Abstract
Atmospheric plasma spraying (APS) is one of the most efficient processes for the preparation of yttrium oxide (Y2O3) ceramic coatings. Changing the spraying process parameters can significantly improve the microstructure and enhance the coating properties. In this study, the combination of plasma-spraying process parameters (current, spraying distance, and argon (Ar) flow) was varied by Response Surface Methodology (RSM) with the help of Minitab 19 software. Applied to the design of experiments, improvement of errors, and prediction of microstructure property results, the optimization and validation of experimental parameters for attaining the desired microstructure of Y2O3 coatings, especially porosity, was achieved. Process parameters were optimized by RSM: current 613.64 A, Ar flow rate 46.92 L/min, spray distance 15.38 cm, and optimum porosity 1.8% after optimization. Electrochemical corrosion experiments and breakdown voltage experiments revealed that the corrosion resistance and dielectric properties increased significantly as the porosity of the coatings decreased. Therefore, by optimizing the plasma-spraying process parameters, the porosity of the coatings can be significantly reduced and the corrosion resistance and dielectric properties of Y2O3 coatings can be effectively improved.
1. Introduction
Ultra-high voltage transmission and transformation equipment is usually built in natural environments that are susceptible to corrosion and electrochemical attack. By adding a ceramic protective coating to the equipment, the corrosion resistance, insulation, and service life of the equipment can be greatly improved while ensuring economic benefits [1,2]. Ceramic materials such as Al2O3, Si3N4, and Y2O3 are often used in the preparation of insulating coatings due to their good dielectric properties and corrosion resistance. APS can replace large shielding components that are difficult to produce using conventional sintering ceramics due to its high economy, flexibility, wide applicability, high degree of automation, and high suitability to oxide ceramics because large-scale ceramics are technically difficult to produce and their costs are often high [3]. The common corrosion-resistant coatings prepared by APS are aluminum-based ceramic coatings and yttrium-based ceramic coatings [4], and yttrium-based ceramic coatings have good porosity and corrosion resistance due to their special porous structure [5]. However, there are still few existing studies on the optimization of APS process parameters, especially the optimization of individual parameter combinations and their influence on coating performance, which greatly limits the in-depth research and extended application of APS in the preparation of ceramic coatings [6,7,8].
Al2O3 coatings represent the most established and extensively utilized ceramic coating materials, renowned for their excellent thermal stability, resistance to thermal shock, and high dielectric strength. However, Al2O3 coatings fabricated via atmospheric plasma spraying (APS) are subject to phase transformations that can lead to a diminution of their insulative capabilities. Bu Zhenyu et al. [9] used APS to prepare Al2O3 coating for electro-erosion protection of motor bearings and mainly analyzed the relationship between the spraying process, coating structure, and coating performance of Al2O3 coating. The results indicated that the insulation performance of the Al2O3 coating was closely related to its microstructure. Features such as pores, cracks, and grain boundaries were identified as areas susceptible to electrical breakdown. Therefore, it could be seen that controlling the porosity and thickness of the coating, i.e., by optimizing the process parameters, is the key to improving the dielectric properties of Al2O3. Wen et al. [10] enhanced the insulation properties of Al2O3 coatings by applying penetrant sealing with silicone resin and epoxy sealant. This treatment markedly decreased the coating’s porosity and increased its dielectric strength. The improvements were observed in both the sprayed coatings and those sealed with silicone resin. Y2O3 coating has high hardness, low porosity, high corrosion resistance [11], and high dielectric strength [12], which can effectively improve the mechanical properties, corrosion resistance, and insulating properties of workpieces [13]. The Y2O3 coating has been widely used in the preparation of APS coatings. Kotlan et al. [14] studied and compared the dielectric strength of Y2O3 coatings and several other metal oxides prepared by APS. The maximum scattering of dielectric strength values was observed in the Y2O3 coating, in which a strong correlation with grain size was also observed, and the crystallite size increased with increasing spray distance. Dai et al. [15] found that Y2O3 coating well inhibited the progression of structural degradation and hindered interfacial reactions, which was the direction for further development of high-nickel cathode materials, and Y2O3-coated samples exhibited much lower charge transfer resistance compared to uncoated Y2O3-coated samples. Qiao et al. [16] researched plasma-sprayed yttria-stabilized zirconia coatings. Porosity was found to decrease with time in high temperatures. After 200 h, porosity dropped from 9.38% to 5.79%. Higher porosity led to complex pore structures and stress concentration. This affected mechanical properties. Hardness increased from 2.52 GPa to 3.12 GPa. Elastic modulus went up from 32.3 GPa to 43.6 GPa.
Numerous studies have been conducted on Y2O3 coatings. However, investigations into the process’s impact on coating porosity and structural characteristics are few. Research on optimization of the process parameters of APS, particularly the interaction effects of parameter interactions on the microstructure, remains limited. This gap constrains the advancement and practical applications of APS in fabricating yttrium-based ceramic coatings. Conventional experimental approaches tend to rely on orthogonal methods, which are prone to substantial errors and can be disproportionately swayed by single factors. Response Surface Methodology (RSM) was employed for the optimization of experiments, enhancing the interaction among multiple variables while concurrently diminishing the number of experiments required, thereby substantially reducing experimental error. In this study, the RSM approach was utilized to elucidate the correlation between the atmospheric Plasma-spraying (APS) process parameters of Y2O3 coatings and their resultant porosity. By selecting three experimental groups representing ‘maximum, medium, and minimum’ porosity levels, we comprehensively investigated the effects of the APS process on porosity and the overall performance of the coatings. This investigation encompassed phase structure characterization, microstructural analysis, electrochemical assessments, and breakdown voltage testing.
In this study, Response Surface Methodology (RSM) was employed to utilize a factorial experimental design with a three-factor, two-level framework. The variables under consideration were current, Ar flow rate, and spraying distance. A comprehensive analysis was conducted to elucidate the influence of atmospheric plasma-spraying (APS) parameters on the microstructural attributes of Y2O3 coatings, including grain size, porosity, and pore size. Furthermore, this study delved into the porosity’s impact on the coatings’ corrosion resistance and electrical insulation characteristics. Ultimately, the research delineated the interplay between APS processing conditions and the resultant microstructural and porosity features of the coatings.
2. Experiments and Characterization
2.1. Preparation of Materials and Coatings
Commercial Y2O3 powder with 99.9% purity was used as the spraying material (provided by Changzhou Geoquin Nano New Material Company, Changzhou, China). The substrate was made of 20 mm× 20 mm × 8 mm aluminum alloy 6061, which was sandblasted before spraying, and ultrasonic cleaning was carried out to remove oil and dirt.
Figure 1a is the image of the powder taken by scanning electron microscope (SEM), and Figure 1b is the particle size distribution of the powder. The particle size of the powder predominantly ranged from 20 to 50 μm and was either spherical or ellipsoidal in shape. Phase analysis was conducted using an X-ray diffractometer (XRD, Rigaku Ultima IV, Tokyo, Japan) with a copper target and Kα-ray radiation. The test conditions were set at a power of 40 kW and a current of 30 mA, with a scanning speed of 5 degrees per minute and a diffraction angle range of 10 to 90 degrees for the X-ray diffraction of the Y2O3 powder. As shown in Figure 1c, the (211), (222), (400), and (622) crystal planes corresponding to the body-centered cubic phase (bcc) were obtained by calibration.
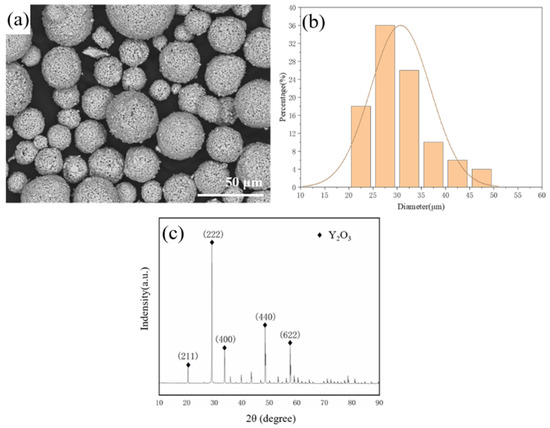
Figure 1.
(a) SEM morphology, (b) particle size distribution of Y2O3 powder, (c) XRD diagram of Y2O3 powder spectrum.
An atmospheric plasma-spraying equipment (APS, Oerlikon Metco UnicoatProTM, Switzerland), with the help of a robotic arm, was used to prepare the Y2O3 coatings. The four spraying process parameters of current, main arc flow rate (Ar), auxiliary gas flow rate (H2), and spraying distance were selected as variables, the design of experiments (DOE) was carried out by RSM using Minitab 19.1 software, and the effect of other process parameters on the coating porosity was investigated by keeping the powder feed rate at 30%. According to the experimental results, three groups of coatings with maximum porosity (MAX), medium porosity (MED), and minimum porosity (MIN) were screened for subsequent characterization and performance testing.
Phase analysis was performed by XRD with a set scanning speed of 5°/min and diffraction angles of 10–90°. The Y2O3 coating was characterized using a scanning electron microscope (SEM, Hitachi TM3030, Tokyo Japan) and energy dispersive spectrometer (EDS, Oxford, UK). The porosity of the coatings was calculated by the grey scale method using Image J 1.53 t software. The Image J software was adopted in this work, and the measurement process was consistent with the related literature, which was ruled as follows: firstly, take SEM images with the scale removed; secondly, determine the size of the images as needed; thirdly, import them into the Image J software; and, finally, set the threshold—the 32-bit grey scale value was set to a maximum of 255 and a minimum of 0. The pores were then calculated and counted. In this work, the porosity of all the coatings was analyzed five times by the software and, finally, the average value was obtained to illustrate the actual porosity. The Scherrer equation was used to calculate the grain size of the Y2O3 coating.
2.2. Corrosion Resistance Dielectric Performance Test of Y2O3 Coatings
The corrosion resistance of the Y2O3 coating was tested by potentiodynamic polarization experiments using Metrohm autolab in 3.5 wt % NaCl solution. The workstation used a three-electrode system: the working electrode was Y2O3 coatings, the reference electrode was saturated calomel, and the counter electrode was platinum. The coating was immersed in 3.5 wt % NaCl solution for 4 h before the experiment, and the polarization test was performed at a rate of 1 mV/s between −0.8 V and +0.8 V.
Figure 2 was a schematic diagram of the breakdown voltage test principle and insulation tester. The ground terminal was connected to the substrate and the test bar was set atop the coating. An AC voltage was then applied incrementally at 500 V/s until the breakdown voltage was reached. At this point, the voltage application ceased. Upon breakdown, an audible alarm from the insulator signaled, and a “FAIL” message appeared on the interface display. The dielectric strength was calculated by dividing the breakdown voltage by the coating thickness.
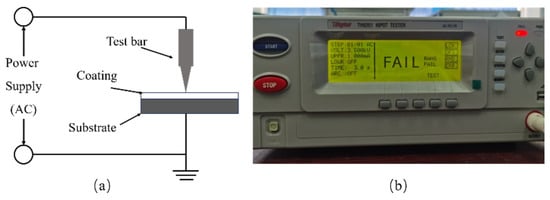
Figure 2.
(a) Schematic diagram of breakdown voltage test principle, (b) operation interface of insulation tester.
3. Results and Discussion
3.1. RSM Modelling and Analysis
In this study, the effects of current, Ar flow, H2 flow, and spraying distance on the porosity of Y2O3 coating were studied. In order to determine the center of the response surface analysis, it was necessary to design a reasonable step size for the parameters and increase the intensity of the experiment to approximate the area with the best effect before designing the response surface analysis method. Therefore, the Plackett–Burman (PB) experimental design method was chosen to reduce the number and volume of RSM experiments [17]. PB design and responses were shown in Table 1, in which four parameters were current (−1 was a low level of 700 A, 0 was a medium level of 600 A, 1 was a high level of 600 A), Ar flow rate (−1 was a low level of 40 L/min, 0 was a medium level of 50 L/min, +1 was a high level of 60 L/min), H2 flow rate (−1 was a low level of 2 L/min, 0 was a medium level of 3 L/min, +1 was a high level of 4 L/min) and spraying distance (−1 was a low level of 13 cm, 0 was a medium level of 15 cm, +1 was a high level of 17 cm).

Table 1.
Experimental design table.
The order of the influence of each factor on porosity was current > Ar flow > spray distance > H2 flow. According to the PB experimental design factor effect table, as shown in Table 2, the p-value of the model was less than 0.05, indicating that the model was significant, and the p-value less than 0.01 was extremely significant. The higher the p-value, the less the association of variables in the sample can be considered to be a reliable indicator of the association of variables in the population. The p-value of H2 flow was 0.047, close to 0.05. In general, the result of a p-value in many fields of science ≤ 0.05 was considered to be a statistically significant boundary line, but this significance level also contained a fairly high probability of error; further, the p-value was a decreasing indicator of the confidence of the results, and the larger the p-value, the less it was considered that the association of variables in the sample was a reliable indicator of the association of variables in the population, so the H2 flow rate was excluded from the subsequent RSM design.
Table 2.
Table of factor effects for PB experimental design.
Following the preliminary screening through the Plackett–Burman (PB) experiment, the Central Composite Design (CCD) methodology was adopted to devise an experimental framework aimed at dissecting the impact of current, argon (Ar) flow rate, and spray distance on the porosity of the coatings. The central composite experimentation was conducted using Minitab software, which incorporated three central points into the factorial design consisting of twelve points, resulting in a comprehensive analysis of a total of fifteen experimental runs and their corresponding response outcomes.
According to the experimental results, the second-order polynomial representing the response surface of the porosity was fitted, and the functions of the porosity, P on the current, the Ar flow rate, and the spraying distance were designed. Equation (1) is shown below:
where P was the porosity, I was the current, A was the Ar flow, and D was the spraying distance.
The second-order polynomial regression equation for the response surface for representing the porosity is shown below:
where y was the response variable about porosity, ε was the error of the experiment, b was the regression coefficient estimation of the polynomial, b0 was the constant, bi was the linear coefficient, bij was the bidirectional interaction coefficient, bii was the quadratic coefficient, and x was the factor.
A central combination experiment was performed on the data using Minitab software, and 15 sets of response surface protocols were generated, as shown in Table 3.
Table 3.
Response surface testing programs and results.
The experimental data were analyzed, and the models for the current, Ar flow, and spraying distance were obtained and equations were fitted, as in Equation (3)
where P was the porosity, I was the current, A was the Ar flow, and D was the spraying distance.
As can be seen from Table 3, the porosity of the 15 groups of experiments ranged from 1.80% to 6.48%, and the overall change was obvious, which indicated that changing the combination of parameters within a reasonable range had a more obvious impact on the porosity of the coatings. In order to verify the adequacy of the model [18], the analysis of variance (ANOVA) of the model was shown in Table 4.
Table 4.
Analysis of variance (ANOVA) of the coating porosity model.
According to ANOVA, various models of the fitting equations were seen to determine the influence of the experimental treatment on the research results. When the p-value was less than 0.05, the effect was significant, and when the p-value was greater than 0.05, or even greater than 0.1, the effect of this source on the response experiment was not considered [19].
As shown in Table 4, the p-value of the model was 0.118 > 0.05, indicating that the model was not out of fit. For the model of the primary term, the p-value of current was 0.01 < 0.05, the p-value of Ar flow rate was 0.00 < 0.05, and the p-value of spraying distance was 0.871 > 0.05, so the p-value of current and Ar flow rate was less than 0.05, is the main influencing factor of the porosity of the coating, and the influence of current (C) was more significant. For the interaction term model, the p-value of the interaction term of current and spraying distance was less than 0.05, and the F-value was 69.65, which was much larger than that of the other two interaction terms, indicating that the interaction term of current and spraying distance played the most important role. Figure 3 shows the residual plot analysis of the experiment. As can be seen from Figure 3a, the residuals were clustered around the fitted line, which was consistent with the predicted values and was in accordance with the law of normal distribution. Figure 3b showed that the residuals fall on both sides of the zero, and there was no “V” trend, showing a random distribution. Figure 3c was a Pareto plot with the absolute values of the normalized effect for each factor in descending order. Among them, the current, the square term of the current, the square term of the Ar flow, the square term of the Ar flow, the interaction term of the current and the spraying distance, and the square term of the spraying distance were above the effective line, and only the spraying distance alone had no significant effect on the model.
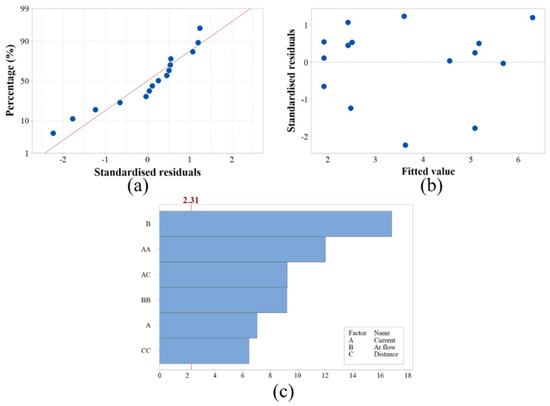
Figure 3.
Models with (a) standardized residuals, (b) fitted values, (c) Pareto diagram of the model.
According to the quadratic term cross-fitting equation and model ANOVA, it can be seen that the Ar flow rate had the greatest influence on porosity, and the porosity was more sensitive to the change of the interaction term of current and spraying distance. Therefore, the effects of the interaction terms of current and spraying distance on porosity at 45 L/min, 50 L/min, and 55 L/min for Ar flow rates were studied, respectively, and the response surface plot of porosity and its contour plot was shown in Figure 4.
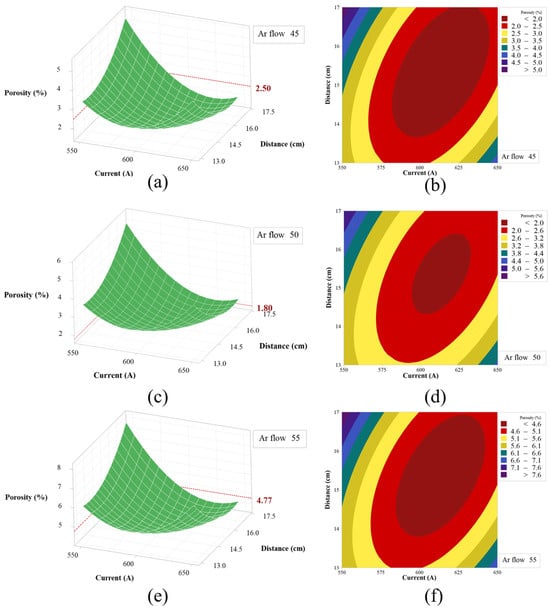
Figure 4.
Surface plots and contour plots of the response of spraying distance and current to porosity at different Ar flow rates, (a) response surface plot of porosity at Ar flow rate 45 L/min, (b) contour plot of porosity at Ar flow rate 45 L/min, (c) response surface plot at Ar flow rate 50 L/min, (d) contour plot at Ar flow rate 50 L/min, (e) response surface plot at Ar flow rate 55 L/min, (f) response surface plot at Ar flow rate 55 L/min.
As shown in Figure 4a,c,e, when the interaction term of current and spraying distance remains constant, with the increase in Ar flow, the porosity of the coating first increased and then decreased, and the maximum porosity was 6.48% when the Ar flow rate was 55 L/min. The minimum porosity was 1.80% when the Ar flow rate was 50 L/min. When the spray distance and current change synchronously, the change in porosity is not described simply by increasing or decreasing. However, there was an optimal area for the interaction of current and spray distance, corresponding to the highest point of each response surface. As shown in Figure 5, the interaction of porosity coincides with the analysis described above.
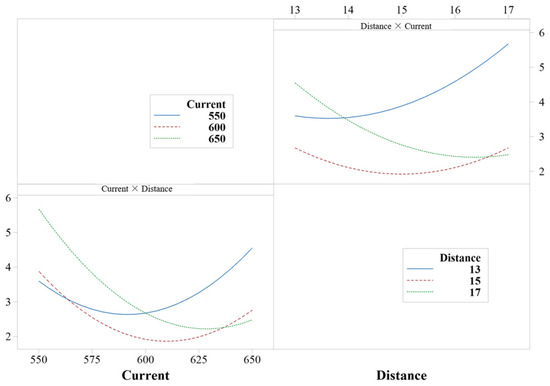
Figure 5.
Mean value plot of porosity interaction fit.
The effect of the current and spray distance interaction terms on the porosity of the coating was more complex. For example, the porosity was 2.50% when A was 45 L/min, D was 13 cm, and the current was 600 A. The porosity was 3.27% when the Ar flow rate was 45 L/min, the current was 550 A, and the spraying distance was 15 cm. Therefore, it showed that when the current and spraying distance were changing synchronously, the change in porosity was not described by simply increasing or decreasing. Nevertheless, an optimal interplay between current and spray distance was identified, corresponding to the nadir on each response surface as depicted in Figure 4a–c. The lowest value of the corresponding coating porosity was close to 1.43%. Finally, the surface response method was used to analyze the porosity, and the response of the porosity was optimized by software, as shown in Figure 6.
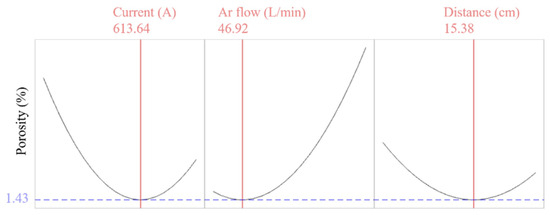
Figure 6.
Optimized RSM parameters.
According to the software analysis, the 95% confidence interval for the porosity of the coatings was (1.16, 1.70). Combined with the actual experimental data, the credibility of the response surface method was verified. In summary, when the current was 613.64 A, the Ar flow rate was 46.92 L/min, and the spraying distance was 15.38 cm, the porosity reached the minimum value. The Y2O3 coating was prepared with the predicted process parameters in this study; the average porosity was 1.46% and the error was 14%. This is shown in Table 5. The actual test porosity met the 95% confidence interval (1.16, 1.70), indicating that the predicted value of this model was credible.
Table 5.
Validation of actual and predicted values.
3.2. Coating Structure and Performance Analysis
3.2.1. Phase Structure and Microstructure Analysis of Y2O3 Coatings
In Figure 7, it can be seen that the strongest diffraction peak for all Y2O3 coatings was the (222) crystal plane diffraction peak of around 2θ = 29°. As shown in Figure 7b, combined with the experimental data in the previous article, the porosity of the coating samples with the largest, medium, and smallest porosity was taken as an example: 3 (MAX), 1 (MED) and 14 (MIN) samples were 6.48%, 3.27%, and 1.80%, respectively.
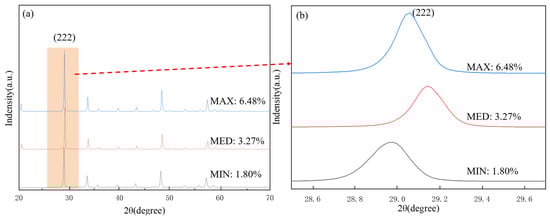
Figure 7.
XRD patterns of Y2O3 coatings with different parameter combinations, (a) MAX, MED and MIN XRD pattern, (b) (222) Peak enlargement of crystal plane.
The volume and characteristics of the grain boundaries evolved with alterations in grain size, and it was noted that variations in both grain size and boundaries significantly influenced porosity. The primary factor affecting grain size was identified as the melting behavior of the Y2O3 powder particles. The better the melting effect, the smaller the porosity of the coating, and some studies have found that there was a high correlation between the effective permittivity and the effective conductivity, and, with the increase in porosity, both the dielectric constant and the effective conductivity decreased strongly [20]. According to the Scherrer equation, the grain size (d) and grain size of the coating were calculated [21,22] as follows:
where λ was the X-ray wavelength, β was the diffraction peak at half height and width, and θ was the diffraction angle because β was half height and width and K was a constant of 0.9. The grain sizes of the MAX, MED, and MIN specimens were 45.94 nm, 44.81 nm, and 36.02 nm. The melting effect of Y2O3 powder particles was the main reason for the grain size and partially melted powder particles tend to form larger size grains. Therefore, the higher concentration of small grains in the coating was a direct result of the greater melting of the particles in flight during the spraying process. This, in turn, led to the formation of flat solid/liquid interface grains [23]. Consequently, it was deduced that optimal spraying parameters influence the degree of powder particle melting, with a more effective melting process yielding a greater proportion of small-sized grains. If the melting effect was insufficient, a larger grain size was produced, and the macroscopic porosity of the corresponding coating would be poor [24].
3.2.2. Analysis of Pore Types
As shown in Figure 8, the coating cross-section had the typical layered characteristics of APS coatings. According to previous studies [25], smaller pores in APS coatings were formed as a result of interactions between material particles, with larger pores caused by spatter particles when colliding with deposited material, or larger pores due to poor deformation of partially melted particles, which had different sizes and extremely complex shapes, as a result of interactions between material particles [26]. However, the formation mechanism of different types of pores and cracks was not analyzed, and the porosity and crack types of Y2O3 coating were analyzed in this study.
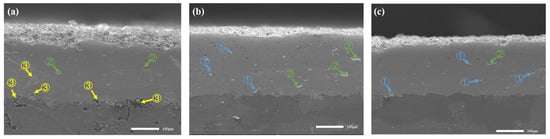
Figure 8.
SEM cross-sections of porosity for different parameter combinations, pores type of ①, ② and ③, (a) MAX, (b) MED, (c) MIN.
It has been found that the different proportions and numbers of porosity and cracks in each type have an impact on the performance of coatings. Chen et al. [27] investigated the relationship between pore characteristics and coating bond strength. Their findings demonstrated a clear inverse relationship: as porosity levels diminished, the bond strength of the coating correspondingly increased. This suggests that a reduction in porosity enhances the overall integrity and adhesion of the coating. With the change of APS process parameters, the pore size and crack direction were classified in this study, and the pore diameter below 10 μm was regarded as type ①, the pore diameter of 10–25 μm was regarded as type ②, and the pore diameter was more than 25 μm as type ③. As shown in Figure 8c, MIN was mainly of type ①, and the porosity was 1.80%. Figure 8b MED was dominated by ① and ② types, with a porosity of 3.27%, and the porosity was mainly affected by the interaction between the current and the spraying distance, and, when the current was small and the spraying distance was large, the difference in the thermal expansion coefficient between the coatings caused the cooling stress to increase, which was closely related to the difference in the thermal expansion coefficient and the residual stress of the coatings [28]. Stress increased the generation and propagation of microcracks in the coating, which increased the porosity to a certain extent. The residual stresses due to this cooling varied depending on the process parameters of the coating and the enhanced resistance to crack propagation in the coatings. It has been reported that the decreased grain size can effectively hinder the rapid propagation of the cracks, especially since the determination of crack propagation paths was strongly related to the grain size. Decreased grain had a higher brittle crack extension resistance to release the applied strain energy. This reflected that the crack propagation rate of the fine grains was lower than that of the coarse grains, which was caused by the propagation behaviors of the cracks. In fine grains, the crack propagation was easily blocked by the grain boundaries, especially the grain boundary triple junction. Therefore, the crack propagation rate of the fine grains was much lower than that of the coarse grains, which could be beneficial to the enhancement of the cohesion strength of the coating. If there is a significant difference in the coefficient of thermal expansion between the particles and the substrate material, they will expand and contract at different rates when cooled and heated at various temperatures. This mismatch can lead to increased stress between the coating and the substrate, which may result in the formation of cracks or pores in the coating. Partially melted particles are compressed when sprayed onto the substrate surface. If the surrounding particles cannot flow sufficiently to fill the gaps, tiny pores will form within the coating. These pores, ranging in size from approximately 10 to 25 μm, can affect the porosity and mechanical properties of the coating. Figure 8a MAX is dominated by ③ and ④ types, with a large porosity of 6.48%; at this time, there were more unmelted particles in the coating, and large pores appeared when the layers were tiled above the unmelted particles.
3.2.3. Effect of Spraying Parameters on the Corrosion Resistance of Y2O3 Coatings
The self-corrosion potential of the MAX, MED, and MIN coatings was tested, and the dynamic potential polarization curves of the Y2O3 coating prepared with different parameters were shown in Figure 9, and the data of corrosion potential Ecorr and corrosion current density Icorr were obtained by fitting the polarization curves according to the Stern–Geary formula [29], and the self-corrosion potential of the coating shifted positively as the porosity decreased, as shown in Table 6.
where βα was the anode Tafel slope, βC was the cathode Tafel slope, and Rp was the polarization resistance.
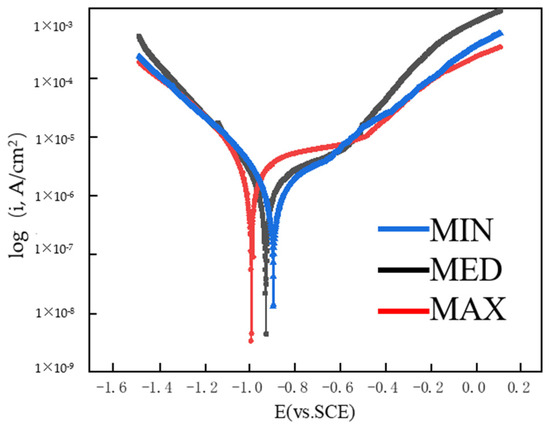
Figure 9.
Kinetic potential polarization curves of Y2O3-coated specimens.
Table 6.
Ecorr and Icorr of Y2O3 coatings.
As can be seen from Table 6, the Ecorr of the coating increased with the decrease in porosity, while the Icorr showed a decreasing trend. The No. 14 specimen (porosity 1.80%) had an open circuit potential of −887 mV and an Icorr of 1.29 × 10⁻⁹ A/cm2. Specimen No. 3 (porosity, 6.48%) had an Ecorr of −986 mV and an Icorr of up to 3.36 × 10⁻⁹ A/cm2.
Figure 10 shows the Nyquist and Bode plots of the coating at different porosities. As can be seen from Figure 10a, the Nyquist diagram of the Y2O3 coating was close to a semicircular arc, and the smaller the porosity of the coating, the larger the radius of the semicircular arc was. The magnitude of the Zmod value in Figure 10b Bode impedance and the maximum phase value in Figure 10c Bode phase can verify the corrosion resistance of the coating, and it can be seen that with the decrease in porosity, the Zmod value and phase maximum value of the composite deposition layer gradually increased, so the No. 14 specimen with the smallest porosity had the best corrosion resistance. The corrosion resistance of the coating is also linked to the nature of the porosity and the presence of cracks within the coating. Pores or cracks are regarded as pathways for electrolyte ingress; thus, coatings with low porosity present a considerable barrier to corrosive electrolytes. Consequently, such coatings demonstrate enhanced corrosion resistance. However, corrosive electrolytes were more likely to penetrate into highly porosity coatings through their inherent microcracks, which then eroded the substrate, reducing their corrosion resistance [30]. In this study, the amorphous phase primarily appeared in the form of amorphous particles. Due to the process parameters, some particles cooled too quickly and could solidify from the molten state into an amorphous phase. This uneven distribution of amorphous particles can increase the brittleness of the coating and lead to stress concentration. Furthermore, the emergence of the amorphous phase can contribute to the formation of cracks in the coating, thereby establishing new channels for corrosion and diminishing the coating’s corrosion resistance.
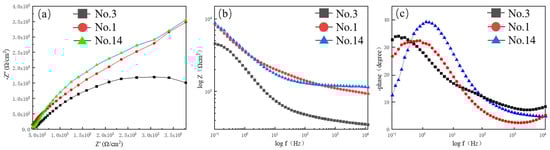
Figure 10.
Y2O3-coated specimens No. 3, 1, 14, (a) Nyquist plot, (b) Bode impedance plot, (c) Bode phase plot.
3.2.4. Dielectric Strength of the Coatings
Breakdown voltage tests were conducted on three samples exhibiting varying porosities (MAX, MED, MIN), each with a coating thickness of approximately 200 μm. The dielectric strength for each coating was determined by dividing the breakdown voltage by the coating’s thickness. Figure 11 illustrates the relationship between the coatings’ porosity and their dielectric strength.
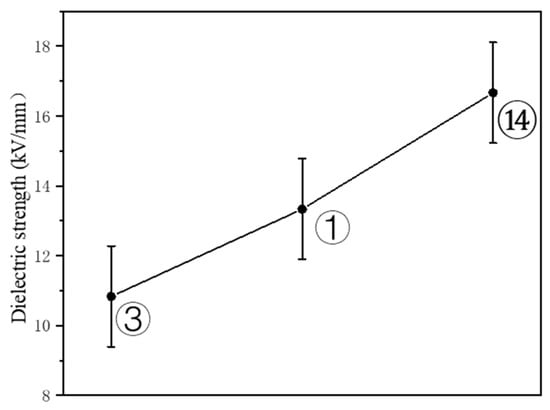
Figure 11.
Dielectric strength of coatings with different porosities.
As depicted in Figure 11, there is a clear trend showing that a lower porosity in the coating correlates with a higher dielectric strength. Specifically, the dielectric strength of the specimen with minimum (MIN) porosity reached 16.67 kV/mm, which is 53.92% higher than that of the specimen with maximum (MAX) porosity, at 10.83 kV/mm. When examining the porosity and types of cracks presented in Figure 8, it becomes evident that optimizing the spray process parameters can considerably reduce the coatings’ porosity and enhance their dielectric strength. The fundamental mechanism behind the dielectric breakdown of coatings is a combination of corona discharge and thermal breakdown. Discharges in internal defects cause localized corrosion, while an imbalance between the heat produced and dissipated within the coating results in permanent damage [31]. By minimizing defects and cracks within the coating, the number of conductive paths is reduced, thereby increasing the dielectric strength of the coating and enhancing its insulative performance.
4. Conclusions
(1) Y2O3 coatings were prepared using atmospheric plasma spraying, and the three significant factors affecting the coating’s porosity were identified as the current, Ar flow rate, and spraying distance using the Plackett–Burman (PB) experimental design method. Response Surface Methodology (RSM) was utilized to establish a model for analyzing the effects of these three process parameters on the porosity of Y2O3 coatings. Among these factors, the interaction between current and spraying distance had the most significant impact on coating performance, and there was an optimal region for their interaction, corresponding to the peak of each response surface. The interaction effect of current and spraying distance on porosity was that it increased first and then decreased, and the value of porosity was more sensitive to the change in spraying distance. When the current was 613.64 A, the Ar flow rate was 46.92 L/min, and the spraying distance was 15.38 cm, the minimum porosity of the coating reached 1.43%. The porosity values of Y2O3 coatings prepared by the predicted process met the 95% confidence interval (1.16, 1.70), indicating the reliability of the prediction of the model.
(2) In this study, the pore sizes were classified, and the high porosity coatings were mainly larger pores and parallel cracks larger than 25 μm, which were caused by insufficient melting when the particles reached the matrix, large differences in the thermal expansion coefficient between the matrix and the coating material. The low porosity coating featured small pores and pores under 25 μm, influenced by the interplay between current and spray distance. Additionally, discrepancies in thermal expansion coefficients between coatings caused increased cooling stress under conditions of low current and greater spray distances.
(3) Electrochemical testing on MAX, MED, and MIN samples showed that Y2O3 coatings with lower porosity presented larger semi-circular arcs in Nyquist plots, indicative of better corrosion resistance. This was corroborated by higher impedance values and peak phase angles in Bode plots. The MIN coating, with the lowest porosity of 1.80%, demonstrated the highest corrosion resistance, evidenced by its high corrosion potential and low corrosion current density.
(4) Dielectric strength tests on MAX, MED, and MIN samples revealed that lower porosity coatings, like the MIN with 1.80% porosity, required higher voltages to form conductive channels. Consequently, the MIN coating’s dielectric strength was 53.29% greater at 16.67 kV/mm compared to the third sample at 10.83 kV/mm.
(5) Low porosity coatings offer enhanced corrosion resistance by limiting corrosive penetration and protecting the substrate more effectively. They also improve dielectric strength due to a more uniform internal structure that supports even electric field distribution and minimizes discharge. Optimizing process parameters like spray current, Ar gas flow, and spray distance in plasma spraying is key to reducing porosity and boosting the coating’s corrosion resistance and dielectric properties.
Author Contributions
Methodology, W.C.; Software, K.S. and X.X.; Resources, S.Q. and S.Z.; Data curation, W.Z.; Writing—original draft, K.S. and X.X.; Writing—review & editing, H.W. and W.L. All authors have read and agreed to the published version of the manuscript.
Funding
This work was financially supported by (1) China Southern Power Grid Co., Ltd., Liuzhou Bureau of EHV Transmission Company under grant number (CGYKJXM20220151); (2) Science and Technology Commission of Shanghai Municipality and Shanghai, Engineering Research Center of Ship Intelligent Maintenance and Energy Efficiency under (Grant 20DZ2252300); and (3) Shanghai High-level Local University Innovation Team (maritime safety and technical support).
Institutional Review Board Statement
This study did not require ethical approval.
Informed Consent Statement
This study did not involve humans.
Data Availability Statement
Data are contained within the article.
Conflicts of Interest
The authors declare that they have no known competing financial interests or personal relationships that could have appeared to influence the work reported in this paper.
References
- Kalkowski, G.; Risse, S.; Guyenot, V. Electrostatic chuck behaviour at ambient conditions. Microelectron. Eng. 2002, 61–62, 357–361. [Google Scholar] [CrossRef]
- Han, F.; Ren, S.; Deng, J.; Yan, T.; Ma, X.; Peng, B.; Liu, L. Dielectric response mechanism and suppressing high-frequency dielectric loss in Y2O3 grafted CaCu3Ti4O12 ceramics. J. Mater. Sci. Mater. Electron. 2017, 28, 17378–17387. [Google Scholar] [CrossRef]
- Kitamura, J.; Ibe, H.; Yuasa, F.; Mizuno, H. Plasma Sprayed Coatings of High-Purity Ceramics for Semiconductor and Flat-Panel-Display Production Equipment. J. Therm. Spray Tech. 2008, 17, 878–886. [Google Scholar] [CrossRef]
- Zhao, Z.; Yang, Z.; Yu, Z.; Fan, M.; Bai, J.; Yu, J.; Ren, Z. Influence of yttrium oxide addition and sintering temperature on properties of alumina-based ceramic cores. Int. J. Appl. Ceram. Tech. 2020, 17, 685–694. [Google Scholar] [CrossRef]
- Kavaliauskas, Ž.; Kėželis, R.; Milieška, M.; Marcinauskas, L.; Valinčius, V.; Aikas, M.; Uscila, R.; Baltušnikas, A.; Žunda, A. Influence of different plasma spraying methods on the physical properties of YSZ coatings. Surf. Interfaces 2021, 24, 101120. [Google Scholar] [CrossRef]
- Mao, J.; Deng, C.; Yang, K.; Kuang, Z.; Ou, X. Optimization of response surface method for atmospheric plasma spraying Cr2O3 coating. J. Mech. Eng. Mater. 2014, 38, 100–104. [Google Scholar]
- Liang, C.; Li, X. Application of surface response method in optimization of plasma spraying WC-12Co coating process. Mater. Sci. Technol. 2018, 26, 90–96. [Google Scholar]
- Chu, J.; Han, B.; Li, R.; Gao, X.; Cong, M.; Wu, H.; Xu, W.; Du, W. Quality optimization of plasma spraying Ni60CuMo coating based on response surface method. Mater. Rep. 2024, 3, 1–15. [Google Scholar]
- Bu, Z.; Zhao, X.; Guo, X.; Yang, M.; Xue, Y.; Wei, X.; An, Y.; Zhou, H. Electromotor Bearing Protection Measures and Research Status of Al2O3 Ceramic Coating. Surf. Technol. 2021, 50, 51–59. [Google Scholar]
- Wen, P.; Wang, X.; Tang, B.; Wang, D.; Dong, W.; Wang, L. Effect of Sealing Treatment on the Dielectric Properties of Plasma-Sprayed Al2O3 Coatings. J. Therm. Spray Tech. 2023, 32, 1940–1948. [Google Scholar] [CrossRef]
- Qiao, J.; Zhang, M.; Zhang, X.; Zhang, K.; Zhang, S. Effect of yttrium oxide nanoparticles on corrosion resistance of chromium-free Dacromet coatings. Met. Heat Treat. 2016, 41, 178–181. [Google Scholar]
- Wang, Y.; Hou, J. Study on microstructure and interfacial properties of Y2O3 thin films of high dielectric materials. Bull. Chin. Ceram. Corp. 2010, 29, 1063–1066. [Google Scholar]
- Ashizawa, H.; Yoshida, K. Plasma-resistance evaluation of yttrium oxyfluoride coating prepared by aerosol deposition method. Int. J. Appl. Ceram. Tech. 2022, 19, 375–382. [Google Scholar] [CrossRef]
- Kotlan, J.; Seshadri, R.C.; Sampath, S.; Ctibor, P.; Pala, Z.; Musalek, R. On the dielectric strengths of atmospheric plasma sprayed Al2O3, Y2O3, ZrO2–7% Y2O3 and (Ba,Sr)TiO3 coatings. Ceram. Int. 2015, 41, 11169–11176. [Google Scholar] [CrossRef]
- Yuan, M.; Dai, S.; Wang, L.; Luo, L.; Xie, T.; Chen, Q.; Li, Y.; Yang, Y. Ultrathin-Y2O3-coated LiNi0.8Co0.1Mn0.1O2 as cathode materials for Li-ion batteries: Synthesis, performance and reversibility. Ceram. Int. 2019, 45, 674–680. [Google Scholar]
- Qiao, X.; Wang, Y.M.; Weng, W.X.; Liu, B.L.; Li, Q. Influence of pores on mechanical properties of plasma sprayed coatings: Case study of YSZ thermal barrier coatings. Ceram. Int. 2018, 44, 21564–21577. [Google Scholar] [CrossRef]
- Magallanes, J.F.; Olivieri, A.C. The effect of factor interactions in Plackett–Burman experimental designs. Chemom. Intell. Lab. Syst. 2010, 102, 8–14. [Google Scholar] [CrossRef]
- Mathanbabu, M.; Thirumalaikumarasamy, D.; Tamilselvi, M.; Kumar, S. Optimization of plasma spray process variables to attain the minimum porosity and maximum hardness of the LZ/YSZ thermal barrier coatings utilizing the response surface approach. Mater. Res. Express 2022, 9, 096505. [Google Scholar] [CrossRef]
- Chen, W.-H.; Uribe, M.C.; Kwon, E.E.; Lin, K.-Y.A.; Park, Y.-K.; Ding, L.; Saw, L.H. A comprehensive review of thermoelectric generation optimization by statistical approach: Taguchi method, analysis of variance (ANOVA), and response surface methodology (RSM). Renew. Sustain. Energy Rev. 2022, 169, 112917. [Google Scholar] [CrossRef]
- Krueger, D.S.; Shende, R.V.; Lombardo, S.J. Effect of porosity on the electrical properties of Y2O3-doped SrTiO3 internal boundary layer capacitors. J. Appl. Phys. 2004, 95, 4310–4315. [Google Scholar] [CrossRef]
- Dai, C.; Cheng, Z.; Zhou, J. Discussion on the calculation of platinum nanograin size by full-spectrum fitting method and Schiele formula. Metall. Anal. 2022, 42, 72–76. [Google Scholar]
- Shiri, H.M.; Ehsani, A.; Behjatmanesh-Ardakani, R.; Hajghani, S. Electrosynthesis of Y2O3 nanoparticles and its nanocomposite with POAP as high efficient electrode materials in energy storage device: Surface, density of state and electrochemical investigation. Solid State Ion. 2019, 338, 87–95. [Google Scholar] [CrossRef]
- Song, X.; Liu, Z.; Suhonen, T.; Varis, T.; Huang, L.; Zheng, X.; Zeng, Y. Effect of melting state on the thermal shock resistance and thermal conductivity of APS ZrO2–7.5wt.% Y2O3 coatings. Surf. Coat. Technol. 2015, 270, 132–138. [Google Scholar] [CrossRef]
- Zhang, Q.; Wu, X.; Ovsyannikov, S.V.; Dong, J.; Qin, S.; Dubrovinsky, L.S.; Chen, D. High-pressure, high-temperature synthesis and properties of the monoclinic phase of Y2O3. Chem. Res. Chin. Univ. 2016, 32, 545–548. [Google Scholar] [CrossRef]
- Karthikeyan, S.; Balasubramanian, V.; Rajendran, R. Developing empirical relationships to estimate porosity and Young’s modulus of plasma sprayed YSZ coatings. Appl. Surf. Sci. 2014, 296, 31–46. [Google Scholar] [CrossRef]
- Tillmann, W.; Khalil, O.; Baumann, I. Influence of Direct Splat-Affecting Parameters on the Splat-Type Distribution, Porosity, and Density of Segmentation Cracks in Plasma-Sprayed YSZ Coatings. J. Therm. Spray Tech. 2021, 30, 1015–1027. [Google Scholar] [CrossRef]
- Chen, C.; Song, X.; Li, W.; Zheng, W.; Ji, H.; Zeng, Y.; Shi, Y. Relationship between microstructure and bonding strength of yttria-stabilized zirconia thermal barrier coatings. Ceram. Int. 2022, 48, 5626–5635. [Google Scholar] [CrossRef]
- Wang, J.; Sun, J.; Zhang, H.; Dong, S.; Jiang, J.; Deng, L.; Zhou, X.; Cao, X. Effect of spraying power on microstructure and property of nanostructured YSZ thermal barrier coatings. J. Alloys Compd. 2018, 730, 471–482. [Google Scholar] [CrossRef]
- Poursaee, A. Potentiostatic transient technique, a simple approach to estimate the corrosion current density and Stern–Geary constant of reinforcing steel in concrete. Cem. Concr. Res. 2010, 40, 1451–1458. [Google Scholar] [CrossRef]
- Qiao, L.; Wu, Y.; Hong, S.; Cheng, J.; Wei, Z. Influence of the high-velocity oxygen-fuel spray parameters on the porosity and corrosion resistance of iron-based amorphous coatings. Surf. Coat. Technol. 2019, 366, 296–302. [Google Scholar] [CrossRef]
- Kim, M.; Choi, E.; So, J.; Maeng, S.; Chung, C.-W.; Suh, S.-M.; Yun, J.-Y. Reduced amount of contamination particle generated by CF4/Ar/O2 plasma corrosion of Y2O3 materials: Influence of defluorination process. Mater. Sci. Semicond. Process. 2023, 167, 107809. [Google Scholar] [CrossRef]
Disclaimer/Publisher’s Note: The statements, opinions and data contained in all publications are solely those of the individual author(s) and contributor(s) and not of MDPI and/or the editor(s). MDPI and/or the editor(s) disclaim responsibility for any injury to people or property resulting from any ideas, methods, instructions or products referred to in the content. |
© 2024 by the authors. Licensee MDPI, Basel, Switzerland. This article is an open access article distributed under the terms and conditions of the Creative Commons Attribution (CC BY) license (https://creativecommons.org/licenses/by/4.0/).