Article

Microstructural, Nanomechanical, and Tribological Properties of Thin Dense Chromium Coatings

1
Research and Technology Development, SKF, 3992 AE Houten, The Netherlands
2
Department of Materials Science and Engineering, Faculty of Mechanical Engineering, Delft University of Technology, 2628 CD Delft, The Netherlands
*
Author to whom correspondence should be addressed.
Coatings 2024, 14(12), 1597; https://doi.org/10.3390/coatings14121597
Submission received: 5 November 2024 / Revised: 13 December 2024 / Accepted: 17 December 2024 / Published: 20 December 2024
(This article belongs to the Special Issue Advanced Tribological Coatings: Fabrication and Application)

Abstract

:
Nowadays, Thin Dense Chromium (TDC) coatings are being industrially used in rolling bearings applications due to their claimed advantages such as high hardness, low wear, and good corrosion resistance. However, despite their broad commercial use, very little has been published in the open scientific literature regarding their microstructure, nanomechanical, and tribological properties. In this paper, TDC coatings with a thickness of about 5 µm were deposited by a customized electrochemical process on ASTM 52100 bearing steel substrates. Surface microstructure and chemical composition analysis of the TDC coatings was carried out by scanning electron microscopy and atomic force microscopy. The results revealed a coating with a dense, nodular, and polycrystalline microstructure. Unlike standard electrodeposited “Hard Chromium” coatings, TDC coatings show no presence of micro/nano-cracks, likely contributing to their superior corrosion resistance. The nanomechanical behavior, studied by nanoindentation as a function of penetration depths, exhibits a pronounced size effect near the coating surface that can be linked to the nodular microstructure. A hard surface with hardness HIT 14.9 ± 0.5 GPa and reduced elastic modulus Er = 216.8 ± 3.9 GPa was observed. Tribological characterization under the presence of lubricants was performed by two single-contact tribometers using coated and uncoated steel balls against flat steel substrates. An in-house fretting wear rig was used to measure the lubricated friction coefficient in pure sliding conditions, whilst the friction performance in rolling/sliding lubricated conditions was evaluated using a WAM test rig. In pure sliding, TDC/TDC contacts show ~13% lower friction than for steel. Under rolling/sliding conditions with 5% sliding, the traction coefficient of TDC/TDC coating contact was at least 20% lower than that for steel/steel contact. The tribological results obtained in various contact conditions demonstrate the benefits of applying TDC coatings to reduce bearing friction.

1. Introduction

The first reference to chromium electrodeposition can be found in a French patent published by Junot de Bussy in 1848 [1]. After this pioneer work, many patents and research works started to be published in Europe and the USA, trying to understand and improve the process. However, it was Dr. G. J. Sargent at Cornell University who published in 1920 a systematic research study about the electrolytic behavior of different combinations of chromium sulphate and chromic acid solutions to produce electrodeposited Cr coatings. In the conclusions section of his publication, Sargent predicted the commercial possibilities of the new coating process owing to its resistance to corrosion by air, moisture, and many chemicals [2]. Indeed, commercial Cr plating processes started to be successfully marketed by end of the 1920s in the UK, Germany, and the USA [3]. Nowadays, the world chromium plating market is valued at USD 18.01 billion and it is predicted to increase to USD 26.08 billion by 2032 [4].
Commercial chromium coatings are offered under two kind of selection possibilities: “hard chromium” and “decorative chromium” layers. Hard chromium is used in many industrial applications to improve the equipment components’ resistance to corrosion and wear and to decrease friction between machine elements. Decorative chrome plating, which is thinner than hard chromium, has more limited applications; although it does not offer the same strength and wear resistance as hard chrome, in addition to its aesthetic advantage, these kinds of coatings are used to provide a corrosion protection to automobile parts, tools, kitchen utensils, etc. The chemical electrochemical baths used in both cases are very similar in formulation, except that for hard chromium the solutions are less concentrated and higher temperatures and higher current densities are used [3]. The majority of hard chromium coatings have microcracks; cracking appears during the electroplating process when the internal coating stress surpasses the chromium’s tensile strength. Numerous factors influence the microcracks’ depth, width, and population density. In general, a microcrack structure with a high population density of shallow, narrow cracks is preferred because the deposit usually has greater corrosion resistance, good wearability, higher lubricity, and lower stress [3].
A new kind of electrodeposited chromium coating was introduced in 1957 [5]. Denominated “thin dense chromium” (TDC), the film was presented as having a dense micronodular structure that results to be hard, thin, and corrosion resistant. Unlike hard chromium, TDC can be deposited crack free with thickness in the range 1–17 µm [5].
A series of technical research was published in the period 1984–1995, with most of the research conducted for aerospace turbines and other military applications. In all of these reports, the main target was to study corrosion resistance and bearing life. Testing of TDC coated steel bearings has shown the improvement in the corrosion resistance and the increase of the rolling contact fatigue life number L10 (the number of hours at a constant speed that a group of bearings will reach before 10% of the bearings fail) over uncoated bearings [6,7,8,9,10,11]. However, these technical reports lack a comprehensive scientific study of the coatings’ microstructure, nanomechanical, and tribological properties.
Simple information about the microstructure, hardness, and friction coefficient can be found nowadays in commercial brochures and websites offering TDC coating services, but there is no scientific support or information about how these data were obtained [12,13,14]. A nodular microstructure is usually shown with a low magnification scanning electron microscopy (SEM) image [15,16] and the friction coefficient is mentioned without much information about measurement conditions [17]. Disclosed mechanical properties have only been reported in terms of Hardness Rockwell C (HRC) indentations, which turns the data into suspicion because it is impossible to measure thin coatings with such method without the influence of the substrate hardness [18]. The only existing standard to measure microhardness of electrodeposited coatings is ASTM B578, which applies the measurement in a cross-section [19], and this method is impossible to apply for TDC coatings due to their low thickness range. No measurements are reported by the use of nanoindentation, which is the only technique able to measure the hardness and elastic modulus of TDC coatings, which usually have a thickness below 10 µm [18].
Despite the fact that nowadays TDC coatings have a high commercial demand for tribological applications like in rolling bearings, no studies can be found to understand their microstructure, mechanical, and tribological behavior. In this paper, we present for first time a scientific study on the microstructural, nanomechanical, and tribological properties of Thin Dense Chromium coatings: morphological studies are conducted by scanning electron microscopy and atomic force microscopy, nanomechanical properties (hardness and elastic modulus) by nanoindentation, and tribological properties (friction and wear) by sliding and rolling test experiments.

2. Experimental Section

2.1. Steel Substrate and Coating

SKF Steel Substrates: ASTM 52100 (100Cr6) steels with typical compositions of 0.98%–1.10% carbon, 1.30%–1.60% chromium, 0.15%–0.30% silicon, 0.25%–0.45% manganese, and trace amounts of other elements like sulfur (≤0.025%) and phosphorus (≤0.025%) were selected as substrates. The bearing steel material was through-hardened to a hardness of 690–790 HV and finally polished to have a roughness similar to the raceway of a rolling bearing. Samples with a rectangular shape of 15 mm × 25 mm × 5 mm were used for the microstructural, nanomechanical, fretting, and adhesion tests, while washer-shaped samples of 50 mm (OD) × 10 mm (ID) × 5 mm (thick) were used for the rolling-sliding tribological tests.
SKF Thin Dense Chromium (TDC): The coating selected in our studies is a proprietary layer process commercialized by SKF [11,20,21], which is also known under the trade name Endurakote® [22]. After being degreased in a heated alkaline solution, the workpieces are either etched or shot with a mildly abrasive powder blaster. In the next step, the components are submerged in a chromium acid electrolyte (Cr(VI)). In order to create a thin layer of chromium with the required surface structure at a lower current density and a shorter coating duration, for instance, potassium dichromate is utilized in the process as a catalyst. Cleaning and preservation bring the procedure to a close.

2.2. Microstructural, Nanomechanical, and Adhesion Characterizations

Surface morphology was analyzed using a scanning electron microscope (SEM), model FEI TENEO (Eindhoven, The Netherlands), operated at 5 kV, 0.4 nA, with a working distance of 10 mm. Atomic force microscopy (AFM) measurements were conducted with a Bruker Dimension Edge (Billerica, MA, USA) equipped with an n-type doped silicon single-crystal pyramid tip (TESPA-V2), featuring a tip height of 10–15 µm and a tip radius of 7 nm. Both height and amplitude signals were recorded in tapping mode with a pixel resolution of 512 × 512 and a scan frequency of 0.3 Hz. Surface roughness Ra (average roughness) and the wear track depths were measured by a white light interferometer (GT Contour, Brucker, Elk Grove Village, IL, USA).
Nanoindentation characterization was conducted by using a TI Premier Hysitron (Bruker, Minneapolis, MN, USA) with a diamond Berkovich indenter with a tip radius of ~150 nm. Indentations were performed under load-controlled feedback to keep the maximum load identical for all tests. The hardness HIT and reduced elastic modulus Er were calculated according to the methods of Oliver and Phar [18,23]. Indents were performed on both plain and cross-sectional samples.
Cross-section samples for SEM imaging and nanoindentation were prepared by cutting the specimen with a diamond disc saw, followed by hot mounting. Polishing was conducted in two stages: initial polishing with an alumina slurry (3 µm) and final polishing with OPS containing 0.25 µm agglomerated particles.
The scratch adhesion test was performed by using a MFT-5000 tribometer (RTEC, San José, CA, USA). A 200 µm radius diamond was drawn over the coating surface with an increasing load in the range 0–100 N under a distance of 15 mm. An optical microscope was used to evaluate the scratch failure modes and the corresponding critical loads (Lc) of the TDC film under which the coating adhesion failure occurs [24]. The experiment was repeated three times.

2.3. Tribological Characterization

For the tribological characterization of the TDC layer, two distinct situations were tested: (a) pure sliding reciprocating tests and (b) rolling/sliding tests, which simulated rolling bearing contact. For both kinds of tribological tests, general bearing conditions were chosen during the experiments regarding lubricant type and temperature.

2.3.1. Reciprocating Sliding Test

A Fretting Wear rig was used internally to quantify the friction coefficient under pure sliding conditions (Figure 1). The ASTM 52100 through-hardened flat steel plate and steel balls used in the experiments were both either uncoated or coated with TDC. The orientation of the substrate surface topography was placed perpendicular to the direction the ball. Table 1 outlines the testing parameters. Every test was conducted at least twice. The reciprocal displacement’s amplitude is less than the semi-contact width associated with fretting corrosion [25].

2.3.2. Ball-on-Disk Rolling/Sliding Tests

A WAM test rig (Wedeven Associates Machine, Inc., Edgmont, PA, USA) was used to assess friction performance under rolling/sliding conditions. Using a 20.64 mm diameter ASTM 52100 steel ball (Rq = 50 ± 10 nm) and an independently driven disk in the ball-on-disk test (Figure 2), different slide-to-roll ratios can be achieved. The steel disks, which are crafted from ASTM 52100 steel that had been hardened throughout, are honed in a circular manner so that the topography aligns with the rolling direction, similar to a bearing ring.
A computer can control the speeds of rotation for both the ball and disk, as well as adjust the load and test temperature according to a pre-determined test plan. The continual measurement of the traction force between the ball and the disk is recorded. The test sequence includes conducting Stribeck curves and traction curves both before and after a 70 h duration step.
Table 2 specifies the test conditions for the setup. The lubricant ISO VG 32 was applied to the spinning disk, guaranteeing complete flooding. The speed of rotation was modified to operate in mixed lubrication, taking into account a lubrication parameter λ of 0.3 based on the disk’s initial roughness before coating (where λ represents the ratio of central film thickness to the root mean square roughness Rq). The WAM tests were conducted a minimum of two times each. The test sequence also comprises Stribeck curves and traction curves performed before and after a duration step of 70 h.

3. Results and Discussion

3.1. Morphology

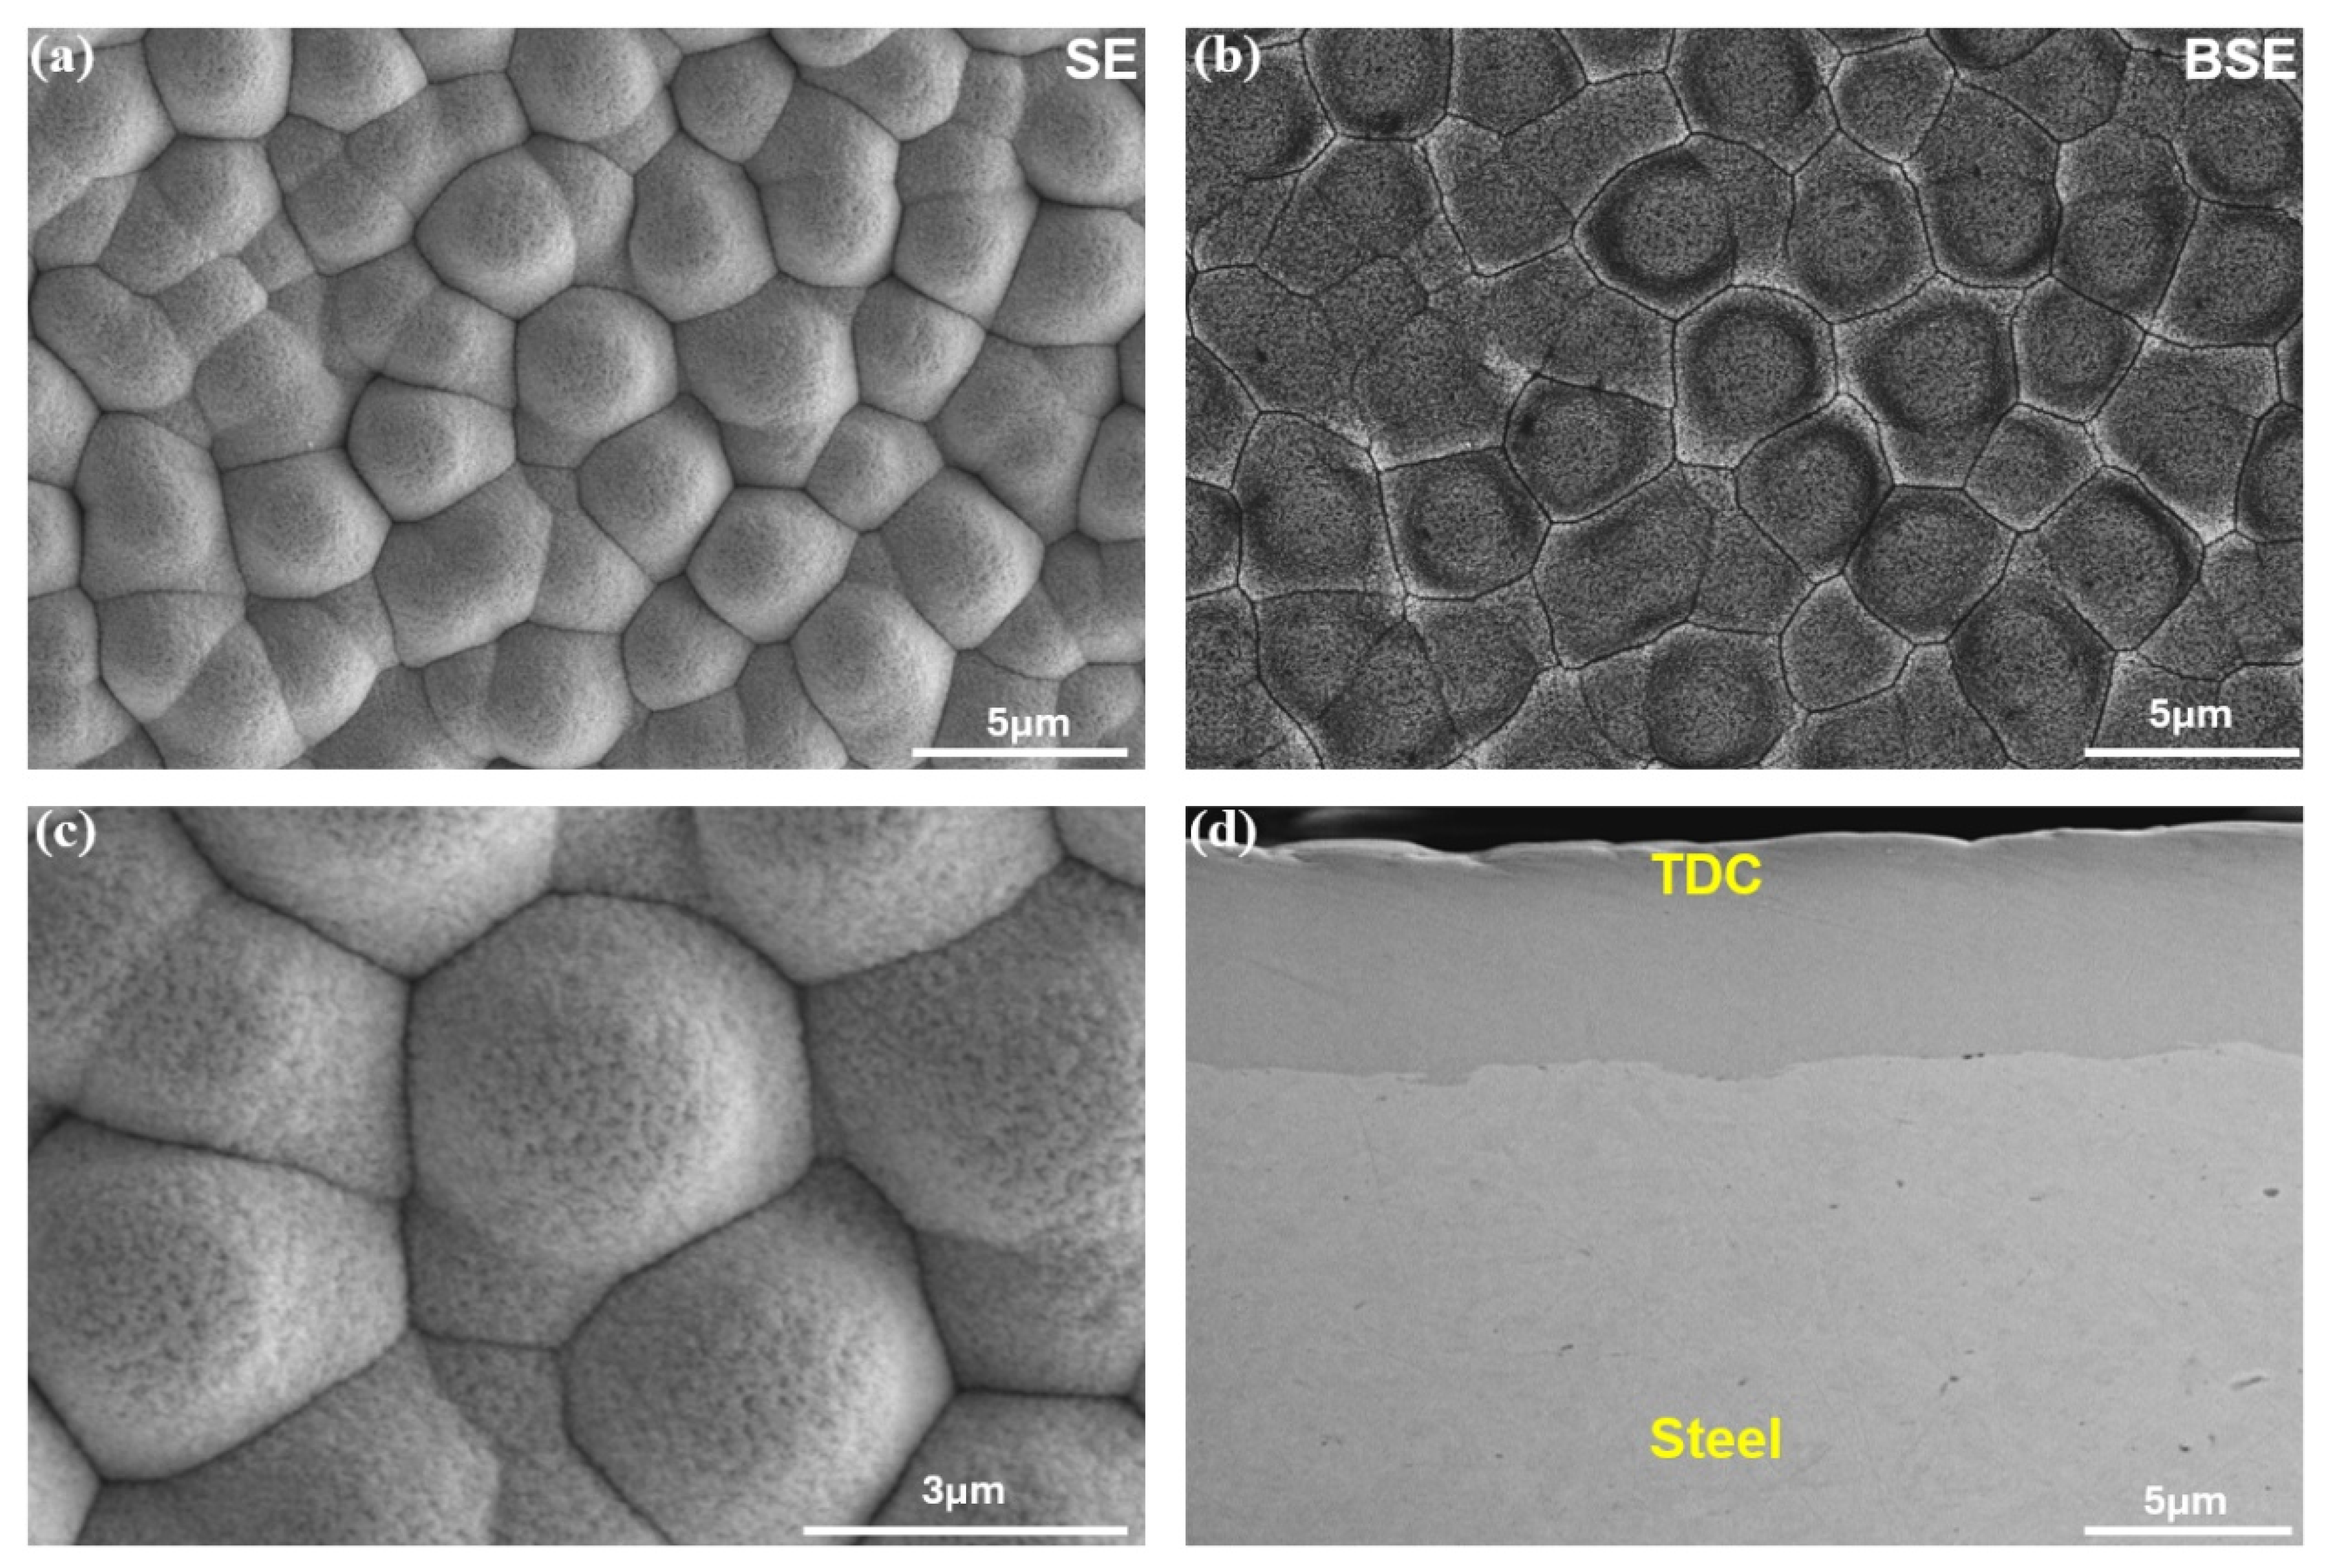
Figure 3a–c present top-view, low- and high-magnification SEM images of a TDC coating captured through secondary electron (SE) and backscatter electron (BSE) signals. The SE-SEM images in Figure 3a,c reveal a distinctive, uniformly distributed nodular surface morphology with an average diameter of 3.6 ± 0.5 µm. In addition, the BSE-SEM image in Figure 3b highlights the nodular boundaries with no signs of micro-cracks or other surface defects. Cross-sectional SEM imaging of the TDC coating in Figure 3d further confirms a flawless chromium layer, applied with a thickness close to ~5 µm that is free from micro-cracks within the microstructure. Furthermore, no inclusions or defects were observed at the coating–steel interface,
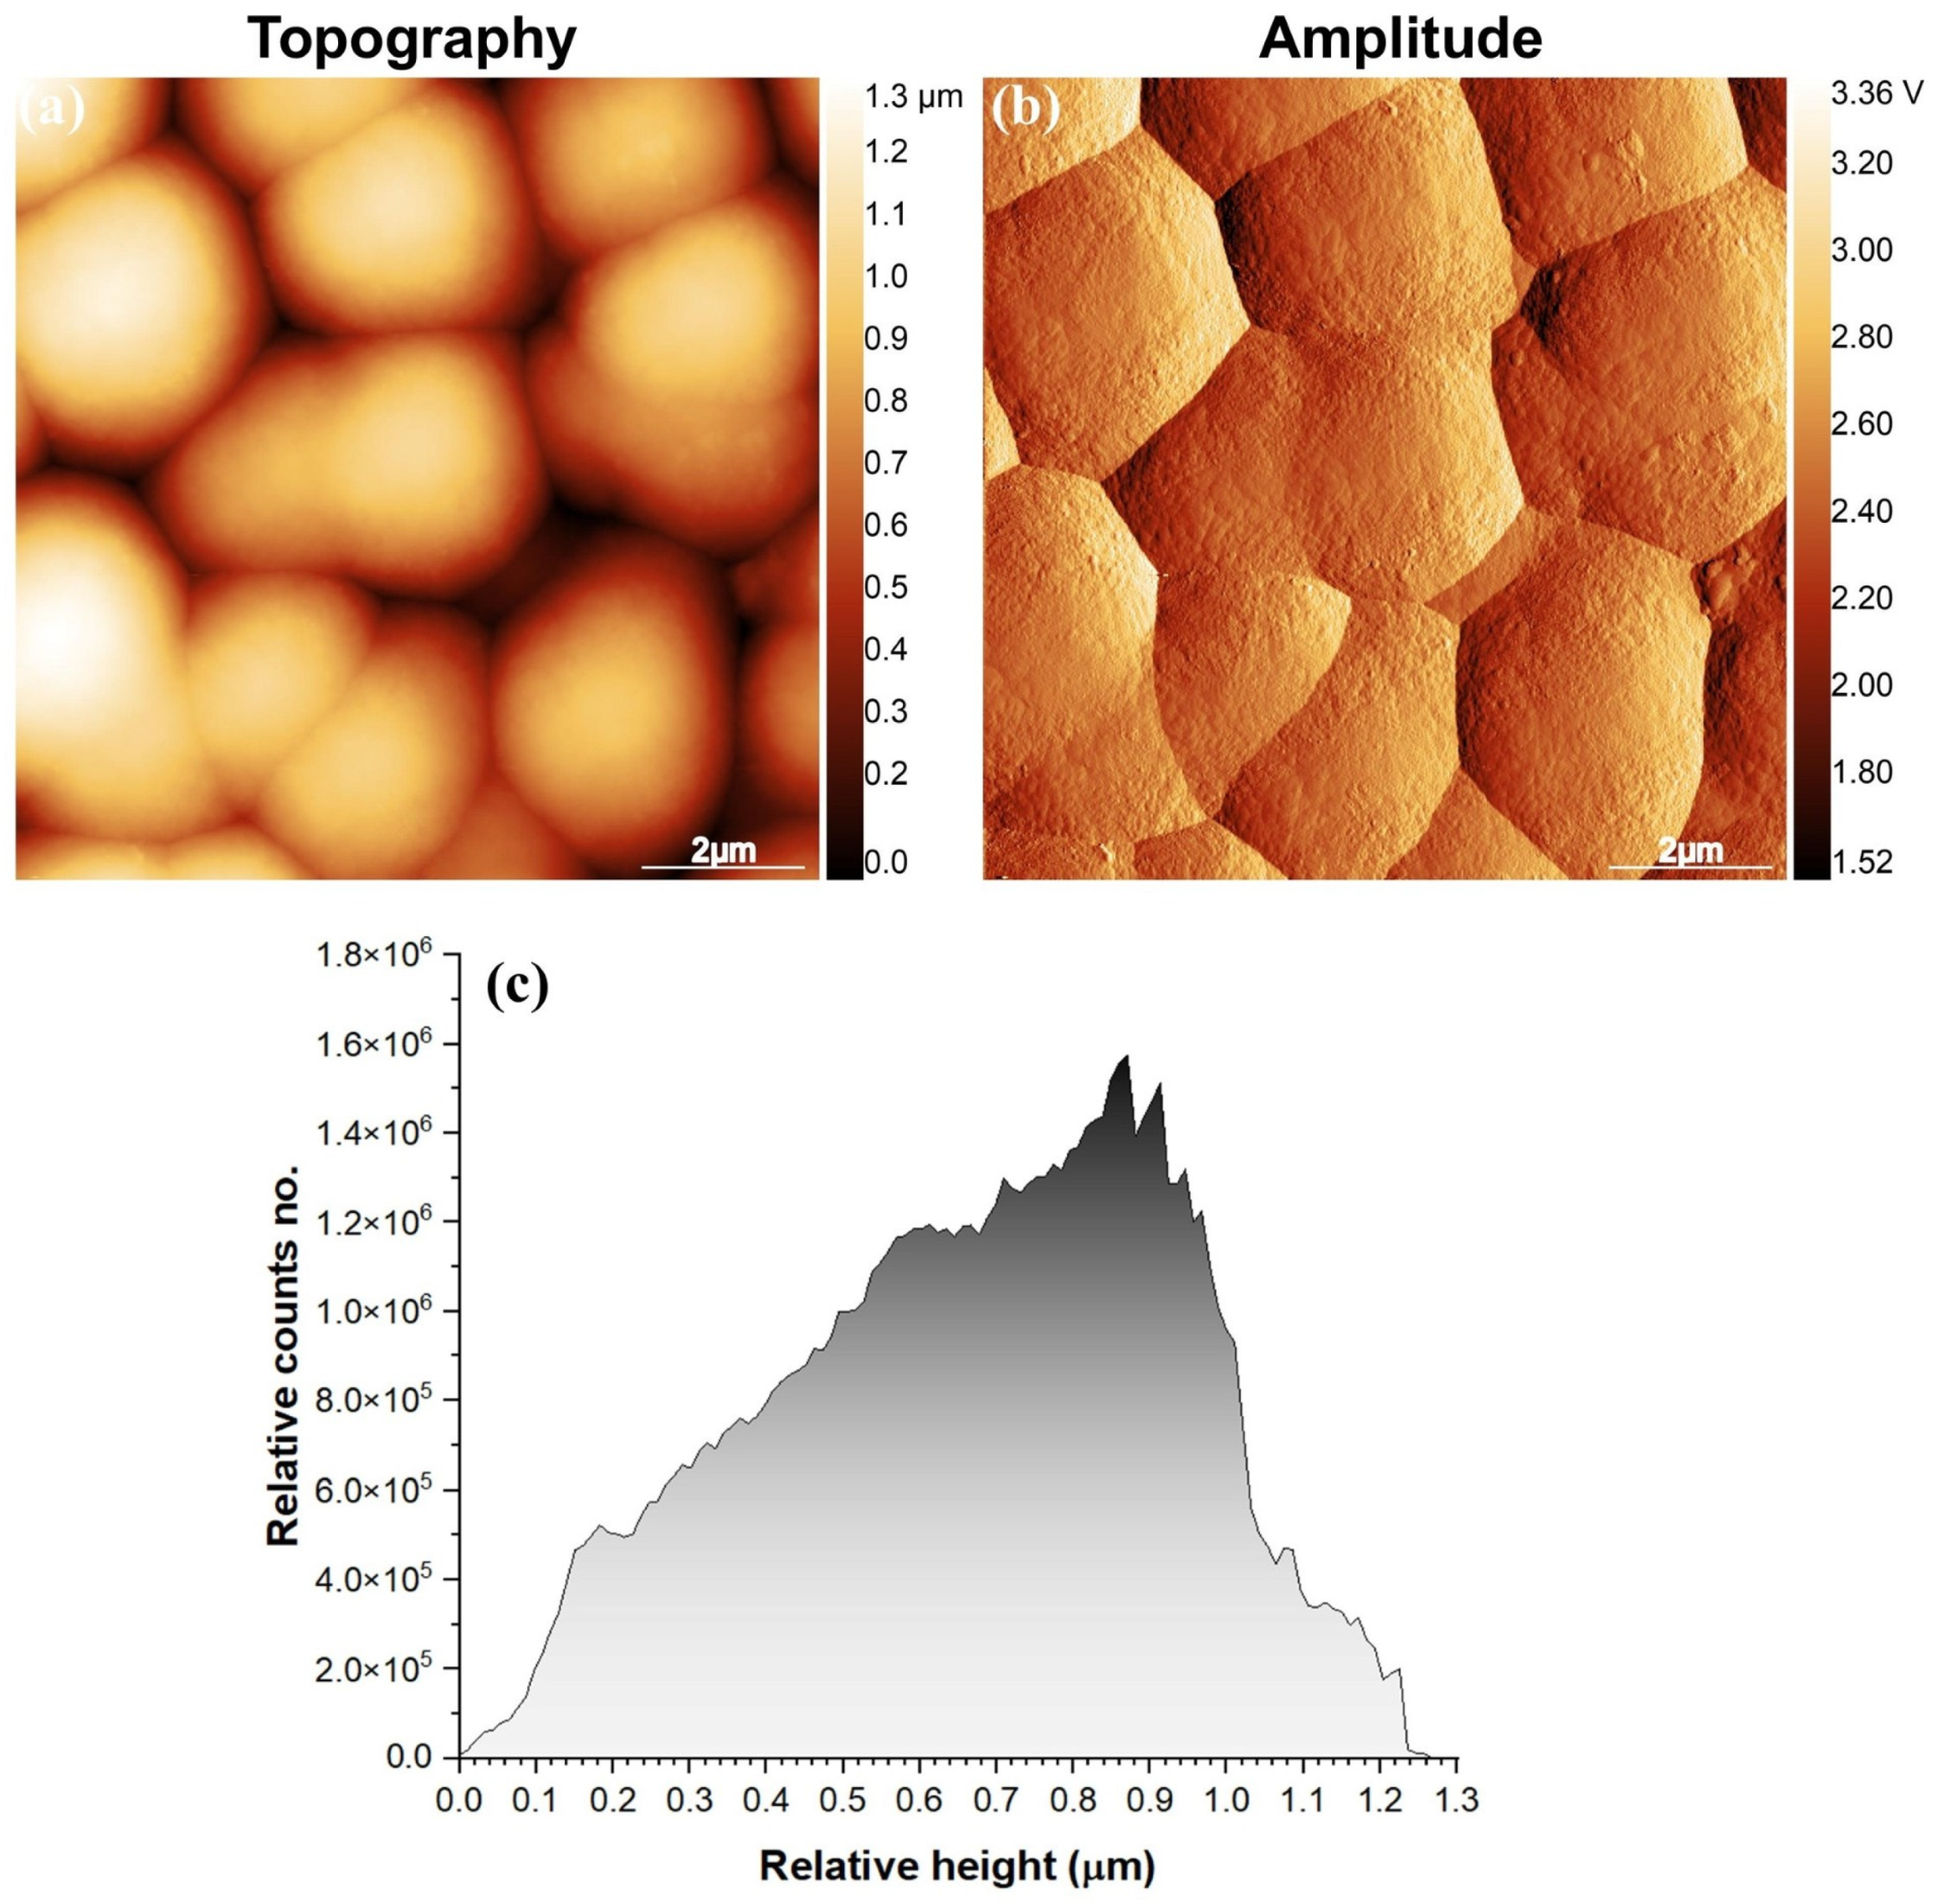
Additional surface morphology and topography details of the TDC coating were obtained by using AFM, as shown in Figure 4. The topography and amplitude mapping signals of the TDC coating, measured over a 10 × 10 µm2 area (Figure 4a,b), reveal nodular features of varying heights with deep gaps at nodule boundaries. The average surface roughness (Ra) of the TDC coating is 204 ± 40 nm. Furthermore, the topography histogram in Figure 4c illustrates a pseudo-heterogeneous distribution of nodules and boundaries, which is characterized by darker regions representing the gaps between nodules.

3.2. Mechanical Properties

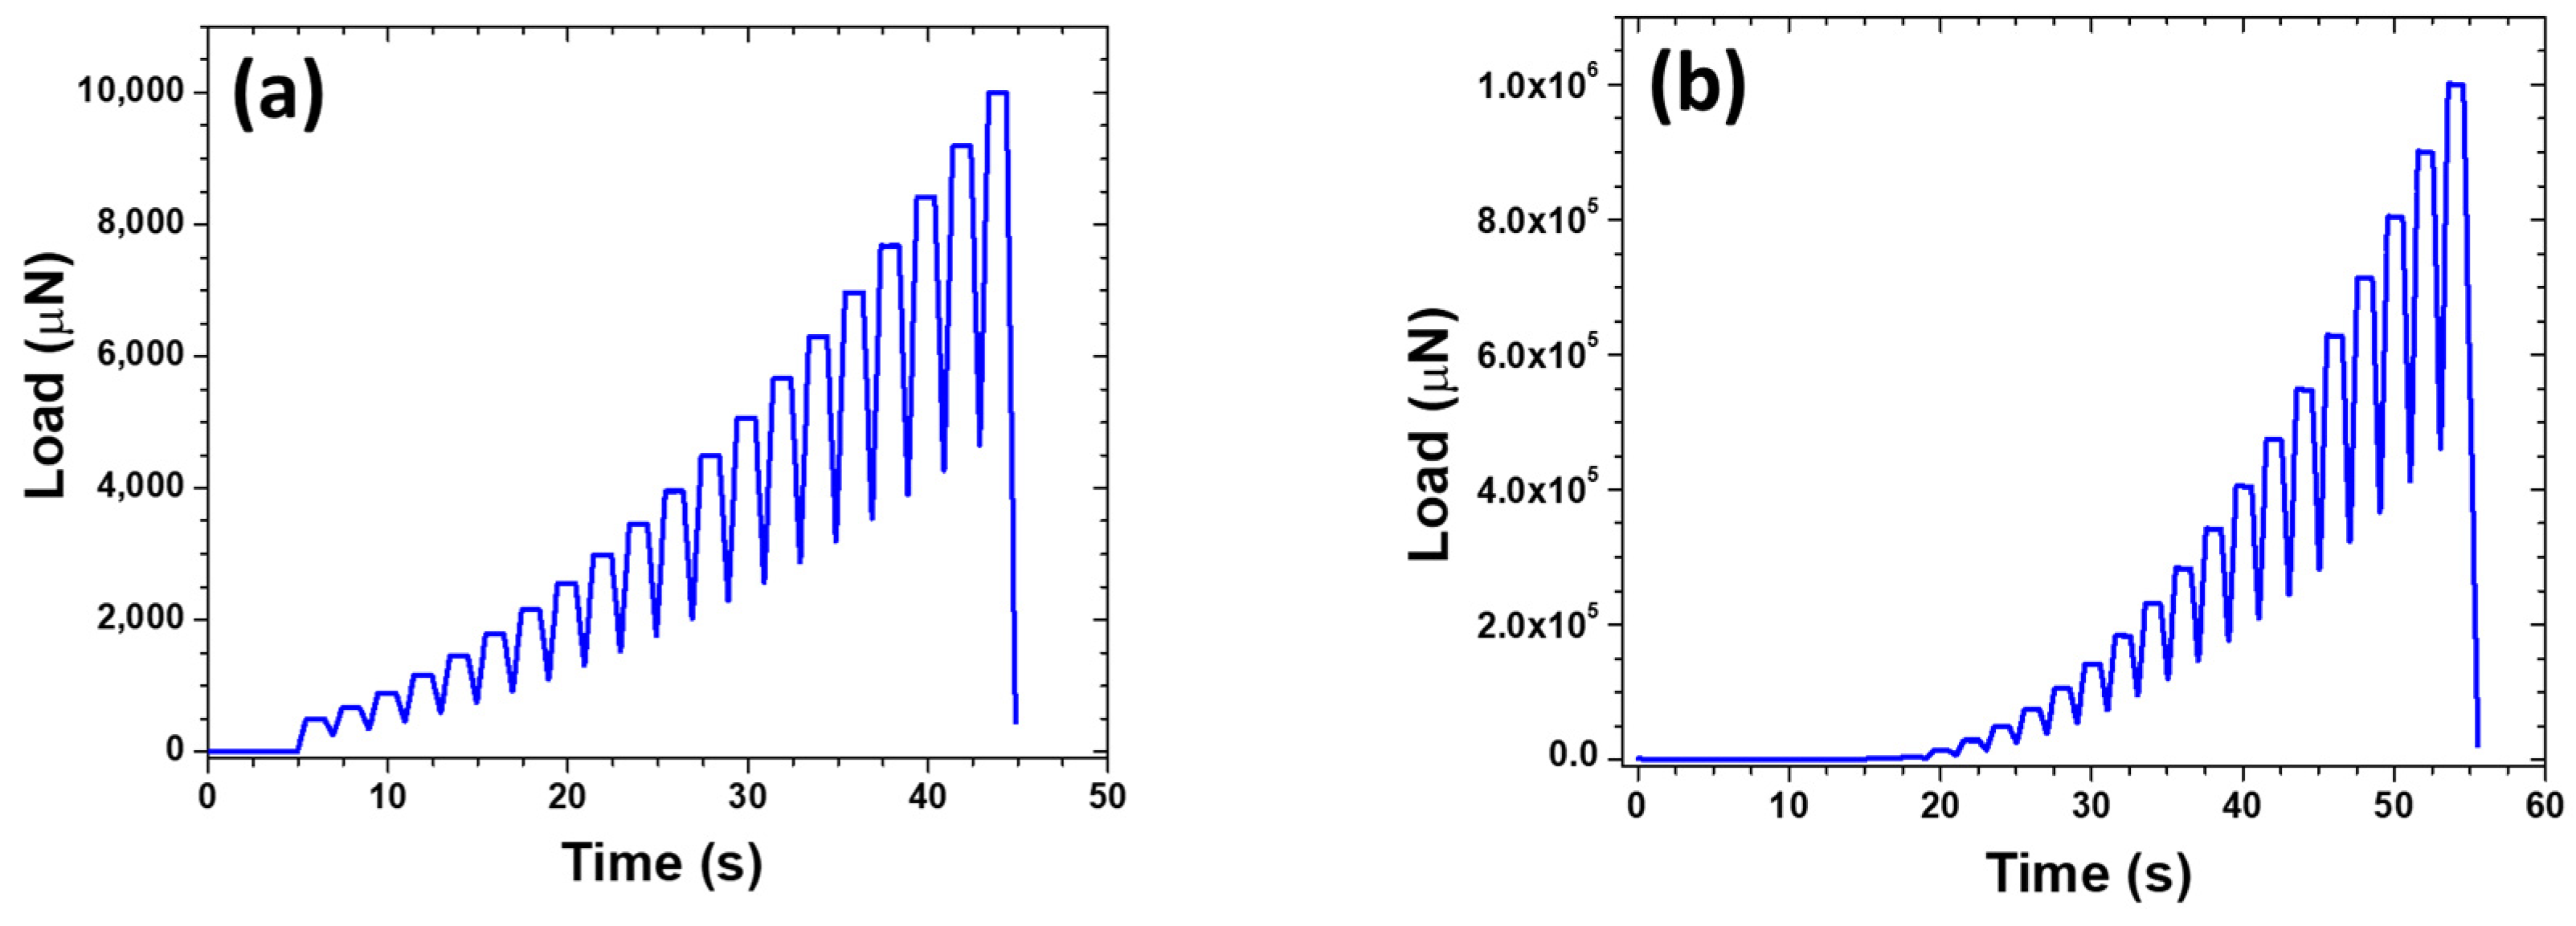
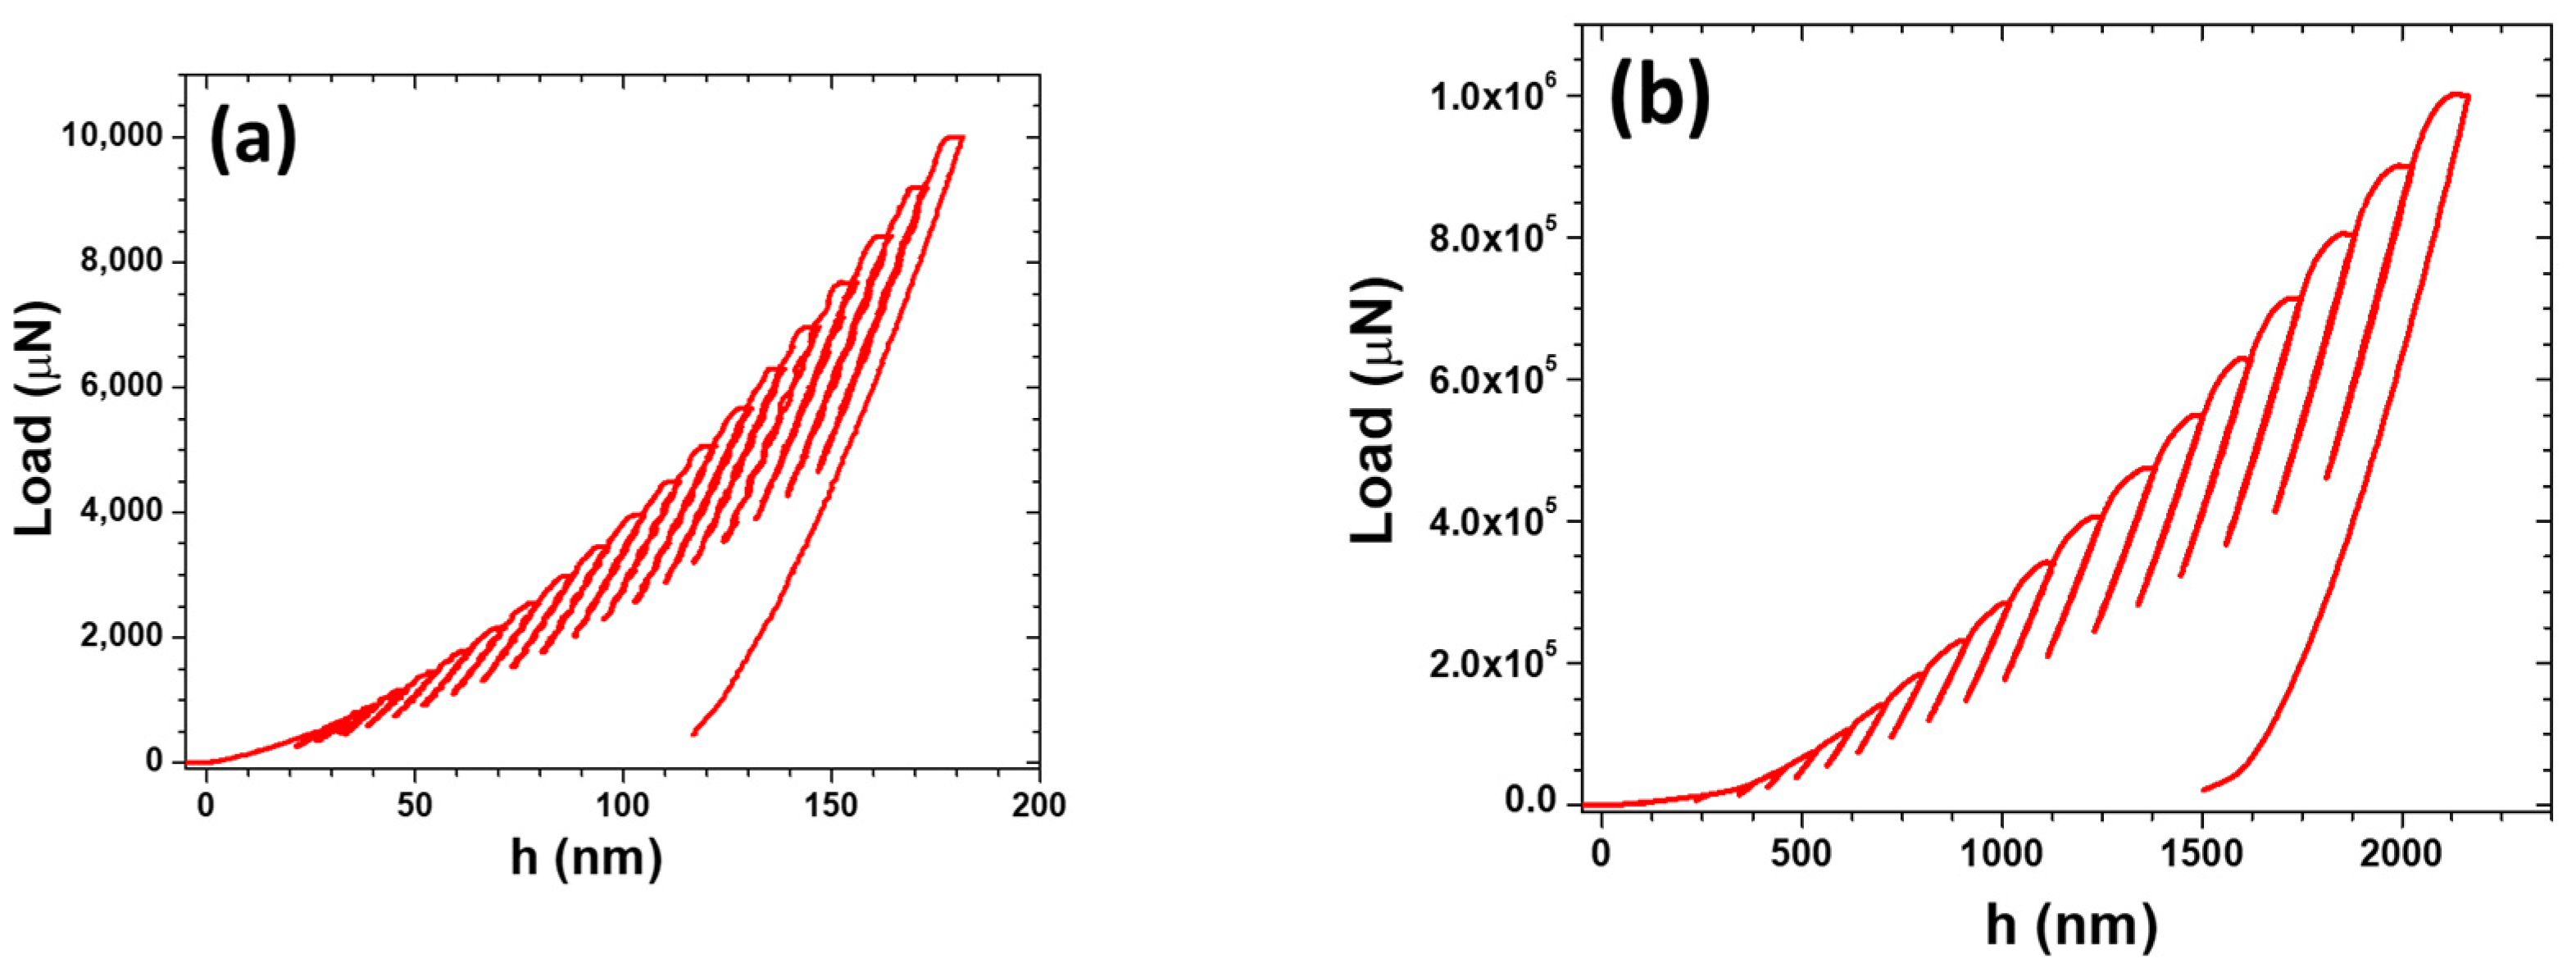
Nanoindentations were performed using a quasi-static partial unload test schedule, as shown in Figure 5a,b. It consists of 20 cycles, where the maximum load (Lmax) was 10 mN (Figure 5a) or 1 N (Figure 5b). At each load increment, a partial unloading is set to provide a measurement of hardness (HIT) and reduced elastic modulus (Er) at the reached penetration depth (h) of the cycle. In this way, it is possible to obtain HIT an Er versus h in a single indentation. Figure 6a,b show typical load–displacement curves obtained when indenting a TDC coated steel substrate.
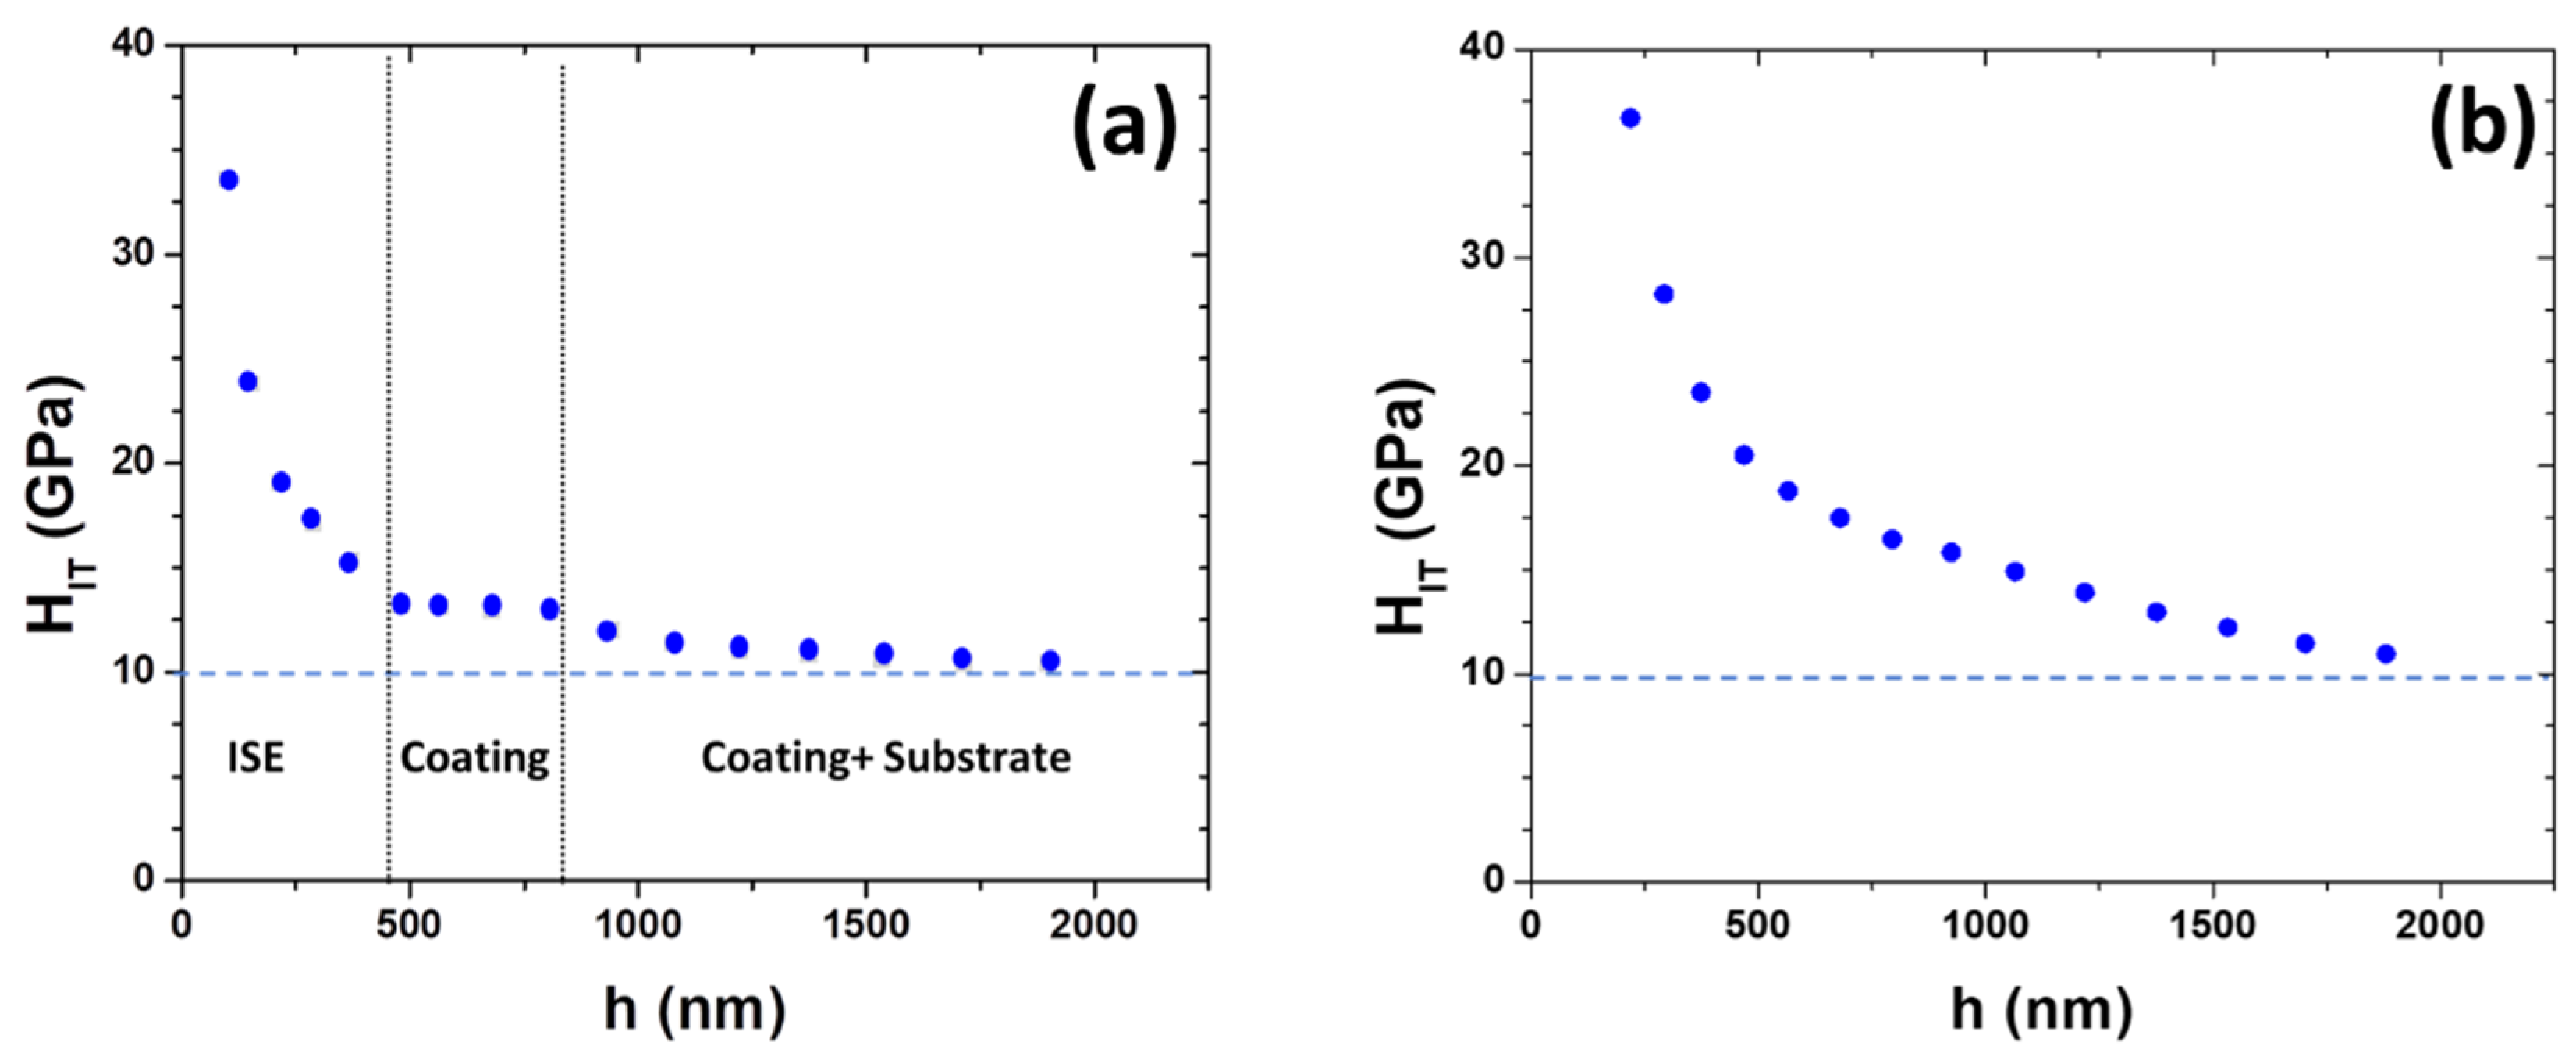
Figure 7 displays two examples of HIT vs. penetration depth curves obtained at Lmax = 1 N. It can be observed that there is a strong indentation size effect (ISE) at low penetrations depths. On the other hand, at very high penetrations, the curves tend to a value of HiT~9 GPa which is the steel substrate hardness. According to the graphical method of the ISO 14525 standard [26], the nanoindentation hardness can be found on the part of the curve where HIT is constant over a certain range of h. We can observe that Figure 7a presents a flat region in the range ~500 nm < h < 800 nm with a value of HIT~13 GPa. For h > 800 nm, the steel substrate starts to influence the hardness values and at h~1900 nm, the hardness is close to the steel substrate’s hardness. However, most of the obtained curves after several tests were similar to Figure 7b, where the indentation size effect is very strong and therefore it is not possible to determine the TDC coating hardness. The nanoindentation size effect could be originated by the high roughness introduced by the nodular microstructure and/or the presence of nodular grain dislocations due to the strain gradients generated around the indenter tip [18,27].
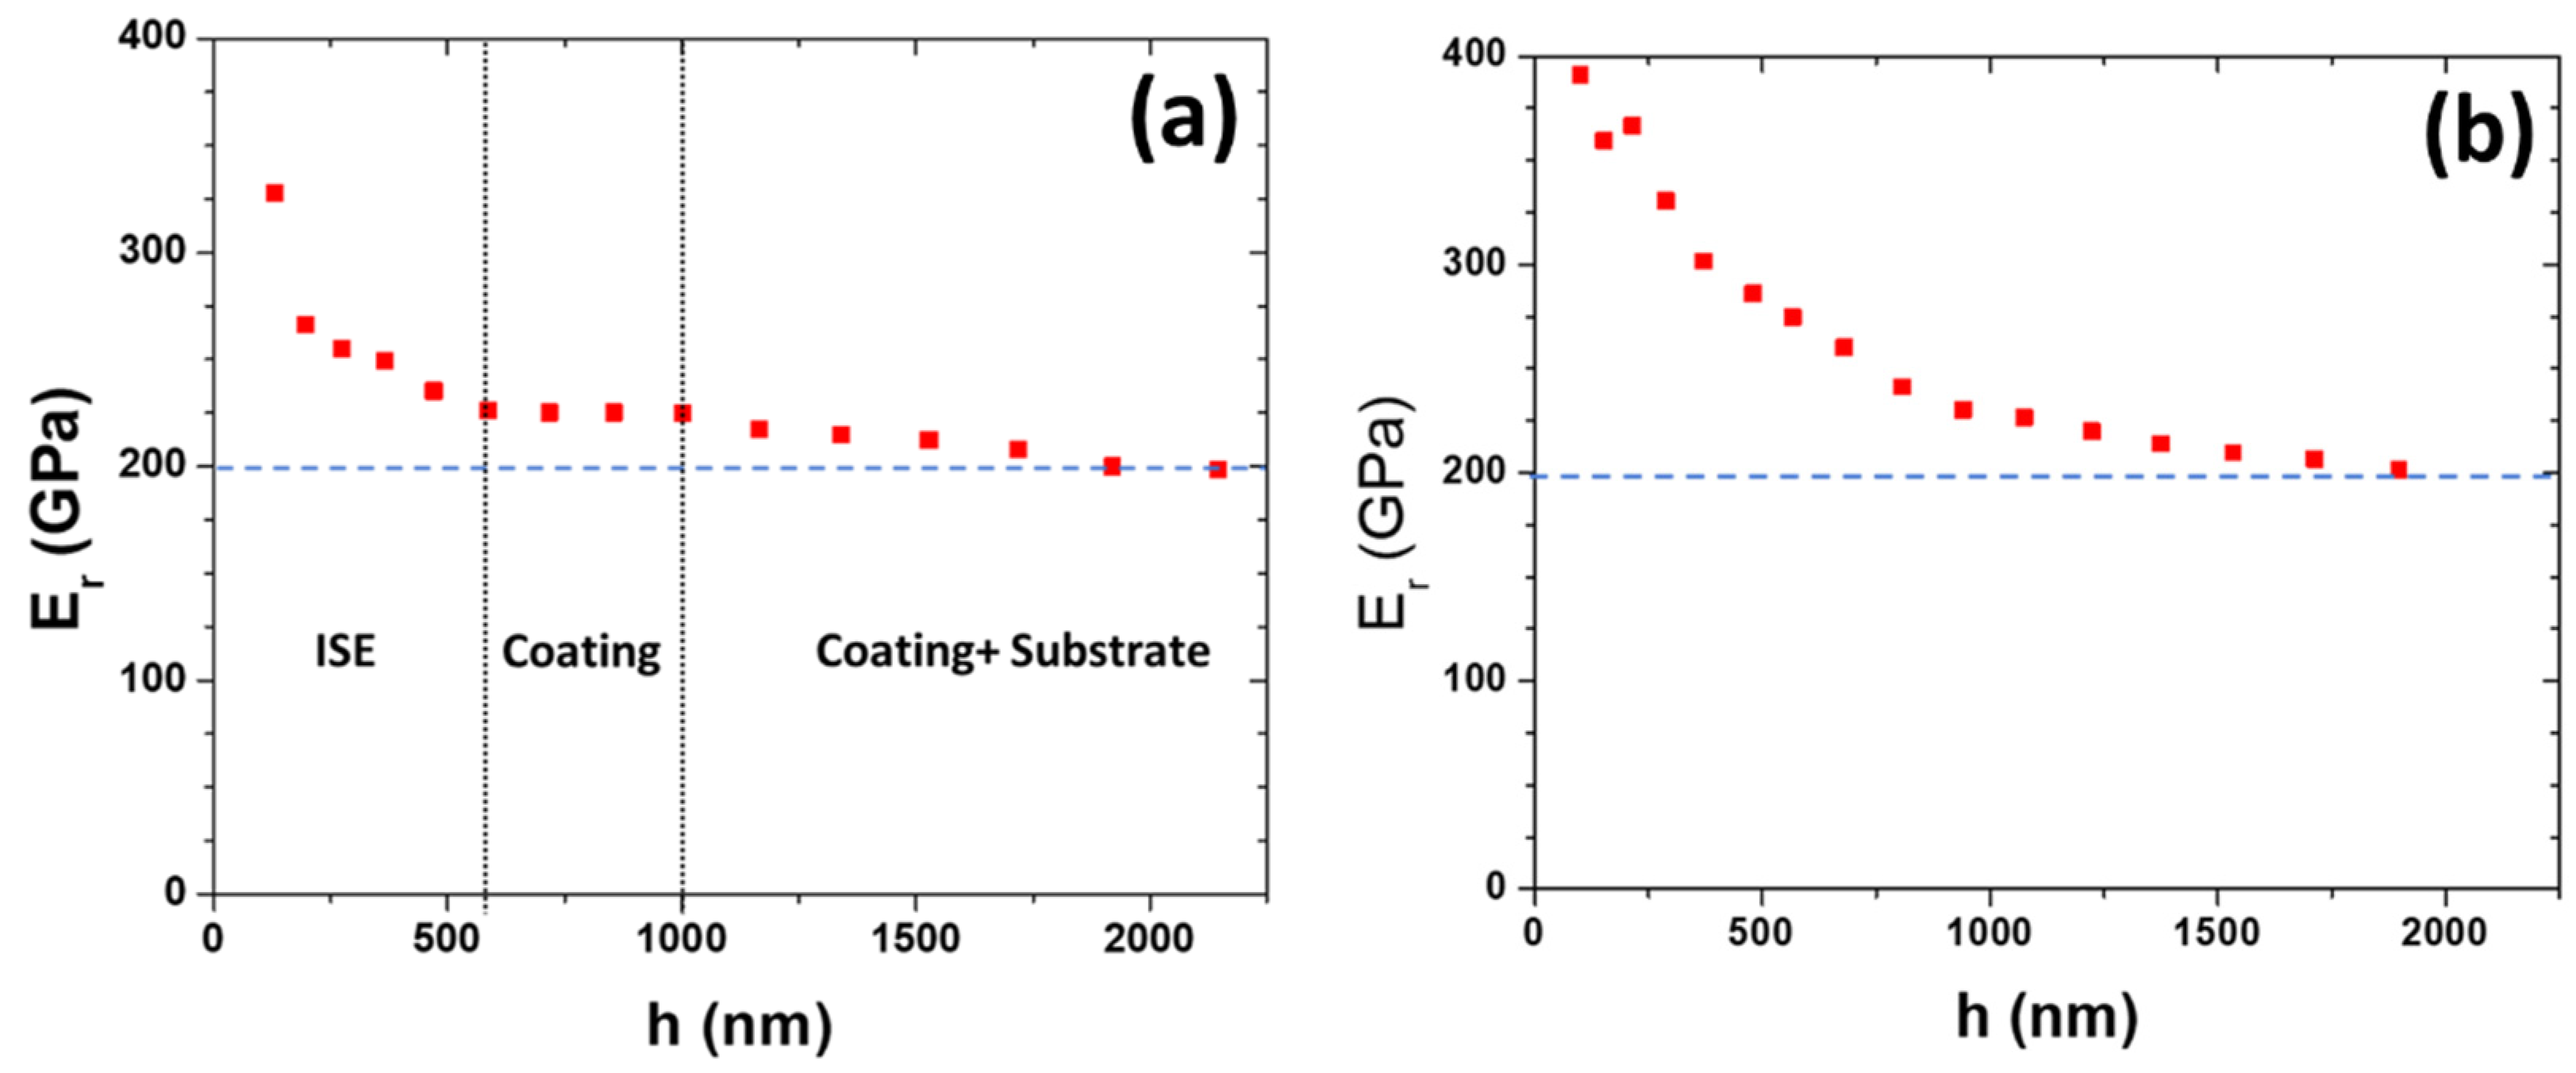
Similar observations were obtained for the reduced elastic modulus, as displayed in Figure 8. In some cases, a value of Er~225 GPa could be determined for the TDC coatings according to the ISO 14525 standard, while in most of the tests, the indentation size effect and the influence of the steel substrate denied the possibility to measure an elastic modulus value. At high penetration depths, all curves tend to a value Er~200 GPa, which is similar to the steel substrate’s reduced elastic modulus.
In order to have a more systematic determination of the TDC nanomechanical properties, cross-sectional samples were measured by using the surface probe microscopy (SPM) mode feature of the nanoindenter. In this mode, the nanoindentation tip is first used as a SPM to scan the topography of the sample and determine the position of the TDC cross-section layer (Figure 9). Then, the polished cross-section area was indented four times following the method shown in Figure 5a, and HIT vs. penetration depth curves were obtained (Figure 10a). At low penetration depths, we can observe a strong increase of hardness, which can be associated with the nanoindentation size effect that in this case is originated by the presence of residual stresses and strain-hardening appearing from the sample preparation and polishing [18,27]. At high penetration depths, the hardness converges to a value of HIT = 14.9 ± 0.5 GPa. In the case of elastic modulus (Figure 10b), we also can observe the indentation size effect at low penetration depths for the four experiments and a convergence at high penetrations depths of the reduced elastic modulus Er = 216.8 ± 3.9 GPa. These measurements contrast with the lower values measured for ASTM 52100 hardened bearing steel [25]: HIT = 8.98 ± 0.97 GPa and Er = 197.6 ± 8.4 GPa.
There are no published data on the elastic modulus of TDC coatings. Furthermore, all published TDC hardness values are reported in the range 70–78 HRC [6,16,28,29]. However, none of these publications describe how the hardness has been measured to avoid the influence of the substrate hardness. Indeed, the Rockwell C hardness HRC made by the indentation with a ball indenter is calculated by the equation:
HRC = 130–500 h
where h (in mm) is the difference in penetration between two applied loads (one of them of 9.8 N) [18]. For a hardness of 78 HRC, we deduce from Equation (1) a value of h = 104 µm and therefore, the ball indenter has fully penetrated the coating thickness and more than 80 µm of the steel substrate, which would be strongly influencing the measurement.
Standard AMS2438 [30] establishes that Vickers hardness of TDC coatings should be 900 HV100 or higher, when measured on a sample cross-section with minimum thickness of 25 µm; this thickness condition limits the possibility to measure the hardness of TDC coatings in standard bearing applications.
The results presented in this section made by nanoindentation, HIT = 14.9 ± 0.5 GPa and Er = 216.8 ± 3.9 GPa, are the first reported hardness and elastic modulus values of TDC coatings without influence of the substrate.

3.3. Adhesion Characterization

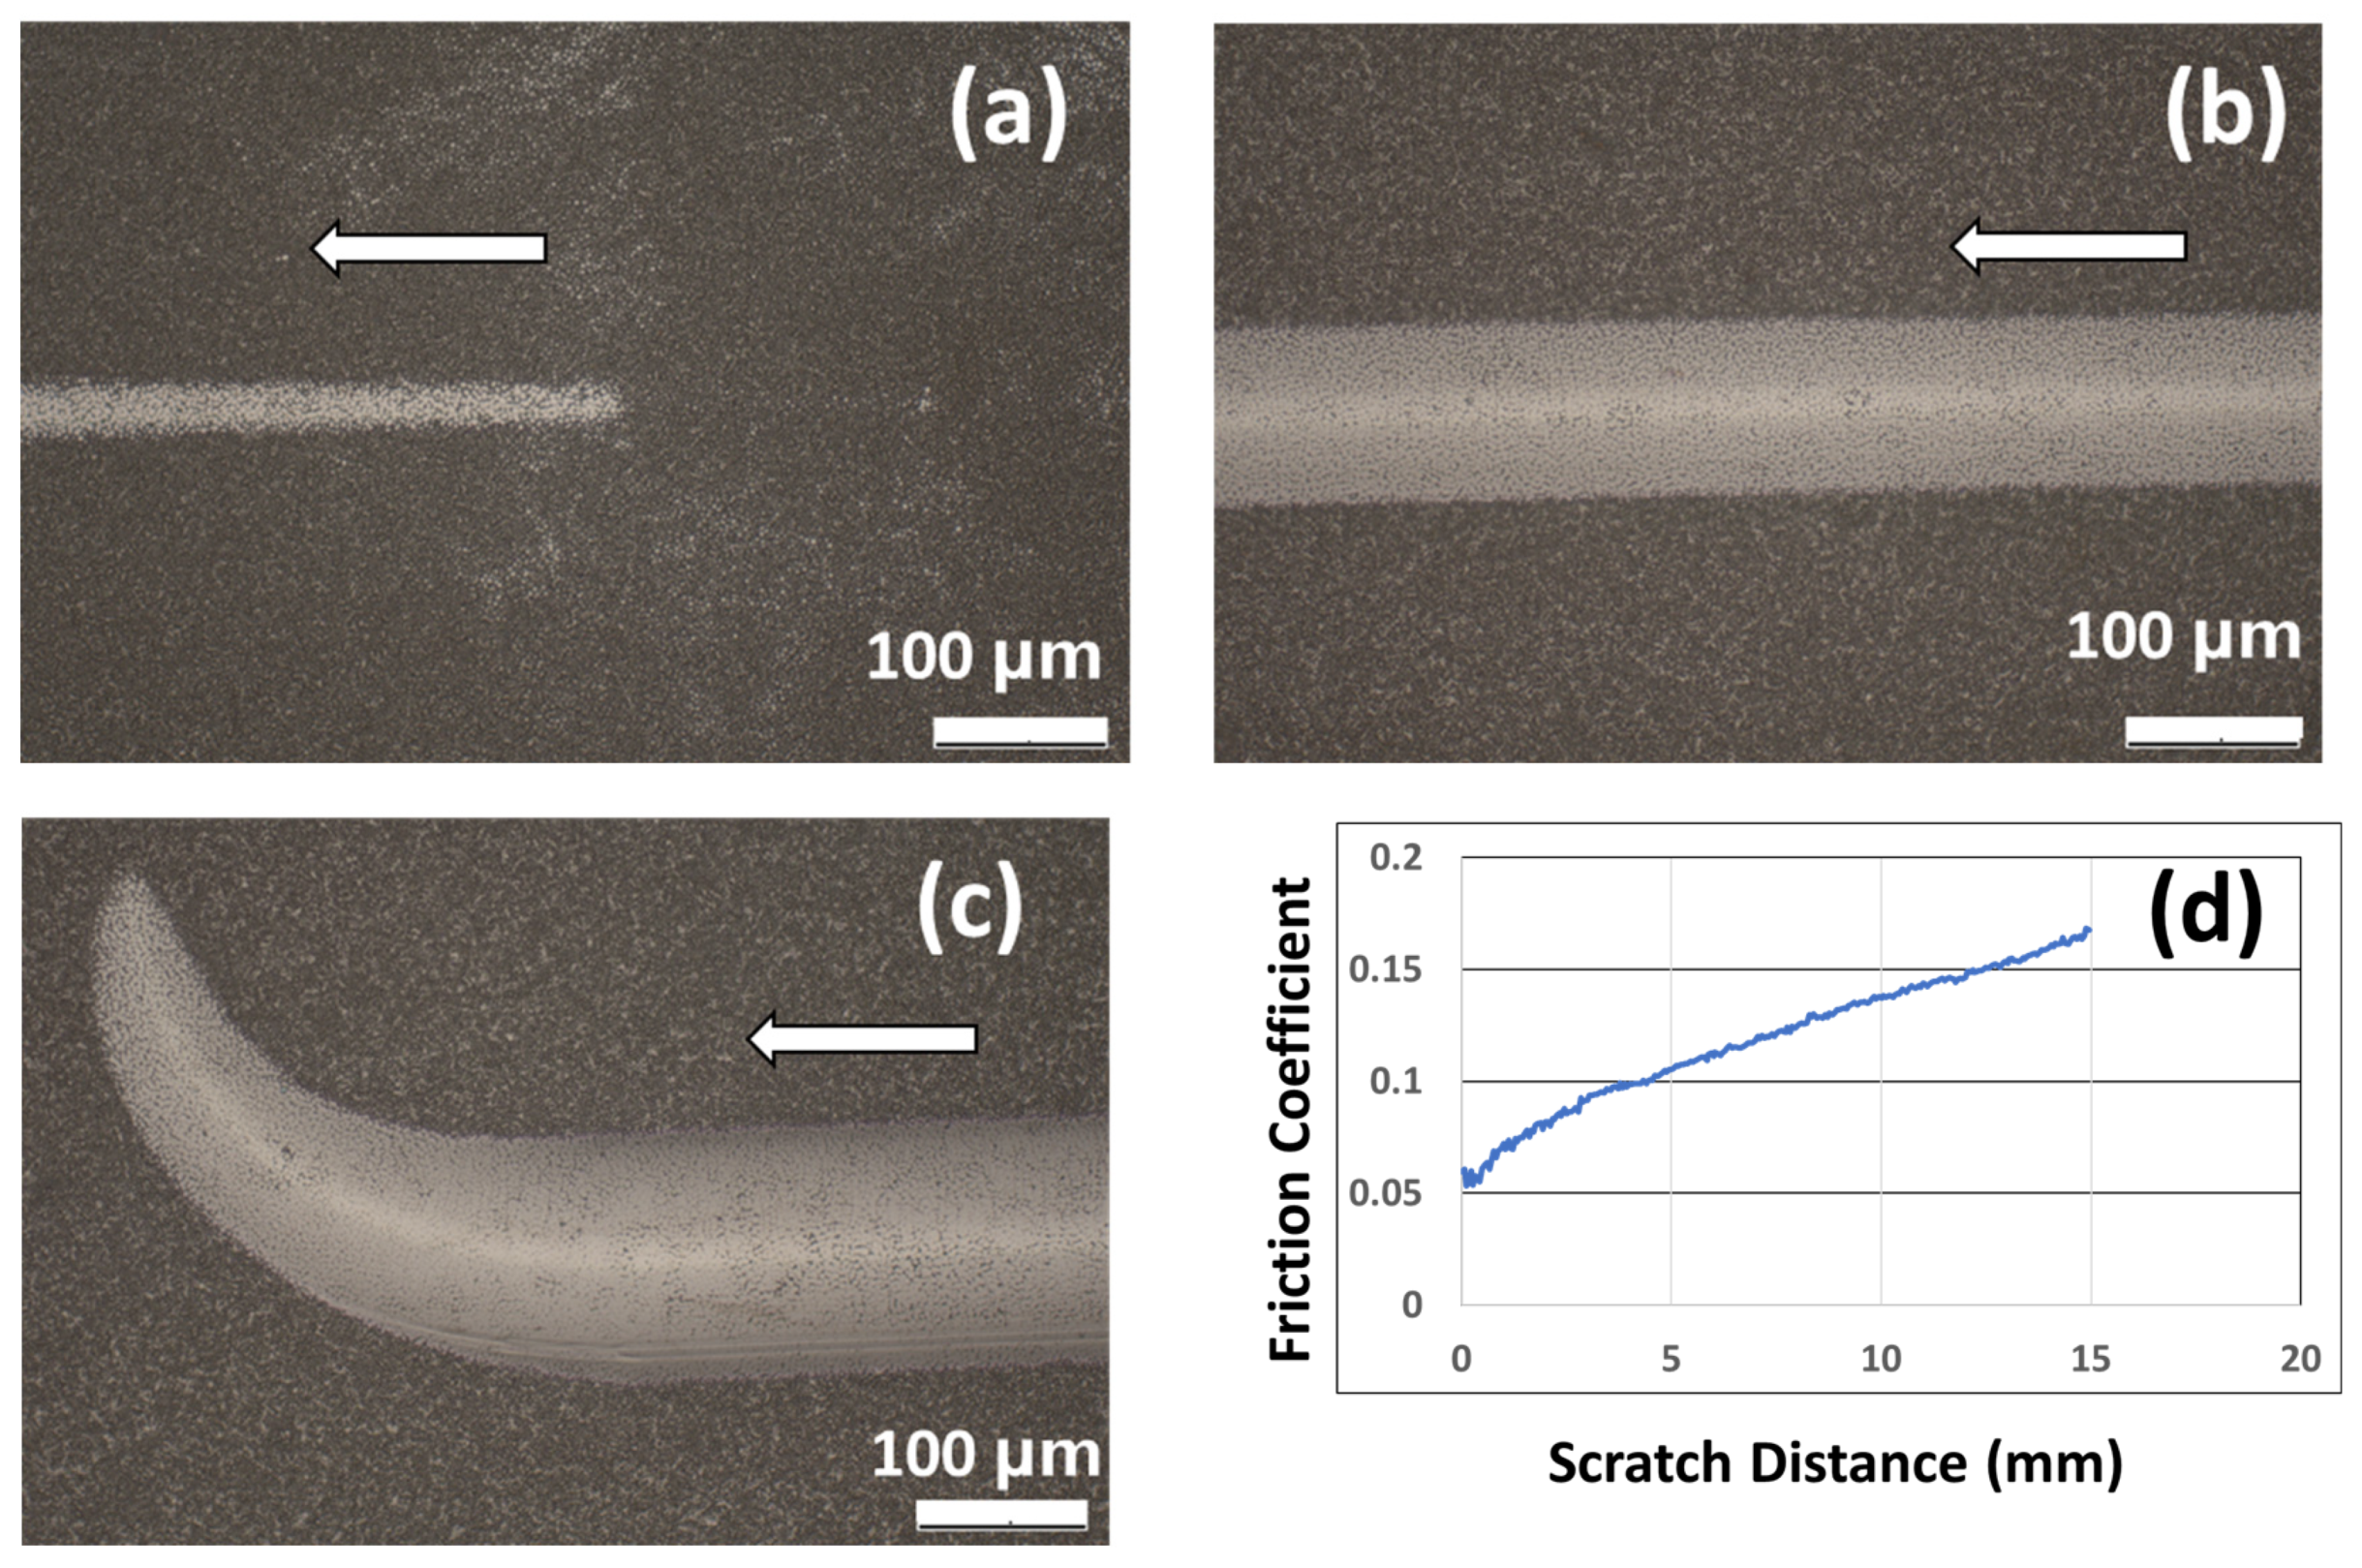
Figure 11a–c displays the scratches at the beginning, middle, and end of the test. No delamination of the coating is observed at any applied load in the range 0–100 N. Figure 11d shows the friction coefficient between the diamond tip and the TDC coating measured during the scratch. The friction shows a steady growth with no presence of spikes or sudden increase in the friction value, which are observable characteristics during the presence of adhesion failures [24].
There are no reports regarding the adhesion measurement of TDC coatings by the scratch test. There is, however, one conference paper by Jones et al. where the authors measured a thin (10 µm) electrodeposited hard chromium by using a Revetest® scratch tester [31]. Their measurement, which was conducted under the same conditions of our test, found that a full delamination occurred at Lc~61 N.
Adhesion scratch tests of typical hard coatings used in the tool industry, like TiN [32] and diamond-like CNx [33] coatings obtained by reactive magnetron sputtering, have been reported to show full delamination at values of Lc = 74 N and 84 N, respectively. Our results indicate that the adhesion of the TDC coatings onto steel is higher than standard hard chromium, TiN, and CNx coatings.

3.4. Reciprocal Sliding Tribological Tests

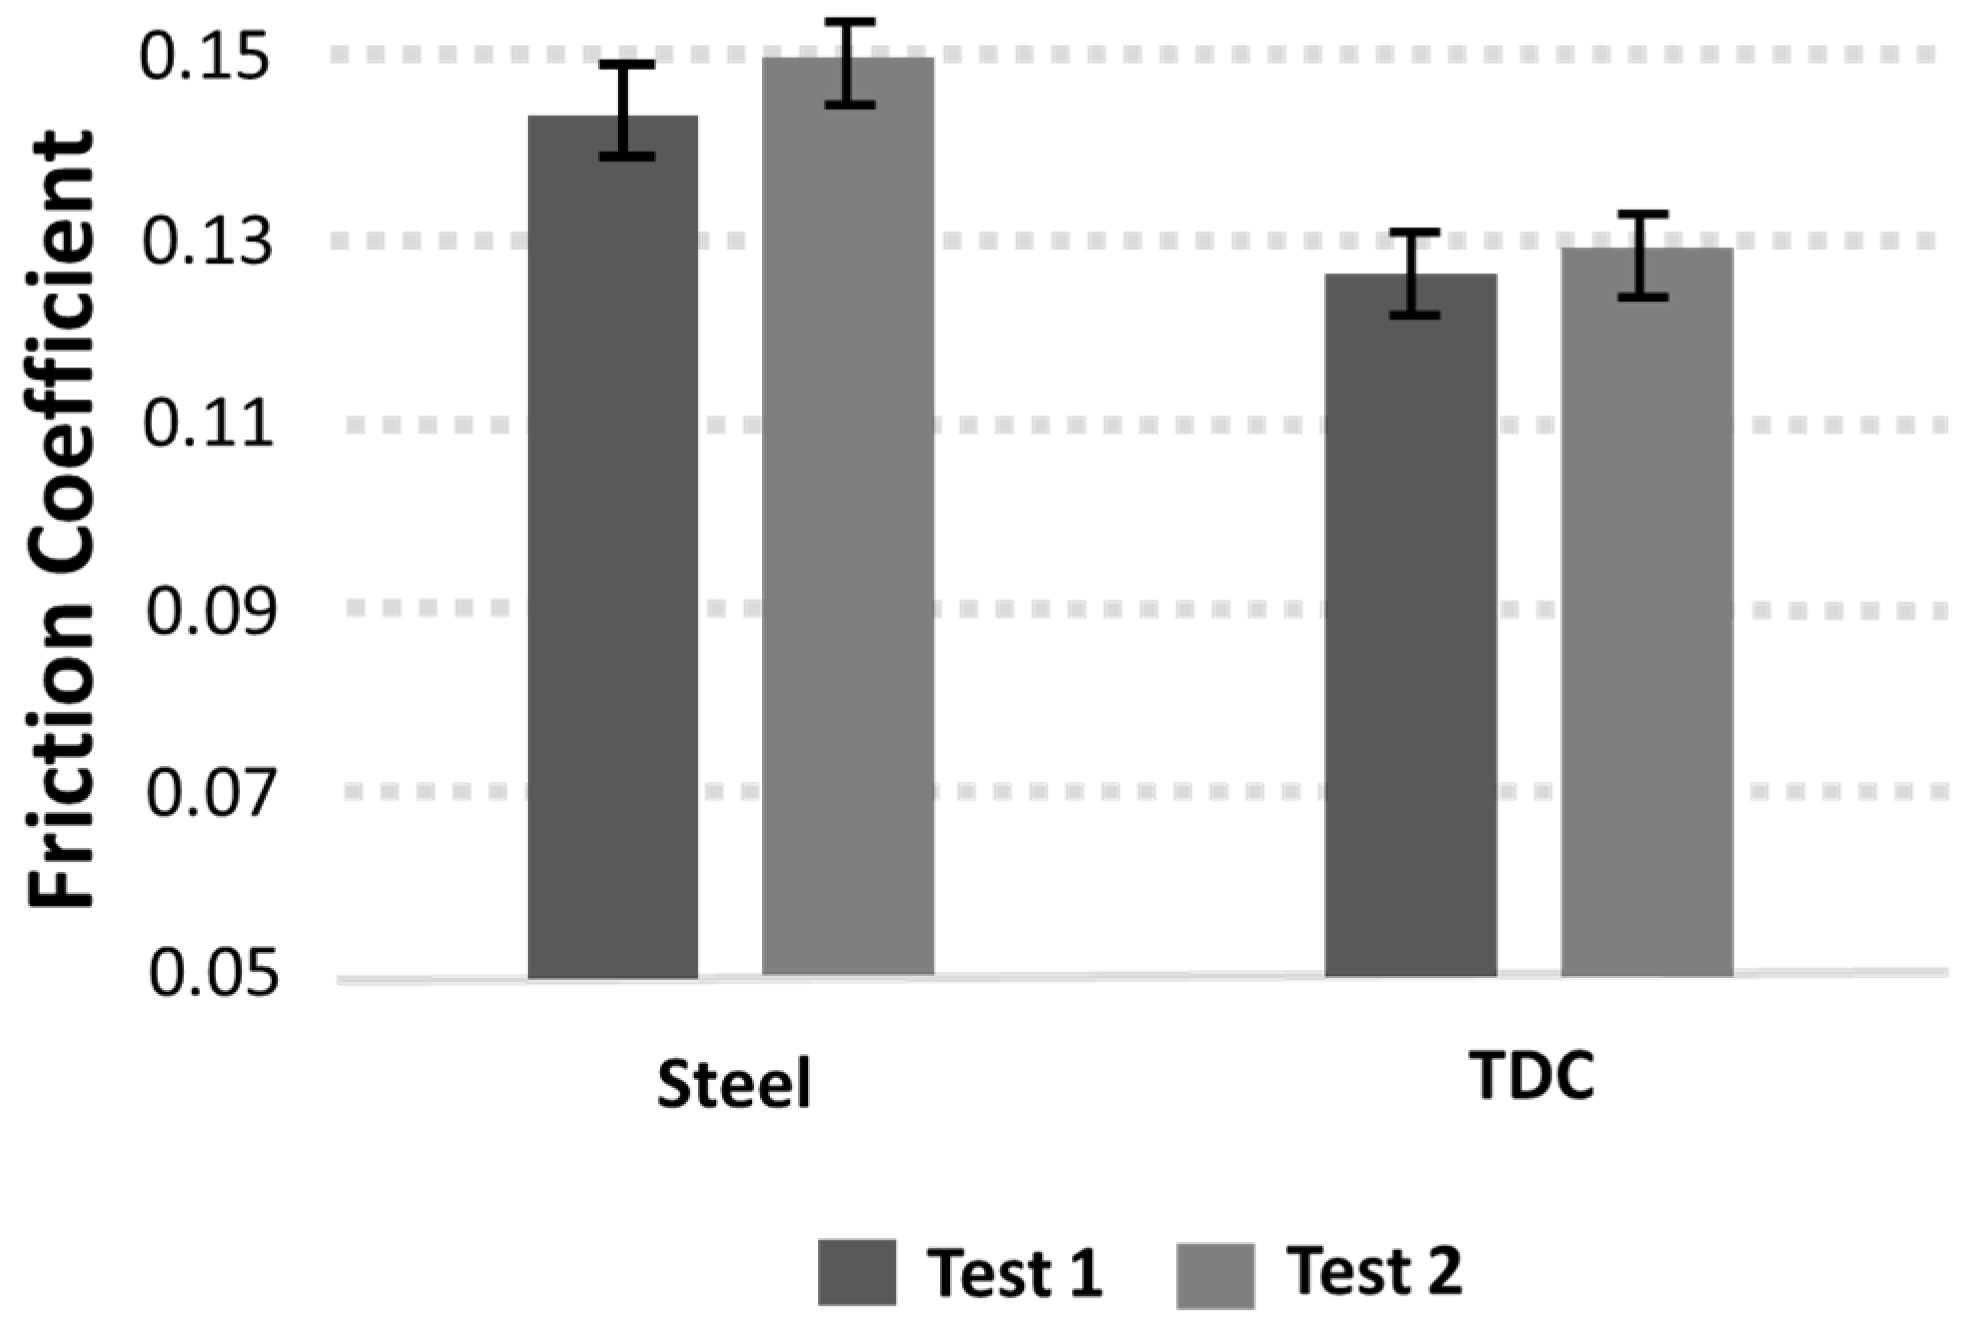
Figure 12 compares the friction coefficient behavior of the pairs steel–steel and TDC–TDC at the end of the reciprocating tests with 1.25 GPa contact pressure, where after a short run-in period, they display a constant friction.
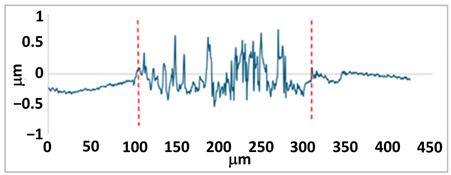
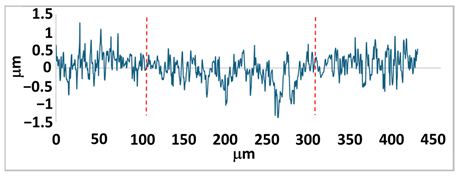
Table 3 displays the wear scars after the test. We have observed that both, the uncoated steel and TDC pairs present just some smoothening of the initial roughness peaks. Furthermore, comparing roughness values outside the wear track, we notice that the roughness values of steel and TDC are similar (Ra~247 nm for steel and ~291 nm for TDC). The result indicates that under the fixed fretting wear conditions, the friction coefficient is ~13% lower for TDC coatings, which is likely due to the eased smoothening of the initial roughness peak. No coating adhesion failures were observed after the tests.
The published information about the friction and wear performance of TDC coatings in sliding contacts is very scarce. Some coating companies advertise a 10%–60% friction reduction in comparison to the steel–steel contact, with friction values in the range 0.12–0.14 [34,35], but without details about the measurement conditions. J. F. Braza [36] is the only researcher who reported the sliding friction values of TDC coated steel samples. The tribometer consisted of two ASTM 52100 rollers, one stationary and the second rotating at a sliding speed of 2 m/s, being lubricated with synthetic turbine oil. After the tests, the TDC coated rollers were observed to have only polishing wear, with no formation of cracks or delamination. The rolling friction coefficient for TDC coatings at 250 N (0.33 GPa contact pressure) under mixed lubricated contact conditions was reported to be 0.067, while for the uncoated steel the recorded value was 0.097. Therefore, the use of TDC coatings represented a friction reduction of ~30% under the tested conditions. While a ~13% friction reduction was confirmed in our experiments, our reported values cannot be compared with the results of J. F. Braza because they were conducted under different tribological conditions.

3.5. Rolling-Sliding Tribological Tests

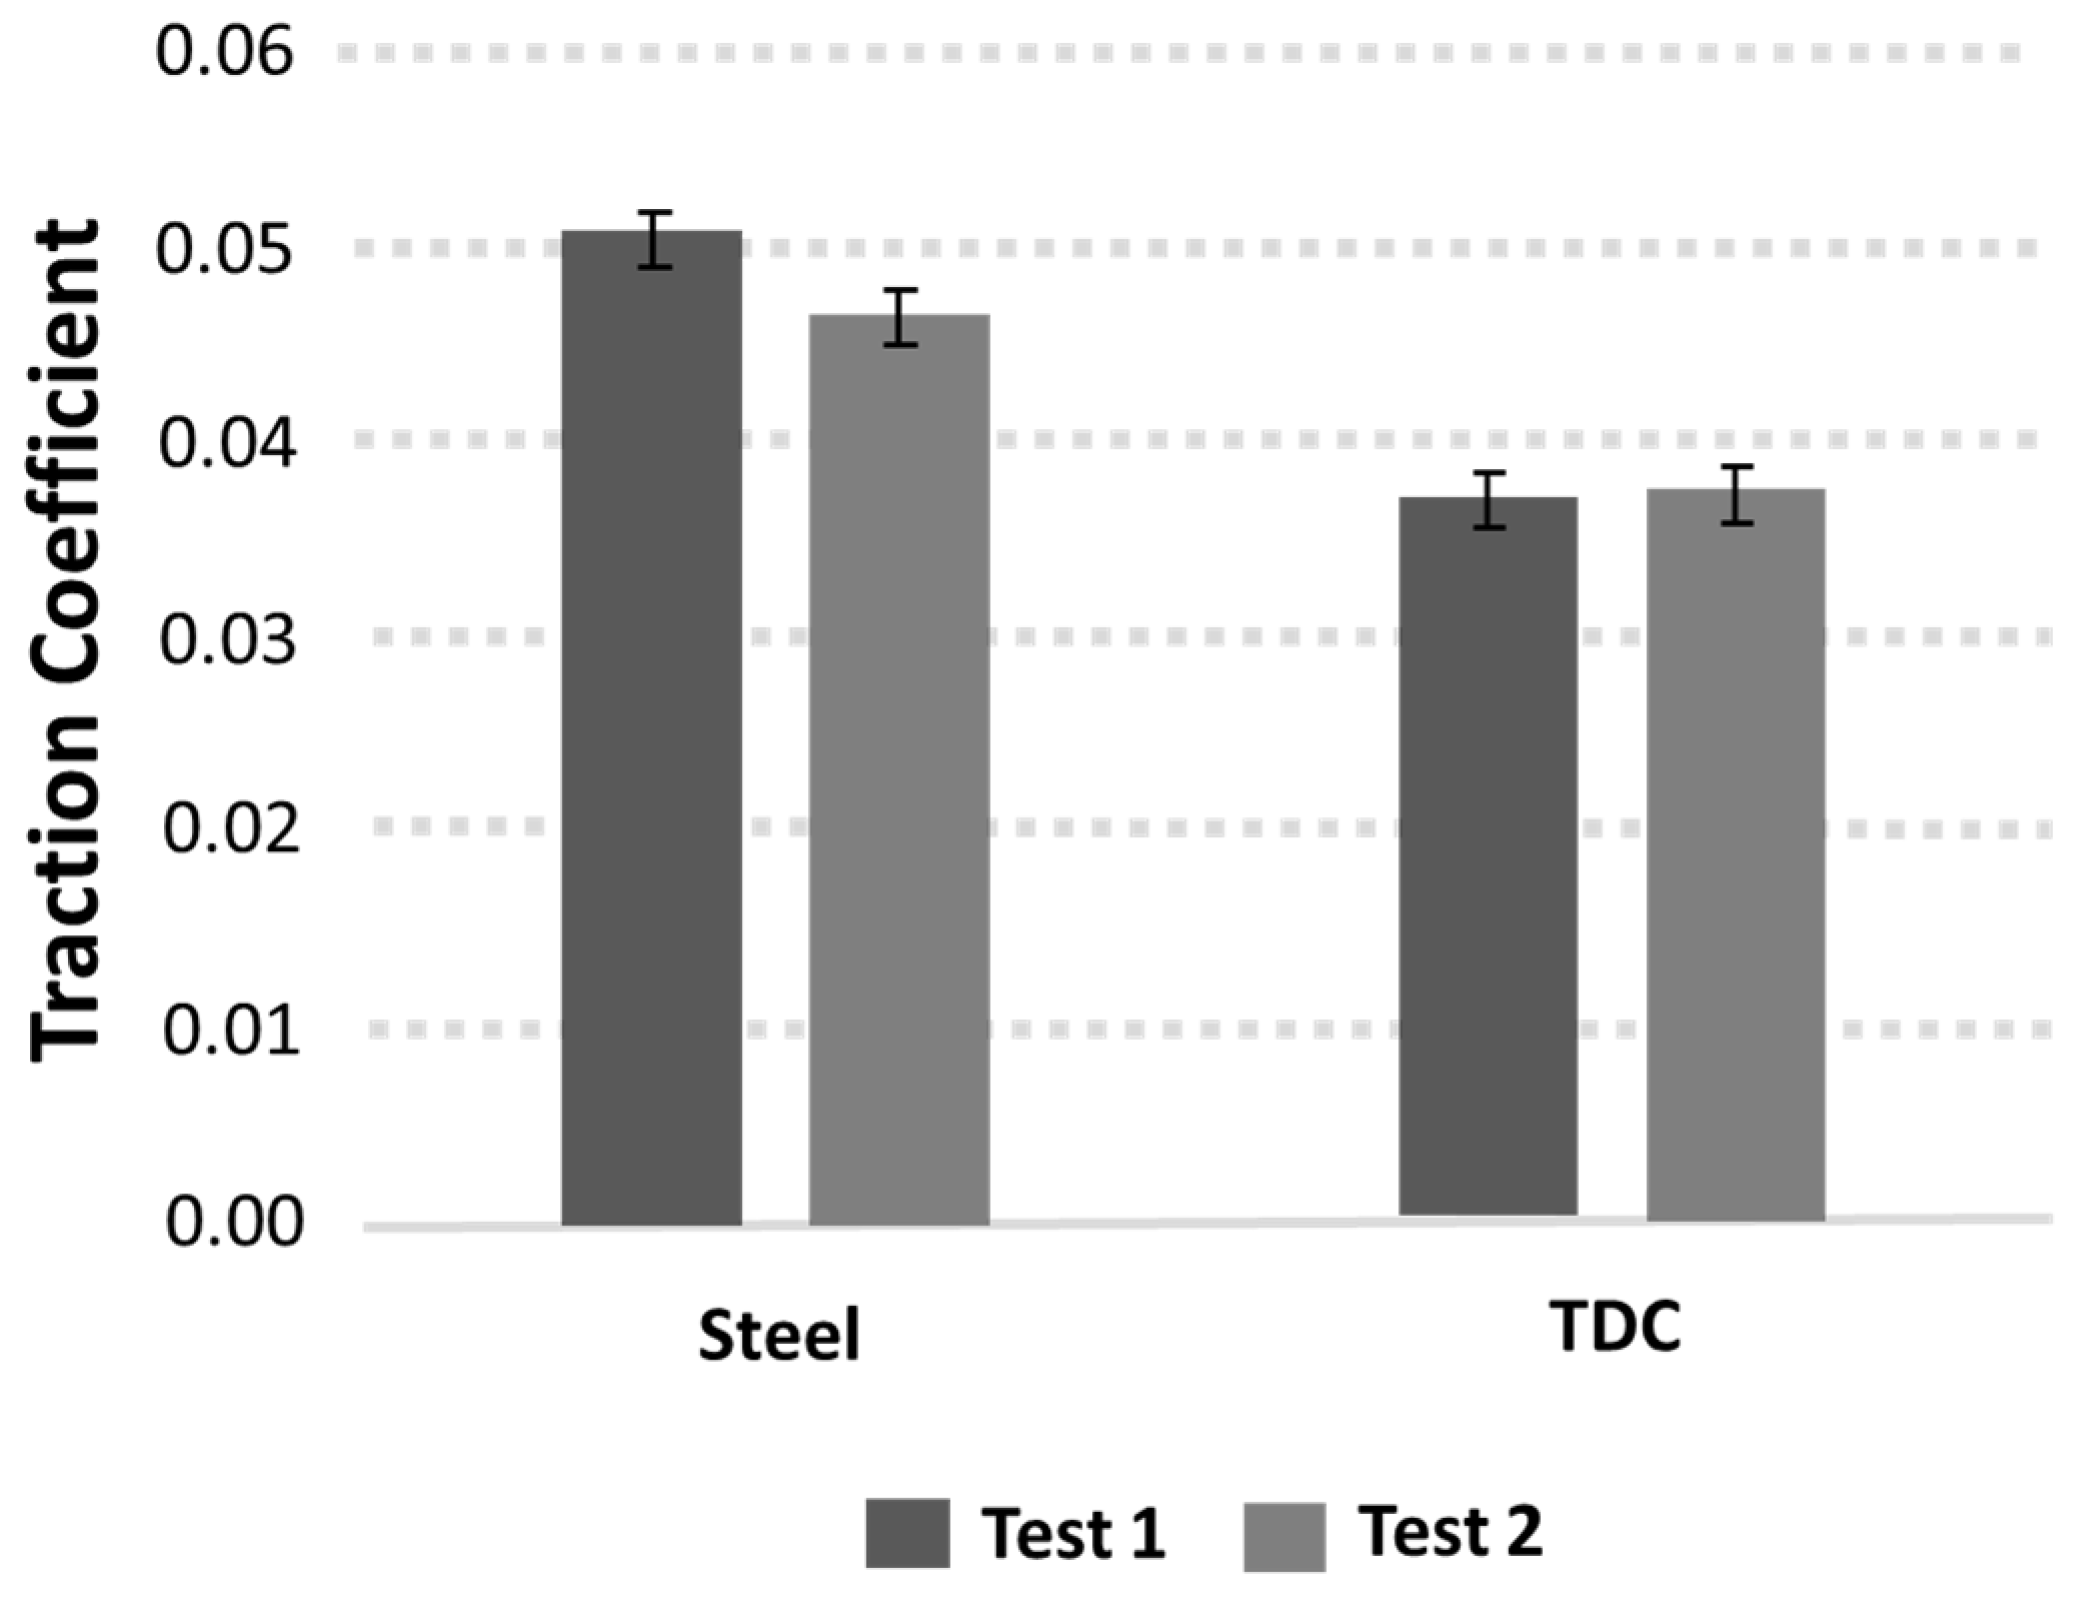
Figure 13 represents the mean traction coefficient during the WAM ball-on-disk tests. During the WAM measurement, the traction force is continuously measured during the whole 70 h experiment length; however, for reasons of clarity, the average traction coefficients of the last 5 h phase in the mixed lubrication experiment (λ = 0.3) are presented.
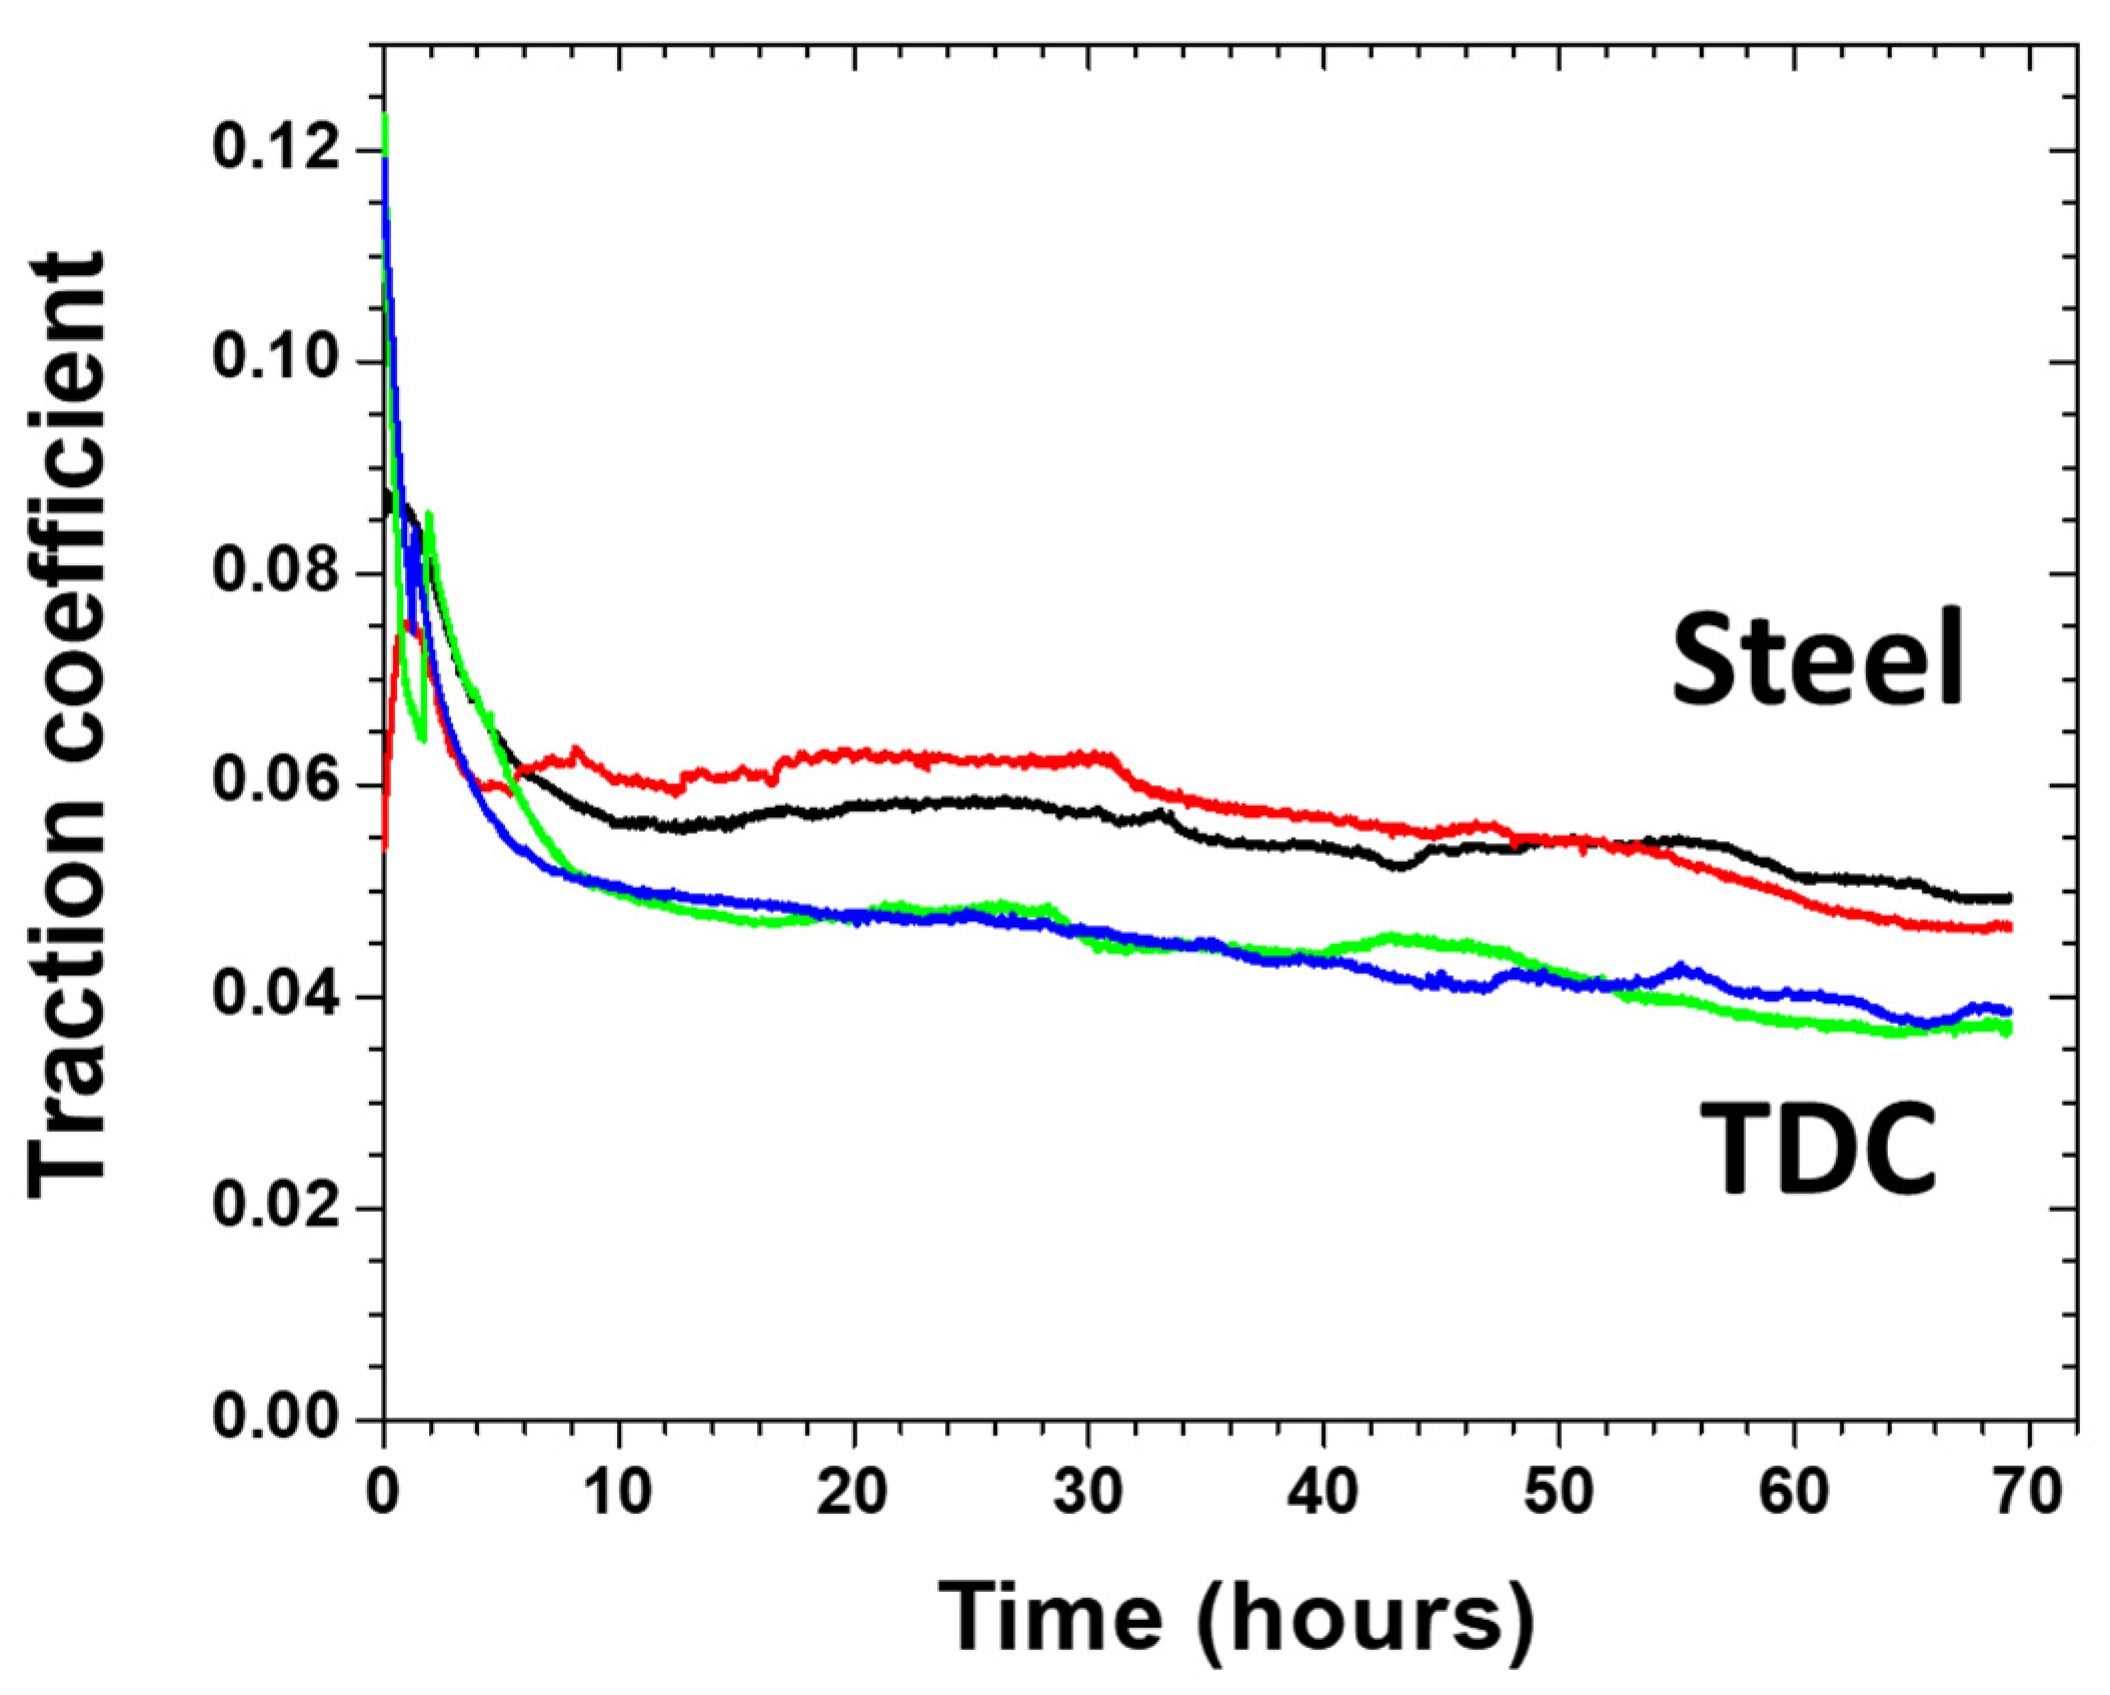
Figure 14 illustrates the typical evolution of friction during the rolling/sliding test. We can observe that after a run-in of about 5 h, the TDC–TDC coating contact presents consistently at least a 20% lower friction coefficient than the steel–steel pair.
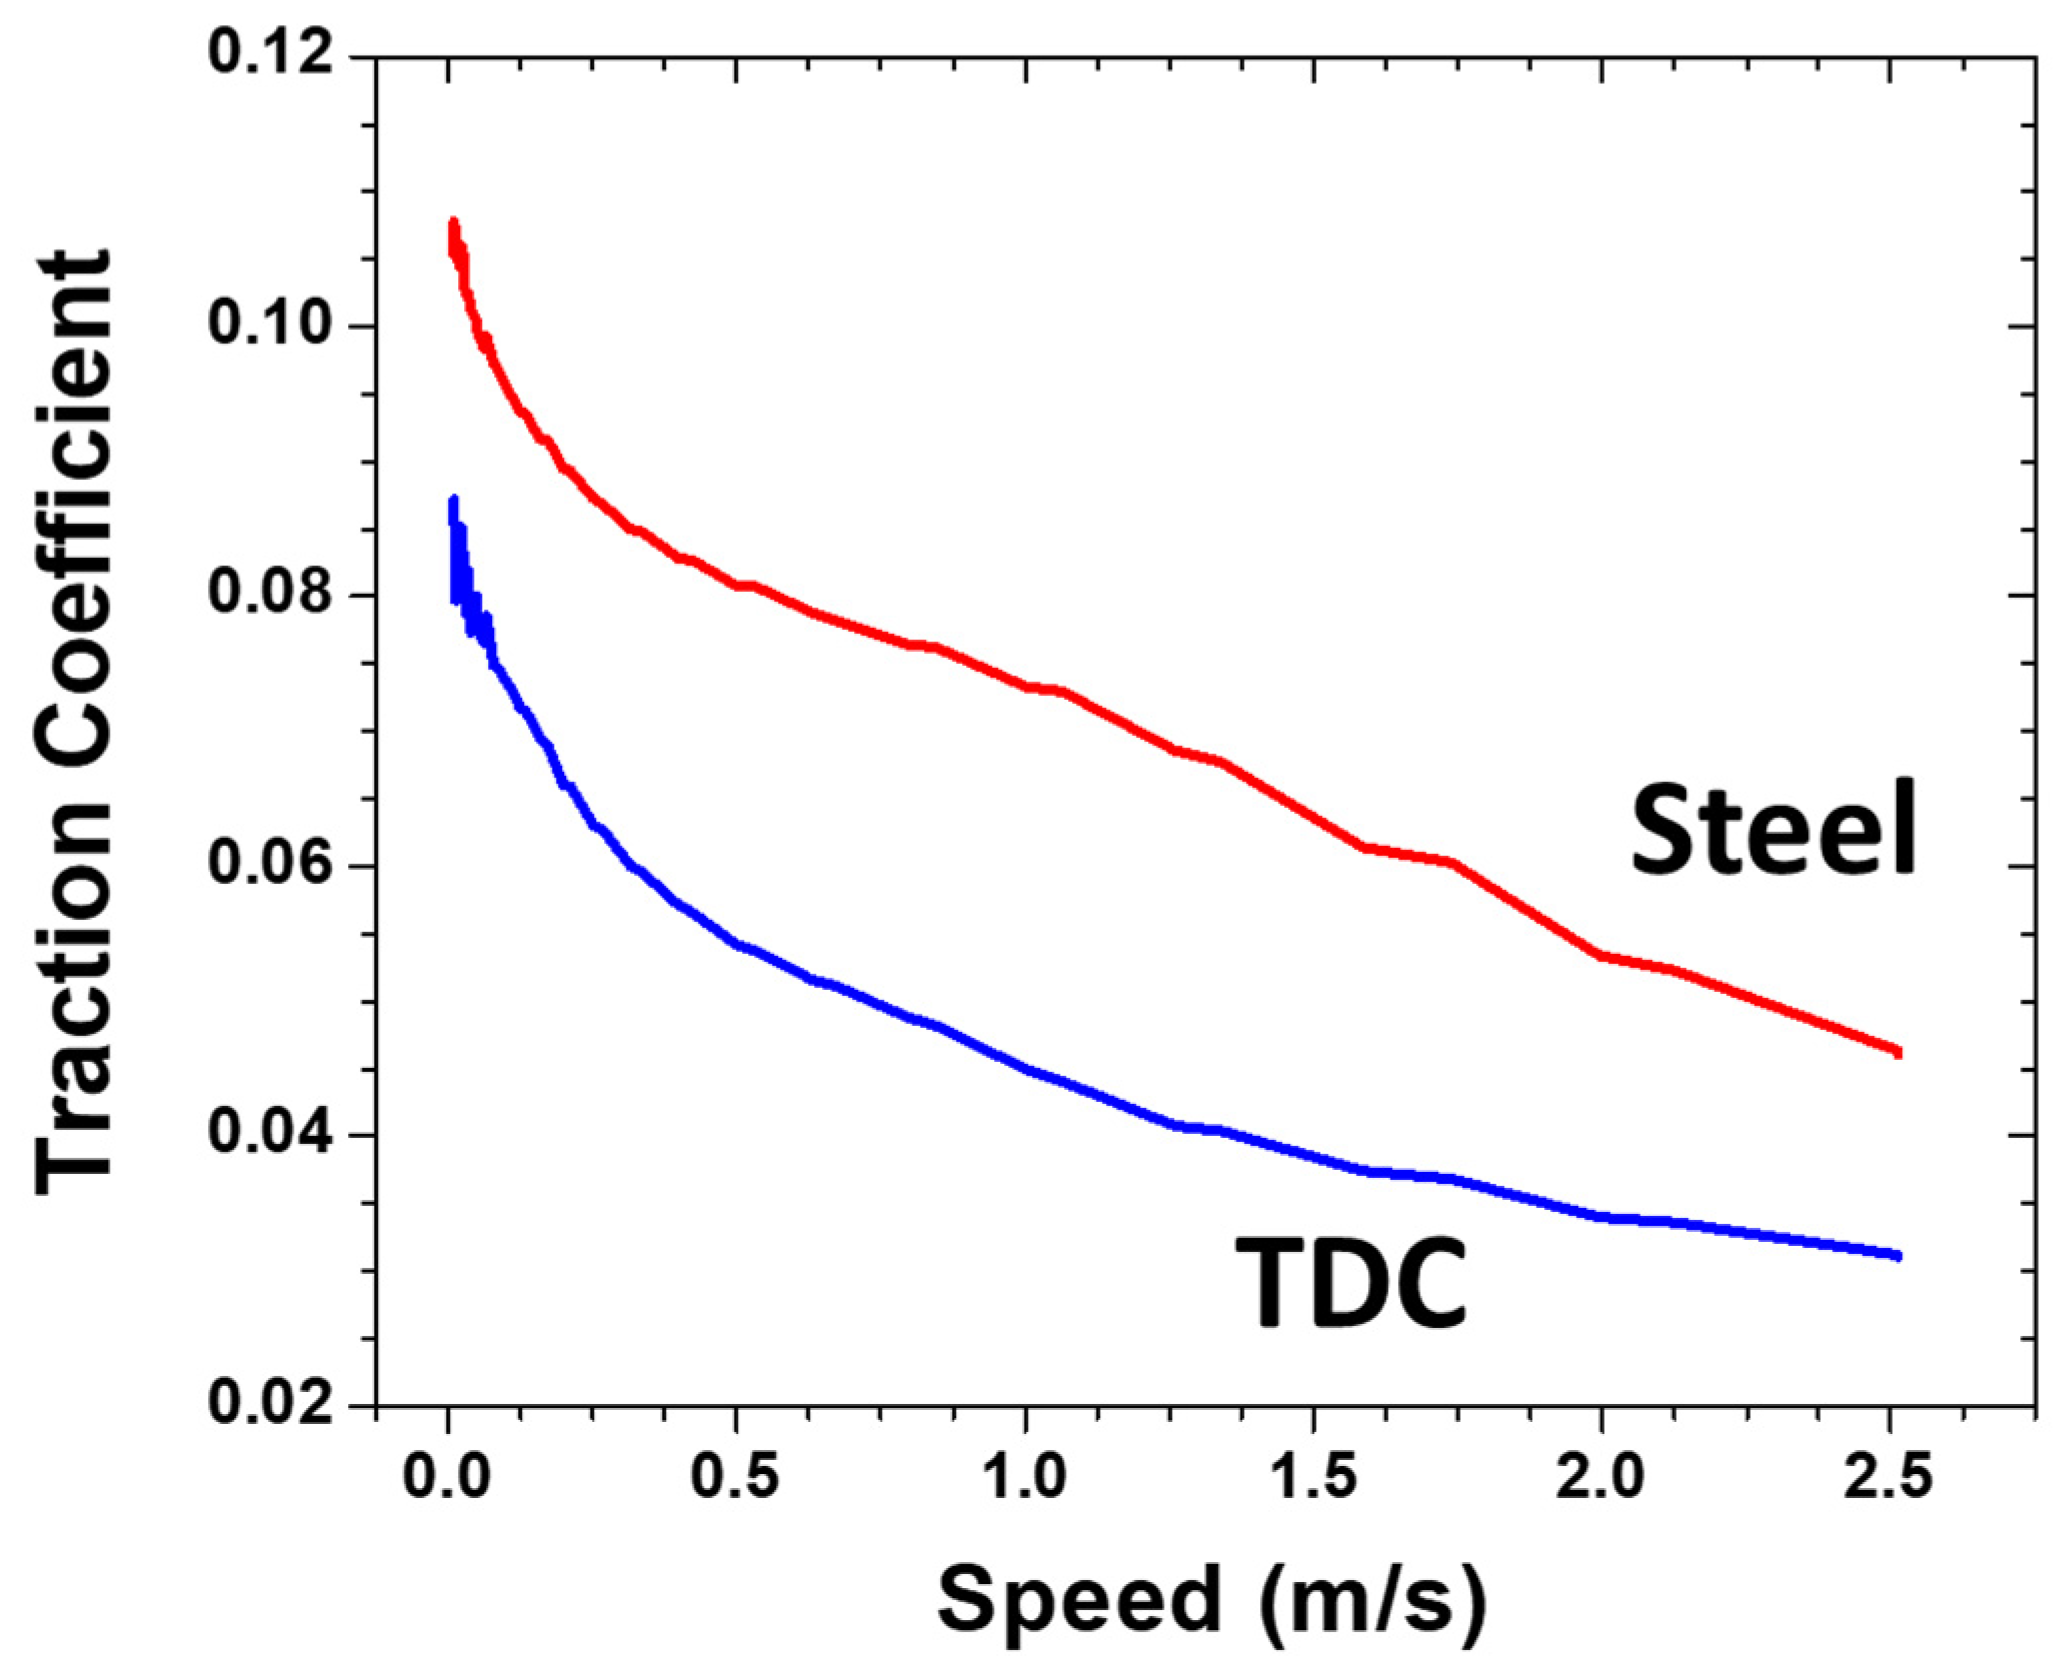
The Stribeck curves shown in Figure 15 compare the friction versus the lubricant entrainment speed. We can observe that both curves have the classical non-linear function, demonstrating again that the TDC coatings have a lower traction coefficient for all tested speeds.
Figure 16 shows the traction coefficient at different slide-to-roll ratios between −15% and +15%. For all values, TDC has lower friction values, and it looks like the difference increases with the increase in SRR.
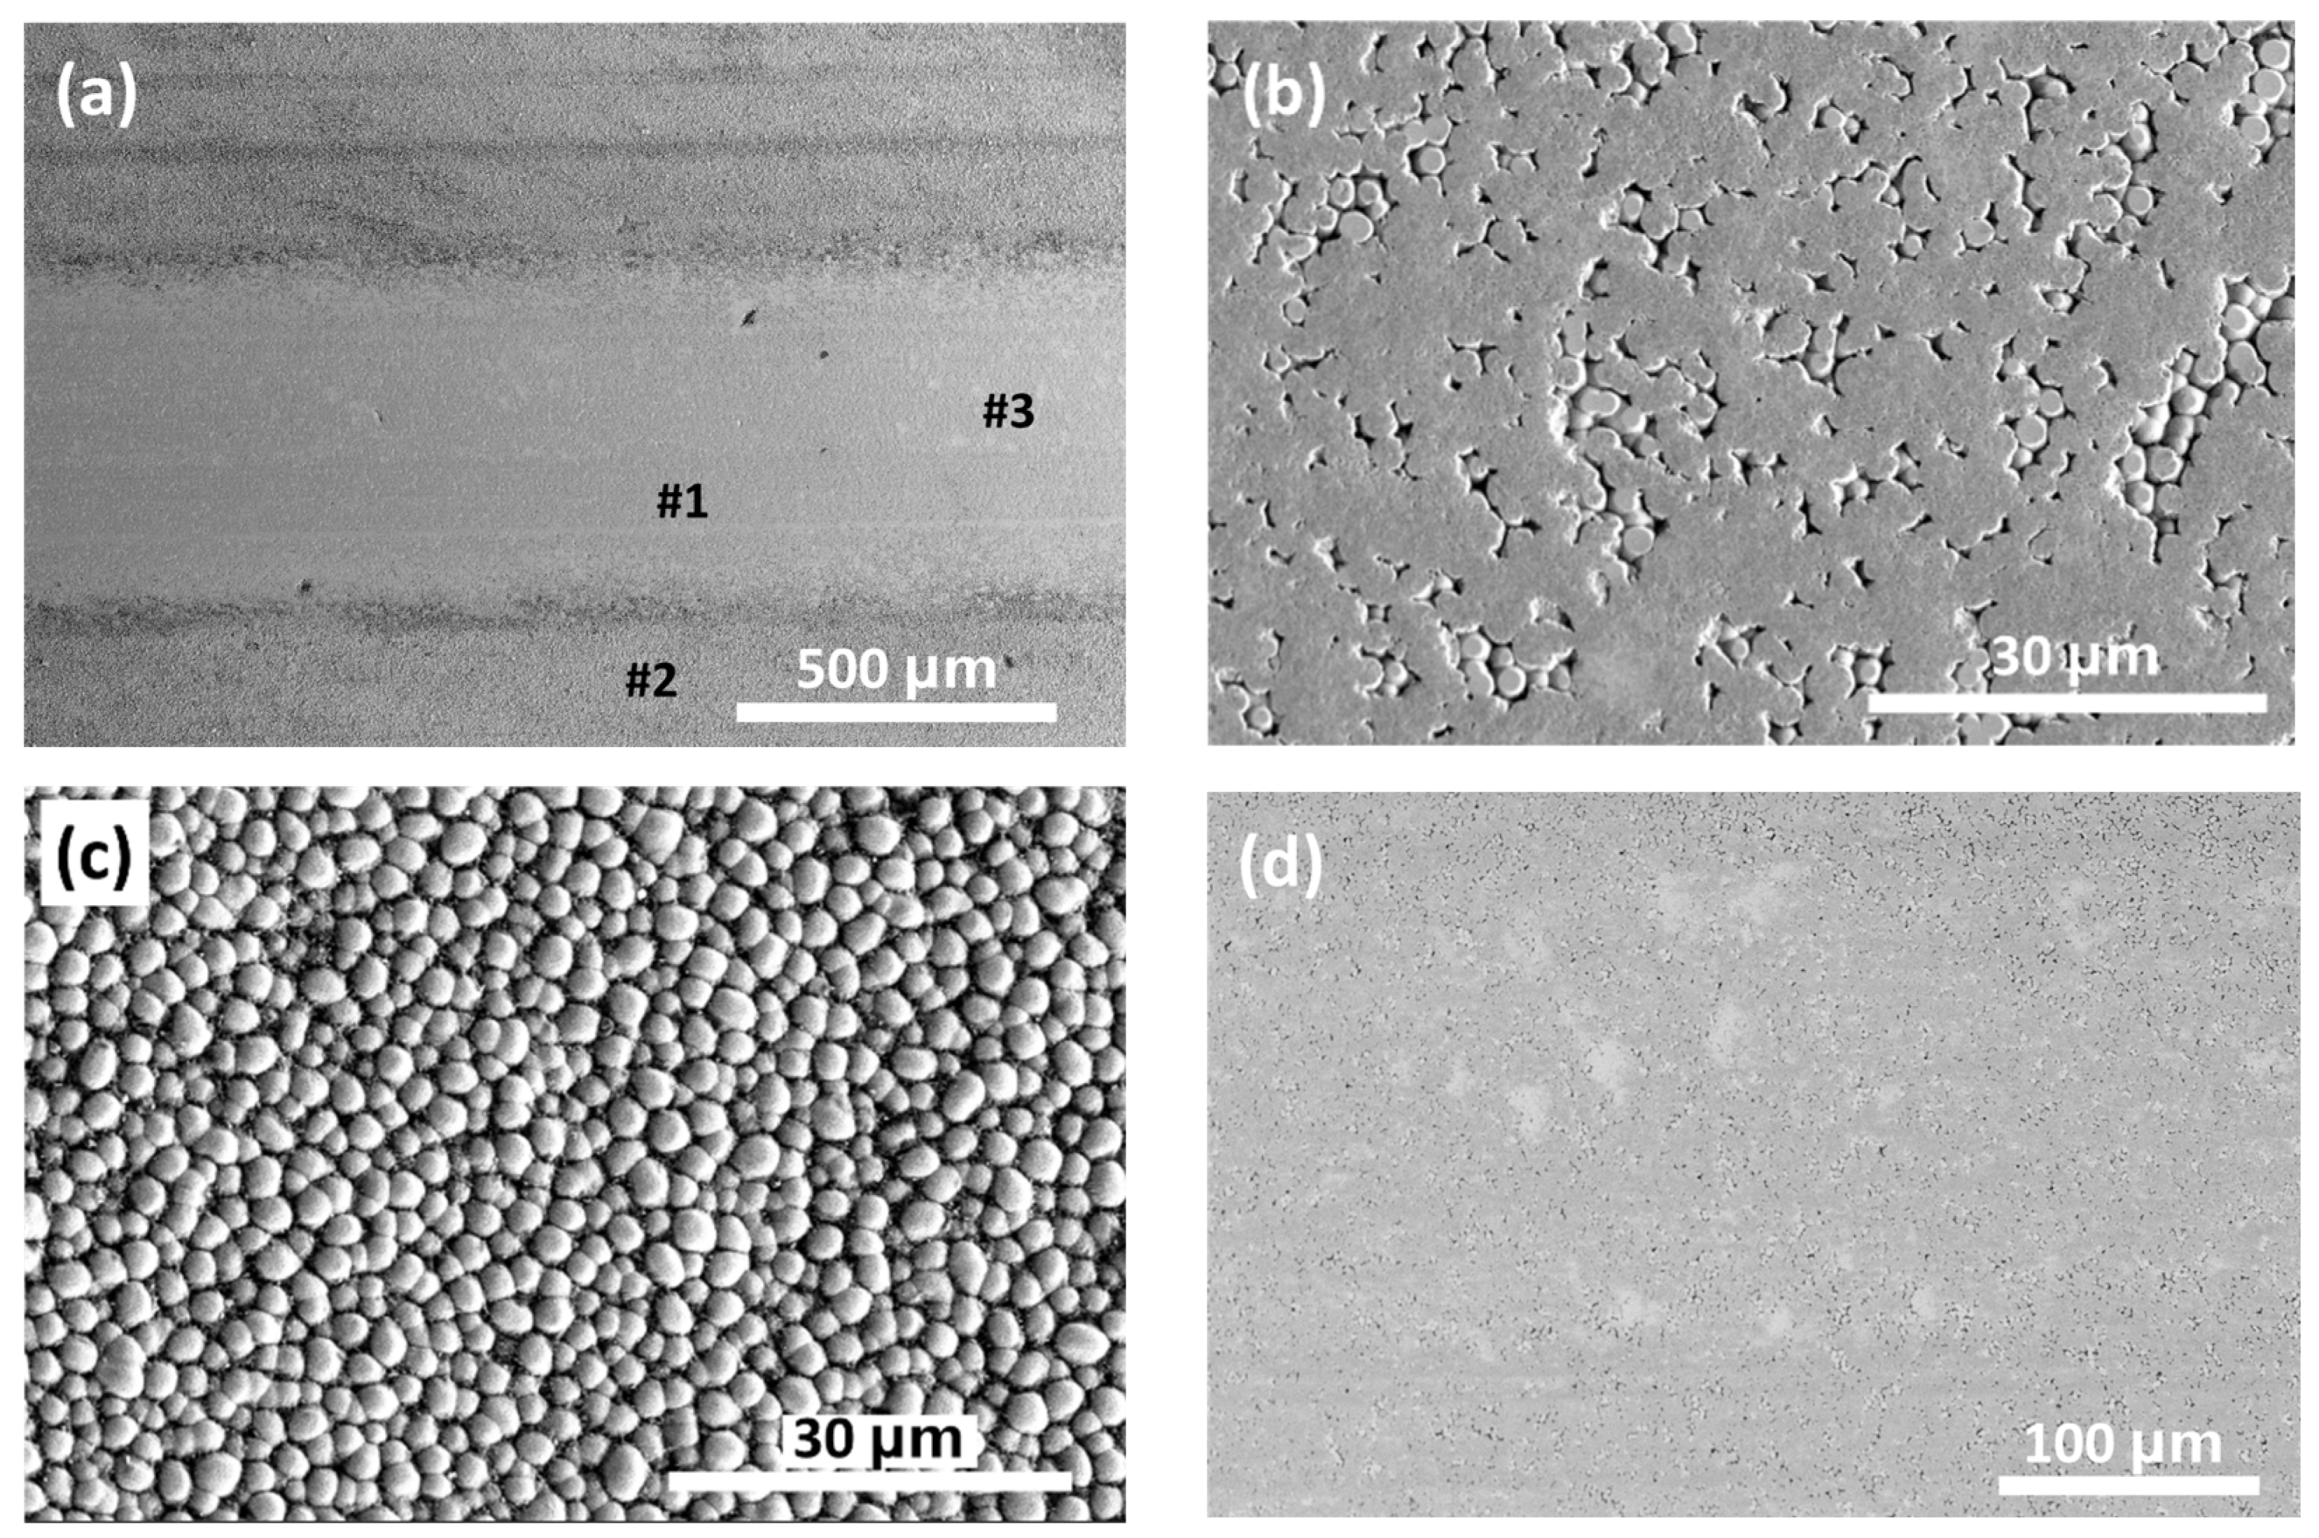
In order to better understand the improved frictional behavior of the TDC coatings, we have studied the morphology of the TDC wear tracks. Figure 17a displays the BSE SEM image of a wear track, ~550 µm wide, at the TDC coated ball measured after the 70-h WAM experiments. Figure 17b corresponds to the surface in area #1, which is at the center of the wear track. We can observe the presence of the apparently plastically deformed top of the nodules, while it is still possible to observe some deep gaps at nodule boundaries. Figure 17b illustrates the morphology of the TDC coating outside the wear track (position #2 in Figure 17a), which is like the morphology shown in Figure 3. We have also identified in area #3 at Figure 17a) the existence of some Cr transfer material (Figure 17d, which was highlighted using SE-SEM). Furthermore, the measurement of the wear track by light interferometry reveals a track depth of 0.22 ± 0.02 µm, which is much lower than the wear track depth of 0.6 ± 0.1 µm obtained in the WAM experiment when using the uncoated steel ball and disk. We should also highlight that no coating adhesion failures were observed after the tests.
No data have been published regarding TDC friction coefficient and wear in rolling-sliding contacts. Our test series demonstrates that in all studied cases (time duration, entrapment speed, and SRR) the TDC coatings in rolling–sliding contacts always have lower friction and present lower wear than the baseline steel–steel contact. The nodular texture promotes the retention of lubricant and also promotes a decrease in the surface contact, which in turn lowers friction and wear.

4. Conclusions

We studied for first time the microstructural, nanomechanical, and tribological properties of Thin Dense Chromium (TDC) coatings.
SEM and AFM analyses of the TDC coating reveal a semi-uniform, nodular surface morphology with an average diameter of 3.6 ± 0.5 µm that is free from micro-cracks or surface defects. The cross-sectional SEM confirms a consistent chromium layer of approximately 5 µm thickness that is devoid of internal microstructural cracks. AFM topography mapping over a 10 × 10 µm2 area indicates nodular features with variable heights and distinct gaps at the boundaries, resulting in an average surface roughness Ra = 204 ± 40 nm.
The nanomechanical study has shown the difficulties introduced by the micronodular microstructure when trying to indent in a direction perpendicular to the coated surface. A careful analysis of the coating cross-section has revealed for the first time the hardness (HIT = 14.9 ± 0.5 GPa) and the reduced elastic modulus (Er = 216.8 ± 3.9 GPa) of TDC coatings. These values contrast with the lower values measured for standard ASTM 52100 hardened bearing steel.
Tribological characterization of TDC coatings in sliding and rolling–sliding conditions has shown that the friction coefficient and wear of the TDC–TDC contact are consistently lower than the ones for the steel–steel pair measured under the same tribological conditions. Furthermore, scratch adhesion characterization has shown no adhesion failures in the range 0–100 N. As well, no adhesion failures have been found after the sliding and rolling/sliding tests.
The better performance of the TDC coatings can be related to the presence of the nodular microstructure. By minimizing the surface area that comes into contact with other surfaces, and by trapping lubricant in the nodule borders, the nodular structure promotes a decrease in friction and wear. The tribological results obtained in various contact conditions demonstrate the benefits of applying TDC coatings to reduce the friction and wear in rolling bearings.

Author Contributions

Conceptualization: E.B., A.J. and E.R.; methodology: E.B. and A.J.; validation: E.B., A.J., E.R., R.M. and J.M.C.M.; formal analysis: E.B.; investigation: E.B., A.J., E.R. and R.M.; project administration: A.J.; resources: E.B.; data curation: E.B.; writing—original draft preparation: E.B.; writing—review and editing: E.B., A.J., E.R., R.M. and J.M.C.M. All authors have read and agreed to the published version of the manuscript.

Funding

This research was carried out under project number T23011 in the framework of the Research Program of the Materials innovation institute (M2i) (www.m2i.nl, 16 December 2024) and was funded by Holland High Tech|TKI HSTM via the PPS allowance scheme for public–private partnerships.

Institutional Review Board Statement

Not applicable.

Informed Consent Statement

Not applicable.

Data Availability Statement

Data available under reasonable request.

Conflicts of Interest

The authors declare no conflicts of interest.

References

  1. Bussy, J.D. Revêtements de Chrome. France Patent 3564, 1848. [Google Scholar]
  2. Sargent, G.J. Electrolytic Chromiun. Trans. Electrochem. Soc. 1920, 37, 479–496. [Google Scholar]
  3. Dennis, J.K.; Such, T.E. Chapter 1—Introduction and Historical Review. In Nickel and Chromiun Plating; Woodhead Publishing: Cambridge, UK, 1993; pp. 1–12. [Google Scholar]
  4. Nagrale, P. Global Chrome Plating Market Overview; Market Research Future: New York, NY, USA, 2024. [Google Scholar]
  5. Bejbl, J. Thin, Dense, Chromium Coatings Protects Parts. Adv. Mater. Process. 2002, 6, 1–2. [Google Scholar]
  6. Waskiewicz, W.P. Extending Bearing Life in Off-Highway Equipment. In International Off-Highway & Powerplant Congress & Exposition; Milwaukee: Brookfield, WI, USA, 1984. [Google Scholar]
  7. Maurer, R. Friction, wear, and corrosion control in rolling bearings through coatings and surface. J. Vac. Sci. Technol. A 1986, 4, 3002–3006. [Google Scholar] [CrossRef]
  8. Bamberger, E.N.; Averbach, B.L.; Pearson, P.K. Improved Fatigue Life Bearing Development—Report AFWAL-TR-89-2012; Wright Research and Development Center: Wright Patterson AFB, OH, USA, 1989. [Google Scholar]
  9. Hirvonen, J.K. Ion Beam Assisted Thin Film Deposition: Fundamentals and Applications of IBAD Processing. In Proceedings of the Nato Advance Study on Materials and Processes for Surface and Interface Engineering, Chateau de Bonas, Gers, France, 18–29 July 1995. [Google Scholar]
  10. Pearson, P.K. The history and future of aircraft turbine engine bearing steels. In Bearing Steels: Into the 21st Century; ASTM International: West Conshohocken, PA, USA, 1998; pp. 335–353. [Google Scholar] [CrossRef]
  11. Beswick, J.; Voskamp, A.; Sanden, J.v.D.; Verburgh, M.; Horton, S. Bearing Material/Treatment Developments at the SKF Engineering and Research Centre. In Creative Use of Bearing Steels, ASTM STP 1195; Hoo, J.J.C., Ed.; American Society for Testing and Materials: West Conshohocken, PA, USA, 1993; pp. 222–234. [Google Scholar]
  12. Armoloy Corporation. Nodular Thin Dense Chrome. Available online: https://armoloy.com/coatings/thin-dense-chrome/ (accessed on 21 October 2024).
  13. U. S. Chrome. Thin Dense Chrome. Available online: https://www.uschrome.com/thin-dense-chrome/ (accessed on 21 October 2024).
  14. Duro-Chrome. Thin Dense Hard Chrome. Available online: https://duro-chrome.com/thin-dense-hard-chrome/ (accessed on 21 October 2024).
  15. ATC Technology Coatings. Thin Dense Chromiun Technology. Available online: https://www.atc-armoloy.com/en/general-information/chromium.html (accessed on 21 October 2024).
  16. Pinedo, B.; López, G.A.; Zubizarreta, C.; Mendizabal, L.; Fraile, S.; Ionescu, L. Tribological Investigation on WC/C Coatings Applied on Bearings Subjected to Fretting Wear. Tribol. Lett. 2024, 72, 87. [Google Scholar] [CrossRef]
  17. The Armoloy Corporation. The Electrolizing Thin, Dense, Chromium Process. In Coatings Technology Handbook; CRC Press: Boca Raton, FL, USA, 2005; p. 28. [Google Scholar]
  18. Broitman, E. Indentation Hardness Measurements at Macro-, Micro-, and Nanoscale: A Critical Overview. Tribol. Lett. 2017, 65, 23. [Google Scholar] [CrossRef]
  19. ASTM B578-21; Standard Test Method for Microindentation Hardness of Electroplated Coatings. ASTM International: West Conshohocken, PA, USA, 2021.
  20. Broitman, E. Coatings to Improve Bearing Perfomance. Evolution 2022, 1–7. Available online: https://evolution.skf.com/coatings-to-improve-bearing-performance/ (accessed on 21 October 2024).
  21. SKF Coatings Catalogue. Available online: https://cdn.skfmediahub.skf.com/api/public/0901d19680a4e17f/pdf_preview_medium/0901d19680a4e17f_pdf_preview_medium.pdf (accessed on 21 October 2024).
  22. SKF. Kaydon Endurakote®—Plated Bearings. Kaydon Bearing Solutions—SKF. Available online: https://www.kaydonbearings.com/Endurakote_bearings.htm&r=1 (accessed on 21 October 2024).
  23. Oliver, W.; Pharr, G. An improved technique for determining hardness and elastic modulus using load and displacement sensing indentation experiments. J. Mater. Res. 1992, 7, 1564–1583. [Google Scholar] [CrossRef]
  24. Bull, S.J.; Berasetegui, E.G. An overview of the potential of quantitative coating adhesion measurement by scratch testing. Tribol. Int. 2006, 39, 99–114. [Google Scholar] [CrossRef]
  25. Broitman, E.; Ruellan, A.; Meeuwenoord, R.; Nijboer, D.; Brizme, V. Comparison of Various Conversion Layers for Improved Friction Performance of Railway Wheel-End Bearings. Coatings 2023, 13, 1980. [Google Scholar] [CrossRef]
  26. ISO-14577-1; Metallic Materials—Instrumented Indentation Test for Hardness and Materials Parameters—Part 1: Test Method. International Organization for Standardization: Geneve, Switzerland, 2015.
  27. Fischer-Cripps, A.C. Nanoindentation; Springer: New York, NY, USA, 2011. [Google Scholar]
  28. Dezzani, M.M.; Pearson, P.K. Hybrid Ceramic Bearings for Difficult Applications. J. Eng. Gas Turbines Power 1996, 118, 449–452. [Google Scholar] [CrossRef]
  29. Mohn, J.H.; Munson, H.E.; Poole, W.E.; Hodgens, H.M., II. Improvement of the Corrosion Resistance of Turbine Engine Bearings (Report AFWAL-TR-84-2014); AF Wright Aeronautical Laboratories: Wright-Patterson, OH, USA, 1984. [Google Scholar]
  30. AMS2438F; Plating, Chromium Thin, Hard, Dense Deposit. Society of Automotive Engineers: Warrendale, PA, USA, 2021.
  31. Jones, A.; Sugawara, S.; Enloe, J. Adhesion Testing of Hard Chromium Electrodeposits. In AESF SUR/FIN; American Electroplaters & Surface Finishers Society: Chicago, IL, USA, 2000. [Google Scholar]
  32. Stallard, J.; Poulat, S.; Teer, D.G. The study of the adhesion of a TiN coating on steel and titanium alloy substrates using a multi-mode scratch tester. Tribol. Int. 2006, 39, 159–166. [Google Scholar] [CrossRef]
  33. Broitman, E.; Czigány, Z.; Greczynski, G.; Böhlmark, J.; Cremer, R.; Hultman, L. Industrial-scale deposition of highly adherent CNx films on steel substrates. Surf. Coat. Technol. 2010, 204, 3349–3357. [Google Scholar] [CrossRef]
  34. Armoloy of Illinois. Thin Dense Chrome Plating Performance Characteristics. Available online: https://armoloy-il.com/armoloy-tdc-thin-dense-chrome/ (accessed on 27 October 2024).
  35. ATC. Thin, Dense, Chromium Coating Technology. ATC Technology Coatings GMBH & CO. Available online: https://www.solidcomponents.com/files/company/SCCNS20DW/companyfiles/doc/atc-armoloy-general-information_engelsk_version.pdf (accessed on 27 October 2024).
  36. Braza, J.F. Sliding wear evaluation of various coating processes on AISI 52100 and M 50 steels. Mater. Sci. Technol. 1992, 8, 582–588. [Google Scholar] [CrossRef]
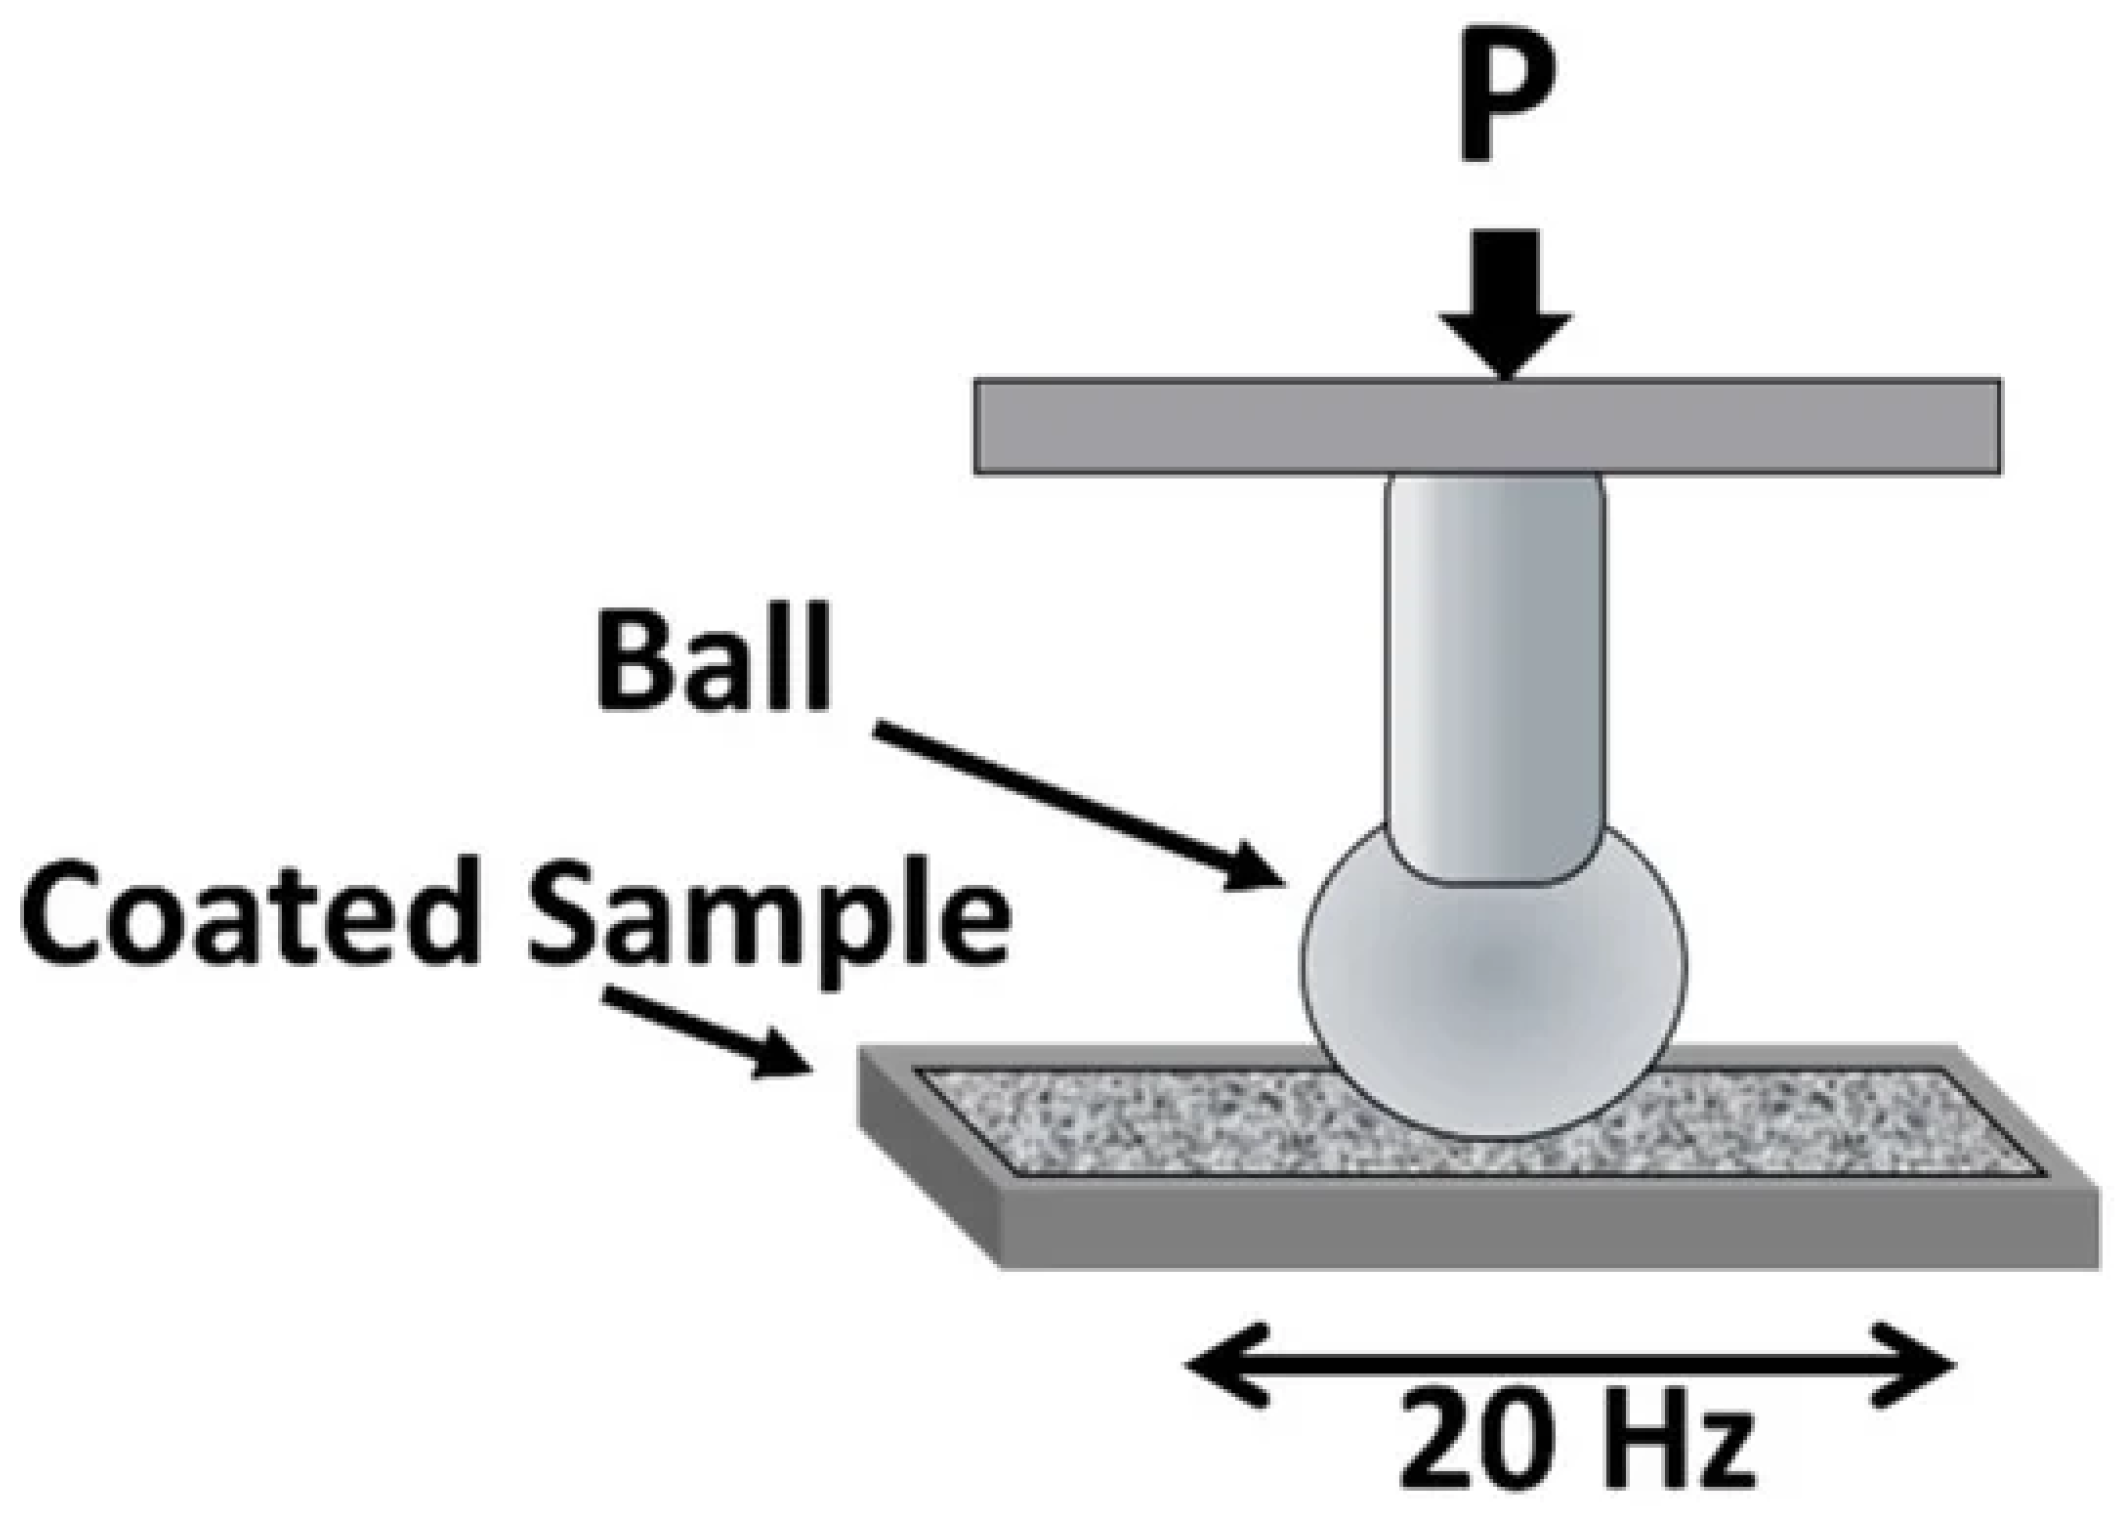
Figure 1. Fretting Test (adapted from [25]).
Coatings 14 01597 g001
Figure 2. Schematic of a WAM rig showing the ball-on-disk setup with independent regulation of ball speed Ub and disk speed Ud. (adapted from [25]).
Coatings 14 01597 g002
Figure 3. (a,b) Secondary and backscatter electron (SE and BSE) images of the TDC coating top surface, (c) SEM high-magnification image of the TDC nodular surface texture, and (d) SEM cross-sectional image of TDC coating.
Coatings 14 01597 g003
Figure 4. (a) Topography and (b) amplitude signals of the TDC coating top surface and (c) TDC topography histogram extracted from (a).
Coatings 14 01597 g004
Figure 5. Quasi-static partial unload test schedule consisting of 20 cycles and a maximum load: (a) Lmax = 10 mN and (b) Lmax = 1 N.
Coatings 14 01597 g005
Figure 6. Typical load–displacement curves obtained when indenting a TDC coated steel substrate with partial unload tests at (a) Lmax = 10 mN and (b) Lmax = 1 N.
Coatings 14 01597 g006
Figure 7. Examples of hardness HIT vs. penetration depth for a TDC coating. In (a), it is possible to distinguish the ISE and Er for the coating regions. In (b), the ISE is more dominant and the Er for the coating cannot be determined. The horizontal dashed line represents the hardness of the steel substrate.
Coatings 14 01597 g007
Figure 8. Examples of reduced elastic modulus Er vs. penetration depth for a TDC coating. In (a), it is possible to distinguish the ISE and Er for the coating regions. In (b), the ISE is more dominant and the Er for the coating cannot be determined. The horizontal dashed line represent the elastic modulus of the steel substrate.
Coatings 14 01597 g008
Figure 9. SPM images of the TDC cross-section layer made with the nanoindenter Berkovich tip: (a) topography and (b) gradient. The size of the scanned area is 10 × 10 µm. The oblique lines indicate the TDC boundaries.
Coatings 14 01597 g009
Figure 10. (a) Hardness and (b) reduced elastic modulus vs. penetration depth for the TDC coatings measured in the cross-section area. Each set of color points represents a different experiment. The dashed black line represents the hardness and elastic modulus of the steel in (a) and (b), respectively.
Coatings 14 01597 g010
Figure 11. Optical micrographs of the scratches at (a) the beginning (low load); (b) at 50 N load, and (c) at the end (100 N) of the test. The arrows indicate the scratch direction. (d) Friction coefficient of the diamond tip against the TDC coating as a function of the scratch distance.
Coatings 14 01597 g011
Figure 12. Mean friction coefficient in the reciprocating sliding test measured at 1.25 GPa contact pressure during the last 22,000 cycles after the run-in period. Average standard deviation was 0.005.
Coatings 14 01597 g012
Figure 13. WAM traction coefficients. The reported values are the average traction coefficient during the last 5 h of the 70 h duration step.
Coatings 14 01597 g013
Figure 14. WAM rolling/sliding friction curves vs. time for the two steel (black and red) and two TDC (blue and green) samples. The traction coefficients for Figure 12 are extracted from this data.
Coatings 14 01597 g014
Figure 15. Stribeck curves for steel–steel and TDC–TDC contacts.
Coatings 14 01597 g015
Figure 16. Traction coefficient vs. slide-to-roll ratio (SRR) for steel–steel and TDC–TDC contacts.
Coatings 14 01597 g016
Figure 17. (a) BSE image of the wear track for a coated TDC ball and corresponding magnified views at: (b) area #1 (BSE); (c) area #2 (BSE); (d): area #3 (SE).
Coatings 14 01597 g017
Table 1. Fretting Wear Rig test conditions (adapted from [25]).
ParameterValues
Ball Diameter12.7 mm
Initial Hertzian Contact Pressure1.25 GPa
Reciprocal stroke100 µm
Frequency 20 Hz
TemperatureRoom Temperature
Number of Cycles72,000
Total Distance7.2 m
Test Duration1 h
LubricantGrease (PAO base oil ISO VG100)
Table 2. Test conditions for the ball-on-disk WAM tests.
SetupBall-on-Disk
Initial Contact Pressure PH1.5 GPa
Entrainment Speed0.8 m/s (Stribeck: 0 to 2.5 m/s)
SRR (slide-to-rolling ratio)5%; −15% to +15%
LubricantMineral oil of 32 cSt at 100 °C with no EP/AW additives
Temperature 100 °C
Lubrication Parameter λλ = 0.3
Test duration70 h
Table 3. Optical micrography, surface topography, and profile transverse to the wear mark after the re-ciprocating sliding test at 1.25 GPa for the test 1 samples in Figure 11.
MicrographProfile
SteelCoatings 14 01597 i001Coatings 14 01597 i002
TDCCoatings 14 01597 i003Coatings 14 01597 i004
Disclaimer/Publisher’s Note: The statements, opinions and data contained in all publications are solely those of the individual author(s) and contributor(s) and not of MDPI and/or the editor(s). MDPI and/or the editor(s) disclaim responsibility for any injury to people or property resulting from any ideas, methods, instructions or products referred to in the content.