Article

The Influence of the Plasma Electrolytic Oxidation Parameters of the Mg-AZ31B Alloy on the Micromechanical and Sclerometric Properties of Oxide Coatings

Institute of Materials Engineering, Faculty of Science and Technology, University of Silesia in Katowice, 75 Pułku Piechoty 1a, 41-500 Chorzów, Poland
*
Authors to whom correspondence should be addressed.
Coatings 2024, 14(11), 1446; https://doi.org/10.3390/coatings14111446
Submission received: 27 October 2024 / Revised: 8 November 2024 / Accepted: 11 November 2024 / Published: 13 November 2024

Abstract

:
This manuscript presents the influence of manufacturing process parameters (peak current density, frequency, process time) on the micromechanical and sclerometric properties of oxide coatings. These parameters were selected based on Hartley’s experimental design, considering three variables at three levels. The coatings were produced on the AZ31B magnesium alloy using the plasma electrolytic oxidation (PEO) method. A trapezoidal voltage waveform and an alkaline, two-component electrolyte were used during the process. The micromechanical and sclerometric properties were assessed by measuring the hardness (HIT) and Young’s modulus (EIT) and determining three critical loads: Lc1 (the critical load at which the first coating damage occurred—Hertz tensile cracks within the scratch), Lc2 (the critical load causing the first cohesive damage to the coating), and Lc3 (the load at which the coating was completely destroyed). Scratch tests were supplemented with profilographometric measurements, which were used to generate isometric images. To identify the relationship between micromechanical and sclerometric properties and the manufacturing parameters, statistical analysis was performed. Research has demonstrated that the plasma electrolytic oxidation (PEO) process improves the micromechanical and adhesive properties of oxide coatings on the AZ31B magnesium alloy. The key process parameters, including peak current density, frequency, and duration, are crucial in determining these enhanced properties.

1. Introduction

Magnesium (Mg) stands as the lightest structural metal, boasting a low density. It offers a superior specific strength and stiffness compared to both steel and aluminum (Al) alloys, outperforming engineering plastics significantly in these areas. With a higher strength-to-weight ratio and enhanced casting properties relative to Al and steel, Mg is highly advantageous for various applications [1,2,3]. Magnesium alloys, especially Mg-AZ31B, are increasingly valued in industries such as automotive, aerospace, and biomedical engineering due to their excellent strength-to-weight ratio, good thermal and electrical conductivity, and biocompatibility [4,5,6,7,8,9]. However, the relatively low surface hardness and wear resistance of these alloys, combined with their susceptibility to corrosion, limit their use in challenging environments. Addressing these shortcomings, particularly in terms of mechanical durability, is crucial for expanding the range of applications for Mg-AZ31B alloys. Plasma electrolytic oxidation (PEO) is a promising surface treatment technique that improves the mechanical and corrosion-resistant properties of magnesium alloys. The PEO process involves generating microdischarges on the alloy’s surface by applying a high voltage in an electrolytic solution, resulting in the formation of a thick, hard oxide coating with superior wear resistance, increased hardness, and improved adhesion to the substrate [10]. The mechanical properties of these oxide coatings, such as their hardness, resistance to abrasion, and load-bearing capacity, can be precisely controlled by adjusting the PEO processing parameters, including the electrolyte composition, current density, voltage, and treatment duration. While significant research has focused on the corrosion [11] and tribological properties [12] of PEO coatings, relatively little attention has been given to their micromechanical and sclerometric properties, which are crucial for applications exposed to mechanical stress. Scientists in their works [13,14,15] described that the hardness of the coating on the Vickers scale was 1169.63 HV and the HIT microhardness was 5.49 ± 0.51 GPa. Sclerometry, a technique used to assess a material’s resistance to scratching and indentation, is particularly valuable for evaluating the wear behavior of PEO coatings. Through sclerometric tests, it is possible to gain insights into key aspects such as the coating’s hardness, its resistance to crack formation, and its ability to withstand localized mechanical stresses. These properties are essential for real-world applications in industries like the automotive and aerospace industries, where surface durability plays a pivotal role in component performance [16]. One of the primary micromechanical characteristics affected by the PEO process is hardness, which determines the material’s capacity to resist deformation under localized pressure. Optimized PEO parameters, including current density and pulse frequency, can significantly enhance the surface hardness of the Mg-AZ31B alloy, improving its resistance to wear. Additionally, the elastic modulus and plasticity of PEO coatings are critical factors in determining the material’s response to mechanical loads [17]. These properties ensure that the coating can withstand stress without excessive deformation, which is particularly important in applications involving cyclic or repeated loads. Another essential aspect is the adhesion strength of the oxide coating to the substrate. Proper adhesion prevents the delamination of the coating during mechanical loading, thus maintaining the integrity of the surface under stress. The quality of this adhesion is closely tied to the specific PEO processing parameters, such as the applied current density, the chemical composition of the electrolyte, and the pulse frequency [18]. Moreover, PEO coatings can enhance the wear resistance of magnesium alloys, which is reflected in their ability to resist surface abrasion and scratch damage. This is particularly important in applications where components are exposed to sliding contact or other forms of mechanical wear [19,20,21]. In addition to improving hardness and wear resistance, PEO can reduce surface roughness, further enhancing the material’s sclerometric performance and preventing premature failure under operational loads [22,23,24,25]. By controlling the process parameters, it is possible to create oxide coatings that optimize these mechanical properties, ensuring that Mg-AZ31B alloys can perform reliably even in harsh conditions. In this study, statistical methods related to the design and analysis of experiments (DOE, design of experiments) were employed, which are useful for process optimization and identifying relationships between input variables and measured parameters. The DOE methodology has been described, among others, in studies [26,27]. To the best of the author’s knowledge, no similar research has yet been reported for magnesium-based substrates. The obtained results enable the precise identification of the key factors influencing the desired mechanical properties, depending on the applied conditions of the PEO (plasma electrolytic oxidation) process. This research aims to investigate how various PEO parameters affect the micromechanical and sclerometric properties of the Mg-AZ31B alloy, with a particular focus on the hardness, scratch resistance, and overall mechanical durability of the oxide coatings. By exploring these aspects, this research seeks to contribute to the broader understanding of how the PEO process can be optimized to improve the mechanical performance of Mg-AZ31B in a wide range of industrial applications.

2. Materials and Methods

2.1. Research Material

This research focused on oxide coatings produced on Mg-AZ31B alloy substrates. Specimens measuring 62.5 mm × 16 mm × 5 mm were cut from a 5 mm-thick rolled sheet, exposing the surfaces intended for oxidation. Before the oxidation process, the samples were prepared by grinding with 240-grit SiC water sandpaper on a polishing machine operating at 150 rpm. To degrease the samples, they were placed in an ultrasonic cleaner for 5 min, using isopropyl alcohol as the cleaning medium. The surface preparation was finalized with a thorough rinse in distilled water, followed by drying.
To create oxide coatings on the Mg-AZ31B alloy, the samples underwent plasma electrolytic oxidation using a trapezoidal voltage waveform generated by a KIKUSUI PCR2000WEA (Kikusui Electronics Corporation, Kikusui, Japan) power supply. A maximum voltage of 400 V was applied during the positive current cycles. In this setup, the magnesium alloy samples acted as the anode, while stainless steel served as the cathode. The oxidation process utilized a two-component electrolyte made of an aqueous solution of sodium metasilicate (Na2SiO3) at a concentration of 5 g/L and sodium hydroxide (NaOH) at 5 g/L. Both components play significant roles in the formation of the oxide layer. Sodium metasilicate serves as a source of silicon, which is essential for forming the oxide coating. Silicon plays a key role in stabilizing the structure of oxide coatings and affects their hardness and corrosion resistance. Additionally, sodium metasilicate promotes the formation of a network structure in the coatings, which enhances their mechanical properties. Sodium hydroxide, on the other hand, functions as an alkalizing agent and contributes to increasing the conductivity of the electrolyte. Its presence enhances the mobility of ions in the solution, which accelerates the deposition of oxides on the surface of the sample. Sodium hydroxide also supports the chemical reactions that lead to the formation of the oxide layer, which is crucial for the effectiveness of the PEO process. The electrolyte temperature was maintained at 303 ± 5 K using a cryostat and was stirred with a pump. Oxidation parameters—including peak current density, process time, and pulse frequency—were determined based on Hartley’s hypercube test plan, which involved three input variables at three different values (Table 1) [12]. The peak current densities applied were 10, 15, and 20 A/dm2; the pulse frequencies were set at 50, 75, and 100 Hz; and the process times were 30, 45, and 60 min.
A distinctive feature of the produced oxide coatings is their surface porosity, with pores of varying sizes. Figure 1a shows the surface morphology of a sample coating, while Figure 1b presents a cross-sectional view. The images were captured using scanning electron microscopy at a 500× magnification for the surface and 1.5k× for the cross-section.
Table 2 presents the instantaneous power values (P), which determine how much energy is consumed per unit of time (1 s) and how much energy is consumed in one hour (W) during the PEO process. Peak current density is one of the most important parameters that has a direct impact on the power consumed in the PEO process. A higher current density usually means a higher process efficiency, but also increases the power requirement. In sample B (current density jpeak = 20 A/dm2) and sample F (current density jpeak = 20 A/dm2), where the current density is high, the power P is also higher (63.79 W for sample B and 66.44 W for sample F), and the energy consumption W is 31.89 Wh and 49.83 Wh, respectively. The higher the current density, the more power is consumed by the process, which translates into higher energy consumption. The current density therefore has a strong influence on both of these values. On the other hand, samples A (current density jpeak = 10 A) and C (current density jpeak = 10 A/dm2) have lower power (e.g., 51.25 W for sample A), and the energy consumption is 51.25 Wh and 13.31 Wh, respectively. These values are significantly lower compared to the samples with higher current density. The frequency affects the dynamic electrochemical process and also the way in which energy is delivered to the material. A higher frequency can increase the number of cycles per unit time, which can lead to higher power consumption in the process. For sample D (frequency f = 100 Hz, time t = 60 min), the power is 34.74 W and the energy consumption is 34.74 Wh. Compared to sample A (frequency f = 50 Hz, time t = 60 min) with a lower frequency, the power is 51.25 W and the energy consumption is also 51.25 Wh, indicating different effects depending on this variable. Changing the frequency can therefore affect the power, but not always in a predictable way, because frequency is only one of the parameters influencing the process. Samples with a frequency of 50 Hz (samples A, B, G) tend to have higher energy consumption compared to samples with a higher frequency, such as samples C, D, H, which may be due to different combinations of times and current densities. The process duration has a direct effect on the total energy consumption, because a longer process means more energy consumption, even if the instantaneous power is constant. Therefore, samples with a longer duration will have higher W (energy consumption) values. Samples such as D (time t = 60 min), F (time t = 45 min), and J (time t = 60 min) tend to use more energy, because a longer process time allows for more energy accumulation, even if the instantaneous power is not the highest. On the other hand, samples with a shorter process duration, such as samples B (30 min) and C (30 min), tend to use less energy, even though the current density may be higher (as in the case of sample B).
Table 3 presents the chemical composition of a sample coating analyzed on the cross-section (Figure 1b). Energy-dispersive X-ray spectroscopy (EDS) was used to determine the chemical composition. The table presents the atomic composition for elements with a concentration above 1%. Magnesium (Mg) and aluminum (Al) are the main components of the Mg-AZ31B alloy and react with oxygen during the oxidation process. In turn, silicon (Si) and sodium (Na) are the primary components of the electrolyte.

2.2. Research Methodology

Surface microscopic analysis was performed using a Hitachi TM3000 scanning electron microscope (Hitachi, Tokyo, Japan). Surface morphology images were taken at 500× magnification to observe pores. Microscopic cross-sectional analysis was conducted using a Hitachi S-4700 scanning electron microscope (Hitachi, Tokyo, Japan) at a magnification of 1.5k×. Chemical composition tests for the cross-sections were performed using the NoranVantage EDS (Energy Dispersive X-ray Spectroscopy) system connected to the Hitachi S-4700 microscope. The EDS tests for the cross-sections were carried out on metallographic samples.
The coating thickness was determined by a contact method using the Fischer Dualoscope MP40 (Helmut Fischer GmbH + Co. KG, Sindelfingen, Germany), which operates on the eddy current principle. For each sample, ten measurements were performed on the surface, and the results were averaged to calculate the mean coating thickness along with the standard deviations.
Micromechanical tests were conducted on the surface of the coating, using the Micro Combi Tester—MCT3 (Anton Paar, Corcelles-Cormondrèche, Switzerland), employing a diamond Vickers indenter (V-M 86). The micro-indentation measurements of the coatings were performed at a maximum penetration depth of hmax = 0.8 μm. The loading and unloading phases lasted 30 s (at a rate of 1.6 μm/min), with a holding time under maximum load of 10 s. For each sample, 6 impressions were made, and the distances between them in the x and y axes were set at 30 µm, in accordance with ISO 14577 [28]. The hardness HIT and the elastic modulus EIT were calculated using the Oliver–Pharr method [29].
The study of the scratch resistance of coatings was conducted using the Micro Combi Tester—MCT3 from Anton-Paar (Corcelles-Cormondrèche, Switzerland), employing the scratch-test method. The testing procedures were carried out in accordance with the standards ISO 19252 [30], ISO 20502 [31], ASTM C1624 [32], and ASTM D7027 [33], using a diamond Rockwell indenter with a radius of 100 μm. The test consisted of three stages. In the first stage (pre-scan), the sample profile was scanned under a load of 0.03 N. The second stage (scan) involved the actual tests, during which the load was progressively increased from 0.03 to 30 N. Each scratch measured 6 mm in length, with the indenter moving at a speed of 12 mm/min. The final stage (post-scan) involved rescanning the profile under a load of 0.03 N after the surface had been scratched. During the tests, parameters such as the applied load (Fn [N]), friction force (Ft [N]), and penetration depth of the indenter under load (Pd [μm]) were recorded. Three critical loads were identified on the baseline samples: Lc1 (the load at which the first deformations of the coating occurred), Lc2 (the load at which the first damage was observed), and Lc3 (the load at which the complete failure of the coating occurred). Three-dimensional measurements were performed using a 3D contact profilographometer (Intra Touch with motorized Y stage, Taylor Hobson, Leicester, UK). The scratches were scanned on the surface x = 2 mm × y = 8 mm with the resolution of the measuring tip Δz = 4 nm. Visualization was performed using dedicated software (TalyMap 9, Digital Surf, Besançon, France). The surface roughness parameters (Ra and Rz) were determined based on profilometric measurements conducted using the Form TalySurf Series 2 50i contact profilometer (Taylor Hobson Ltd., Leicester, UK). In order to determine the influence of input quantities on the microhardness HIT, Young’s modulus EIT, and critical load values Lc1 (first cohesive cracks), Lc2 (first adhesive cracks), and Lc3 (complete removal of coating), an experiment based on the Hartley plan with three three-valued input quantities was analyzed in the Statistica program. This design falls under the category of small central composite designs, primarily aimed at determining the response surface. In other words, it involves fitting a model to the experimental values of the output variable, which includes main effects for input quantities (x1, x2, x3), their interactions (x1∙x2, x1∙x3, x2∙x3), and square values (x12, x22, x32). An analysis of the experience with a compositional master plan was chosen. An evaluation of the effects of the trivalent input variables (x1—peak current density j (A/dm2), x2—pulse frequency f (Hz), and x3—process time t (min)) on the dependent output variables (microhardness HIT (GPa), Young’s modulus EIT (GPa), and critical load values Lc1, Lc2, Lc3) was carried out. The model’s fit (in terms of adequacy and consistency) to the response surface is demonstrated through spatial plots. A Pareto chart was created to identify which variables (from those listed in 1–3) should be included in the model. Additionally, marginal mean plots with 95% confidence intervals were employed to visualize the statistical analysis of the results.

3. Results and Discussion

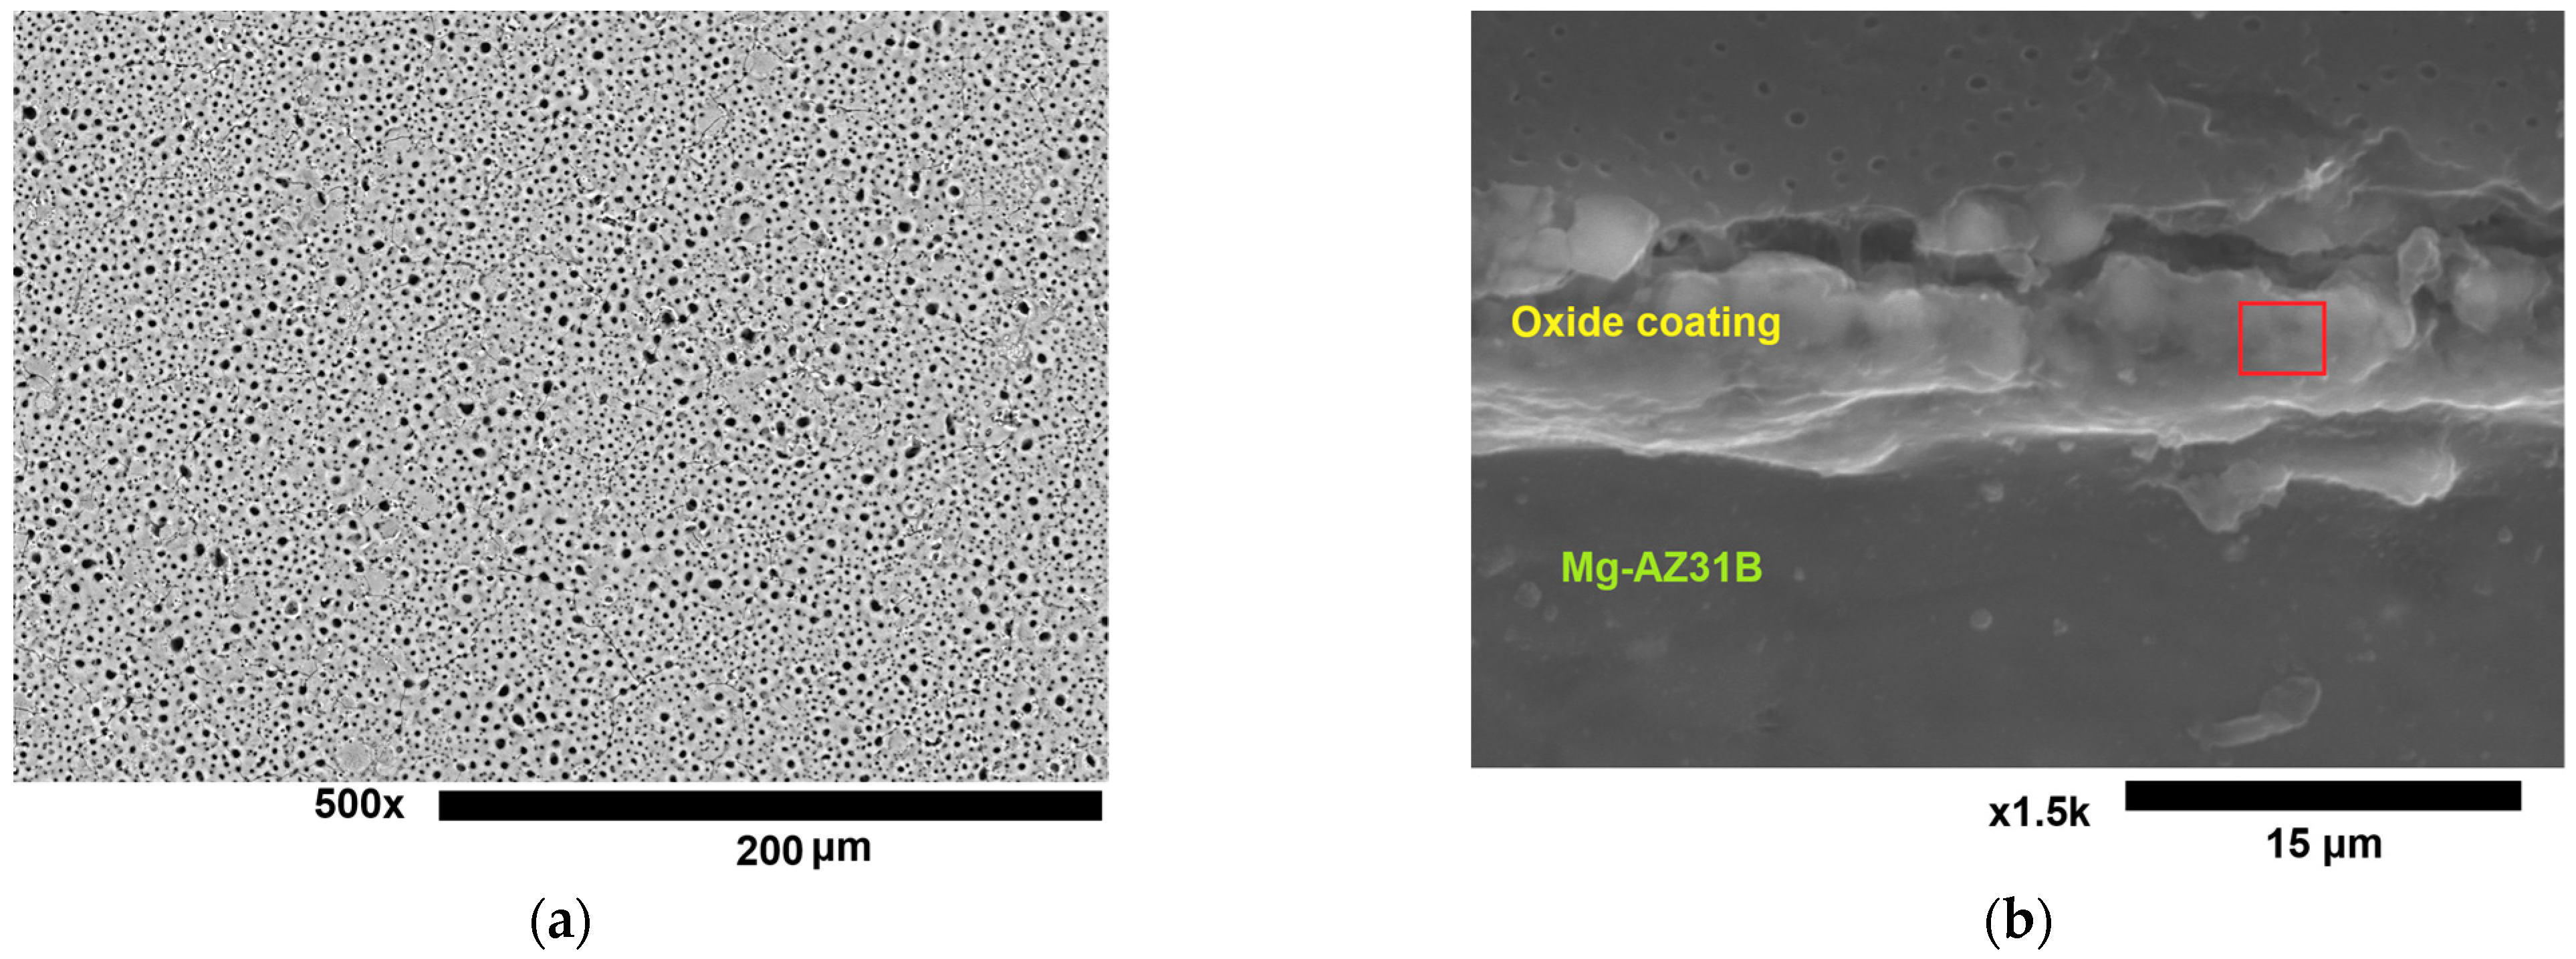
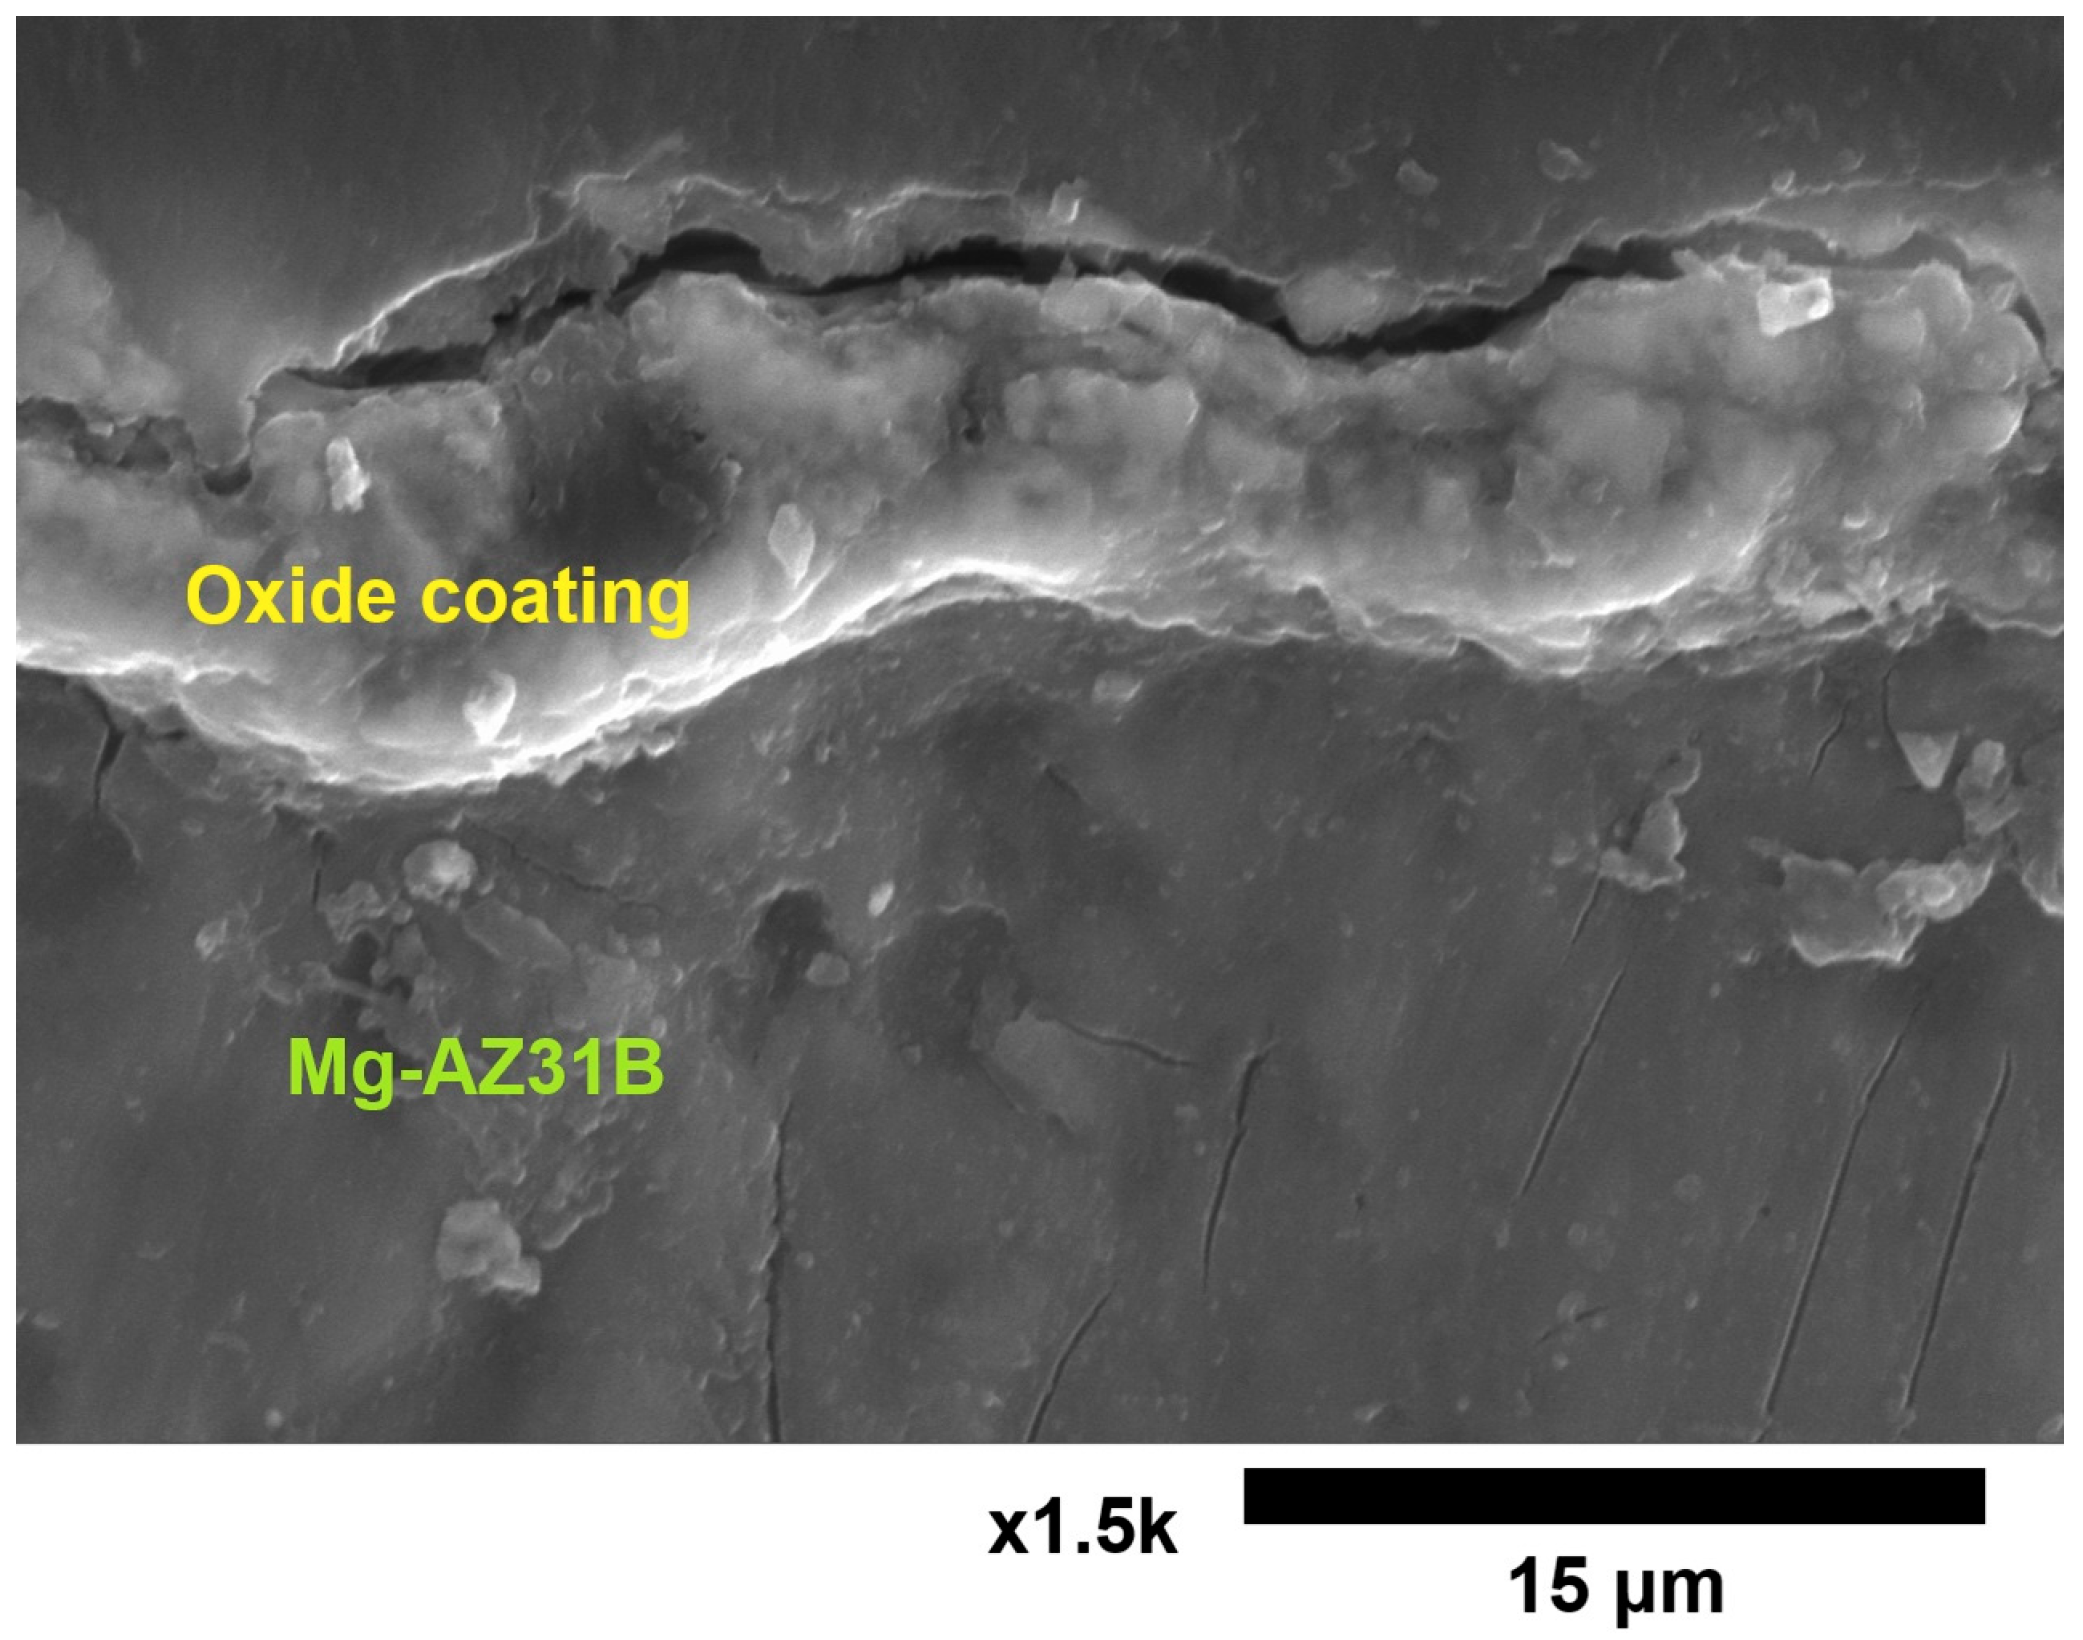
3.1. The Thickness of the Oxide Coating

The average coating thickness measurements compiled in Table 4 are presented in the article [12]. The highest oxide coating thickness was observed for sample F, produced at a peak current density of 20 A/dm2, frequency of 75 Hz, and duration of 45 min, while the lowest thickness was recorded for sample H, produced at a peak current density of 15 A/dm2, frequency of 100 Hz, and duration of 45 min. The small deviations suggest a uniform coating buildup across the entire sample surface.

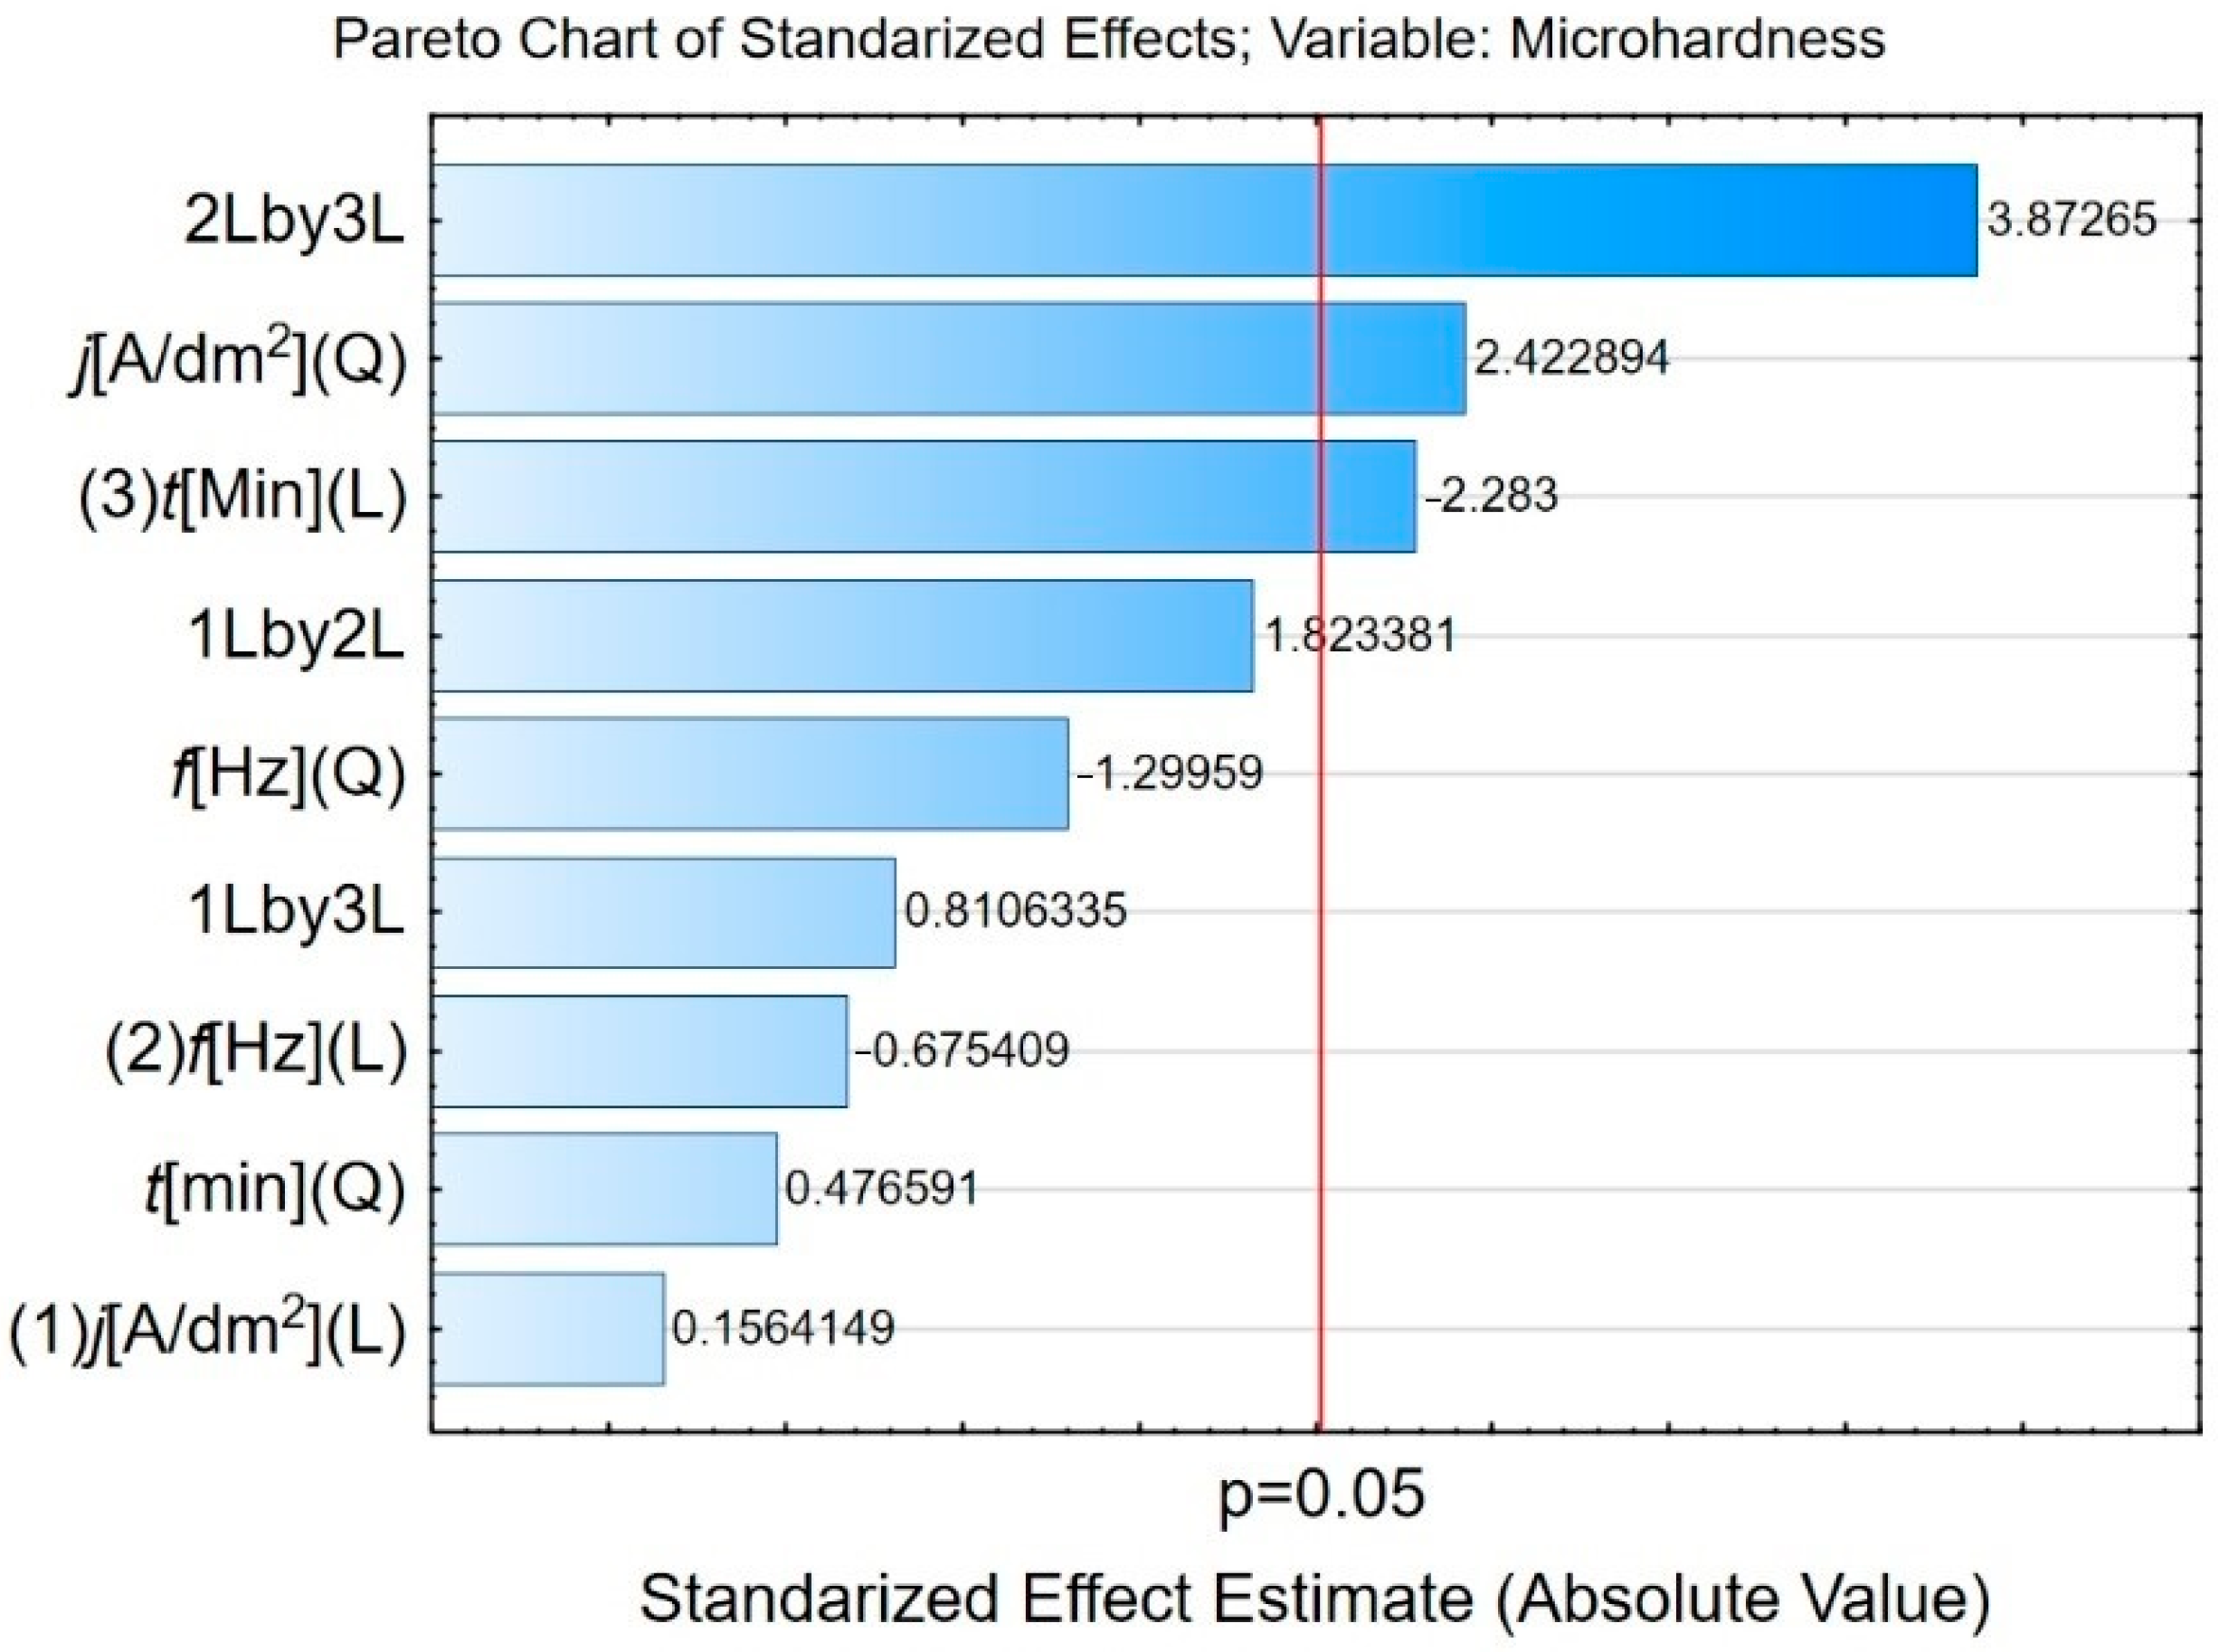
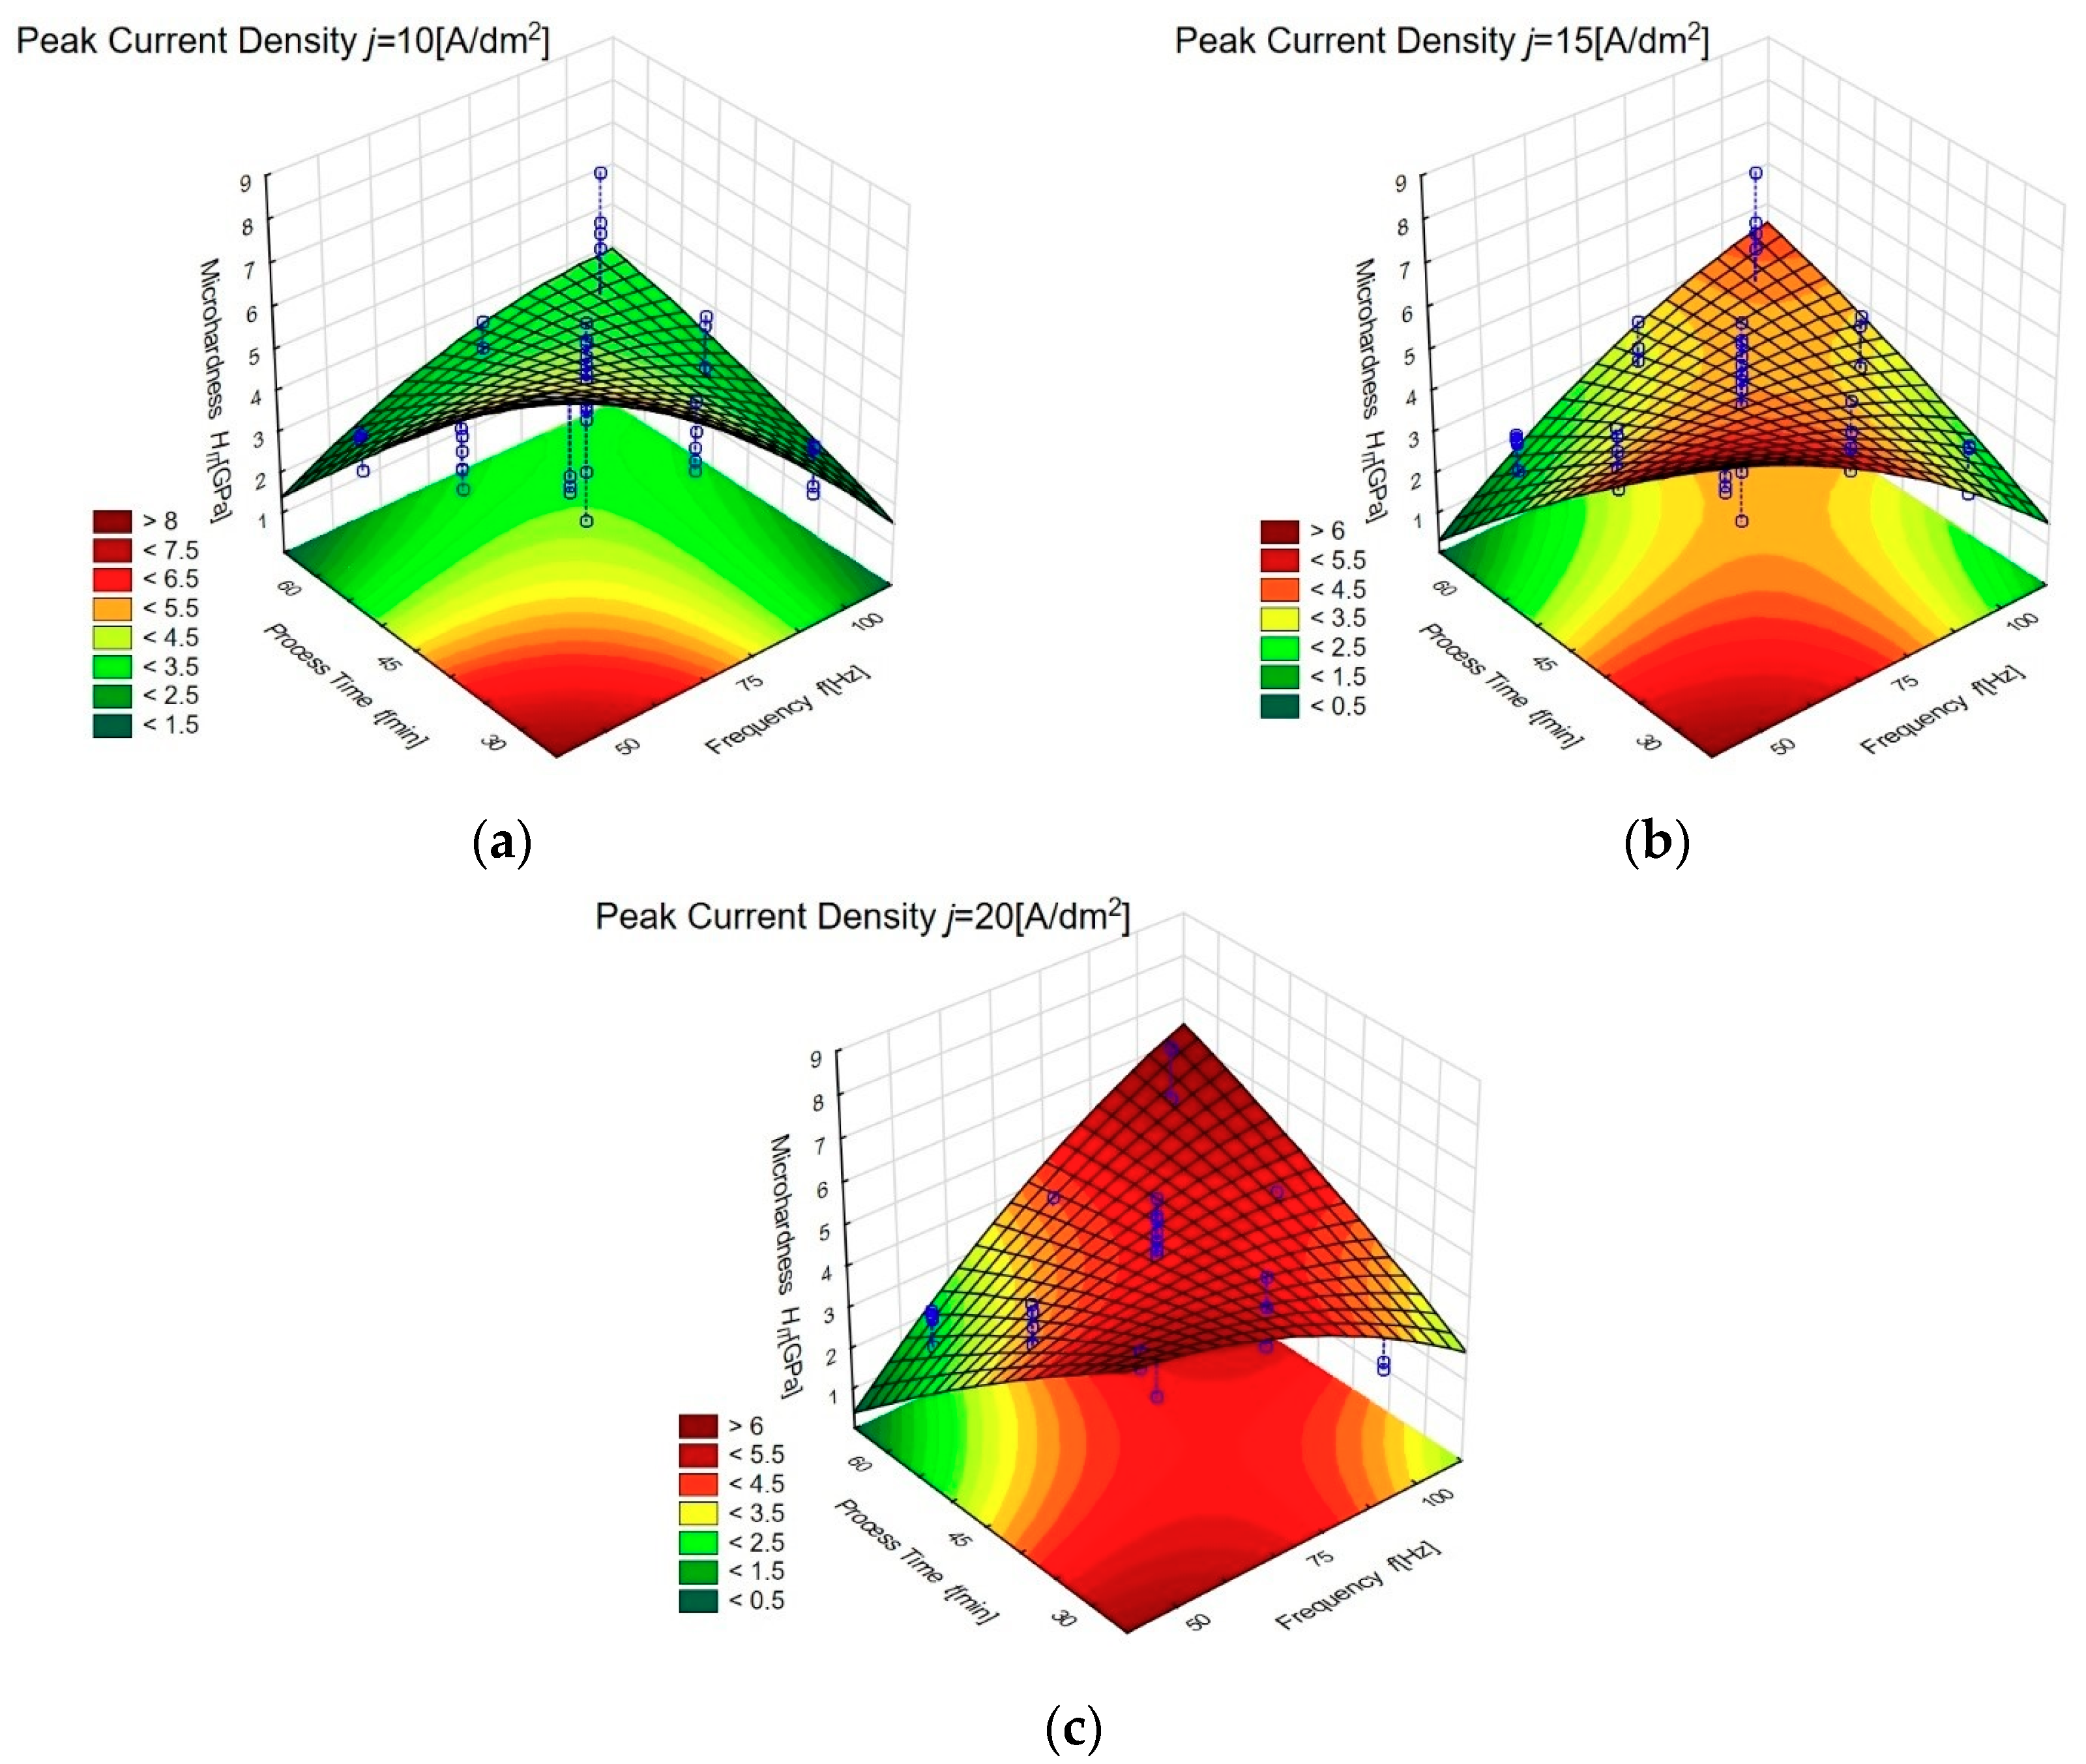
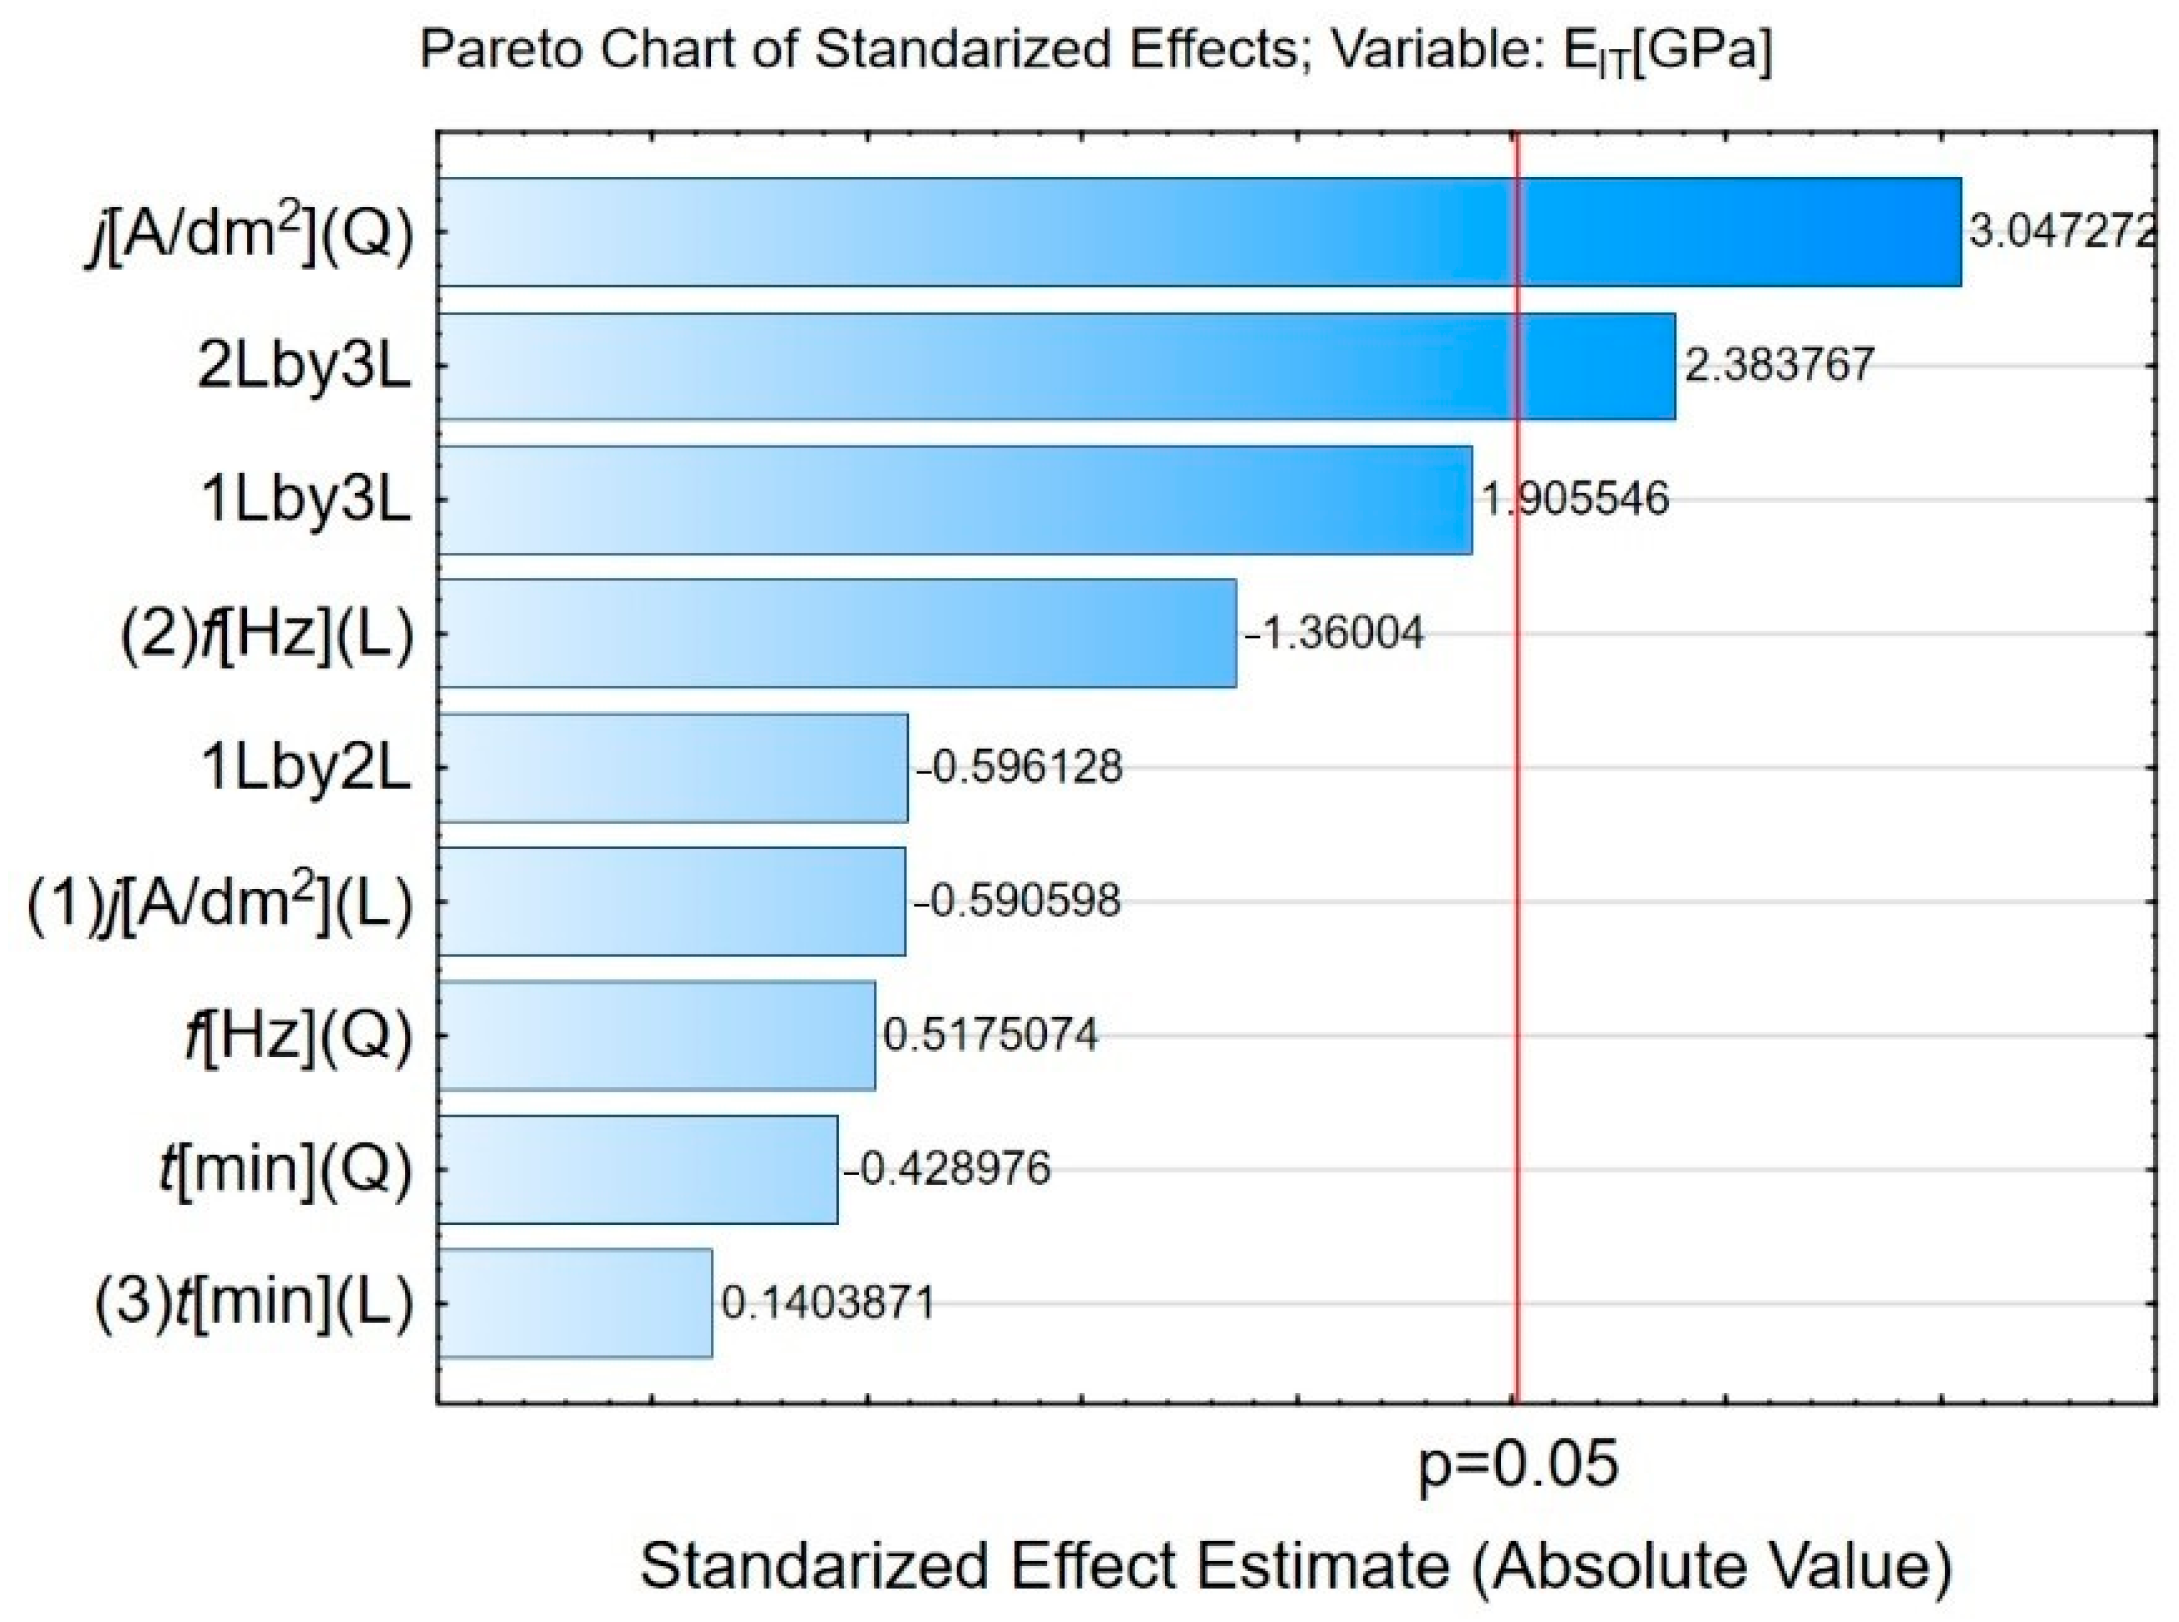
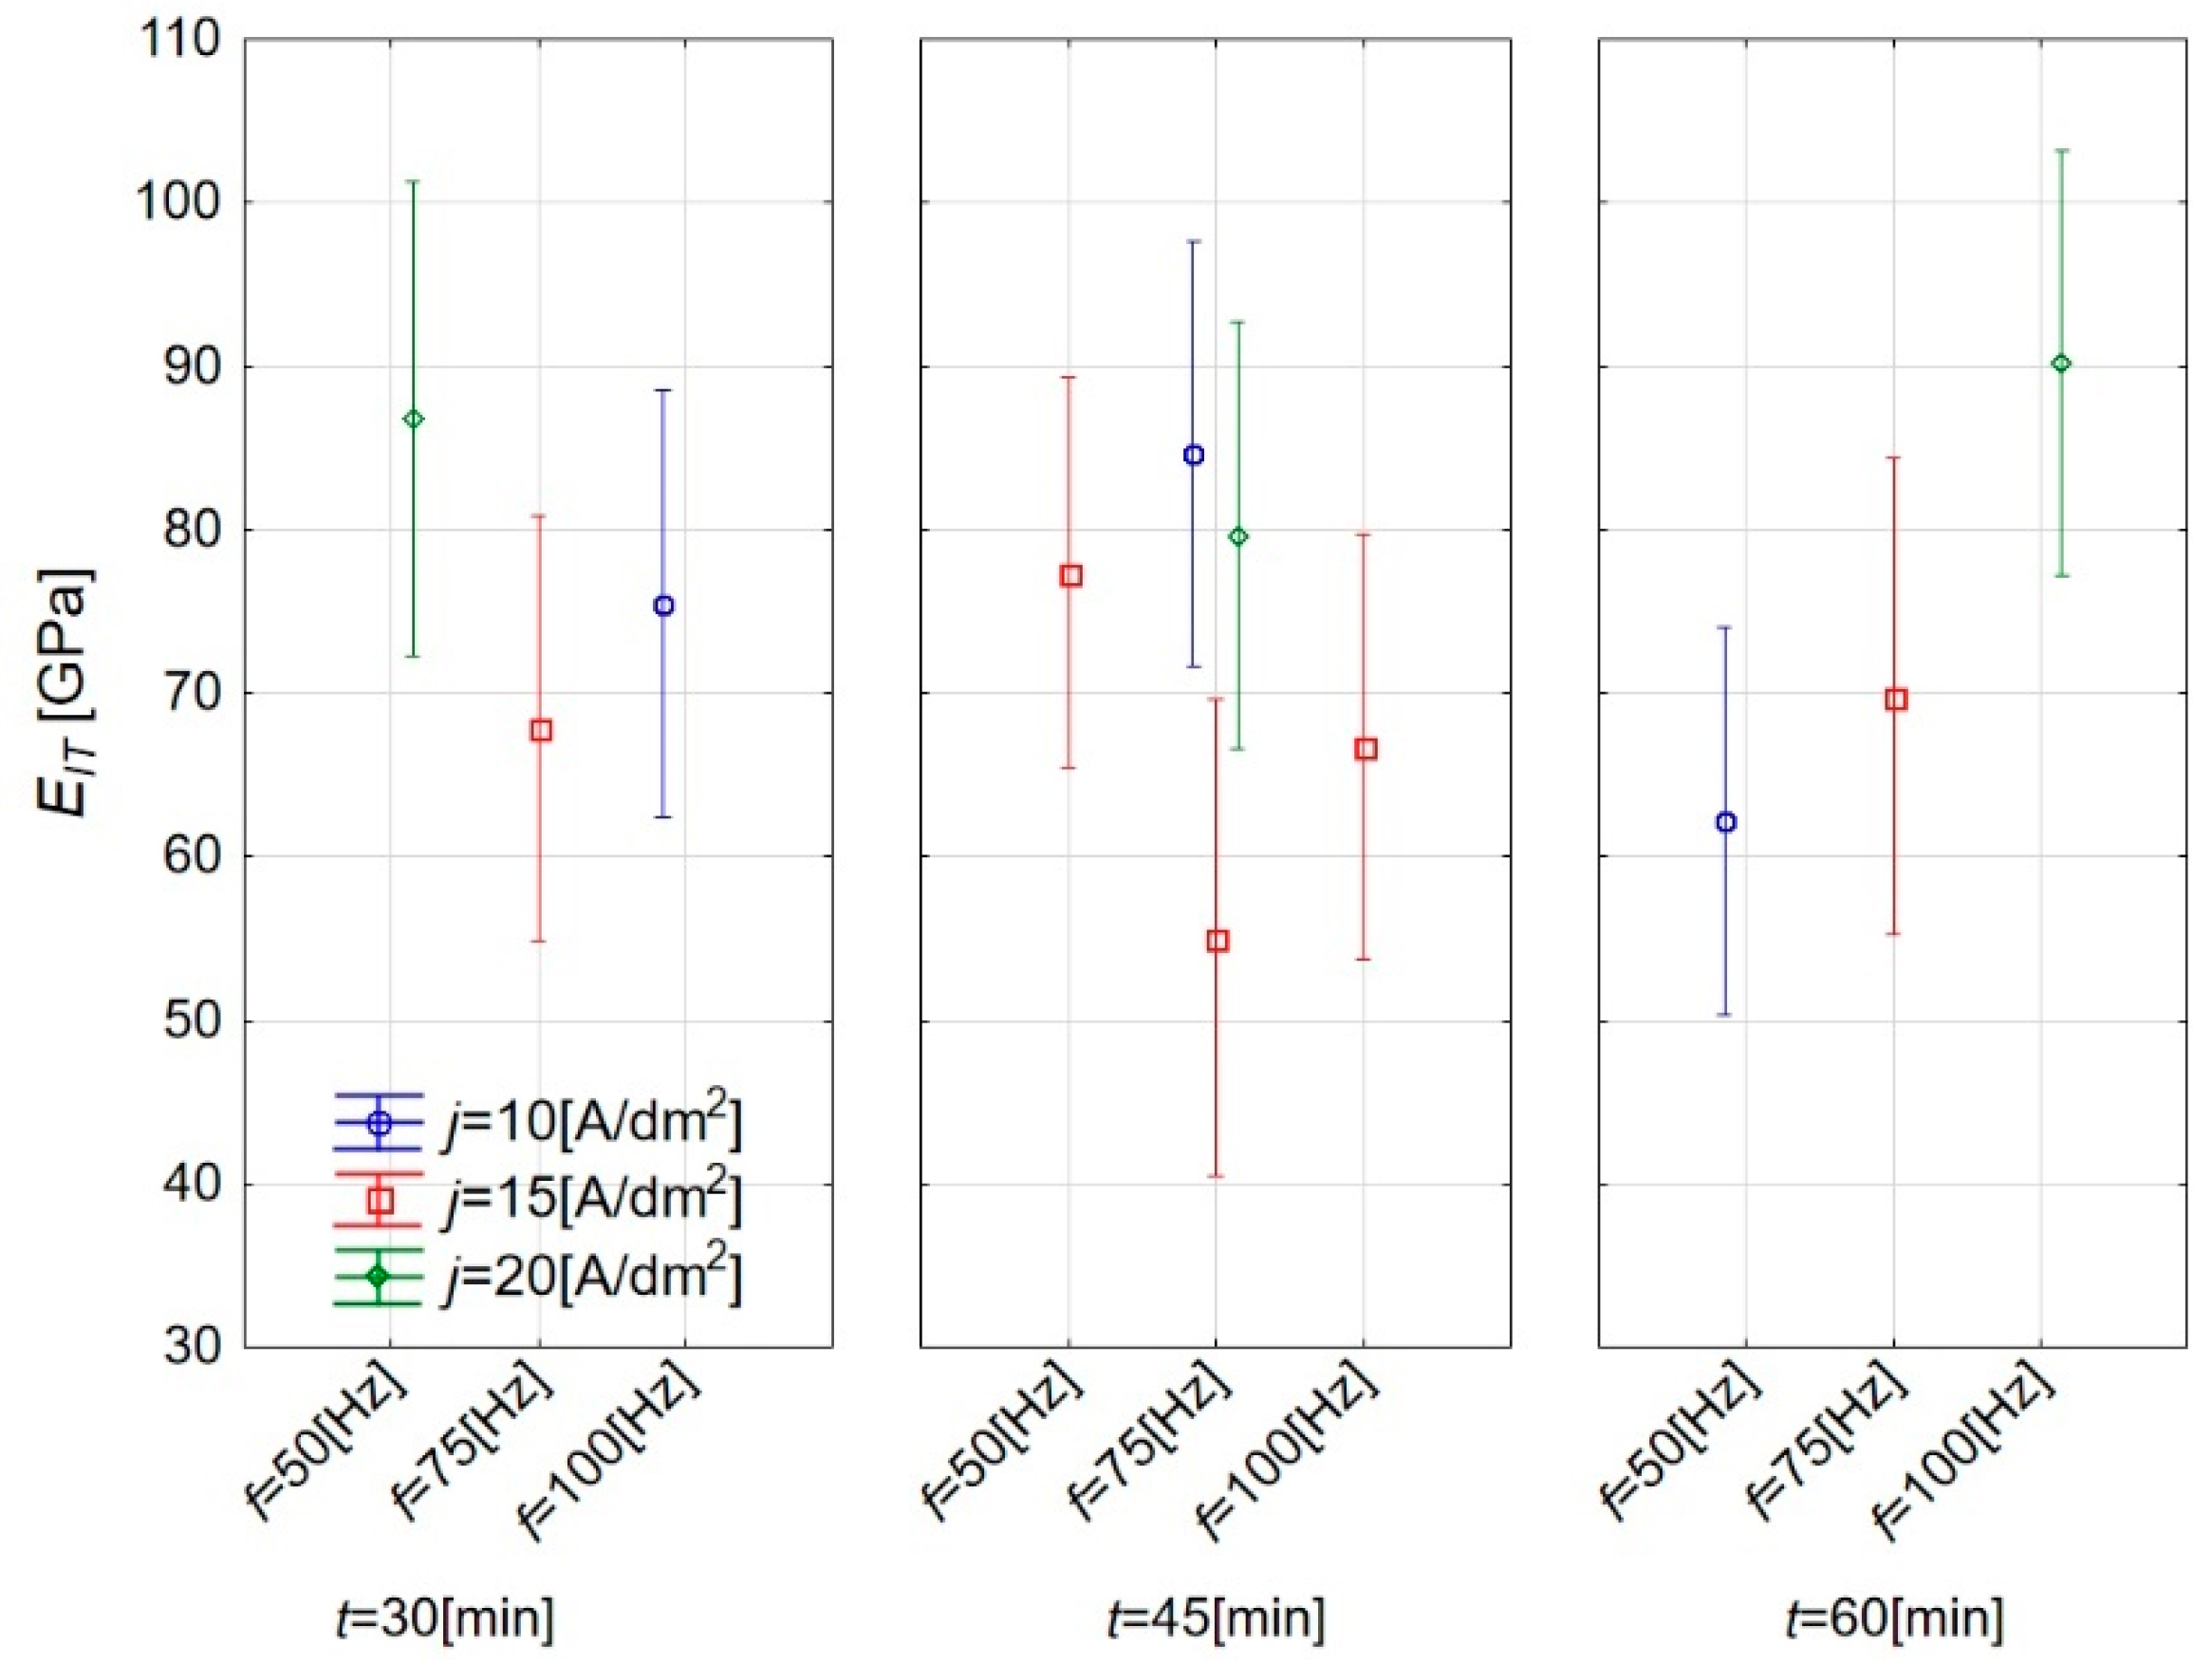
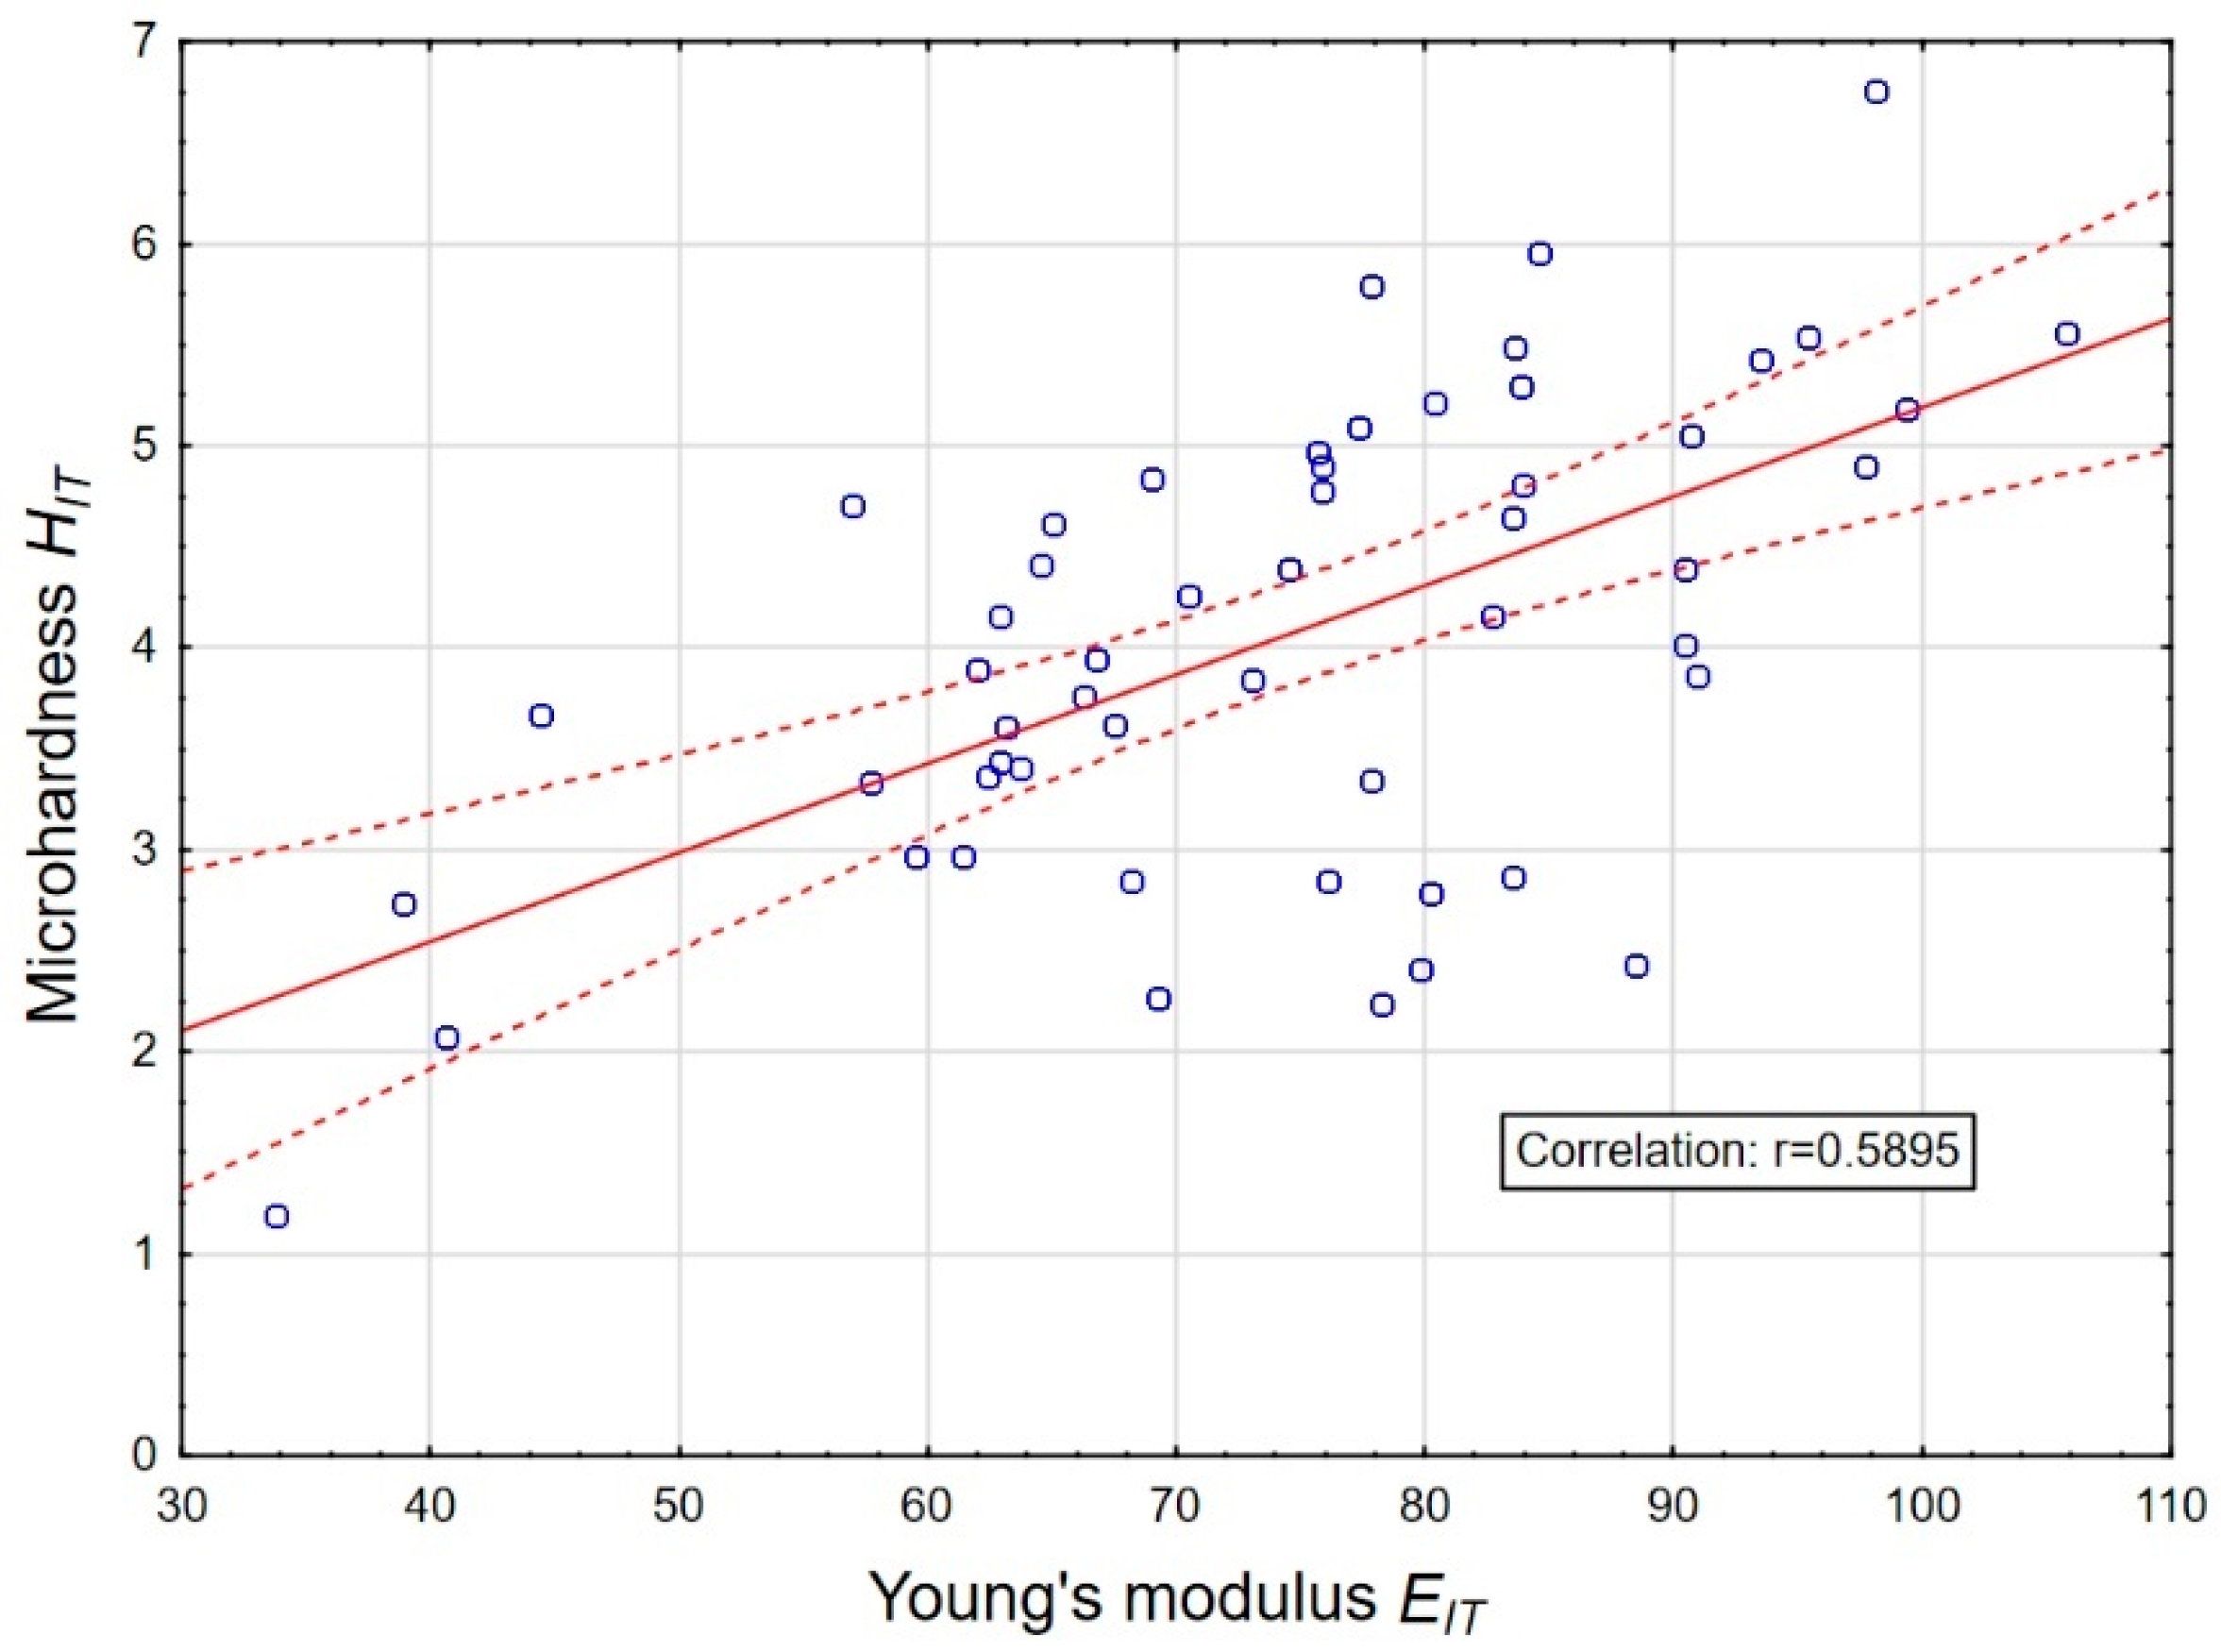
3.2. Influence of Plasma Electrolytic Oxidation on Micromechanical Properties

Table 5 shows the measurement of the hardness (HIT) and Young’s modulus (EIT). The indentation hardness (HIT) values indicate that sample D exhibits the highest hardness at 5.48 GPa, along with a relatively low standard deviation of 0.76 GPa, suggesting consistent results. Sample B follows closely with a hardness of 4.96 GPa. In contrast, samples A (2.71 GPa) and K (2.96 GPa) show the lowest hardness values, indicating these coatings may be more susceptible to deformation and less resistant to mechanical stress. In terms of the indentation elasticity modulus (EIT), sample D also demonstrates the highest modulus at 90.12 GPa, indicating significant stiffness and resistance to deformation. Samples B (86.82 GPa) and E (84.70 GPa) similarly exhibit high EIT values, suggesting they are suitable for applications requiring structural integrity. Conversely, samples K (55.02 GPa) and A (62.16 GPa) possess the lowest EIT values, which may limit their application in dynamically loaded environments due to lower stiffness. The standard deviations for HIT are generally low across most samples, indicating uniform hardness distribution on the coating surfaces. However, sample K shows the highest standard deviation (0.98 GPa), suggesting some inconsistency in hardness. The standard deviations for EIT values, however, vary more significantly, with samples A (19.10 GPa) and K (20.21 GPa) displaying considerable variability, which may reflect heterogeneous structures within these coatings. In summary, sample D stands out with the best mechanical properties, demonstrating the highest hardness and elasticity modulus, making it particularly suitable for applications requiring durability and resistance to deformation. The cross-section of sample D is presented in Figure 2.
Samples B and E also present robust mechanical characteristics, albeit slightly lower than sample D. Conversely, samples A and K, with their lower hardness and elasticity modulus and higher variability, may be less effective in demanding applications.
The Pareto chart in Figure 3 illustrates the normalized effects of various factors on the microhardness HIT. The horizontal axis displays the normalized effect values (absolute values), while the vertical line indicates the statistical significance threshold at p = 0.05. Factors positioned to the right of this line are considered statistically significant.
The greatest influence on HIT is attributed to the interaction between frequency f and time t, denoted as 2Lby3L. Additionally, the quadratic term of current density j[A/dm2](Q) has a significant impact on microhardness, indicating a nonlinear effect of this parameter. The chart also reveals a linear effect of time t[min](L) on the microhardness results.
Other effects, such as the interaction 1Lby2L (between current density j and frequency f) and 1Lby3L (between current density j and time t), as well as the quadratic and linear dependencies of microhardness on frequency f and time t (represented as f[Hz](Q), f[Hz](L), t[min](Q), t[min](L), respectively), exhibit lower values and do not exceed the significance threshold. This suggests that their influence on the microhardness HIT is limited or negligible.
Figure 4 shows the response-surface models for the three peak current densities used. These models can be compared as they have the same dependent variable (microhardness) and the same sample range. The influence of the oxidation parameters (process time, frequency) is dependent on the peak current density.
Figure 5 shows marginal average graphs for the microhardness for three process durations. For time intervals of t = 30 and 60 min, the microhardness increases with the rise in current density. The highest microhardness was achieved at j = 20 A/dm2 in all cases. The microhardness HIT varies depending on the frequency and time for different current density values, and it is difficult to identify a clear trend in this context. Considering the economic aspect of the coating deposition process, to achieve coatings with high microhardness values, it is sufficient to use a current density of 20 A/dm2 for 30 min at a frequency of 50 Hz.
The Pareto chart in Figure 6 illustrates the normalized effects of various factors on Young’s modulus. The greatest influence on EIT is exerted by the square of the current density j[A/dm2](Q), indicating a nonlinear effect of this parameter. The interaction between the linear effects of frequency and time (2Lby3L) is also statistically significant. Other factors have less importance or their effects are not statistically significant.
Figure 7 shows the response-surface models of EIT for the three peak current densities used. The influence of the oxidation parameters (process time, frequency) is dependent on the peak current density.
Figure 8 presents the Young’s modulus as a function of the coating deposition parameters. The variability of the results depending on frequency and time does not allow for a clear interpretation across all graphs. For t = 60 [min], an increase in Young’s modulus can be observed with rising current density and frequency. The data also exhibit significant variability, as indicated by the error bars.
Using the correlation coefficient, Figure 9 shows a relationship strength of r = 0.5895 between the microhardness HIT and Young’s modulus EIT, indicating a moderate positive correlation between these parameters.

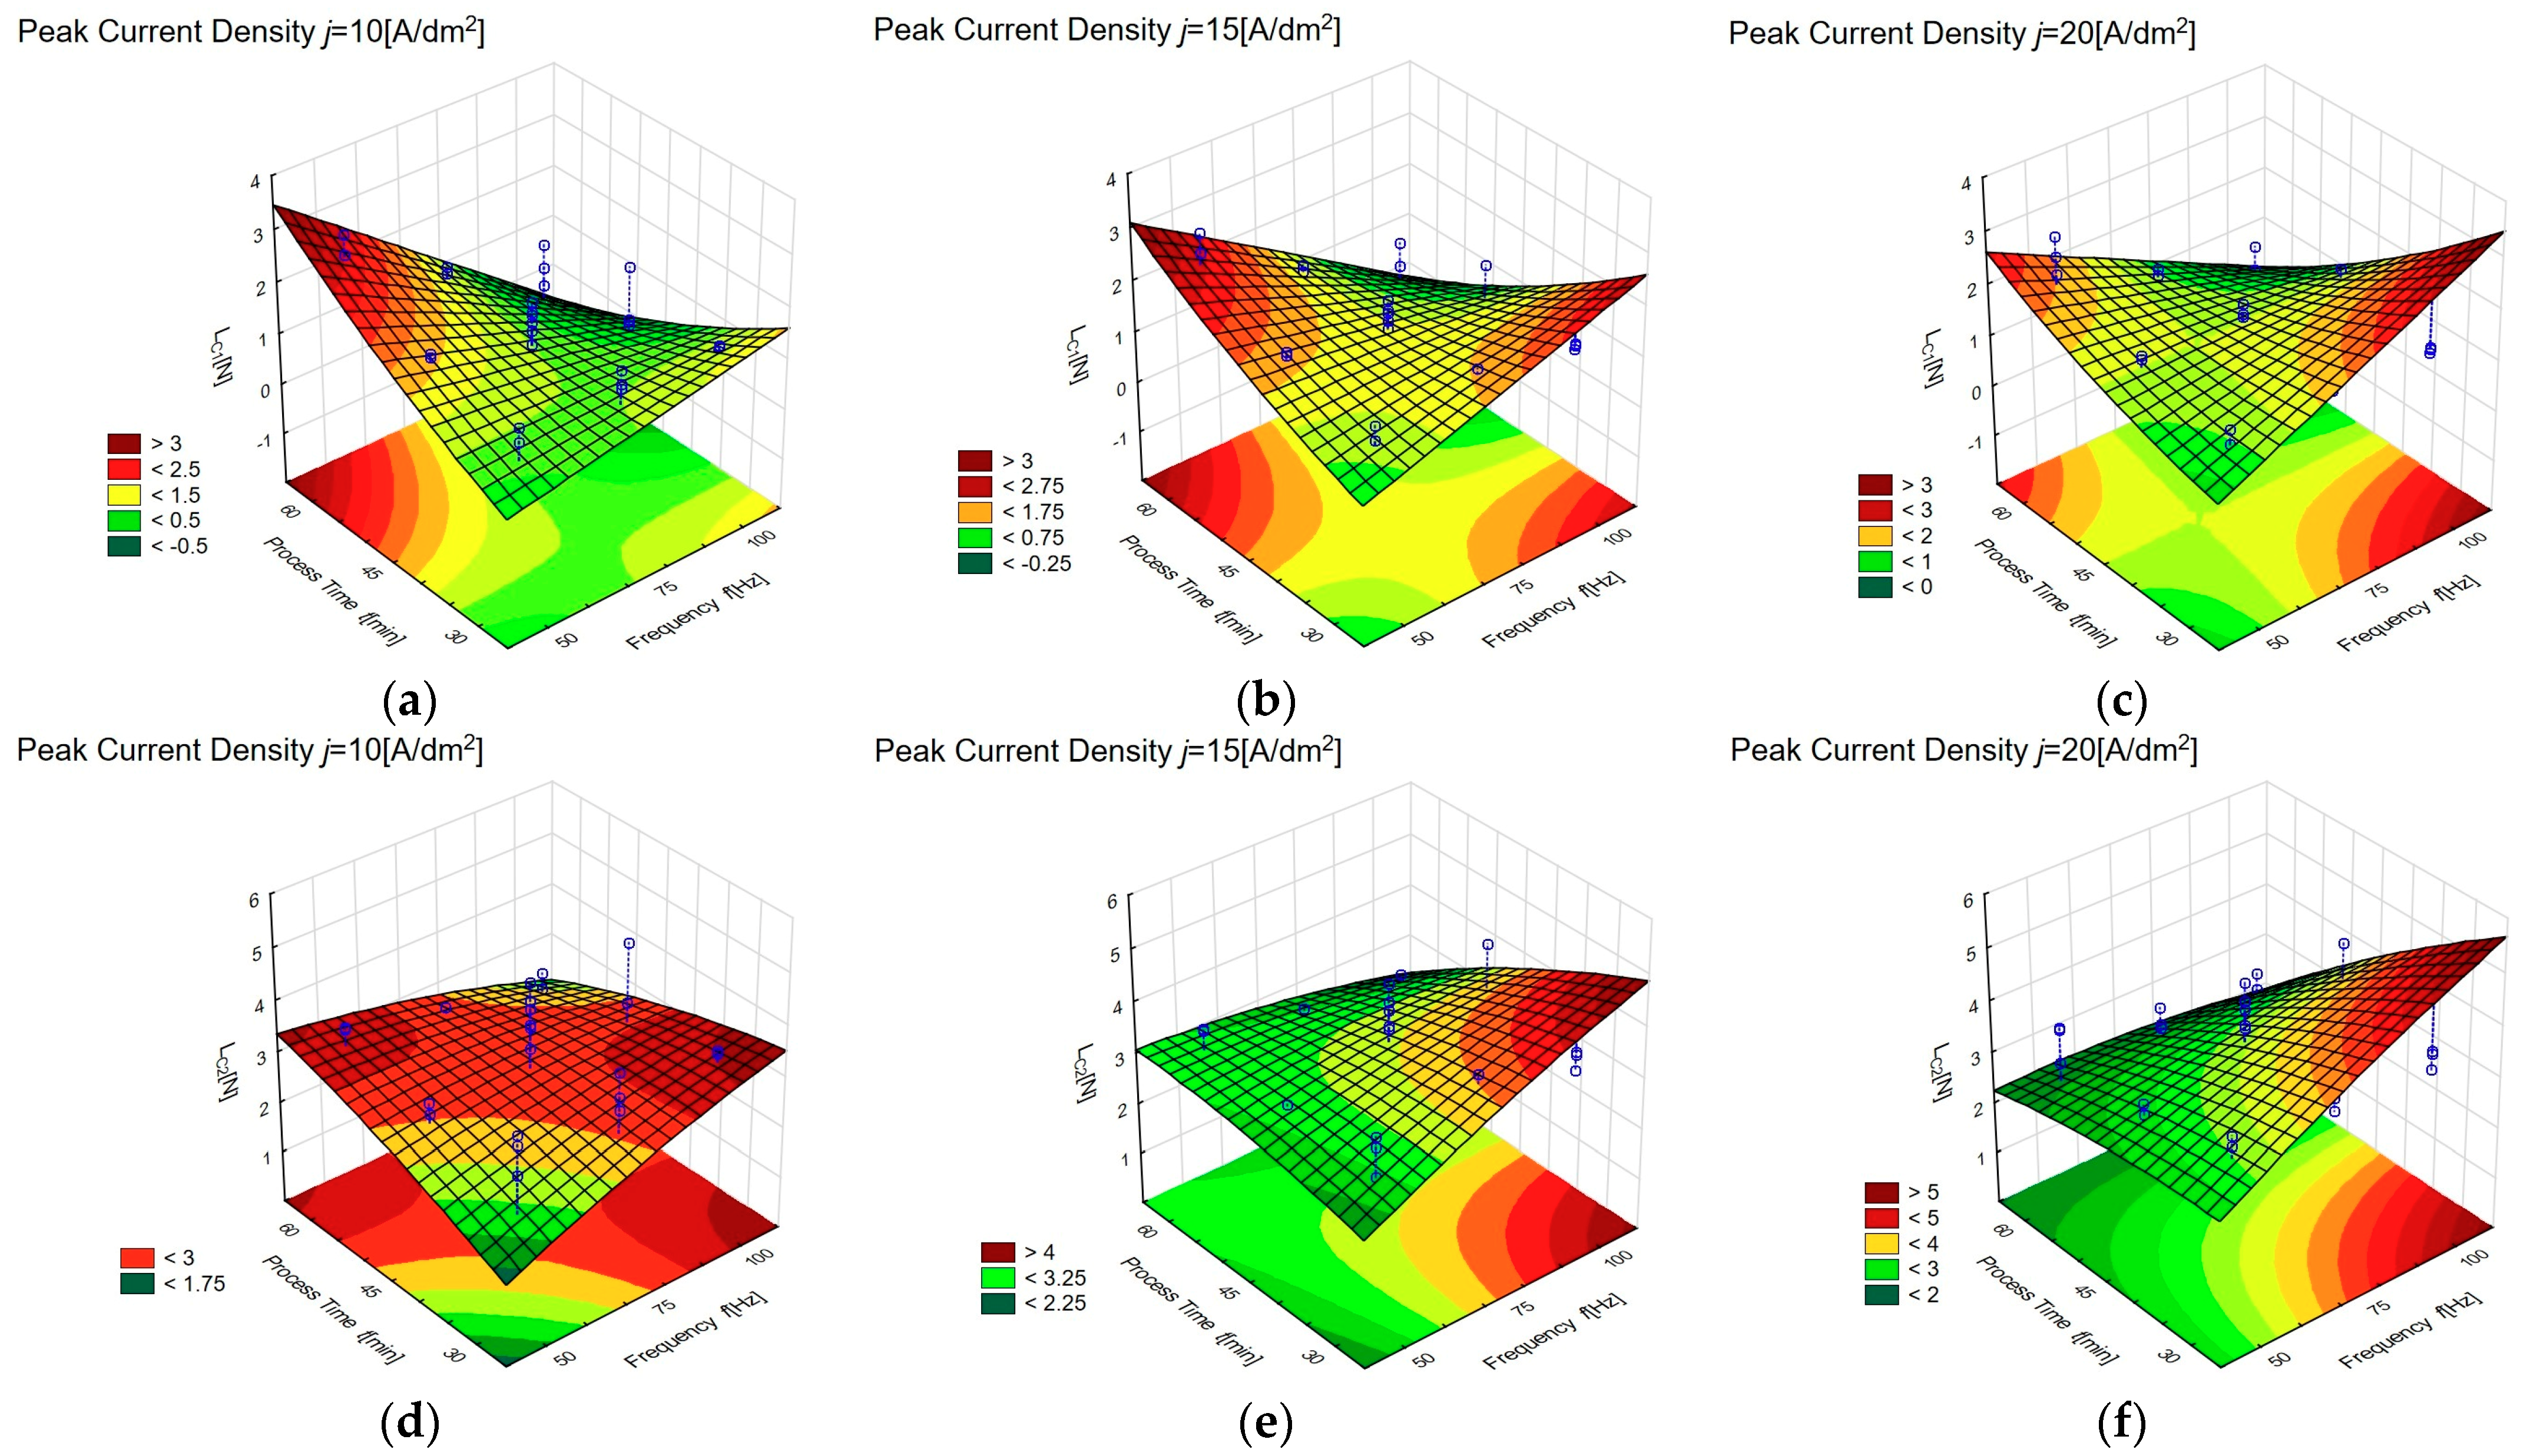
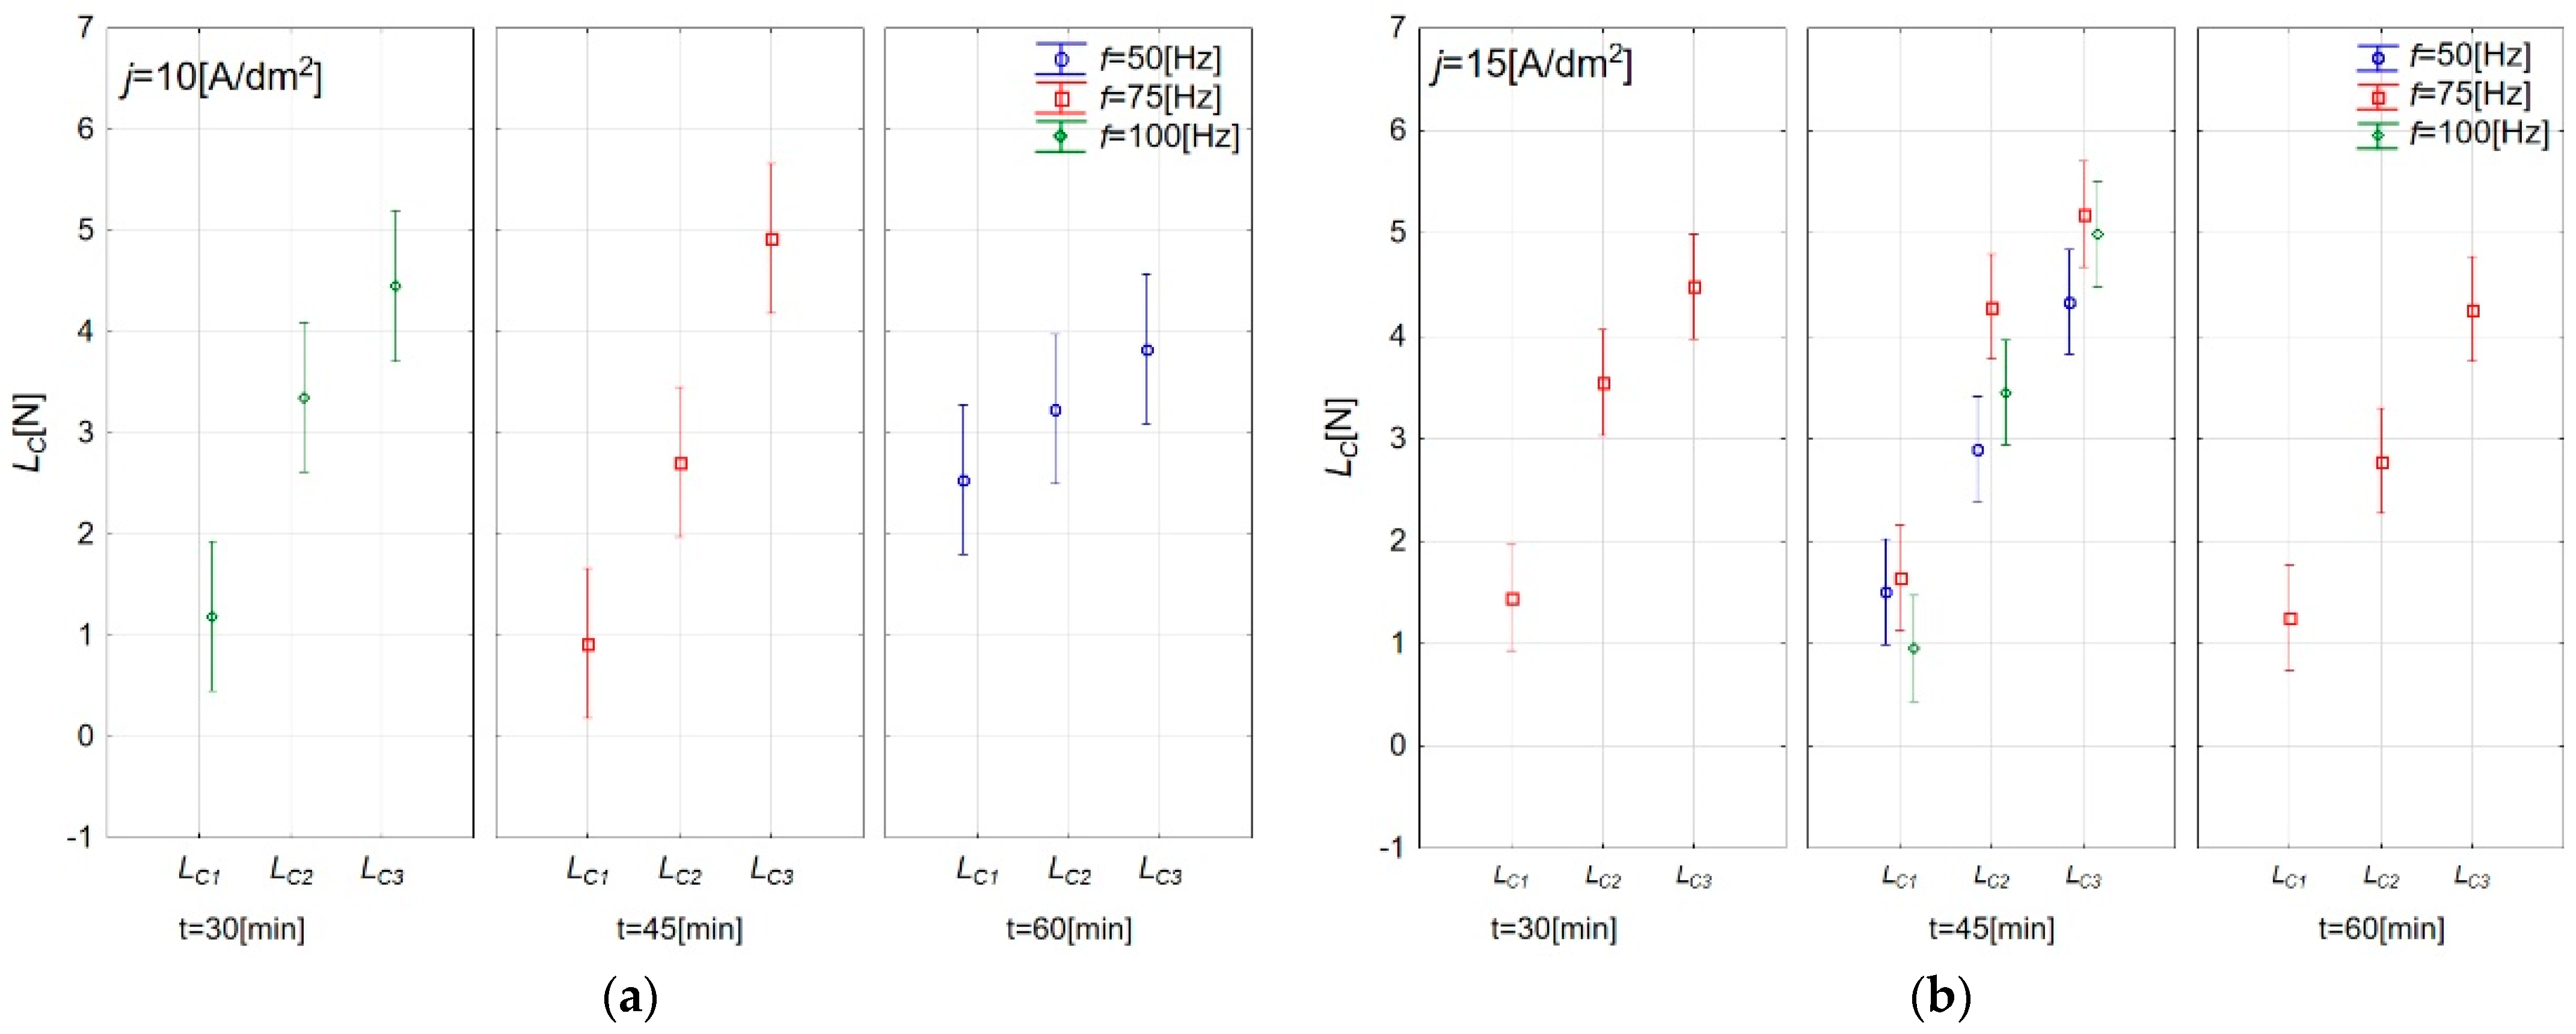
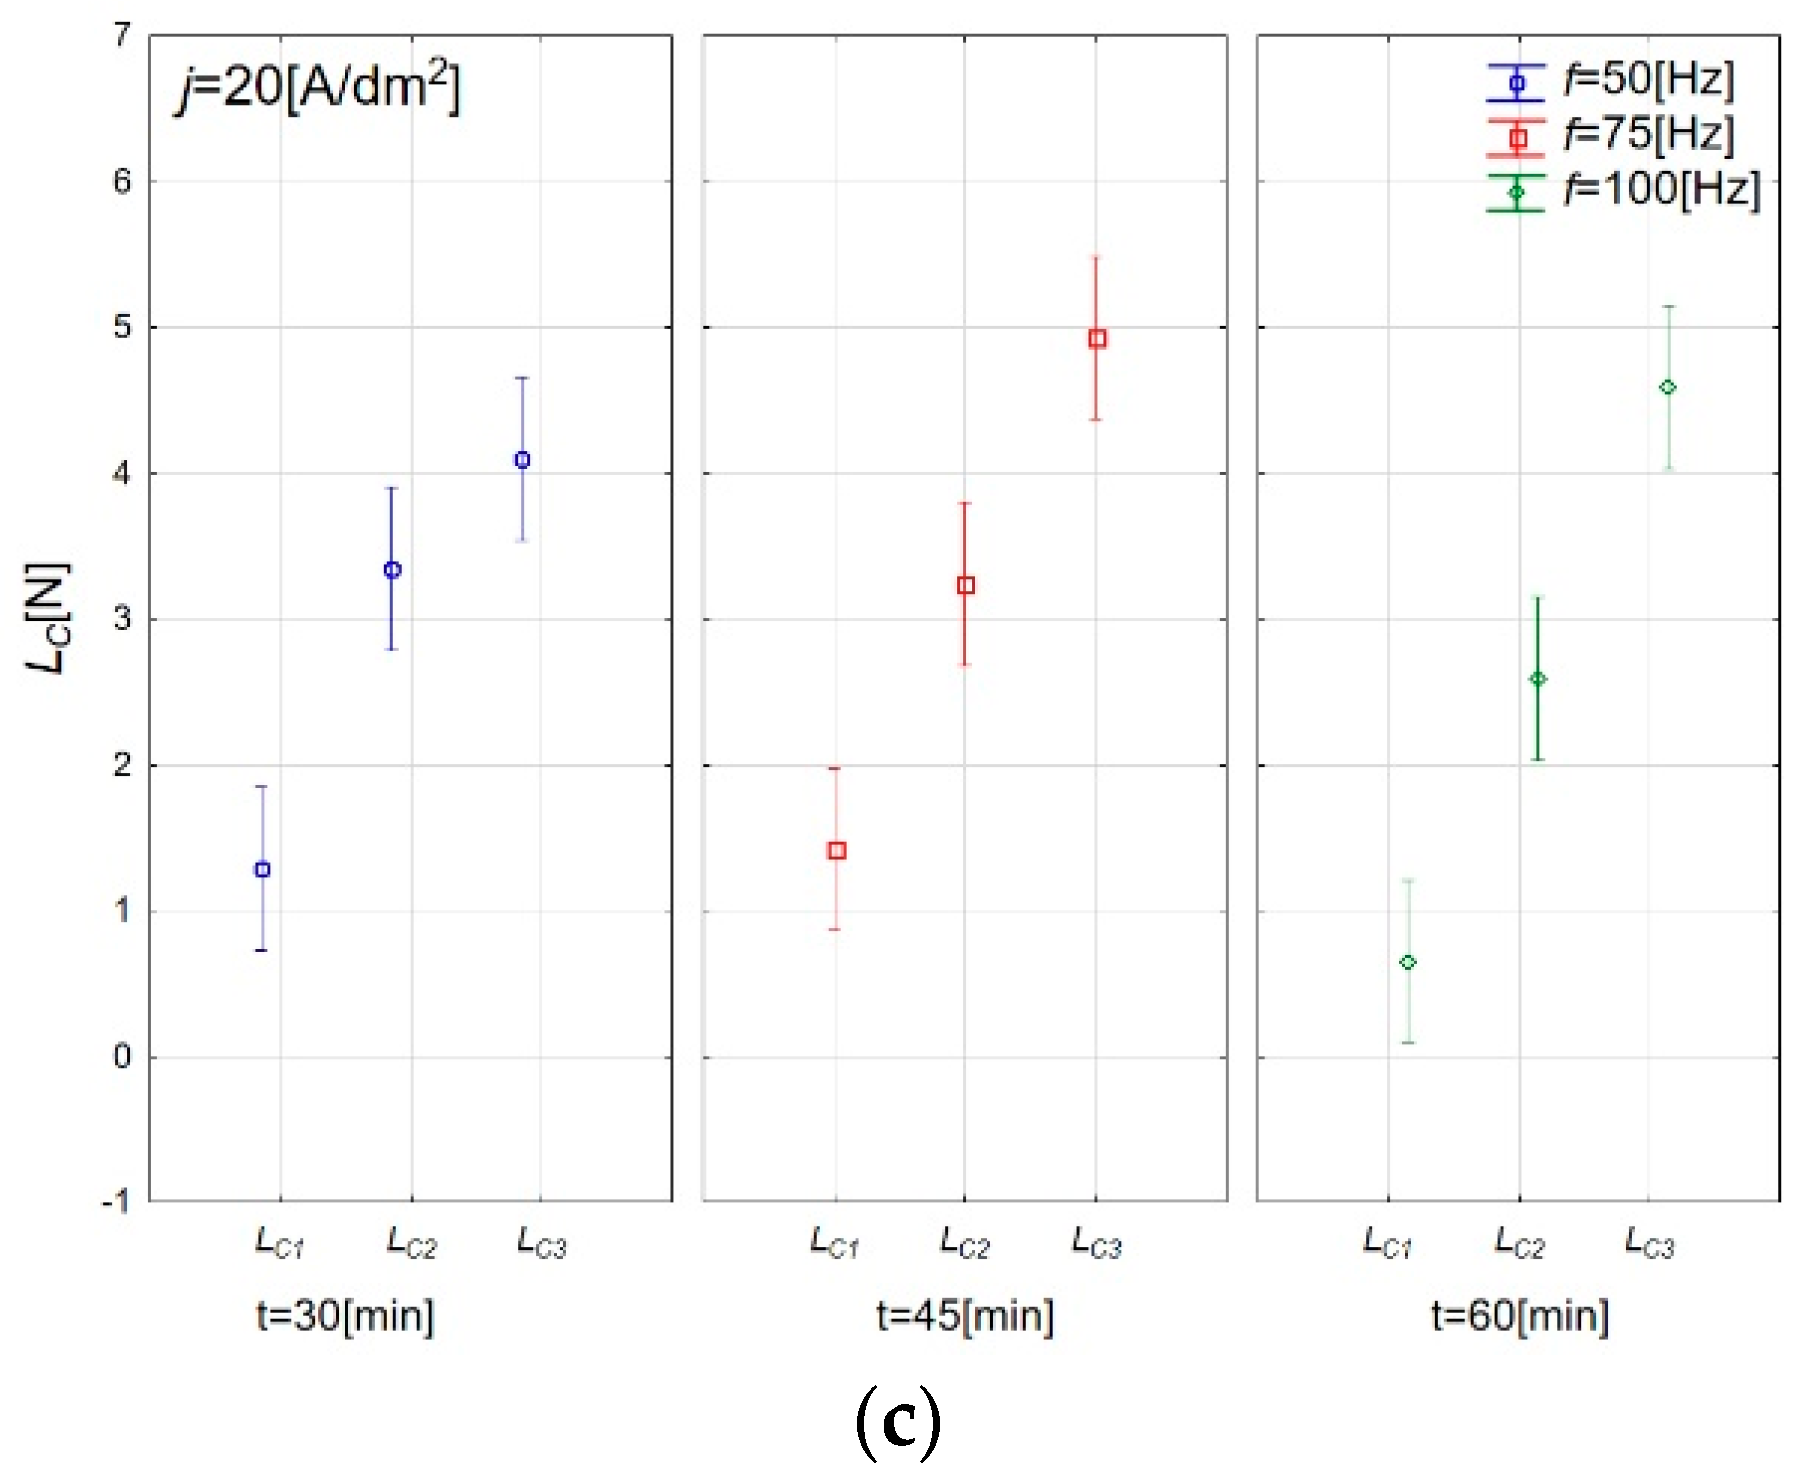
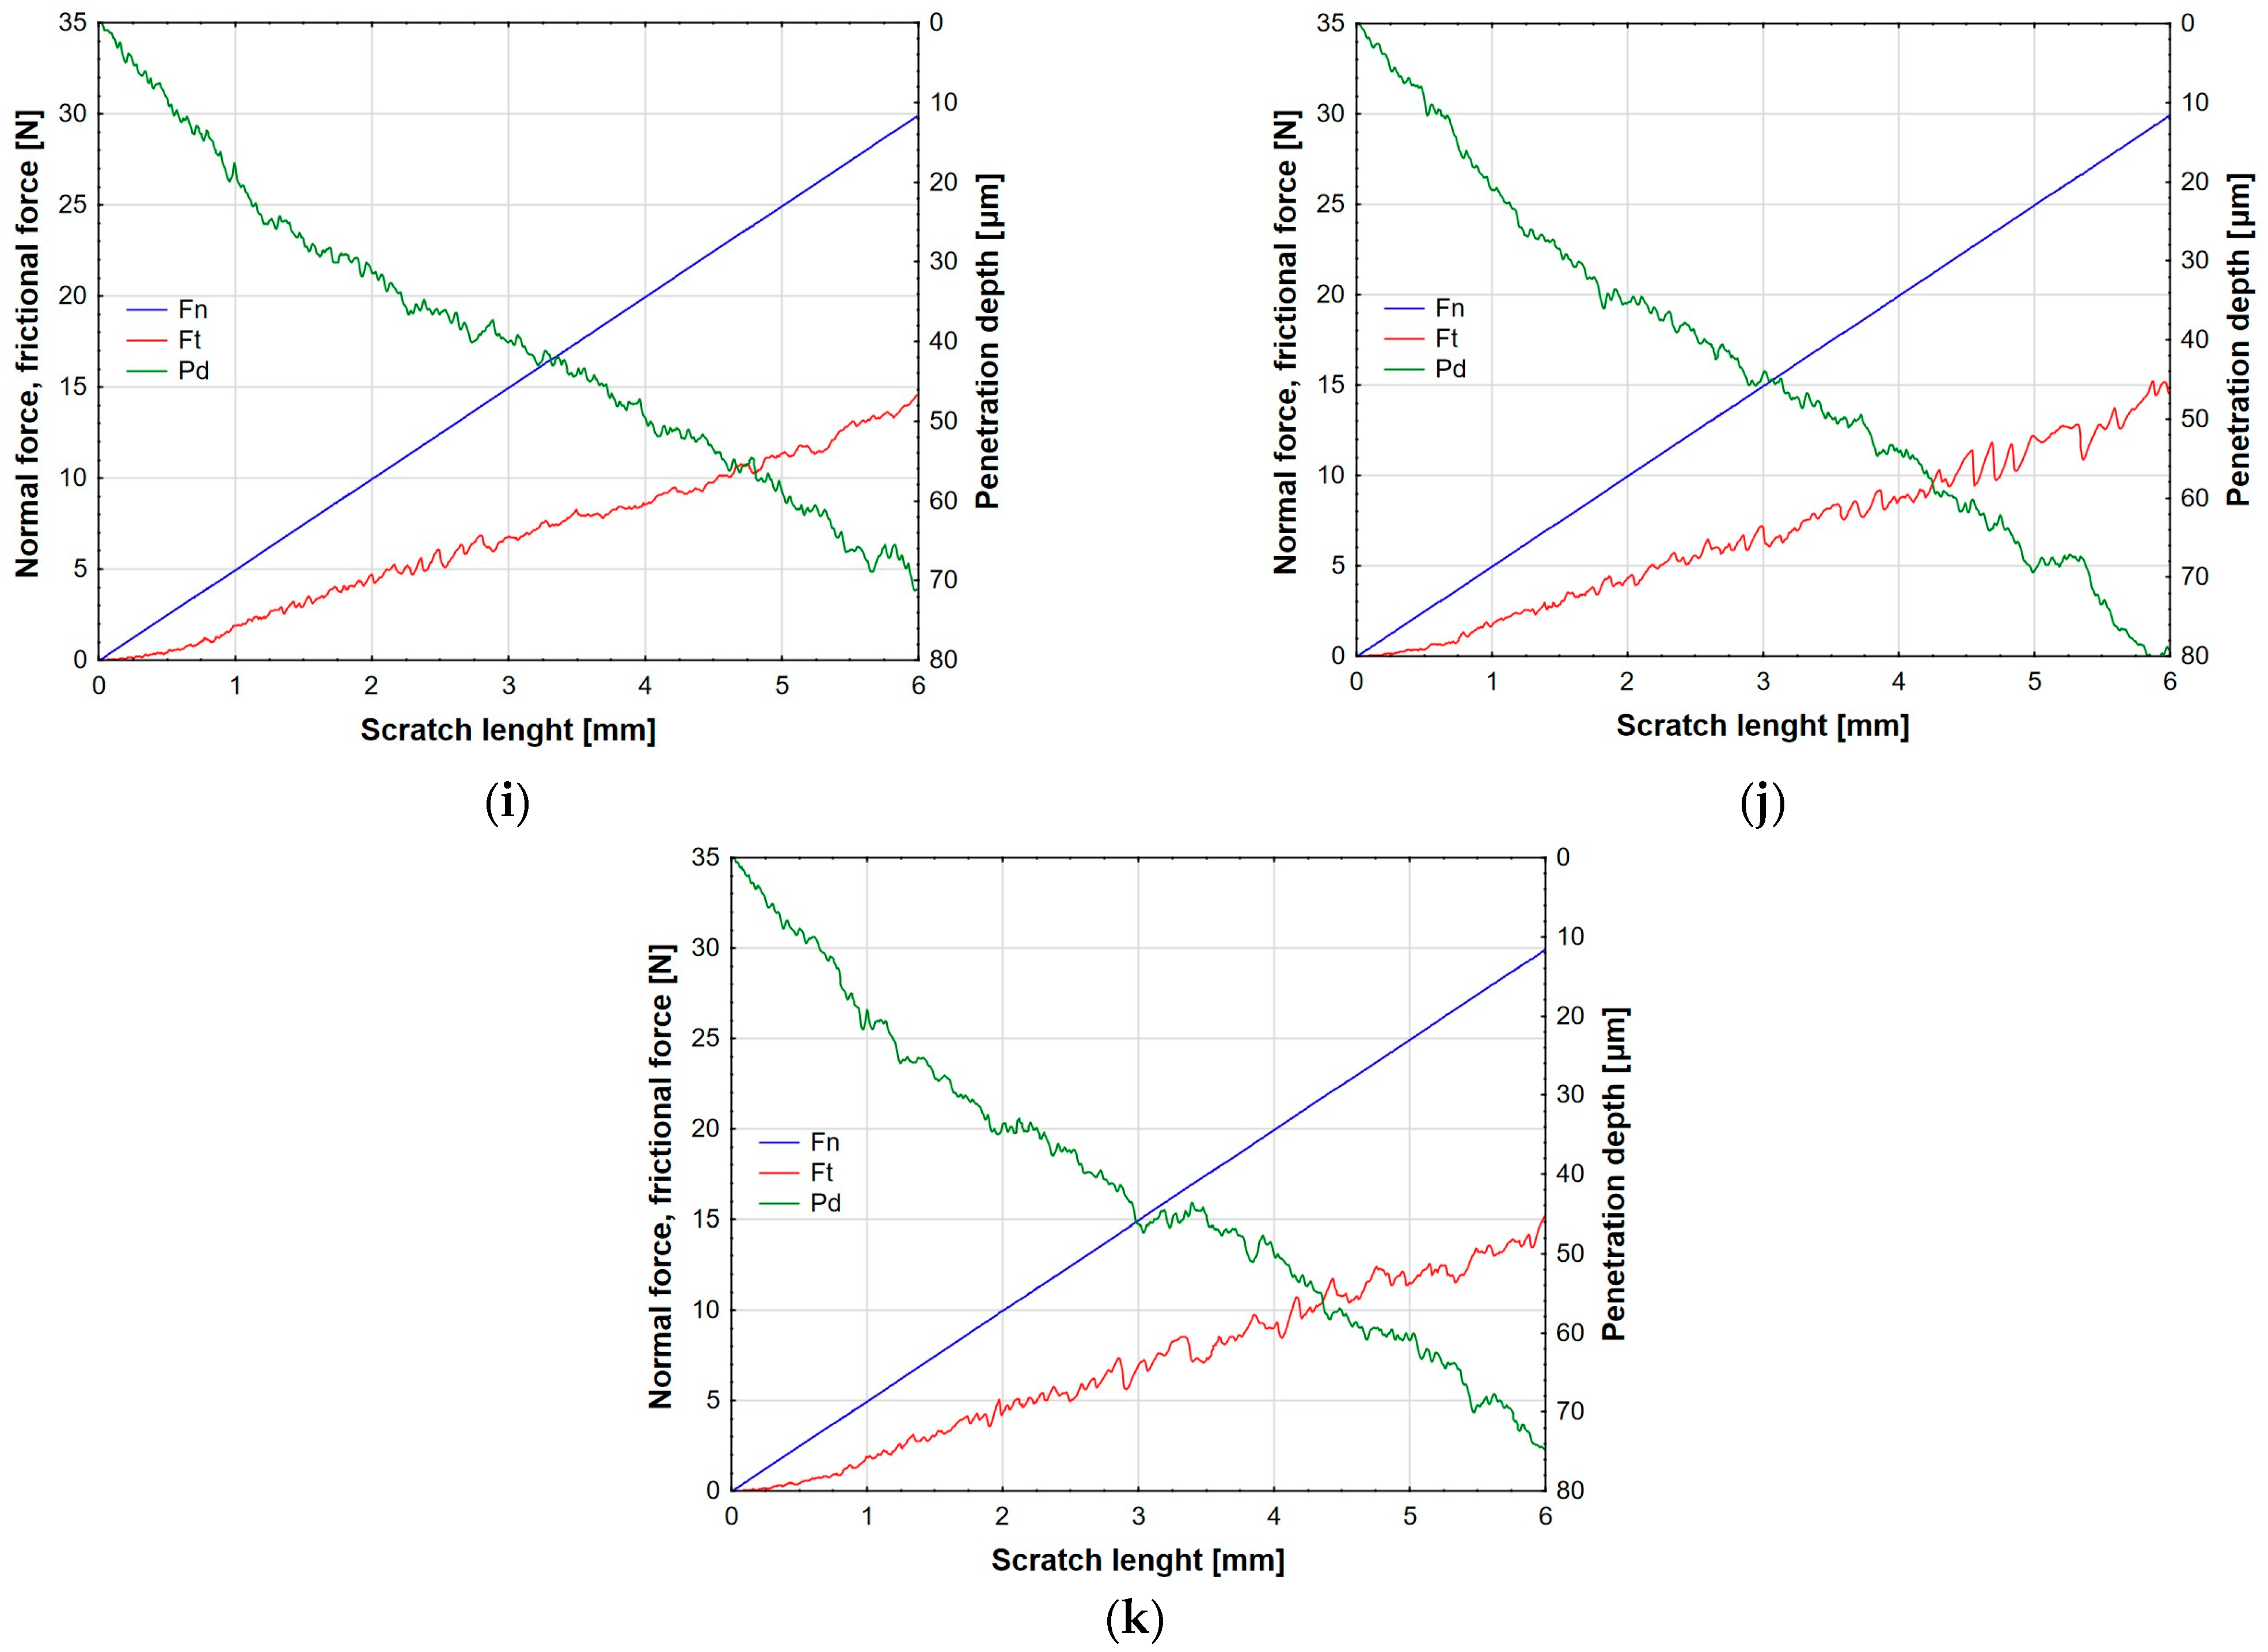
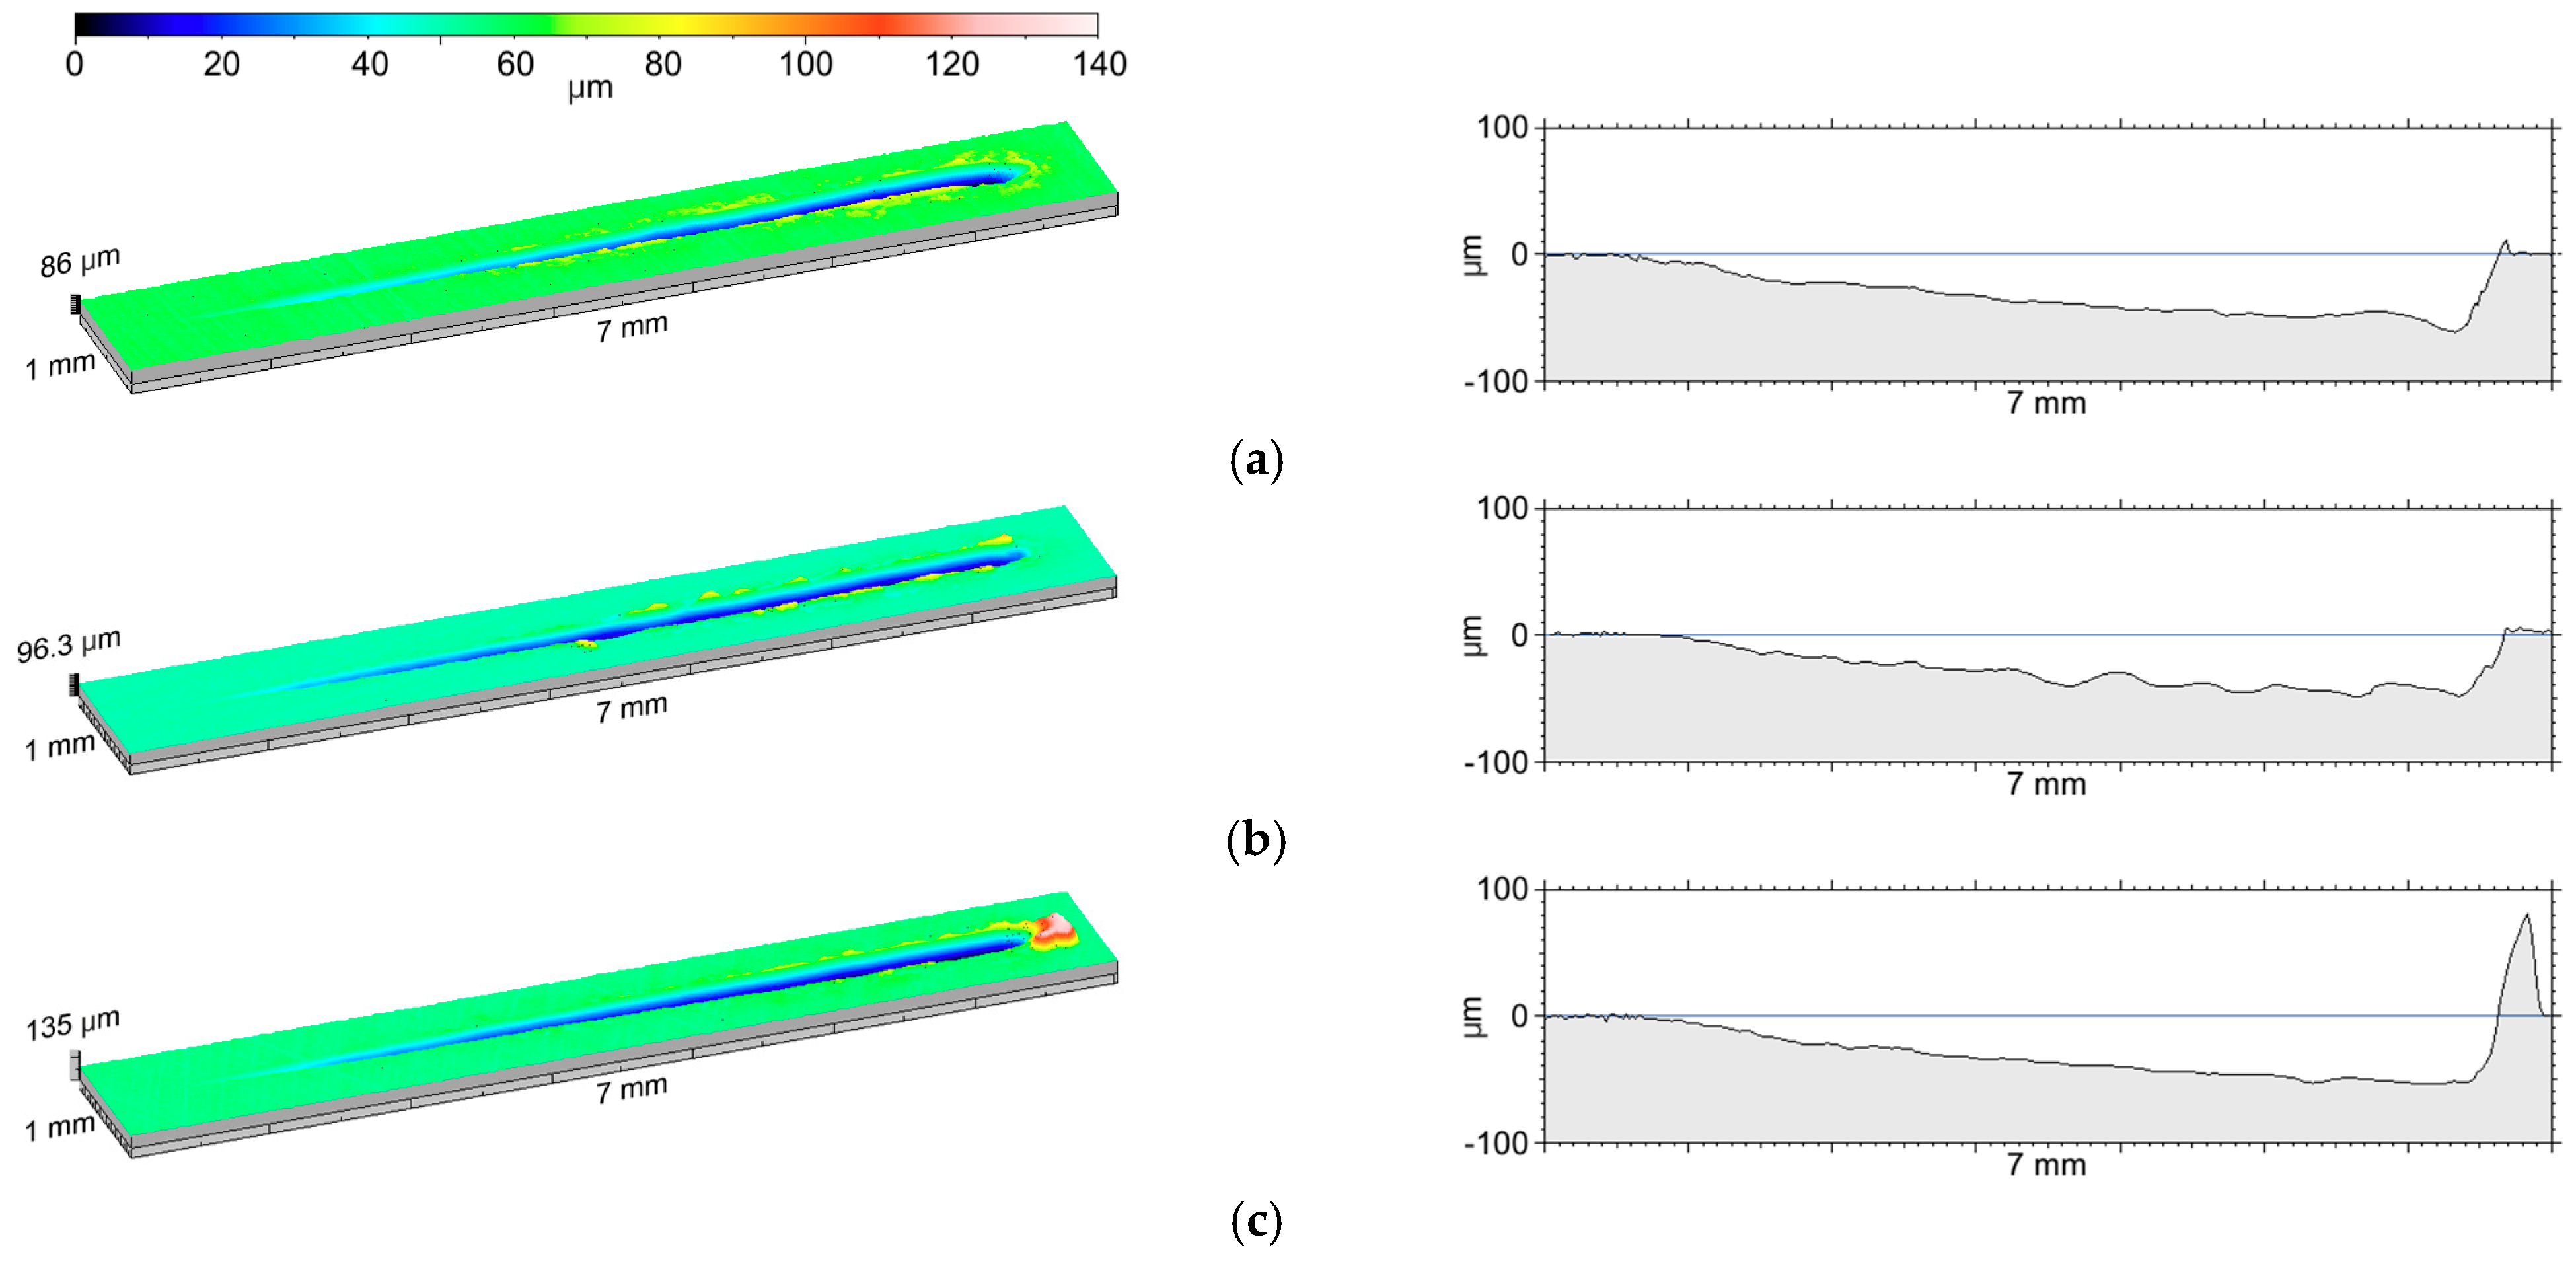
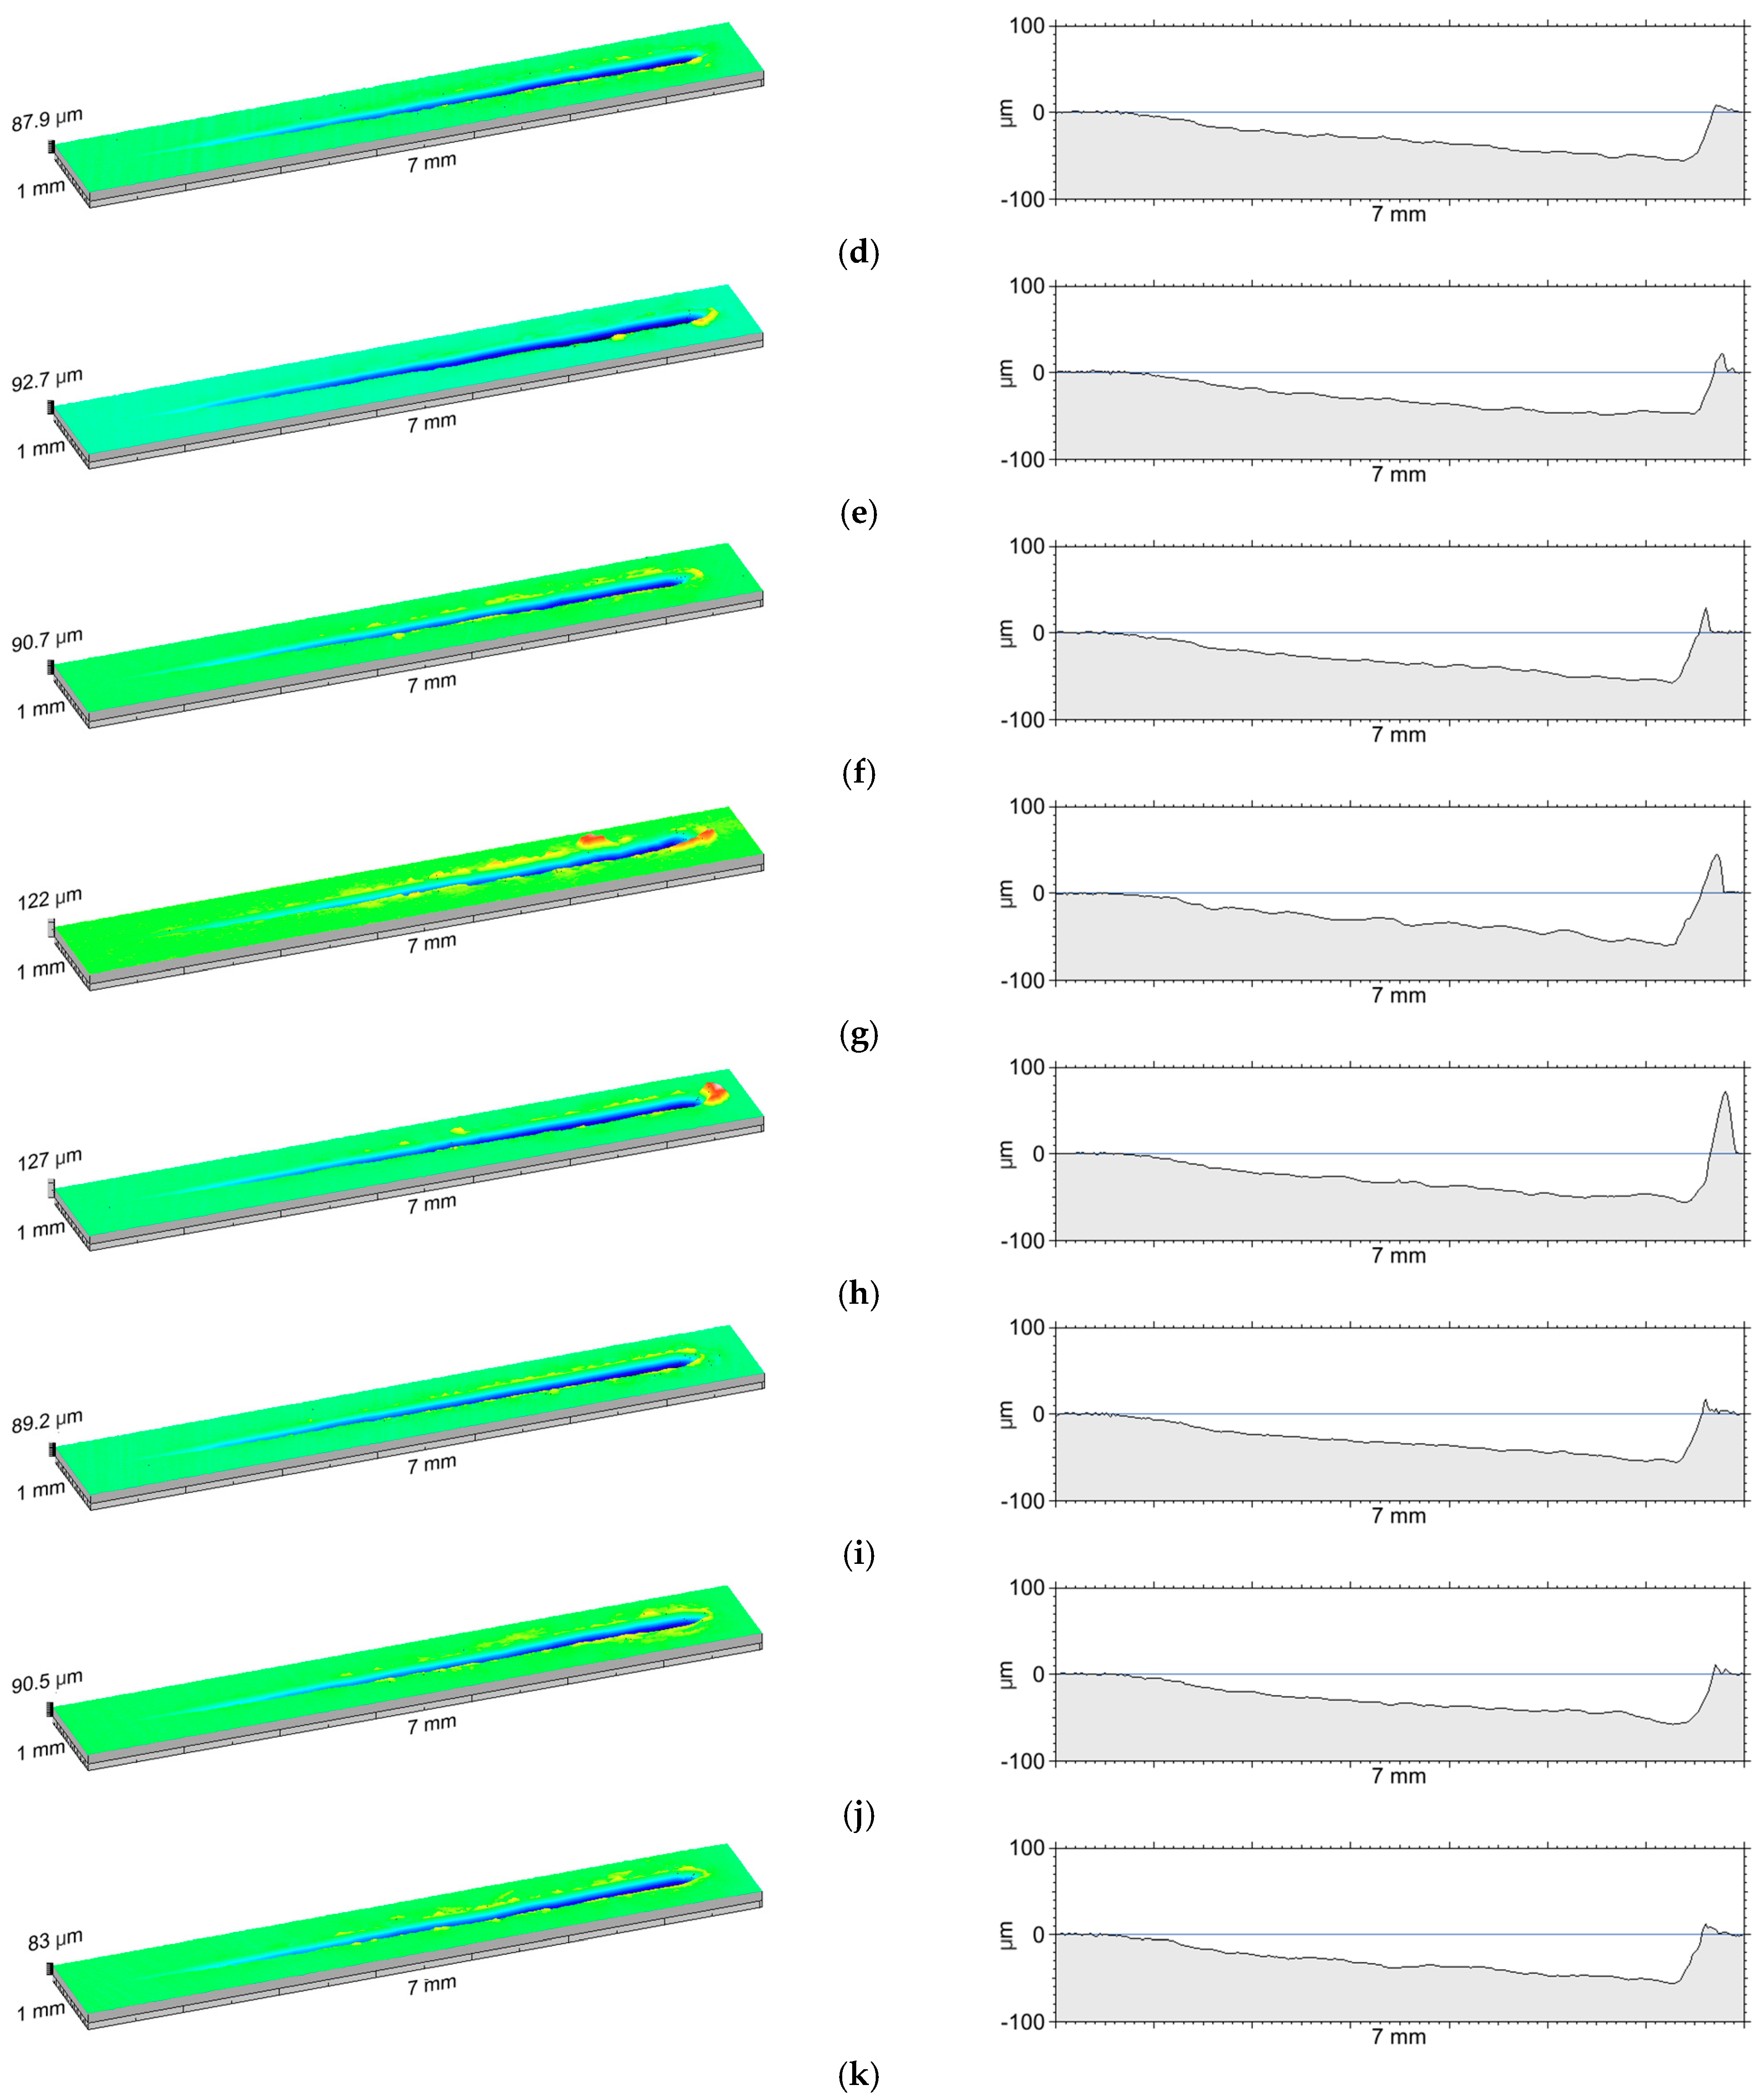
3.3. Adhesive Properties of Anodic Oxide Coatings

The analysis of Table 6, which presents the critical loads (Lc) determined for the tested coatings, provides valuable insights into the mechanical performance and stability of each sample under varying load conditions. For the critical load Lc1, the highest value is observed for sample K, with a measurement of 1.64 N and a very low standard deviation of 0.03 N, indicating consistent and reliable performance under initial loading conditions. Sample A follows with an Lc1 of 2.54 N, but it has a higher standard deviation (0.36 N), suggesting some variability in its performance. In contrast, the lowest critical load Lc1 is found in sample D (0.65 N), which also exhibits a significant standard deviation (0.41 N), indicating less reliability and potentially more susceptibility to failure under lower load conditions. For the critical load Lc2, sample K again achieves the highest value at 4.29 N, reinforcing its strong mechanical properties across different loading scenarios, supported by a low standard deviation (0.26 N). Sample B also performs well with an Lc2 of 3.34 N, showing moderate variability (0.39 N). Conversely, sample D shows the lowest Lc2 at 2.59 N, with a moderate standard deviation (0.28 N), indicating that it may not sustain higher loads effectively compared to other samples. In terms of the critical load Lc3, the highest load is again noted for sample K at 5.19 N, with a low standard deviation (0.12 N), demonstrating excellent performance and reliability under peak load conditions. Sample E follows closely with an Lc3 of 4.93 N and a relatively high standard deviation (0.22 N), indicating some variability but still a strong performance. In contrast, sample D exhibits the lowest critical load Lc3 at 4.59 N, with a standard deviation of 0.16 N, suggesting it may be less capable of withstanding peak loads compared to other samples. In summary, sample K consistently demonstrates the highest critical loads across all three measurements (Lc1, Lc2, and Lc3) and maintains low standard deviations, making it the most reliable coating in terms of load-bearing capacity. The cross-section of sample K is presented in Figure 10.
Sample A shows strong performance in Lc1 but does not maintain the same level of performance in subsequent critical loads, while sample B exhibits moderate values across Lc2 but has a notably lower Lc1. Samples C, D, and E tend to show lower critical load values, particularly sample D, which has the lowest Lc1 and Lc2 values, indicating that it may be less suitable for applications requiring a high load tolerance. Overall, sample K stands out as the best-performing coating, showing superior load-bearing capacity and consistency, while the standard deviations provide further insight into the reliability of each sample, with lower values indicating more consistent performance under load.
Figure 11 presents the response-surface model of the critical force values Lc1, Lc2, and Lc3, which are used to evaluate the resistance of the obtained coatings to various forms of damage under mechanical forces. The Lc1 value for coatings obtained at current densities of 10, 15, and 20 A/dm2 (respectively, Figure 11a–c) represents the force at which the coating begins to show initial signs of damage, such as cracks or micro-scratches. Higher Lc1 values indicate better resistance of the coating to initial damage, suggesting stronger adhesion to the substrate. The Lc2 value, defining the critical cohesive force, refers to the point at which the coating starts to crack or chip off, indicating an internal weakening of the structure. These values for coatings obtained at current densities of 10, 15, and 20 A/dm2 are shown in Figure 11d–f, respectively. The critical Lc3 force of total damage, which defines the point at which the coating undergoes complete destruction, such as delamination or complete chipping from the surface, is depicted for coatings obtained at current densities of 10, 15, and 20 A/dm2 in Figure 11g–i, respectively. The initial observation from the response-surface plots of the Lc forces indicates a similarity in the shapes for Lc1 (Figure 11a–c) obtained for coatings at current densities of 10, 15, and 20 A/dm2. Similar conclusions can be drawn from the resemblance of the response functions for Lc2 (Figure 11d–f) and Lc3 (Figure 11g–i).
All three indicators, Lc1, Lc2, and Lc3, should be analyzed together, as a large difference between them may indicate specific issues, such as good adhesion but poor cohesion. Useful for this analysis are the marginal mean plots with a 95% confidence interval, which are presented in Figure 12. According to the plot, the best adhesion to the substrate (Lc1) is exhibited by the coating obtained after 60 min, at a frequency of 50 Hz and a current density of 10 A/dm2; the weakest adhesion is shown by the coating obtained after 60 min, at a frequency of 100 Hz and a current density of 20 A/dm2. The high variability of the results (error lines) suggests that these parameters may significantly affect the stability and consistency of the coatings, which may require further investigation to optimize the process. Considering this error, in some cases, a blurring of the boundary between cohesion (Lc2) and complete removal of the coating (Lc3) is noticeable, and in one case, even between adhesion (Lc1) and cohesion (Lc2). This information also suggests that the abrasion test should be conducted under lower loads, allowing for a more precise distinction between Lc1, Lc2, and Lc3.
The parameters recorded during the scratch tests of the coatings allowed for the plotting of the characteristics of friction force and the penetration depth of the indenter under load (Figure 13). The line Fn represents the normal force of the indenter, which was increased proportionally up to a value of 30 N along the entire length of the scratch. Therefore, these characteristics are identical for all tested coatings. The curves Ft and Pd indicate the changes in friction force and the penetration depth of the indenter as a function of the scratch length. For all cases, the friction force of the indenter increases as it penetrates into the structure of the coating and substrate, which is an expected effect resulting from the increase in the normal force. The progression of these curves for all coatings takes on a nonlinear shape already at the initial stage of the test, and with increasing load, it changes to a characteristic with numerous step-like values of friction force. The initial nonlinearity of the Ft characteristics is a result of the inhomogeneity of the coating structures. The oxide coatings produced by the PEO method are characterized by significant porosity and a heterogeneous structure, with numerous surface cracks (Figure 1). This irregular structure, both in terms of pore size and their occurrence, may be the reason for the differences observed in the Ft and Pd curves. However, the studies conducted indicate that these differences are negligible. The nonlinearity occurring above 8 μm depends solely on the structure of the substrate material of the coatings.
Figure 14 shows isometric images of the coatings and substrate along with a longitudinal cross-section, taken after the scratch tests. The penetration profile of the indenter reflects the progression of the Pd curves from Figure 11.
Table 7 presents the surface roughness parameters Ra (arithmetic average roughness) and Rz (average profile height). Sample D (Ra = 0.479 µm, Rz = 2.773 µm) exhibits the highest hardness values: HIT = 5.48 GPa and EIT = 90.12 GPa, despite having a higher roughness compared to sample K. It is possible that the higher roughness of sample D contributes to its greater wear resistance and improved hardness. Moreover, the increased roughness may support hardening mechanisms resulting from the electrochemical process (PEO), which could lead to higher hardness. Sample D also shows the highest adhesion values: Lc1 = 0.65 N, Lc2 = 2.59 N, Lc3 = 4.59 N. Despite its higher roughness, this sample demonstrates very high adhesion, suggesting that increased roughness may enhance adhesion, particularly at higher levels of pressure (Lc3). Sample K (Ra = 0.389 µm, Rz = 2.299 µm) exhibits the lowest hardness values: HIT = 2.96 GPa and EIT = 55.02 GPa, which may suggest that lower surface roughness leads to lower hardness. The smooth surface of this sample may not contribute sufficiently to achieving higher mechanical resistance. However, sample K shows higher adhesion values at higher pressures: Lc1 = 1.64 N, Lc2 = 4.28 N, Lc3 = 5.19 N. Despite its lower roughness, sample K exhibits higher adhesion compared to sample D at higher pressures, suggesting that roughness is not the only factor influencing adhesion. In this case, other factors, such as material composition or the coating production process, may have a greater impact on the results.

4. Conclusions

The research demonstrated that the plasma electrolytic oxidation (PEO) process enhances the micromechanical and adhesive properties of oxide coatings on the AZ31B magnesium alloy, with key process parameters—peak current density, frequency, and duration—playing a crucial role in shaping these properties. The findings indicate that these parameters can be optimized to achieve coatings with a high hardness and Young’s modulus, rendering the coatings more resistant to deformation and mechanical stress. One example is sample D, obtained under optimized process settings, which exhibited the highest hardness and stiffness, suggesting that coatings produced under ideal conditions are particularly useful in applications requiring significant wear resistance and durability.
The analysis of adhesion and load-bearing capacity revealed that sample K demonstrated substantial stability, making it best suited to withstand high-load applications. The tests also highlight economic benefits from process optimization; using a current density of 20 A/dm2 for 30 min at a 50 Hz frequency achieved a high-hardness coating while minimizing costs and resource use. Moreover, the porous and cracked surface structures observed in PEO coatings impacted frictional force characteristics during scratch tests, indicating that further studies could deepen the understanding of the relationship between a coating’s structure and its performance.
Microhardness is most influenced by the interaction between frequency (f) and process time (t). Significant factors also include the quadratic effect of current density and the linear impact of time (t). Higher current density generally results in greater microhardness. The results suggest that both process duration and frequency can significantly impact hardness; however, these effects depend on the set current density value.
Ultimately, the research confirmed that appropriate PEO parameter settings can enhance the durability and strength of oxide coatings, which presents prospects for their industrial applications, especially in environments requiring resistance to variable loads and abrasion. The analyses also underscored the potential for further process optimizations and the importance of considering the microscopic structure of the coating when designing future applications—particularly those requiring surface uniformity and precision. The results provide a basis for developing PEO processes for magnesium alloys that enable the production of coatings with balanced mechanical and economic properties.

Author Contributions

Conceptualization, M.N.; Methodology, M.N., A.B. and S.K.; Software, M.N., J.K., A.B. and S.K.; Formal analysis, M.N., J.K. and M.B.; Writing—original draft, M.N., J.K. and M.B.; Writing—review and editing, M.N., M.B. and J.K.; Visualization, M.N., J.K., A.B. and S.K.; Supervision, M.N. All authors have read and agreed to the published version of the manuscript.

Funding

This research received no external funding.

Institutional Review Board Statement

Not applicable.

Informed Consent Statement

Not applicable.

Data Availability Statement

The data presented in this study are available upon request from the corresponding author. The data are not public due to the very large amount, but they can be made available upon request.

Conflicts of Interest

The authors declare no conflicts of interest.

References

  1. Li, R.; Liu, Q.; Zhang, R.; Li, Y.; Ma, Y.; Huo, H.; Gao, Y.; Zuo, P.; Wang, J.; Yin, G. Achieving high-energy-density magnesium/sulfur battery via a passivation-free Mg-Li alloy anode. Energy Storage Mater. 2022, 50, 380–386. [Google Scholar] [CrossRef]
  2. Sandlöbes, S.; Friák, M.; Korte-Kerzel, S.; Pei, Z.; Neugebauer, J.; Raabe, D. A rare-earth free magnesium alloy with improved intrinsic ductility. Sci. Rep. 2017, 7, 10458–10464. [Google Scholar] [CrossRef] [PubMed]
  3. Shen, L.L.; Zhang, G.R.; Venter, T.; Biesalski, M.; Etzold, B.J. Towards best practices for improving paper-based microfluidic fuel cells. Electrochim. Acta 2019, 298, 389–399. [Google Scholar] [CrossRef]
  4. Barylski, A.; Aniołek, K.; Dercz, G.; Matuła, I.; Rak, J.; Mazur, I. The Effect of Changes in the Aging Temperature Combined with Deep Cryogenic Treatment on the Structure, Phase Composition, and Micromechanical Properties of the WE43 Magnesium Alloy. Materials 2023, 16, 7447. [Google Scholar] [CrossRef]
  5. Chen, L.; Ye, T.; Wang, Y.; Zhou, D.; Suo, T.; Deng, Q.; Zhao, F.; Wang, Q. Development of mechanical properties in AZ31 magnesium alloy processed by cold dynamic extrusion. Mater. Charact. 2021, 182, 111535. [Google Scholar] [CrossRef]
  6. Liu, B.; Yang, J.; Zhang, X.; Yang, Q.; Zhang, J.; Li, X. Development and application of magnesium alloy parts for automotive OEMs: A review. J. Magnes. Alloy. 2023, 11, 15–47. [Google Scholar] [CrossRef]
  7. Witte, F. The History of Biodegradable Magnesium Implants: A Review. Acta Biomater. 2010, 6, 1680–1692. [Google Scholar] [CrossRef]
  8. Waizy, H.; Diekmann, J.; Weizbauer, A.; Reifenrath, J.; Bartsch, I.; Neubert, V.; Schavan, R.; Windhagen, H. In Vivo Study of a Biodegradable Orthopedic Screw (MgYREZr-Alloy) in a Rabbit Model for up to 12 Months. J. Biomater. Appl. 2014, 28, 667–675. [Google Scholar] [CrossRef]
  9. Golroudbary, S.R.; Makarava, I.; Repo, E.; Kraslawski, A.; Luukka, P. Magnesium Life Cycle in Automotive Industry. Procedia CIRP 2022, 105, 589–594. [Google Scholar] [CrossRef]
  10. Yerokhin, A.L.; Nie, X.; Leyland, A.; Matthews, A.; Dowey, S.J. Plasma electrolysis for surface engineering. Surf. Coat. Technol. 1999, 122, 73–93. [Google Scholar] [CrossRef]
  11. Ghasemi, A.; Raja, V.S.; Blawert, C.; Dietzel, W.; Kainer, K.U. Study of the structure and corrosion behavior of PEO coatings on AM50 magnesium alloy by electrochemical impedance spectroscopy. Surf. Coat. Technol. 2008, 202, 3513–3518. [Google Scholar] [CrossRef]
  12. Niedźwiedź, M.; Bara, M.; Korzekwa, J.; Kaptacz, S.; Sowa, M.; Olesiński, A.; Simka, W. Tribological Properties and Surface Wettability of Coatings Produced on the Mg-AZ31B Alloy by Plasma Electrolytic Oxidation. Coatings 2024, 14, 780. [Google Scholar] [CrossRef]
  13. Toulabifard, A.; Rahmati, M.; Raeissi, K.; Hakimizad, A.; Santamaria, M. The Effect of Electrolytic Solution Composition on the Structure, Corrosion, and Wear Resistance of PEO Coatings on AZ31 Magnesium Alloy. Coatings 2020, 10, 937. [Google Scholar] [CrossRef]
  14. Rehman, Z.U.; Ahn, B.-H.; Jeong, Y.S.; Song, J.I.; Koo, B.H. The influence of various additives on the properties of PEO coatings formed on AZ31 Mg Alloy. Surf. Rev. Lett. 2016, 23, 1650006. [Google Scholar] [CrossRef]
  15. Bhowmick, S.; Muhaffel, F.; Sun, G.; Cimenoglu, H.; Alpas, A.T. Role of counterfaces with DLC and N-based coatings on frictional behaviour of AZ31 magnesium alloy subjected to plasma electrolytic oxidation (PEO) process. Surf. Coat. Technol. 2020, 397, 125997. [Google Scholar] [CrossRef]
  16. Sravya, T.; Sankaranarayanan, S.; Abdulhakim, A.; Gupta, M. Mechanical properties of magnesium-rare earth alloy systems: A review. Metals 2015, 5, 1–39. [Google Scholar]
  17. Cakmak, E.; Tekin, K.C.; Malayoglu, U.; Shrestha, S. The effect of substrate composition on the electrochemical and mechanical properties of PEO coatings on Mg alloys. Surf. Coat. Technol. 2010, 204, 1305–1313. [Google Scholar] [CrossRef]
  18. Hutsaylyuk, V.; Student, M.; Posuvailo, V.; Student, O.; Hvozdets’kyi, V.; Maruschak, P.; Zakiev, V. The role of hydrogen in the formation of oxide-ceramic layers on aluminum alloys during their plasma-electrolytic oxidation. J. Mater. Res. Technol. 2021, 14, 1682–1696. [Google Scholar] [CrossRef]
  19. Gazenbiller, E.; Mansoor, S.; Konchakova, N.; Serdechnova, M.; Zheludkevich, M.L.; Blawert, C.; Höche, D. Computational damage modelling of PEO coated extruded magnesium tested in slow strain rate configuration. Surf. Coat. Technol. 2022, 446, 128758. [Google Scholar] [CrossRef]
  20. Pezzato, L.; Gennari, C.; Franceschi, M.; Brunelli, K. Influence of silicon morphology on direct current plasma electrolytic oxidation process in AlSi10Mg alloy produced with laser powder bed fusion. Sci. Rep. 2022, 12, 14329. [Google Scholar] [CrossRef]
  21. Egdio, G.D.; Tonelli, L.; Morri, A.; Boromei, I.; Shashkov, P.; Martini, C. Influence of Anodizing by Electro-Chemical Oxidation on Fatigue and Wear Resistance of the EV31A-T6 Cast Magnesium Alloy. Coatings 2023, 13, 62. [Google Scholar] [CrossRef]
  22. Durdu, S.; Bayramoğlu, S.; Demirtaş, A.; Usta, M.; Üçışık, A.H. Characterization of AZ31 Mg Alloy coated by plasma electrolytic oxidation. Vacuum 2013, 88, 130–133. [Google Scholar] [CrossRef]
  23. Lv, G.H.; Chen, H.; Li, L.; Niu, E.W.; Pang, H.; Zou, B.; Yang, S.Z. Investigation of plasma electrolytic oxidation process on AZ91D magnesium alloy. Curr. Appl. Phys. 2009, 9, 126–130. [Google Scholar] [CrossRef]
  24. Zhang, W.X.; Jiang, Z.H.; Li, G.Y.; Jiang, Q.; Lian, J.S. Electroless Ni-P/Ni-B duplex coatings for improving the hardness and the corrosion resistance of AZ91D magnesium alloy. Appl. Surf. Sci. 2008, 254, 4949–4955. [Google Scholar] [CrossRef]
  25. Lou, B.S.; Yen, C.A.; Chen, Y.Y.; Lee, J.W. Effects of processing parameters on the adhesion and corrosion resistance of oxide coatings grown by plasma electrolytic oxidation on AZ31 magnesium alloys. J. Mater. Res. Technol. 2021, 10, 1355–1371. [Google Scholar] [CrossRef]
  26. Pietraszek, J. Response surface methodology at irregular grids based on Voronoi scheme with neural network approximator. In Neural Networks and Soft Computing, Proceedings of the 6th International Conference on Neural Networks and Soft Computing, Zakopane, Poland, 11–15 June 2002; Physica: Heidelberg, Germany, 2003; pp. 250–255. [Google Scholar]
  27. Pietraszek, J.; Goroshko, A. The Heuristic Approach to the Selection of Experimental Design, Model and Valid Pre-Processing Transformation of DoE Outcome. Adv. Mater. Res. 2014, 874, 145–149. [Google Scholar] [CrossRef]
  28. ISO 14577-4; Metallic Materials—Instrumented Indentation Test for Hardness and Materials Parameters—Part 4: Test Method for Metallic and Non-Metallic Coatings. ISO: Geneva, Switzerland, 2016.
  29. Oliver, W.C.; Pharr, G.M. An improved technique for determining hardness and elastic modulus using load and displacement sensing indentation experiments. J. Mater. Res. 1992, 7, 1564–1583. [Google Scholar] [CrossRef]
  30. ISO 19252:2008; Plastics—Determination of Scratch Properties. ISO: Geneva, Switzerland, 2008.
  31. ISO 20502:2005; Fine Ceramics (Advanced Ceramics, Advanced Technical Ceramics)—Determination of Adhesion of Ceramic Coatings by Scratch Testing. ISO: Geneva, Switzerland, 2005.
  32. ASTM C1624-22(2022); Standard Test Method for Adhesion Strength and Mechanical Failure Modes of Ceramic Coatings by Quantitative Single Point Scratch Testing. ASTM International: West Conshohocken, PA, USA, 2022.
  33. ASTM D7027-20(2020); Standard Test Method for Evaluation of Scratch Resistance of Polymeric Coatings and Plastics Using an Instrumented Scratch Machine. ASTM International: West Conshohocken, PA, USA, 2020.
Figure 1. Images SEM of an example oxide coating for (a) the surface morphology and (b) a cross-section (the red square marks the site of EDS analysis).
Coatings 14 01446 g001
Figure 2. SEM image from the cross-section at x1.5k magnification for sample D.
Coatings 14 01446 g002
Figure 3. Pareto chart of absolute values of standardized effects affecting the microhardness.
Coatings 14 01446 g003
Figure 4. Response-surface models of microhardness for samples produced at a peak current density of (a) 10 A/dm2, (b) 15 A/dm2, (c) 20 A/dm2.
Coatings 14 01446 g004
Figure 5. Plot of marginal means and confidence interval (95%) for the microhardness.
Coatings 14 01446 g005
Figure 6. Pareto chart of absolute values of standardized effects affecting the Young’s modulus EIT.
Coatings 14 01446 g006
Figure 7. Response-surface models of EIT for samples produced at a peak current density of (a) 10 A/dm2, (b) 15 A/dm2, (c) 20 A/dm2.
Coatings 14 01446 g007
Figure 8. Plot of marginal means and confidence interval (95%) for the Young’s modulus EIT.
Coatings 14 01446 g008
Figure 9. Charts of the correlation coefficient between the microhardness HIT and the Young’s module EIT.
Coatings 14 01446 g009
Figure 10. SEM image from the cross-section at x1.5k magnification for sample K.
Coatings 14 01446 g010
Figure 11. Response-surface models of EIT for samples produced at a peak current density of Lc1 at (a) 10 A/dm2, (b) 15 A/dm2, (c) 20 A/dm2; Lc2at: (d) 10 A/dm2, (e) 15 A/dm2, (f) 20 A/dm2; Lc3 at: (g) 10 A/dm2, (h) 15 A/dm2, (i) 20 A/dm2.
Coatings 14 01446 g011aCoatings 14 01446 g011b
Figure 12. Plot of marginal means and confidence interval (95%) for the Lc: (a) 10 A/dm2, (b) 15 A/dm2, (c) 20 A/dm2.
Coatings 14 01446 g012aCoatings 14 01446 g012b
Figure 13. Characteristics of scratch test parameters for samples: (ak); Fn—normal force, Ft—frictional force, Pd—penetration depth.
Coatings 14 01446 g013aCoatings 14 01446 g013bCoatings 14 01446 g013c
Figure 14. Isometric images after scratch tests of coatings and substrates along with longitudinal sections for the samples: (ak).
Coatings 14 01446 g014aCoatings 14 01446 g014b
Table 1. Hartley’s test plan [12].
SampleControlled Factors
On a Natural ScaleOn a Standard Scale
Peak Current Density
jpeak (A/dm2)
Frequency
f (Hz)
Process Time
t (min)
×1×2×3
A105060−1−11
B2050301−1−1
C1010030−11−1
D2010060111
E107545−100
F207545100
G1550450−10
H1510045010
I15753000−1
J157560001
K157545000
Table 2. Instantaneous power values (P) and how much energy is consumed in one hour (W) during the PEO process.
SampleInstantaneous Power
P
Energy Consumed
W
[W][Wh]
A51.2551.25
B63.7931.89
C26.6113.31
D34.7434.74
E43.2132.41
F66.4449.83
G39.9729.98
H42.2831.71
I60.5330.27
J31.8731.87
K41.0530.79
Table 3. The atomic chemical composition of the coating from Figure 1b (expressed in %).
MgSiOAlNa
49.7526.3818.103.521.09
Table 4. List of the thickness of oxide coatings produced in the oxidation process [12].
SampleOxide Layers Thickness
d (μm)
Standard Deviation (μm)
A8.490.23
B8.460.32
C8.300.37
D8.250.49
E7.960.53
F8.850.48
G8.340.50
H7.820.49
I8.210.42
J8.070.44
K8.360.67
Table 5. Measuring the hardness (HIT) and Young’s modulus (EIT).
SampleHIT (GPa)Standard
Deviation (GPa)
EIT (GPa)Standard
Deviation (GPa)
A2.710.3262.1619.10
B4.960.5686.826.28
C2.740.5675.499.49
D5.480.7790.129.89
E4.850.9084.7014.81
F4.930.4479.6612.86
G4.130.5477.3810.54
H3.810.7774.3219.64
I4.830.6467.919.265
J3.640.6069.8114.04
K2.960.9855.0220.21
Table 6. Critical loads determined for the tested coatings.
SampleLc1
(N)
Standard
Deviation (N)
Lc2
(N)
Standard
Deviation (N)
Lc3
(N)
Standard
Deviation (N)
A2.540.363.240.393.830.31
B1.280.153.340.394.010.23
C1.190.063.350.204.450.15
D0.650.412.590.284.590.16
E0.920.442.720.514.930.22
F1.420.453.240.854.930.45
G1.500.332.890.244.330.31
H0.950.633.501.004.990.14
I1.440.193.540.374.480.39
J1.250.262.780.224.260.38
K1.640.034.280.265.190.12
Table 7. Values for the roughness parameters Ra and Rz.
SampleRa
(µm)
Standard
Deviation (µm)
Rz
(µm)
Standard
Deviation (µm)
A0.4200.0252.4600.164
B0.4470.0242.4920.105
C0.3880.0472.3320.232
D0.4790.0692.7730.311
E0.3960.0562.3630.335
F0.4800.0642.7800.321
G0.4440.0582.5450.270
H0.3840.0512.3000.241
I0.4600.0382.6480.231
J0.4700.0482.7060.241
K0.3890.0602.2990.278
Disclaimer/Publisher’s Note: The statements, opinions and data contained in all publications are solely those of the individual author(s) and contributor(s) and not of MDPI and/or the editor(s). MDPI and/or the editor(s) disclaim responsibility for any injury to people or property resulting from any ideas, methods, instructions or products referred to in the content.

