Article

ZnO Matrices as a Platform for Tunable Localized Surface Plasmon Resonances of Silver Nanoparticles

by
Dimitrios Ntemogiannis
1,
Maria Tsarmpopoulou
1,
Alkeos Stamatelatos
1,†,
Spyridon Grammatikopoulos
2,*,
Vagelis Karoutsos
1,
Dimitrios I. Anyfantis
1,
Alexandros Barnasas
1,
Vasilis Alexopoulos
1,
Konstantinos Giantzelidis
1,
Emanuel A. Ndoj
1,
Mihail Sigalas
1 and
Panagiotis Poulopoulos
1,*
1
Materials Science Department, University of Patras, 26504 Patras, Greece
2
Department of Mechanical Engineering, University of Peloponnese, M. Alexandrou 1, 26334 Patras, Greece
*
Authors to whom correspondence should be addressed.
Present address: Department of Physics, University of Warwick, Coventry CV4 7AL, UK.
Coatings 2024, 14(1), 69; https://doi.org/10.3390/coatings14010069
Submission received: 13 November 2023 / Revised: 24 December 2023 / Accepted: 31 December 2023 / Published: 3 January 2024
(This article belongs to the Section Thin Films)

Abstract

:
In this study, the localized surface plasmon resonances (LSPRs) of Ag nanoparticles (NPs) embedded in ZnO dielectric matrices were studied. Initially, continuous Ag thin films were deposited on Corning glass substrates via magnetron sputtering, followed by post annealing, resulting in the formation of self-assembled nanoparticles. In some cases, a heated substrate holder was employed to induce NP formation during the deposition. The morphology of nanoparticles was studied using atomic force microscopy (AFM). Ultraviolet–visible spectroscopy (UV-Vis) probed the LSPRs. Subsequently, a 70 nm thick ZnO layer was deposited on top of the Ag thin films. For the Ag films, LSPR characteristics were found to depend on the initial film thickness. The ZnO capping layer induced an intense red shift, suggesting its potential as a mechanism for tailoring LSPRs. Lastly, theoretical calculations with the rigorous coupled-wave analysis (RCWA) method were carried out for comparison with the experimental results.

1. Introduction

In the field of nanoscience and nanotechnology, manipulating light–matter interactions at the nanoscale represents a key challenge that attracts significant scientific interest, defining a dynamic and evolving research area. Noble metallic nanoparticles (NPs), grown with various methods such as lithography [1], laser ablation [2], chemical synthesis [3,4], sputtering [5,6,7,8] green synthesis [9] and more [6,7,8,10,11,12], have become versatile building blocks for diverse applications in sensing, optoelectronics, photovoltaics, catalysis, photothermal therapy and surface-enhanced Raman scattering (SERS) [13,14,15,16,17,18,19,20] thanks to their unique optical properties, particularly their ability to exhibit localized surface plasmon resonances (LSPRs). LSPRs are collective charge density oscillations excited on the NPs’ surfaces when subjected to an electromagnetic field, resulting in the confinement of light and substantial enhancement of the local electric field. The precise control of LSPRs is of great importance and can be achieved by tuning the structural parameters of the nanostructures such as the size, shape, composition and distribution and the refractive index of their surrounding dielectric environment [6,7,10,13]. This can lead to cutting-edge functional materials for sensing applications, optoelectronics, energy harvesting and others, as described in [6,7,8,10,12,13,14,15,16,17,18,19] and references therein.
The incorporation of nanostructures into dielectric or semiconducting thin films can lead to the emergence of composite materials with new enhanced properties compared to those of individual components [21]. Particularly, as we mention below, much attention has been paid to the employment of noble metal–semiconductor nanocomposites, with silver (Ag) and zinc oxide (ZnO) being one of the most-studied noble metal–semiconductor material combinations due to the remarkable properties of its constituent materials.
ZnO is a direct wide-band-gap semiconductor with a 3.37 eV band gap at room temperature. It possesses unique optical and electrical properties, featuring high electron mobility and high exciton binding energy (60 meV). ZnO also exhibits piezoelectric, antibacterial and anticancer properties, high catalytic performance and morphological flexibility while being chemically stable and ecologically benign [22,23]. Due to its remarkable properties, it can find applications in solar cells, LEDs, gas sensors, photocatalysis, UV lasers and optoelectronic components. Recent advances in the field have led to the synthesis of ZnO nanostructures and thin films using numerous methods, including the hydrothermal method, sol-gel and green synthesis, sputtering, pulsed laser deposition, chemical vapor deposition, sonochemical synthesis and others, as reported in [22,24,25].
Furthermore, Ag is an ideal candidate for integration with ZnO, due to its low optical losses, stability in nanoparticle form, high electrical conductivity, intense LSRP absorption in the visible spectrum, cost-effectiveness (compared to other noble metals) and non-toxic nature [7,23]. The integration of Ag nanostructures in ZnO, which exploits the surface plasmon resonance phenomenon induced by them, has been widely employed to enhance the intrinsic properties of ZnO. Numerous studies have reported that Ag/ZnO nanocomposites demonstrate improved optical and electronic properties, suggesting their potential for use in photocatalysis [23,26,27,28,29,30], sensing [31,32,33,34], solar cells [35,36], optoelectronics [26,37,38,39] and antimicrobial [40,41], antibacterial [42] and anticancer [43,44] applications. Clearly, diverse fabrication methods apply to this nanocomposite, as previously outlined in the references for net ZnO and noble metallic NP synthesis, as well as described in [23,26,27,28,29,30,31,32,33,34,35,36,37,38,39,40,41,42,43,44].
Regarding the plasmonic properties of the Ag/ZnO nanocomposite, ZnO, due to its high refractive index, can induce substantial shifts and amplification of the Ag NPs’ plasmonic resonances. This system can exhibit intense and tailored LPSRs across a wide spectral range by adjusting its NPs’ size and geometry as well as the overall material composition. Since both materials are abundant and affordable, Ag/ZnO nanocomposites provide an appealing option for advanced optoelectronic, sensing, energy harvesting and photocatalytic applications, among others. To our knowledge, only a limited number of studies have focused on investigating the plasmonic features of this system, particularly focusing on the study of plasmon resonances of ZnO/Ag, Ag/ZnO bilayers and ZnO/Ag/ZnO multilayers [45], while Roy et al. [46] examined the plasmon resonances of silver nanoparticles embedded in ZnO matrices after sputtering deposition at substrate temperatures ranging from 233K to 273K.
On the contrary, most studies on the Ag/ZnO nanocomposite emphasized the enhancement of photocatalytic, sensing, antimicrobial and optoelectronic properties of ZnO after doping with Ag nanostructures followed by an evaluation of its performance.
This study examines the Ag/ZnO nanocomposite from a fundamental science perspective, concentrating on the correlation between structural and optical properties as well as the potential manipulation of the plasmonic characteristics of ZnO-covered Ag NPs. More specifically, we delve into the plasmonic behavior of a nanocomposite thin-film system consisting of self-assembled silver nanoparticles inside ZnO matrices. Our main objective is to investigate how the ZnO capping layer matrix influences the LSPR characteristics of the coated Ag NPs and evaluate its potential as a tuning mechanism. Specifically, we focus on how the presence of the ZnO capping layer affects LSPRs obtained from silver nanoparticles of different diameters and distributions, utilizing two growth methods and complementary theoretical calculations.
Ag NPs were grown via magnetron sputtering either on heated glass substrates or using post-deposition annealing of Ag thin films in air. Subsequently, a ~70 nm ZnO layer was sputter-deposited on top of them. The morphology of the nanocomposite films was studied via AFM and SEM microscopy as well as EDS spectroscopy. Notably, UV-Vis spectra revealed that the ZnO capping layer (matrix) systematically induced a red shift in all LSPRs obtained, while also affecting their amplitude. This showed that the ZnO capping layers can be effectively used as a tuning “tool” to obtain pronounced LPSRs in the visible spectrum, useful for applications such as photocatalysis, solar cells, LEDs and more. Finally, we employed rigorous coupled-wave analysis (RCWA) theoretical calculations to further investigate the influence of the ZnO environment on the plasmonic behavior of Ag NPs and facilitate the interpretation of the experimental results.

2. Materials and Methods

2.1. Experimental Details

Ultrathin Ag films with thicknesses between 6 and 33 nm were deposited via direct-current (DC) and radiofrequency (RF) magnetron sputtering on Corning glass at 440 °C and room temperature, respectively. A sputter-coater device (modified Balzers Union model SCD040) with a heated substrate holder was utilized for the DC magnetron sputtering. The base pressure of the chamber was 1.5 × 10⁻² mbar, achieved using a dual-stage rotation pump. During deposition, argon was inserted in the chamber, increasing the total pressure to 5 × 10⁻² mbar. An Ag #4 film was deposited at 440 °C via DC magnetron sputtering. The rest of the Ag samples, the net ZnO film and the ZnO capping layers were deposited by means of RF magnetron sputtering in a custom-made high-vacuum chamber (base pressure 1 × 10⁻⁶ mbar).
Films deposited at 440 °C were directly self-assembled to NPs. In contrast, films deposited at room temperature grew continuously. Therefore, when referring to the thickness of a self-organized film, we reference the thickness of a continuous Ag film that would form under the same deposition time at room temperature. Concerning the Ag films deposited at room temperature, nanoparticles were grown using thermal annealing in a muffle furnace (model Linn 63 Elektronik VMK 22) in air at 440 °C. Subsequently, all the nanostructured Ag films were coated with a 70 nm ZnO layer.
To determine the thickness of continuous films, we utilized atomic force microscopy (AFM) images of the profile of a narrow scratch made intentionally on an as-deposited Ag film surface [47]. The scratch thickness was measured at 33 nm. Subsequently, we calibrated the thickness of other samples using the deposition time. Figure 1a shows typical absorbance spectra of the continuous Ag films in the as-deposited state. At this point, we have to mention that for all absorbance spectra, the wavelength (nm) has been converted to electron volts (eV). Figure 1b,c illustrate the surface morphology of the film used for thickness evaluation and the scratch area along with its profile, respectively. Finally, in Figure 1d, we present the nanoparticle diameter distribution of this film. For the determination of the NP size distribution, we followed the logarithmic normal (log-norm) distribution function.
Table 1 summarizes the films deposited and their associated thermal processing and NP growth method to enhance the comprehension of the experimental procedure.
The optical properties of both ZnO-coated and non-coated films were investigated via ultraviolet–visible (UV–Vis) spectroscopy using the Perkin Elmer λ-35 spectrometer instrument functioning at room temperature in the wavelength range of 200–1100 nm.
Their surface morphology was studied via atomic force microscopy (AFM), utilizing a multimode microscope with a Nanoscope IIIa controller and a 120 µm × 120 µm magnet-free scanner (Model AS-130 VMF) developed by Digital Instruments (Chapel Hill, NC, USA). The microscope was operated in the non-contact (tapping) mode. Finally, two ZnO-coated and two non-coated nanostructured Ag films were studied with a scanning electron microscope (SEM) (model Zeiss EVOMA 10, Jena, Germany) working in the energy-dispersive X-ray analysis (EDS) mode.

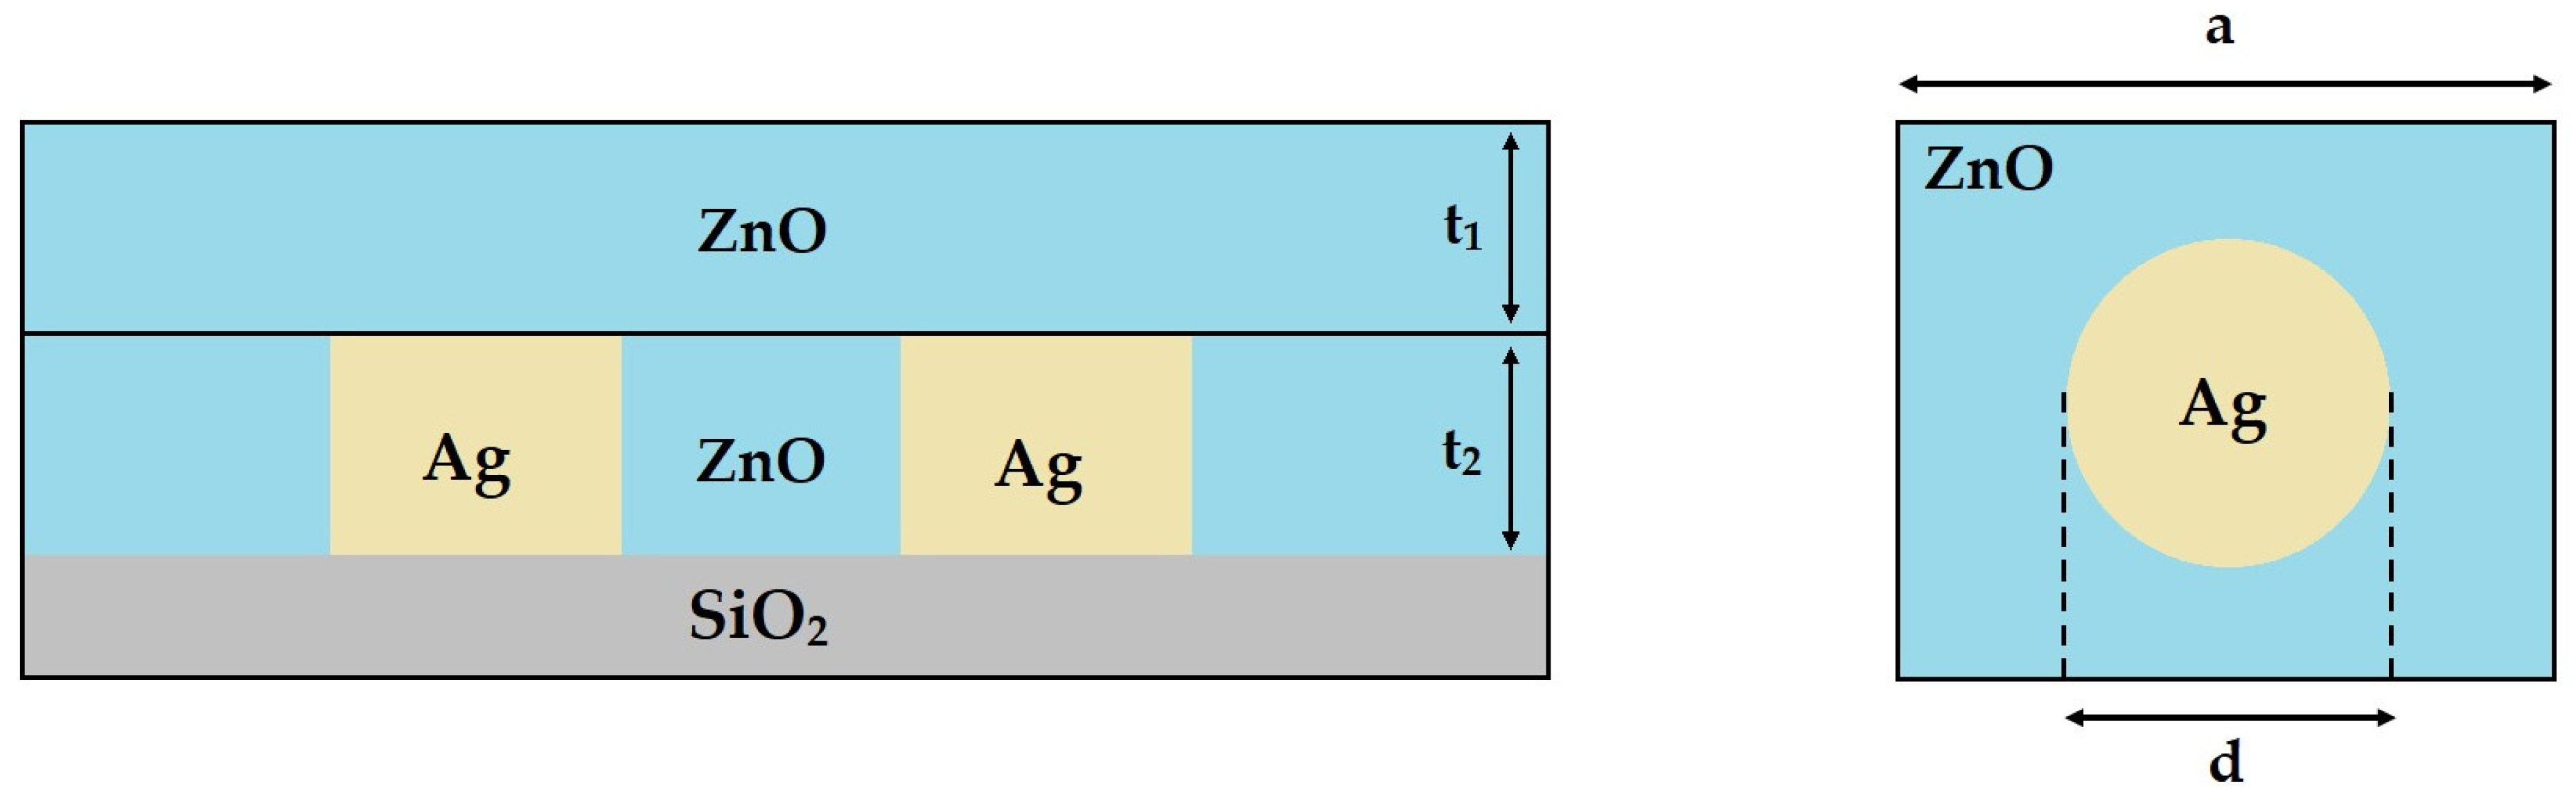
2.2. Theoretical Model

Rigorous coupled-wave analysis (RCWA) is an analytical method for interpreting the diffraction of an electromagnetic plane wave incident between two materials [48]. It is a fast computational method that utilizes the Fourier series to partition the examined areas into layers, simplifying all calculation processes. The RCWA theory is employed to study cubes and cylinders that have the same cross-section along the z-axis. Within each layer, the relative permittivity has a two-dimensional periodicity. Therefore, it can be expanded in the following Fourier series.
ε ( x , y , z ) = ε ( x + Λ , y + Λ , z ) = p , q ε p q ( z ) e i ( p K x x + q K y y )
where Λ is the grating period, εpq the Fourier component of grating permittivity Κx = Κy = 2 π/Λ and i = (−1)1/2
The electric field of the incoming region can be described with the next formula.
E I = e i ( k x i x + k y i y + k z i z ) + n m R n m e i ( k x n x + k y m y + k z n m i z )
where kxn = kx0 + nKx, kyn = ky0 + mKy, kznmi = √(k2εi − k2xn − k2ym), kx0 and ky0 are the x and y components of the incident plane wave, respectively, k = 2π/λ, and Rnm is the n, m order backward-diffracted wave.
The electric field in each layer is:
E I I = n m S n m ( z ) e i ( k x n x + k y m y + k z n m i z )
where Snm(z) are the space harmonics field amplitudes.
The electric field in the outgoing region is:
E I I I = n m T n m e i ( k x n x + k y m y + k z n m o ( z d ) )
where kznmo = √(k2εo − k2xn − k2ym), and T n m is the n, m order forward diffracted wave.
Keeping n = N and m = M harmonics in the Fourier expansion and the continuity of the tangential electric 165 and magnetic fields at the boundaries z = 0 and z = d, then a 4NM system of equations emerges, leading to the solution of the Rnm and Tnm values.
For multilayer structures with layers that are non-uniform and periodic in the transverse direction, RCWA requires less computational time, outperforming other methods such as finite difference time domain (FDTD) and finite element (FE) [49].

3. Results

3.1. Experimental

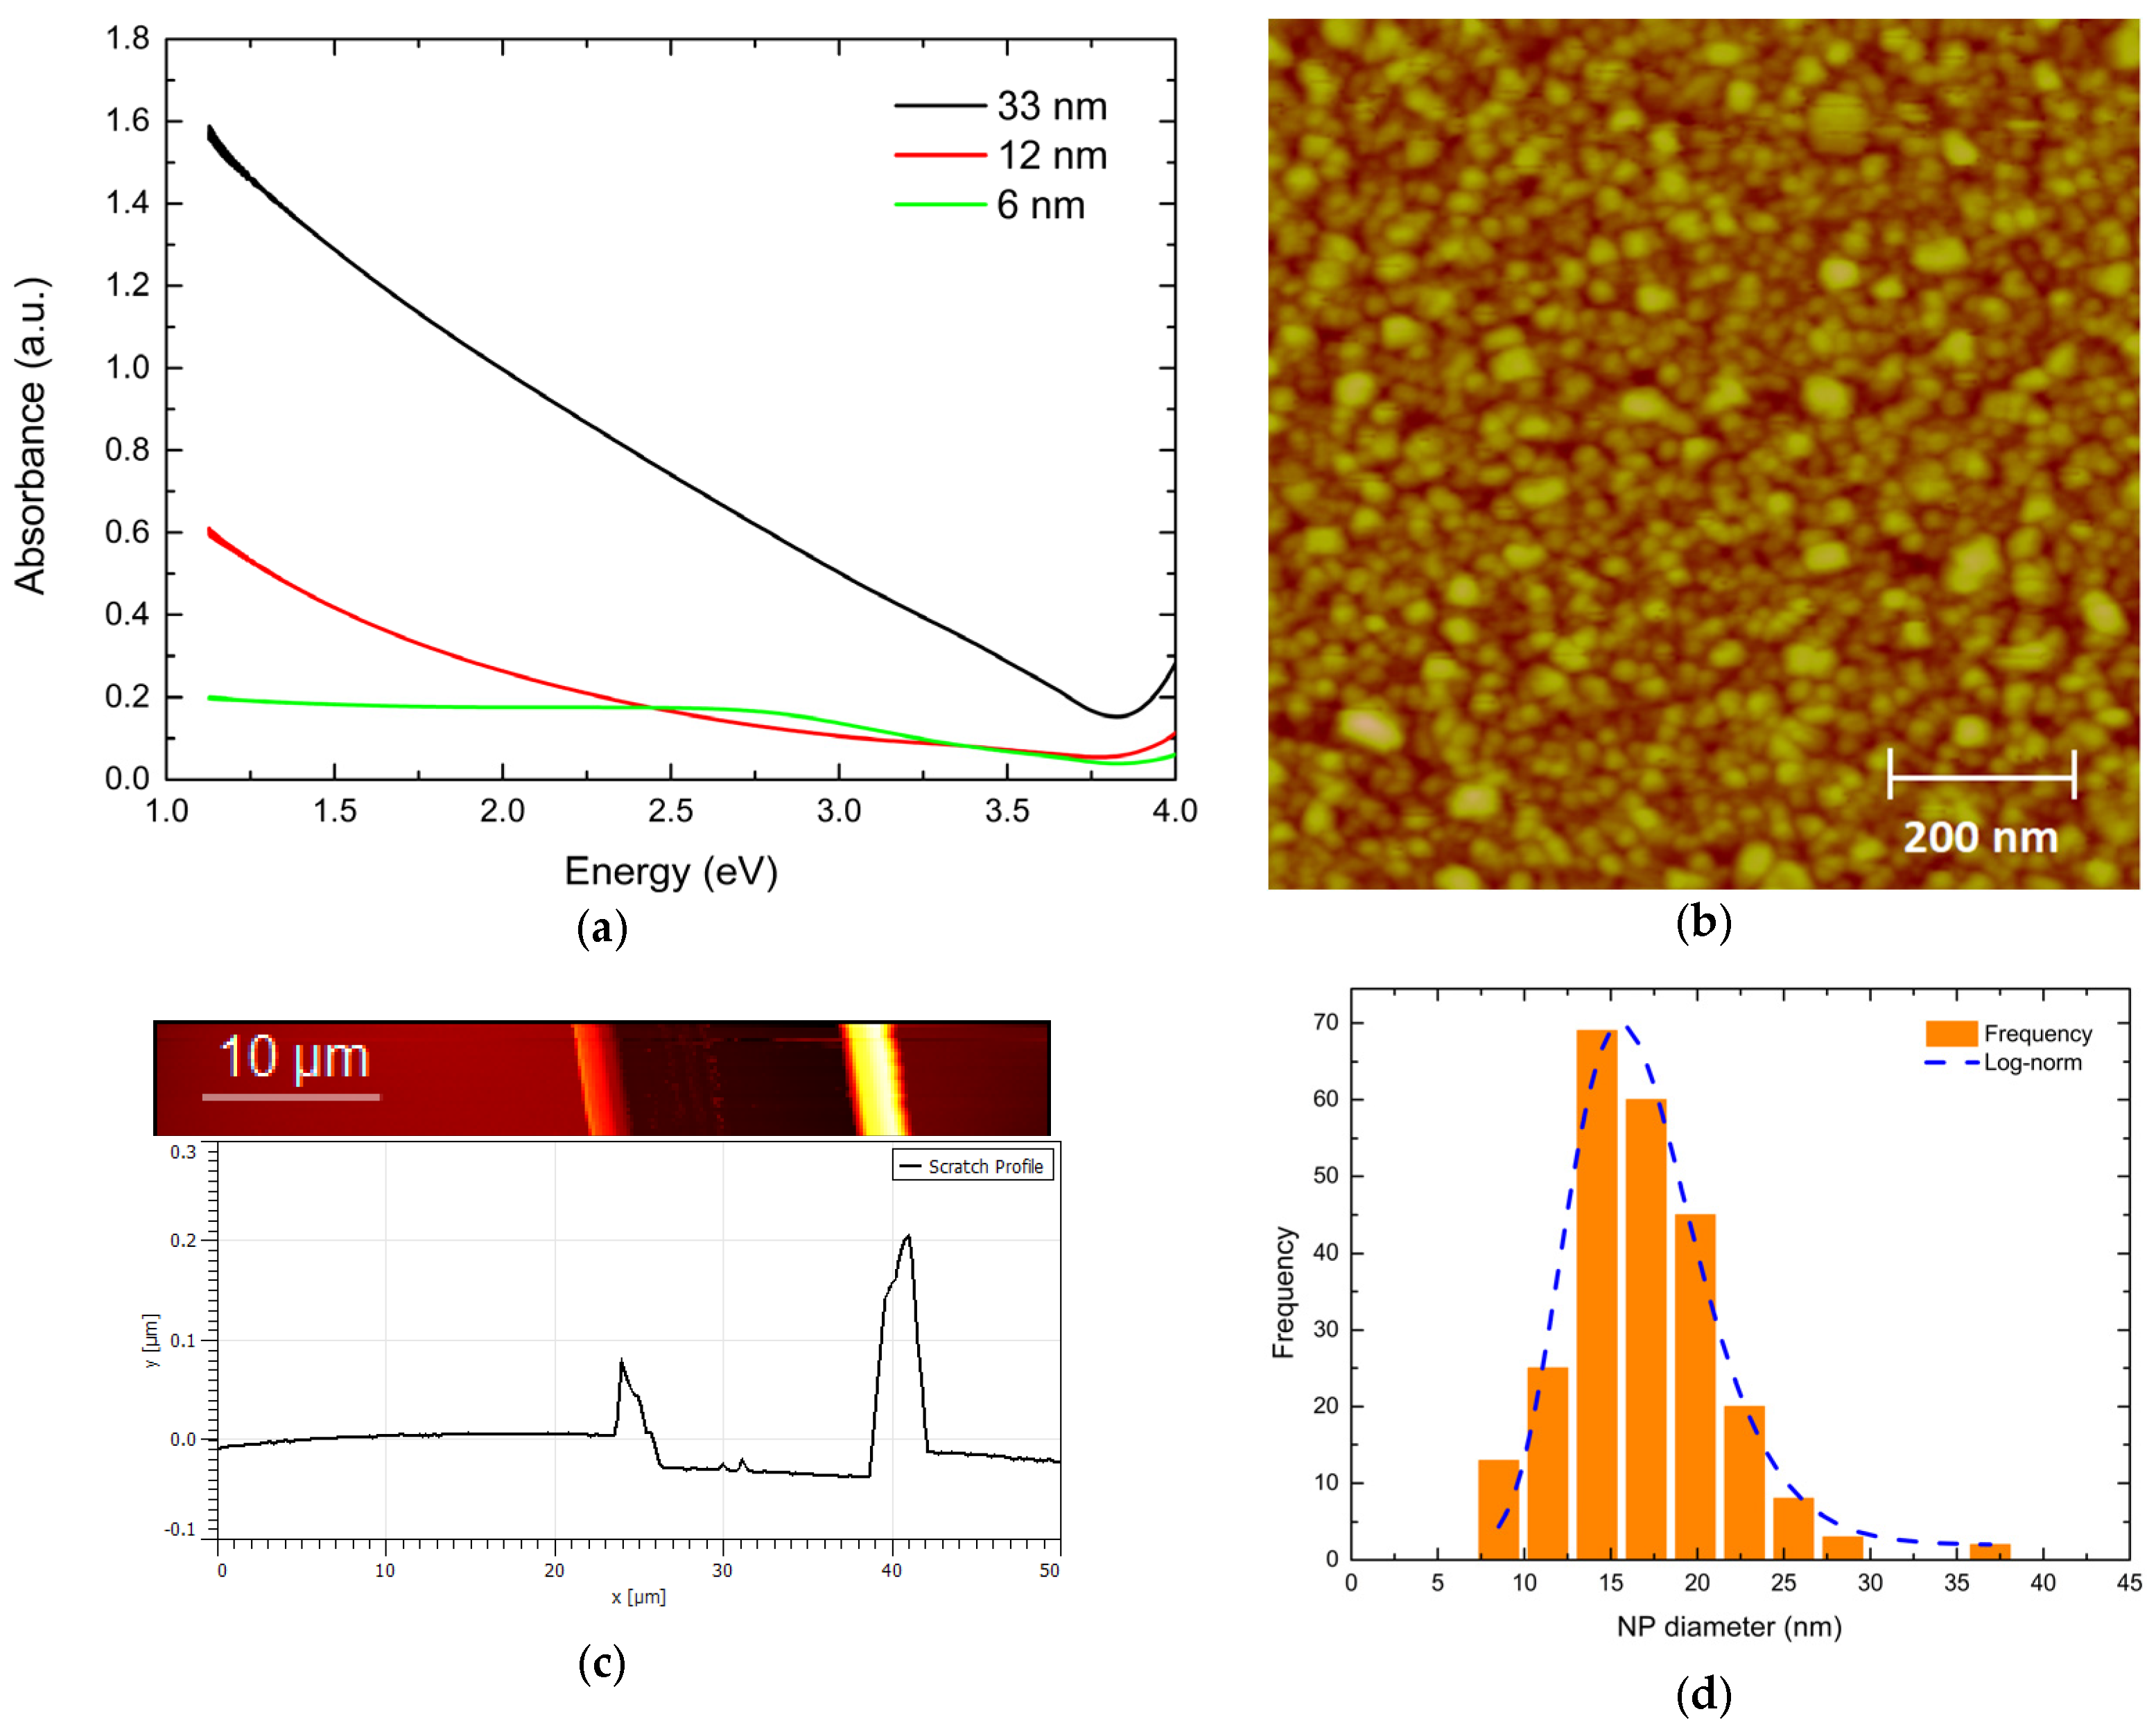
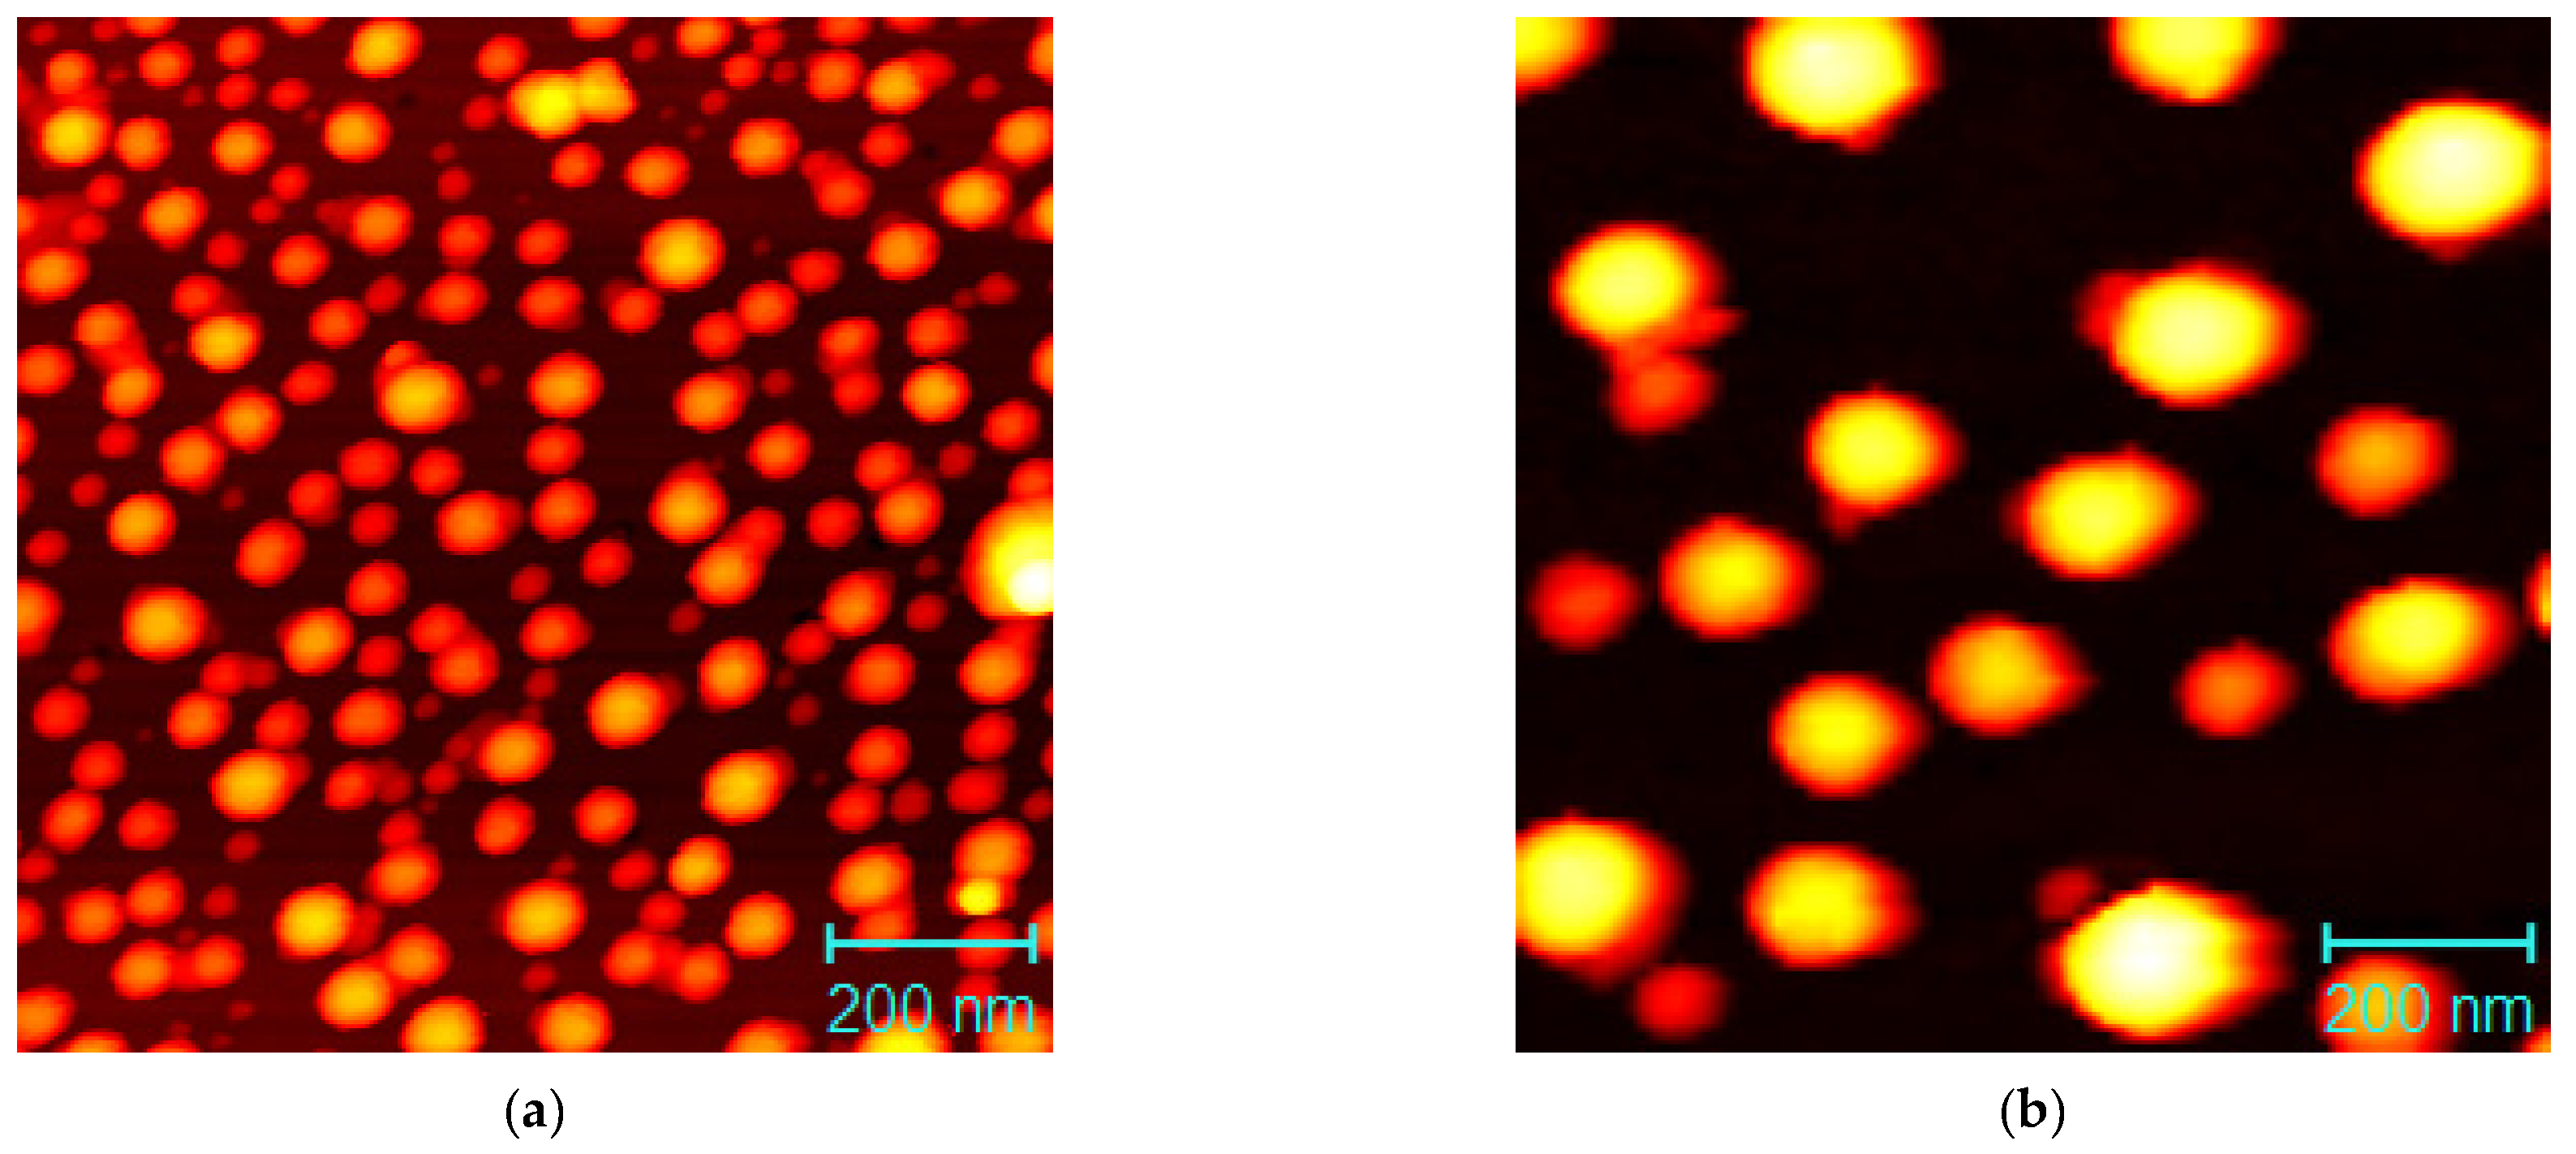
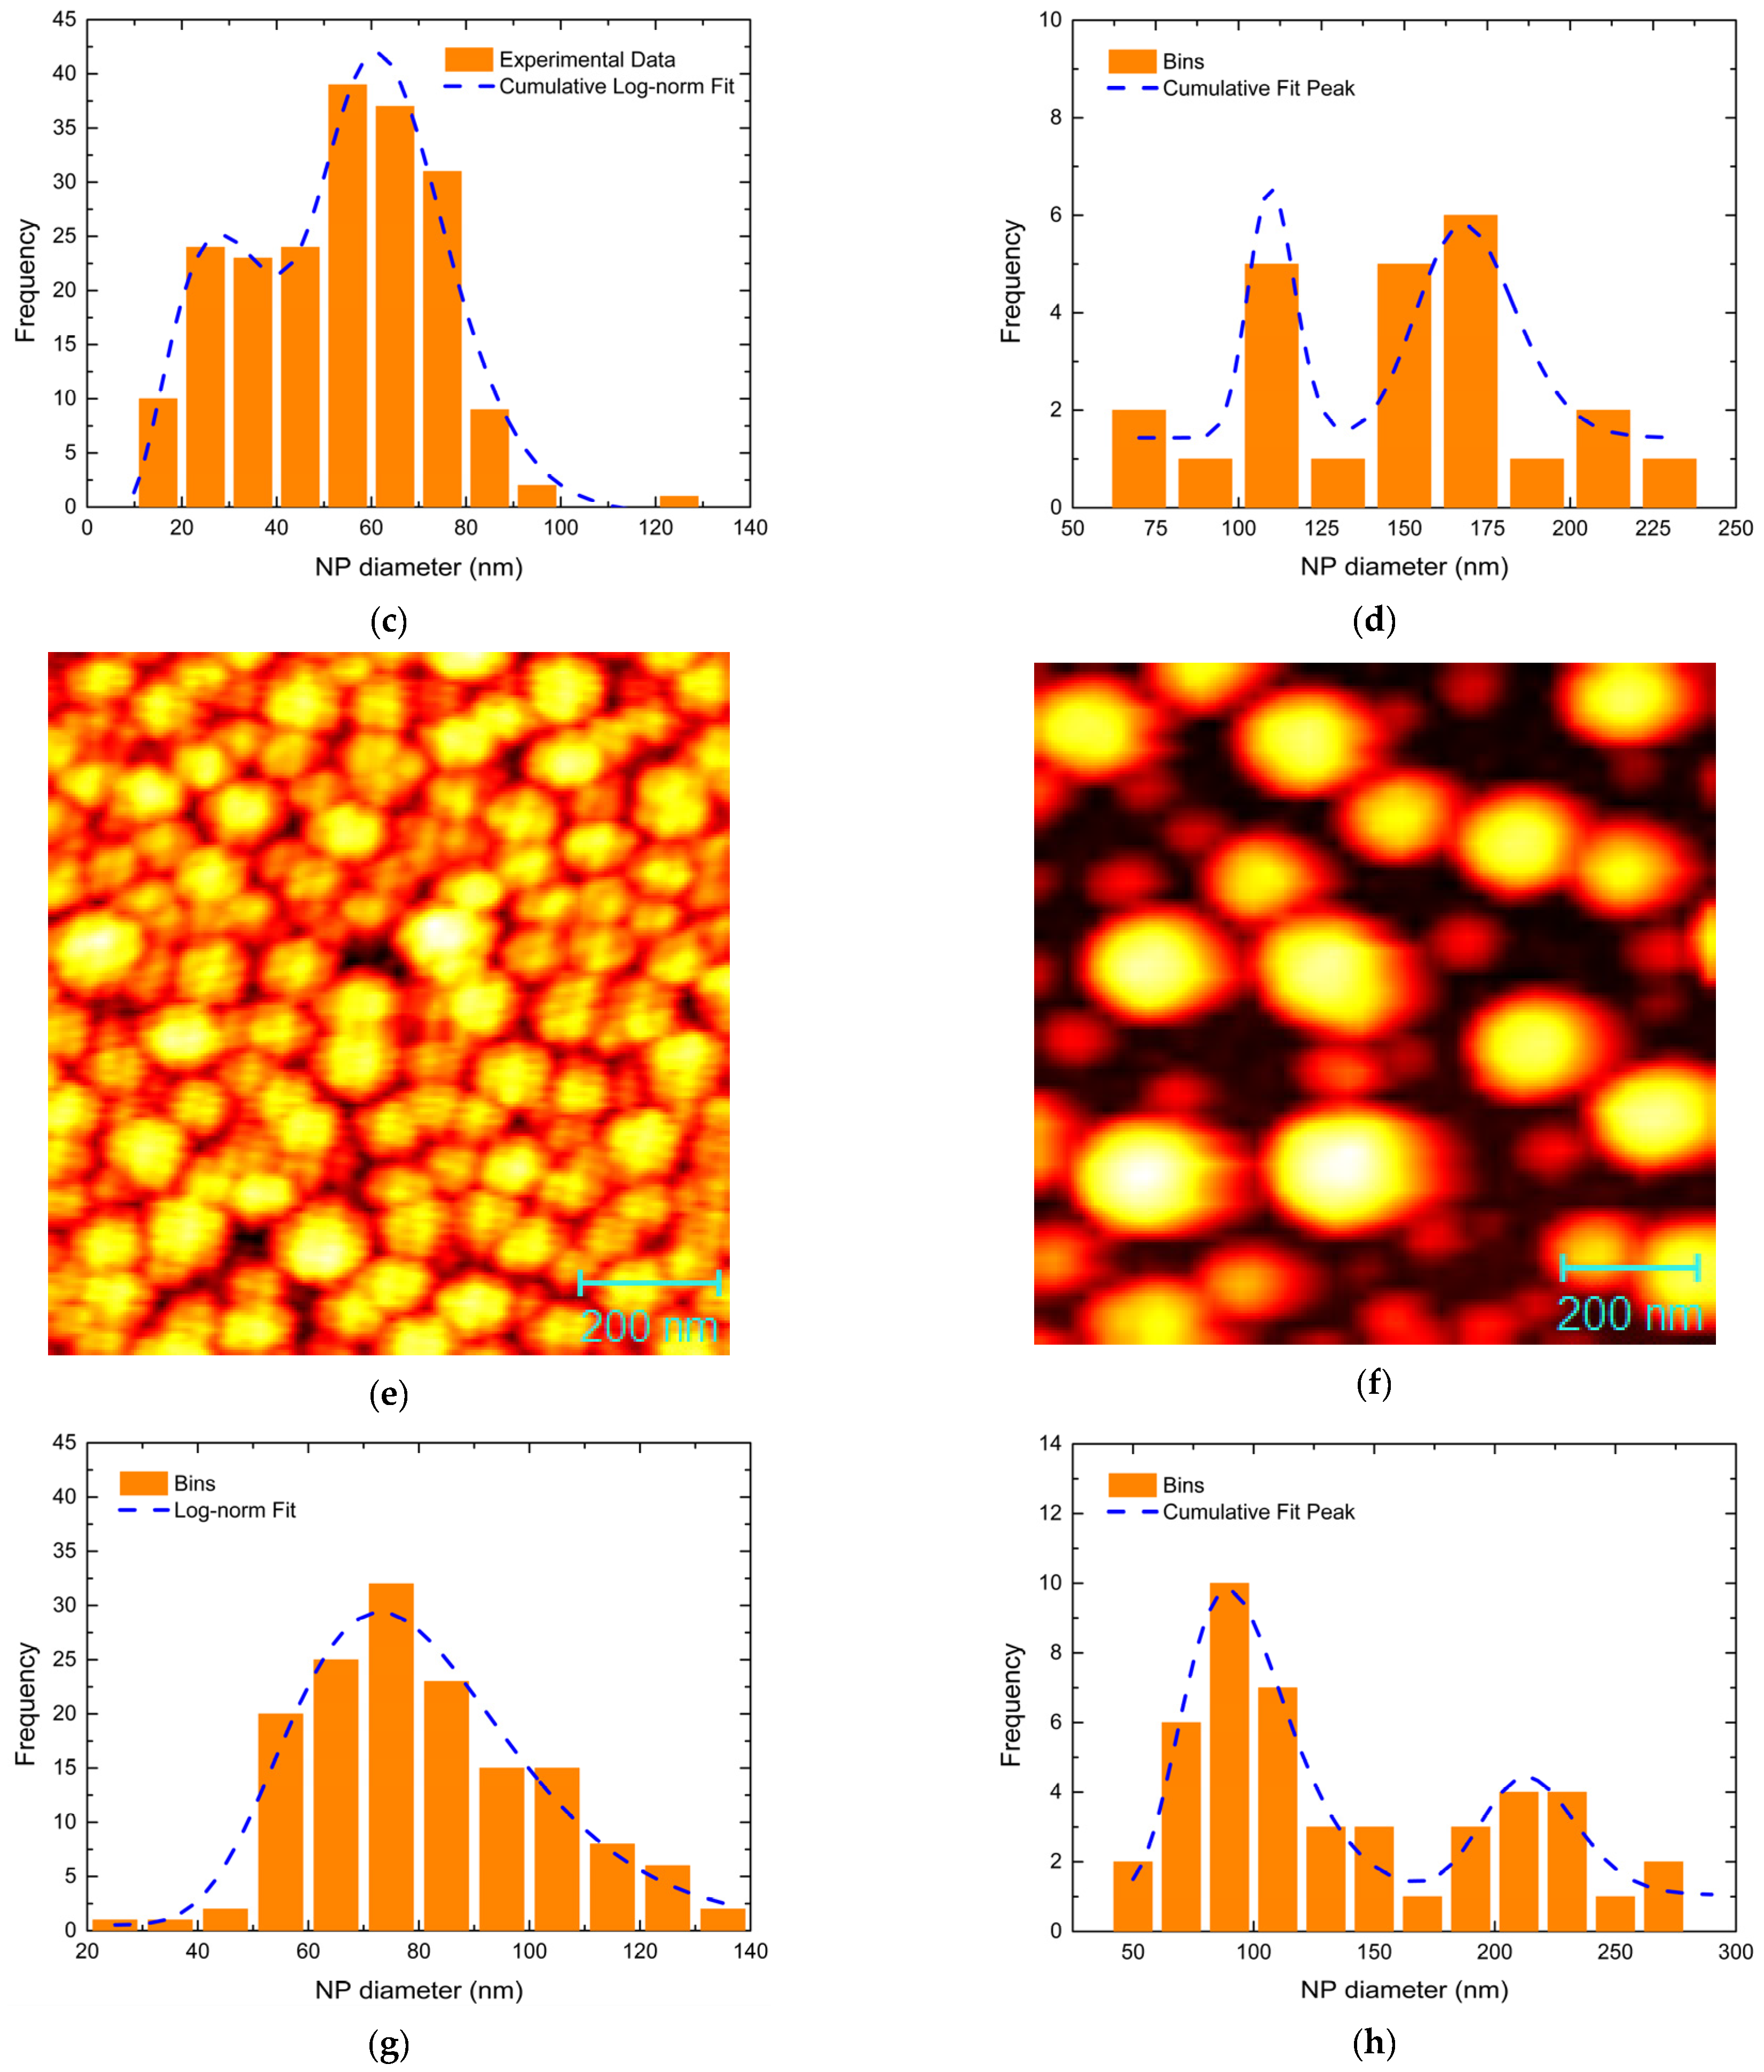
UV-Vis and Microstructure Analysis

Two Ag films, Ag #2 with a thickness of 6 nm and Ag #3 with a thickness of 12 nm, were annealed in air at 440 °C for 5 and 30 min, respectively. This led to the formation of self-assembled Ag NPs on Corning glass substrates, visibly detected with the color change of the films, as illustrated in Figure 2.
After the initial characterization, a ZnO capping layer was deposited on top of them. Intense LSPRs for both the ZnO-coated and non-coated Ag NPs were observed.
Figure 3 shows the UV-Vis absorbance spectra of the self-assembled NPs, with and without the 70 nm ZnO capping layer, alongside the absorbance spectra of a 70 nm net ΖnO film (ZnO #1) in the same figure.
The substrate covered only with ZnO did not exhibit plasmonic resonances. This was expected because the material is a semiconductor. Furthermore, there is a sharp increase in absorbance around 3.3 eV, corresponding to the energy gap of the semiconductor. Moreover, the absorption curves of ZnO-covered NPs showed non-zero absorbance at 1.1 eV compared to the non-covered ones, which is attributed to the presence of ZnO.
Two prominent LSPRs were observed in the absorption curve of non-coated Ag films at 2.77 eV and 2.46 eV, with the secondary ones found at 3.50 and 3.43 eV for Ag #2 and Ag #3, respectively. The LSPR amplitude was higher for the main resonance of Ag #2; however, Ag #3 exhibited a larger amplitude of its secondary resonance. After capping with the ZnO layer, only the thicker (AgZnO #3) ZnO-coated film displayed two LSPRs. The secondary LSPR of the thinner (AgZnO #2) film seemed to be dampened and only one prominent LSPR could be detected. LSPR amplitude did not show a clear dependence on the initial film thickness, as it increased for the thinner film, while for the thicker one, it decreased. Moreover, while the non-coated specimens displayed typical Ag NP LSPRs [8], in both samples, the ZnO-covered NPs exhibited a significant red shift in all LSPR peaks. This red shift can be attributed to the large value of the refractive index (n~1.95) of ZnO. Similar results were observed when using NiO as the capping layer [49,50,51]. The ZnO capping layer also caused an increase in the full width at half-maximum (FWHM) for the main LSPR of Ag #2, while for the thicker Ag #3, a decrease in FWHM values for both LSPR peaks was observed. Finally, the absorbance curves of specimens coated with ZnO exhibited a significant increase at energies above 3 eV due to the band gap of ZnO.
Figure 4a–d show images of the nanoparticles grown after annealing Ag #2 (6 nm) and Ag #3 (12 nm) films at 440 °C, along with their respective nanoparticle size distribution diagrams. In Figure 4a, the surface morphology of an Ag #2 film after annealing is depicted, revealing a bimodal distribution of scattered spherical nanoparticles and several agglomerates. The mean NP diameter values for each peak are 35 and 65 nm. Figure 4b shows an AFM image of an Ag #3 film’s morphology after annealing. A bimodal distribution of NPs is observed once more, with a limited number of agglomerates. Here, the average NP diameter values for each distribution peak are 110 nm and 169 nm. It is evident that the thicker film led to much larger nanoparticles and a wider NP size distribution.
Figure 4e–h illustrate the surface morphology and nanoparticle size distribution diagrams of the same annealed Ag films after the deposition of the 70 nm ZnO capping layer on them. Since Ag and ZnO are immiscible, the topography of the AFM images can be interpreted as the ZnO surrounding the Ag NPs. Ag and ZnO mapping images recorded with a SEM microscope reveal that both constituents are uniformly distributed throughout the sample surface (Figure 5c–f).
More specifically, Figure 4e corresponds to the AgZnO #2 film, which shows a very dense distribution of imperfectly spherical particles, along with many agglomerates and an average diameter of 78 nm. Even well-defined particles have limited space around them or connect with their neighbors. Therefore, in this case, it might be more appropriate to refer to these nanostructures as islands rather than NPs. As for the AgZnO #3 film, depicted in Figure 4f, it shows a dense bimodal distribution of spherical NPs with a few agglomerates, but the spacing between the NPs is bigger compared to AgZnO #2 (Figure 4e). Furthermore, the mean NP diameter values for each distribution peak are 95 nm and 215 nm, and the NPs distribution is wider as well. In the case of thicker films (12 nm), we consistently observed much larger NPs, as seen in the uncoated specimens.
The thinner film (Ag #2–6 nm) resulted in denser, narrower single distributions of smaller-diameter NPs compared to the thicker film (Ag #3–12 nm). Ag #3, in contrast, led to wider, less-dense bimodal distributions of larger NPs. This may explain the more pronounced main LSPR in the 6 nm film and the two broader LSPRs in the 12 nm film. The bimodal distribution of NPs of a wide diameter range seems to have resulted in broader LSPR peaks of lower intensity, along with a more pronounced secondary LPSR. These observations show a dependence of LSPR features on the initial Ag film thickness and apply to both ZnO-coated and uncoated NPs.
Figure 5a–h show surface topography SEM images of the nanocomposite AgZnO films, mapping images of Ag and ZnO, as well as EDS spectra showing the element composition for each specimen. Figure 5a,c,e,g refer to AgZnO #2 (6 nm Ag + 70 nm ZnO) nanocomposite film, and Figure 5b,d,f,h to AgZnO #3 (12 nm Ag + 70 nm ZnO). The corresponding SEM-EDS mapping images of Ag and Zn elements depicted in Figure 5c–f reveal the uniform coexistence of the Ag and ZnO across the coated nanocomposite films’ surface.
As Ag films about 15–20 nm thick fabricated with the post-annealing method show very broad and less intense LSPRs [6], we decided to grow such films on heated substrates [2]. This enabled us to obtain smaller grains, a narrow grain-size distribution and sharper and more pronounced LSPRs like those demonstrated in [6,52] for Au NPs.
Silver NPs with the equivalent mass of an 18 nm continuous film (Ag #4) were self-assembled at 440 °C. Figure 6 shows their UV-Vis spectra with and without the presence of the 70 nm ZnO capping layer.
Two LSPRs could be observed in the absorption curve of non-coated Ag NPs, with the first one located at 2.51 eV being more prominent, while the secondary at 3.52 eV was blunt. Furthermore, the in situ grown Ag NPs exhibited a very intense LSPR compared to post-annealed films of similar thickness [52]. As was the case for post-annealed films, the ZnO-covered NPs’ absorption curve shows a larger absorbance at 1.1 eV compared to net Ag NPs, which is attributed to the presence of ZnO. Additionally, the ZnO layer induced once more a substantial red shift in both LSPR peaks due to the quite large value of the refractive index n of ZnO (1.95) compared to air (n = 1.00). Moreover, the amplitude of both LPSRs was increased substantially and no significant alteration was noticed in terms of FWHMs. Finally, similar to post-annealed films, the absorbance curve of ZnO-coated NPs showed a significant increase above 3 eV due to the band gap of ZnO (3.3 eV).
Finally, Table 2 summarizes the LPSR data for all studied films.

3.2. Theoretical Results

In this section, we deal with the theoretical/computational aspects of our study. Our objective is to provide a theoretical framework that complements the aforementioned experimental results. As previously mentioned, our experiments involved Ag NPs with and without a ZnO matrix on Corning glass substrates. Although detailed theoretical results for Ag nanostructures surrounded by air have been reported in [8], in this paper, we reiterate similar calculations, focusing on a direct comparison with the calculations involving Ag NPs surrounded by ZnO. This comparative analysis provides a clearer understanding of the nanocomposite system, highlighting observed alterations and trends. The system under study is visually represented in Figure 7.
NPs are represented as cubes and cylinders because they allow faster computational processing when applying the RCWA method [49,51,52]. NPs are positioned on a SiO2 substrate, surrounded by the ZnO matrix. For net Ag NPs, ZnO is replaced by air. Previous articles [8,49] have shown that despite the non-periodical behavior of materials fabricated via experimental techniques, the theoretical and experimental results practically align. Calculating the experimentally observed disorder structure is very challenging, if not impossible, since it requires calculations in a large supercell, demanding significant time and memory resources. On the other hand, calculating one individual metal nanoparticle is not reliable because, according to experimental results, nanoparticles are located very close to each other. For this reason, and to ensure precise calculations, a periodic array between nanoparticles was employed. However, we expect the calculated absorbance to be higher than the experimental measurements [53].

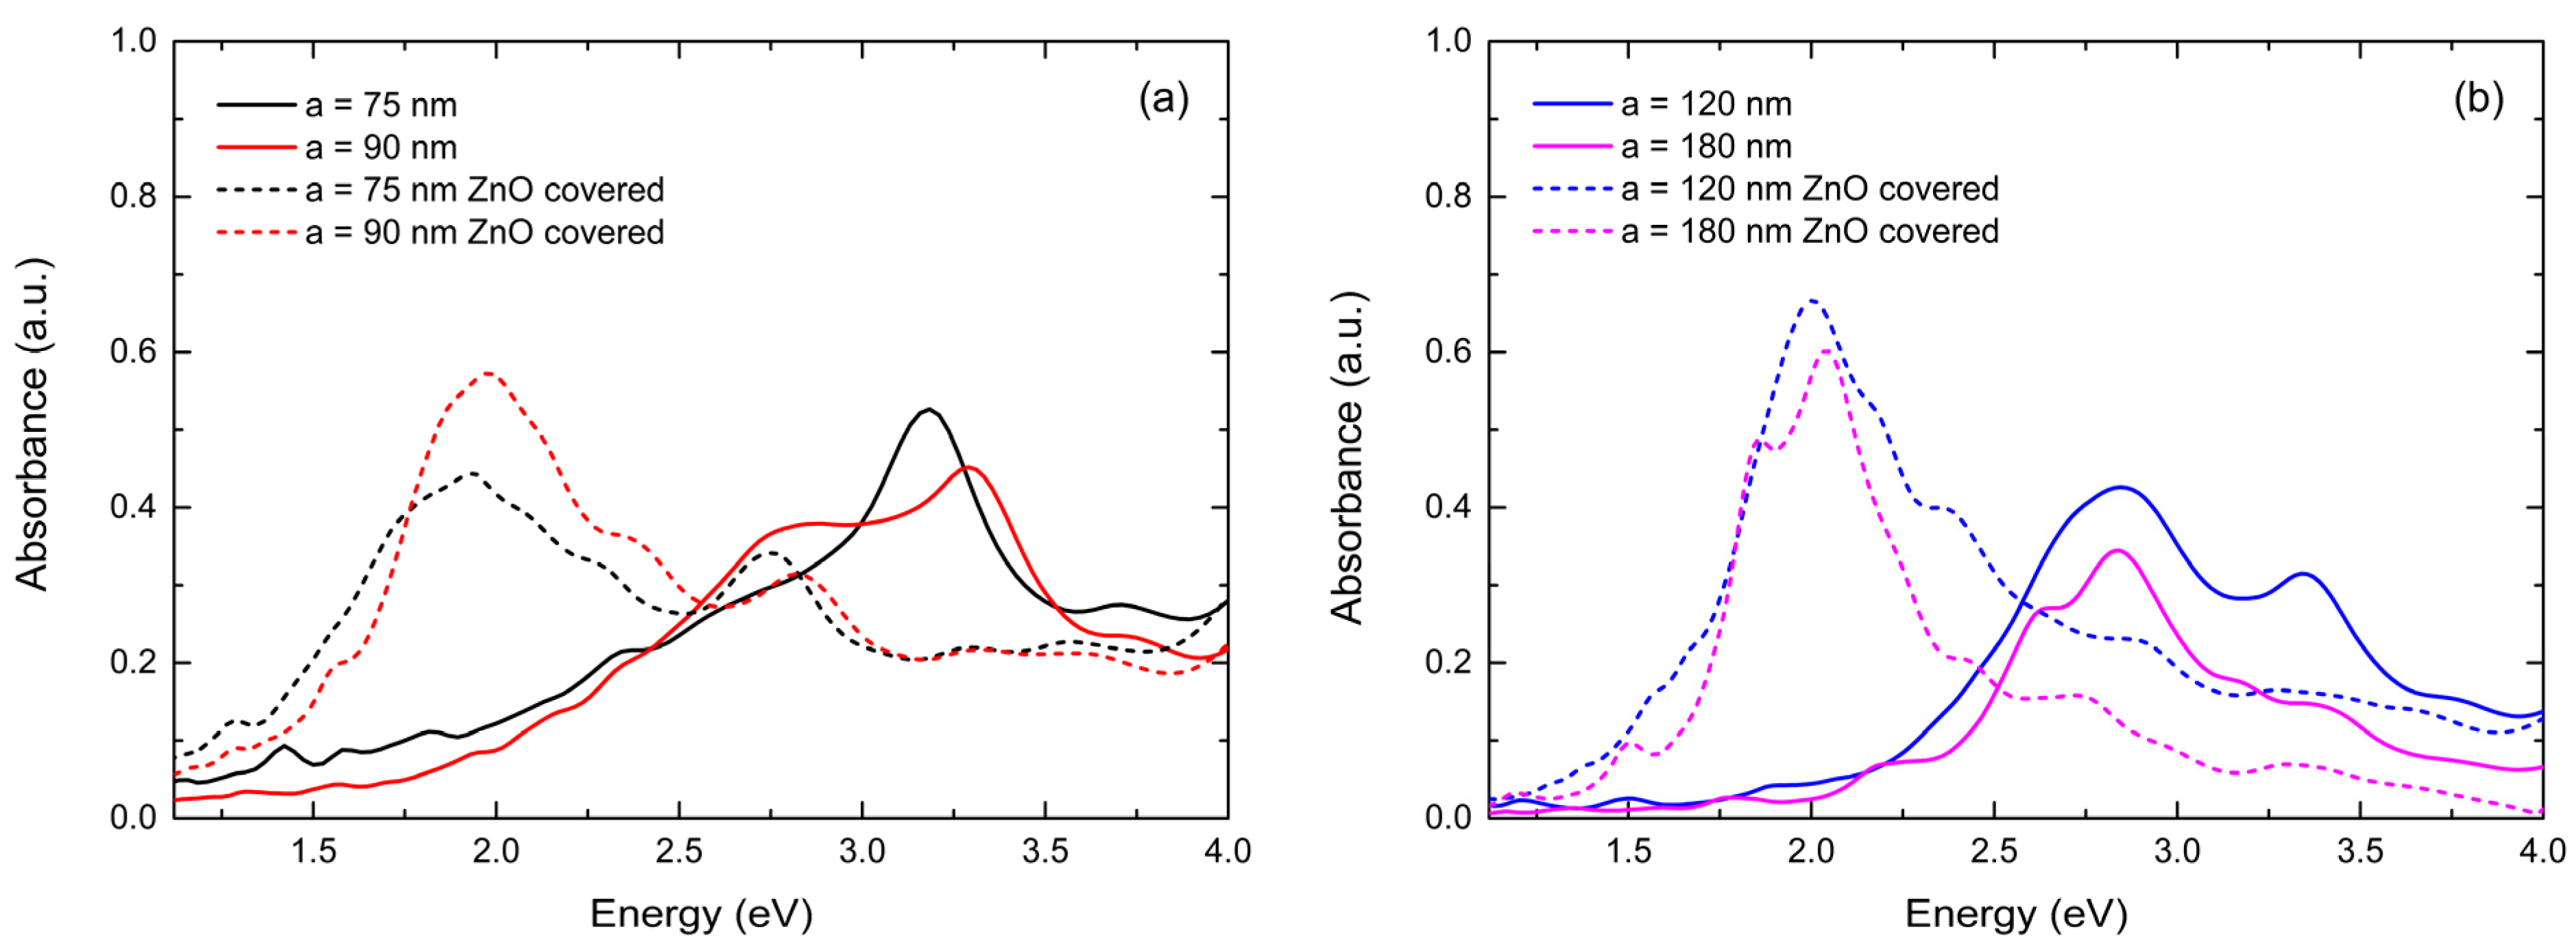
3.2.1. Comparative Plasmonic Behavior of ZnO-Coated and Non-Coated Ag NPs of Various Dimensions and Distributions

NP diameter (d) values in the investigated cases vary from 60 to 150 nm. For each case, the lattice constant (a) is varied with values corresponding to a = (5d/4), a = (3d/2), a = 2d and a = 3d, while NP height retains a value of t2 = d/2 in all cases. Furthermore, t1, which represents the thickness of the dielectric medium, maintains a constant value of 70 nm throughout the process. Table 3 shows the investigated cases. In cases where a = (5d/4), the lattice constant value was rounded up to the nearest integer.
Calculations were carried out for Ag NPs on an SiO2 substrate, surrounded by either ZnO or air. In Figure 8a–h, we present the calculated absorbance spectra for each case. There are eight figures rather than four, as each case is divided into two graphs for better visibility.
Case (i) is depicted in Figure 8a,b. Concerning the non-coated Ag NPs, the main LSPRs for smaller lattice constant (a) values, i.e., denser NP distributions, were located at 3.18 and 3.29 eV, yet for the two bigger lattice constant values they were located at 2.84 and 2.85 eV. As for the secondary LSPRs, in the cases of a = 75 nm and a = 120 nm, they were located at higher energies compared to the main LPSRs, while for a = 90 nm and a = 180 nm, they were found at lower energies. For a = 75–120 nm, secondary LSPRs could be located around 3.7 eV, which in the cases of a = 90 and a = 120 nm could be considered third resonances. Notably, for a = 180 nm, four peaks were evident, with the two minor ones being found around 3.15 and 3.35 eV. Furthermore, for ZnO-coated NPs, a significant red shift can be observed for all LSPRs in all studied subcases. Additionally, the ZnO capping layer seems to have caused the absorbance peaks to become broader in some cases, as seen for a = 75 nm in Figure 8a, and sharper in others, as illustrated in Figure 8b. Moreover, more minor peaks or curvatures that cannot be considered LSPRs appeared in the absorbance curves. This observation is further explained below in the discussion section. The amplitude of the main LSPRs was slightly decreased for a = 75 nm, while for the remaining lattice constant values it increased. Lastly, an amplitude enhancement also occurred for well-defined secondary LPSRs.
In case (ii), the most prominent LSPRs were located between 2.54 and 3.11 eV, while the secondary ones were located around 3.70 eV for a = 113 nm and a = 135 nm. For the two bigger lattice constant values, more than two peaks could be identified. The third one appeared at 3.74 eV for a = 180 nm and at 3.32 eV for a = 270 nm. Moreover, numerous minor peaks or curvatures could be detected at energies lower than 2.20 eV. As in case (i), ZnO induced a considerable red shift in all LSPRs, which was more intense for a = 135 nm. LSPR amplitude was enhanced for a = 180 nm and a = 270 nm, whereas for the smaller lattice constant values it decreased. Notably, for a = 113 nm, the main LSPR was dampened, and several low-intensity peaks developed. Interestingly, for a = 270 nm, a very sharp double LSPR peak occurred between 2.92 and 3.00 eV.
In case (iii), one can observe a similar behavior of the main LSPRs of the net Ag NPs as in case (ii). More specifically, the main LSPRs were located between 2.30 and 3.18 eV. For a = 144 nm and a = 180 nm, secondary peaks were detected around 3.65–3.70 eV. However, for a = 240 nm and a = 360 nm, the secondary LSPRs were located at lower energies compared to their main LPSRs. For a = 360 nm, a third LSPR appeared at 3.14 eV and for all cases, many minor peaks could be observed for energies below 2.30 eV. Once again, the ZnO capping layer resulted in a substantial red shift of LSPRs, whose amplitude increased for a = 360 nm but decreased for the rest.
Finally, in case (iv), one can notice main LSPRs between 1.90 and 2.99 eV. For a = 188 nm and a = 225 nm, no apparent LSPRs could be detected besides a small peak around 3.70 eV and numerous minor peaks below 2.50 eV. For a = 300 nm and a = 450 nm, more than two distinct peaks were evident, and for the latter case, the main LSPR was very sharp compared to the previous cases when a = 3d. In addition, for those two cases, secondary peaks were located on both sides of the main LSPR. One more time, the LPSRs of the ZnO-covered Ag NPs exhibited a substantial red shift. As also noticed in previous cases, the ZnO capping layer once again broadened the absorbance peaks, particularly for lower lattice constant values, and resulted in several low-amplitude peaks. Regarding the main LSPR amplitude on which we focus more, it was enhanced for a = 300 nm and a = 450 nm; however, it decreased for a = 188 nm and a = 225 nm.

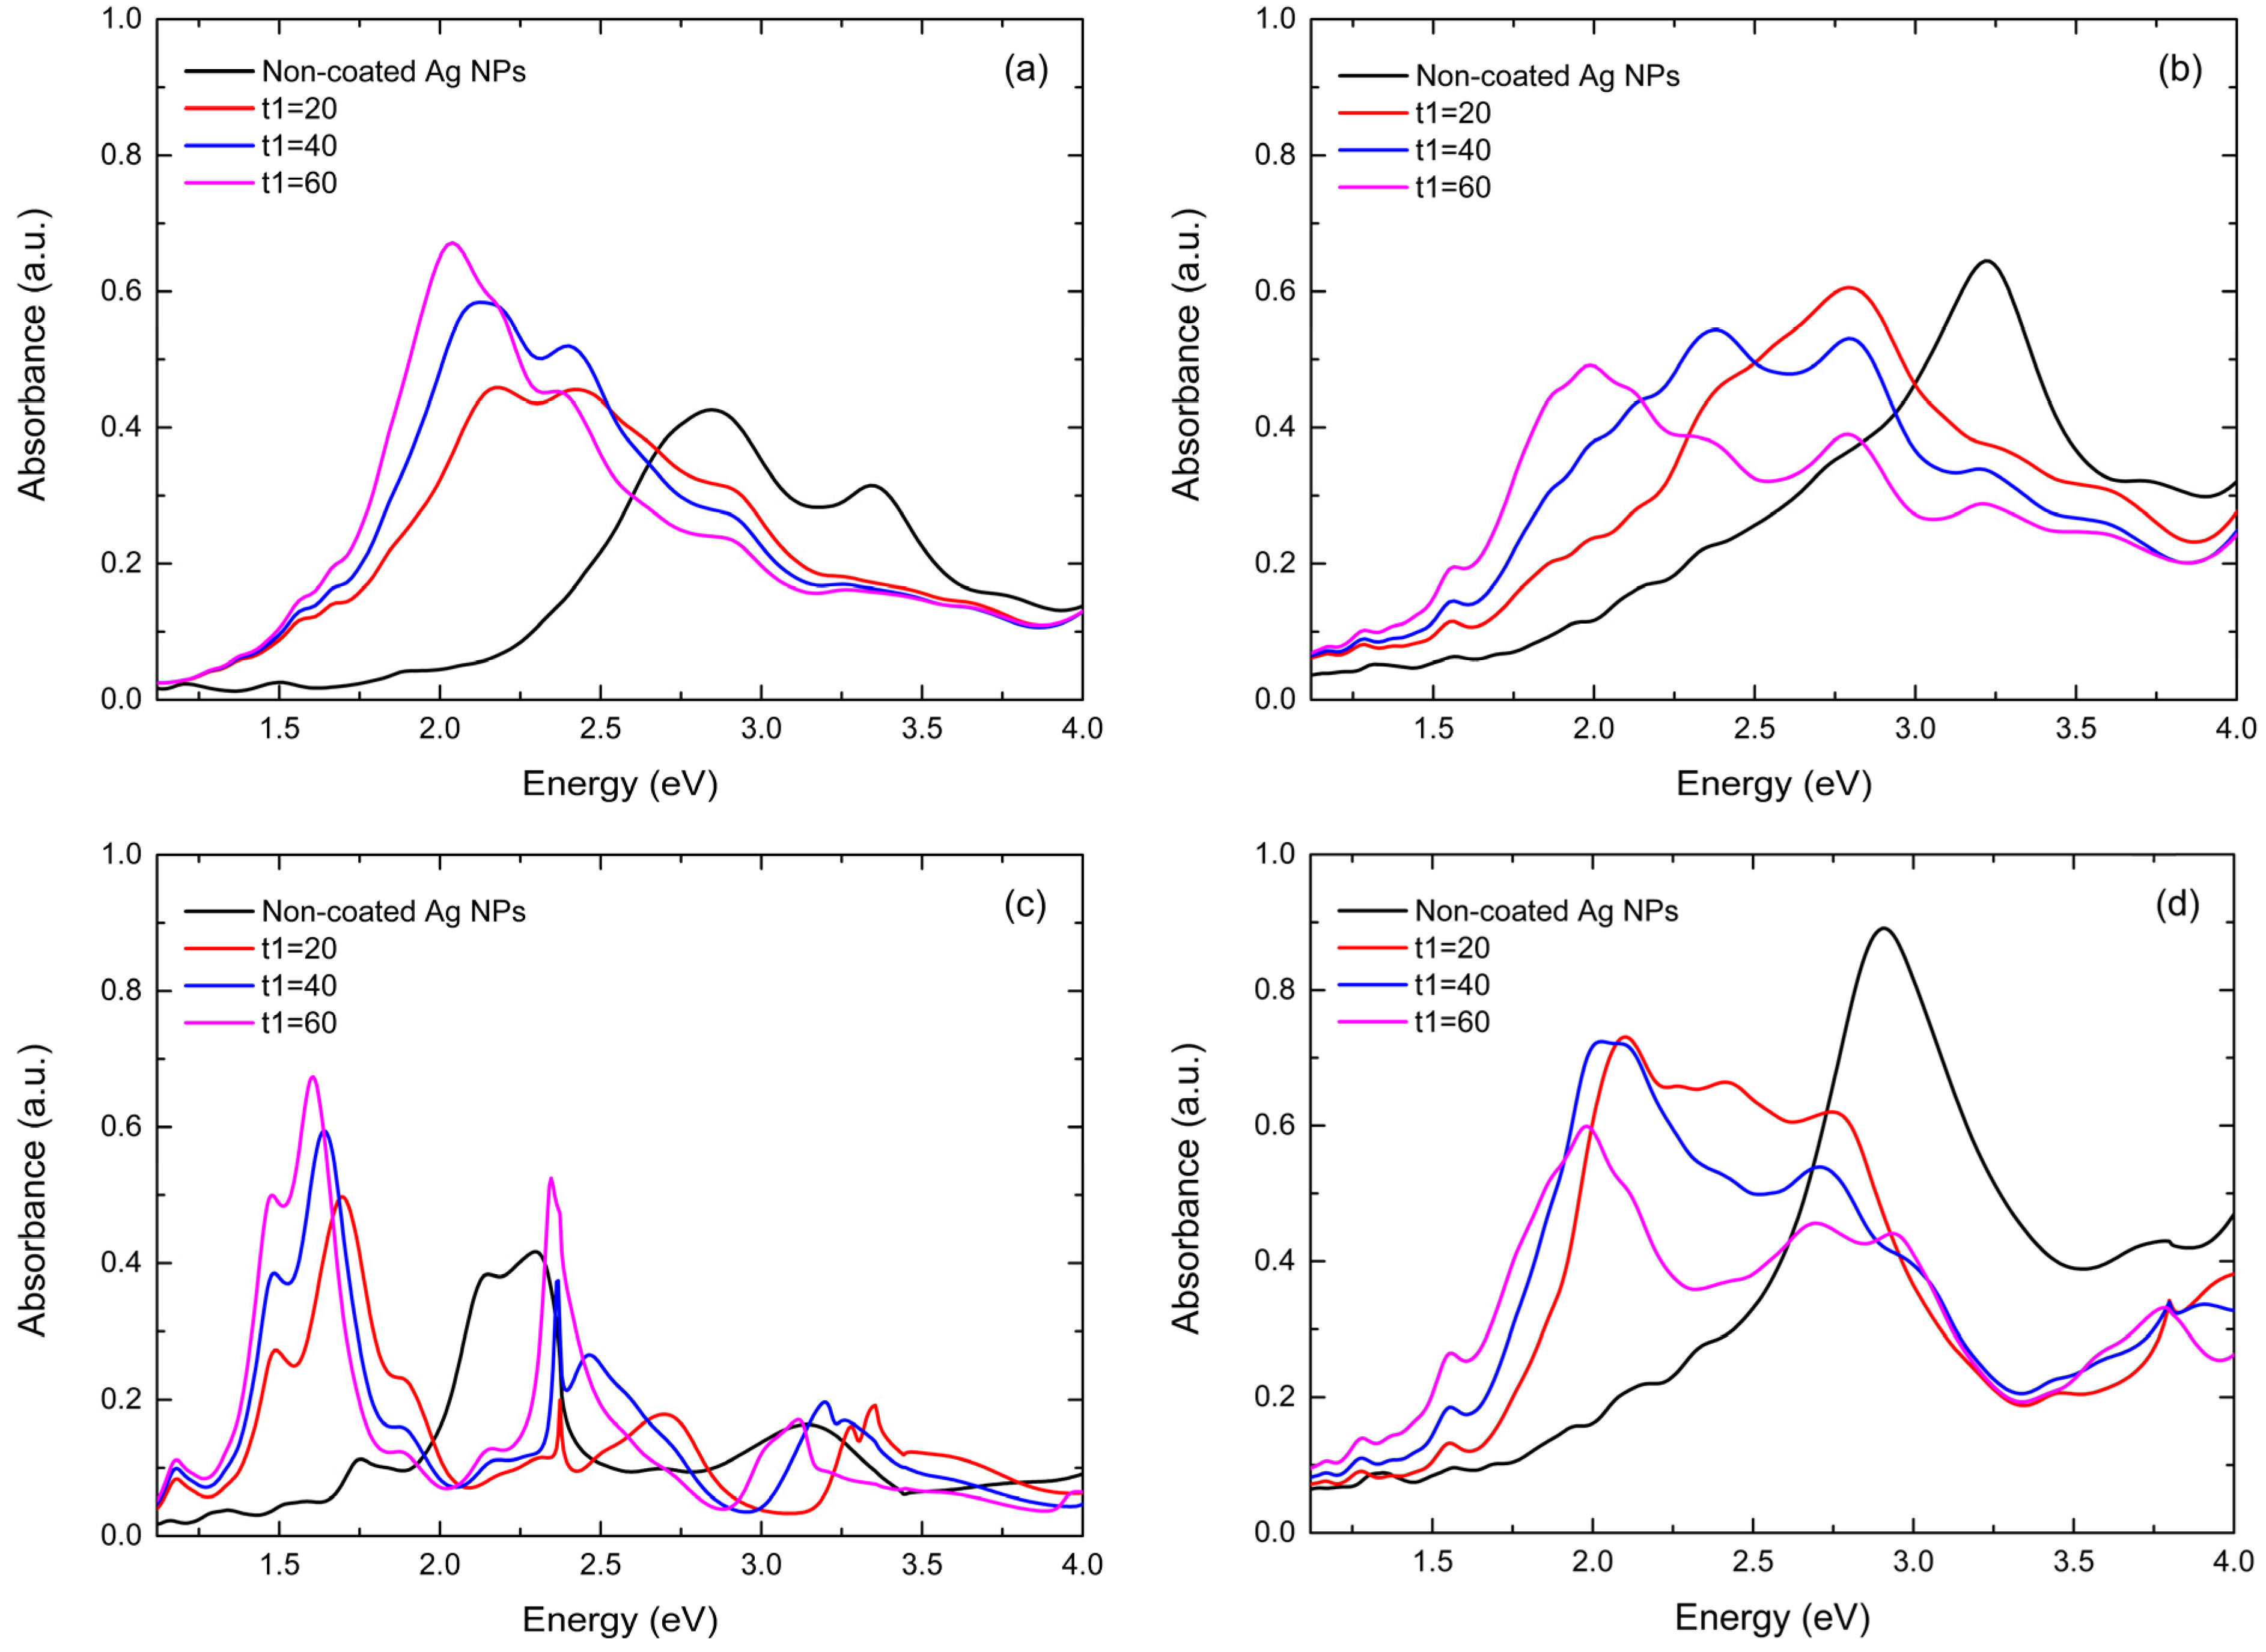
3.2.2. Influence of ZnO Thickness on Plasmonic Behavior

Moving forward, we present below the influence of the dielectric medium thickness (t1) on LSPRs in randomly selected cases in order to elucidate its role in both LSPRs and the absorbance curve in general under various array configurations. Our objective was to identify trends and not fully predict the precise absorbance spectra of the investigated cases. Here, the thickness t1 varied between 20 and 60 nm and we also present the absorbance curve of Ag NPs surrounded by air for comparison purposes.
Figure 9a illustrates the first case for d = 60 nm, a = 120 nm and NP height t2 = 30 nm. It can be clearly seen that the ZnO environment induces a significant red shift for all calculated t1 values. As t1 increases, the absorbance curve shifts consecutively to even lower energies. Additionally, larger t1 values resulted in an enhanced LSPR amplitude, showing that the ZnO layer, depending on its thickness, could affect both the LSPR position and amplitude. Similar behavior was observed for the LSPRs of the AgZnO #2 and AgZnO #4 films. However, the calculated spectra did not show a significant absorbance increase around 3.3 eV, which was evident in the experimental ones. This was consistent for all cases studied, so it will not be repeated below. Last, as observed in the initial calculations, ZnO presence induced additional LPSRs or broad absorbance peaks, which became more pronounced with increasing t1 values.
The next investigated case was for d = 90 nm, a = 135 nm and t2 = 45 nm. In Figure 9b, a similar behavior is witnessed, since the ZnO dielectric environment induced major red shifts for increasing t1 values. The LSPR positions were moving towards lower energy values; however, the LSPR amplitude was declining with increasing t1. Furthermore, absorbance curves broadened with increasing t1 and the trend of additional LPSRs or broad absorbance peaks was once more evident.
For d = 120 nm, a = 360 nm and t2 = 60 nm (Figure 9c), an almost identical behavior to the first case was identified, since the increasing t1 thickness caused consistent red shifts along with enhancement of the amplitude of LSPRs. It is worth noting that in this case, we obtained LPSRs even in the near-IR range. Additionally, LSPRs of NPs inside the ZnO matrix were sharper compared to those surrounded by air. This is something that was apparent in the first case (Figure 9a) too, but the exact opposite was noticed in Figure 9b. Interestingly, numerous secondary LSPRs were obtained under a ZnO environment, but this time they were very distinct and sharp.
Finally, for d = 150 nm, a = 225 nm and t2 = 75 nm, which is illustrated in Figure 9d, we observed high absorption of the non-coated NPs, which could be justified from their size and their distribution. In this case, the pattern of systematic red shifts along with the manifestation of numerous secondary LSPRs was once again detected. As in the first case (Figure 9a), ZnO’s presence initially broadened the absorbance curves, but with increasing t1 the main LSPRs seemed to become sharper.

4. Discussion

In the context of investigating the plasmonic behavior of a nanocomposite thin-film system composed of self-assembled silver nanoparticles inside ZnO matrices, we conducted both experimental and theoretical analyses. Our main objective was to investigate how the ZnO capping layer affects the LSPR characteristics of Ag NPs and evaluate its potential as a tuning platform.
NPs grown via post-deposition annealing, as discussed in the results section, exhibited characteristic LSPRs for Ag NPs located at 2.46 and 2.77 eV with similar amplitudes. Additionally, secondary LSPRs appeared at 3.50 and 3.43 eV, but with smaller amplitudes. These secondary resonances might be the result of multiple scattering within the film’s nanostructure, due to the presence of very small NPs [7,8]. AFM images displayed two distinct bimodal NP distributions, with the thicker (12 nm) Ag #3 film showing a sparser distribution of much larger nanoparticles and a wider NP size distribution. This might explain the greater amplitude of its secondary LPSR. One would expect that its primary LPSR would also display a higher amplitude due to the larger NPs; however, we have to consider the radiation damping effect [54], which explains its lower amplitude as well as the fact that it is also broader, as the FWHM values in Table 2 reveal.
We observed that as the initial film thickness increased, there was a substantial increase in grain diameter following annealing, accompanied by a broadening of the NP size distribution. Specifically, Ag #4 exhibited a behavior similar to the previous films, with two LSPRs at similar energy values to those of Ag #2. Notably, as Figure 6 revealed, its primary resonance exhibited almost double the amplitude of the other films, despite the secondary LSPR having a similar amplitude. This can be attributed to its more available mass, which is equivalent to an 18 nm continuous film, as well as its narrow NP size distribution of small NPs.
Moving to the ZnO-covered NPs, as seen in Figure 3 and Figure 6 along with the data presented in Table 2, the ZnO capping layer induced a systematic red shift in all LSPRs and the absorbance curves overall. This may be interpreted by the fact that, before coating, the NPs were surrounded by air with a dielectric constant of 1. Similar results were observed with NiO as the capping layer [49,50,51]. Furthermore, the absorption curves of ZnO-covered NPs exhibited a higher initial absorbance compared to the uncovered NPs. This is attributed to the presence of ZnO, which is not fully transparent around 1.12 eV. Additionally, the coated NPs presented a characteristic increase in absorbance around 3.3 eV similar to the characteristic absorbance curve of pure ZnO, linked to its band gap.
The AgZnO #3 and AgZnO #4 films presented two LSPRs. However, the secondary LSPR of the thinnest AgZnO #2 film seems to have been dampened and only one prominent LSPR could be clearly detected. There is a slight curvature at 2.85 eV that cannot be unambiguously considered a peak, as can also be explained by the alteration of its microstructure, as Figure 4e illustrates. After capping with ZnO, AgZnO #2 displayed a very dense single distribution, in contrast with the bimodal distribution before covering Ag NPs with ZnO. In contrast, AgZnO #3, which maintained its two LPSRs, also maintained a bimodal distribution. For both cases, denser distributions arose, with larger average diameters, as their AFM images and NP size distribution in Figure 4e–h reveal. It was observed that the combination of NP size and distribution density affects the LSPR amplitude. In the cases of Ag #2 and Ag #4, which displayed dense distributions of small NPs, their LSPR amplitude was enhanced after ZnO coating, as Figure 3 and Figure 6 reveal. However, for Ag #3, which showed a sparser distribution of large NPs, its LSPR amplitude decreased.
We might be able to correlate the amplitude alterations with the coexistence of ZnO and Ag NPs on the surface of the AgZnO films, as depicted in the SEM-EDS mapping images in Figure 5c–f. More precisely, a possible explanation could be that ZnO filled the space between Ag NPs in the sparse Ag distribution, thus reducing the coupling effects between Ag NPs and consequently, their respective LSPR amplitude. In addition, the already very large NPs of Ag #3 were further enlarged after capping with ZnO, enhancing the radiation damping effect and therefore decreasing its LSPR amplitude while also making the overall absorbance curve blunter. This was less intense for the already dense distributions of Ag #2 and Ag #4, as less space was available, so they were not affected considerably, and no reduction in amplitude was observed. In the case of initially smaller NPs, the increase in their diameter, along with the further densification of their distribution, has probably resulted in enhanced absorbance and possibly contributed to the red shift also. However, this NP diameter enlargement is attributed to the ZnO coating, which is the driving force of the red shift. It has to be noted that the above observations concern the main LSPRs. The secondary peaks were also affected by the aforementioned phenomena, yet further analysis of the secondary peaks would complicate the discussion, which is focused on the primary resonances.
Additionally, the main resonances’ width did not show a consistent behavior after ZnO coating, since for AgZnO #2 it increased, while for the rest FWHM decreased, as shown in Table 2. A similar inconsistency was also observed in our theoretical calculations and will not be discussed further, since no safe conclusions can be drawn due to the imperfectly spherical shape and disordered structure of the experimentally fabricated NPs.
In our theoretical analysis, different cases were considered, varying parameters like NP diameter (d), lattice constant (a), NP height (t2) and dielectric medium thickness (t1). The calculations aligned with the experimental trend, showing that a ZnO environment consistently induced intense red shifts as well as alterations in the LSPR amplitude for all investigated cases. Furthermore, in the first phase of our calculations, we compared the plasmonic behavior of ZnO-covered and non-covered Ag NPs for various NP sizes and array distributions. Our observations regarding the main resonances were as follows: The ZnO capping layer induced a systematic red shift in all cases, with the cases where a = (3d/2) displaying substantially intense shifts, most notable for larger NP size. This behavior aligns with our experimental findings. Furthermore, the LSPR amplitude’s dependence on the ZnO dielectric environment showed two trends: First, it decreased for the denser NP distributions, a trend more obvious for larger NPs. One exception was evident in Figure 8a, for a = 90 nm, where the LSPR amplitude was slightly increased. Second, the LSPR amplitude was enhanced for the sparser NP distributions, with one exception, also for a = 90 nm, as illustrated in Figure 8f. In this case, the main resonance’s amplitude was decreased, while its secondary resonance, located at a lower energy, increased. Nevertheless, it achieved a smaller amplitude compared to the non-coated main LSPR. According to these findings, the calculated data showed that the main patterns observed can be disrupted in some cases, making the prediction of the exact LSPR characteristics after ZnO deposition really challenging. When compared to the experimental findings, the LSPR behavior was almost impossible to be exactly reproduced, but this was expected for the following reasons. First, our theoretical calculations investigated a range of NP dimensions and distributions in order to identify general behavior and trends. Since we did not attempt to precisely predict the experimental absorbance, such discrepancies were expected. Additionally, we have to consider the disordered structure of experimentally grown NPs and their imperfectly spherical geometry, which was assumed for calculated NPs. Achieving totally accurate predictions requires a thorough investigation of the complex interaction between NPs’ size, distribution and ZnO layer thickness, which is beyond the scope of this study. Moving forward, one more observation that agreed with the experimental results was that with ZnO, the absorbance curves exhibited more minor peaks or curvatures. In cases where a = (5d/4), numerous broad peaks were observed, while for some other cases, the new minor peaks could be considered LSPRs, as they were well-defined and sharp. The secondary peaks are attributed to higher-order plasmonic resonances, due to the presence of ZnO, which has a high refractive index value. Due to disorder and non-uniformities of the grown nanoparticles, those higher-order resonances were smoothened in our experimental results, resulting in broader absorbance curves [39], as illustrated in Figure 3 and Figure 6. Lastly, UV-Vis spectra from the experimental data showed that ZnO caused a notable increase in absorbance around 3.3 eV. However, this was not reproduced in our theoretical calculations.
By comparing the calculated absorbance of coated NPs for various ZnO thickness values (t2), we found once again an inconsistency in the LPSR amplitude behavior. In some cases, increasing ZnO thickness amplified the LPSR, while in others, it had the opposite effect. Hence, we can conclude that the behavior of ZnO-coated Ag NPs is influenced by the initial NP size and distribution. ZnO also led to additional LPSRs or broad absorbance peaks, and this effect became more pronounced with increasing ZnO thickness (t1). Finally, increasing the ZnO thickness induced consistent red shifts, repeating the systematic trend observed in all our analyses. These red shifts became more intense with increasing t1 values.
In summary, the results presented in this study provide a comprehensive overview of the optical properties of Ag NPs with and without a ZnO matrix. This research highlights that the ZnO layer matrix can potentially tailor the LSPR characteristics of Ag NPs, specifically by inducing a systematic red shift regardless of the NP size or distribution. Additionally, by carefully selecting the proper NP size, distribution and thickness of the ZnO capping layer, one can obtain tailored LSPRs across a broad spectrum, extending from the visible to the near-infrared. In our case, this could have been achieved by adjusting the annealing time and temperature, or by employing an alternative thermal treatment such as laser annealing to fabricate the desired nanostructures. Silver or other metallic nanoparticles can be grown through various methods, and by simply coating with ZnO, one could potentially facilitate the precise tuning of their LSPRs for a plethora of applications. ZnO could be useful as a matrix when combined with materials exhibiting LSPRs in the UV range, extending their applicability for applications in the visible spectrum. Ultimately, it is important to note that this was a facile study assessing the feasibility of this approach, and further research is required to investigate the observed discrepancies between the experimental and calculated results.

5. Conclusions

In this study, we carried out both experimental and theoretical analyses to study the influence of ZnO dielectric matrices on the LSPR characteristics of Ag NPs and evaluate their potential as an LSPR tuning platform. The self-assembled NPs exhibited intense LSPRs in all cases. After coating with ZnO, a systematic red shift was observed in all LSPRs, with their amplitude showing a dependence on the combination of NP diameter and distribution density. However, even though the RCWA calculations successfully reproduced the red shift for all studied cases, accurately predicting the LSPR amplitude was a challenging task. Moreover, the thickness of the ZnO layer affected the intensity of the red shift and LSPR amplitude. Our results demonstrated a reproducible red shifting in all LPSR that depends on the Ag NP size and distribution, as well as the ZnO layer thickness. The current results are promising for potentially tunable LSPRs, mainly towards lower energy values. Hence, our study paves the way for potential research for the development of precisely engineered plasmonic devices.

Author Contributions

Conceptualization, P.P. and S.G.; methodology, P.P. and M.S.; software, D.N and M.T.; validation, P.P. and M.S.; formal analysis, D.N., A.S. and M.T.; investigation, V.K., V.A., K.G., E.A.N., D.I.A. and A.B.; data curation, A.S., M.T., V.K. and D.N.; writing—original draft preparation, D.N.; writing—review and editing, P.P, M.T., A.S., S.G and M.S.; visualization, P.P., A.S., D.I.A. and A.B.; supervision, S.G.; project administration, P.P. and M.S. All authors have read and agreed to the published version of the manuscript.

Funding

This research received no external funding.

Institutional Review Board Statement

Not applicable.

Informed Consent Statement

Not applicable.

Data Availability Statement

Data is contained within the article.

Acknowledgments

V. Stamoulis is acknowledged for assistance in some optical experiments.

Conflicts of Interest

The authors declare no conflict of interest.

References

  1. Le-The, H.; Berenschot, E.; Tiggelaar, R.M.; Tas, N.R.; Van Den Berg, A.; Eijkel, J.C.T. Large-Scale Fabrication of Highly Ordered Sub-20 Nm Noble Metal Nanoparticles on Silica Substrates without Metallic Adhesion Layers. Microsyst. Nanoeng. 2018, 4, 4. [Google Scholar] [CrossRef] [PubMed]
  2. Ossi, P.M.; Neri, F.; Santo, N.; Trusso, S. Noble Metal Nanoparticles Produced by Nanosecond Laser Ablation. Appl. Phys. A 2011, 104, 829–837. [Google Scholar] [CrossRef]
  3. Wang, H.; Qiao, X.; Chen, J.; Ding, S. Preparation of Silver Nanoparticles by Chemical Reduction Method. Colloids Surf. A Physicochem. Eng. Asp. 2005, 256, 111–115. [Google Scholar] [CrossRef]
  4. Wolf, J.B.; Stawski, T.M.; Smales, G.J.; Thünemann, A.F.; Emmerling, F. Towards Automation of the Polyol Process for the Synthesis of Silver Nanoparticles. Sci. Rep. 2022, 12, 5769. [Google Scholar] [CrossRef] [PubMed]
  5. Nguyen, M.T.; Yonezawa, T. Sputtering onto a Liquid: Interesting Physical Preparation Method for Multi-Metallic Nanoparticles. Sci. Technol. Adv. Mater. 2018, 19, 883–898. [Google Scholar] [CrossRef]
  6. Grammatikopoulos, S.; Pappas, S.; Dracopoulos, V.; Poulopoulos, P.; Fumagalli, P.; Velgakis, M.; Politis, C. Self-Assembled Au Nanoparticles on Heated Corning Glass by Dc Magnetron Sputtering: Size-Dependent Surface Plasmon Resonance Tuning. J. Nanopart. Res. 2013, 15, 1446. [Google Scholar] [CrossRef]
  7. Ntemogiannis, D.; Floropoulos, P.; Karoutsos, V.; Grammatikopoulos, S.; Poulopoulos, P.; Alexandropoulos, D. Plasmonic Nanostructuring by Means of Industrial-Friendly Laser Techniques. Photonics 2023, 10, 384. [Google Scholar] [CrossRef]
  8. Chronis, A.G.; Stamatelatos, A.; Grammatikopoulos, S.; Sigalas, M.M.; Karoutsos, V.; Maratos, D.M.; Lysandrou, S.P.; Trachylis, D.; Politis, C.; Poulopoulos, P. Microstructure and Plasmonic Behavior of Self-Assembled Silver Nanoparticles and Nanorings. J. Appl. Phys. 2019, 125, 023106. [Google Scholar] [CrossRef]
  9. Chutrakulwong, F.; Thamaphat, K. Green Synthesis of Silver Nanoparticles Using Durian Rind Extract and Optical Characteristics of Surface Plasmon Resonance-Based Optical Sensor for the Detection of Hydrogen Peroxide. Green Process. Synth. 2023, 12, 20230070. [Google Scholar] [CrossRef]
  10. Hutter, E.; Fendler, J.H. Exploitation of Localized Surface Plasmon Resonance. Adv. Mater. 2004, 16, 1685–1706. [Google Scholar] [CrossRef]
  11. Habibullah, G.; Viktorova, J.; Ruml, T. Current Strategies for Noble Metal Nanoparticle Synthesis. Nanoscale Res. Lett. 2021, 16, 47. [Google Scholar] [CrossRef] [PubMed]
  12. Nalwa, H.S. (Ed.) Encyclopedia of Nanoscience and Nanotechnology. v. 1-10; American Scientific Publishers: Stevenson Ranch, CA, USA, 2004; Volume 8, ISBN 978-1-58883-001-2. [Google Scholar]
  13. Haes, A.J.; Hall, W.P.; Chang, L.; Klein, W.L.; Van Duyne, R.P. A Localized Surface Plasmon Resonance Biosensor: First Steps toward an Assay for Alzheimer’s Disease. Nano Lett. 2004, 4, 1029–1034. [Google Scholar] [CrossRef]
  14. Fei Guo, C.; Sun, T.; Cao, F.; Liu, Q.; Ren, Z. Metallic Nanostructures for Light Trapping in Energy-Harvesting Devices. Light Sci. Appl. 2014, 3, e161. [Google Scholar] [CrossRef]
  15. Zeng, S.; Baillargeat, D.; Ho, H.-P.; Yong, K.-T. Nanomaterials Enhanced Surface Plasmon Resonance for Biological and Chemical Sensing Applications. Chem. Soc. Rev. 2014, 43, 3426. [Google Scholar] [CrossRef] [PubMed]
  16. Salem, M.A.; Bakr, E.A.; El-Attar, H.G. Pt@Ag and Pd@Ag Core/Shell Nanoparticles for Catalytic Degradation of Congo Red in Aqueous Solution. Spectrochim. Acta Part A Mol. Biomol. Spectrosc. 2018, 188, 155–163. [Google Scholar] [CrossRef] [PubMed]
  17. Nazemi, M.; Soule, L.; Liu, M.; El-Sayed, M.A. Ambient Ammonia Electrosynthesis from Nitrogen and Water by Incorporating Palladium in Bimetallic Gold–Silver Nanocages. J. Electrochem. Soc. 2020, 167, 054511. [Google Scholar] [CrossRef]
  18. Henley, S.J.; Carey, J.D.; Silva, S.R.P. Laser-Nanostructured Ag Films as Substrates for Surface-Enhanced Raman Spectroscopy. Appl. Phys. Lett. 2006, 88, 081904. [Google Scholar] [CrossRef]
  19. Pan, C.; Dong, L.; Zhu, G.; Niu, S.; Yu, R.; Yang, Q.; Liu, Y.; Wang, Z.L. High-Resolution Electroluminescent Imaging of Pressure Distribution Using a Piezoelectric Nanowire LED Array. Nat. Photon 2013, 7, 752–758. [Google Scholar] [CrossRef]
  20. Austin, L.A.; Mackey, M.A.; Dreaden, E.C.; El-Sayed, M.A. The Optical, Photothermal, and Facile Surface Chemical Properties of Gold and Silver Nanoparticles in Biodiagnostics, Therapy, and Drug Delivery. Arch. Toxicol. 2014, 88, 1391–1417. [Google Scholar] [CrossRef]
  21. Kvítek, O.; Siegel, J.; Hnatowicz, V.; Švorčík, V. Noble Metal Nanostructures Influence of Structure and Environment on Their Optical Properties. J. Nanomater. 2013, 2013, 743684. [Google Scholar] [CrossRef]
  22. Hezam, A.; Drmosh, Q.A.; Ponnamma, D.; Bajiri, M.A.; Qamar, M.; Namratha, K.; Zare, M.; Nayan, M.B.; Onaizi, S.A.; Byrappa, K. Strategies to Enhance ZnO Photocatalyst’s Performance for Water Treatment: A Comprehensive Review. Chem. Rec. 2022, 22, e202100299. [Google Scholar] [CrossRef] [PubMed]
  23. Munawar, K.; Mansoor, M.A.; Olmstead, M.M.; Zaharinie, T.; Mohd Zubir, M.N.; Haniffa, M.; Basirun, W.J.; Mazhar, M. Fabrication of Ag-ZnO Composite Thin Films for Plasmonic Enhanced Water Splitting. Mater. Chem. Phys. 2020, 255, 123220. [Google Scholar] [CrossRef]
  24. Doustkhah, E.; Esmat, M.; Fukata, N.; Ide, Y.; Hanaor, D.A.H.; Assadi, M.H.N. MOF-Derived Nanocrystalline ZnO with Controlled Orientation and Photocatalytic Activity. Chemosphere 2022, 303, 134932. [Google Scholar] [CrossRef] [PubMed]
  25. Hessien, M. Recent Progress in Zinc Oxide Nanomaterials and Nanocomposites: From Synthesis to Applications. Ceram. Int. 2022, 48, 22609–22628. [Google Scholar] [CrossRef]
  26. Liu, H.-Q.; Yao, C.-B.; Cai, Y.; Yin, H.-T. Synthesis, Photoluminescence and Photocatalytic Characteristics of Ag–ZnO Sandwich Structures. J. Phys. Chem. Solids 2022, 165, 110697. [Google Scholar] [CrossRef]
  27. Rashid, J.; Barakat, M.A.; Salah, N.; Habib, S.S. Ag/ZnO Nanoparticles Thin Films as Visible Light Photocatalysts. RSC Adv. 2014, 4, 56892–56899. [Google Scholar] [CrossRef]
  28. Alrebdi, T.A.; Ahmed, H.A.; Alkallas, F.H.; Pashameah, R.A.; Alrefaee, S.H.; Alsubhe, E.; Mostafa, A.M.; Mwafy, E.A. Ag/ZnO Thin Film Nanocomposite Membrane Prepared by Laser-Assisted Method for Catalytic Degradation of 4-Nitrophenol. Membranes 2022, 12, 732. [Google Scholar] [CrossRef] [PubMed]
  29. Nie, M.; Liao, J.; Cai, H.; Sun, H.; Xue, Z.; Guo, P.; Wu, M. Photocatalytic Property of Silver Enhanced Ag/ZnO Composite Catalyst. Chem. Phys. Lett. 2021, 768, 138394. [Google Scholar] [CrossRef]
  30. Singh, S. Natural Sunlight Driven Photocatalytic Performance of Ag/ZnO Nanocrystals. Mater. Today Commun. 2022, 33, 104438. [Google Scholar] [CrossRef]
  31. Wang, T.-J.; Huang, Y.-T.; Liu, Z.-Y.; Barveen, N.R. Photochemical Synthesis of ZnO/Ag Heterogeneous Nanostructure on Chemically Patterned Ferroelectric Crystals for High Performance SERS Detection. J. Alloys Compd. 2021, 864, 158120. [Google Scholar] [CrossRef]
  32. Koleva, M.E.; Nedyalkov, N.N.; Atanasov, P.A.; Gerlach, J.W.; Hirsch, D.; Prager, A.; Rauschenbach, B.; Fukata, N.; Jevasuwan, W. Porous Plasmonic Nanocomposites for SERS Substrates Fabricated by Two-Step Laser Method. J. Alloys Compd. 2016, 665, 282–287. [Google Scholar] [CrossRef]
  33. Zheng, Y.; Li, M.; Wen, X.; Ho, H.-P.; Lu, H. Nanostructured ZnO/Ag Film Prepared by Magnetron Sputtering Method for Fast Response of Ammonia Gas Detection. Molecules 2020, 25, 1899. [Google Scholar] [CrossRef] [PubMed]
  34. Dare, E.; Adanu-Ogbole, B.; Oladoyinbo, F.; Makinde, F.; Uzosike, A.O. Synthesis and Characterization of Silver–Zinc Oxide Nanocomposites for Humidity Sensing. Nano Select 2023, 4, 255–262. [Google Scholar] [CrossRef]
  35. Kanimozhi, G.; Vinoth, S.; Kumar, H.; Srinadhu, E.S.; Satyanarayana, N. Electrospun Nanocomposite Ag–ZnO Nanofibrous Photoanode for Better Performance of Dye-Sensitized Solar Cells. J. Electron. Mater. 2019, 48, 4389–4399. [Google Scholar] [CrossRef]
  36. Tran, T.H.; Tran, T.N.A.; Bach, T.C.; Sai, C.D.; Pham, N.H.; Tran, V.T.; Nguyen, T.B.; Nguyen, Q.H.; Pham, V.T.; Doan, Q.K.; et al. Effect of Annealing on the Properties of Transparent Conducting Ag Doped ZnO Thin Films Prepared by r.f. Magnetron Sputtering Method. Micro Nanostruct. 2022, 166, 207219. [Google Scholar] [CrossRef]
  37. Sarkar, A.; Gogurla, N.; Bhaktha, B.N.S.; Ray, S.K. Plasmonic Enhanced Optical Characteristics of Ag Nanostructured ZnO Thin Films. Mater. Res. Express 2016, 3, 046403. [Google Scholar] [CrossRef]
  38. Xu, L.; Miao, J.; Chen, Y.; Su, J.; Yang, M.; Zhang, L.; Zhao, L.; Ding, S. Characterization of Ag-Doped ZnO Thin Film for Its Potential Applications in Optoelectronic Devices. Optik 2018, 170, 484–491. [Google Scholar] [CrossRef]
  39. Rajkumar, P.; Barman, D.; Kashyap, A.; Sarma, B.K. Realization of ZnO Microrods and Ag Nanoparticles on Glass and Si Substrates by Magnetron Sputtering and near Band Edge Photoluminescence Enhancement from the Exciton-Plasmon System. Mater. Lett. 2022, 325, 132898. [Google Scholar] [CrossRef]
  40. Da Silva, D.J.; Duran, A.; Cabral, A.D.; Fonseca, F.L.A.; Bueno, R.F.; Rosa, D.S. Questioning ZnO, Ag, and Ag/ZnO Nanoparticles as Antimicrobial Agents for Textiles: Do They Guarantee Total Protection against Bacteria and SARS-CoV-2? J. Photochem. Photobiol. B Biol. 2022, 234, 112538. [Google Scholar] [CrossRef]
  41. Mtavangu, S.G.; Machunda, R.L.; Van Der Bruggen, B.; Njau, K.N. In Situ Facile Green Synthesis of Ag–ZnO Nanocomposites Using Tetradenia Riperia Leaf Extract and Its Antimicrobial Efficacy on Water Disinfection. Sci. Rep. 2022, 12, 15359. [Google Scholar] [CrossRef]
  42. Karunakaran, C.; Rajeswari, V.; Gomathisankar, P. Antibacterial and Photocatalytic Activities of Sonochemically Prepared ZnO and Ag–ZnO. J. Alloys Compd. 2010, 508, 587–591. [Google Scholar] [CrossRef]
  43. Nagajyothi, P.C.; Muthuraman, P.; Tettey, C.O.; Yoo, K.; Shim, J. In Vitro Anticancer Activity of Eco-Friendly Synthesized ZnO/Ag Nanocomposites. Ceram. Int. 2021, 47, 34940–34948. [Google Scholar] [CrossRef]
  44. Rafique, S.; Bashir, S.; Akram, R.; Jawaid, S.; Bashir, M.; Aftab, A.; Attique, A.; Awan, S.U. In Vitro Anticancer Activity and Comparative Green Synthesis of ZnO/Ag Nanoparticles by Moringa Oleifera, Mentha Piperita, and Citrus Lemon. Ceram. Int. 2023, 49, 5613–5620. [Google Scholar] [CrossRef]
  45. Praveena, R.; Sameera, V.S.; Mohiddon, M.A.; Krishna, M.G. Surface Plasmon Resonance, Photoluminescence and Surface Enhanced Raman Scattering Behaviour of Ag/ZnO, ZnO/Ag and ZnO/Ag/ZnO Thin Films. Phys. B Condens. Matter 2019, 555, 118–124. [Google Scholar] [CrossRef]
  46. Roy, R.K.; Bandyopadhyaya, S.; Pal, A.K. Surface Plasmon Resonance in Nanocrystalline Silver in a ZnO Matrix. Eur. Phys. J. B 2004, 39, 491–498. [Google Scholar] [CrossRef]
  47. Garoufalis, C.S.; Poulopoulos, P.; Bouropoulos, N.; Barnasas, A.; Baskoutas, S. Growth and Optical Properties of Fe2O3 Thin Films: A Study of Quantum Confinement Effects by Experiment and Theory. Phys. E Low-Dimens. Syst. Nanostruct. 2017, 89, 67–71. [Google Scholar] [CrossRef]
  48. Moharam, M.G.; Gaylord, T.K. Rigorous Coupled-Wave Analysis of Metallic Surface-Relief Gratings. J. Opt. Soc. Am. A 1986, 3, 1780. [Google Scholar] [CrossRef]
  49. Stamatelatos, A.; Tsarmpopoulou, M.; Chronis, A.G.; Kanistras, N.; Anyfantis, D.I.; Violatzi, E.; Geralis, D.; Sigalas, M.M.; Poulopoulos, P.; Grammatikopoulos, S. Optical Interpretation for Plasmonic Adjustment of Nanostructured Ag-NiO Thin Films. Int. J. Mod. Phys. B 2021, 35, 2150093. [Google Scholar] [CrossRef]
  50. Grammatikopoulos, S.; Stamatelatos, A.; Delimitis, A.; Sousanis, A.; Chrisanthopoulou, A.; Trachylis, D.; Politis, C.; Poulopoulos, P. Growth of Au Nanoparticles in NiO via Short Annealing of Precursor Material Thin Film and Optimization of Plasmonics. Phys. Status Solidi A 2017, 214, 1700303. [Google Scholar] [CrossRef]
  51. Tsarmpopoulou, M.; Chronis, A.G.; Sigalas, M.; Stamatelatos, A.; Poulopoulos, P.; Grammatikopoulos, S. Calculation of the Localized Surface Plasmon Resonances of Au Nanoparticles Embedded in NiO. Solids 2022, 3, 55–65. [Google Scholar] [CrossRef]
  52. Stamatelatos, A.; Tsarmpopoulou, M.; Geralis, D.; Chronis, A.G.; Karoutsos, V.; Ntemogiannis, D.; Maratos, D.M.; Grammatikopoulos, S.; Sigalas, M.; Poulopoulos, P. Interpretation of Localized Surface Plasmonic Resonances of Gold Nanoparticles Covered by Polymeric Coatings. Photonics 2023, 10, 408. [Google Scholar] [CrossRef]
  53. Kravets, V.G.; Kabashin, A.V.; Barnes, W.L.; Grigorenko, A.N. Plasmonic Surface Lattice Resonances: A Review of Properties and Applications. Chem. Rev. 2018, 118, 5912–5951. [Google Scholar] [CrossRef] [PubMed]
  54. Wokaun, A.; Gordon, J.P.; Liao, P.F. Radiation Damping in Surface-Enhanced Raman Scattering. Phys. Rev. Lett. 1982, 48, 957–960. [Google Scholar] [CrossRef]
Figure 1. (a) Typical absorbance spectra of the continuous Ag films in the as-deposited state. (b) AFM image of the film used for thickness evaluation (Ag #1). (c) AFM image of the scratch area as well as its profile. (d) Nanoparticle diameter distribution of Ag #1 film along with log-normal fitting.
Coatings 14 00069 g001
Figure 2. Continuous Ag film (Ag #3–12 nm) (left) before and (right) after annealing at 440 °C for 30 min.
Coatings 14 00069 g002
Figure 3. UV-Vis spectra for the two post-annealed films (Ag #2 and Ag #3) before and after covering with ZnO, as well as for 70 nm net ZnO (Zone #1). A.u. stands for arbitrary units.
Coatings 14 00069 g003
Figure 4. (a,c) AFM image of Ag #2 film (6 nm) after annealing at 440 °C for 5 min and its NP diameter distribution. (b,d) AFM image of Ag #3 film (12 nm) after annealing at 440 °C for 30 min and its NP diameter distribution. (e,g) AFM image of Ag #2 film (6 nm) after covering the previously annealed film with ZnO and its NP diameter distribution. (f,h) AFM image of Ag #3 film (12 nm) after covering the previously annealed film with ZnO and its NP diameter distribution.
Coatings 14 00069 g004aCoatings 14 00069 g004b
Figure 5. SEM images showing surface topography of the samples AgZnO #2 (a) and AgZnO #3 (b). SEM-EDS mapping images of Ag (c,d) and Zn (e,f) elements. EDS element spectrum for the specimens AgZnO #2 (g) and AgZnO #3 (h).
Coatings 14 00069 g005
Figure 6. UV-Vis spectra for the film grown at 440 °C (Ag #4) before (solid) and after (dashed line) covering with ZnO.
Coatings 14 00069 g006
Figure 7. The system of Ag NPs on glass substrate surrounded by ZnO. Side view (left) and top view (right). “a” represents the lattice constant, “d” the diameter of the NPs, “t2” their height and “t1“the thickness of the dielectric medium.
Coatings 14 00069 g007
Figure 8. The calculated absorbance spectrum of Ag NPs surrounded by air or ZnO. (a,b) correspond to case (i), (c,d) to case (ii), (e,f) to case (iii) and (g,h) to case (iv).
Coatings 14 00069 g008aCoatings 14 00069 g008b
Figure 9. The calculated absorbance spectrum of Ag NPs surrounded by ZnO compared to Ag NPs surrounded by air, for various thickness values (t1). Four different cases were studied: (a) d = 60 nm, a = 120 nm, t2 = 30 nm; (b) d = 90 nm, a = 135 nm, t2 = 45 nm; (c) d = 120 nm, a = 360 nm, t2 = 60 nm; (d) d = 150 nm, a = 225 nm, t2 = 75 nm.
Coatings 14 00069 g009
Table 1. List of all films deposited and their associated thermal processing and NP growth method.
Film—ThicknessGrowth Method
Ag #1, 33 nmRF magnetron sputtering
Ag #2, 6 nmRF magnetron sputtering and post-deposition annealing @ 440 °C for 5′
Ag #3, 12 nmRF magnetron sputtering and post-deposition annealing @ 440 °C for 30′
Ag #4, 18 nmDC magnetron sputtering on heated substrate @ 440 °C
ZnO #1, 70 nmRF magnetron sputtering
AgZnO #2, 70 nmRF magnetron sputtering (on Ag #2 NPs)
AgZnO #3, 70 nmRF magnetron sputtering (on Ag #3 NPs)
AgZnO #4, 70 nmRF magnetron sputtering (on Ag #4 NPs)
Table 2. LPSR characteristics for all specimens along with information about their thermal treatment.
Specimen—ThicknessThermal TreatmentLSPR
Position
(eV)
LSPR
Amplitude
(a.u.)
FWHM
(eV)
LSPR
Position
(eV)
LSPR
Amplitude
(a.u.)
FWHM
(eV)
1st peak2nd peak
Ag #2
(6 nm)
Post-deposition annealing @ 440 °C for 5′2.7740.5870.5213.5030.1470.384
Ag #3
(12 nm)
Post-deposition annealing @ 440 °C for 30′2.4600.5180.7373.4250.2800.449
Ag #4
(18 nm)
Deposition on heated substrate @ 440 °C2.5051.1040.9553.5220.2200.299
AgZnO #2
(6 nm)
-2.4030.6440.655---
AgZnO #3
(12 nm)
-1.8870.4730.6952.4650.36680.422
AgZnO #4
(18 nm)
-2.0291.4870.8622.7370.7880.612
Table 3. Investigated cases with all the fundamental parameters.
CaseDiameter
(d)
Lattice Constant
(a)
Dielectric Medium Thickness (t1)NP Height
(t2)
(i)d = 60 nm75 nm70 nm30 nm
90 nm
120 nm
150 nm
(ii)d = 90 nm113 nm70 nm45 nm
135 nm
180 nm
270 nm
(iii)d = 120 nm144 nm70 nm60 nm
180 nm
240 nm
360 nm
(iv)d = 150 nm188 nm70 nm75 nm
225 nm
300 nm
450 nm
Disclaimer/Publisher’s Note: The statements, opinions and data contained in all publications are solely those of the individual author(s) and contributor(s) and not of MDPI and/or the editor(s). MDPI and/or the editor(s) disclaim responsibility for any injury to people or property resulting from any ideas, methods, instructions or products referred to in the content.

