Article

Ceramic–Titanium Alloy Artificial Hip Joint Wear Simulation and Experimental Study

1
College of Mechanical Engineering, Zhejiang University of Technology, Hangzhou 310014, China
2
Key Laboratory of Special Purpose Equipment and Advanced Processing Technology, Zhejiang University of Technology, Hangzhou 310014, China
3
Chinese Academy of Housing and Real Estate, Zhejiang University of Technology, Hangzhou 310014, China
*
Author to whom correspondence should be addressed.
Coatings 2023, 13(8), 1321; https://doi.org/10.3390/coatings13081321
Submission received: 18 June 2023 / Revised: 18 July 2023 / Accepted: 21 July 2023 / Published: 27 July 2023
(This article belongs to the Special Issue Investigations and Applications in Advanced Materials Processing)

Abstract

:
The wear of artificial joints can lead to joint noise and tissue pathology within the human body, which is a primary factor affecting their service life. In response to the issue of wear in ceramic–titanium alloy artificial hip joints, this study employed hip joint wear simulations and experimental wear testing on hip joint specimens to investigate the impact of different contact surface parameters on the wear of ceramic–titanium alloy articulating surfaces. The objective was to provide guidance for joint surface treatment to minimize wear. The simulation results demonstrated that the contacting surfaces of the articulating components exhibited a crescent-shaped surface composition before and after wear. The initial variation in the surface friction coefficient had minimal influence on the wear rate after stabilization, whereas excessively high friction coefficients led to erratic changes in wear depth. Based on the simulation results, experimental research was conducted to compare the wear results of different surface roughness values ranging from 60 to 550 nm. The findings revealed that a surface roughness of 150 nm exhibited the least amount of wear and the best anti-wear performance. Furthermore, an exploration of the mechanism behind the influence of different surface friction coefficients on the wear of the articulating surfaces provided valuable insights for surface processing and wear analysis of artificial joints.

1. Introduction

The human joints, as the connecting points between bones, bear loads and serve as pivotal elements for movement, providing the essential conditions for normal productive labor [1]. Depending on the type of movement, joints can be classified as mobile joints, slightly movable joints, and immovable joints. In recent years, frequent natural disasters and traffic accidents have led to an increase in the total number of patients with joint diseases in our country. Currently, for joint diseases, conservative treatment using medication is usually given priority. In cases where the desired outcomes cannot be achieved or when the condition has reached a severe stage, surgical intervention in the form of artificial joint replacement is performed, effectively treating end-stage joint diseases caused by factors such as aging, injury, and infection [2,3].
The International Forum on Articular Joints has pointed out that there are approximately 1.5 million patients in China who require artificial joint replacement surgery for treatment [4,5]. The technology of artificial joint replacement has become widespread and can effectively eliminate joint pain, restore the original function of the joint, and enable patients to work, shop, travel, and participate in sports activities like normal individuals, providing significant convenience in the lives of patients with joint diseases [6,7]. In the 1960s, Charnley from the United Kingdom proposed the Charnley-type total hip joint prosthesis for the treatment of rheumatoid arthritis [8]. This involved the use of polytetrafluoroethylene for the acetabulum, stainless steel material for a femoral head with a diameter of 22.5 mm, and fixation with polymethyl methacrylate, resulting in a joint prosthesis with excellent anti-friction performance, thus laying the foundation for the development of artificial joint replacement surgery. In the past 20 years, significant progress has been made in the rational optimization of the structural design and materials of artificial joints such as hip, elbow, shoulder, ankle, and knee joints [9,10], with particular emphasis on hip and knee joints as the main focus of experimental research on artificial joints. In addition to having good compatibility and mechanical properties, artificial joint materials also need to exhibit favorable biotribological properties, including strong wear resistance, minimal adverse effects of wear debris on the human body, excellent corrosion resistance, and no material degradation or adverse reactions with surrounding tissues inside the human body [11,12].
Hip prostheses are medical devices used to replace damaged or diseased hip joints. They are designed to restore mobility and alleviate pain in individuals suffering from conditions such as osteoarthritis, rheumatoid arthritis, or hip fractures [13]. The success of a hip prosthesis depends on various factors, including its material composition and tribological properties, which determine its wear resistance, frictional behavior, and long-term performance. One significant advancement in hip prosthesis materials is the use of ceramic components, particularly alumina and zirconia [14]. These ceramics offer excellent biocompatibility, high hardness, and low wear rates compared to traditional metal-on-polyethylene combinations. Ceramic-on-ceramic articulations have demonstrated superior wear properties and reduced friction, resulting in decreased implant wear and increased longevity [15]. Additionally, ceramics are highly resistant to chemical degradation and are well-tolerated by the surrounding tissues. Furthermore, the field of hip prosthesis materials is continuously evolving to improve the tribological properties of implants. Ceramic-on-ceramic articulations, metal-on-metal implants, highly crosslinked polyethylene, and advanced composites represent some of the promising options with enhanced wear resistance and frictional characteristics [16]. However, it is important to note that the selection of the most suitable material for a hip prosthesis depends on factors like patient age, activity level, and specific clinical considerations, and should be determined through careful evaluation and consultation with healthcare professionals.
Artificial hip joints are a typical type of ball-and-socket joint, and ceramic–titanium alloy combinations have good biocompatibility and corrosion resistance, making them promising for development. Hip joint prostheses experience particle wear, adhesive wear, fatigue wear, as well as erosive and corrosive wear due to long-term exposure to the human body environment during bodily movements. To address the issues of expensive cost and time-consuming nature of lifespan pretesting for artificial hip joints, Liu et al. [17] conducted finite element simulation analysis based on the Archard wear model and short-term wear experiments on metal-on-metal hip joints. Tandler et al. [18] conducted simulation studies on tool wear during milling of difficult-to-machine titanium alloys. Federici et al. [19] conducted research on the influence of surface roughness on friction and wear characteristics.
Friction-wear simulations and experiments have significant guidance implications for guiding surface treatments and reducing wear in joints. In this study, a friction-wear model was established for the acetabular joint contact of artificial hip joints. Finite element analysis software was further developed to numerically simulate the wear of titanium alloy acetabula based on the Archard wear model. The influence of different contact surface friction coefficients on wear results was compared and summarized, providing theoretical guidance for wear experiments on acetabular joints. Custom-shaped specimens representing the acetabular joint contact of artificial hip joints were fabricated for friction-wear experiments. The effects of different surface roughness values on specimen wear and wear morphology were compared, providing experimental guidance for determining the appropriate surface roughness values and understanding the wear mechanisms in titanium alloy artificial joints.

2. Mechanism of Wear Erosion

Friction occurs between the femoral head and the acetabulum in artificial hip joints during relative sliding and rotational movements [20,21]. This results in the removal of material from the softer surface or the corrosion-induced reduction of the implant material in the surrounding human body environment. These phenomena are considered joint wear, which is the primary cause of hip joint failure. Three fundamental characteristics of tribological behavior were proposed and substantiated: time-dependence, system-dependence, and multidisciplinary coupling [22,23,24]. These characteristics laid the foundation for further research in tribology. Time-dependence refers to the continuous variation of the contact surface state, wear behavior, and friction behavior of the mating surfaces over time during the frictional process. System-dependence emphasizes that tribological behavior is influenced by the composition of the system, including material properties and surface topography of the tribological pair.

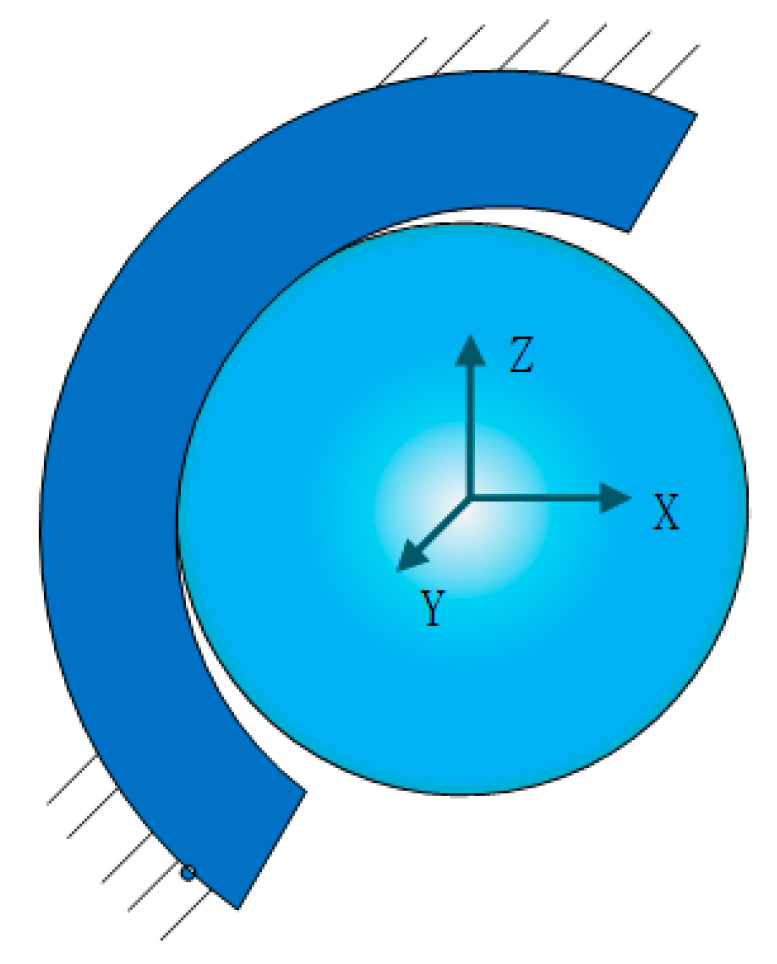
2.1. Motion Analysis of the Human Hip Joint

The human hip joint is a ball-and-socket joint, where the movement of the hip joint involves sliding and rotation of the femoral head within the acetabulum. The motion of the hip joint during daily activities is relatively complex [25]. In theoretical analysis, it is often decomposed and simplified into three primary movements: abduction–adduction motion around the X-axis, flexion–extension motion around the Y-axis, and internal–external rotation motion around the Z-axis, as shown in Figure 1.
According to the international standard ISO14242-1, the angles of rotational motion of the hip joint around the three axes are not the same, and their magnitudes vary with different motion states. During normal human walking, the gait cycle has a duration of 1 s. The variation of the rotational angle of the hip joint within the gait cycle is represented by Equations (1)–(3).
The angle of hip joint abduction–adduction motion within the gait cycle, Φ, can be expressed as:
Φ = { 4 sin ( 2.38 π t ) + 3 ( 0 t 0.2 ) 5.5 sin ( 2.38 π t ) + 1.5 ( 0.2 t 0.61 ) 4 sin ( 0.26 π + 2 π t ) ( 0.61 < t 1 )
The angle of hip joint internal–external rotation motion within the gait cycle, τ, can be expressed as:
τ = 6 sin ( 1.5 π + 2 π t ) 4 ( 0 t 1 )
The angle of hip joint flexion–extension motion within the gait cycle, σ, can be expressed as:
σ = 21.5 cos ( 2 π t ) + 3.5 ( 0 t 1 )
During the gait motion, the direction and magnitude of forces acting on the hip joint vary in real time. According to the international standard ISO14242-1, the variation of vertical load on the hip joint during the gait cycle for a male weighing 75 kg can be described by Equation (4). It can be represented graphically in the form of a curve, as shown in Figure 2.
F Z = { 930441.23625 t 4 + 1135491.19487 t 3 446360.76549 t 3 + 60926.33664 t + 300 ( 0 < t < 0.61 )   300 ( 0.61 < t < 1 )

2.2. Based on Archard’s Wear Prediction Model

Professor Archard from the United Kingdom proposed the Archard wear model [26], which extends the application of the model from adhesive wear to include fatigue wear, abrasive wear, and corrosive wear. In Archard’s macroscopic wear theory, it is assumed that wear occurs due to the removal of debris from the surface of the object, and the removed debris is assumed to be hemispherical with an average radius of r [27]. Therefore, the actual contact area is given by:
A = N π r 2
where N represents the number of contact points, and r represents the radius of the debris.
Let the load acting on each contact point be denoted as pi:
p i = σ s π r 2
where σs is the yield strength of the worn material.
Thus, the total load P can be calculated as:
P = N p i π r 2
The volume of an individual abrasive particle generated during the wear process is defined as half of a sphere with a certain radius. Therefore, the wear volume per unit distance caused by multiple abrasive particles, v, is given by:
v = i = 1 N 2 3 π r 3 2 r = 1 3 i = 1 N π r 2 = 1 3 N π r 2
Assuming the sliding distance during wear is denoted as L, the total wear volume V can be expressed as follows:
V = v L = 1 3 N π r 2 L = 1 3 P L σ s
Assuming that the material hardness H is equal to the yield strength, and considering N contact points, the probability of a contact point being worn into an abrasive particle is denoted as m. Therefore, the final wear volume can be expressed as follows:
V = m P L 3 H
The Archard model bears resemblance to the Holm model in its form; however, the Archard model has a wider applicability and is currently the most widely used wear model. According to the Archard model, the wear volume of a material is directly proportional to the normal load and sliding distance, while inversely proportional to the hardness of the softer material in the friction pair [28]. By converting the wear volume in the Archard model to wear depth, the Archard wear model can be modified as follows:
V = m P L 3 H h A = m P L 3 H h = m P L 3 H A = k p L
where h represents the wear depth, A denotes the contact area, p represents the local contact stress, k is the local linear wear coefficient, and L represents the sliding distance.
Therefore, the relationship between the wear depth at various points on the contact surface, the contact stress at those points, and the sliding velocity can be determined by applying the Archard wear correction model.

3. Development of Hip Joint Model and Wear Simulation Analysis

The hip joint is one of the most widely demanded artificial joints. In order to improve the patient’s condition and enable normal daily activities after implantation, it is important to simulate the daily activities of the prosthesis as accurately as possible and estimate its usage conditions. Numerical simulation is a powerful tool to address the engineering problems that cannot be directly solved by experiment [29,30,31,32,33,34]. In this study, a wear model of the hip joint was established using ABAQUS finite element software, and further development was conducted. The wear of titanium alloy acetabulum with different surface contact friction coefficients was simulated, and the variations in wear depth were obtained. This provides a theoretical research foundation for friction and wear experiments on the articular surface of the hip joint.

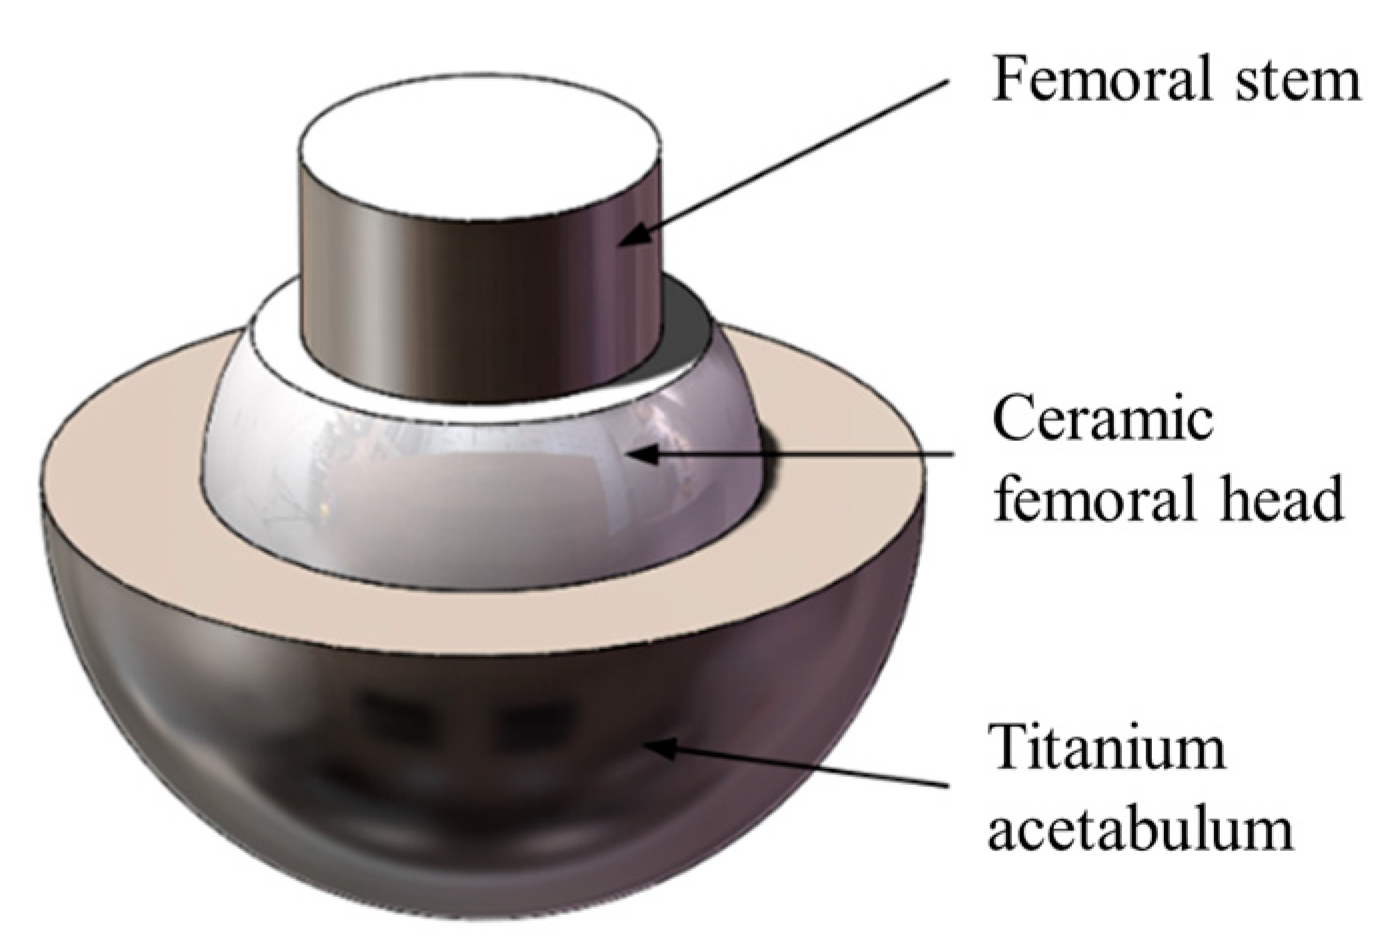
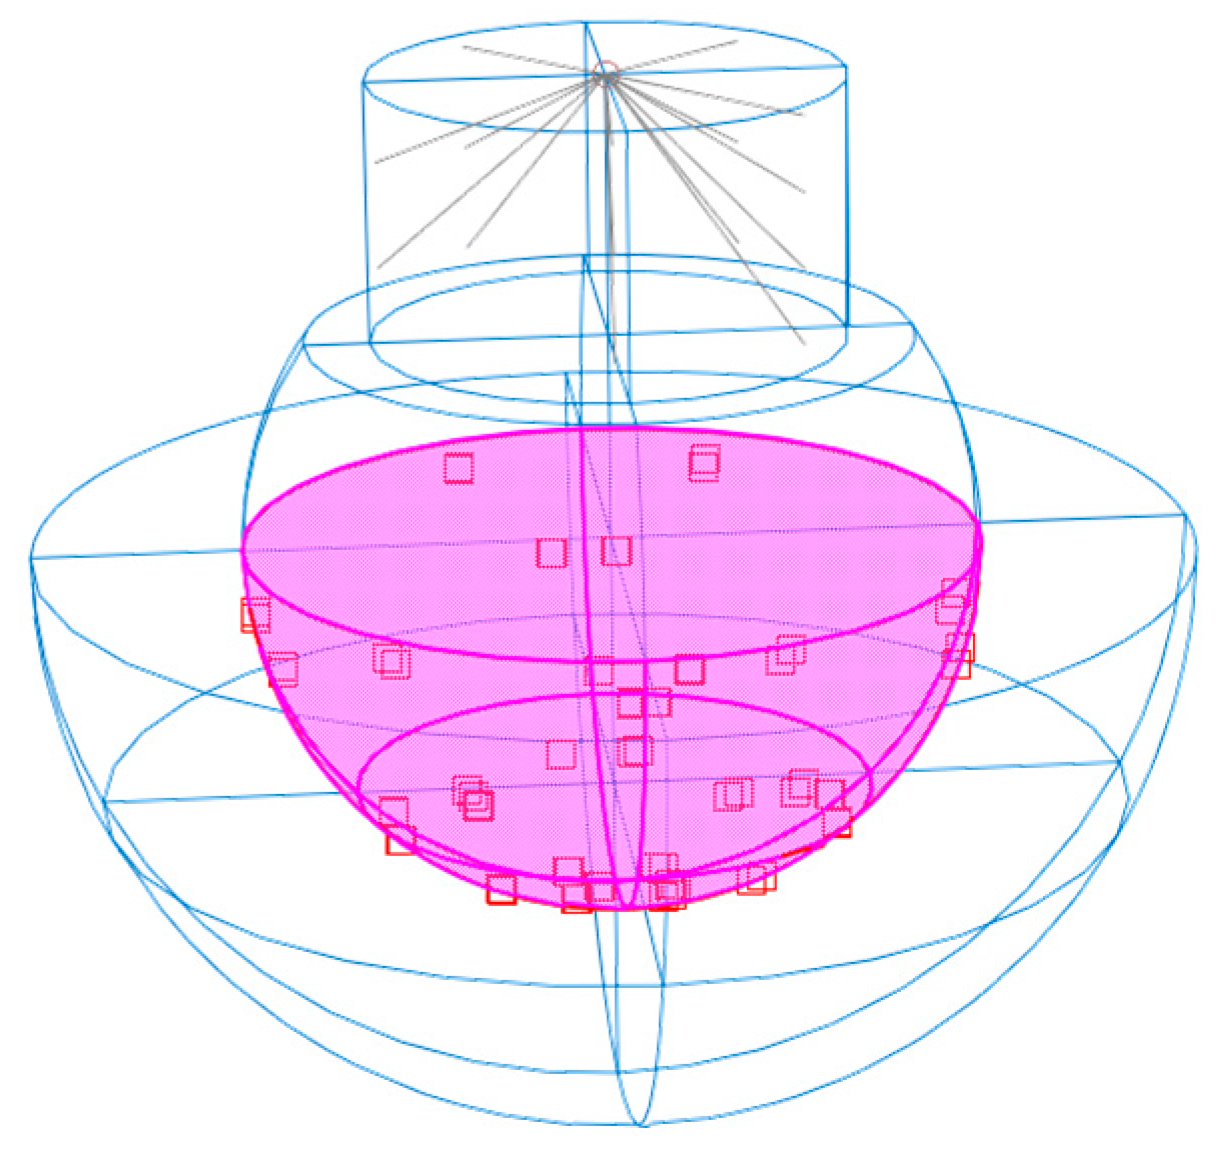
3.1. Development of Hip Joint Model

This paper established a hip joint model with a radial clearance of 0.05 mm. The diameter of the femoral head was 28 mm, and the diameter of the acetabular socket was 28.1 mm. The assembly was performed by connecting the bottom of the acetabulum to the top of the femoral head, with tangential contact at the lowest point of the acetabulum. The three-dimensional model is shown in Figure 3.
In this study, wear simulation was conducted on the ceramic–titanium alloy pair of artificial hip joints. The artificial femoral head was made of zirconia ceramic, while TC4 titanium alloy was selected as the femoral stem and acetabular material. The material properties of the components are defined as shown in Table 1, and the analysis steps are specified in Table 2.
Face-to-face discrete contact was selected. Due to the higher hardness of ceramic material compared to titanium alloy material, wear mainly occurs at the titanium alloy acetabulum. Therefore, the internal surface of the titanium alloy acetabulum was defined as the secondary surface, and the external surface of the ceramic femoral head was defined as the primary surface, as shown in Figure 4.
Applying the penalty function friction model, based on available data [35], the friction coefficient of the human hip joint is approximately 0.01, while the initial friction coefficient of the artificial joint materials is around 0.05. Therefore, friction coefficients of 0.05, 0.1, 0.2, and 0.3 were set for simulation analysis.

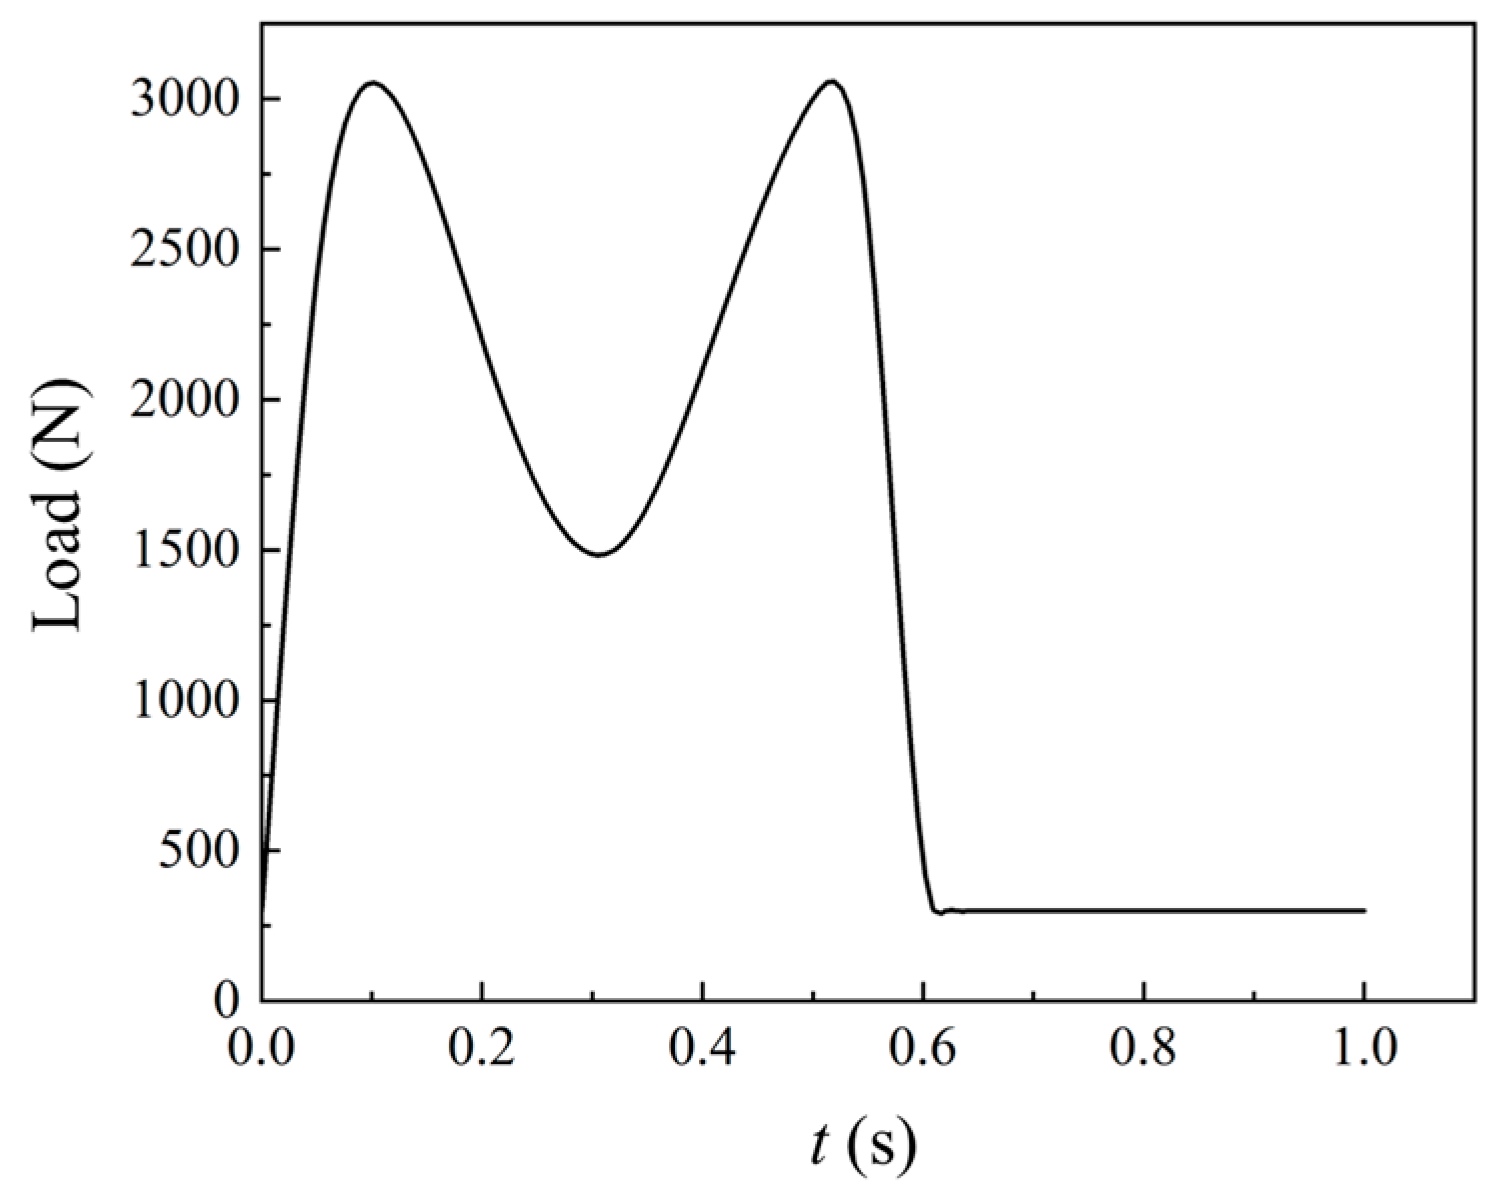
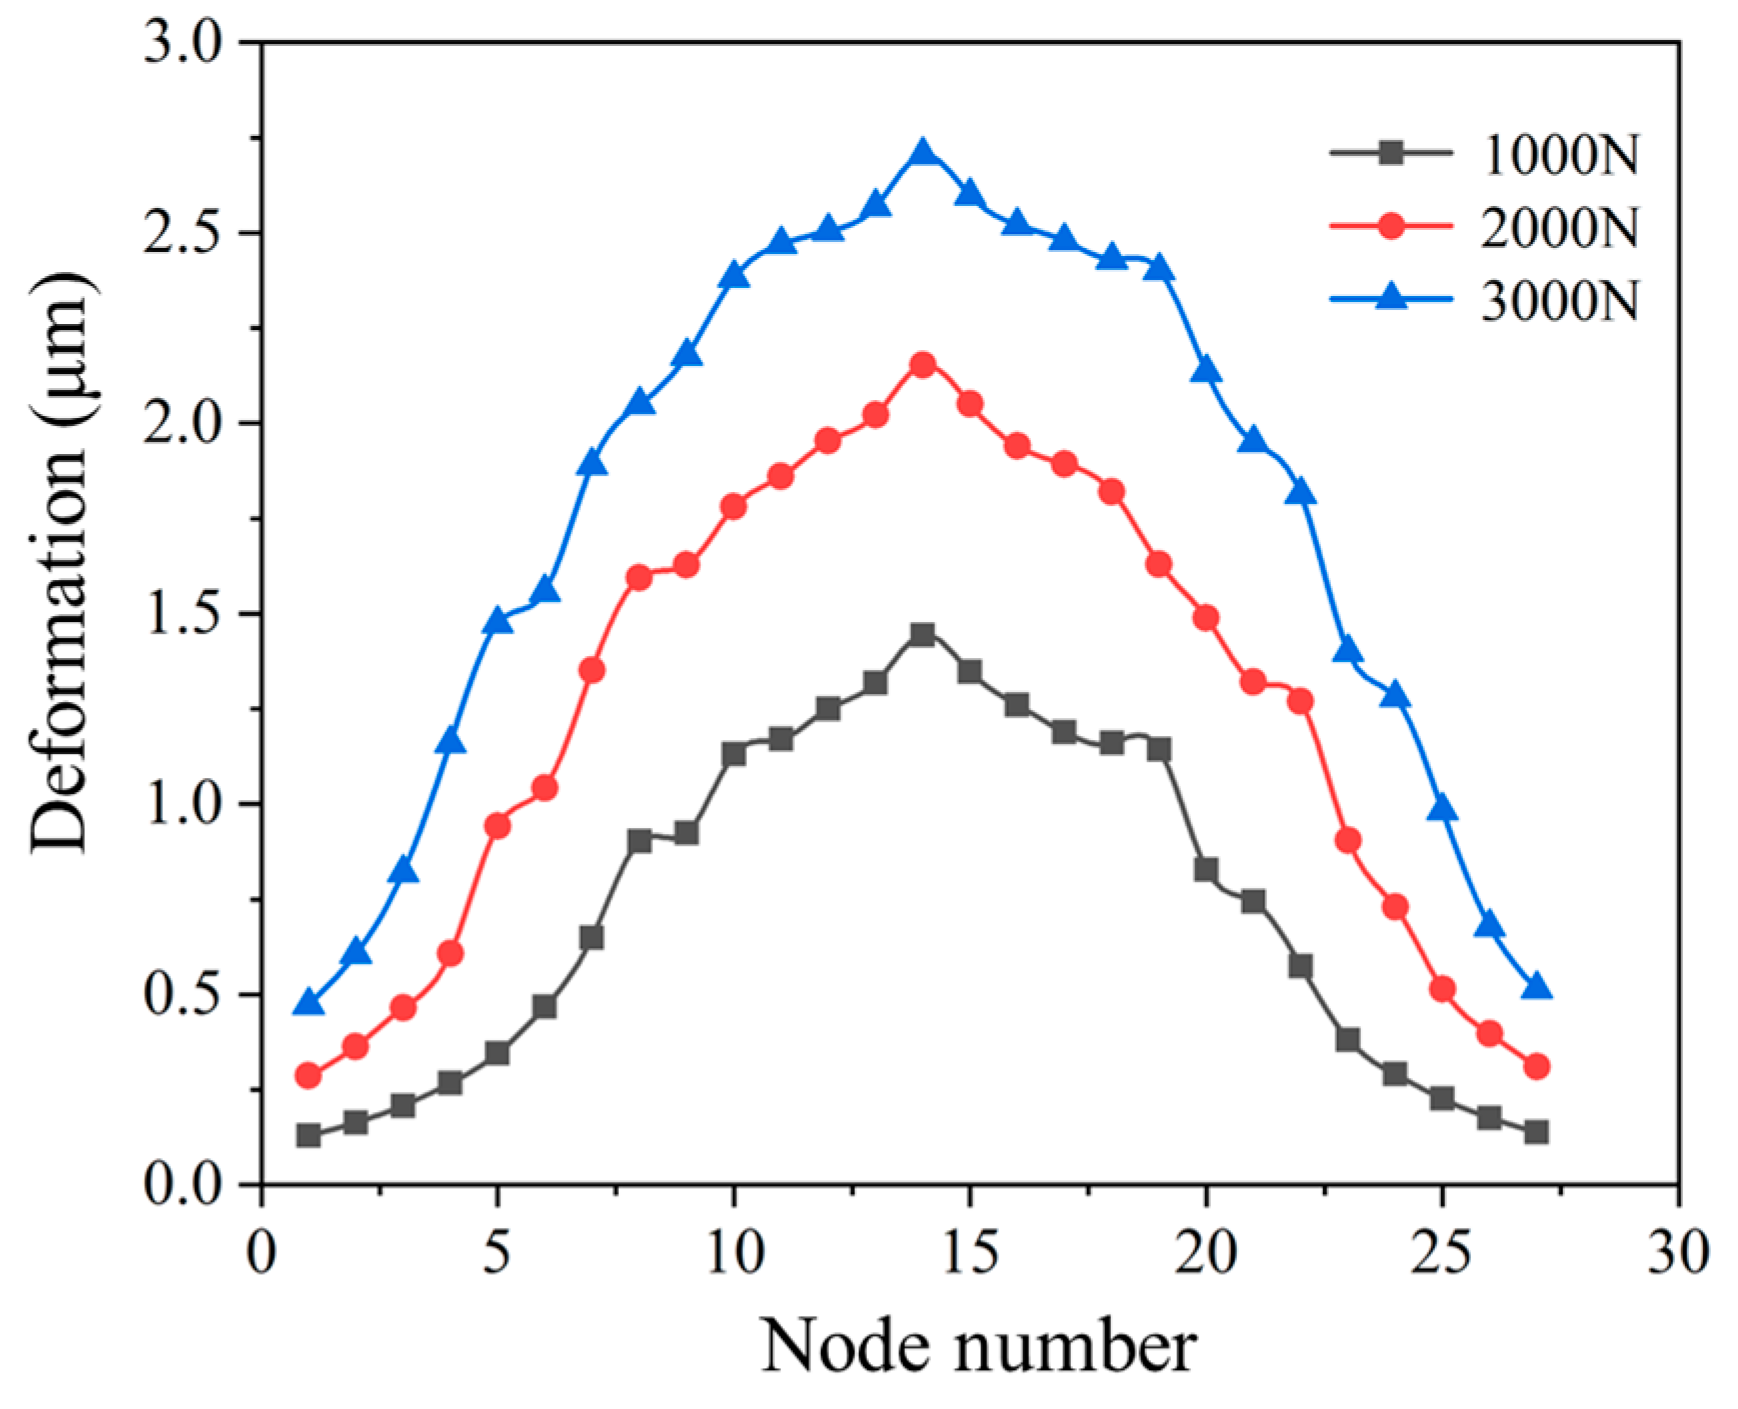
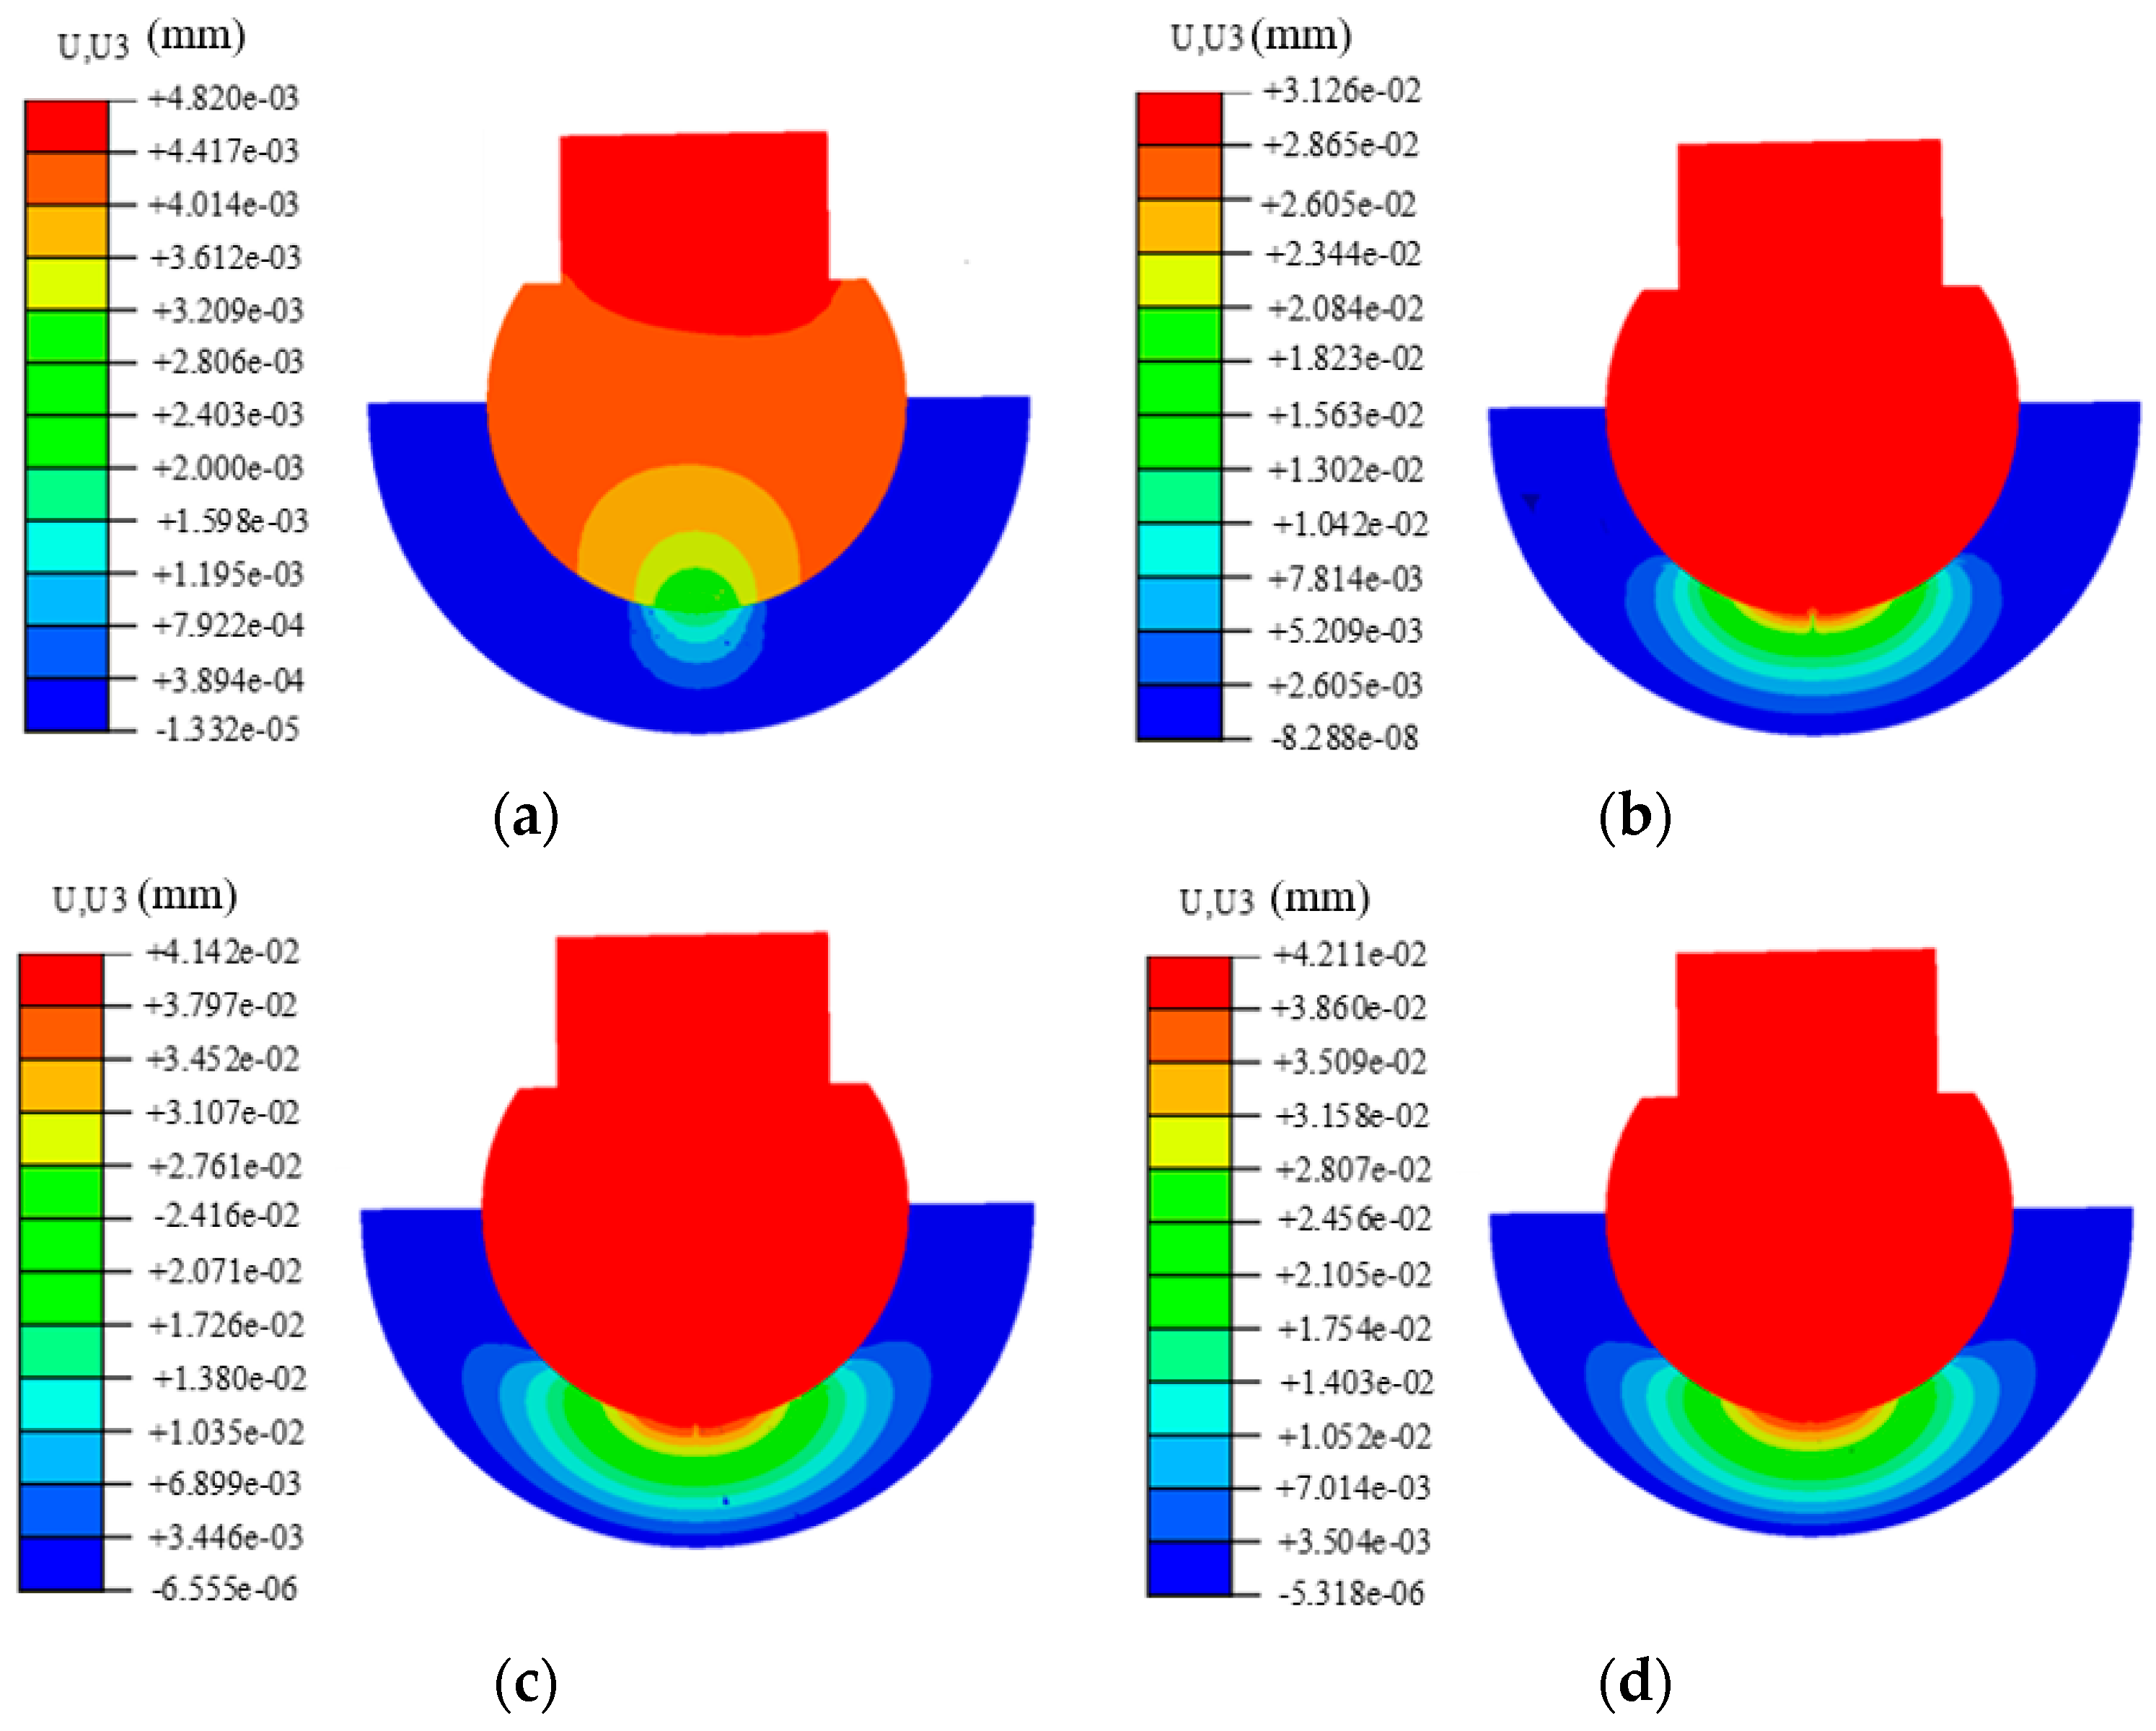
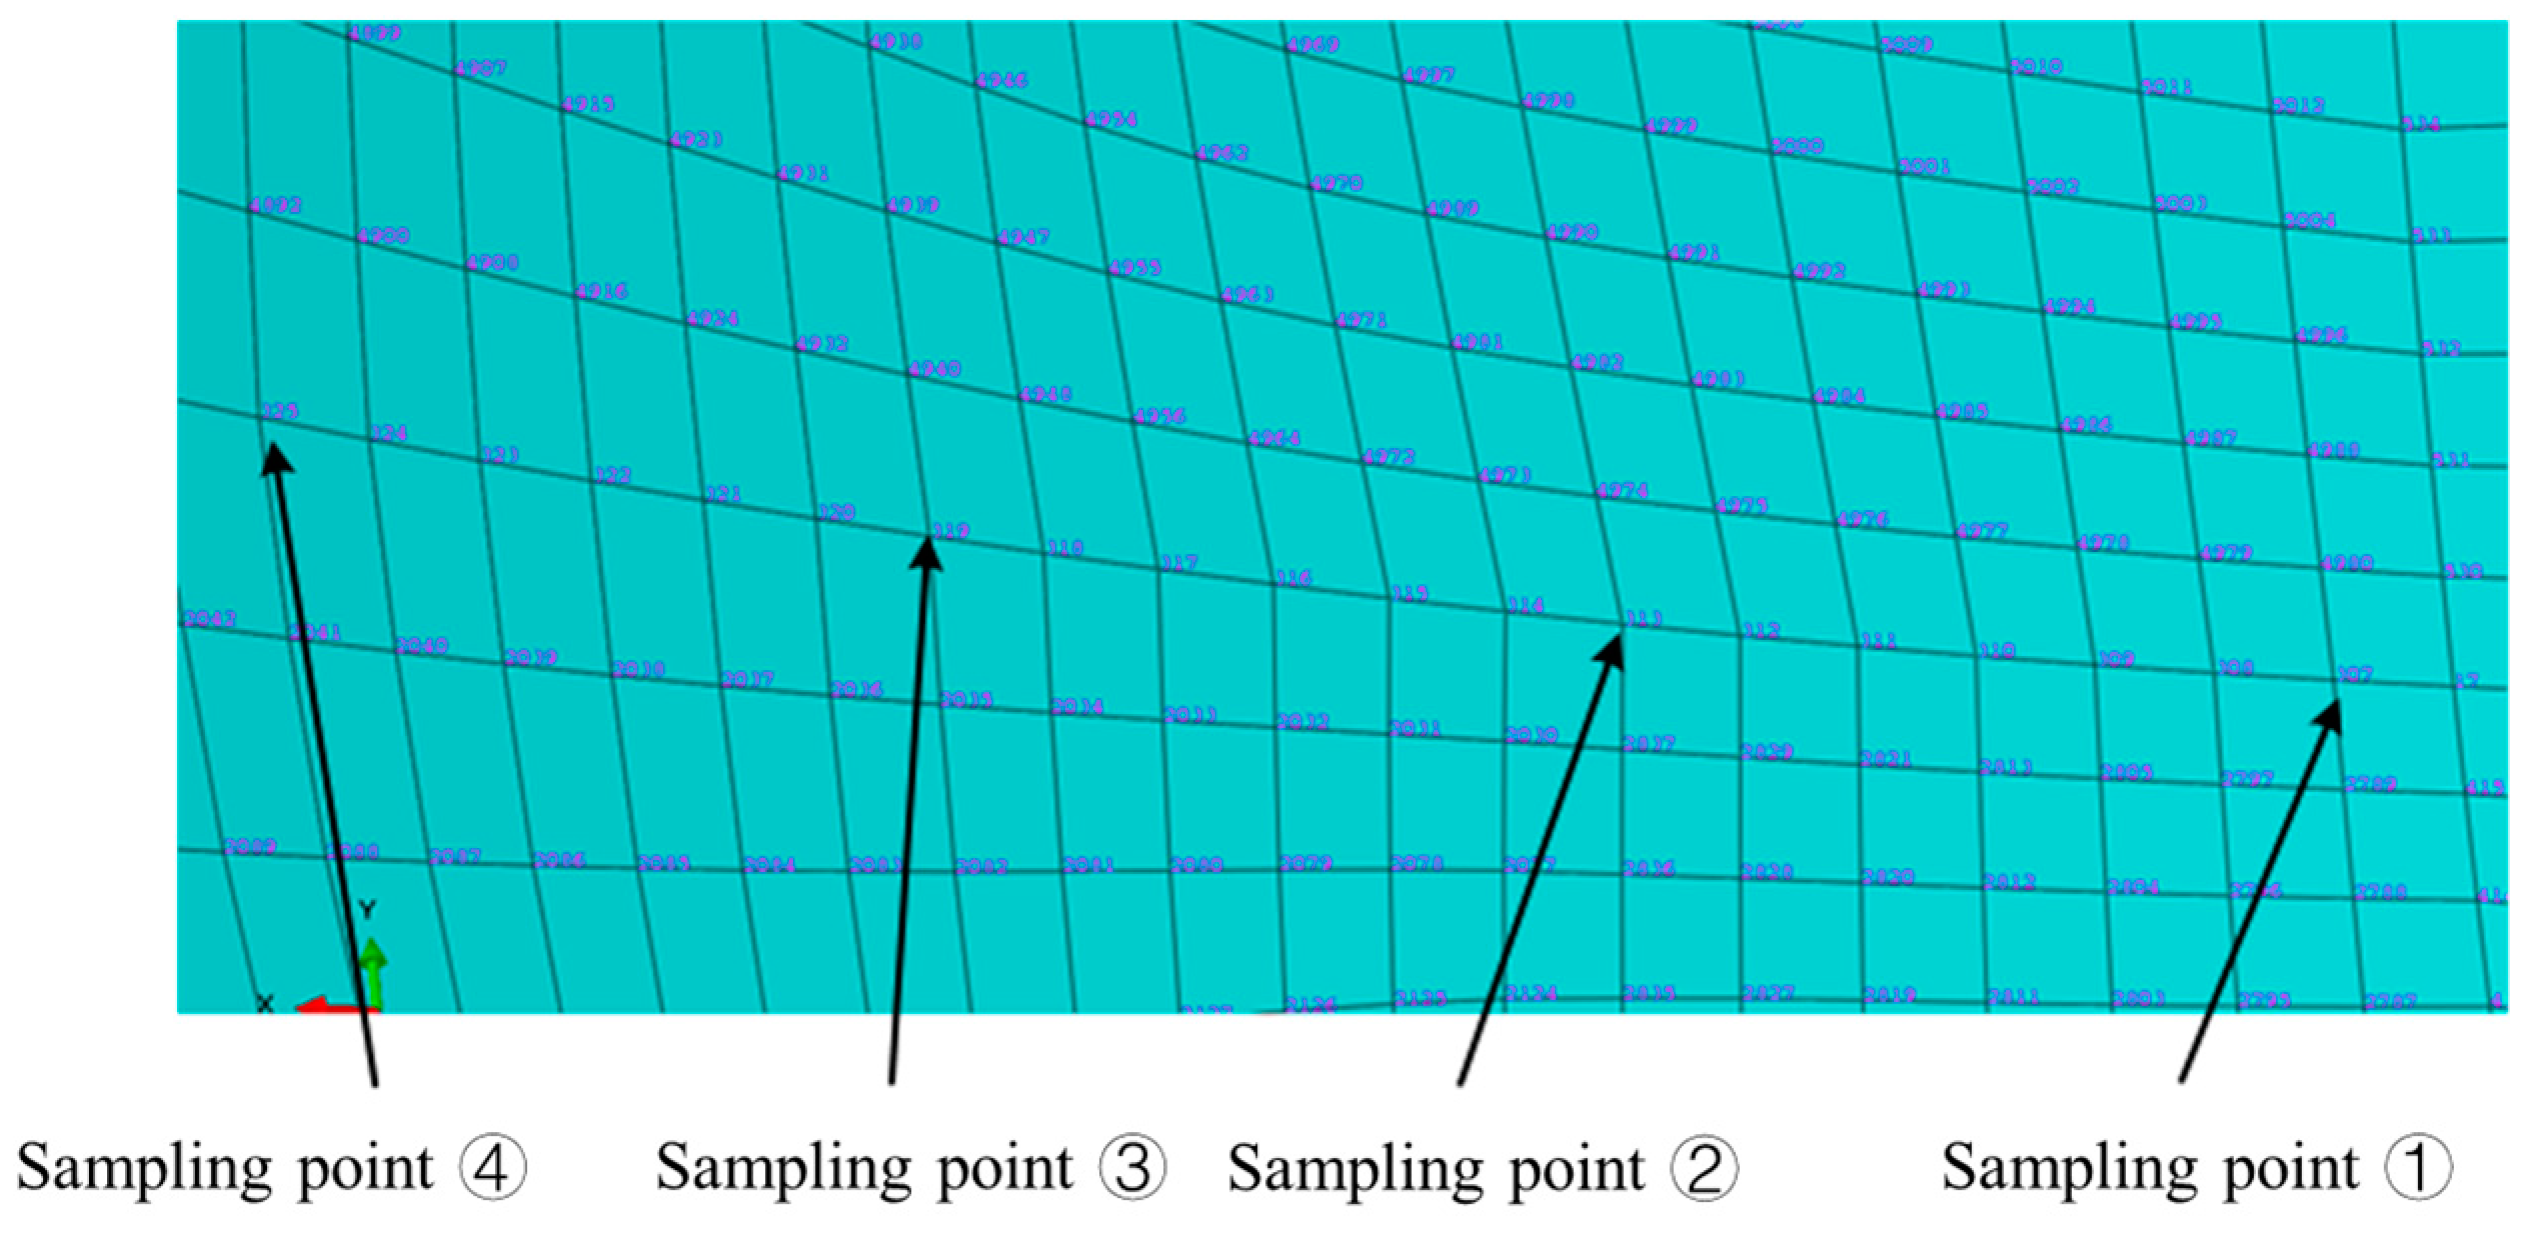
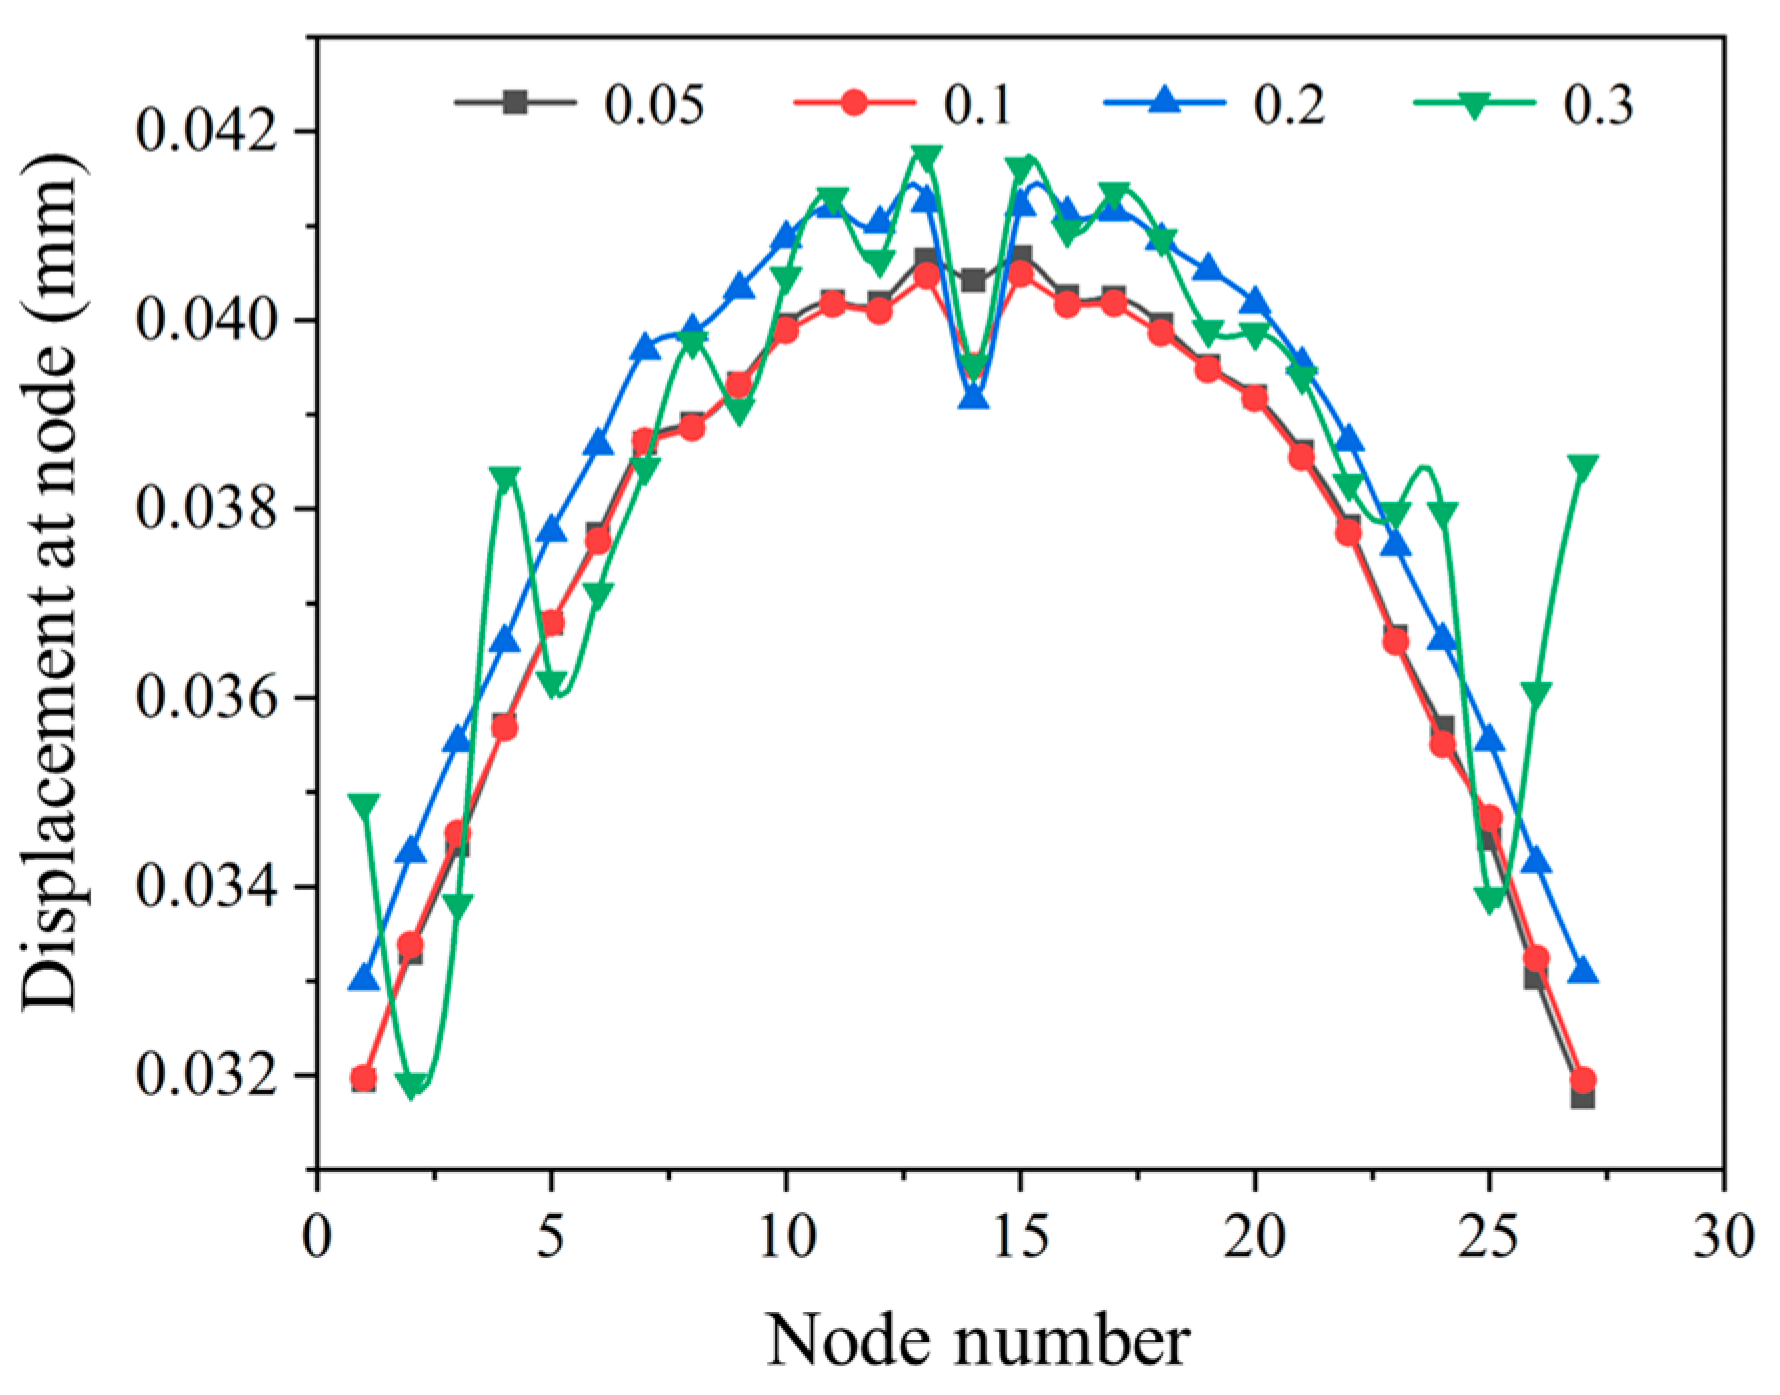
3.2. The Stress and Deformation under Different Loads

An analysis was conducted using ABAQUS to examine the contact stress and deformation of a ceramic–titanium artificial hip joint under different loads. In the post-processing stage, stress and deformation contour plots were extracted at the completion of Step 1 loading, as shown in Figure 5. It can be observed from Figure 6 that the size of the stress and deformation regions was positively correlated with the applied load, and the distribution trends of stress and deformation were similar for different loads. Consequently, during the gait cycle, as the load on the hip joint interface increased, the deformation also increased, resulting in an expansion of the contact area between the femoral head and the acetabulum, thereby increasing the area of wear. The stress distribution, due to the frictional contact setting at the surface interface, exhibited a discrete distribution around the contact center, with the maximum deformation occurring at the contact center. Furthermore, both stress and deformation values decreased as they approached the edges of the contact surface.
Based on the stress–strain results, the maximum stress values under 1000 N, 2000 N, and 3000 N loads were found to be 35.5 MPa, 49.7 Mpa, and 59.0 Mpa, respectively. The maximum deformation values were 1.45 μm, 2.16 μm, and 2.70 μm, respectively. A path passing through the contact center was chosen, and 27 nodes along the path were numbered. The contact stress values at these nodes under different loads were plotted in a line graph, shown in Figure 6. It can be observed from the graph that as the applied load increased, the stress values at each node also increased. The maximum contact stress was located at the central node, and the distribution of contact stress along the path resembled a semi-ellipse, which is consistent with the theoretical expectations for contact stress in a ball-and-socket joint. The deformation plots of each node along the path under different loads were generated and are shown in Figure 7. The deformation of each node followed a consistent pattern with the applied load. As the load increased, the contact radius expanded, resulting in larger deformations at the nodes.

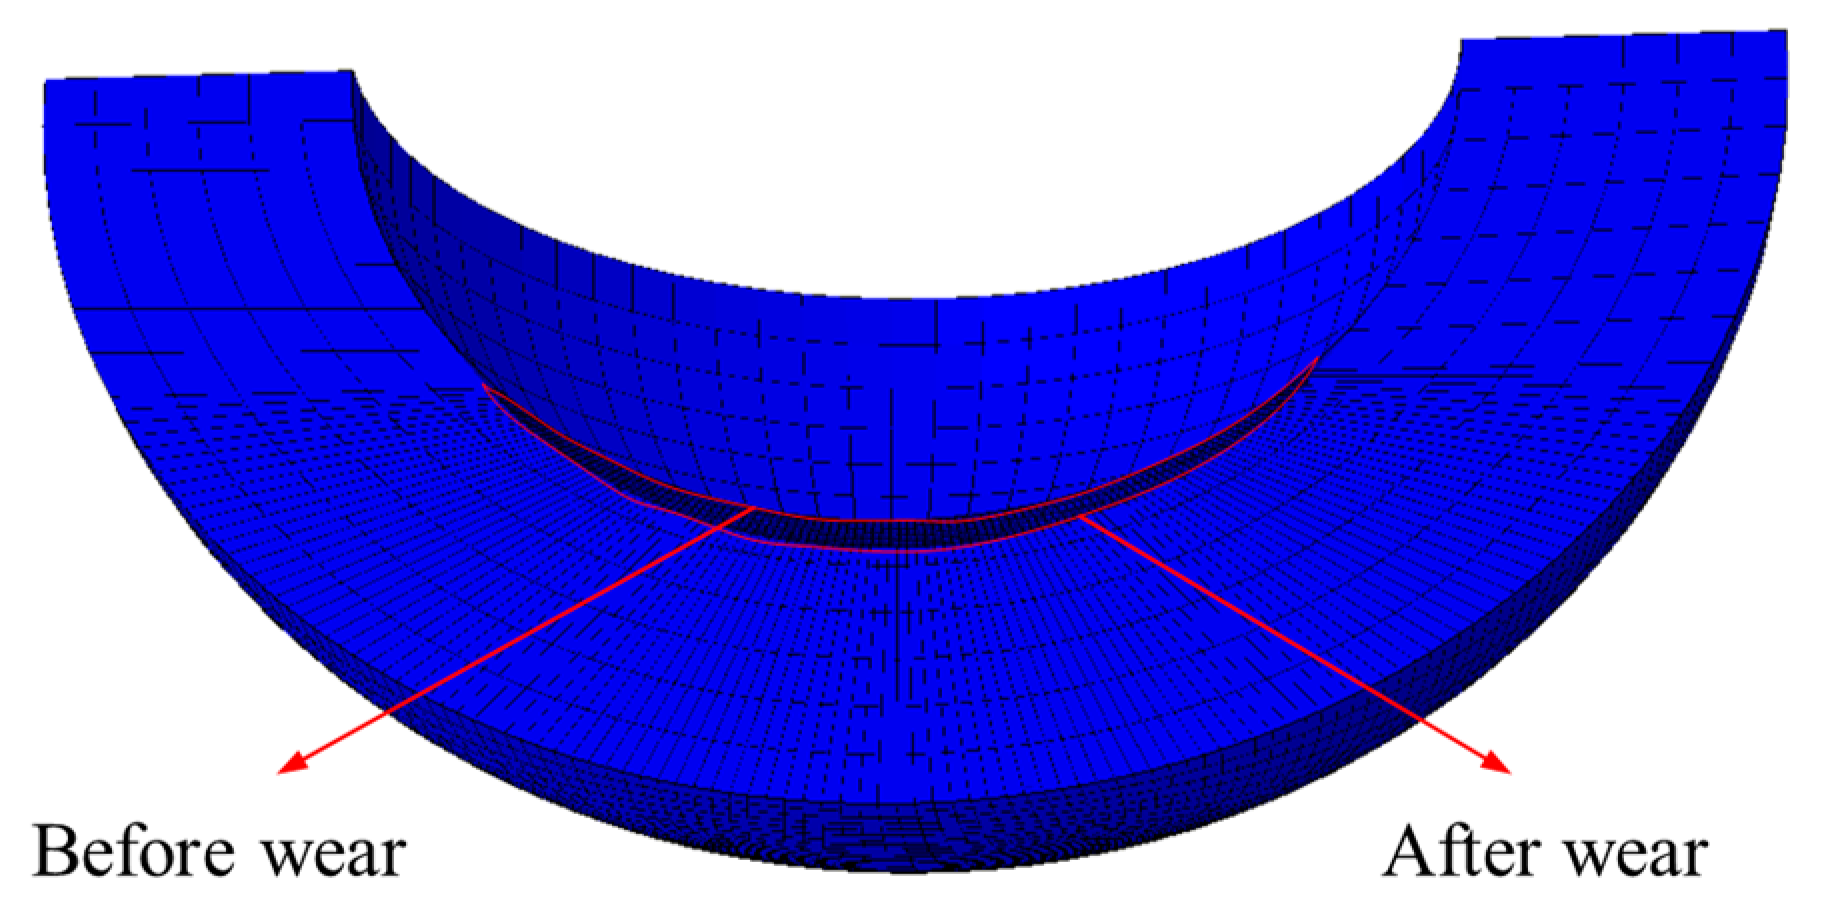
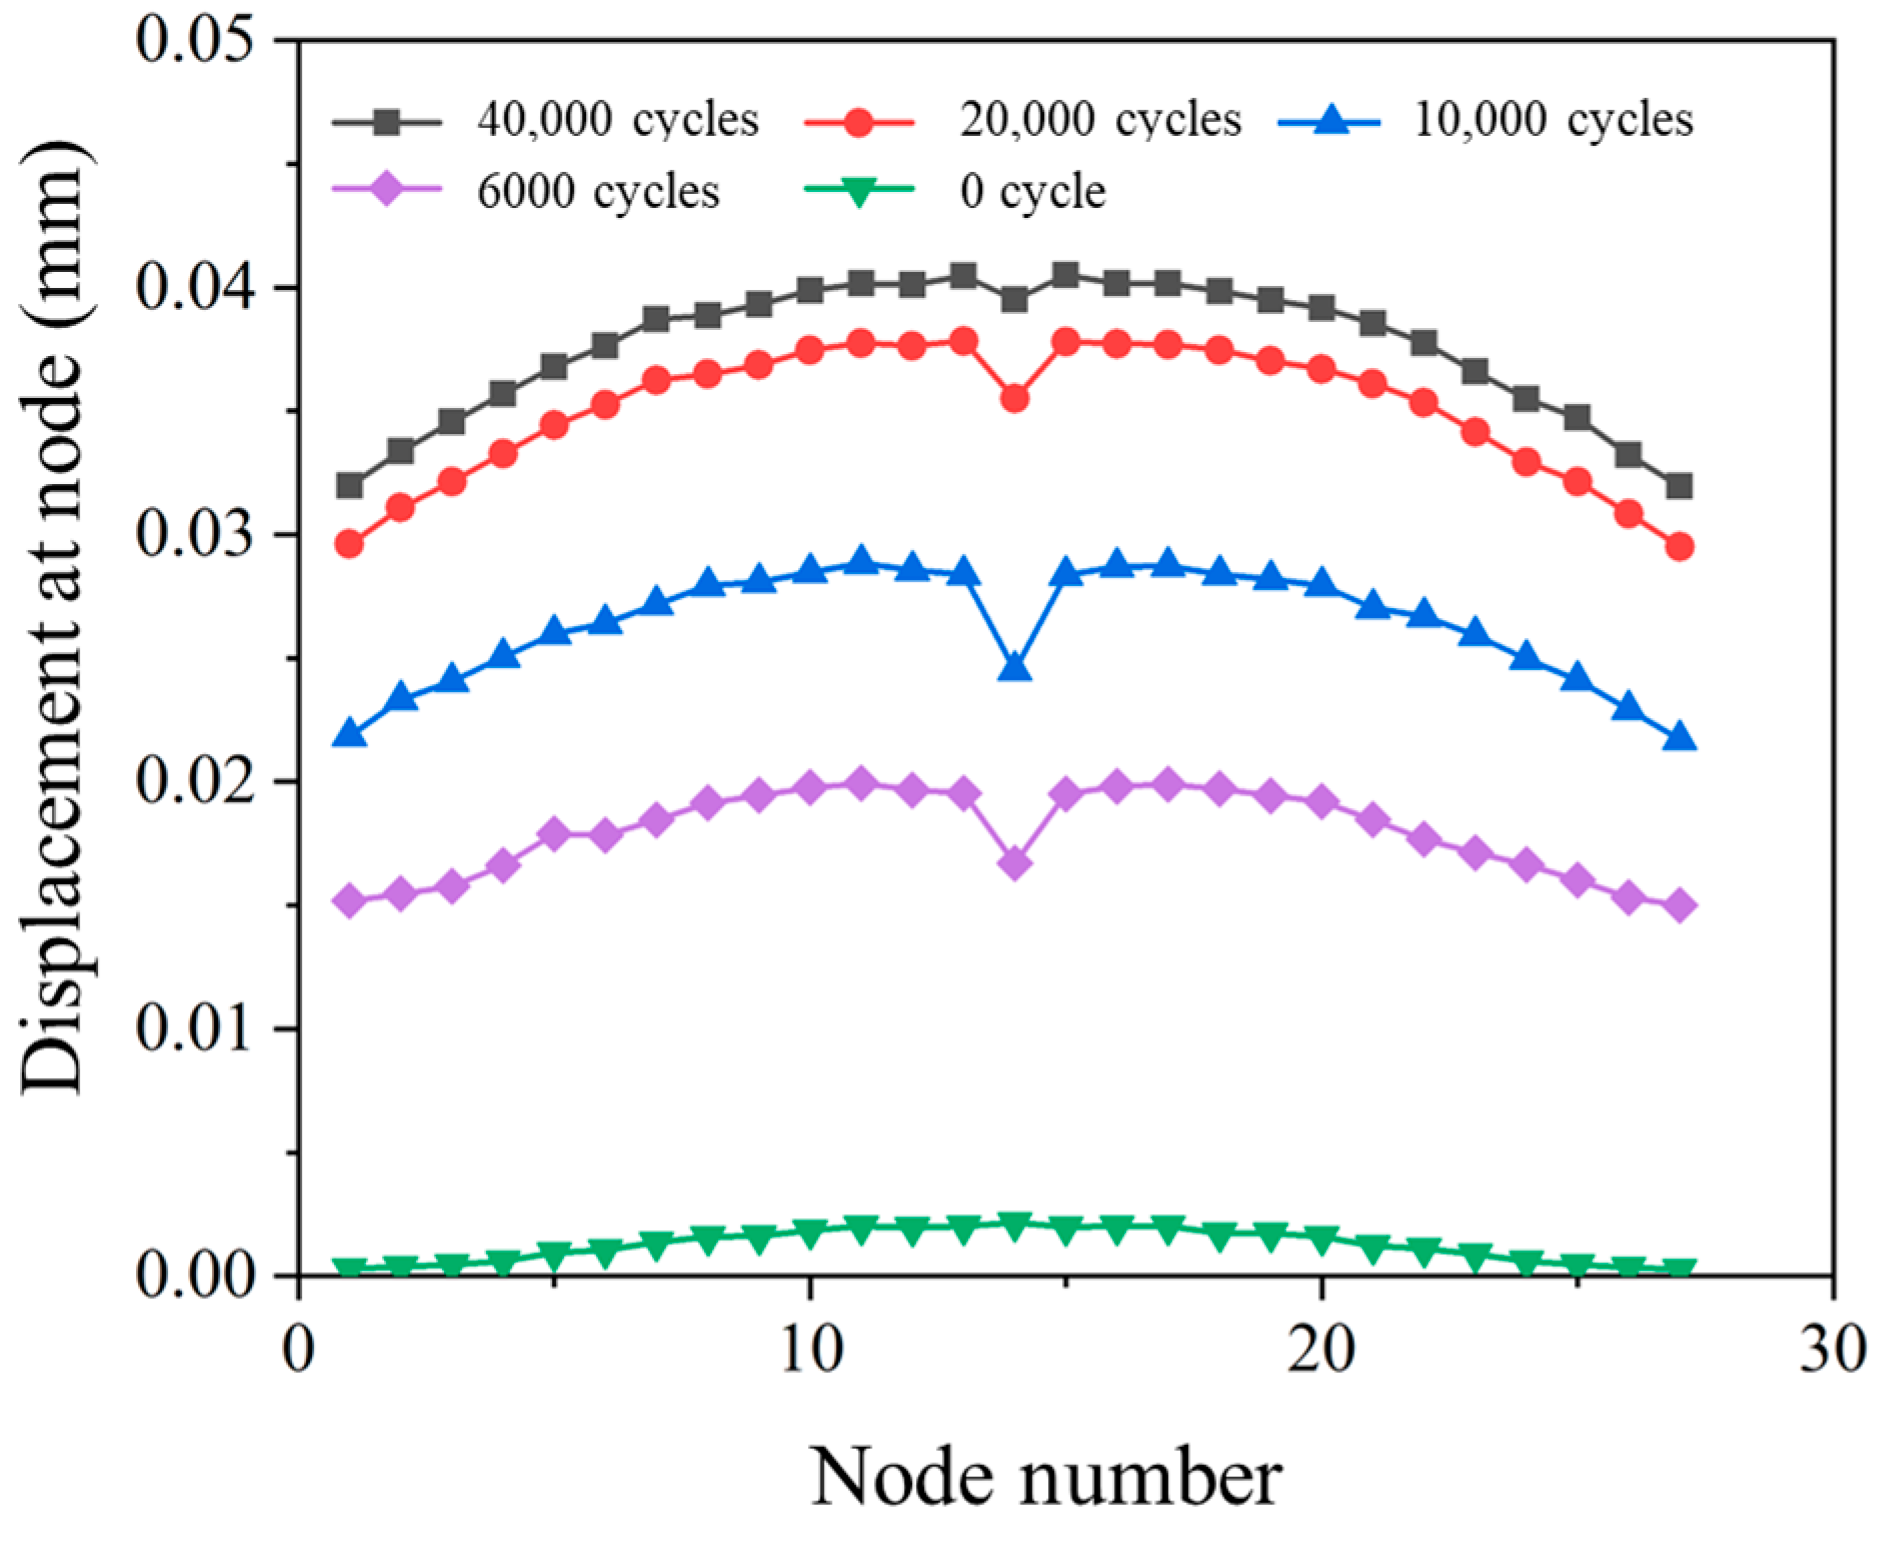
3.3. Effects on Wear Depth

In the post-processing module of ABAQUS, a cross-sectional view of the acetabulum is selected for observation and analysis. Cloud plots are generated simultaneously for the undeformed and deformed configurations. Due to the small deformation and wear during the simulation, a scaling factor of 20 is applied for better visualization, as shown in Figure 8. It can be observed that the surface morphology before wear and after wear formed a crescent shape, with the wear depth gradually decreasing from the center towards the edges.
In ABAQUS, a cross-sectional view was taken to observe the variation of wear depth of the titanium alloy acetabulum in the longitudinal section with respect to the analysis step duration. Figure 9 shows the vertical deformation cloud plots for Step 2 with 0, 10,000, 20,000, and 40,000 cycles under a applied load of 2000 N and a friction coefficient of 0.1.
From Figure 9, it can be observed that as the wear simulation progresses, the wear depth gradually increased. The most severe wear occurred at the center of the contact region, gradually decreasing towards the sides. A line plot of the displacement values at various nodes along the path under different wear cycle counts is shown in Figure 10. When flexion–extension rotation was not performed, only the contact area was affected by the applied load, resulting in minimal deformation. As wear progressed, the displacement at each node gradually increased. After 6000 cycles, the displacement was increased by approximately 0.015 mm; after 10,000 cycles, it was 0.023 mm; after 20,000 cycles, it was 0.032 mm; and after 40,000 cycles, it was 0.039 mm. It can be observed that the increasing trend of node deformations gradually diminished. This can be attributed to the initial stage of wear, where there are fewer contact nodes between the primary and secondary surfaces, resulting in a smaller contact area and higher contact stress values along the path. As wear progresses, adaptive mesh refinement techniques stabilize the contact area, indicating the completion of the running-in phase and the onset of stable wear. It can be observed that the center of contact experienced lower wear compared to the surrounding points. According to the wear theory model, this can be attributed to the high stress values but relatively small relative sliding at that particular node. Therefore, during the wear process of the actual ball and socket joint contact pair, the center of contact gradually forms a raised region.
A comparison of wear at different positions along the path was conducted by displaying node numbers in the viewing options. Four sampling points along the selected path, as shown in Figure 11, were chosen. Sampling point ① is closest to the contact center, while sampling point ④ is farthest from it. The data generated by the subroutine were imported into Excel, and the wear depth of these four nodes was extracted and analyzed over the number of wear cycles. The analysis revealed that nodes closer to the contact center generated more data, indicating a higher frequency of contact during the wear simulation. The linear wear rates of the four nodes entering the stable wear stage were compared. The linear wear rate at sampling point ① was 3.61 × 10⁻⁸ mm·s−1, at sampling point ② it was 1.87 × 10⁻⁸ mm·s−1, at sampling point ③ it was 1.68 × 10⁻⁸ mm·s−1, and at sampling point ④ it was 7.35 × 10⁻⁹ mm·s−1. Thus, it can be concluded that the wear rate on the surface of the titanium alloy hip joint decreases with an increasing distance from the contact center.
Figure 12 shows the displacement variation plots of different nodes under different friction coefficient conditions on the same path after 40,000 cycles and a load of 2000 N. Figure 12 reveals that the contact surfaces with friction coefficients of 0.05 and 0.1 exhibited similar wear depths, with maximum values of approximately 0.0407 mm and 0.0405 mm, respectively. However, a significant increase in wear depth was observed when the friction coefficient was 0.2, with a maximum value of 0.0412 mm. Further increasing the friction coefficient to 0.3 led to a disturbed relationship between wear depths of different nodes, with fluctuating patterns as the node numbering increased. This phenomenon can be attributed to the larger variation in contact area and significant stress changes among nodes under higher friction coefficients. The maximum wear depth in this case was 0.0417 mm. Therefore, it can be concluded that an increase in surface friction coefficient is not conducive to a smooth progression of wear in the articular contact pair. The wear depth data of sampling node ① under different friction coefficients were outputted, and the wear rates after entering the stable wear stage for different contact surface friction coefficients were compared. The linear wear rates for friction coefficients of 0.05, 0.1, 0.2, and 0.3 were determined to be 3.42 × 10⁻⁸ mm·s−1, 3.51 × 10⁻⁸ mm·s−1, 3.82 × 10⁻⁸ mm·s−1, and 3.77 × 10⁻⁸ mm·s−1, respectively. Hence, it can be concluded that different surface friction coefficient values in the articular contact model result in relatively small differences in wear rates after entering the stable wear stage.

4. Experiment and Results Discussion

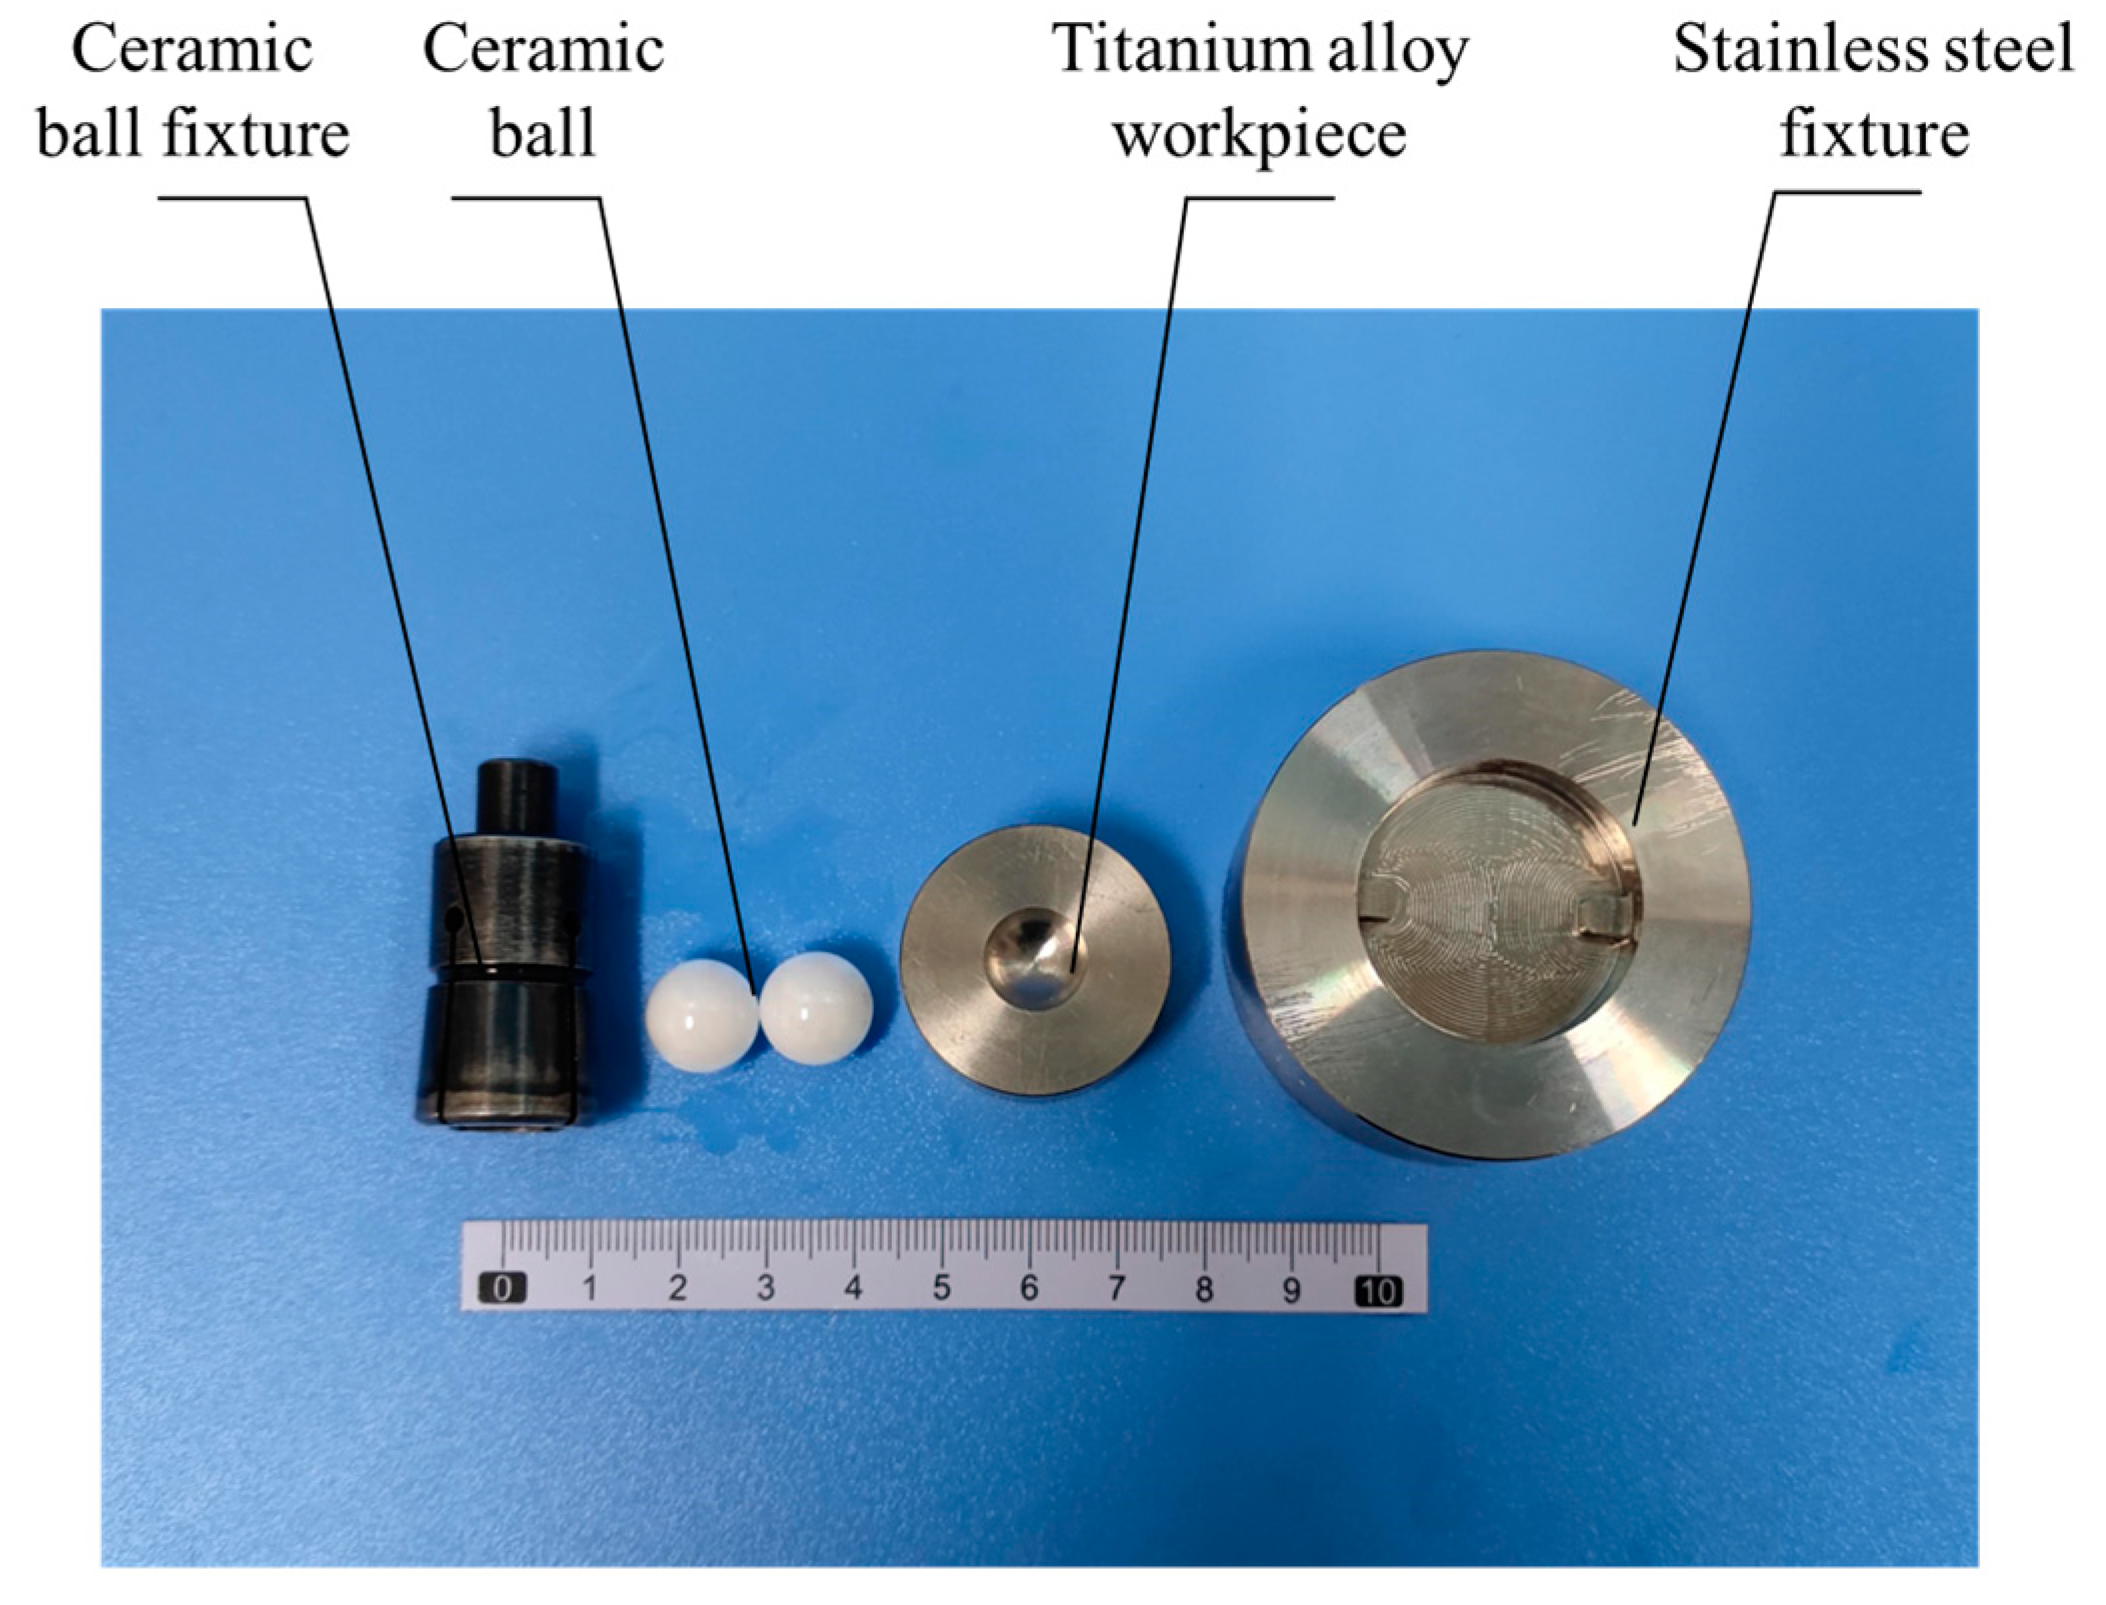
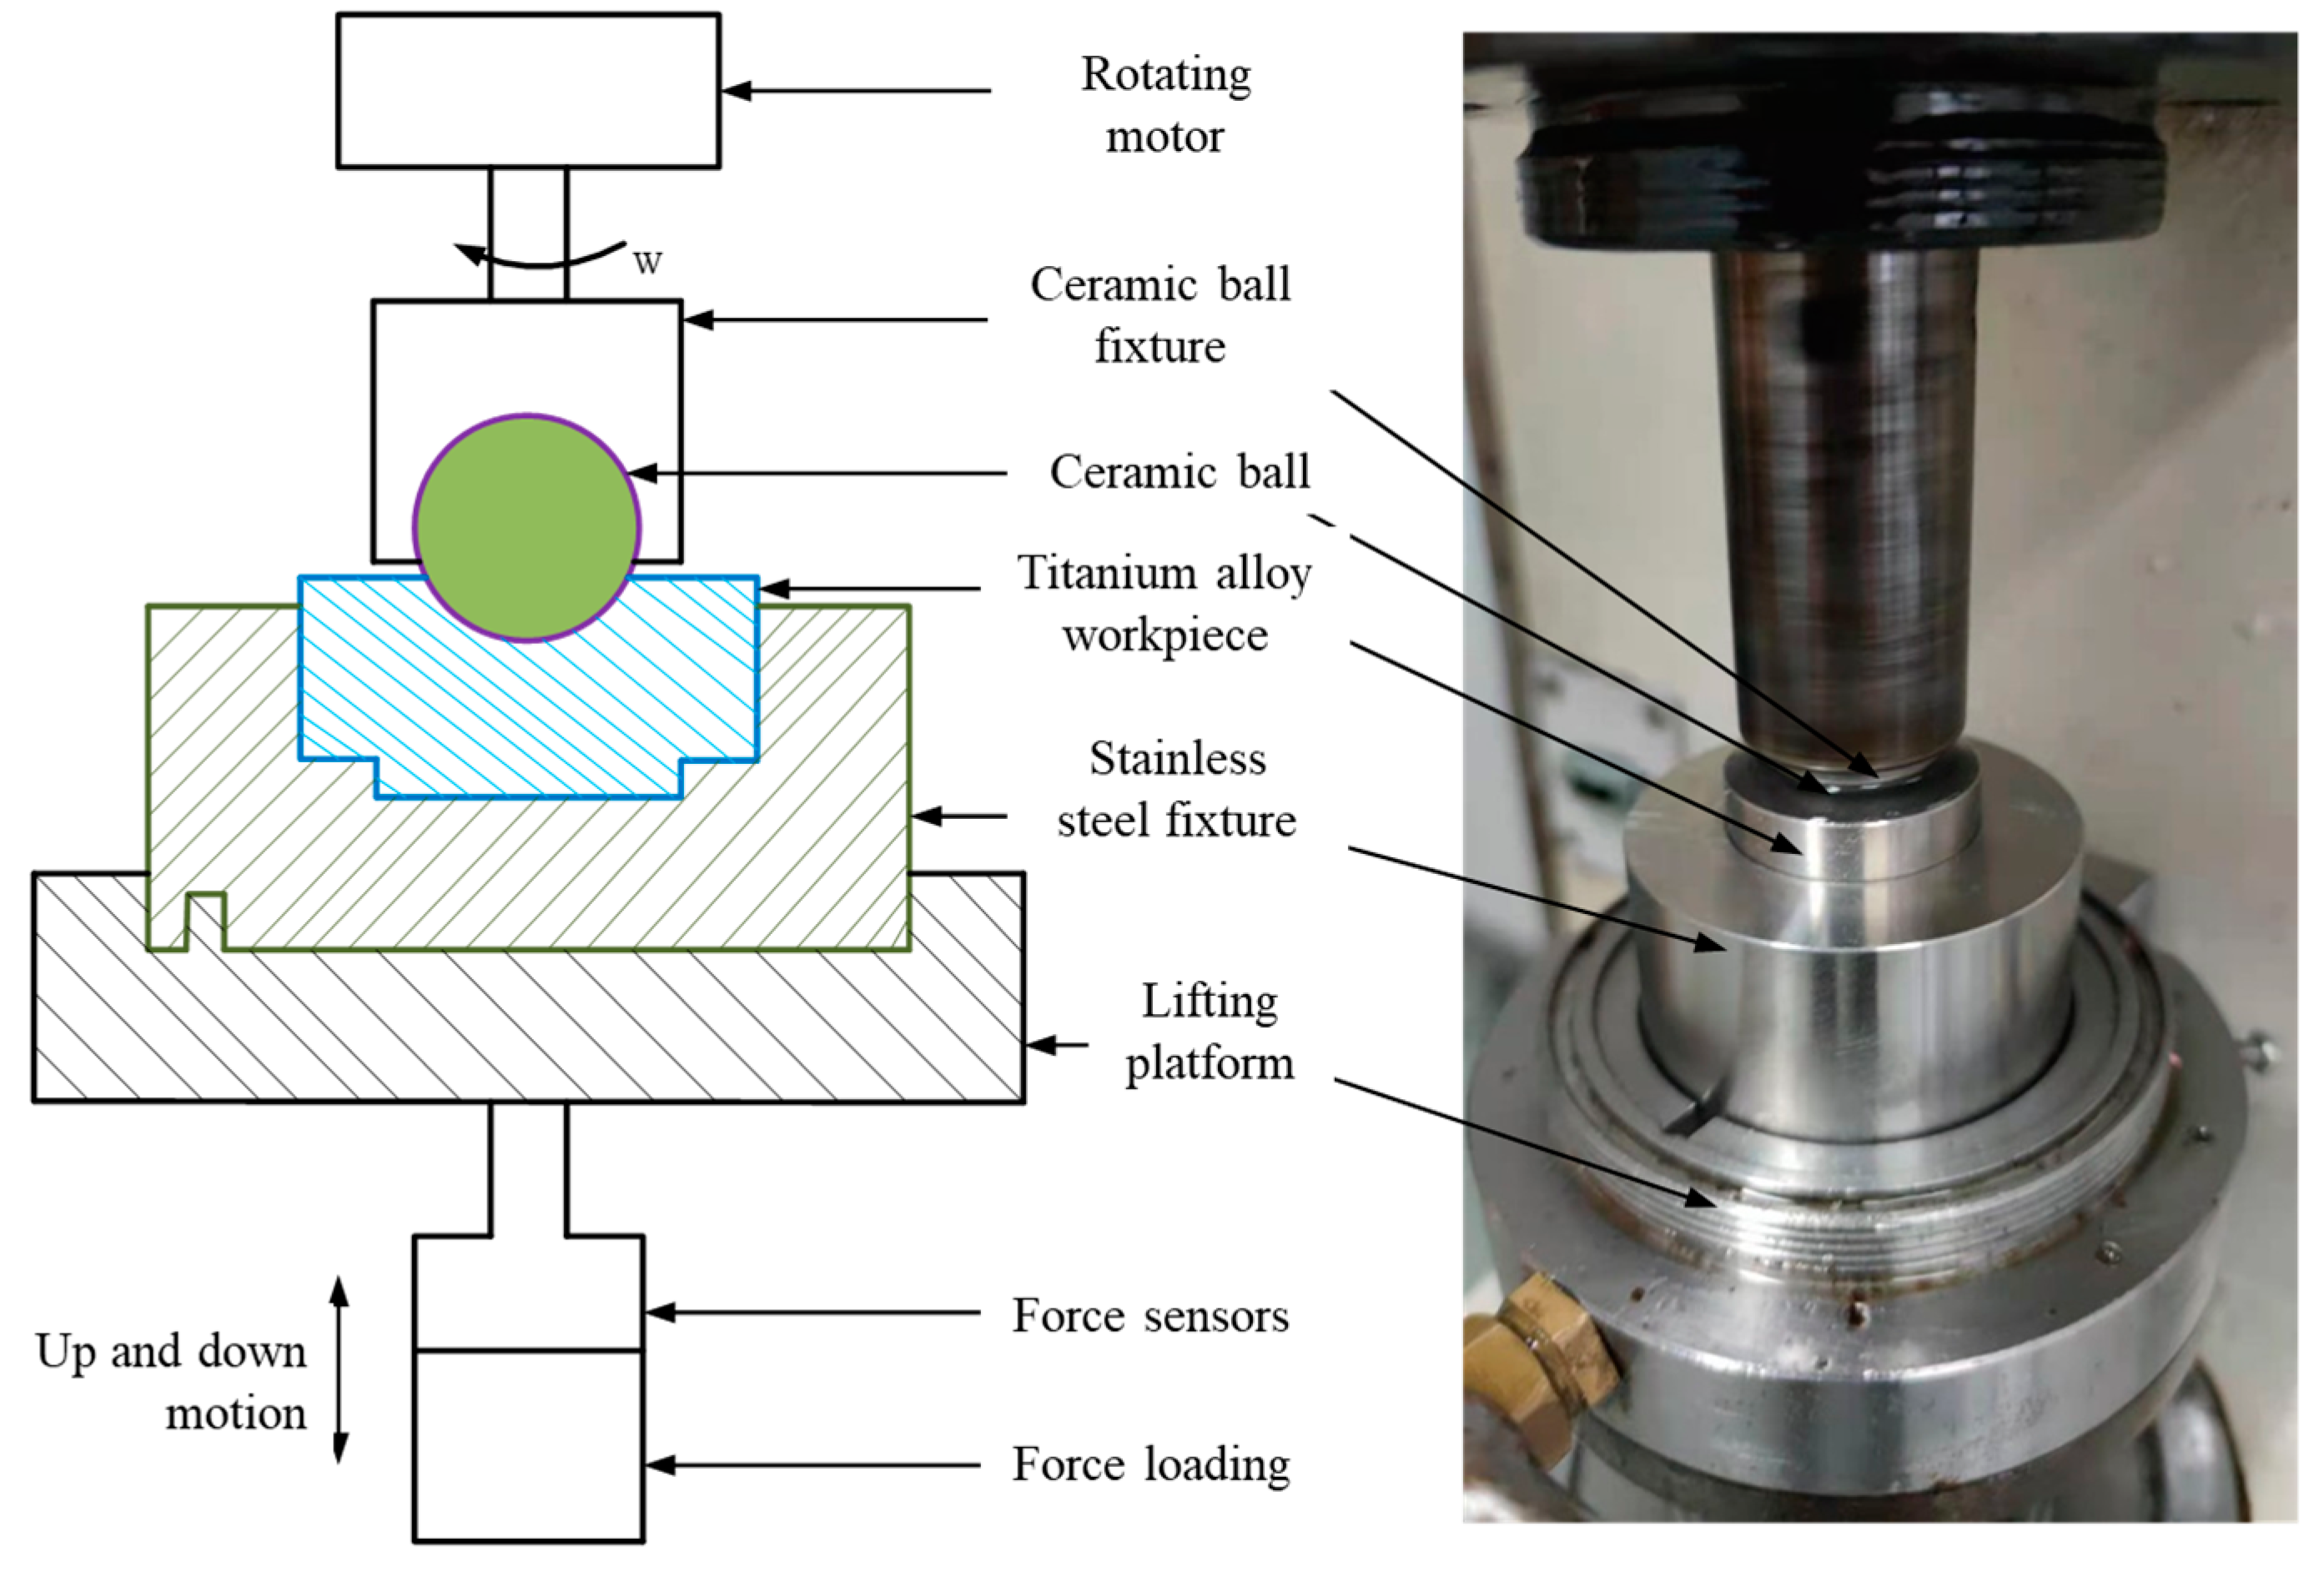
4.1. Experimental Work

The experiment was conducted using an MMW-1 vertical universal friction and wear testing machine. The wear performance of the titanium alloy in contact with zirconia ceramics was studied. A zirconia ceramic ball with a diameter of 12.7 mm was selected, along with a titanium alloy workpiece designed with a center groove of 12.8 mm in diameter. The ceramic ball was fixed to the bottom of the ceramic ball fixture using an embedding method and connected to the rotating motor of an MM-W1 testing machine. The titanium alloy workpiece was secured to a stainless steel fixture through a keyway, and the stainless steel workpiece was fixed on the lifting platform to ensure the stability of the workpieces during the wear test. The components of the setup are shown in Figure 13, along with the assembly diagram and schematic diagram in Figure 14.
To simulate the wear effects closer to those experienced by the human hip joint, the experiment utilized simulated body fluid (SBF) as the lubricating medium. SBF is an artificially stable solution designed to mimic the composition of bodily fluids. The formulation and ion concentrations of SBF in comparison to plasma are presented in Table 3. The ion concentrations in SBF closely resemble those found in the human body, making it widely used for in vitro simulation experiments.

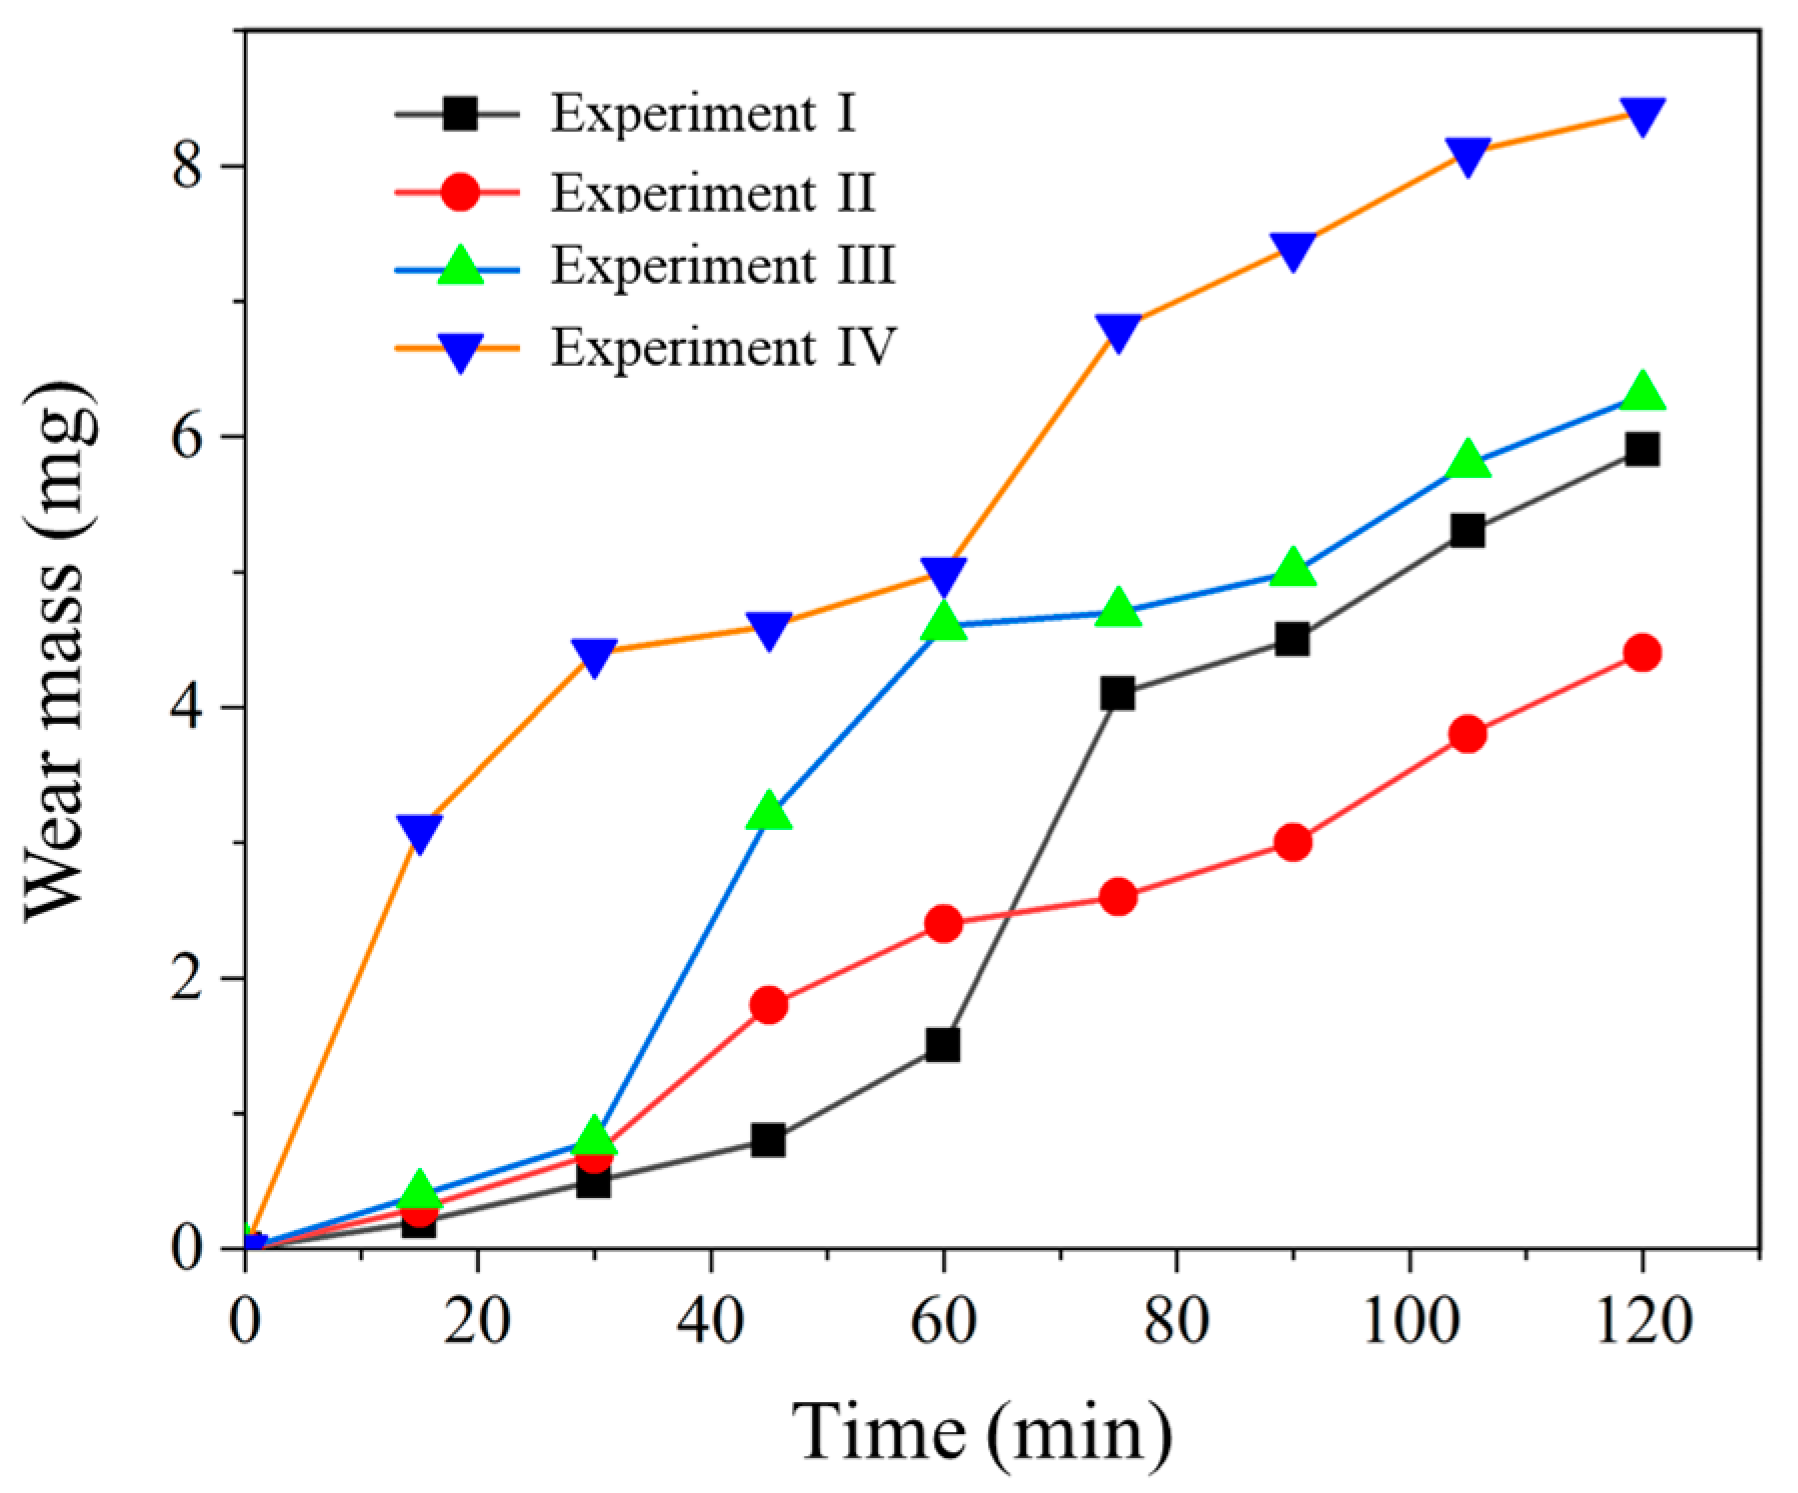
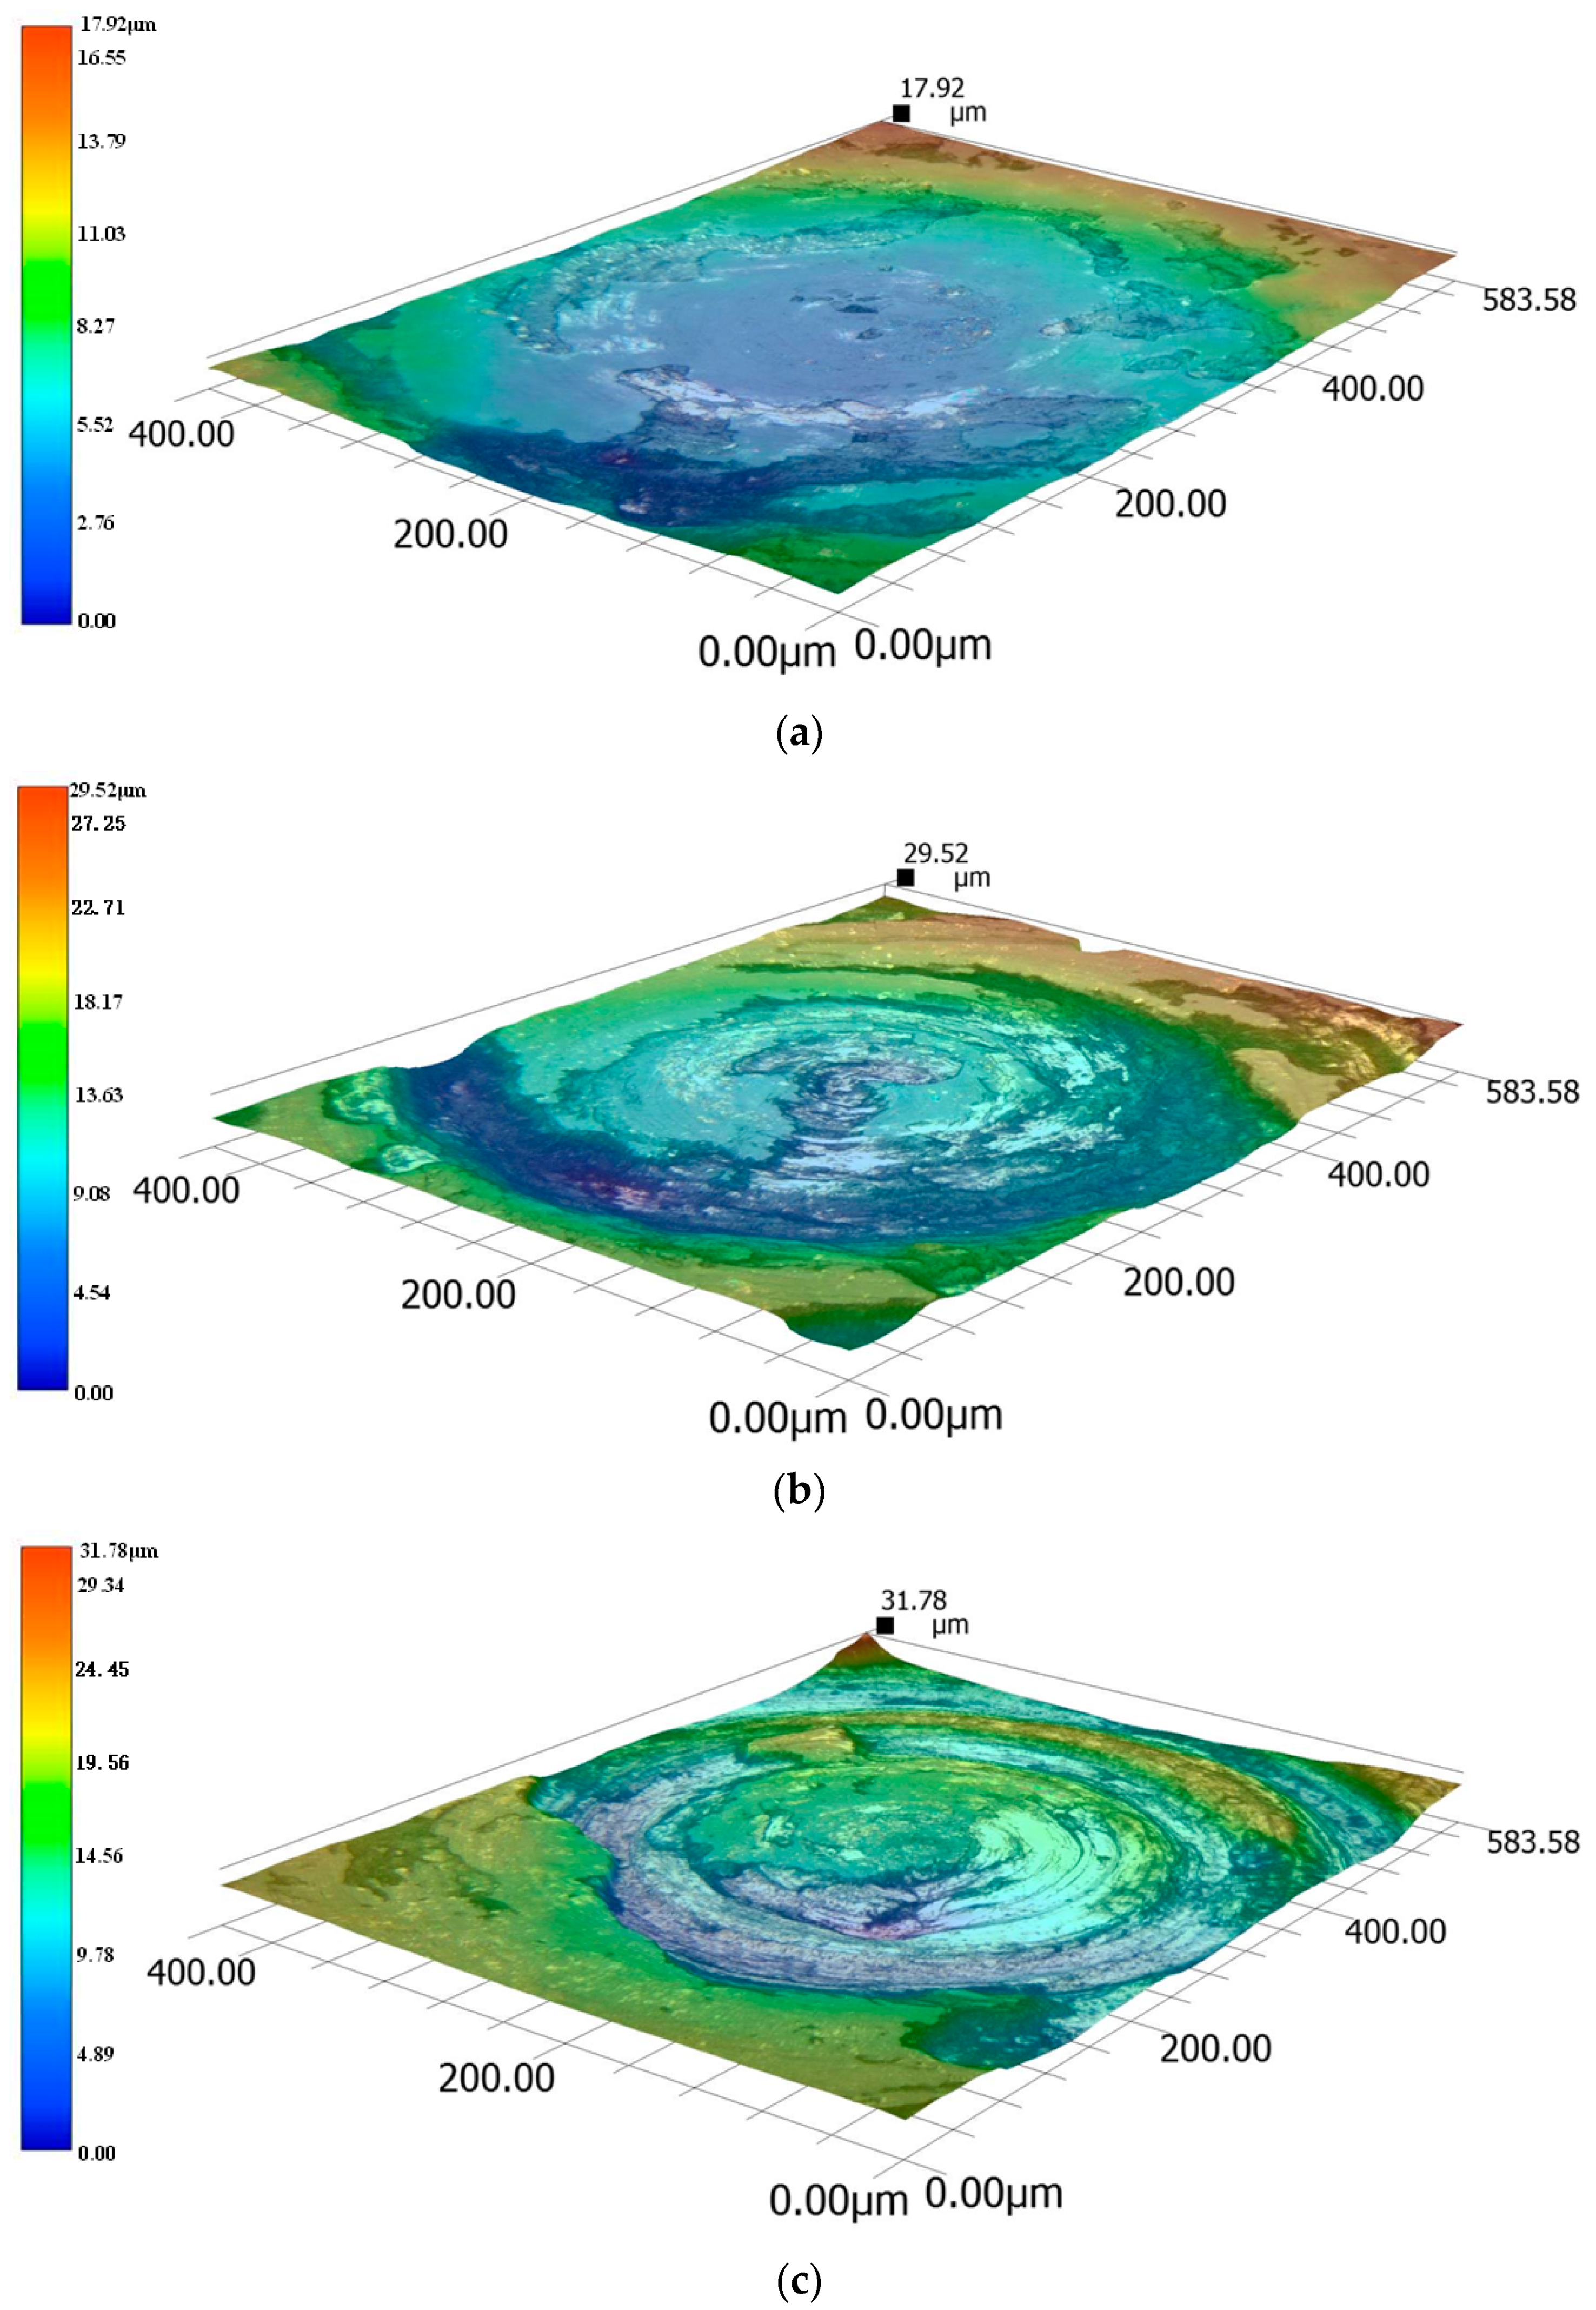
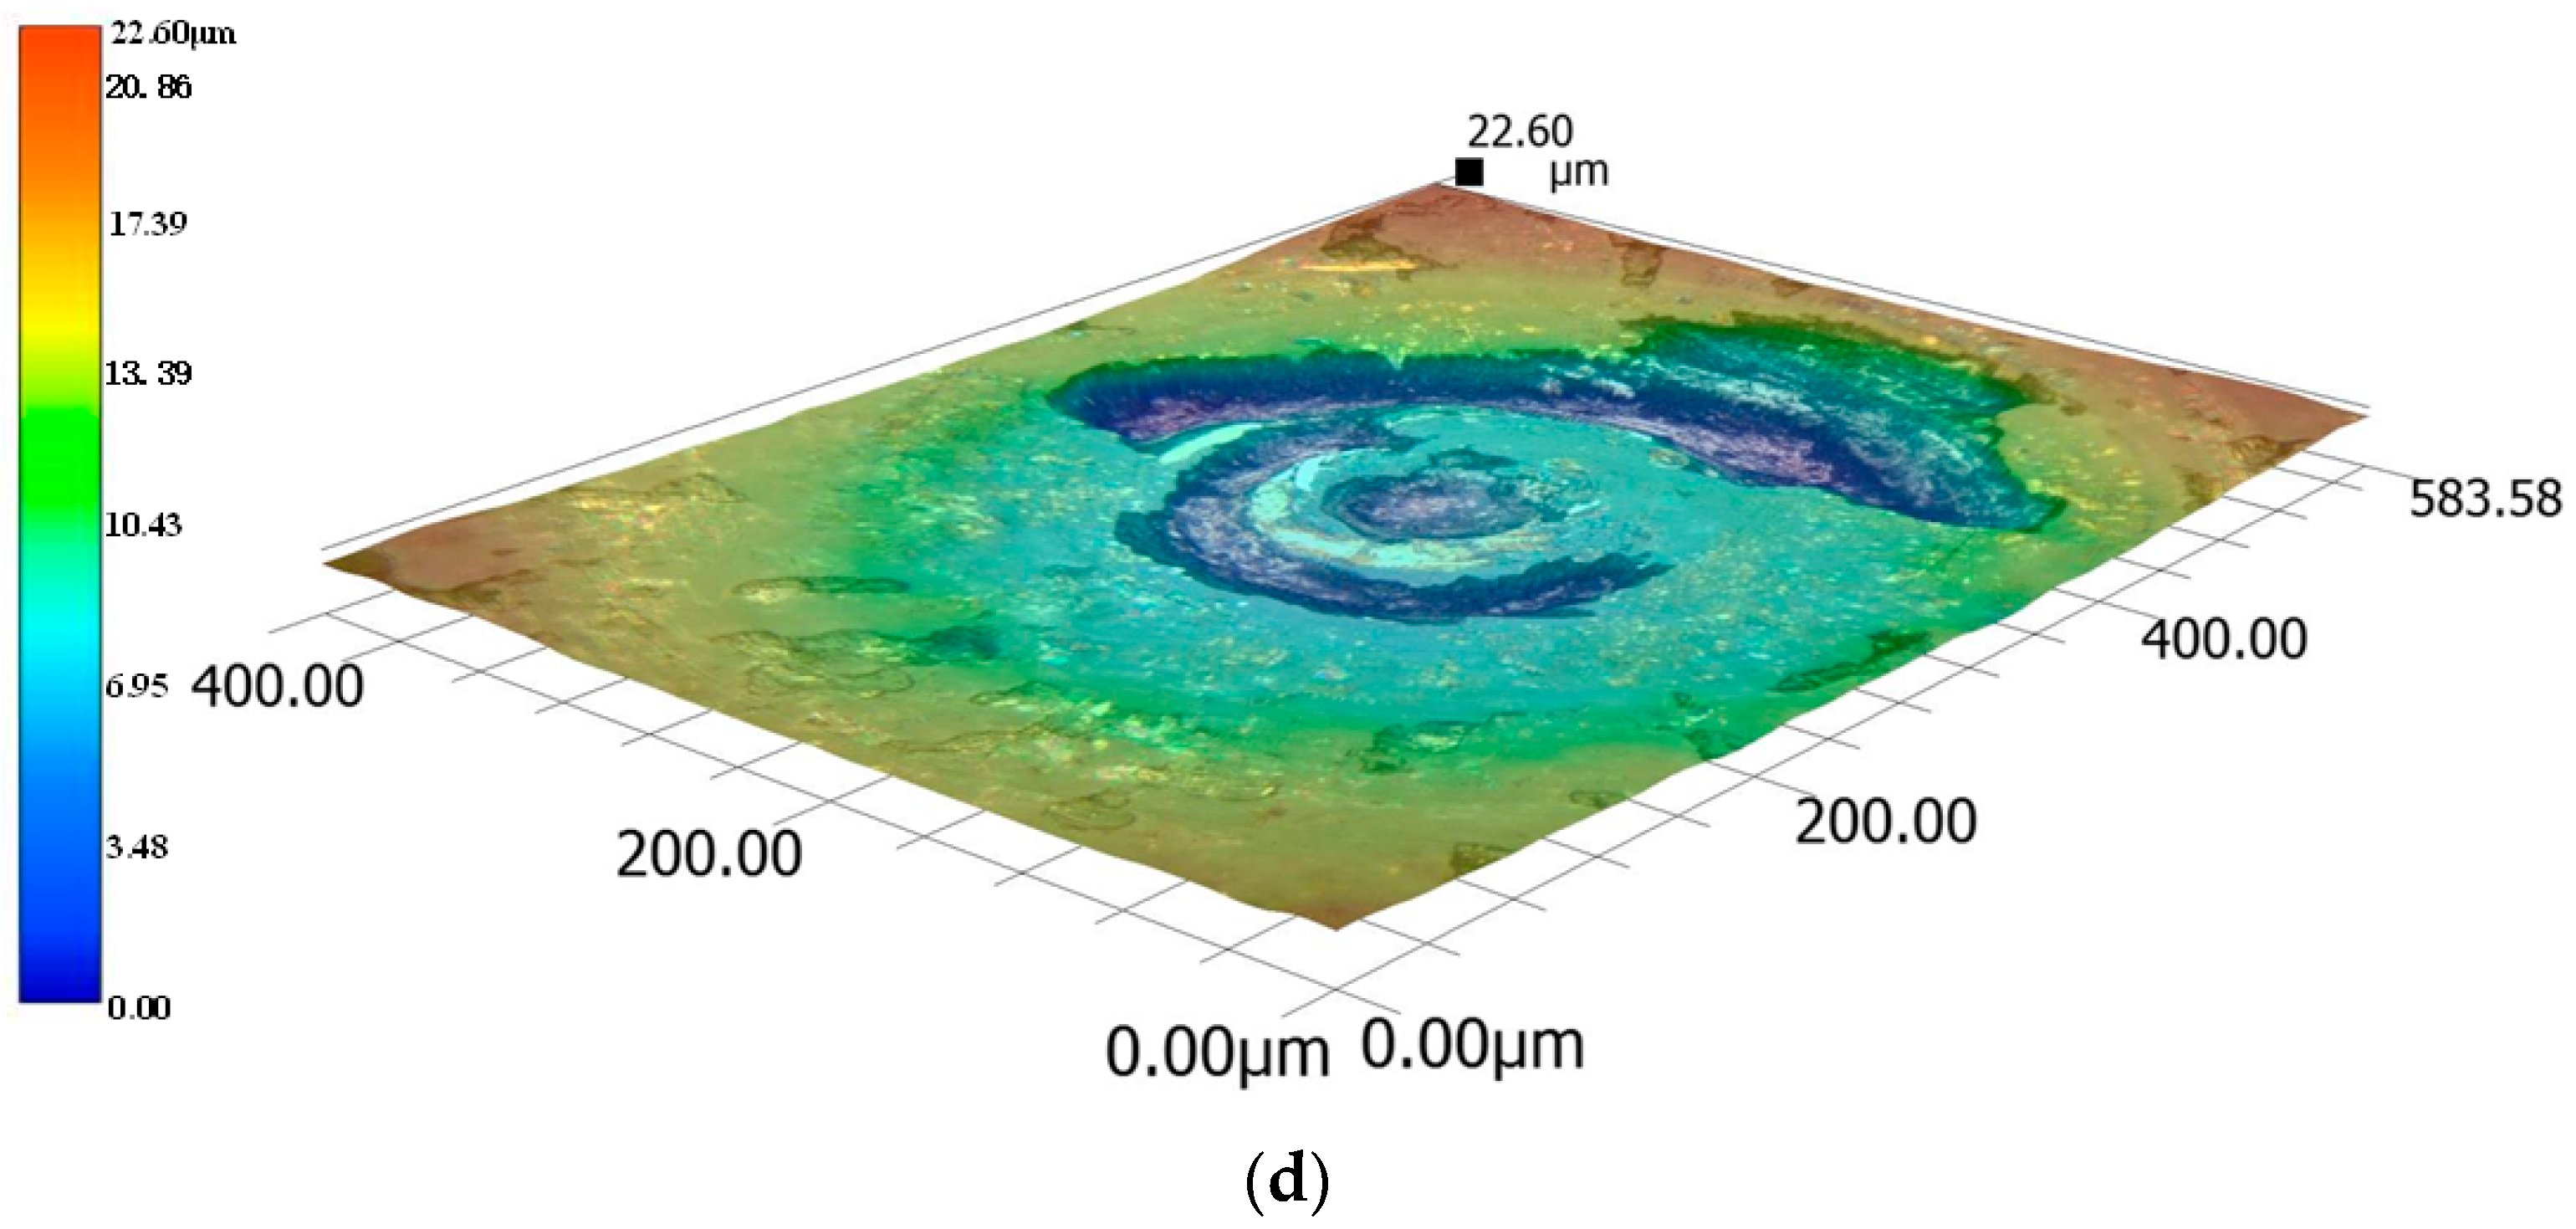
4.2. Experimental Results and Discussion

Before each experiment, the mass of the titanium alloy specimen was measured using a precision analytical balance. During the experiment, the friction and wear test machine was stopped every fifteen minutes, and the titanium alloy specimen was removed, cleaned, and dried to measure the wear mass. The wear mass at each stage was accumulated, and three experiments were conducted for each experimental group. The wear mass obtained after 2 h of wear is presented in Table 4.
A scatter plot showing the variation of wear mass with experimental time was generated for titanium alloy surfaces with different surface roughness values, Ra, and is shown in Figure 15. From Figure 15, it can be observed that in the initial stage of the wear experiment, the wear mass increased with increasing Ra value, indicating that the initial wear mass of Experimental Group IV was the highest among all groups, reaching 3.1 mg. This is because a rougher surface has a poorer surface finish and contains a larger number of micro-asperities, which are gradually eliminated by the cutting action during the wear and mating process of the titanium alloy specimen. In Experimental Group I, which had the smoothest surface, only a small amount of abrasive wear occurred, resulting in the lowest initial wear mass of 0.2 mg. However, after fatigue wear occurred, the wear mass in Experimental Group I exceeded that of Experimental Group II. In the later stages of wear, the increase in wear mass among all experimental groups was approximately the same, around 0.7 mg every 15 min. This indicates that the wear process entered a stable phase, suggesting that the surface roughness value of the titanium alloy has a significant influence during the initial wear period of the acetabular joint friction pair, but its impact diminishes as the contact boundary gradually expands. Comparing the total wear mass for different roughness values, it can be concluded that the wear mass of the titanium alloy specimen in the acetabular joint contact pair exhibited a decreasing-then-increasing trend with increasing Ra value, indicating the existence of an optimal surface roughness that minimizes wear mass.
The obtained wear mass results from the experiments conducted with different surface roughness values were subjected to significance analysis using the statistical software SPSS 25.0. Since the surface roughness differences within the same experimental group were small and the experimental conditions were identical, the obtained data were considered to be repeated test data. Therefore, a one-way analysis of variance (ANOVA) test method was employed to analyze the significance relationship between different surface roughness values of titanium alloy and their impact on frictional wear [36]. With a significance level of α = 0.05, the experimental groups with similar levels of variation were grouped together, and the analysis results using the Student–Newman–Keuls (S-N-K) method [37] are presented in Table 5. From Table 5, it can be observed that the sample data of experimental groups Ⅰ and Ⅲ fell within the same subset, indicating a small difference between these two groups. This suggests that there is no significant difference in the average wear mass between the titanium alloy specimens with an average surface roughness (Ra) of 60 nm and those with an average surface roughness of 300 nm. Experimental group Ⅱ was classified into a separate subset, indicating a significant difference in the mean wear mass compared to the other experimental groups. This suggests that the titanium alloy specimens with a roughness of approximately 150 nm exhibited lower wear mass compared to the other groups. Experimental group Ⅳ showed a noticeable difference in the mean wear mass compared to the other groups, indicating that titanium alloy specimens with a surface roughness of around 500 nm exhibited higher wear mass. This demonstrates that excessively rough surfaces lead to a significant increase in wear. Therefore, for the wear behavior of the ceramic–titanium alloy pairing in the acetabular joint contact, both excessively smooth and excessively rough titanium alloy surfaces result in increased wear mass. The titanium alloy with a surface roughness of approximately 150 nm exhibited the least wear mass.
A dynamic analysis of the three-dimensional display system was used to measure the surface topography near the contact center after wear with different surface roughness values, Ra, as shown in Figure 16. From the figure, it can be observed that the titanium alloy surface exhibited deformation due to compression. The wear in the contact center area was primarily attributed to adhesive and fatigue wear, extending along the direction of rotation. After wear, as the contact radius increase, the wear depth decreased except for the pits formed by fatigue and adhesive wear. This observation was consistent with the simulated trends, particularly at the contact center of each experimental group. Due to the minimal relative sliding distance at the contact center, a raised platform was easily formed.

5. Conclusions

A study and analysis of the wear behavior of ceramic–titanium alloy artificial hip joint contacts were conducted. The motion and loading conditions of the hip joint under gait loads were analyzed. The Archard wear model was modified to obtain a model for the contact stress variation in the acetabular joint contact surfaces. Using ABAQUS software, wear simulations were performed based on the flexion–extension motion characteristics of the artificial hip joint to analyze the influence of different friction coefficients on the simulated wear results. Friction-wear tests were conducted using a friction-wear testing machine with a custom-shaped artificial hip joint specimen subjected to a fixed load and rotational motion. The effects of different surface roughness values on wear in real-world conditions were explored and compared with the simulation results. Through the analysis and discussion of the simulated and experimental results, the following conclusions were drawn:
(1) The analysis of gait motion led to the establishment of equations describing the relationship between hip joint motion, loading duration, and wear depth at various points on the contact surface, incorporating the Archard modified wear model.
(2) The friction wear under flexion–extension motion of the hip joint was simulated and the impact of different contact surface friction coefficients on the simulation results were compared. The stress and deformation of the titanium alloy acetabulum were positively correlated with the applied load, and the stress distribution and deformation of the acetabular joint contact followed a semi-elliptical distribution, consistent with the theoretical contact stress model for the acetabular joint. The contact surface of the acetabular joint exhibited a crescent-shaped wear pattern before and after wear, and the initial surface friction coefficient had minimal influence on the wear rate after reaching a stable wear state. Excessive friction coefficients led to irregular changes in wear depth.
(3) The effect of different surface roughness values on the friction wear of ceramic–titanium alloy acetabular joint contacts was analyzed using a friction-wear testing machine. The average friction coefficient during wear increased with increasing surface roughness. Overly smooth surfaces exhibited minimal initial wear, but were more prone to crack formation and fatigue wear. Conversely, excessively rough surfaces had a prolonged wear-in period and generated significant wear during the running-in process. Comparing the wear rates, titanium alloy surfaces with an Ra value of around 150 nm exhibited the best wear resistance.

Author Contributions

Data curation, F.C.; formal analysis, R.J. and R.Y.; investigation, R.J. and R.Y.; methodology, R.J.; software, F.C.; supervision, L.Z.; writing—original draft, F.C.; writing—review and editing, L.Z. All authors have read and agreed to the published version of the manuscript.

Funding

This research was funded by the National Natural Science Foundation of China (51575493) and the Zhejiang Provincial Natural Science Foundation of China (LGG19E050025).

Institutional Review Board Statement

Not applicable.

Informed Consent Statement

Not applicable.

Data Availability Statement

Data sharing is not applicable to this article.

Conflicts of Interest

The authors declare that the research was conducted in the absence of any commercial or financial relationships that could be construed as a potential conflict of interest.

References

  1. Murakami, T. 2–Biomechanics of human and artificial joints. In Biotribology of Natural and Artificial Joints; Murakami, T., Ed.; Elsevier: Amsterdam, The Netherlands, 2023; pp. 29–79. [Google Scholar]
  2. Dimitroulis, G. Comparison of the outcomes of three surgical treatments for end-stage temporomandibular joint disease. Int. J. Oral Maxillofac. Surg. 2014, 43, 980–989. [Google Scholar] [CrossRef] [PubMed]
  3. Zhang, L.; Yuan, Z.; Qi, Z.; Cai, D.; Cheng, Z.; Qi, H. CFD-based study of the abrasive flow characteristics within constrained flow passage in polishing of complex titanium alloy surfaces. Powder Technol. 2018, 333, 209–218. [Google Scholar] [CrossRef]
  4. Nunez, E.E.; Polycarpou, A.A.; Economy, J. Tribological studies of a novel high-performance aromatic thermosetting copolyester containing carbon nanotubes for artificial hip joints. Tribol. Int. 2023, 178, 108038. [Google Scholar] [CrossRef]
  5. Williams, S.; Jalali-Vahid, D.; Brockett, C.; Jin, Z.; Stone, M.H.; Ingham, E.; Fisher, J. Effect of swing phase load on metal-on-metal hip lubrication, friction and wear. J. Biomech. 2006, 39, 2274–2281. [Google Scholar] [CrossRef]
  6. Zhang, L.; Yuan, Z.; Tan, D.; Huang, Y. An Improved Abrasive Flow Processing Method for Complex Geometric Surfaces of Titanium Alloy Artificial Joints. Appl. Sci. 2018, 8, 1037. [Google Scholar]
  7. Zhang, L.; Wang, J.-S.; Tan, D.-P.; Yuan, Z.-M. Gas compensation-based abrasive flow processing method for complex titanium alloy surfaces. Int. J. Adv. Manuf. Technol. 2017, 92, 3385–3397. [Google Scholar] [CrossRef]
  8. Okutani, Y.; Goto, K.; Kuroda, Y.; Kawai, T.; Okuzu, Y.; Kawata, T.; Shimizu, Y.; Matsuda, S. Long-term outcome of cemented total hip arthroplasty with the Charnley-type femoral stem made of titanium alloy. J. Orthop. Sci. 2019, 24, 1047–1052. [Google Scholar] [CrossRef]
  9. Mattei, L.; Di Puccio, F.; Piccigallo, B.; Ciulli, E. Lubrication and wear modelling of artificial hip joints: A review. Tribol. Int. 2011, 44, 532–549. [Google Scholar] [CrossRef]
  10. Qian, H.; Chen, M.; Qi, Z.; Teng, Q.; Qi, H.; Zhang, L.; Shan, X. Review on Research and Development of Abrasive Scratching of Hard Brittle Materials and Its Underlying Mechanisms. Crystals 2023, 13, 428. [Google Scholar] [CrossRef]
  11. Cai, Y.; Li, K.; Li, L.; Hu, J. Anti-friction mechanism of textured artificial joint material under the walking conditions of human. J. Mater. Res. Technol. 2022, 20, 2999–3007. [Google Scholar] [CrossRef]
  12. Ji, R.; Qi, Z.; Chen, J.; Zhang, L.; Lin, K.; Lu, S.; Li, Y. Numerical and Experimental Investigation on the Abrasive Flow Machining of Artificial Knee Joint Surface. Crystals 2023, 13, 430. [Google Scholar] [CrossRef]
  13. Cousins, M.M.; Short, E.; Heckman, P.; Narayana, V.; Bryant, A.K.; Hurley, P.; Hearn, J.; McLaughlin, P.W. Prostate radiotherapy in the setting of bilateral hip prostheses: All commonly used photon-based radiation approaches are feasible. Med. Dosim. 2021, 46, 404–410. [Google Scholar] [CrossRef]
  14. Buj-Corral, I.; Bagheri, A.; Domínguez-Fernández, A. Influence of Structure Support Printing Parameters on Surface Finish of PLA Hemispherical Cups for Emulation of Ceramic Hip Prostheses. Procedia CIRP 2018, 68, 347–351. [Google Scholar] [CrossRef]
  15. Cilingir, A.C. Finite Element Analysis of the Contact Mechanics of Ceramic-on-Ceramic Hip Resurfacing Prostheses. J. Bionic Eng. 2010, 7, 244–253. [Google Scholar] [CrossRef]
  16. Askari, E.; Flores, P.; Dabirrahmani, D.; Appleyard, R. A review of squeaking in ceramic total hip prostheses. Tribol. Int. 2016, 93, 239–256. [Google Scholar] [CrossRef]
  17. Liu, F.; Leslie, I.; Williams, S.; Fisher, J.; Jin, Z. Development of computational wear simulation of metal-on-metal hip resurfacing replacements. J. Biomech. 2008, 41, 686–694. [Google Scholar] [CrossRef]
  18. Tandler, R.; Bohn, N.; Gabbert, U.; Woschke, E. Analytical wear model and its application for the wear simulation in automotive bush chain drive systems. Wear 2020, 446–447, 203193. [Google Scholar] [CrossRef]
  19. Federici, M.; Menapace, C.; Moscatelli, A.; Gialanella, S.; Straffelini, G. Effect of roughness on the wear behavior of HVOF coatings dry sliding against a friction material. Wear 2016, 368–369, 326–334. [Google Scholar] [CrossRef]
  20. Liu, F.; He, Y.; Gao, Z.; Jiao, D. Enhanced computational modelling of UHMWPE wear in total hip joint replacements: The role of frictional work and contact pressure. Wear 2021, 482–483, 203985. [Google Scholar] [CrossRef]
  21. Yuan, H.; Yang, W.; Zhang, L.; Hong, T. Model Development of Stress Intensity Factor on 7057T6 Aluminum Alloy Using Extended Finite Element Method. Coatings 2023, 13, 581. [Google Scholar] [CrossRef]
  22. Cheng, Z.; Wang, S.; Wu, G.; Gao, J.; Yang, X.; Wu, H. Tribological properties of high-entropy alloys: A review. Int. J. Miner. Metall. Mater. 2022, 29, 389–403. [Google Scholar] [CrossRef]
  23. Xie, X.; Zhang, L.; Zhu, L.; Li, Y.; Hong, T.; Yang, W.; Shan, X. State of the Art and Perspectives on Surface-Strengthening Process and Associated Mechanisms by Shot Peening. Coatings 2023, 13, 859. [Google Scholar] [CrossRef]
  24. Wang, Y.; Wang, Z.; Ni, P.; Wang, D.; Lu, Y.; Lu, H.; Guo, S.; Chen, Z. Experimental and Numerical Study on Regulation of Cutting Temperature during the Circular Sawing of 45 Steel. Coatings 2023, 13, 758. [Google Scholar] [CrossRef]
  25. Sah, A.P. How Much Hip Motion Is Used in Real-Life Activities? Assessment of Hip Flexion by a Wearable Sensor and Implications After Total Hip Arthroplasty. J. Arthroplast. 2022, 37, S871–S875. [Google Scholar] [CrossRef]
  26. Sun, Y.; Li, Y.; Zhang, Q.; Qin, X.; Chen, K. Wear analysis and simulation of small module gear based on Archard model. Eng. Fail. Anal. 2023, 144, 106990. [Google Scholar] [CrossRef]
  27. Aghababaei, R.; Zhao, K. Micromechanics of material detachment during adhesive wear: A numerical assessment of Archard’s wear model. Wear 2021, 476, 203739. [Google Scholar] [CrossRef]
  28. Liu, Y.; Liskiewicz, T.W.; Beake, B.D. Dynamic changes of mechanical properties induced by friction in the Archard wear model. Wear 2019, 428–429, 366–375. [Google Scholar] [CrossRef]
  29. Qi, H.; Wen, D.; Lu, C.; Li, G. Numerical and experimental study on ultrasonic vibration-assisted micro-channelling of glasses using an abrasive slurry jet. Int. J. Mech. Sci. 2016, 110, 94–107. [Google Scholar] [CrossRef]
  30. Qi, H.; Wen, D.; Yuan, Q.; Zhang, L.; Chen, Z. Numerical investigation on particle impact erosion in ultrasonic-assisted abrasive slurry jet micro-machining of glasses. Powder Technol. 2017, 314, 627–634. [Google Scholar] [CrossRef]
  31. Qi, H.; Qin, S.; Cheng, Z.; Teng, Q.; Hong, T.; Xie, Y. Towards understanding performance enhancing mechanism of micro-holes on K9 glasses using ultrasonic vibration-assisted abrasive slurry jet. J. Manuf. Process. 2021, 64, 585–593. [Google Scholar] [CrossRef]
  32. Qi, H.; Qin, S.; Cheng, Z.; Zou, Y.; Cai, D.; Wen, D. DEM and experimental study on the ultrasonic vibration-assisted abrasive finishing of WC-8Co cemented carbide cutting edge. Powder Technol. 2021, 378, 716–723. [Google Scholar] [CrossRef]
  33. Qi, H.; Wang, Y.; Qi, Z.; Shi, L.; Fang, Z.; Zhang, L.; Riemer, O.; Karpuschewski, B. A Novel Grain-Based DEM Model for Evaluating Surface Integrity in Scratching of RB-SiC Ceramics. Materials 2022, 15, 8486. [Google Scholar] [CrossRef] [PubMed]
  34. Zhang, L.; Ji, R.; Fu, Y.; Qi, H.; Kong, F.; Li, H.; Tangwarodomnukun, V. Investigation on particle motions and resultant impact erosion on quartz crystals by the micro-particle laden waterjet and airjet. Powder Technol. 2020, 360, 452–461. [Google Scholar] [CrossRef]
  35. Zhang, G. Study on Biomechanical and Tribological Properties of Composite Artificial Hip Joint Materials; Qingdao University of Science and Technology: Qingdao, China, 2019. [Google Scholar]
  36. Kumar, D.; Murthy, K.; Kore, S.D.; Nandy, A. Effect of thread angle besides other process parameters in electromagnetically crimped threaded surfaced tube-to-tube joint: FEM modelling and ANOVA analysis. Mater. Today Proc. 2023. [Google Scholar] [CrossRef]
  37. Oehlert, G.W. Student–Newman–Kuels controls the false discovery rate. Stat. Probab. Lett. 2000, 46, 381–383. [Google Scholar] [CrossRef]
Figure 1. Schematic representation of the human hip joint motion.
Coatings 13 01321 g001
Figure 2. Schematic representation of the human hip joint motion.
Coatings 13 01321 g002
Figure 3. Model of hip joint.
Coatings 13 01321 g003
Figure 4. Definition of the contact surface.
Coatings 13 01321 g004
Figure 5. Distribution of stress and deformation under different loads. (a1) Stress under 1000 N. (a2) Deformation under 1000 N. (b1) Stress under 2000 N. (b2) Deformation under 2000 N. (c1) Stress under 3000 N. (c2) Deformation under 3000 N.
Coatings 13 01321 g005
Figure 6. Distribution of stress under different loads.
Coatings 13 01321 g006
Figure 7. Distribution of deformation under different loads.
Coatings 13 01321 g007
Figure 8. Comparison of surface morphology before and after wear erosion.
Coatings 13 01321 g008
Figure 9. Effect of wear cycles on the wear depth. (a) 0 cycles. (b) 10,000 cycles. (c) 20,000 cycles. (d) 40,000 cycles.
Coatings 13 01321 g009
Figure 10. The variation of node displacement with the number of wear cycles can be observed.
Coatings 13 01321 g010
Figure 11. Schematic representation of different sampling points.
Coatings 13 01321 g011
Figure 12. The variation in node displacement with different friction coefficients.
Coatings 13 01321 g012
Figure 13. The components of the experimental setup.
Coatings 13 01321 g013
Figure 14. The schematic representation of the experimental setup.
Coatings 13 01321 g014
Figure 15. The variation of wear mass under different experimental conditions.
Coatings 13 01321 g015
Figure 16. Surface morphology for different experiments. (a) Experiment I. (b) Experiment II. (c) Experiment III. (d) Experiment IV.
Coatings 13 01321 g016aCoatings 13 01321 g016b
Table 1. Material properties of hip joint model.
MaterialsDensity (g/cm3)Elastic Modulus (MPa)Poisson Ratio
Titanium4.428112,0000.34
Ceramic6200,0000.3
Table 2. Simulating parameters.
Analysis StepsType of StepsGeometric NonlinearityTime DurationTransferred AttributeFunction
InitialInitialN/AN/ATransferApplying constraint boundary condition
Step-1Static, genericON1TransferApplying full loads
Step-2Static, genericON20TransferApplying motion boundary conditions
Table 3. Ion concentrations of SBF and body fluid.
FormulationNa+K+Mg2+Ca2+ClHCOSO42−HPO42−
Ion concentrations of body fluid142.05.01.52.5103.027.01.00.5
Ion concentrations of SBF142.05.01.52.5147.84.21.00.5
Table 4. Wear mass under different surface roughness.
Experiment No.Surface Roughness Ra (nm)Load (N)Times Experiment Was RepeatedWear Mass (mg)
I609815.9
25.5
36.0
II1509814.4
25.0
34.2
III3509816.5
26.0
35.8
IV5509817.9
28.4
37.5
Table 5. S-N-K results for wear mass under different surface roughness.
Experiment No.Total Experimental TimeSubset for α = 0.05
123
S-N-K analysisII34.8667
I3 5.8000
III3 6.1000
IV3 7.9333
Significance/1.000.3621.00
Disclaimer/Publisher’s Note: The statements, opinions and data contained in all publications are solely those of the individual author(s) and contributor(s) and not of MDPI and/or the editor(s). MDPI and/or the editor(s) disclaim responsibility for any injury to people or property resulting from any ideas, methods, instructions or products referred to in the content.

