Article

Influence of the Relative Position of Powder–Gas Jet and Laser Beam on the Surface Properties of Inconel 625 Coatings Produced by Extreme High-Speed Laser Material Deposition (EHLA)

by
Matthias Brucki
1,2,*,
Tobias Schmickler
1,
Andres Gasser
1 and
Constantin Leon Häfner
1,2
1
Fraunhofer ILT—Institute for Laser Technology, Steinbachstraße 15, D-52074 Aachen, Germany
2
Chair for Laser Technology, RWTH Aachen University LLT, Steinbachstraße 15, D-52074 Aachen, Germany
*
Author to whom correspondence should be addressed.
Coatings 2023, 13(6), 998; https://doi.org/10.3390/coatings13060998
Submission received: 16 March 2023 / Revised: 15 May 2023 / Accepted: 23 May 2023 / Published: 27 May 2023
(This article belongs to the Special Issue Laser Cladding Coatings: Microstructure, Properties, and Applications)

Abstract

:
Laser material deposition (LMD) is a widely used coating process in industry. However, to increase its economic appeal, higher process speeds are required. The solution to this challenge is an innovative modification known as extreme high-speed laser material deposition (EHLA). EHLA allows for an impressive increase in process speed from 2 m/min for conventional LMD to 500 m/min. With the ability to adjust process parameters, EHLA can generate tailor-made surface properties, expanding its potential application beyond current industrial uses. In this novel study, we explore the effects of relative positioning between tools (laser beam and powder–gas jet) and substrate on the surface properties of EHLA coatings. By laterally and axially offsetting the tools, the proportional energy coupling of the laser radiation into the powder–gas jet and substrate can be modified. Altering the position of the powder–gas jet can also affect the weld pool flow or number of particle attachments, thereby affecting surface properties. This approach allows for the adjustment of surface roughness over a wide range—from smooth, quasi-laser-polished surfaces to rough surfaces covered with particle adhesions.

1. Introduction

The coating of components, e.g., against wear or corrosion, has become an indispensable part of industry and technology. In addition to the reduction of costs through the construction of components from low-cost base materials with high-end coatings for the extension of service life, the functionality of components is often determined by their geometrical surface properties.
Laser material deposition (LMD), also known as direct energy deposition (DED), is a well-established coating process used for maintenance, wear, and corrosion protection in areas such as tools, engines, or mechanical engineering [1]. In this coating process (Figure 1a), a laser beam (LB) focused on the surface generates a melt pool at the edge of the component, into which the metallic filler material (powder) is introduced and liquefies. By moving the component relative to the laser beam and powder–gas jet (PGJ), the weld pool, including the filler material, leaves the laser spot and solidifies, creating a metallurgical and thus firmly bonded layer. The disadvantage of this process is the process speed of typically 0.2 m/min to 2 m/min [2], which is too low for many applications.
To increase the process speed and thus productivity and economic efficiency, LMD was developed for extreme high-speed laser material deposition (German acronym: EHLA, Figure 1b). Here, the powder focus and preferably also the laser focus are located above the component surface, so that the powder is already strongly heated—preferably even completely melted—above the component surface. In this way, powder material reaches the weld pool as liquid droplets [2]. Since the particles are already melted on the path to the surface, the time needed to melt the particles in the weld pool is eliminated [2], and the process speed can be increased to up to 500 m per minute [4].
An important aspect of the component functionality is the geometric shape of the surface, which defines the surface condition. The shape of the surface results from the deviations of the actual surface from the geometric (ideal, technical drawing) surface due to manufacturing and random factors [5]. The actual surface can be divided into coarse and fine shapes, with waviness (structures with relatively long wavelengths) and roughness (structures with relatively small wavelengths) attributed to the fine shape surface [6]. Coatings manufactured by high-speed LMD reach a surface roughness of approx. Rz = 50–100 µm, Ra = 11.3–20.5 μm [7,8,9]. In comparison to this, coatings manufactured by conventional LMD reach a surface roughness of approx. Ra = 13.8–31.7 µm (Sa = 15–105 µm) [10,11,12]. The material and coating thickness differ in the mentioned studies. Since different applications demand different surface shape requirements and postprocessing such as grinding or turning is cost-intensive, targeted processing of surface conditions is desirable. This article presents an approach to shaping the surface condition by axial and lateral offset of the laser beam, powder–gas jet, and component surface with the EHLA process. Thus, surfaces ranging from rough to smooth and from porous to dense can be generated.

2. Materials and Methods

2.1. Materials

2.1.1. Filler Material

For this study, the nickel-based superalloy Inconel 625 (German material number 2.4856) is used as filler material in the form of Oerlikon Metco’s MetcoClad 625F powder. Its chemical composition is given in Table 1.
In Figure 2, a scanning electron microscope (SEM, Leo 1455 EP, Carl Zeiss AG, Jena, Germany) shows images of the powder. The particles have a predominantly nearly spherical shape and, in some cases, small satellites. Both are characteristic of gas-atomized powders such as MetcoClad 625F. Moreover, 53.2% of the particles have a sphericity of SPHT = 0.9, and the average sphericity is SPHT = 0.892. Sphericity indicates how closely the shape of a particle corresponds to a sphere, where SPHT = 1 is equivalent to a perfect sphere.
The nominal particle size distribution is specified by the manufacturer as −53 + 20 µm. The measured particle size distribution is shown in Figure 3. In terms of volume, 99.7%, and in terms of number, 98.5% of the particles have a particle diameter xarea in the range of the manufacturer’s specifications. The fine fraction (xarea < 20 µm) is 0% by volume and 1.4% by number. The coarse fraction (xarea > 53%) is 0.3% by volume and 0.1% by number.

2.1.2. Substrate

Cold-drawn, seamless precision steel tubes with an outside diameter of 100 mm, a wall thickness of 8 mm, and a length of 400 mm are used as substrates. The base material is the unalloyed structural steel S355J0 + AR (German material number 1.0553, chemical composition: Table 2), which is mainly used in mechanical engineering [13]. Before the experiments, the substrates are turned at a feed rate of 0.2 mm per revolution and cleaned with ethanol immediately before the coating process.

2.2. Experimental Setup and Tools

2.2.1. Experimental Setup

The experiments are carried out at a facility specially designed for the EHLA process by Hornet Laser Cladding BV, Netherlands. It contains a powder conveying system with a powder feed nozzle, a laser beam source including optics, as well as a work cell including rotary handling, as shown schematically in Figure 4.
The Oerlikon Metco powder feeder Twin-150 (dosing disc type: NL 5.0/1.0) conveys the powder as a powder–gas mixture (conveying gas: argon) via a powder distributor (by HD Sonderoptiken, Übach-Palenberg, Germany), which divides the powder–gas mixture into three equal streams, to the nozzle. This coaxial powder feed nozzle, HighNo 40 from HD Sonderoptiken, is specially designed for the EHLA process and is positioned at a standard distance of 10 mm from the component surface to the nozzle tip. Inside the nozzle, the powder–gas mixture is fed through the nozzle coaxially to the laser beam and focused as a cone over the substrate, where it is melted by the laser beam. The laser beam as well as the shielding gas (argon, for oxygen shielding of the process area and for protection of the nozzle) are guided through the nozzle centrally along the z-axis. The adjustment of the shielding gas volume flow is carried out with the gas mass flow meter of the Redy Compact 2 series from Vögtlin Instruments GmbH, Muttenz, Switzerland.
As a laser beam source, the disc laser TruDisk4002 from Trumpf GmbH, Ditzingen, Germany, with a wavelength of 1030 nm, is used. The nominal output power in continuous wave operation is 80 W up to a maximum of 4000 W, with an output power stability of ±1%. The laser radiation is coupled into the processing optics via a fiberoptic cable LLK-D 06 from Trumpf GmbH, Ditzingen, Germany, with a diameter of 600 µm and a numerical aperture of 0.125.
The BEO D70 collimating optics from Trumpf GmbH enables automated positioning of the laser focal level in the z-direction, thus the axial offset of the laser beam with respect to standard EHLA settings can be realized.
Together with the powder feed nozzle, the optics form a unit that is automatically moved in the x- and z-directions relative to the substrate surface during the coating process. For the axial offset of the powder–gas jet, this unit is shifted in the z-direction, whereby the laser focus position is corrected by the collimator. For the lateral offset between the laser beam and the powder–gas jet, the nozzle is adjusted accordingly via (x-y) set screws.

2.2.2. Laser Beam Caustic

To determine the laser beam caustics, the FocusMonitor FM+ (Primes GmbH, Pfungstadt, Germany) with the detector DFY-PS+ (photodiode) and the measuring tip NIR high div (pinhole diameter 20 μm; sensitivity 1560 cts/(MW/cm2)), as well as the software LaserDiagnosticsSoftware (version 1.4.3) from Primes, is used. The laser beam is measured at a power of PL = 1800 W and for the axial offsets of the laser beam of ΔLB = −20 mm, ΔLB = 0 mm and ΔLB = +20 mm. For each measurement, the intensity distribution is recorded on 31 planes in a range of about ±25 mm around the laser focus position (Figure 5).
The results of the caustic measurement are summarized in Table 3. At standard settings (no axial offset of the laser beam), the laser focus is on the substrate surface and has a diameter of about 1.147 mm. With an axial offset of the laser focus position by means of the collimator, the diameter at the beam waist and the Rayleigh length become smaller from negative offset to positive offset, and the divergence angle becomes larger. The diffraction measure M2 and the beam parameter product BPP remain almost constant.
In the area of focus position, the intensity distribution has a top-hat-like profile. This means that the intensity within the beam radius is relatively large and drops abruptly at the beam radius. However, since the intensity distribution within the beam radius is not homogeneously distributed but rather an intensity peak of about 30% in terms of power at the beam radius is present in the center, the distribution deviates slightly from an ideal top-hat distribution.
Along the optical axis, the power density distribution changes with increasing distance to the focus position into a Gaussian-like pattern (Figure 5 and Figure A1).

2.2.3. Powder–Gas Jet Analysis

For powder–gas jet analysis, the powder jet monitor developed and patented at Fraunhofer ILT (Pat. No.: DE 10 2011 009 345 B3) is used (Figure 6). Thereby, the PGJ is illuminated by a line laser on different planes and viewed by a high-speed camera directed through the powder nozzle, so that the particle density distribution per plane can be determined. For the measurement of the PGJ (powder mass flow rate m . = 9.6 g/min, conveying gas volume flow rare V˙F = 6 L/min, protective gas volume flow rare V˙S = 10 L/min), 1000 images per plane are taken, and superimposed on 14 planes (distances of the planes: see Table 4). From these, the powder density distribution as well as the diameters per plane can be determined, and the spatial position of the PGJ focus with respect to the nozzle tip as well as the propagation of the PGJ can be derived. The results are summarized in Table 4.
The smallest measured diameter is on the measuring plane at 9 mm, but the calculated focus position is located at a distance of 9.06 mm with respect to the nozzle tip, which corresponds to a distance of the focus to the substrate surface at the standard setting (no axial offset of the PGJ) of about 0.94 mm. At this position, the PGJ has a calculated focus diameter of 1.162 mm. Above the focus, the PGJ has the shape of a hollow cone, so the particle density distribution is annular. Towards the focus position, the powder–gas jet narrows to the area of the PGJ focus and widens below the focus position to a jet with a particle density distribution that is no longer annular.

2.3. Methods

2.3.1. Experimental Approach

The investigation of the influence of the relative positioning of the laser beam, powder–gas jet, and substrate on the surface properties is carried out on the one hand on 12 mm-wide coatings and on the other hand on single tracks. To generate the coatings, several single tracks are placed with an overlap that results from an axial feed rate of the substrate relative to the processing head of vf = 0.2 mm/rev. For the single tracks (without overlap), helices with four turns and a pitch of 2 mm (vf = 2 mm/rev) are applied. The selected settings of the process parameters laser power PL, powder mass flow rate m . , peripheral speed vU of the substrate surface relative to the processing head, feed rate vf, conveying gas volume flow rate V˙F, and protective gas volume flow V˙S rate can be seen in Table 5. With these settings, the lateral and axial offsets of LB and PGJ are varied in succession.
Figure 7 shows schematically the lateral and axial offsets of the LB and PGJ. The axial offset of the laser beam ΔLB indicates the distance in the z-direction (axial distance) of the laser focus from the substrate surface. At ΔLB = 0 mm, the LB focus is on the substrate surface. A positive axial offset means that the laser focus is above the substrate surface, i.e., it is moved towards the powder feed nozzle, whereas a negative axial offset means that the laser focus is below the substrate surface. During preliminary investigations, it was possible to determine the range from ΔLB = −20 mm to ΔLB = +20 mm in which coatings or parts of them are completely metallurgically bonded to the substrate. The axial offset of the laser focus position affects, on the one hand, the interaction between the laser beam and the powder–gas jet, so that both the interaction time and distance, as well as the experienced intensity distribution of each powder particle, and thus the absorbed energy, are changed. On the other hand, the laser spot on the substrate surface changes both in size and intensity distribution, which in turn affects the heating of the substrate and the weld pool.
The axial offset of the powder–gas jet ΔPGJ is set via the nozzle tip distance to the substrate surface, whereby the laser focus position is corrected in each case. By default (ΔPGJ = 0 mm), a nozzle distance of 10 mm is selected, which corresponds to a distance of the PGJ focus to the substrate surface of 0.94 mm. A positive axial offset of the PGJ means that the distance between the focus and substrate surface is increased, and vice versa. The axial offset is varied in 1 mm increments, with the limit set at ΔPGJ = −1 mm for negative offset. This corresponds practically to conventional LMD, so that a further negative offset is not considered. The upper limit in the positive range is chosen at ΔPGJ = +4 mm since preliminary investigations have shown that at larger offsets, it is no longer possible to ensure working coatings with the parameter settings used here. The axial offset ΔPGJ affects the interaction distance and time between the laser beam and the powder particles, as well as the intensity distribution experienced by the particles. Furthermore, the PGJ spot on the substrate surface is influenced in terms of size and particle distribution.
In the case of a lateral offset between the LB and the PGJ, the PGJ is displaced laterally with respect to the optical axis of the LB. The offset is given by the polar coordinates φPGJ (angle with respect to vU) and rPGJ (distance of the axis of the PGJ to the optical axis of the LB). For the investigations concerning the lateral offset, rPGJ = 0.6 mm is chosen. A larger displacement of the PGJ is not possible due to the nozzle geometry, since the laser beam could collide with the inner nozzle wall and damage it. The angle φPGJ is varied from φPGJ = 0° to φPGJ = 315° in 45° steps. Due to the lateral offset, the powder particles no longer pass through the laser beam radially symmetrically. As a result, the interaction distance and time of the particles within the PGJ differ. This affects the experienced intensity distribution as well as the heating of the individual particles of the PGJ and the substrate. Furthermore, the lateral offset can influence the overspray so that, e.g., the number of particle adhesions can be increased. On the other hand, a kind of laser polishing effect is expected from the remelting of already applied filler material without the supply of further filler material. For the later description of the results, locations on the substrate surface with respect to the laser spot are labeled “behind”, “in front”, “on the left”, and “on the right”, as in Figure 7c.

2.3.2. Analysis of Surface Condition

The surface condition of the coatings is analyzed and evaluated with respect to the parameters “mean arithmetic height” Sa, “maximum height” Sz, and “developed transition area ratio” Sdr according to DIN EN ISO 25178-2. Furthermore, the number of particle adhesions per mm2 is determined. Sa is calculated from the arithmetic mean of the absolute ordinate values within a defined range [14]. Sz is calculated from the sum of the largest profile peak and the largest slump height within a defined area [14]. Sdr describes the ratio of the increase in the transition area of a scale-limited surface within the definition range over the defined area [14]. Thus, Sdr indicates the percentage of the additional area of the definition area that is due to texture compared to the absolutely flat definition area [15].
To determine the surface parameters, the surfaces of the coatings are imaged using the Zygo Nexview NX2 white light interferometer (WLI) from Ametek (Berwyn, PA, USA). For this purpose, a 6.31 mm × 6.31 mm measuring field is first imaged for each coating using a 1.4× objective. Subsequently, images are taken at three different points in this measurement field with a 5.5× objective (Figure 8). These WLI files are prepared with the MX software (Zygo Corporation, Middlefield, CT, USA) for subsequent evaluation (for the preparation settings, see Table A1). From the 5.5× WLI images, the characteristics Sa, Sz, and Sdr are determined with MX.
To determine the number of particle adhesions on coatings, the 1.4× WLI images are prepared according to Table A1. With the software Gwyddion and the integrated function “Automated Threshold Using Otsu’s Method on Heights”, the particles are detected (orange dotes in Figure 9a,b), and their number can be determined (Figure 9a). This method reaches its limits with a large particle density on the surface if individual particles can no longer be resolved separately from each other. If individual particles are deposited close together, these particles can also form agglomerates, which are interpreted and counted as a single particle (Figure 9b, 2). In these cases, the determined particle number decreases. Another limit exists for surfaces with predominantly long-wave (>>grain fraction) structures and comparatively few particle adhesions. Filtering reduces the heights of particles so that the filtered surfaces are very flat and the detection of individual particles with Otsu’s method is no longer possible (Figure 9c).
In addition, a distribution in the x-direction (Figure 10) of adhering particles, agglomerates, as well as any structures of the track edges is determined. Since a helix with 4 turns and a pitch of 2 mm was generated for each parameter setting, and the distance between two neighboring single tracks is sometimes so small that the particles cannot be assigned to the corresponding single track, the outer areas with a size of 2 mm × 2 mm of the outer single tracks are considered in each case and then merged (Figure 10). For the determination of the distribution, the 1.4× WIM images are prepared according to Table A1. By means of Gwyddion and the integrated function “Automated Threshold Using Otsu’s Method on Heights”, the structures are detected, and their distribution is given out in 0.05 mm intervals.
Photron’s FastCam SA5 (Photron, Tokyo, Japan) is used to observe the weld pool (Figure 11). The camera is aligned perpendicular to the peripheral speed of the substrate vU (α = 90°) and at an angle of β = 45° to the horizontal on the weld pool. The weld pool is illuminated by the Cavilux HF illumination laser (wavelength: 808 ± 10 nm; power: 500 W ± 10%) from Cavitar Ltd. A bandpass filter (CWL = 810 nm, FWHM = 10 nm) is placed in front of the camera objective to reject the processing laser. The camera is operated at a frame rate of 40,000 fps.

3. Results and Discussion

3.1. Axial Offset of the Laser Beam ΔLB

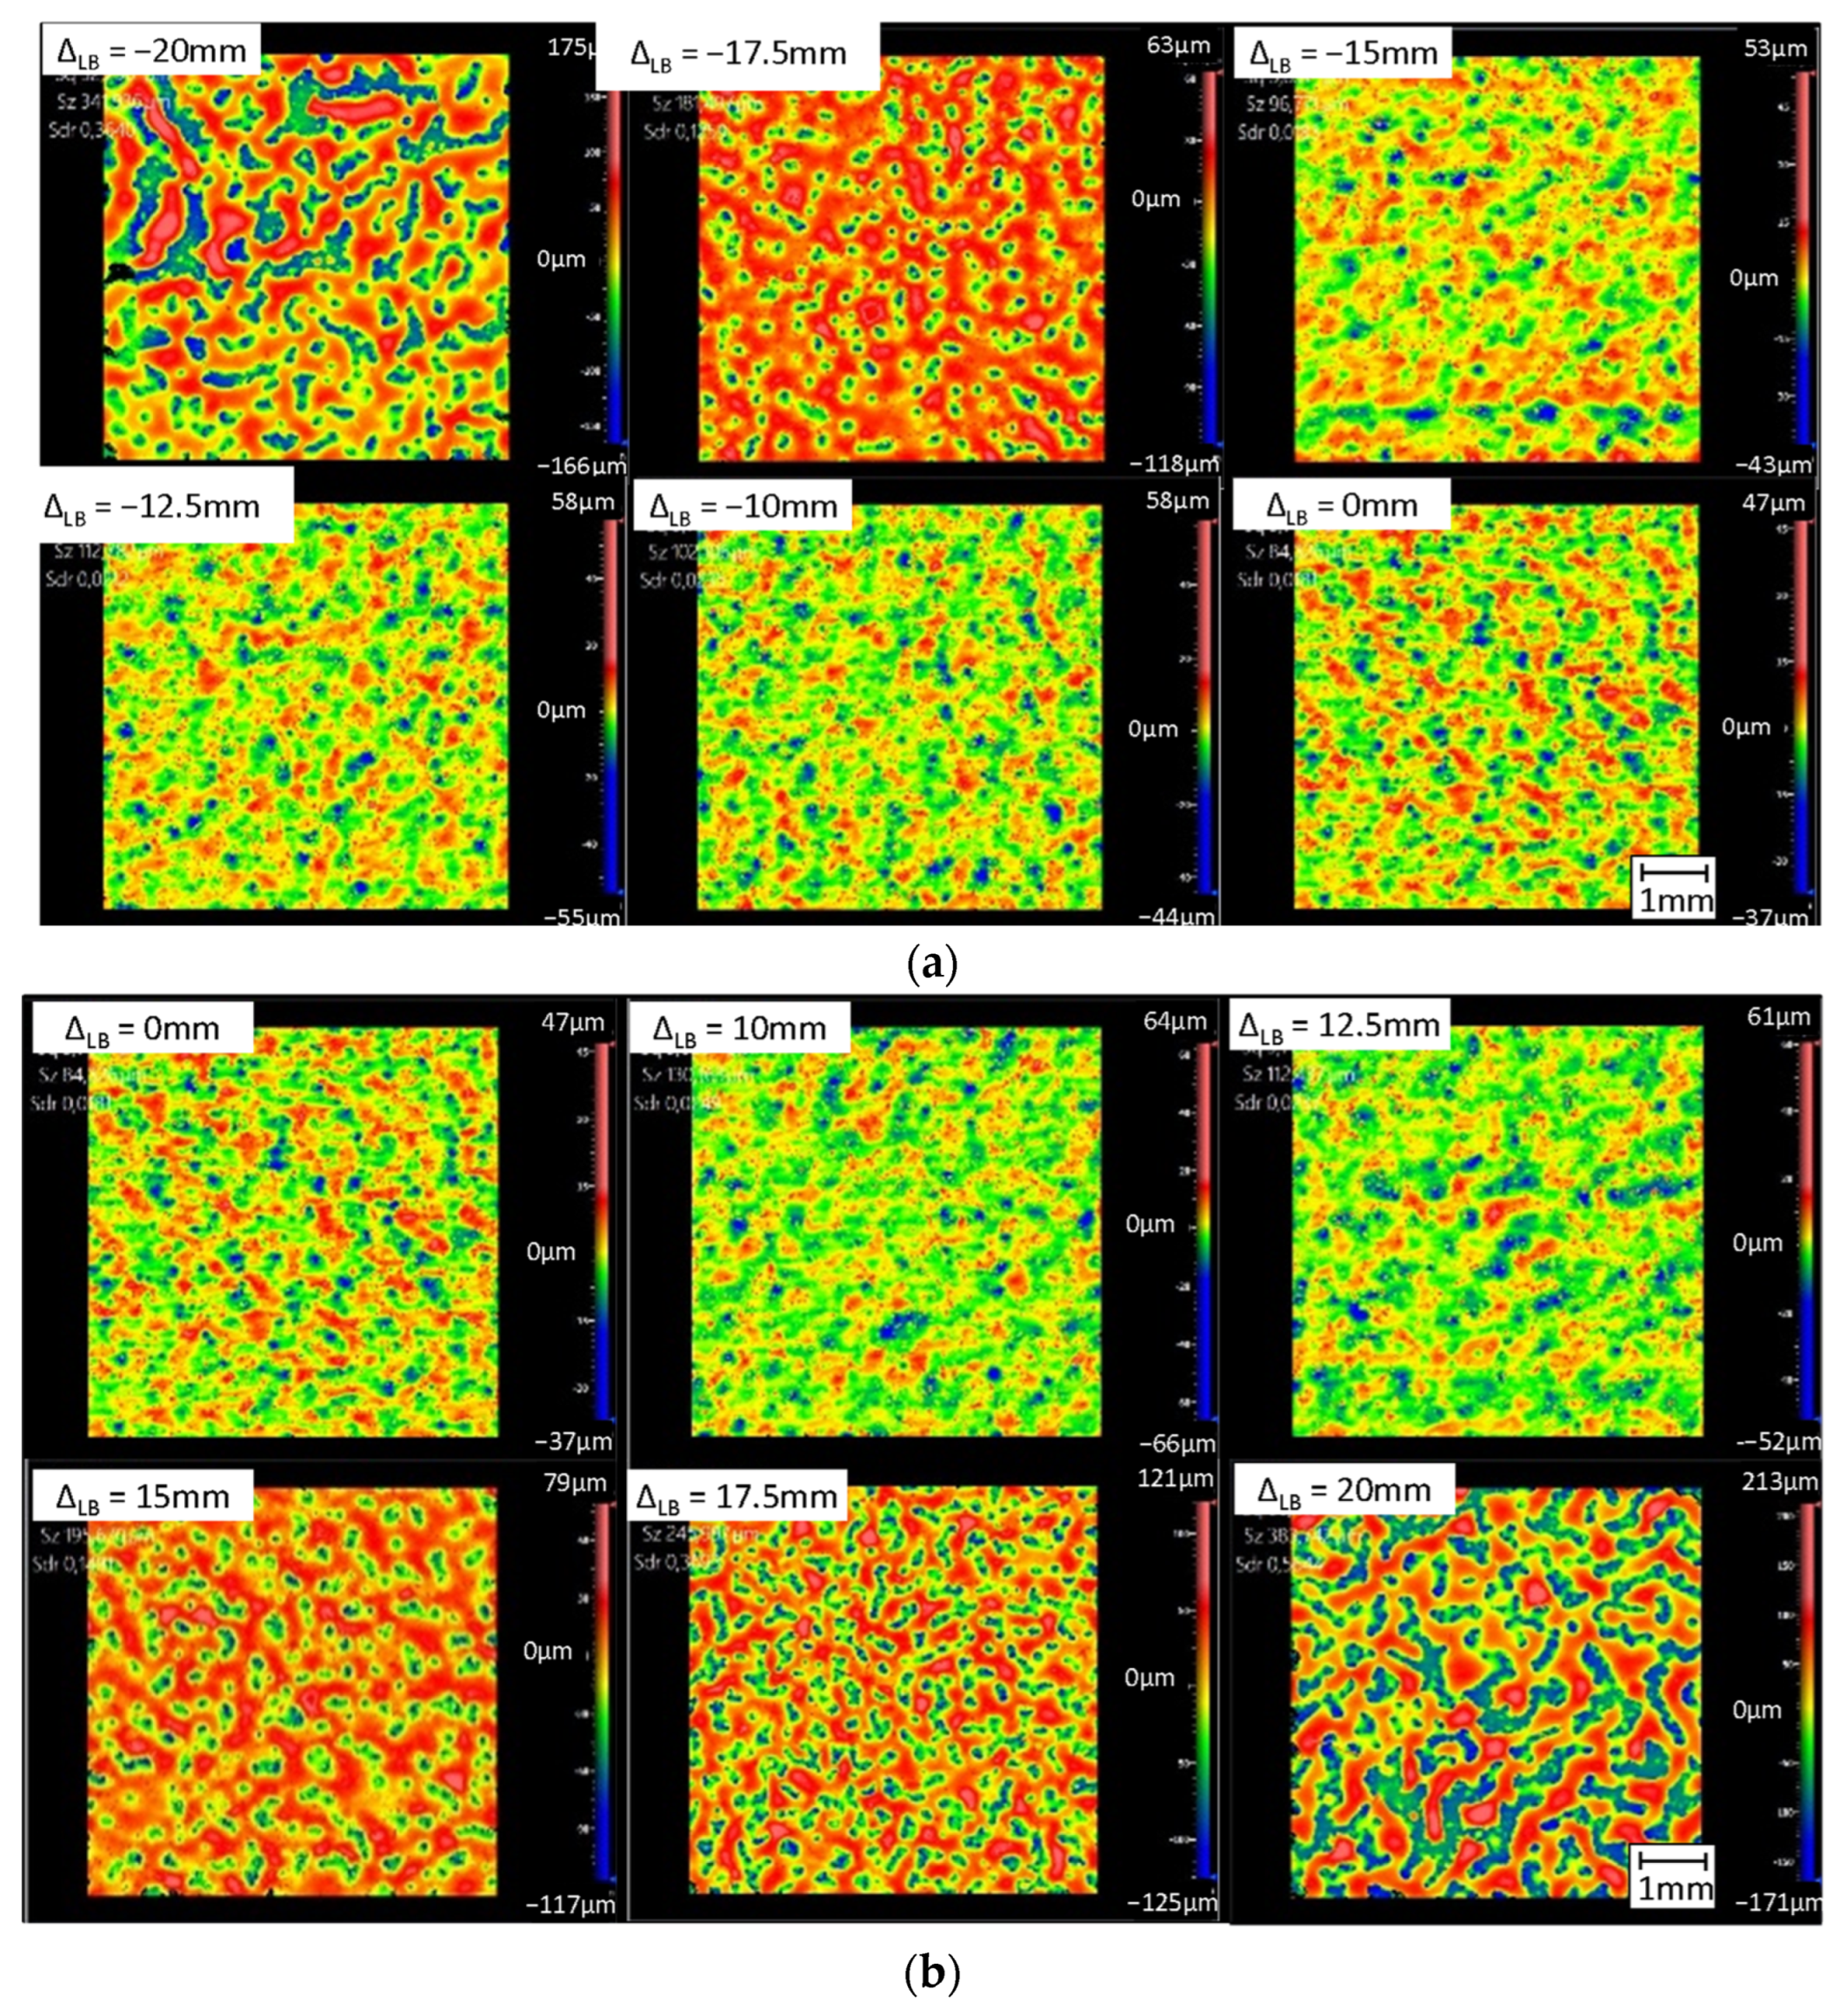
To evaluate the surface condition, the height profile in the WLI images (Figure 12) shall be considered first. Based on the surface structures, the coatings created in a range of −15 mm ≤ ΔLB ≤ 12.5 mm have comparable coating surfaces at standard settings (ΔLB = 0 mm). The microstructure is fine and has a small height difference. The surface structure changes significantly with a negative offset from ΔLB = −17.5 mm or with a positive offset from ΔLB = 15 mm. A coarse macrostructure is formed, and defined melt islands are visible. This applies to both the lateral extent and the axial height of the structures (note the height scales). In these areas, large structures spreading over many single tracks can be recognized, which do not show any orientation.
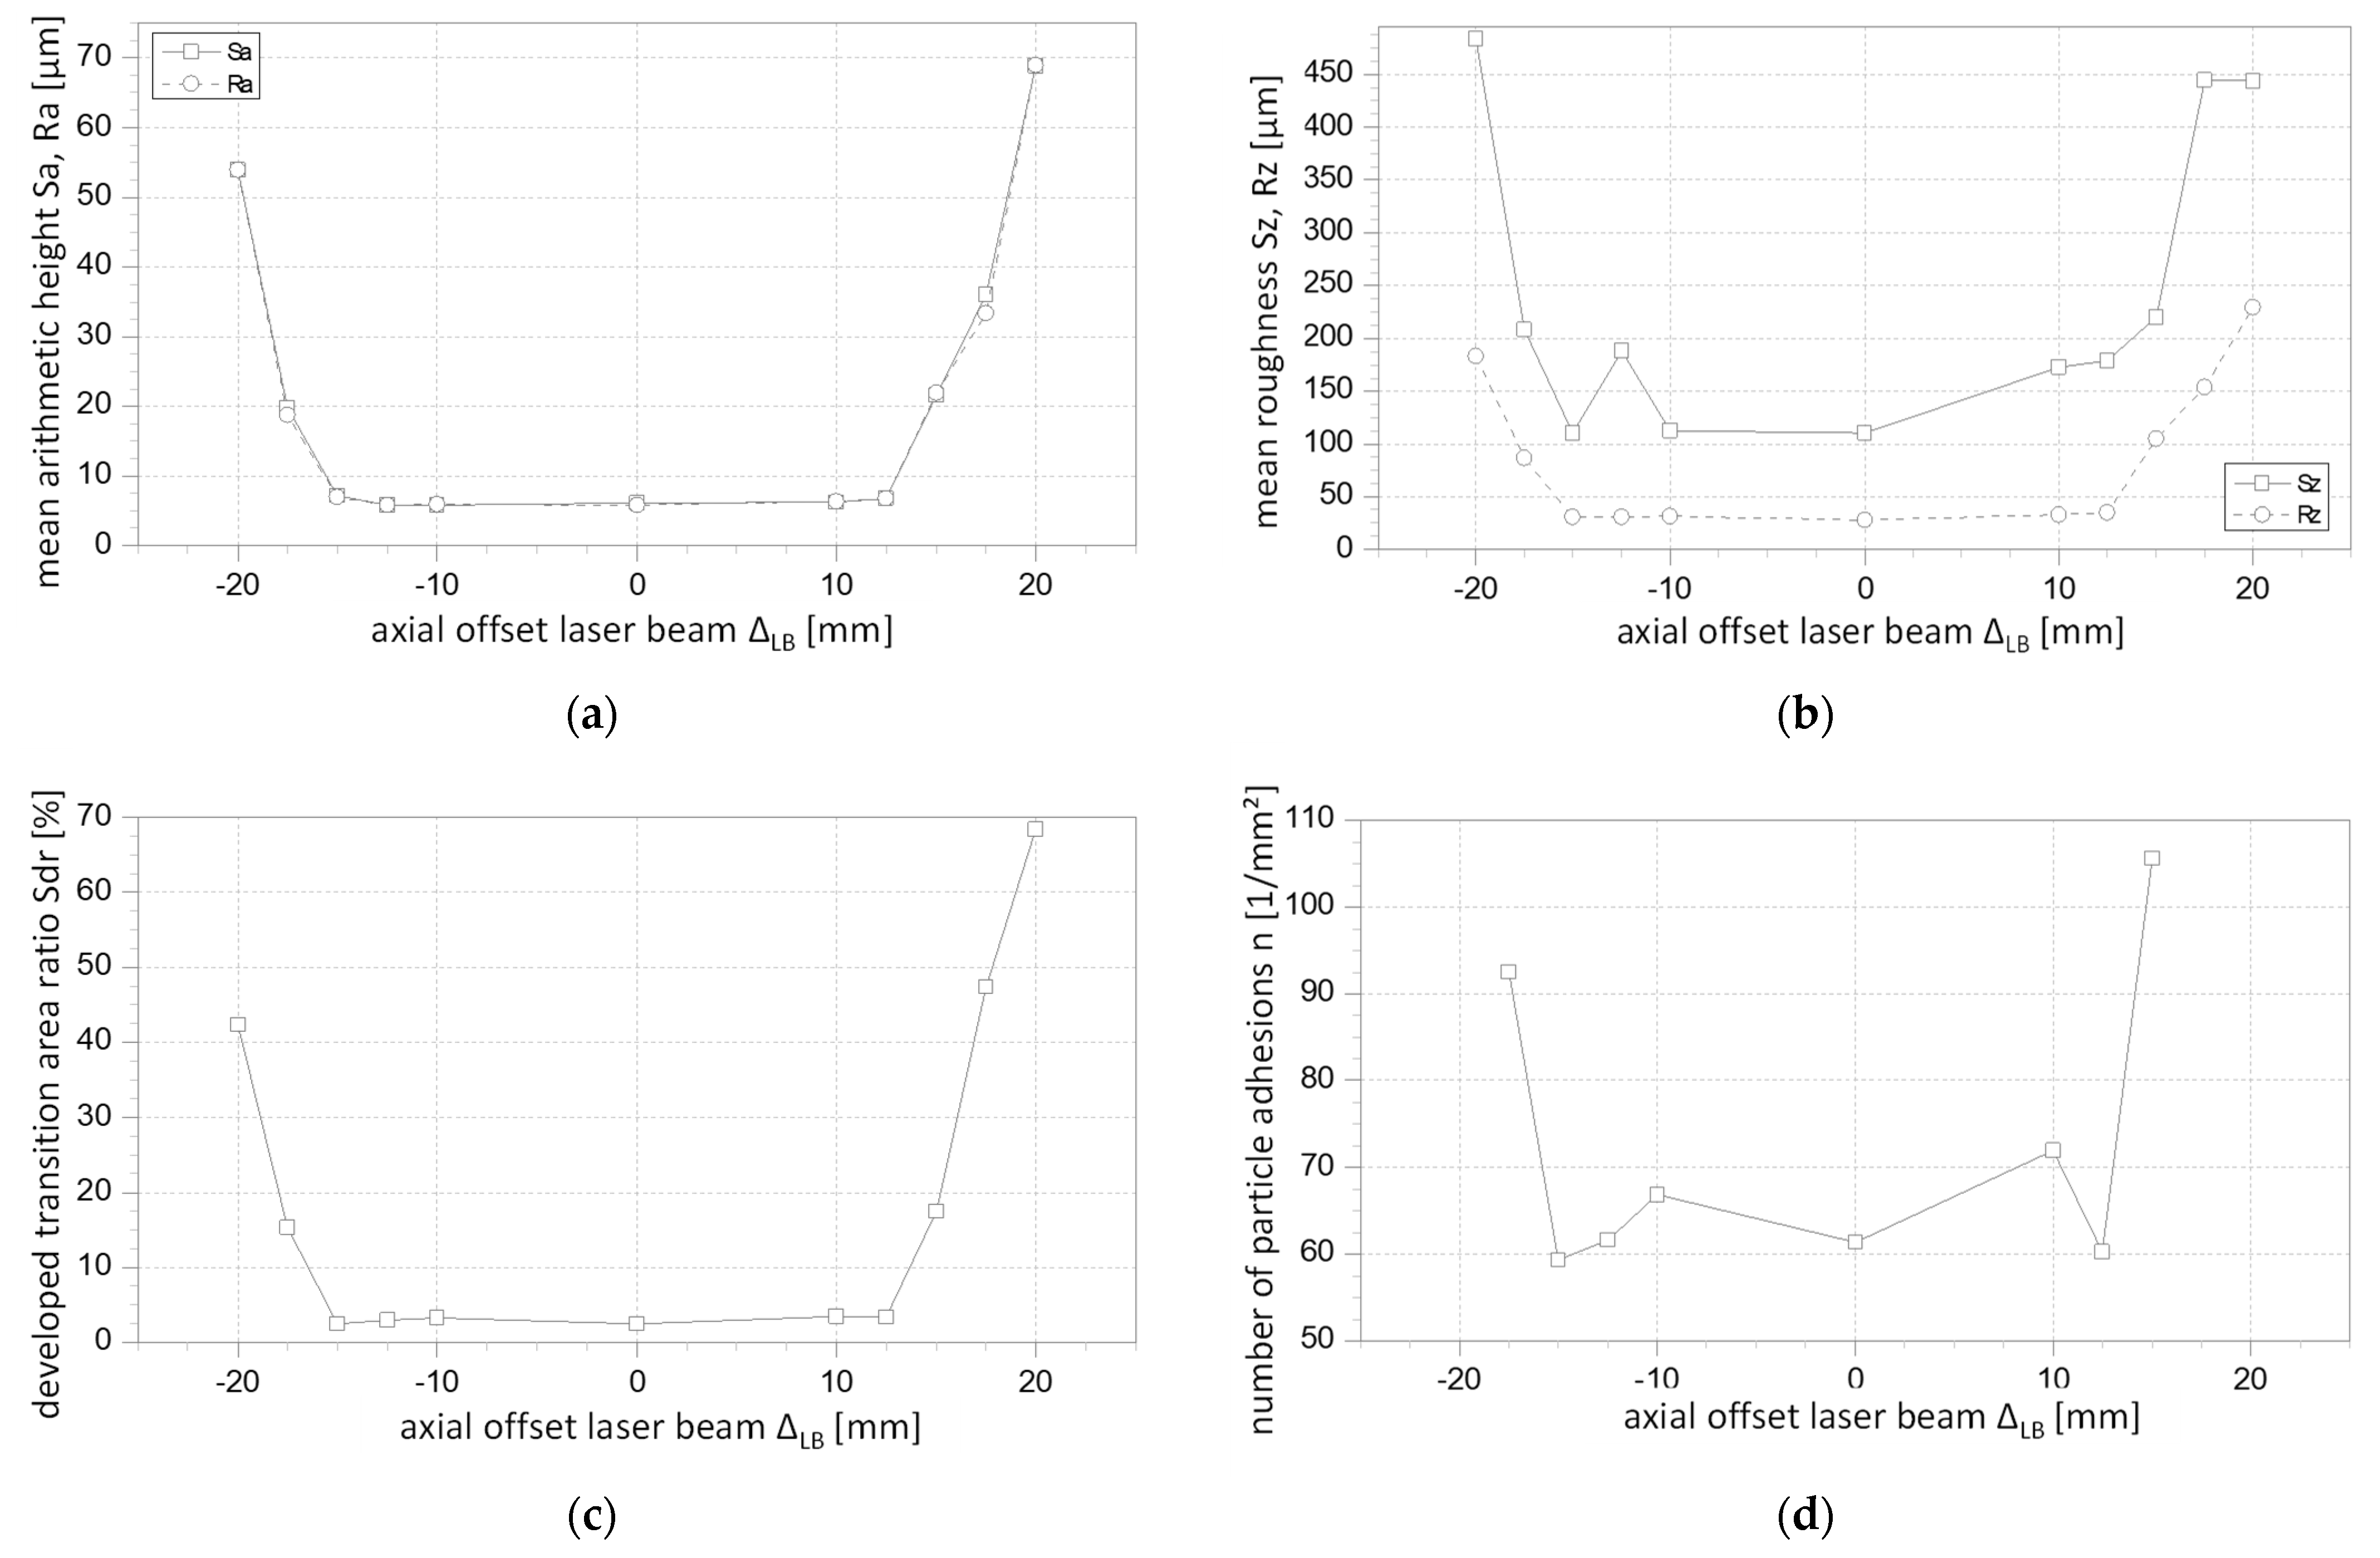
The same can be seen in the determined parameters Sa, Sz, and Sdr (Figure 13). In the range of −15 mm ≤ ΔLB ≤ 12.5 mm, the mean arithmetic height is comparable with values of about Sa ≈ 6.3 µm. Outside this range, the value increases to Sa = 53.9 µm at ΔLB = −20 mm and to Sa = 68.8 µm at ΔLB = 20 mm. The mean roughness takes values between Sz = 110.4 µm and Sz = 188 µm in the range of −15 mm ≤ ΔLB ≤ 12.5 mm and more than doubles outside this range to Sz = 483.7 µm at ΔLB = −20 mm and to Sz = 443.7 µm at ΔLB = 20 mm due to the large structure heights. Since the real surface area is increased by the resulting structures, the developed area ratio also shows this trend, so that it is Sdr ≈ 3% inside the range of −15 mm ≤ ΔLB ≤ 12.5 mm and increases to Sdr ≈ 42.3% at ΔLB = −20 mm and to Sdr ≈ 68.4% at ΔLB = 20 mm outside this range. The particle number could only be determined from ΔLB = −17.5 mm to ΔLB = 15 mm using the method described above. In the range from ΔLB = −15 mm to ΔLB = 12.5 mm, the coating surfaces have a number of adhering particles of 59 to 72 per mm2, whereas at ΔLB = −17.5 mm and at ΔLB = 15 mm, the number increases to 93 and to 106 per mm2, respectively.
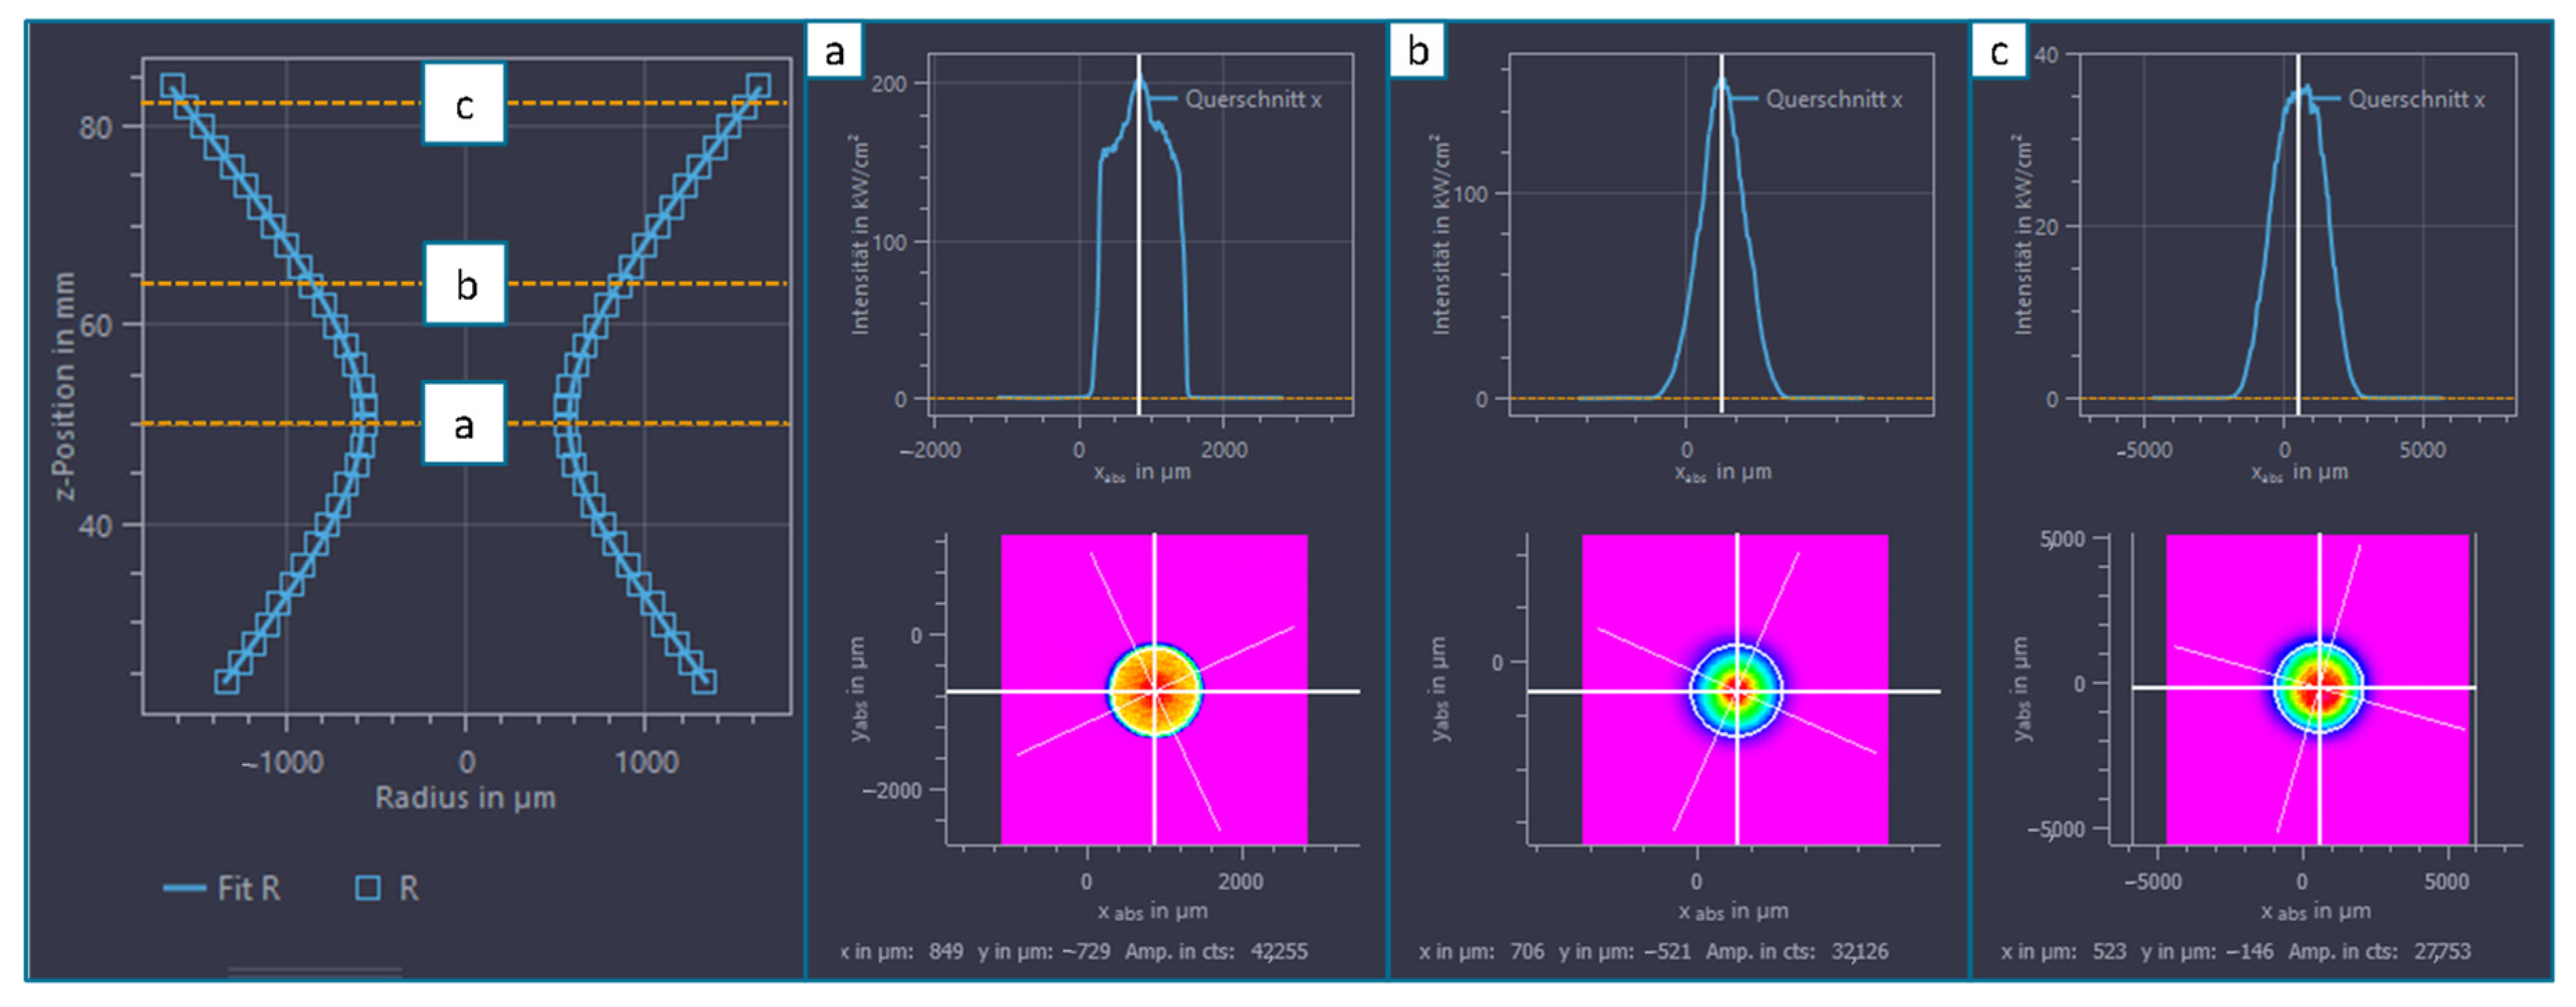
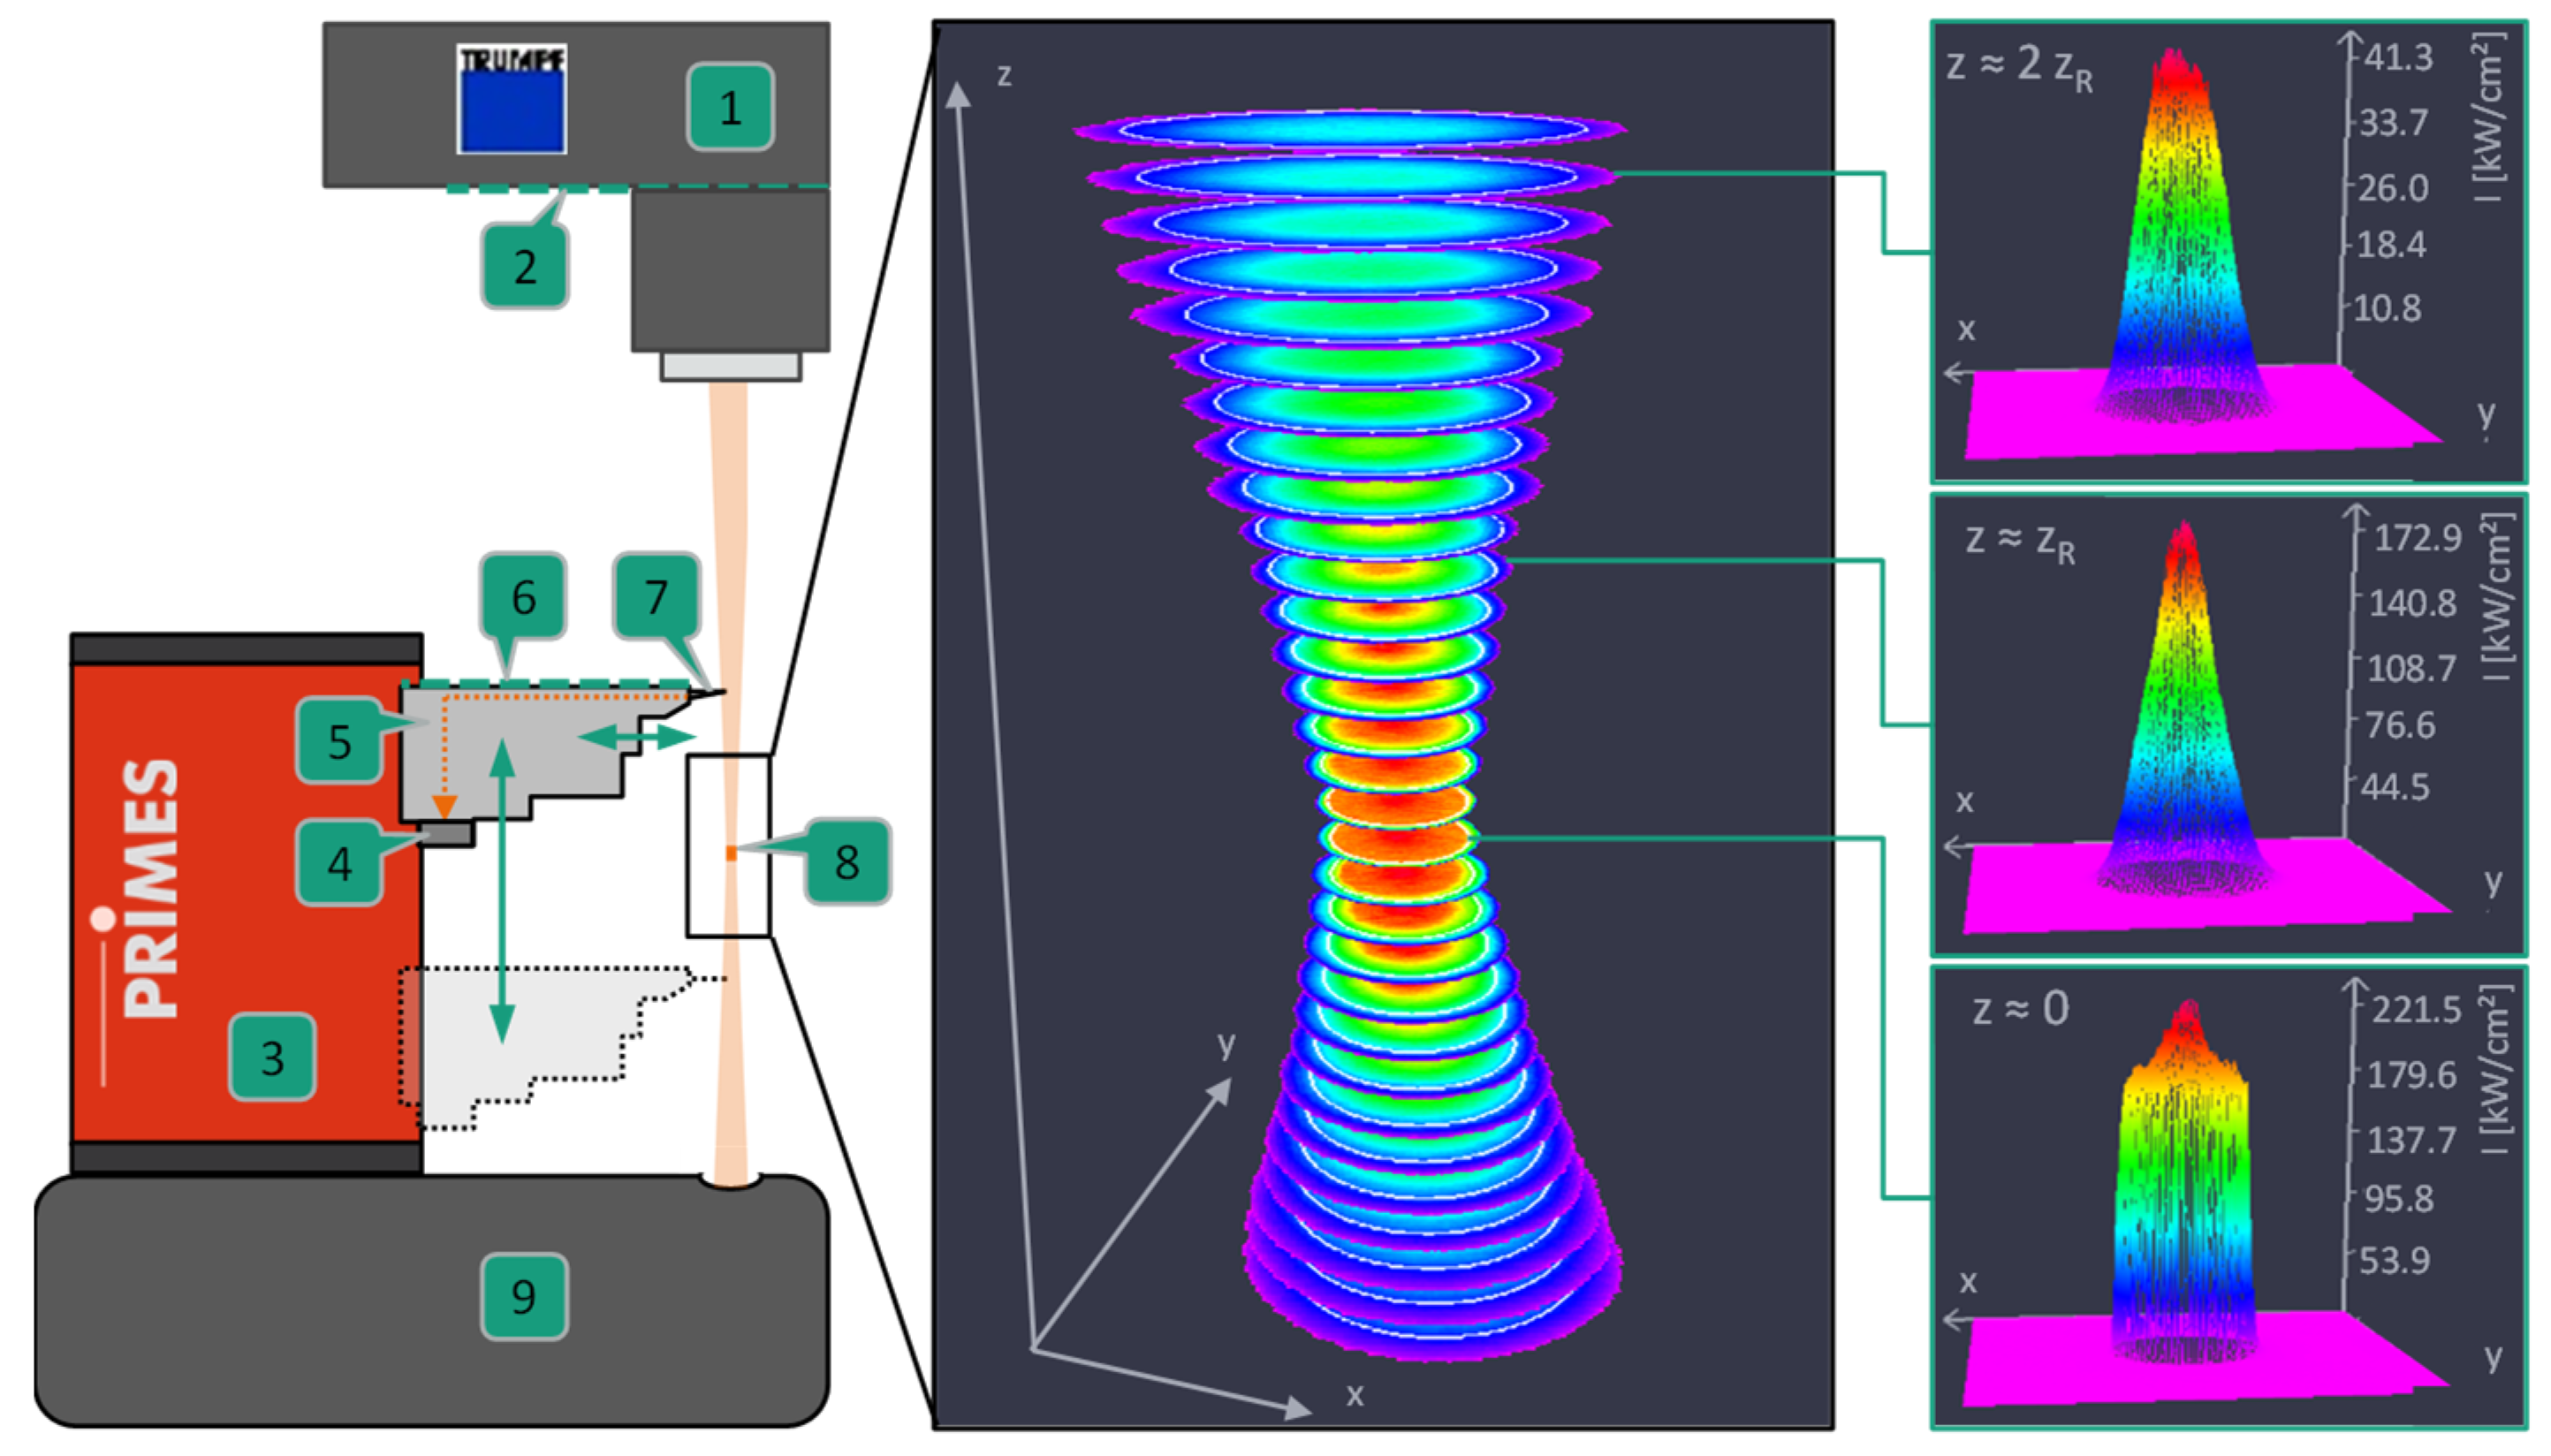
The Rayleigh length zR of the laser beam could be the reason why the surface properties of the coatings remain almost constant over a wide range of the axial offset of the laser beam and change significantly only from ΔLB = −17.5 mm to ΔLB = 15 mm. The Rayleigh length indicates the axial distance from the beam waist at which the laser beam expands to √(2)-fold [16], i.e., the laser spot area doubles. Within the Rayleigh length, intensity changes due to the caustic can be neglected (for Gaussian beams) [1]. The range from z = −zR to z = zR with respect to the beam waist is called the focus length [16]. For the laser beam used here, an approximately constant energy distribution and input into both the substrate and the PGJ is also expected in this range, so that the surface conditions are expected to be constant over the range of the focus length.
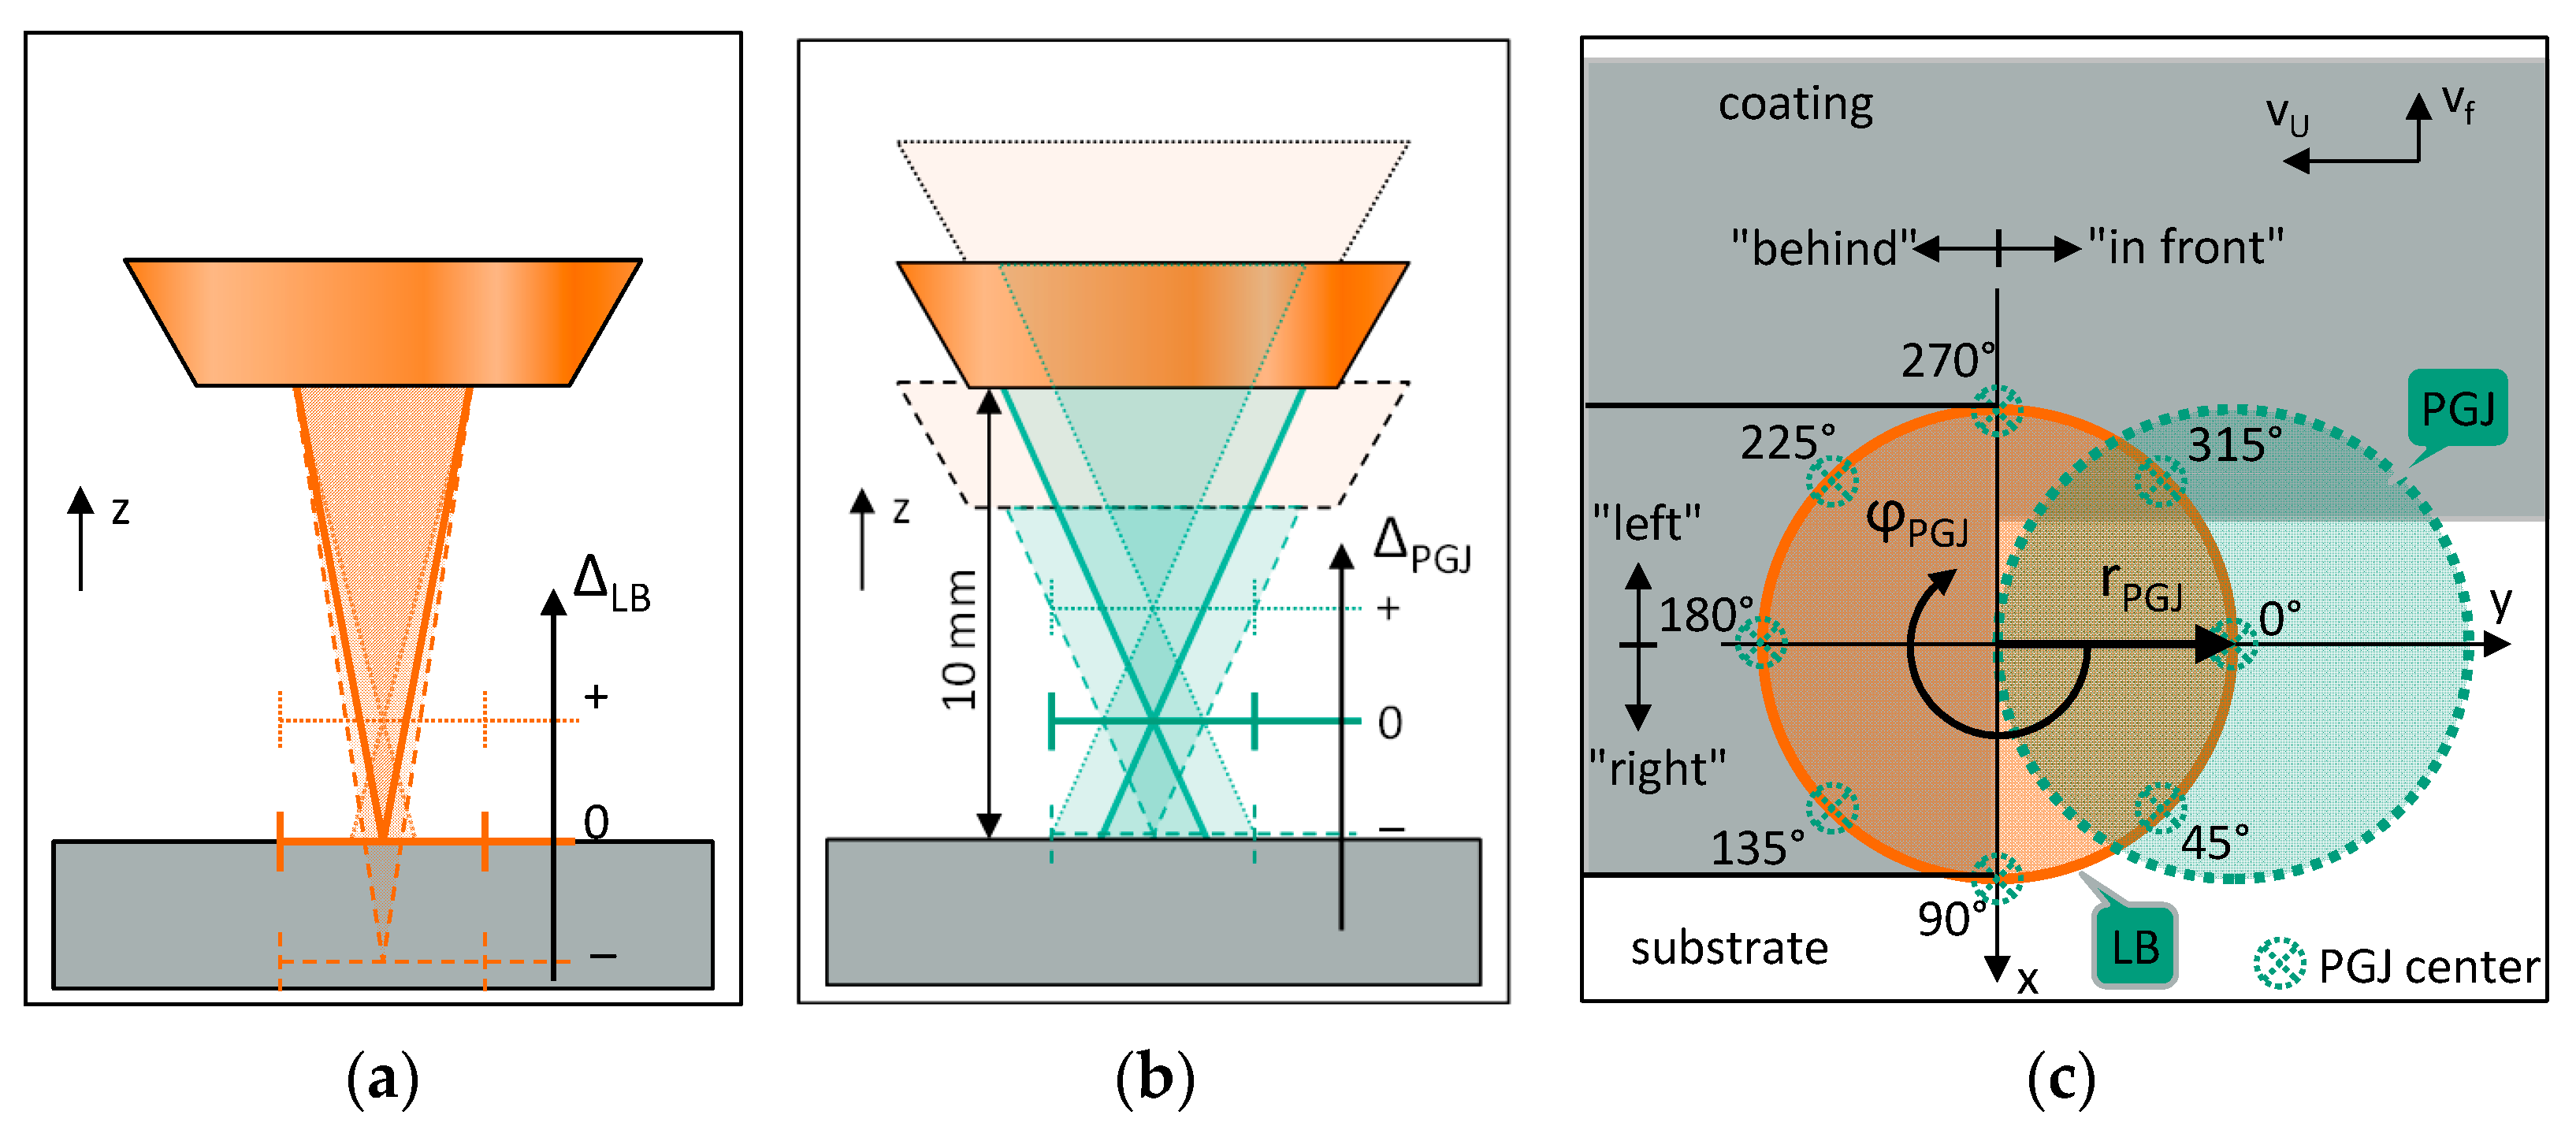
For negative offset, effects on the surface condition are first noticeable at ΔLB = −17.5 mm, whereas for positive offset, they are already noticeable at ΔLB = 15 mm. This asymmetry could be related to the change in Rayleigh length that occurs when the laser beam focus is shifted by the collimator. A negative shift increases the Rayleigh length, and a positive shift decreases it. Thus, with a positive offset, the substrate surface emerges earlier from the range of the focus length, so that differences in the energy input into the substrate and thus differences in the weld pool formation can occur earlier here than with a negative offset of the laser beam.
Thus, it can be said that the EHLA process with the parameter settings of Table 5 is stable at least over the range of the focal length (±zR). A shift beyond ±z
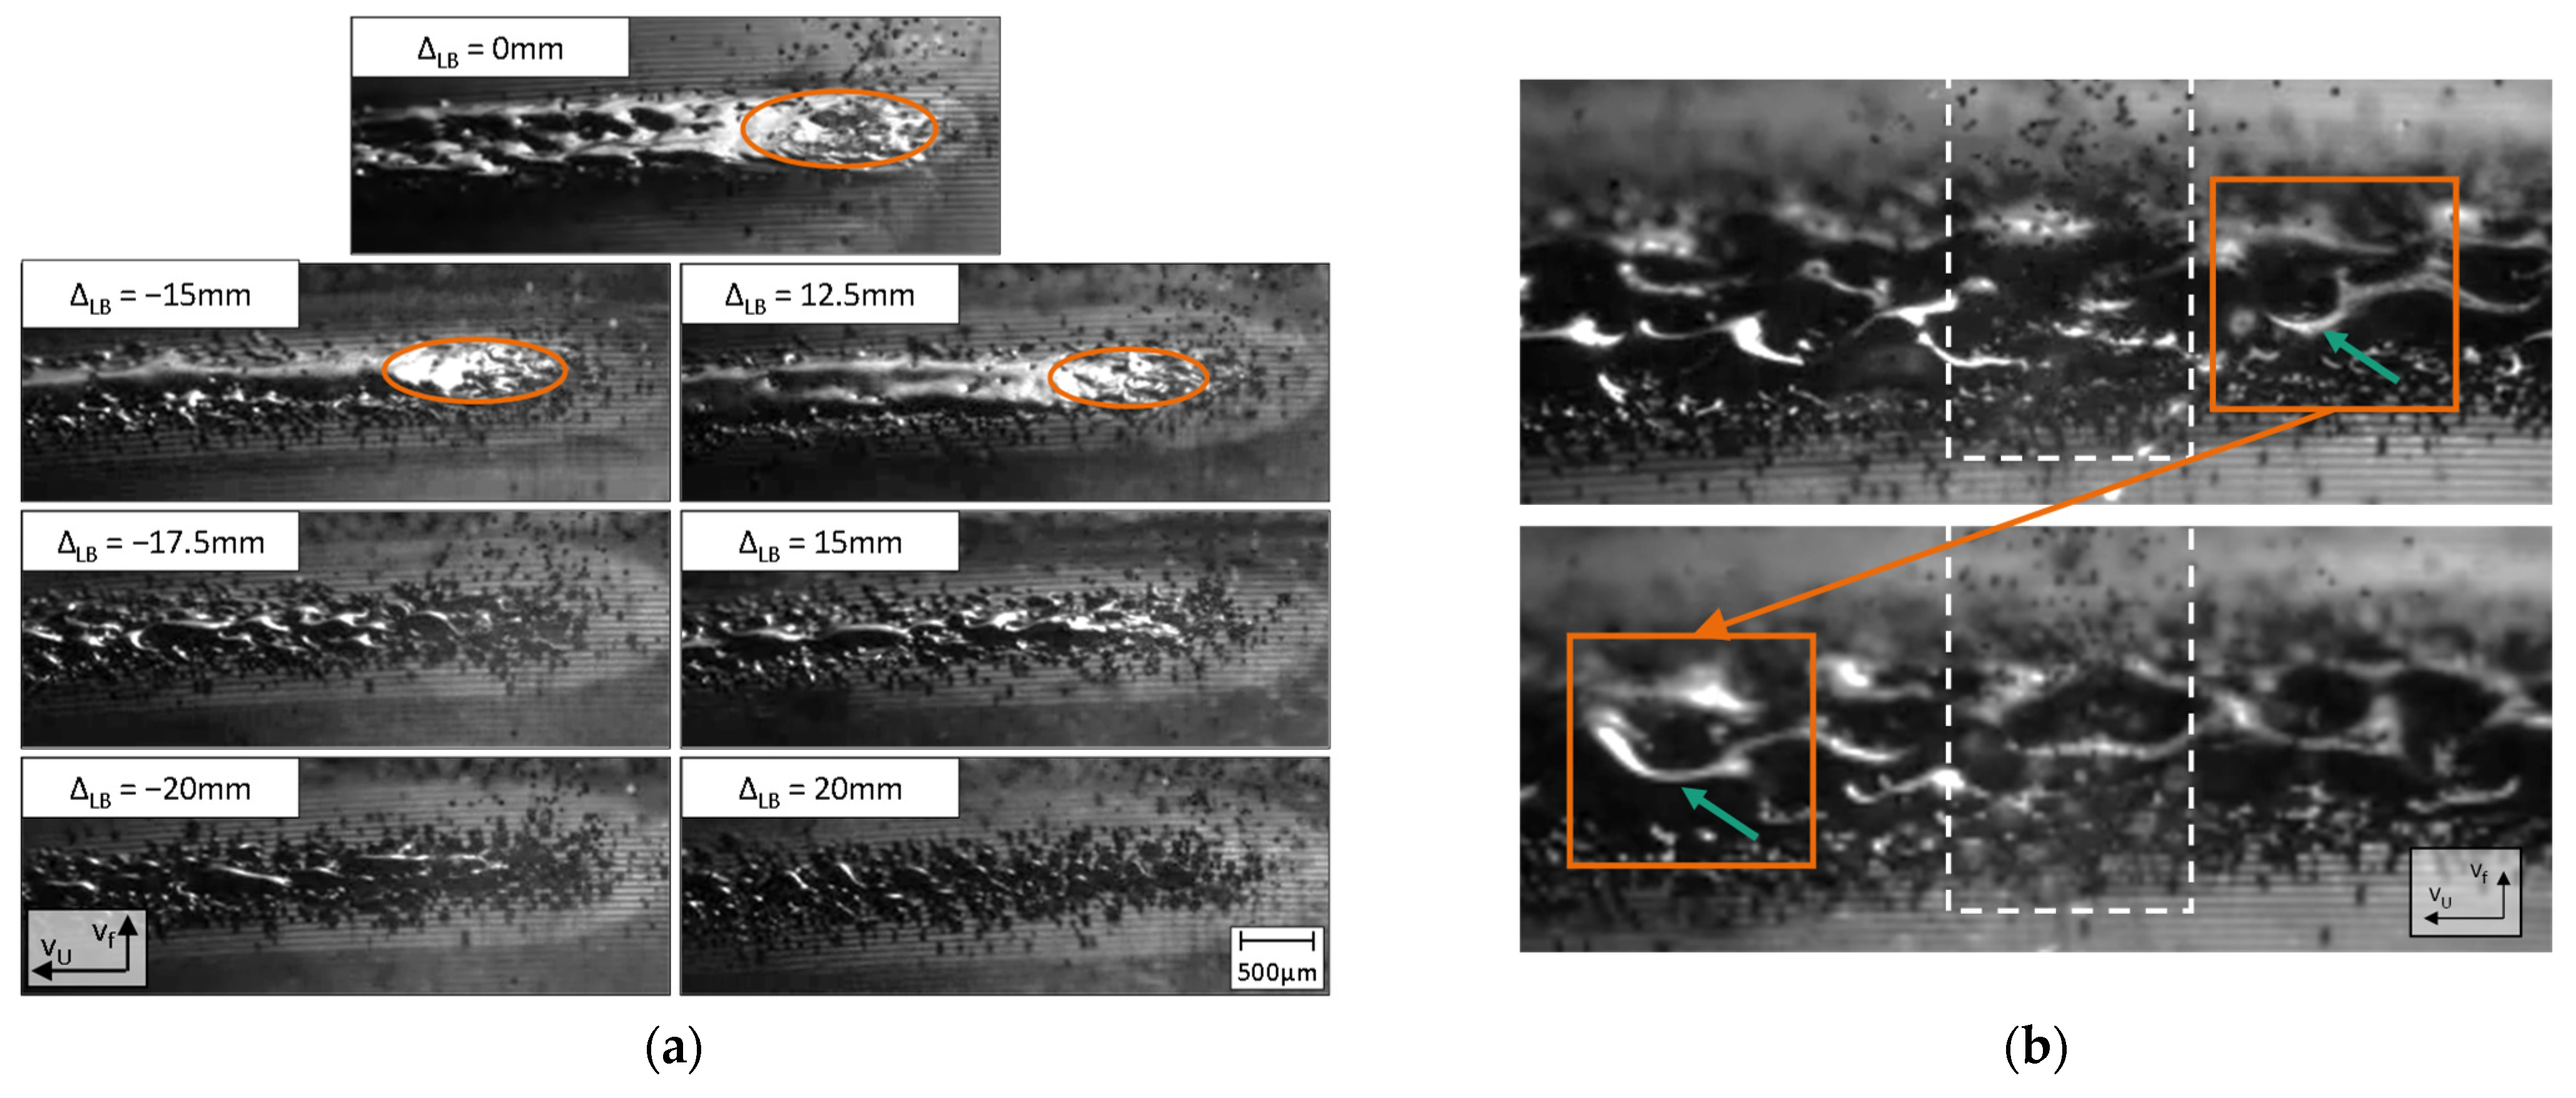
R can lead to an insufficient power density on the substrate surface to generate or permanently sustain a weld pool. This is shown by the single tracks (Figure 14). With the standard setting, a clear, almost uniform boundary between the deposited track and the substrate can be seen, whereas the edges of the single tracks become increasingly frayed with negative axial offset. Furthermore, up to ΔLB = −15 mm, the material is deposited continuously in the core areas of the single tracks. From ΔLB = −17.5 mm, however, an increasing number of defects can be seen in the core areas of the single tracks, so that no longer continuous tracks are produced. The behavior of the positive offset is equivalent to that of the negative offset.
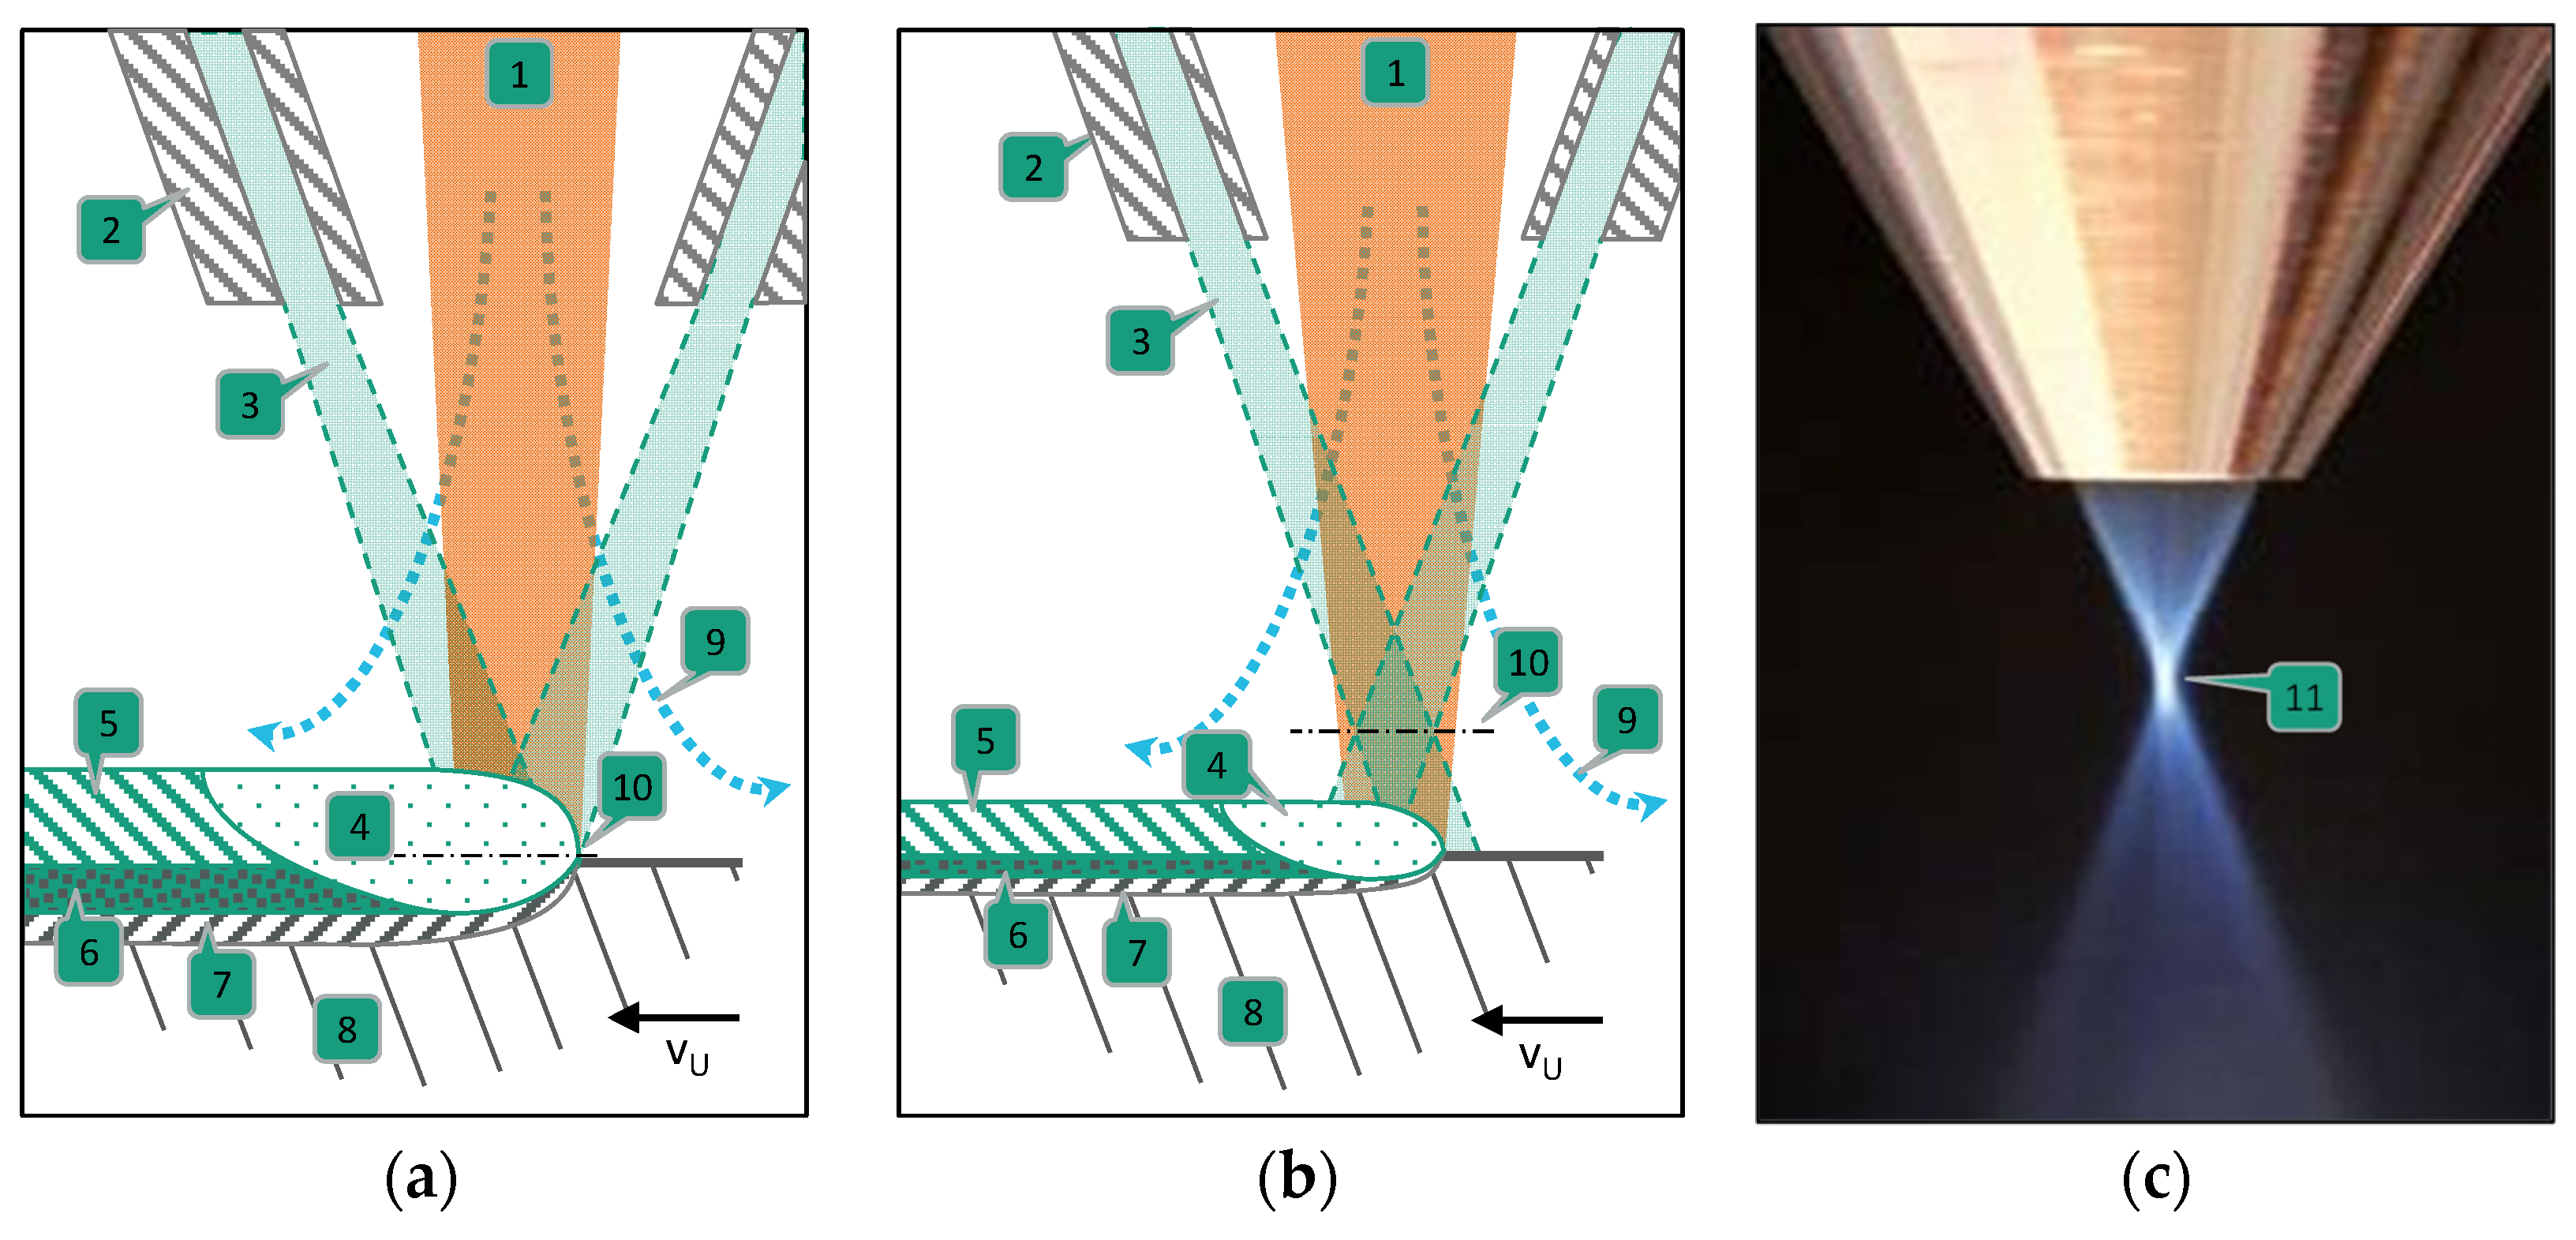
The high-speed images (Figure 15a) show that at ΔLB = −15 mm, there is still a continuous, permanent weld pool. At ΔLB = −17.5 mm, the weld pool is no longer continuous, which could be caused by the reduced energy density on the substrate surface. So, instead of a single melt line, several individual structures are formed on the substrate surface. During the next overlapping run, the material already deposited is re-melted, and due to surface tension, the newly deposited material preferably forms a molten bond with the remelted material of the existing structures. This can be seen in Figure 15b. In the top image, the area of the already coated substrate marked by the orange rectangle is still in front of the process area of the single track now to be applied. Here, a recess with relatively small crater walls can be seen (green arrow). In the bottom image, the marked area has moved to the left, behind the process area. During the process, additional material has accumulated on the crater wall, making it more pronounced, and this structure thus extends over another single track.
The same is observed with a positive axial offset. In this case, non-continuous core areas occur in single tracks with strongly frayed edges from ΔLB = 15 mm. In the high-speed images, processes comparable to those described above can be seen. The fact that no more continuous weld pools are generated above a certain axial offset suggests that the power density on the substrate surface is no longer sufficient to apply enough energy per area and time to reach the melting temperature of the substrate material.

3.2. Axial Offset of the Powder–Gas Jet ΔPGJ

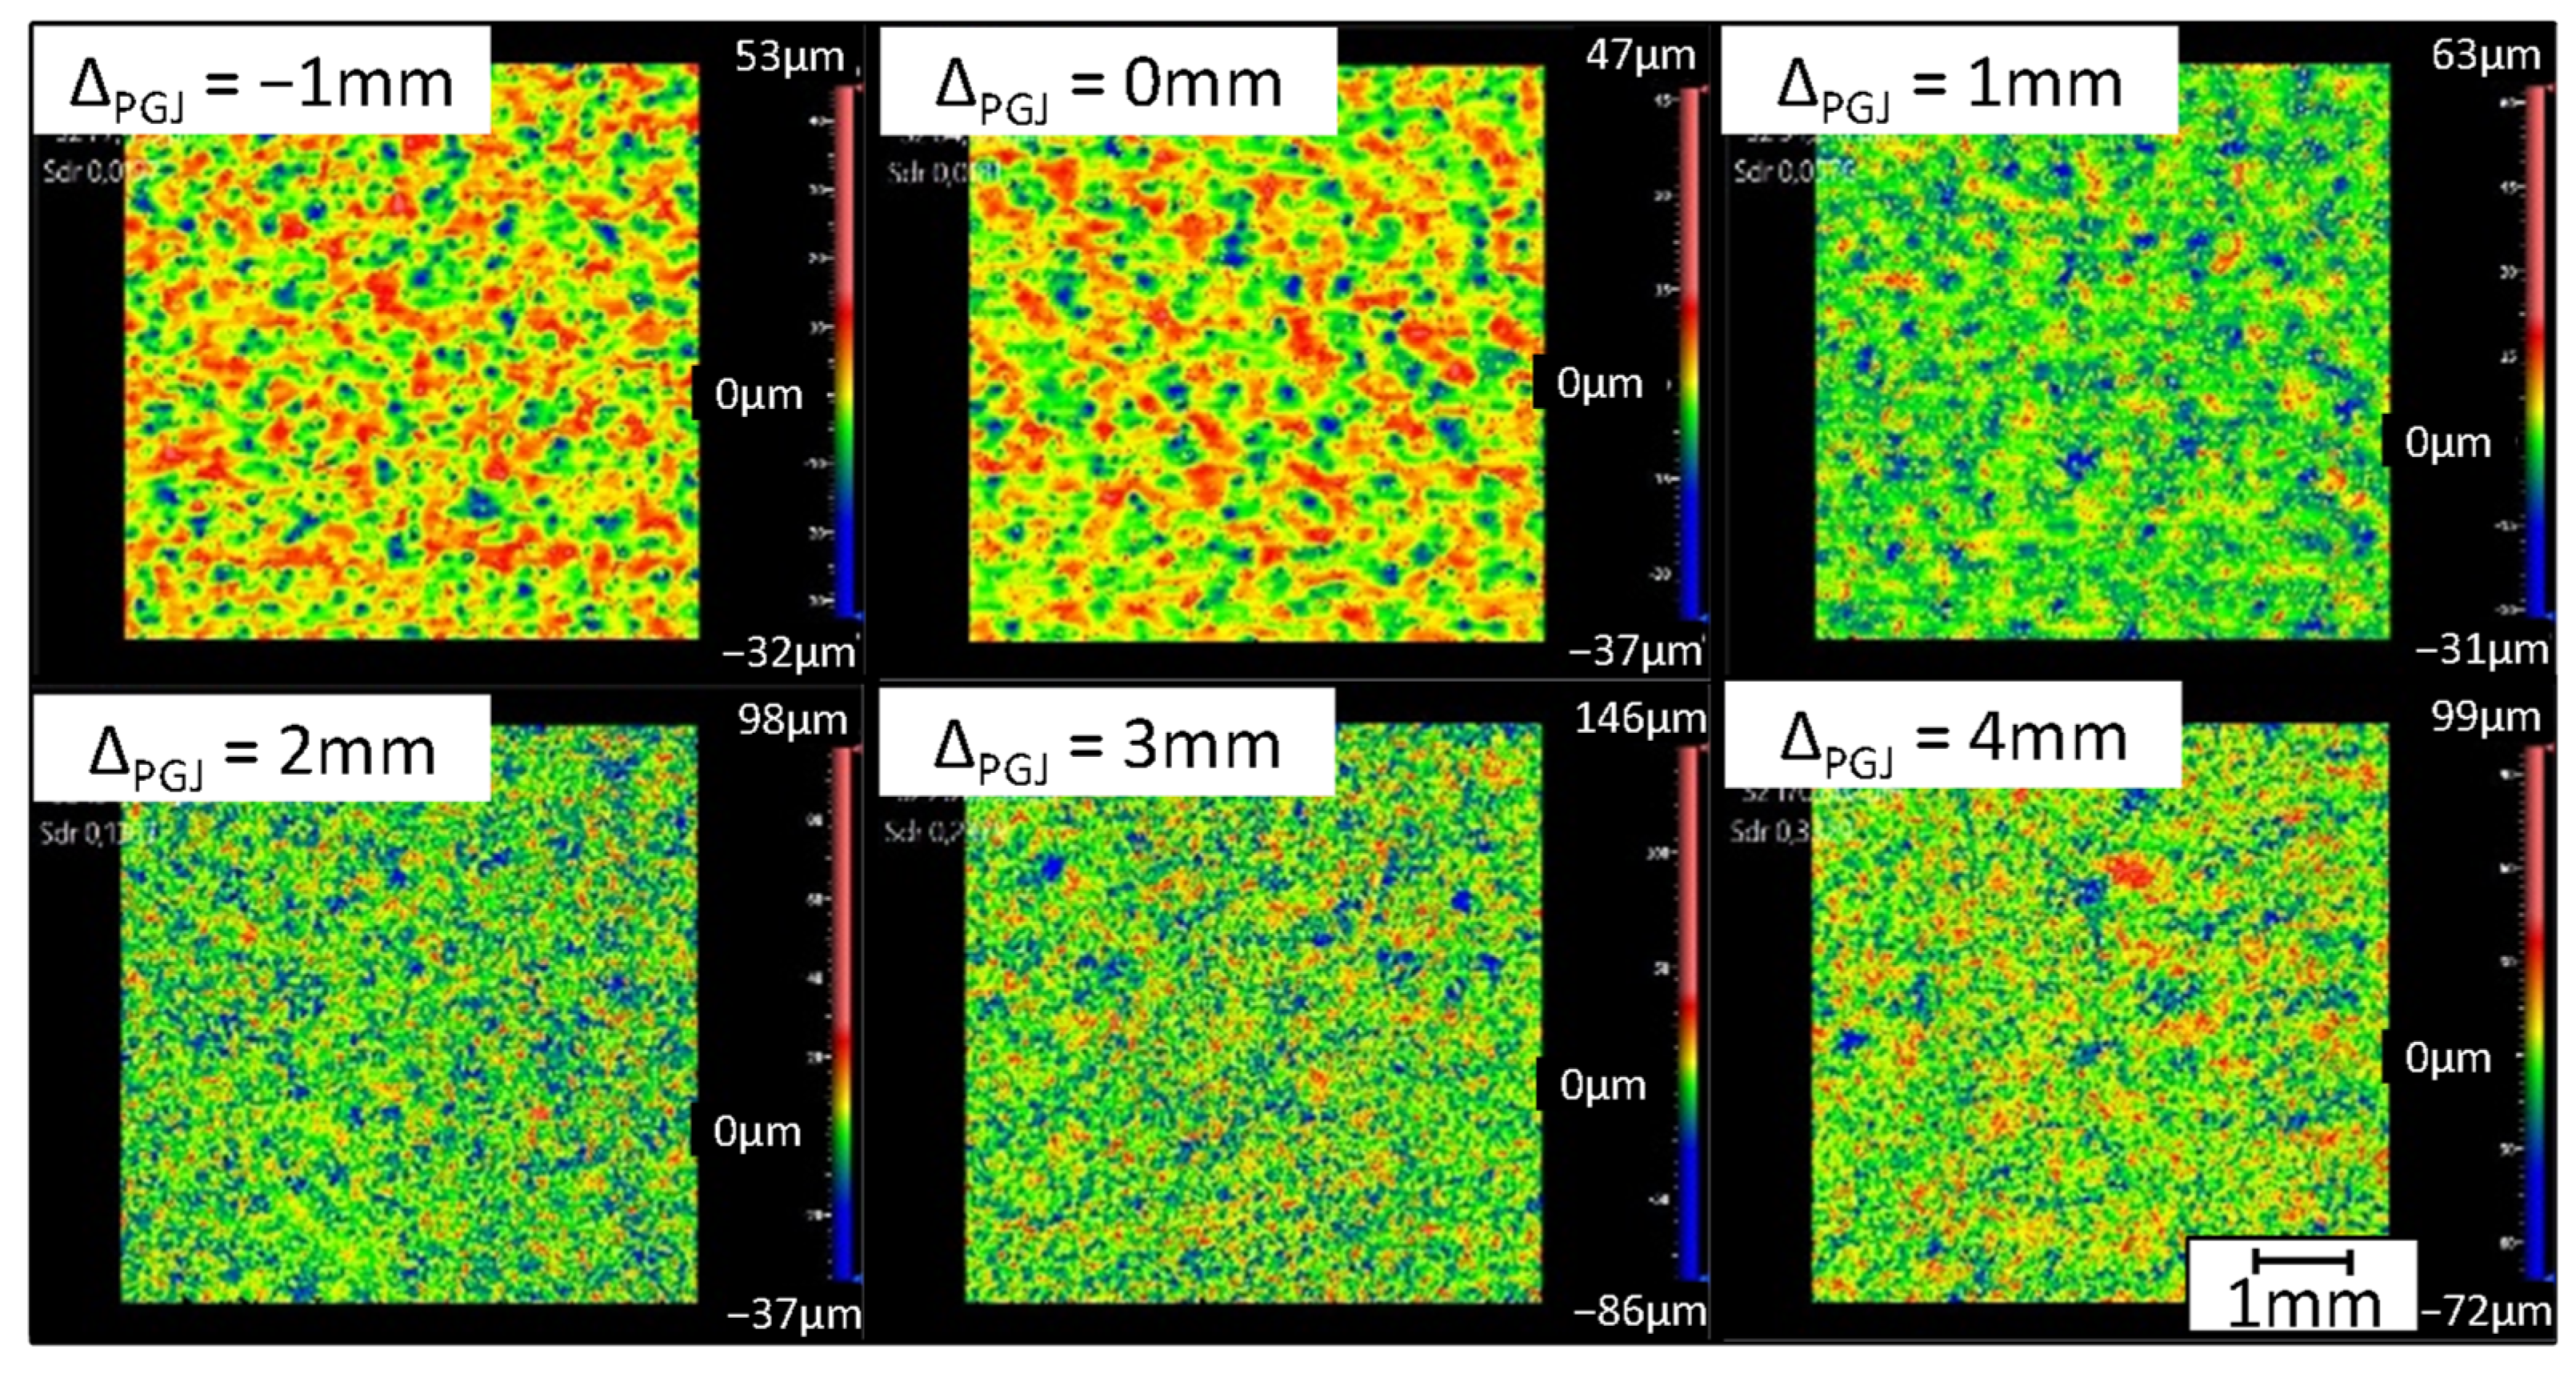
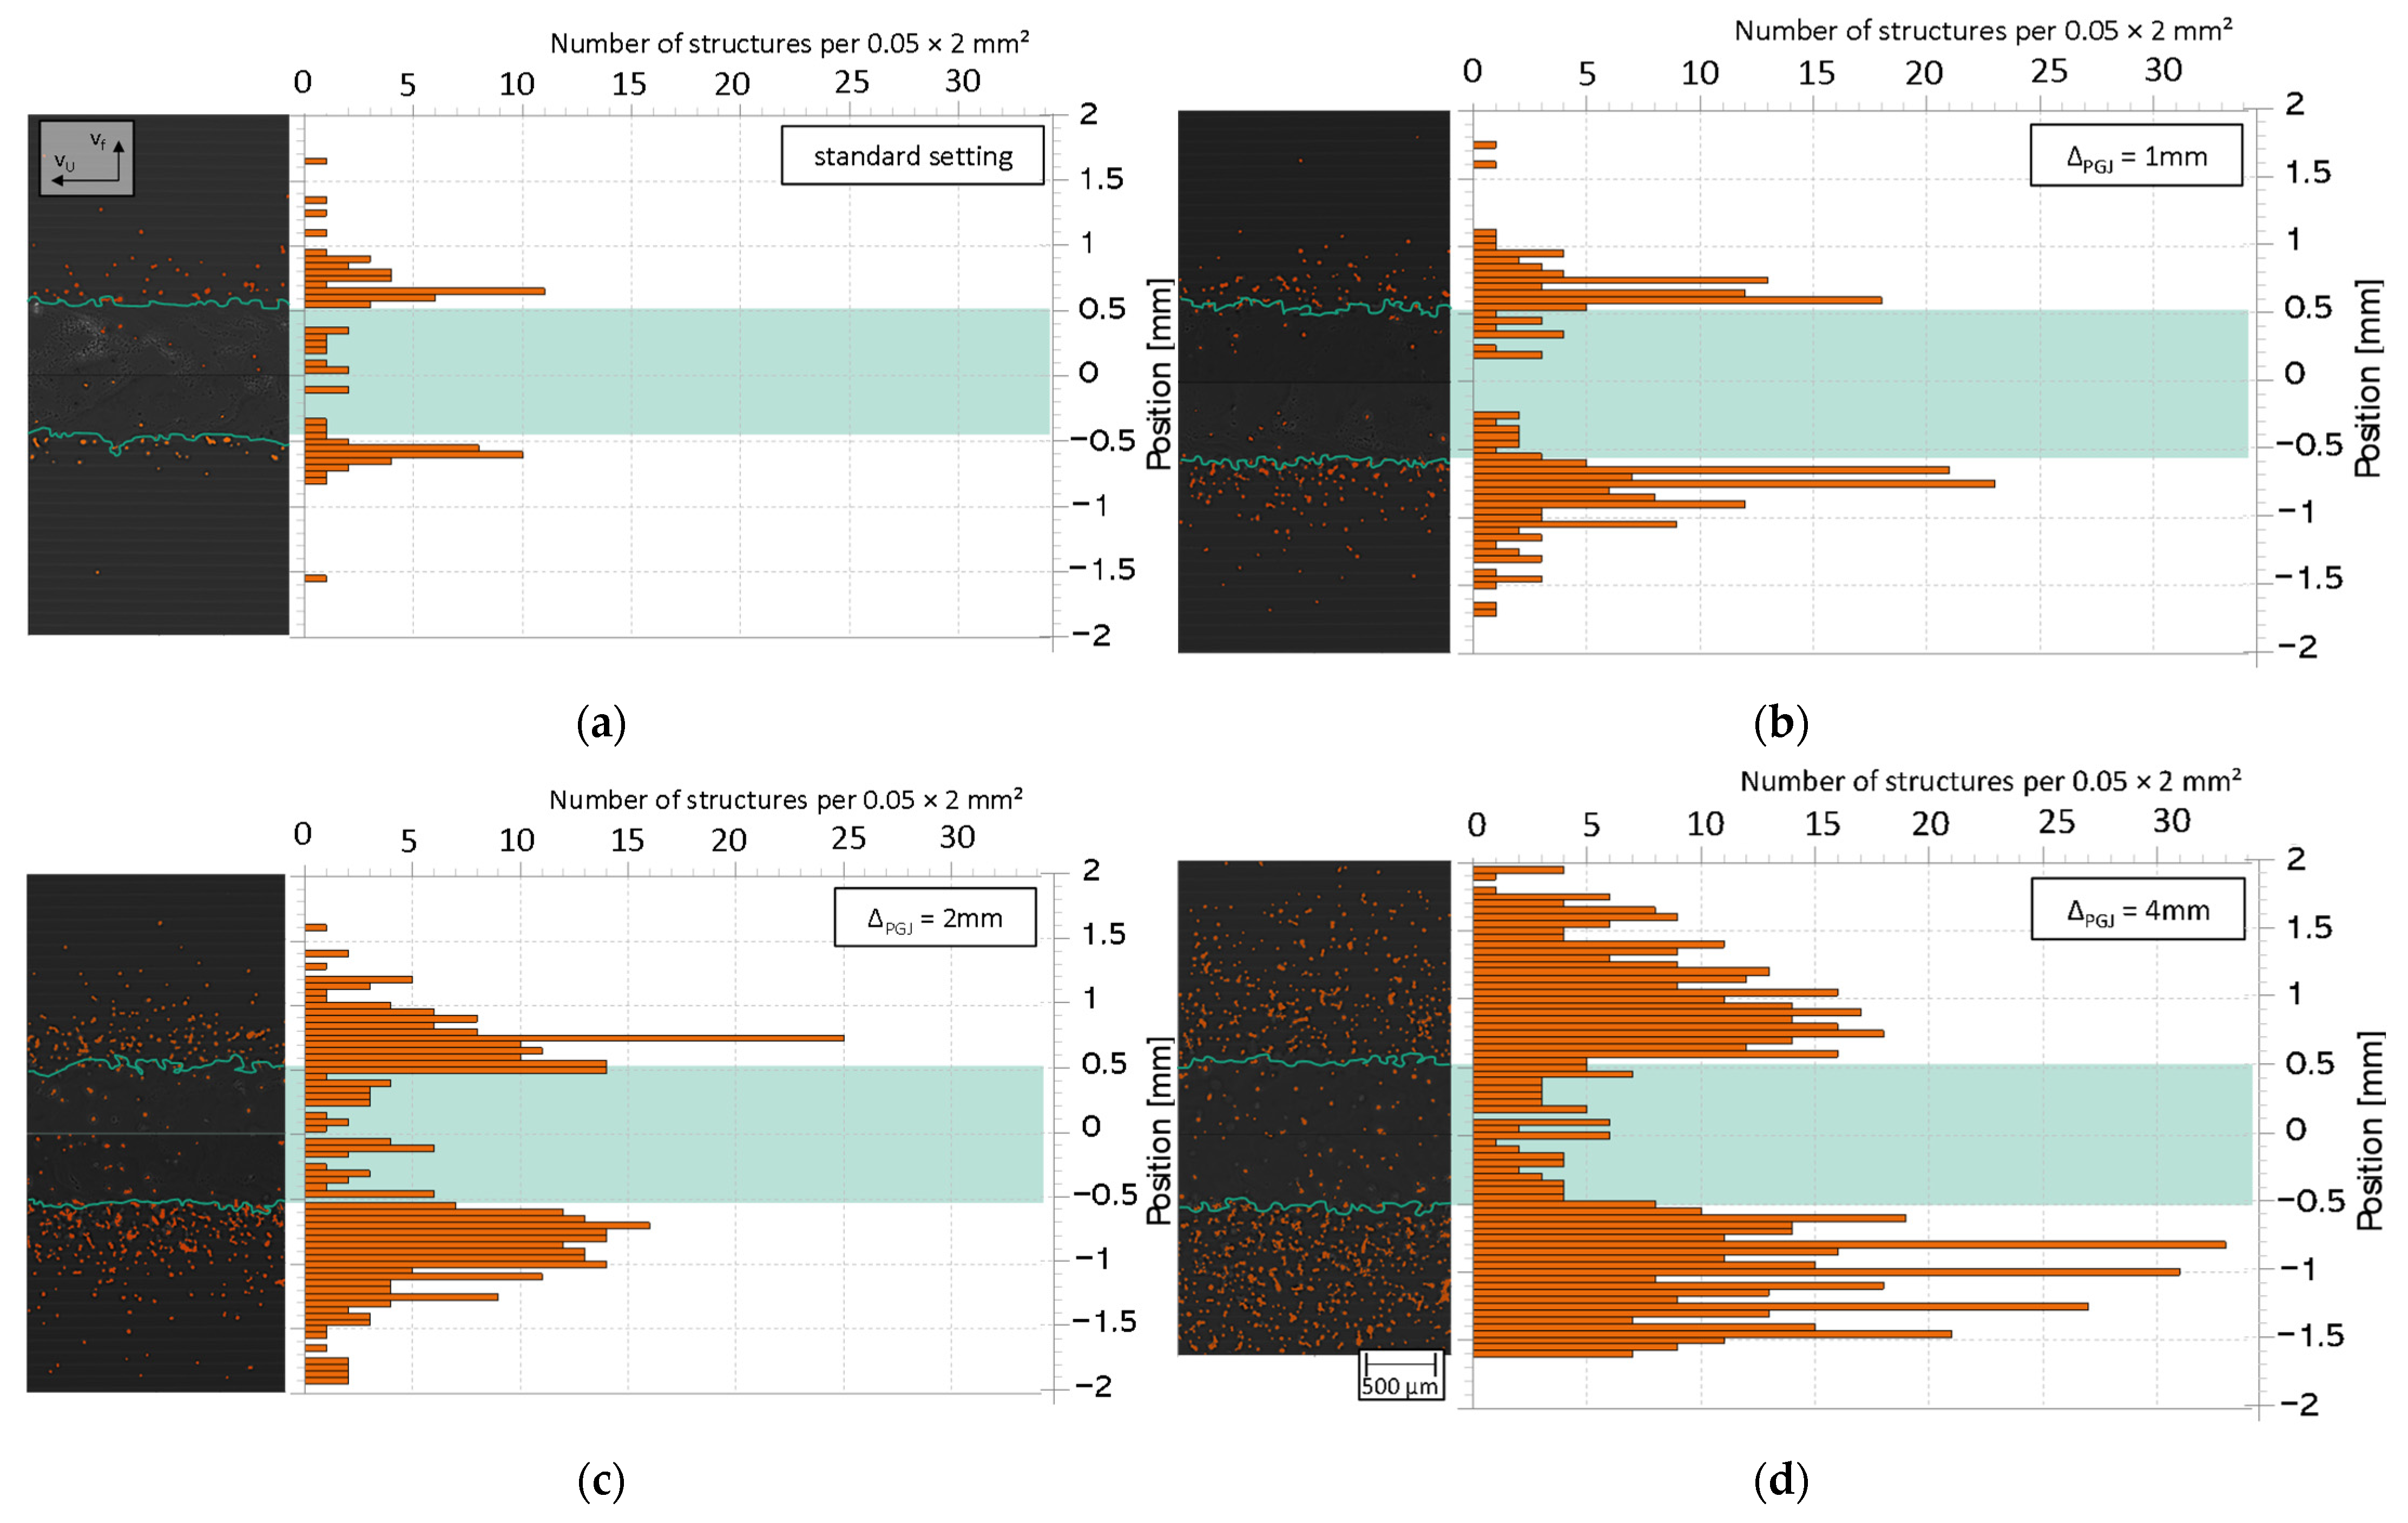
Figure 16 shows the WLI images of the coatings produced with varied axial offsets of the PGJ. At ΔPGJ = −1 mm, the focus is approximately on the substrate surface. At this axial offset, the structure of the surface is comparable to that at the standard setting (ΔPGJ = 0 mm). Thus, at ΔPGJ = −1 mm, the characteristic values are Sa = 6.3 µm, Sdr = 2.7%, and a particle number of 54 per mm2, comparable to those at ΔPGJ = 0 mm, with values of Sa = 6.1 µm, Sdr = 2.4% and a particle number of 61 per mm2. The average roughness depth is larger for ΔPGJ = −1 mm with Sz = 169 µm than for ΔPGJ = 0 mm with Sz = 110.4 µm.
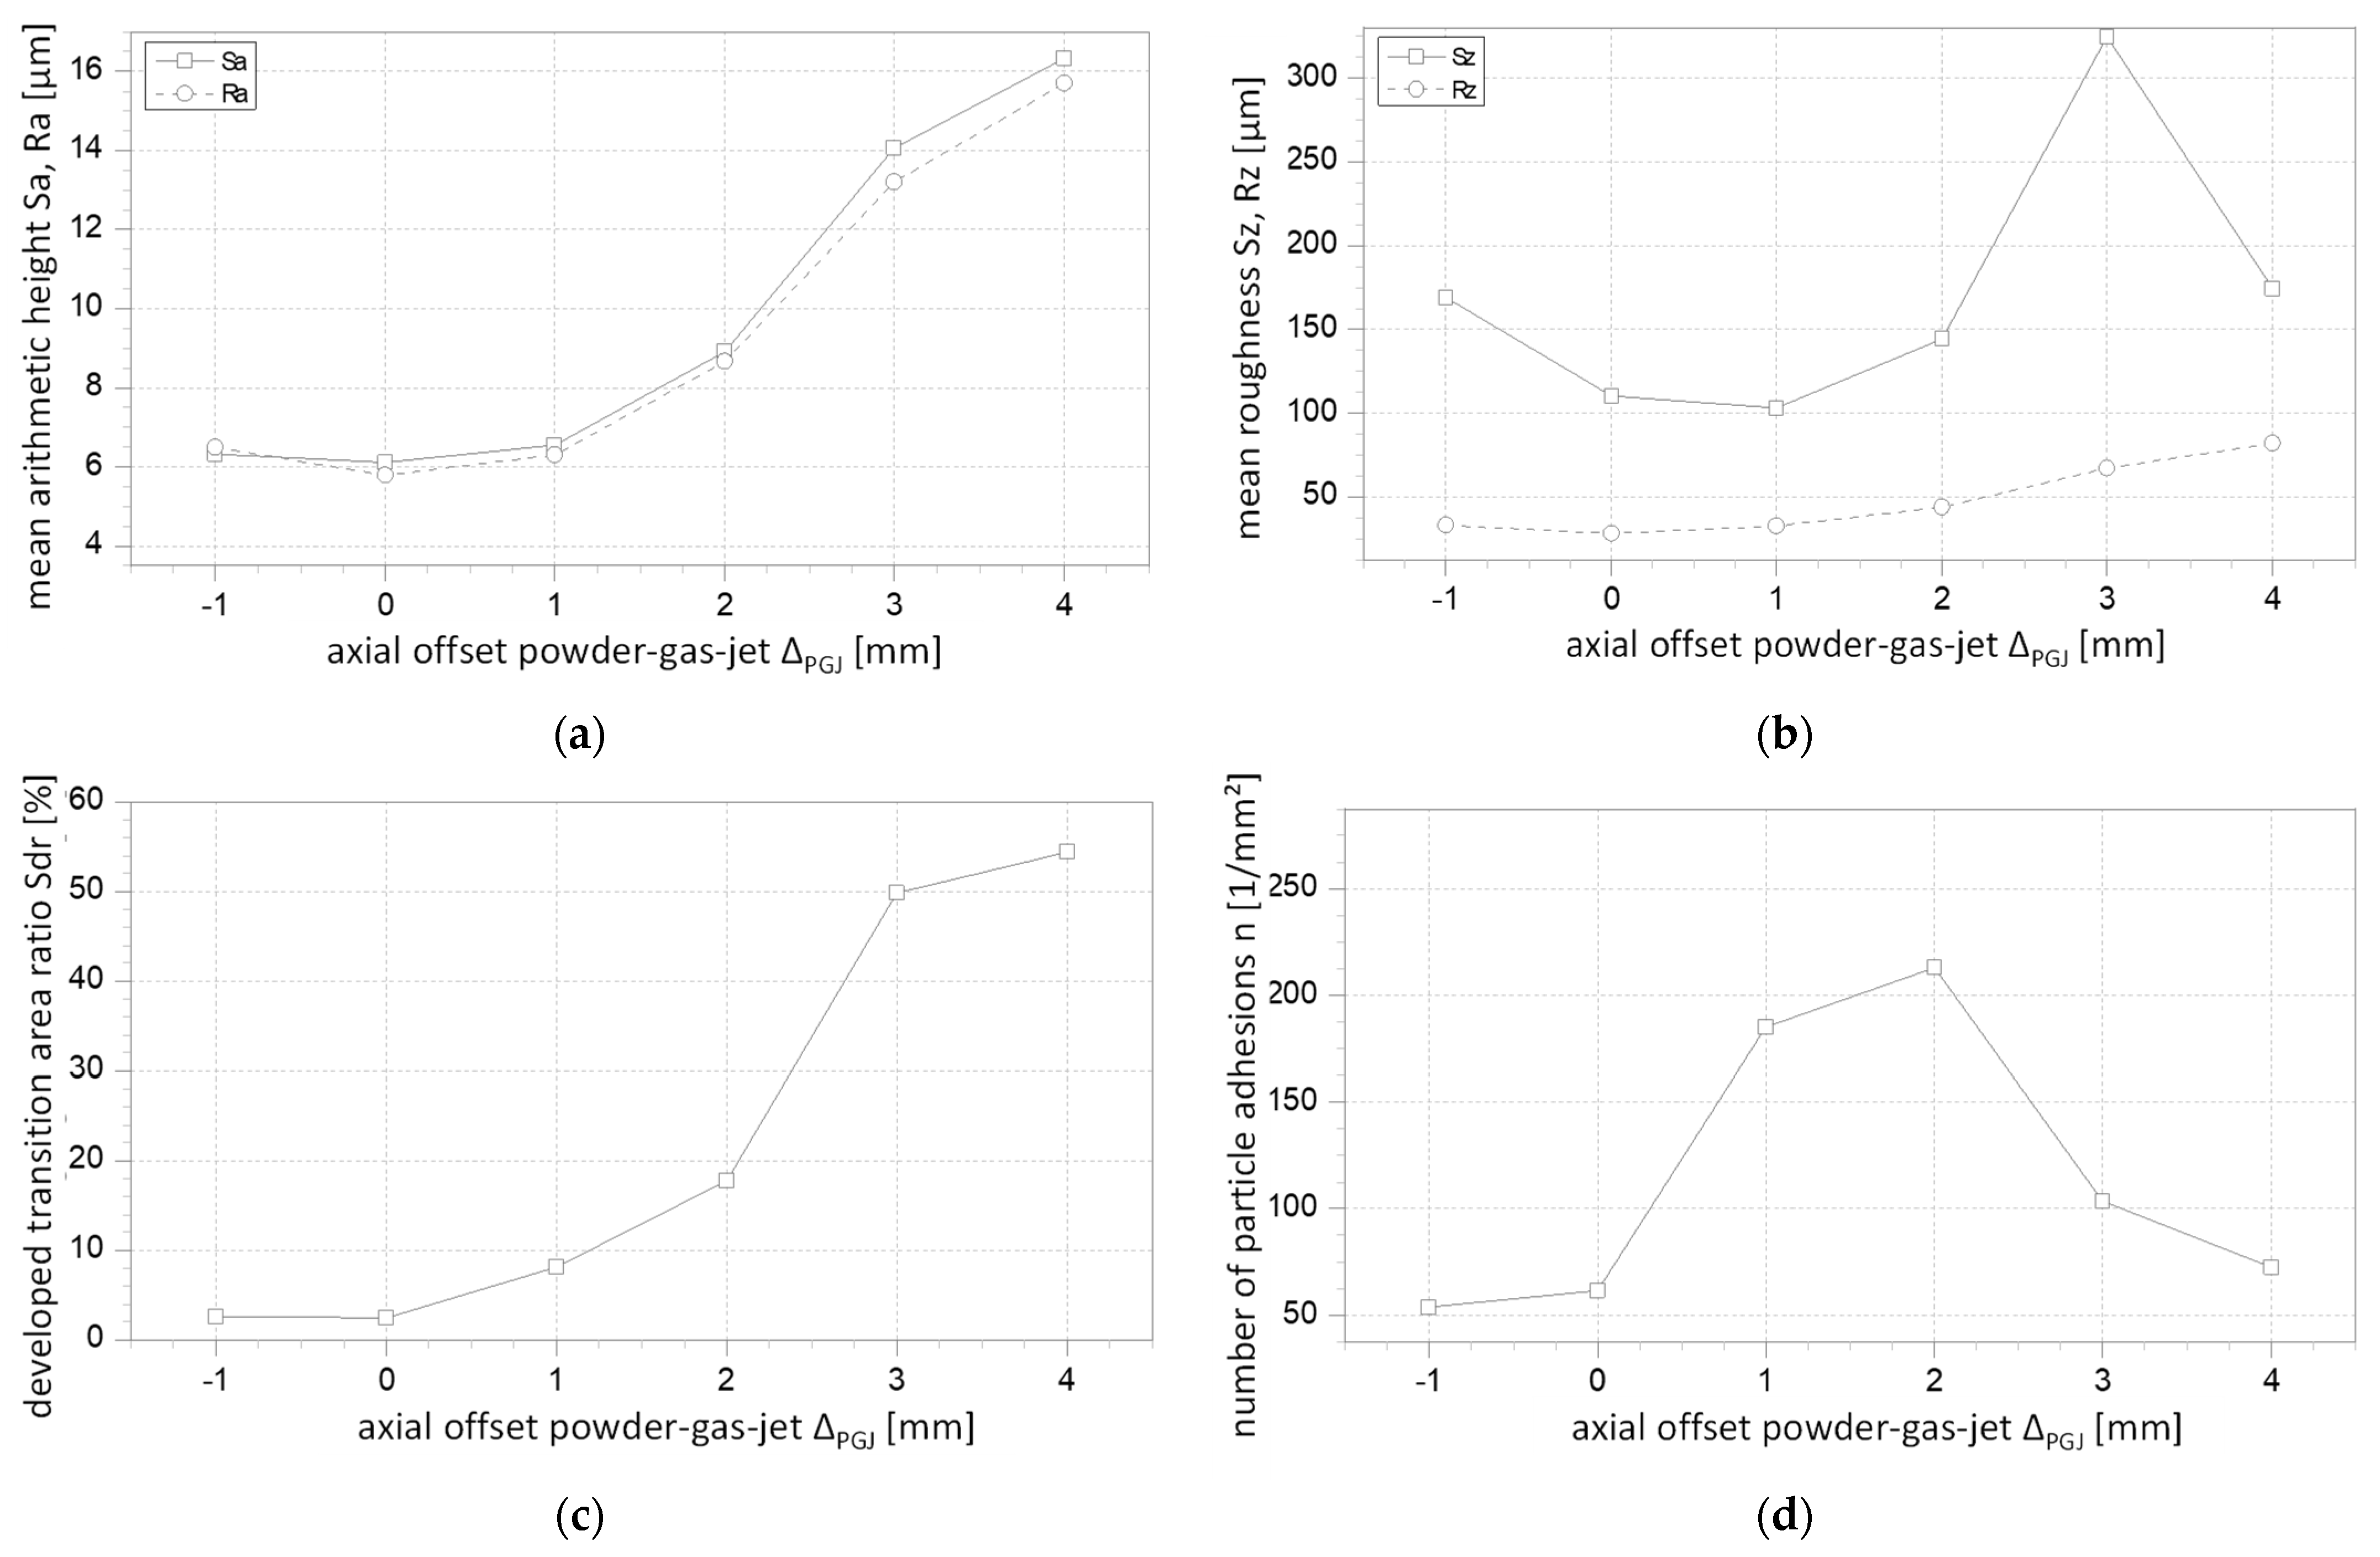
With a positive axial offset, the WLI images show that finer structures increasingly appear on the surfaces. These fine structures cause the roughness values of Sa = 16.3 µm and Sz = 174.5 µm at ΔPGJ = 4 mm (Figure 17). In addition, these structures enlarge the real surface area, causing the developed transition area ratio to increase to Sdr = 54.4% at ΔPGJ = 4 mm. The investigations regarding particle adhesions suggest that these fine structures are caused by adherent particles. The number of particle adhesions is already 185 per mm2 at ΔPGJ = 1 mm. From ΔPGJ = 2 mm, the particle density on the coating surface is so high that individual particles can often no longer be resolved separately using the method described above, and the number of particles on the coating therefore increases only slightly to 213 per mm2. This effect is amplified with a further positive offset ΔPGJ. In addition, since the particles are often deposited so close together or even one above the other, they merge more and more into agglomerates. Thus, the determined number of particles decreases.
The fact that the PGJ focus in the present investigations is shifted in a range that lies within the Rayleigh length of the laser beam leads to the assumption that the energy input into the powder particles is still sufficient to melt the majority of the particles on their way to the substrate. However, due to positive ΔPGJ, the PGJ spot on the surface becomes larger, so that an increased number of molten particles outside the weld pool hit the surface. This overspray can cause molten particles that impinge, perhaps on a sufficiently preheated substrate or coating surface, to fuse with it [17]. This is well visible on the single tracks (Figure 18). With greater ΔPGJ, the particle adhesion increases on the single track and on both sides next to it. No significant differences in the form of the track edges can be seen over the investigated offset range, which indicates a continuously existing weld pool, so a sufficiently high energy input in the substrate and thus homogeneously enclosed coatings are to be assumed.
Since the overspray increases with the positive offset, the width of the particle distribution increases on the one hand, and the total number of particles deposited on the surface per run increases on the other. This means that more particles are deposited on an already coated area by the following run, but also that the number of following runs in which particles are deposited at this area increases with the offset ΔPGJ, which is the reason for the strong increase in particle adhesion and fine structures and thus in the parameters Sa, Sz, and Sdr.

3.3. Lateral Offset of the Powder–Gas Jet φPGJ

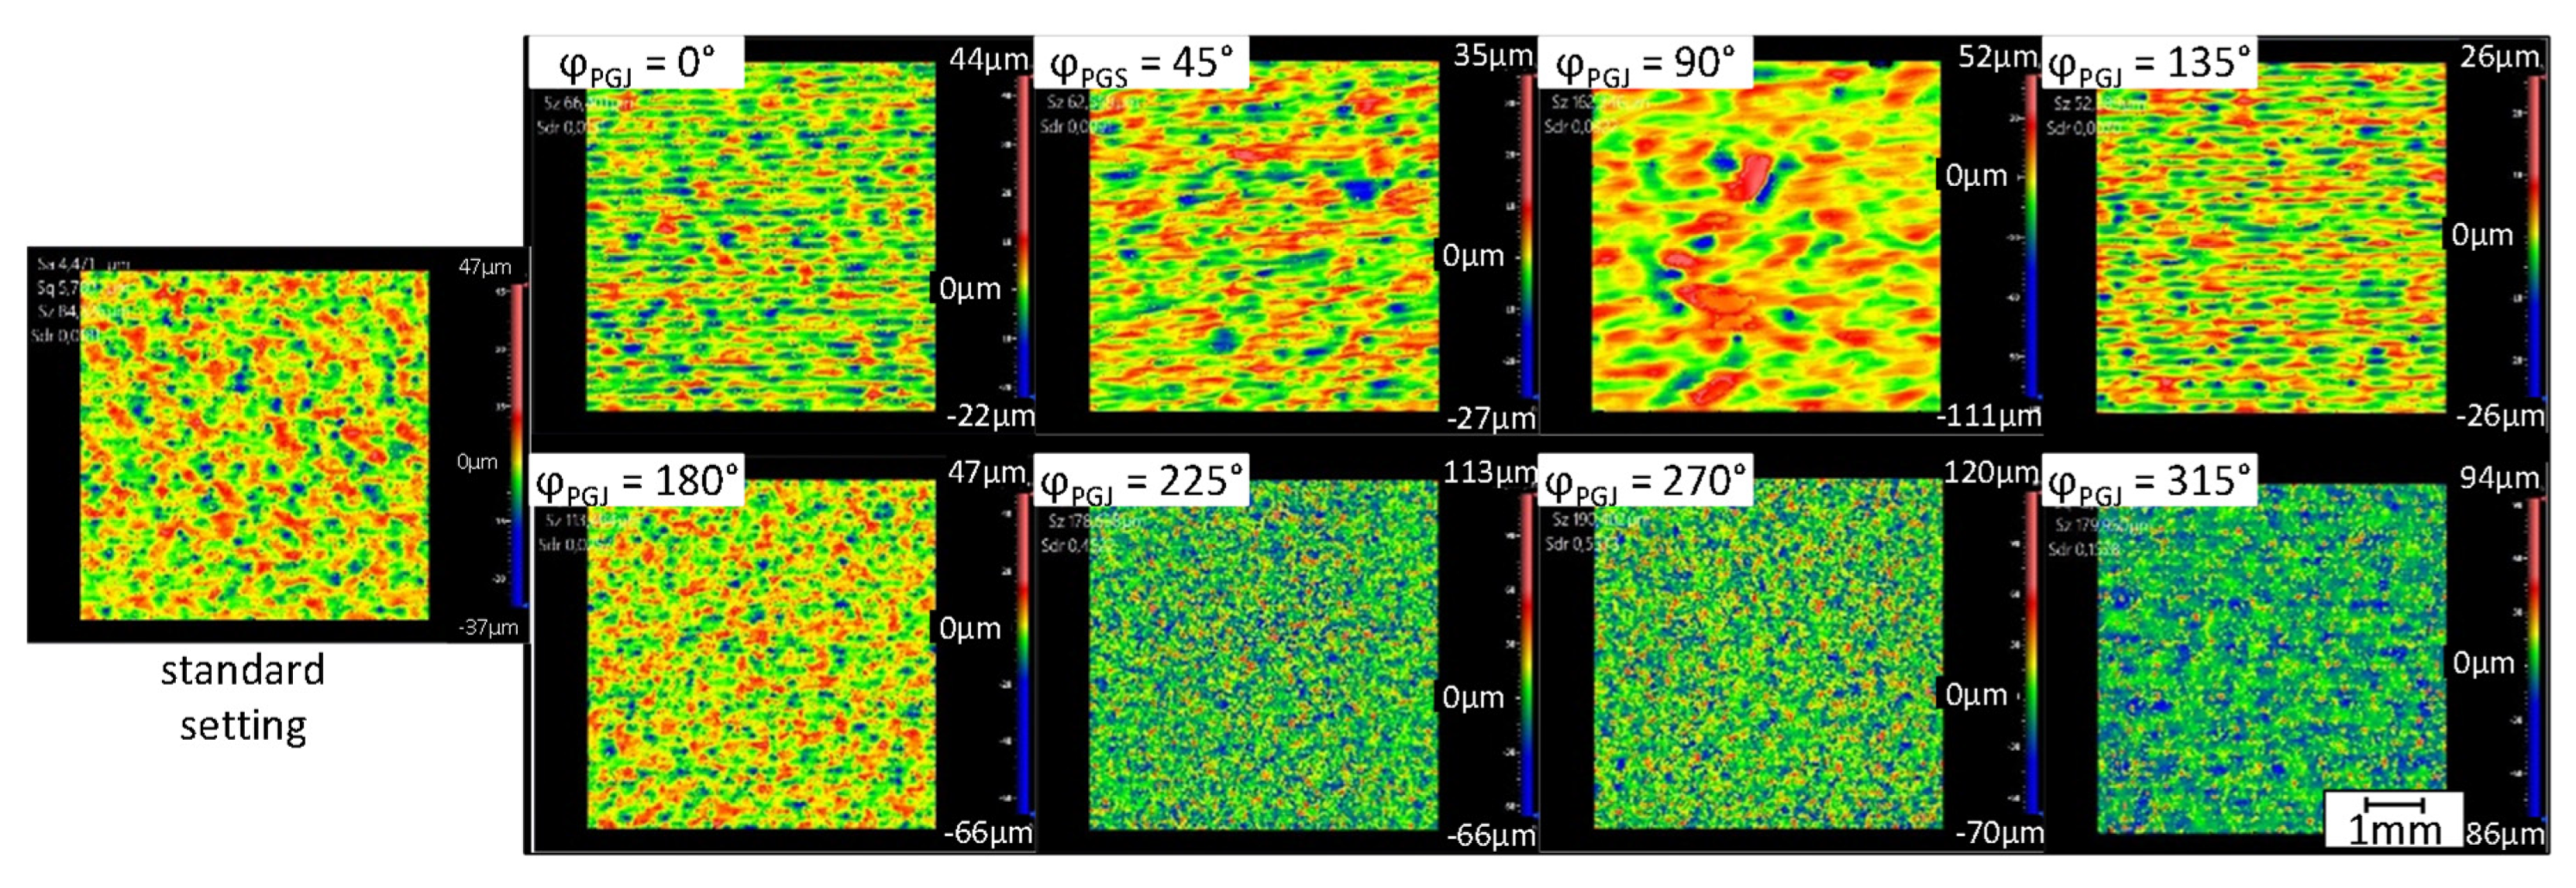
Since the lateral offsets lead to very different surface textures (Figure 19), which are caused by different mechanisms, the lateral offsets investigated are evaluated individually. For this purpose, the WLI images of the coatings and the single tracks, the determined parameters, as well as the high-speed images, are considered.
With an offset of φPGJ = 0°, compared to the standard setting (rPGJ = 0 mm), coatings with smaller overlapping structures result, which have an orientation in the scanning direction (Figure 19). With φPGJ = 0°, the PGJ spot lies in front of the laser spot (see 
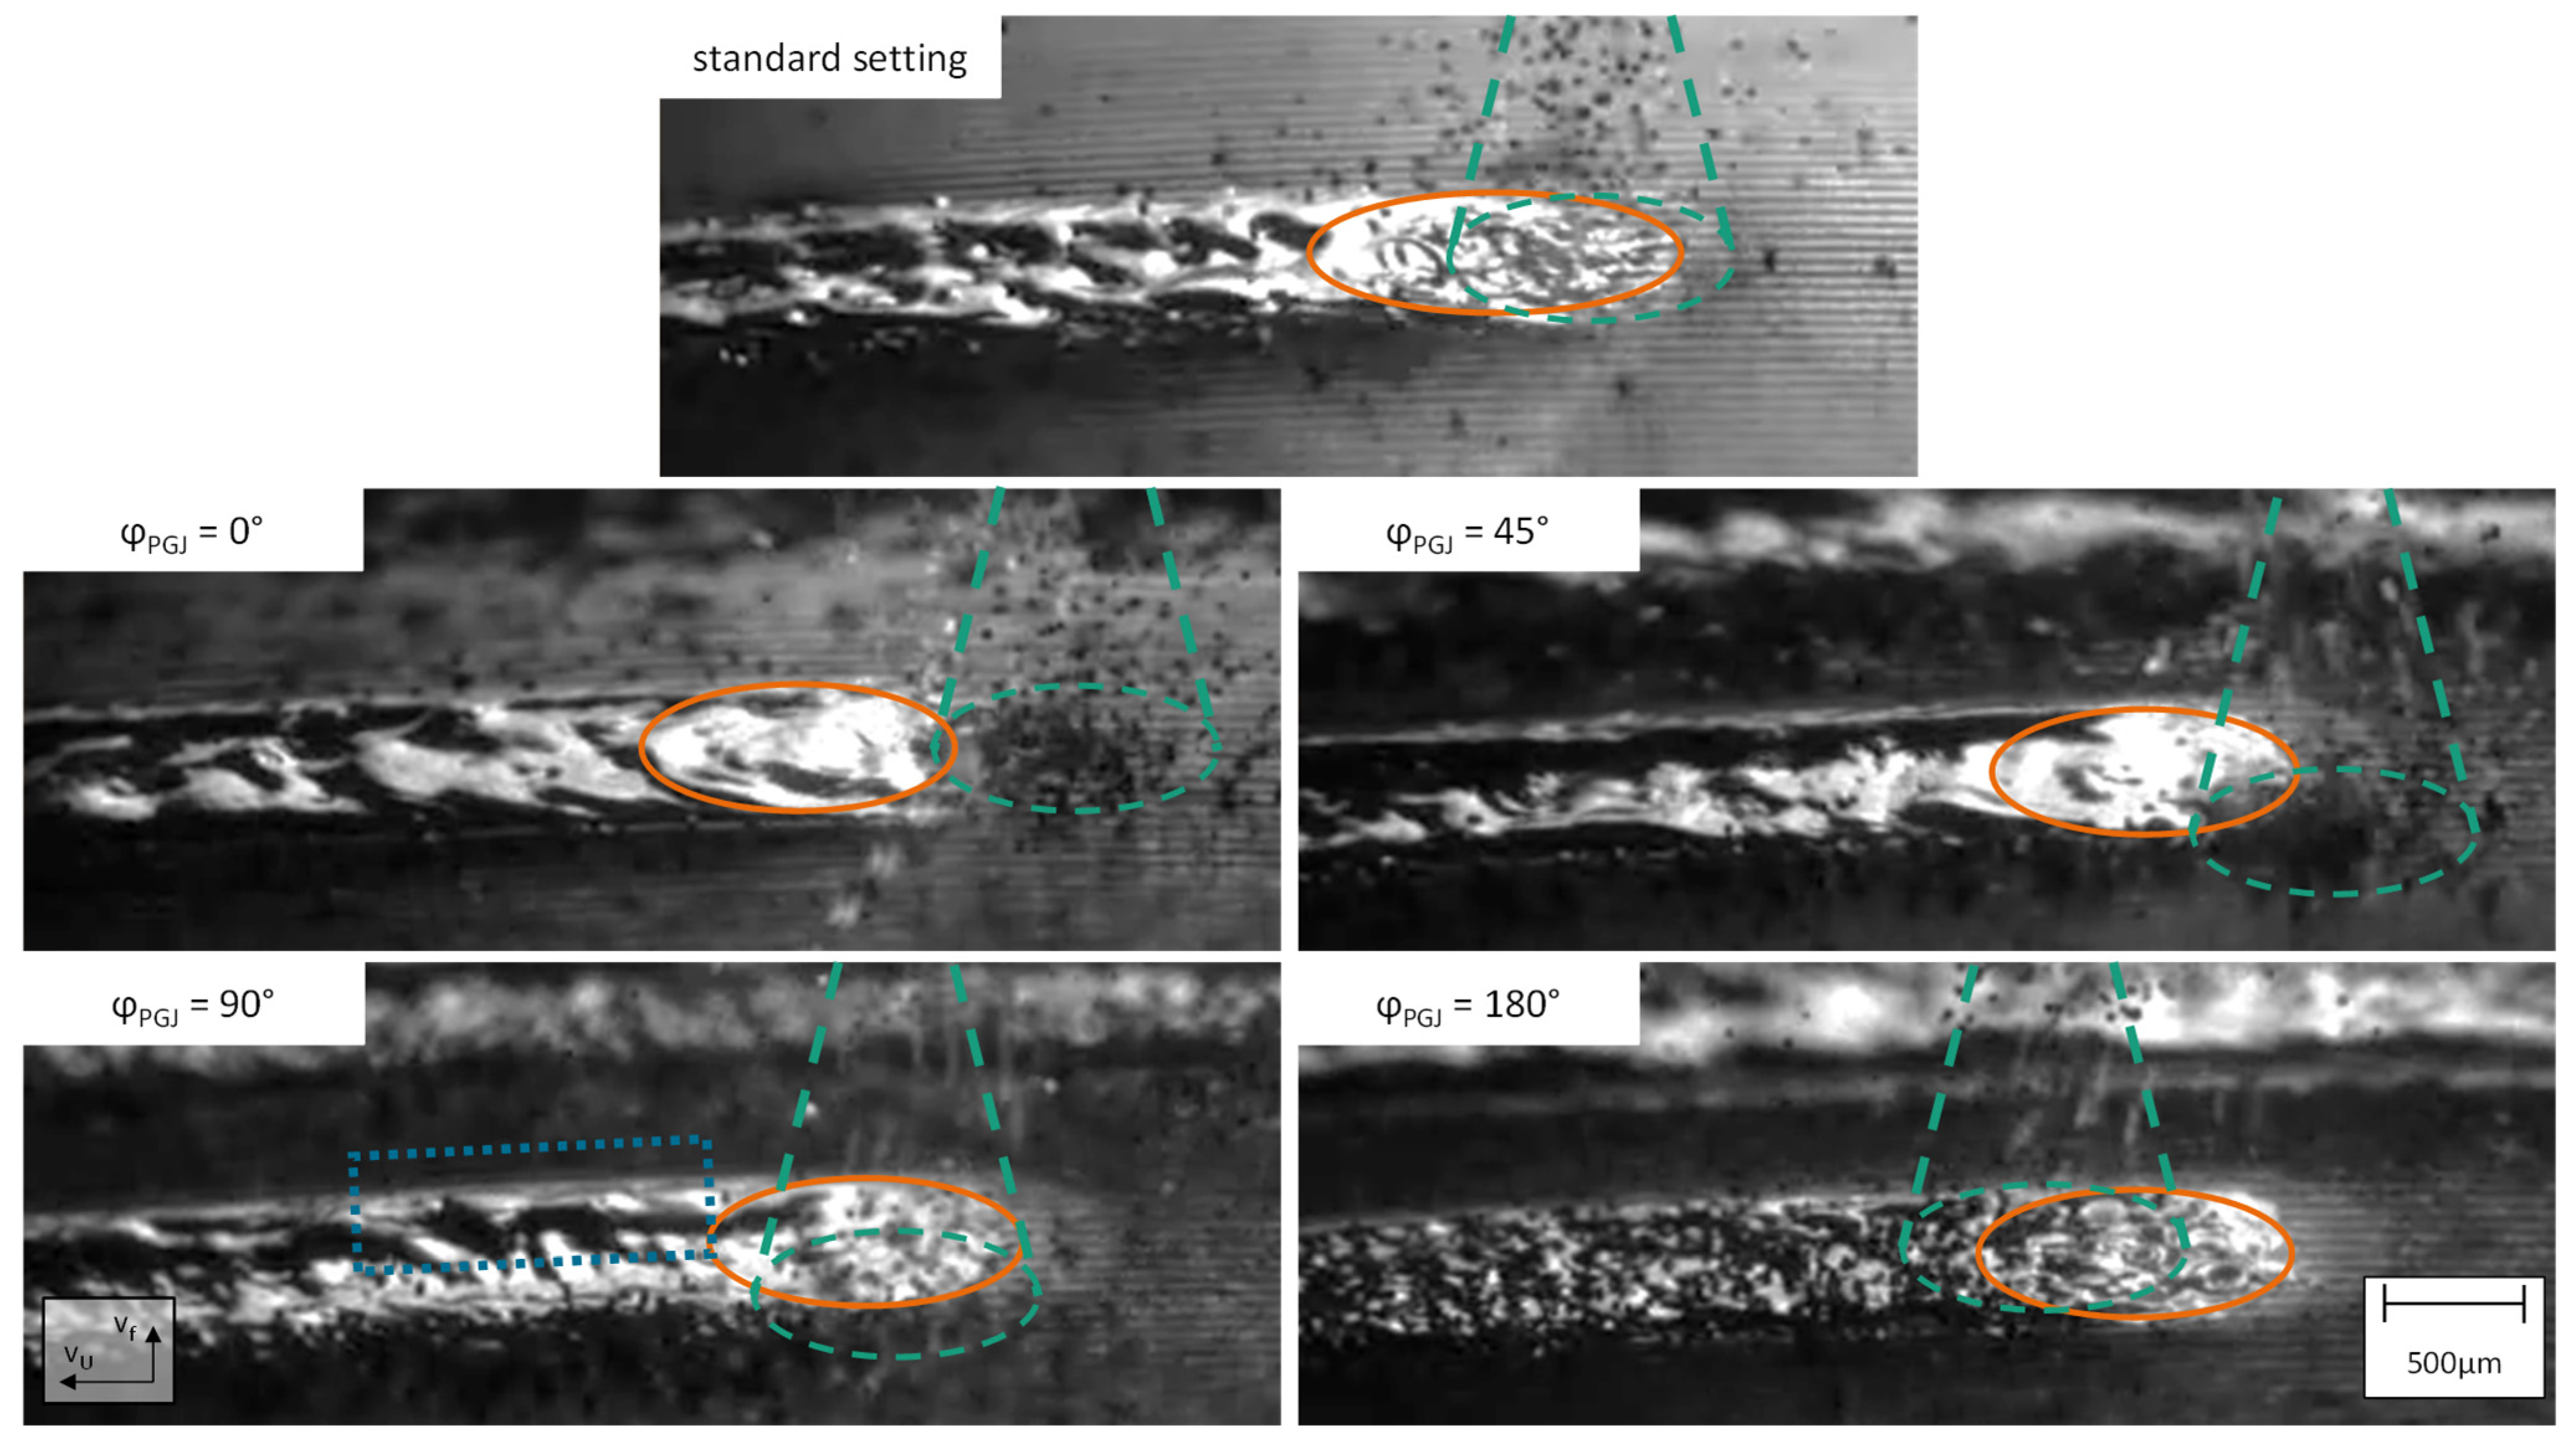
Figure 7). Thus, less powder enters the weld pool directly; rather, the powder is first deposited in front of the weld pool and then absorbed by the weld pool when moving over it. Since the powder is not fed directly into the weld pool, fewer waves are induced in it than with the standard setting (Figure 20).
With the standard setting, structures develop out of the waves when the weld pool solidifies, which is less prominent with φPGJ = 0° due to the smoother weld pool. So, the structures are less pronounced laterally and merely expand in the scanning direction. Due to the following weld pool, almost no further particles are deposited behind it (
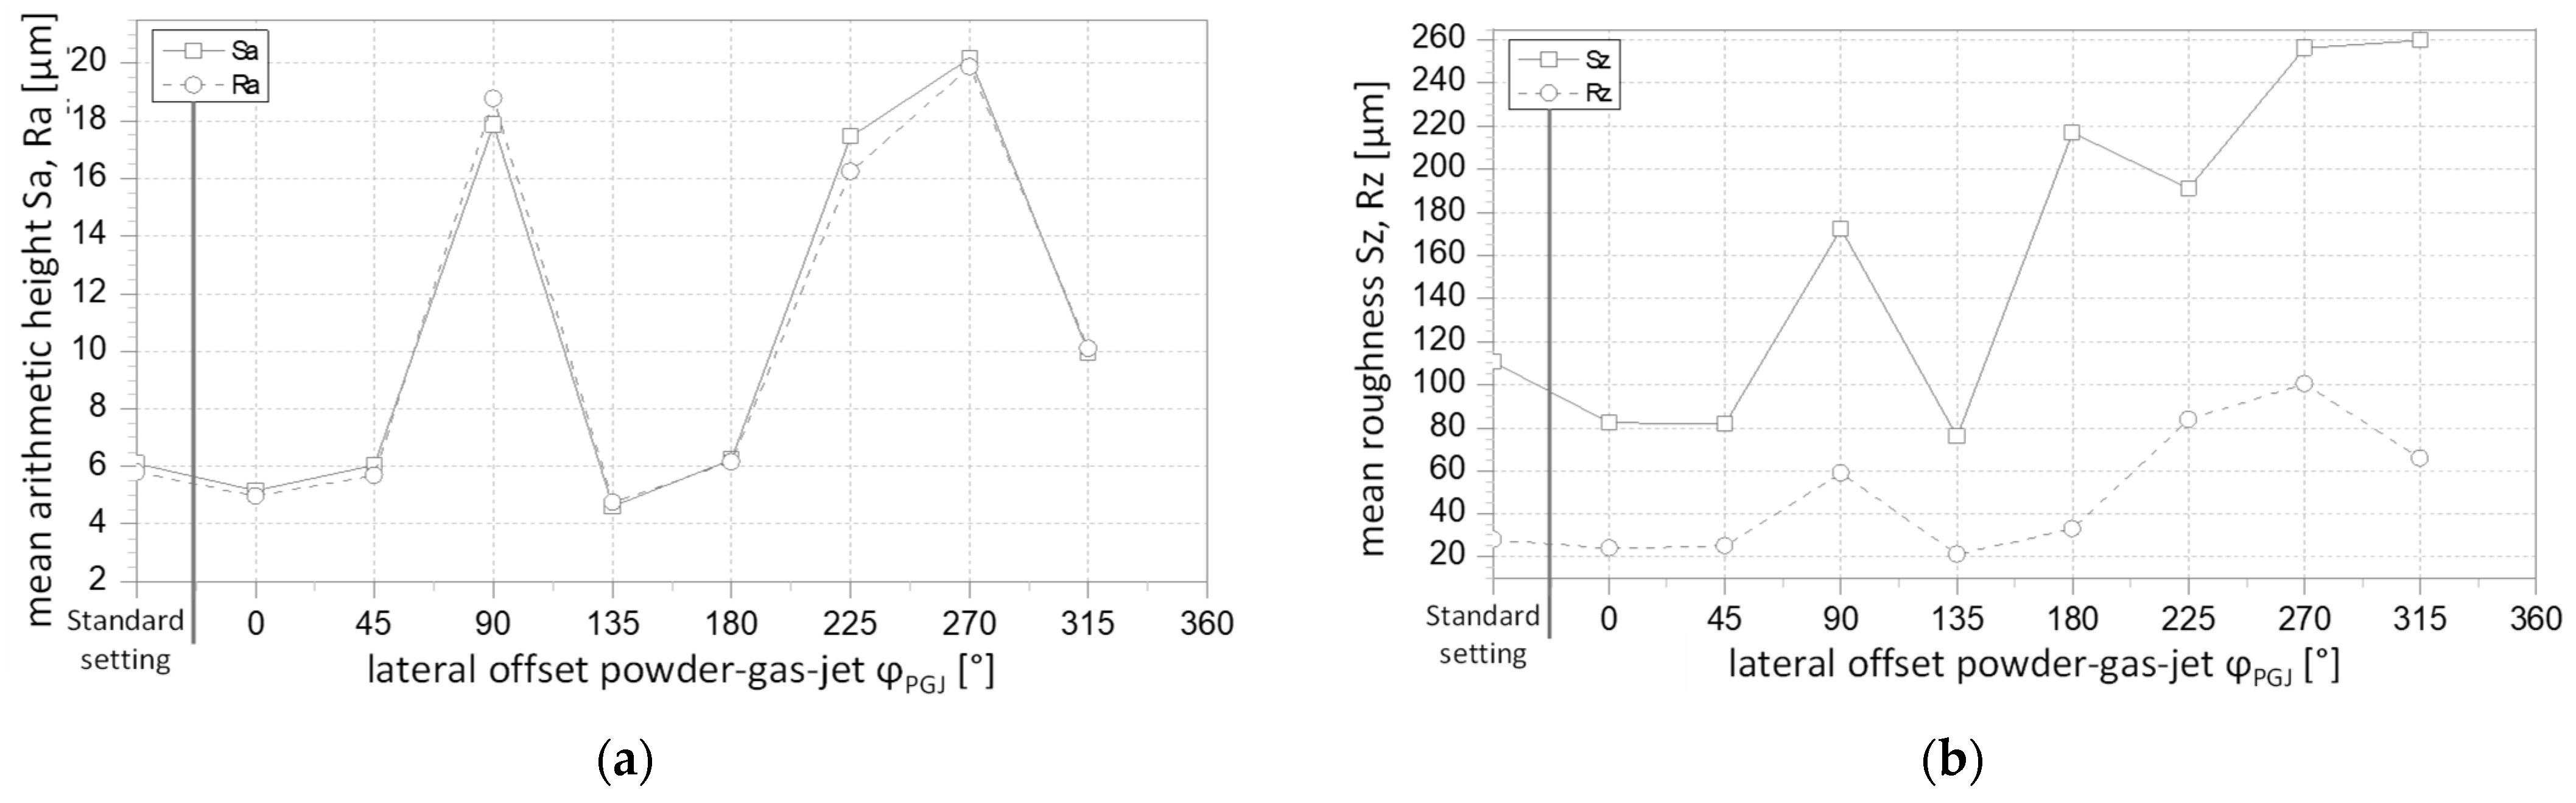
Figure 21a), and the surface is smoothed by the laser beam. In addition, fewer particles adhere on the left side next to the single track because the particles hitting the substrate’s surface there do not pass the laser beam anymore and thus are not heated up enough to adhere. Thus, all investigated parameters at φPGJ = 0° are reduced to Sa = 5.2 µm, Sz = 82.3 µm, Sdr = 1.8%, and the number of particle adhesions to 43 per mm2 (Figure 22).
At φPGJ = 45°, structures with an orientation in the direction of vU appear again, whereby these structures are larger and partially spread over several tracks (Figure 19). The PGJ is in front of the laser beam, whereby the PGJ also lies to the right of the laser beam. Due to this relative positioning, the number of particles adhering to the single tracks is relatively small due to the following laser beam as described for φPGJ = 0° (Figure 21b). Additionally, since the PGJ is located to the right of the laser beam, many particles adhere to the right side, and fewer melted particles reach the area to the left of the track. However, the particle adhesions on the right side do not contribute directly to the surface condition since these are re-melted during the next run. The low particle number on the left side leads to a reduction in the particle number to 26 per mm2 on the generated coating. Because fewer particles are deposited directly into the weld pool, which is similar to φPGJ = 0°, the weld pool is relatively smooth (Figure 20). But at φPGJ = 45°, the particles are mainly fed to the weld pool from the side, so that they induce a wave and thus a material transport from the right to the left side of the weld pool. This leads to an accumulation of material on the left side of single tracks (Figure 20). During the coating process, the material is thus transported in the direction of the previous track and can be deposited there. Since the weld pool extends relatively far behind the laser beam and even further behind the PGJ, transported material can partially flow back from the previous track to the center of the now deposited track (Figure 20). This material flow could result in structures at the left edge of a single track, which could also spread over several track offsets due to the material returning to the weld pool. The combination of few particle attachments and the formation of (comparatively long-wavelength) structures due to a modified weld pool flow, leads to values of Sa = 6.1 µm, Sz = 81.6 µm, and Sdr = 1.2% at φPGJ = 45° (Figure 22).
With a further shift to φPGJ = 90°, the resulting overlapping structures on the surface become even larger, so that they now extend over several single tracks (Figure 19). These structures again have an orientation in the scanning direction. Since the PGJ is located to the right of the laser beam with respect to the scanning direction, powder is significantly added to the weld pool on this side. As a result, many particles are deposited on this side, too (Figure 21c). Furthermore, adding the powder from the side forms a wave in the weld pool, which forces the material to the opposite, left side of the weld pool (Figure 20). On the one hand, this material transport makes the left edge higher, but on the other hand, it also creates unevenness, which leads to large and deep structures. Due to these structures, the roughness values increase to Sa = 17.9 µm and Sz = 172.3 µm. Since also here relatively few particles adhere to the left side of the track, the particle number of 26 per mm2 remains unchanged compared to φPGJ = 45°. The developed transition area ratio is significantly increased by particle adhesions and less by large, long-wavelength structures, as they occur here, so this value increases to only Sdr = 2.7%.
At φPGJ = 135°, smaller structures with an orientation in the scanning direction appear again, which are comparable to those at φPGJ = 45°. Since very few particles adhere to the left edge as well as to the left of the single track (Figure 22d), the number of particles on the entire surface assumes the smallest value of 19 per mm2 observed for all offsets. The other parameters also assume the smallest values of Sa = 4.6 µm, Sz = 75.9 µm, and Sdr = 0.9%. Thus, the roughness can be reduced by an offset of φPGJ = 135° with respect to the standard setting.
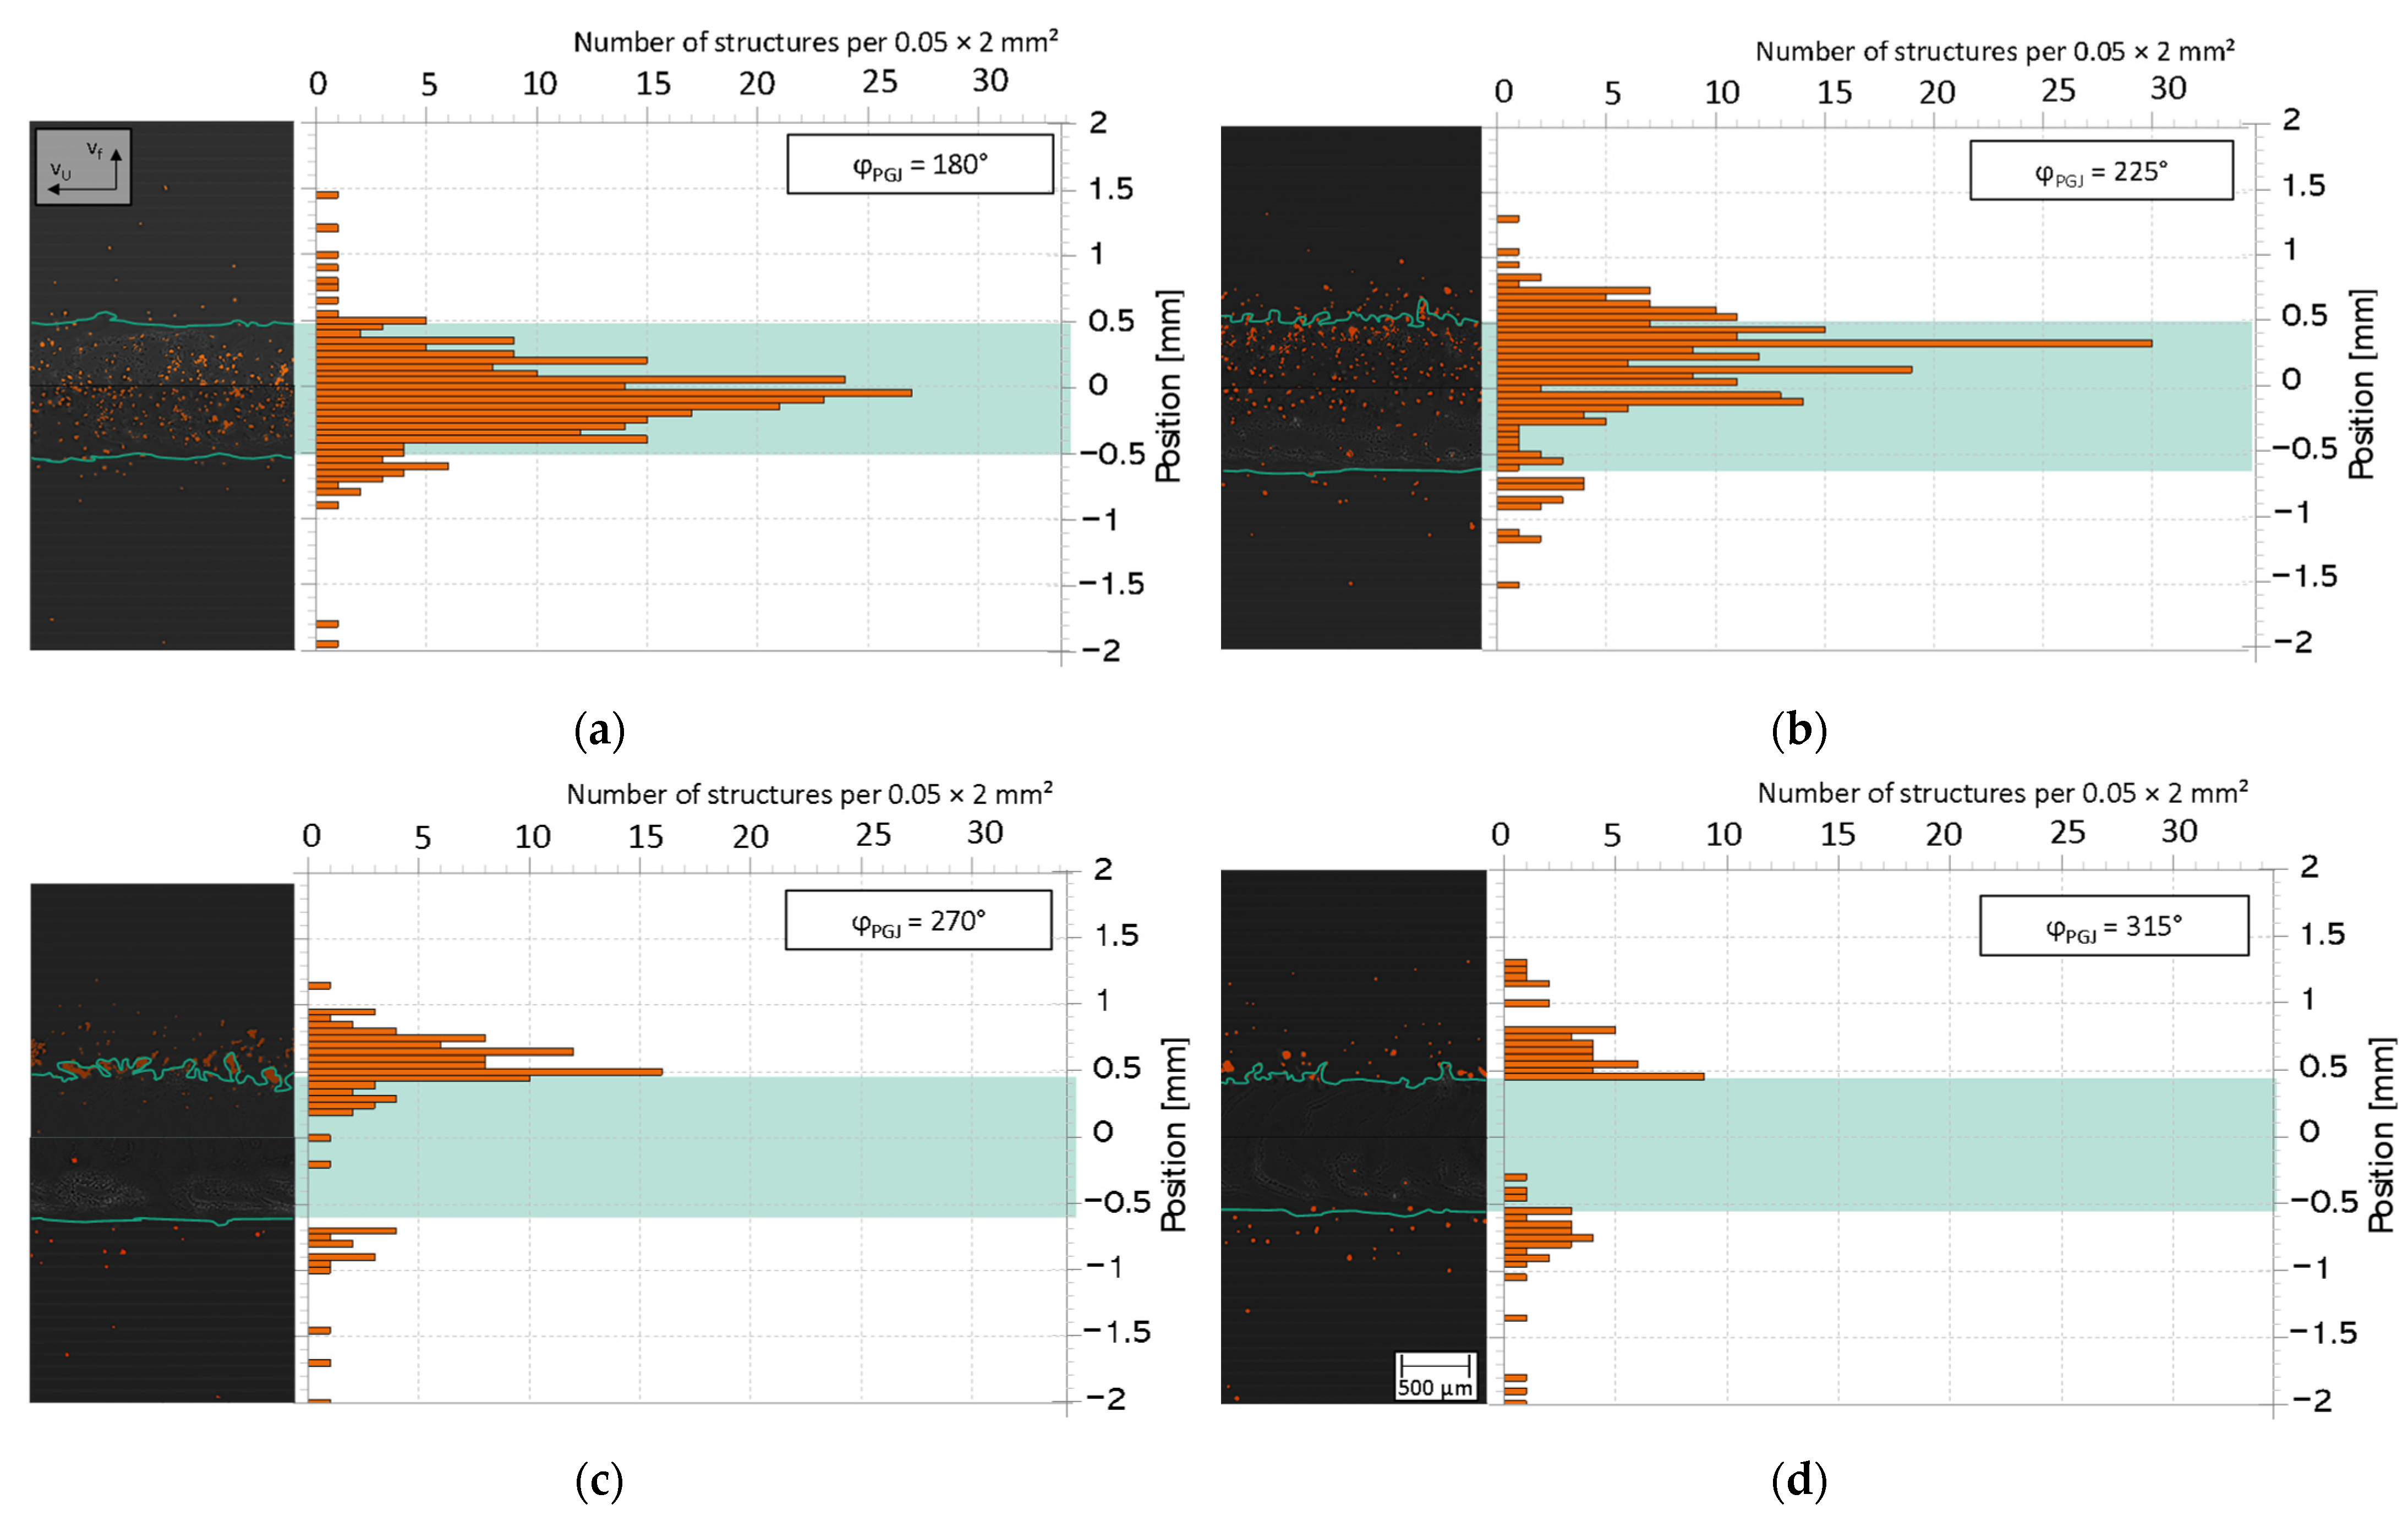
At φPGJ = 180°, the PGJ is located behind the laser beam with respect to the scanning direction. Since the weld pool also extends to an area behind the laser spot, the powder particles impinge on an area in which the weld pool is still present or is cooling down. This results in a very turbulent weld pool with many particles adhering to the surface (Figure 20). These particles are not remelted by further runs, so an increased occurrence of particle adhesion on the single track (Figure 23a) and therefore also on the coating surfaces (103 per mm2) is observed. The structures on the coatings are therefore, again, smaller and without orientation, comparable to the standard setting. Thus, the developed transition area ratio also increases to Sdr = 3.4%. In addition, the roughness values increase to Sa = 6.2 µm and Sz = 217.2 µm.
At φPGJ = 225°, the PGJ is located behind the laser beam and to its left with respect to the scanning direction. For this reason, the particle distribution shifts to the left when looking at the single tracks, so that more particles adhere to the left edge area of the track and to any tracks that are already present but even on the single track itself (Figure 23b). Since the particles on the left edge area are not re-melted during the following run and further particles adhere during the following runs, a particle number on the coatings of 240 per mm2 is determined. However, since the particle density on the surface is so high, particles can form agglomerates, and the surface shows fine structures without orientation. Due to these fine structures, the developed transition area ratio increases rapidly to Sdr = 75.1%. In addition, a further increase in roughness values to Sa = 17.5 µm and Sz = 191.1 µm can be seen.
With a further rotation of the lateral offset to φPGJ = 270°, the PGJ is at the same level but to the left of the laser beam, so that few particles impinge on the right side and the weld pool dominates there. So, the single tracks on the right have few particle adhesions (Figure 23c). The particle distribution of the single tracks thus shifts further to the left, and an increased particle adhesion can be observed both at the left edge of the track and in the area to the left of the track (i.e., on previous tracks). For this reason, the particle density on the coatings increases to such an extent that an increased formation of agglomerates takes place. Therefore, the determined number of particle adhesions on the coating surface decreases again to 225 per mm2. The other parameters, however, increase again slightly due to the fine structures produced, so that with regard to the lateral offsets investigated, the largest values could be determined with Sa = 20.2 µm, Sz = 256.3 µm, and Sdr = 88.5% at φPGJ = 270°.
With φPGJ = 315°, the PGJ is located to the left of the laser beam as with φPGJ = 225°, but this time the PGJ is placed in front of the laser beam. As a result, although the particle distribution to the left of the single track at φPGJ = 315° is comparable to that at φPGJ = 225°, fewer particles are deposited on the edge region of the track this time because the following weld pool absorbs these particles (Figure 23d). Since the number of particles adhering to the single tracks is now so small, the particles adhering to the coatings are virtually only caused by the particles adhering to the left of the single tracks. Thus, the number of particles on the coatings decreases to 175 per mm2. At the same time, the other parameters also decrease to Sa = 10 µm, Sz = 260.1 µm, and Sdr = 22.2%.
In summary, it can be said that the lateral offset φ PGJ influences the interaction between the particle adhesions on and in the area next to the track as well as the material transport in the weld pool. On the one hand, the lateral offset of the PGJ to the left or right side causes increased particle deposition on the respective side, and on the other hand, the lateral addition of powder into the weld pool forces material transport to the opposite side. If the PGJ is placed in front of the laser beam, a smooth weld pool is created, and the surface is smoothed by the laser beam. Therefore, hardly any particles are deposited on the single tracks. If the PGJ is located behind the laser beam, more particles are deposited on the single tracks. The surface properties are influenced by the synthesis of all these effects.

4. Conclusions

Coatings manufactured by high-speed LMD reach a surface roughness of approx. Rz = 50–100 µm, Ra = 11.3–20.5 μm, [7,8,9]. In the present investigations, it has been shown that the surface condition of coatings can be adjusted in a broader range from Sa = 4.6–68.8 µm (Ra = 4.6–67 µm) and Sz = 75–483 µm (Rz = 18–232 µm) by shifting the relative position of the powder–gas jet, laser beam, and component surface. A specific near-net shape of the coated component in terms of mean arithmetic height, mean roughness, developed transition area ratio, and number of particle adhesions can be realized with the relative positioning techniques presented in the article. Since different applications demand different surface shape requirements and postprocessing is cost-intensive, targeted processing of surface conditions is desirable. The near-net shape with the aim of achieving a smooth surface can be adjusted in the EHLA process to reduce the postprocessing work, e.g., by turning or grinding for the manufacturing of hydraulic cylinders, brake discs, and journal bearings. Increased surface roughness and the number of particle adhesions lead to a larger surface of the coating, which can be specifically adjusted in the EHLA process, e.g., for the manufacturing of heat exchangers or electrodes for electrolysers [18].
In the investigations, a common and well-established material combination of Inconel 625 as a filler material and construction steel S355 as a base material was used. The measured quality feature is the surface condition. Application-targeted and specific metallographic properties should be investigated accordingly.

Author Contributions

Conceptualization, M.B.; methodology, M.B. and T.S.; validation, M.B., A.G. and C.L.H.; formal analysis, M.B.; investigation, M.B. and T.S.; data curation, T.S.; writing—original draft preparation, M.B., T.S. and A.G.; writing—review and editing, M.B. and T.S.; visualization, M.B. and T.S.; supervision, A.G. and C.L.H.; project administration, M.B. All authors have read and agreed to the published version of the manuscript.

Funding

This research received no external funding.

Institutional Review Board Statement

Not applicable.

Informed Consent Statement

Not applicable.

Data Availability Statement

Not provided.

Conflicts of Interest

The authors declare no conflict of interest.

Appendix A

Table A1. Settings at MX.
ParameterForm RemoveFilterData Fill
Sa, Sz, SdrCylinderFill All Voids
Number of particles on coatingsCylinderFilter Type: Spline
Filter: Band Pass
Type: Gaussian Spline Fixed
Period: 20–53 µm
Fill All Voids
Distribution of adhering structures on single tracksCylinderFilter Type: Spline
Filter: Band Pass
Type: Gaussian Spline Fixed
Period: 20–53 µm
Fill All Voids
Figure A1. Intensity distribution at focal position (a), at the Rayleigh length (b) and at the double Rayleigh length (c).
Coatings 13 00998 g0a1

References

  1. Poprawe, R. Lasertechnik für Die Fertigung: Grundlagen, Perspektiven und Beispiele für den Innovativen Ingenieur; Springer: Berlin/Heidelberg, Germany, 2005. [Google Scholar]
  2. Küppers, W.; Backes, G.; Kittel, J. Extremes Hochgeschwindigkeitslaserauftragsschweißverfahren (Offenlegungsschrift). DE Patent 102011100456A1, 4 May 2011. [Google Scholar]
  3. Gasser, A.; Backes, G. Systemtechnik für das Pulverbasierte Laserauftragschweissen. Themenbroschüre Systemtechnik für das Pulverbasierte Laserauftragschweißen. 2009. Available online: https://www.ilt.fraunhofer.de/de/mediathek/prospekte/themenbroschuere-systemtechnik.html (accessed on 23 April 2023).
  4. Schopphoven, T.; Gasser, A. Fraunhofer-Institut für Lasertechnik ILT; Press Release: Umweltfreundliche Alternative zum Verbotenen Hartverchromen Mit Chrom(VI). Available online: https://www.ilt.fraunhofer.de/de/presse/pressemitteilungen/pm2017/pressemitteilung-10-08-2017.html (accessed on 23 April 2023).
  5. Weingraber, H.v.; Abou-Aly, M. Handbuch Technische Oberflächen: Typologie, Messung und Gebrauchsverhalten; Springer: Berlin/Heidelberg, Germany, 2013. [Google Scholar]
  6. Schorr, D.-I.D. Rauheitsmessung zur Oberflächencharakterisierung—Aber Richtig. WOTech GbR. 6 September 2021. Available online: https://www.wotech-technical-media.de/womag/ausgabe/2018/04/24_schorr_rauheit_04j2018/24_schorr_rauheit_04j2018.php (accessed on 23 April 2023).
  7. Lindner, T.; Liborius, H.; Töberling, G.; Vogt, S.; Preuß, B.; Rymer, L.-M.; Schubert, A.; Lampke, T. High-Speed Laser Metal Deposition of CrFeCoNi and AlCrFeCoNi HEA Coatings with Narrow Intermixing Zone and Their Machining by Turning and Diamond Smoothing. Coatings 2022, 12, 879. [Google Scholar] [CrossRef]
  8. Xu, X.; Lu, H.; Qiu, J.; Luo, K.; Su, Y.; Xing, F.U.; Lu, J. High-speed-rate direct energy deposition of Fe-based stainless steel: Process optimization, microstructural features, corrosion and wear resistance. J. Manuf. Process. 2022, 75, 243–258. [Google Scholar] [CrossRef]
  9. Bobzin, K.; Wietheger, W.; Knoch, M.A.; Sommer, J.; Brucki, M.; Schleifenbaum, J.H. Constantin Häfner: Combination of a laser deposition welded corrosion protection coating and a thermally sprayed wear protection coating. DVS-Verl. Verl. Schweißen Verwandte Verfahren 2020, 13, 114–121. [Google Scholar]
  10. Pauly Stahlhandel, Stahl Werkstoff-Nr.: 1.0553 Datenblatt. Available online: https://pauly-stahlhandel.com/de/werkstoff-nr/1.0553 (accessed on 10 August 2021).
  11. Mariani, F.E.; Ribeiro, K.S.B.; Lombardi, A.N.; Casteletti, L.C.; Coelho, R.T. Effect of Laser Polishing Post-Processing Technique on the Roughness and Wear Resistance of Inconel 625 Deposited by Laser Cladding on AISI 304L Stainless Steel. J. Mater. Eng. Perform. 2021, 30, 6713–6721. [Google Scholar] [CrossRef]
  12. Cus, F.; Zuperl, U.; Irgolic, T. Effects of laser cladding parameters on microstructure properties and surface roughness of graded material. Proc. Manuf. Syst. 2015, 10, 77. [Google Scholar]
  13. Przestacki, D.; Majchrowski, R.; Marciniak-Podsadna, L. Experimental research of surface roughness and surface texture after laser cladding. Appl. Surf. Sci. 2016, 388, 420–423. [Google Scholar] [CrossRef]
  14. DIN EN ISO 25178-2; Geometrische Produktspezifikation (GPS)—Oberflächenbeschaffenheit: Flächenhaft—Teil 2: Begriffe und Oberflächen-Kenngrößen (ISO 25178-2:2012). Deutsche Fassung EN ISO 25178-2:2012; DIN Deutsches Institut für Normung e. V.: Berlin/Heidelberg, Germany, 2012.
  15. Keyence Deutschland GmbH, Parameter der Oberflächenrauheit: Hybrid. Sdr (Entwickeltes Grenzflächenverhältnis). Available online: https://www.keyence.de/ss/products/microscope/roughness/surface/tab03_b.jsp (accessed on 8 September 2021).
  16. Eichler, H.J.; Eichler, J. Laser: Bauformen, Strahlführung, Anwendungen, 8th ed.; Springer: Berlin/Heidelberg, Germany, 2015. [Google Scholar]
  17. Schopphoven, T. Experimentelle und modelltheoretische Untersuchungen zum Extremen Hochgeschwindigkeits-Laserauftragschweißen. Ph.D. Thesis, Maschinenwesen, Rheinisch-Westfälische Technische Hochschule, Aachen, Germany, 2019. [Google Scholar]
  18. Bernäcker, C.; Loos, S. Fraunhofer IFAM: Electrolysis Technology—Development and Qualification of Stack Components. Available online: https://www.ifam.fraunhofer.de/content/dam/ifam/en/documents/dd/Infobl%C3%A4tter/electrolysis_technology_fraunhofer_ifam_dresden.pdf (accessed on 23 April 2023).
Figure 1. Schematic representation of the principles of (a): conventional LMD; (b): EHLA; (c): picture of the tip of the powder feed nozzle and the powder–gas jet for the EHLA process [3]. 1: laser beam; 2: powder nozzle; 3: powder–gas jet; 4: weld pool; 5: coating layer; 6: dilution zone; 7: heat-affected zone; 8: substrate; 9: shielding gas; 10: level of powder–gas jet focus; 11: focus area of the powder–gas jet; vU: peripheral speed.
Coatings 13 00998 g001
Figure 2. Scanning electron microscope (SEM) images of the powder. 1: nearly spherical particle; 2: aspherical particle; 3: satellite.
Coatings 13 00998 g002
Figure 3. Particle size distribution: cumulative Q and relative p frequency against the particle diameter xarea. (a): volume-weighted; (b): number-weighted.
Coatings 13 00998 g003
Figure 4. Schematic representation of the EHLA machine. 1: conveying and shielding gas supply (argon); 2: powder feeder; 3: laser beam source; 4: CNC control panel; 5: lathe; 6: substrate; 7: powder feed nozzle; 8: optics; 9: powder distributor; 10: gas mass flow meter; a: powder supply pipe; b: nozzle tip; c: powder–gas jet (focus area).
Coatings 13 00998 g004
Figure 5. Analysis of laser beam caustic. left: Schematic representation of the caustic measurement device; middle: laser power density distribution at 31 levels around the focal area; right: laser power density distribution near the focal plane, the Rayleigh length, and twice the Rayleigh length 1: optics; 2: reference edge; 3: FocusMonitor; 4: detector; 5: vertical and horizontal slide; 6: reference edge (FocusMonitor); 7: measuring tip; 8: laser focus range; 9: beam trap.
Coatings 13 00998 g005
Figure 6. Powder–gas jet analysis. Left: schematic representation of the powder jet monitor; right: 1000 superimposed images, each of powder–gas jet measurements taken from (ai) at a distance of 4, 6, 8, 9, 10, 11, 12, 13, 14 mm from the nozzle tip; 1: high-speed camera; 2: focusing optics; 3: nozzle mount and linear axle; 4: powder feed nozzle; 5: illumination laser; 6: powder–gas jet; 7: powder collection container; 8: calculated powder–gas jet focus level.
Coatings 13 00998 g006
Figure 7. Schematic representation of the parameter settings of the offsets: (a) axial offset of the laser beam; (b) axial offset of the powder–gas jet (by adjusting the distance between nozzle tip and component surface); (c) lateral offset of the powder–gas jet relative to the laser beam.
Coatings 13 00998 g007
Figure 8. Schematic representation of the WLI imaging strategy. Middle: EHLA—coating, left: WLI—height profile image with 1.4× magnification, right: WLI—height profile image with 5.5× magnification.
Coatings 13 00998 g008
Figure 9. Detection of the particle adhesions on the coatings: (a) at standard position; (b) at ΔPGJ = 2 mm; (c) at ΔLB = 20 mm (top: without Otsu’s method, bottom: with Otsu’s method); 1: detected particle; 2: agglomerate of particles.
Coatings 13 00998 g009
Figure 10. Schematic representation of the determination of the distribution of adhering structures for single tracks. Left: WLI file; middle: merged areas of the outer tracks, including marking of the detected adhesions and of the track edges; right: distribution of adhering structures (standard settings: ΔLB = 0 mm, ΔPGJ = 0 mm, rPGJ = 0 mm).
Coatings 13 00998 g010
Figure 11. Setup of the high-speed imaging: 1: high-speed camera; 2: objective of the high-speed camera; 3: fiber of the illumination laser; 4: objective of the illumination laser; 5: mirror; 6: powder feeding nozzle; 7: substrate; α: angle with respect to scanning direction; β: angle with respect to the horizontal.
Coatings 13 00998 g011
Figure 12. WLI images of the coatings at ΔLB: (a) negative offsets (b) positive offsets.
Coatings 13 00998 g012
Figure 13. Results for axial offset of the laser beam. (a) Mean arithmetic height vs. ΔLB; (b) mean roughness vs. ΔLB; (c) developed transition area ratio vs. ΔLB; (d) number of particle adhesions vs. ΔLB.
Coatings 13 00998 g013
Figure 14. Shapes (green line) and particle adhesions (orange dots) of the single tracks at different axial offsets ΔLB.
Coatings 13 00998 g014
Figure 15. High-speed images of the weld pool at different offsets ΔLB: (a) change in the extent of the weld pool due to different axial offsets ΔLB (orange ellipse marks weld pool); (b) creation of large, overlapping structures by bonding new material with existing structures (ΔLB = −17.5 mm: white dashed lines mark the PGJ and the process area; orange rectangles mark the same area in front of and behind the weld pool; green arrows mark the enlarging structure).
Coatings 13 00998 g015
Figure 16. WLI images of the coatings at different ΔPGJ, scanning direction from left to right.
Coatings 13 00998 g016
Figure 17. Results for axial offset of the powder–gas jet. (a) Mean arithmetic height vs. ΔPGJ; (b) mean roughness vs. ΔPGJ; (c) developed transition area ratio vs. ΔPGJ; (d) number of particle adhesions vs. ΔPGJ.
Coatings 13 00998 g017
Figure 18. Particle distribution on single tracks at different axial offsets ΔPGJ: (a) ΔPGJ = 0 mm; (b) ΔPGJ = 1 mm; (c) ΔPGJ = 2 mm; (d) ΔPGJ = 4 mm. The detected particles are marked with orange dots and the edge of the single tracks with green lines.
Coatings 13 00998 g018
Figure 19. WLI images of the coatings for different φPGJ, scanning direction from left to right.
Coatings 13 00998 g019
Figure 20. High-speed images of the weld pool at different offsets φPGJ. The powder–gas jet is marked with green dashed lines, the weld pool with an orange ellipse, and the raised track edge with a blue dotted square.
Coatings 13 00998 g020
Figure 21. Particle distribution on single tracks at different axial offsets φPGJ: (a) φPGJ = 0°; (b) φPGJ = 45°; (c) φPGJ = 90°; (d) φPGJ = 135°. The detected particles are marked with orange dots, and the edges of the single tracks are marked with green lines.
Coatings 13 00998 g021aCoatings 13 00998 g021b
Figure 22. Results for lateral offset of the powder–gas jet. (a) Mean arithmetic height vs. φPGJ; (b) mean roughness vs. φPGJ; (c) developed transition area ratio vs. φPGJ; (d) number of particle adhesions vs. φPGJ.
Coatings 13 00998 g022aCoatings 13 00998 g022b
Figure 23. Particle distribution on single tracks at different axial offsets φPGJ: (a) φPGJ = 180°; (b) φPGJ = 225°; (c) φPGJ = 270°; (d) φPGJ = 315°. The detected particles are marked with orange dots, and the edge of the single tracks marked are with green lines.
Coatings 13 00998 g023
Table 1. Chemical composition of the filler material [max. mass%].
NiCrMoNbFerest
58.0–63.020.0–23.08.0–10.03.0–5.0≤5.0<2.0
Table 2. Chemical composition of the substrate material [max. mass%].
CSiMnPS
≤0.22≤0.55≤1.60≤0.025≤0.04
Table 3. Laser beam parameters.
Axial Offset of the Laser Beam ΔLB [mm]Radius at Beam Waist w0 [µm]Rayleigh Length zR [mm]Divergence Angle Θ [mrad]Diffraction Measure M2Beam Parameter Product BPP [mm × mrad]
−2059613.5488.0580.0726.25
057312.5391.580.0326.24
+2054811.48955779.9726.22
Table 4. Powder–gas jet parameters.
Measuring Plane (Distance to Nozzle Tip) [mm]Corresponding ΔPGJ [mm], Where the Measuring Plane Would Be on the Substrate SurfaceDiameter [mm]
Coatings 13 00998 i0014−64.124
6−42.795
8−21.528
8.5−1.51.259
8.75−1.251.167
9−11.126
9.25−0.751.149
9.5−0.51.203
1001.434
11+12.070
12+22.678
13+33.279
14+43.882
15+54.409
Calculated focal plane9.06−0.941.162
Table 5. Parameter settings.
Process ParameterUnitSetting
Laser power PLW1800
Powder mass flow rate m . g/min9.6
Peripheral speed vUm/min50
Feed rate vfmm/rev0.2 (coating)
2 (single track)
Conveying gas volume flow rare V˙FL/min6
Protective gas volume flow rare V˙SL/min10
Axial offset of the laser beam ΔLBmm−20–+20
Axial offset of the powder–gas jet ΔPGJmm−1–+4
Lateral offset of the powder–gas jet φPGJ (angle) rPGJ (distance)°
mm
0–315
0.6
Disclaimer/Publisher’s Note: The statements, opinions and data contained in all publications are solely those of the individual author(s) and contributor(s) and not of MDPI and/or the editor(s). MDPI and/or the editor(s) disclaim responsibility for any injury to people or property resulting from any ideas, methods, instructions or products referred to in the content.

