Abstract
Interfacial bonding strength between the substrate and its coating is one of the important indexes affecting the service life of parts. To reduce the manufacturing cost, a mathematical model can be established to quantitatively describe the microscopic surface roughness and its anti-corrosion coating adhesion strength. Anti-corrosion life could be improved by controlling the surface roughness of the substrate. In this study, a model of interfacial bond strength and roughness, which was calibrated using the substrate surface and closely related to the cell spacing and length of the support, was established. Under the same condition as the coating, component materials and the coating thickness, results were obtained that the coating strength changed along with the substrate roughness. When roughness changed between 37.1 μm and 48.4 μm, the bonding strength showed a decreasing trend. The larger the value of the roughness, the more conducive it was to the bonding between the arc spraying layer and the substrate. The adhesion between the coating and substrate was not always increased with the higher roughness on the same surface. It should be evaluated based on the surface roughness and its evaluation parameters, and there was an optimal roughness evaluation and selection range. The experimental results were consistent with the theoretical predictions.
1. Introduction
Hot dip plating of Al–Zn alloys is an inexpensive and corrosion-resistant method for steel corrosion protection, which is widely used in many industrial fields due to the excellent wear resistance, casting property, thermal conductivity and high temperature oxidation resistance [1,2,3]. The surface characteristics of parts affect the strength and service life of the anti-corrosion coating [4,5,6]. The use of equipment components has led to higher demands on corrosion protection under the ocean, in the chemical industry and for other severe environmental conditions [7]. From design to construction, anti-corrosion coating should consider many factors, such as the environment, substrate type, durable life, ease of maintenance and so on [8]. The strength and life of anti-corrosion coatings are influenced by the substrate surface’s features. Of the factors affecting the durability of anti-corrosion coatings, substrate surface treatment accounted for 50% [9]. The part needs excellent compatibility and adhesion to the coating [10]. In addition, the design of a coating system, including the coating type, number of layers and thickness will also significantly affect the durability of the coating [11,12,13]. Surface anticorrosion of machining parts plays an important role in equipment parts, which influence the properties of parts. The interfacial bonding strength between the coating and linear surface roughness of cutting parts are mainly discussed in this research.
Preparation on the surface of the machining part is another important aspect to improve the interfacial bond strength between the coating and part [14]. In machining processes, it is necessary to attain the desired surface quality in order to produce parts providing the required functioning [15]. The surface quality also affects some coating properties of the product, such as corrosion protection [6,16,17]. Surface roughness prediction is helpful, which is mostly based on cutting parameters, and sometimes some other parameters.
Experimental results show that the interfacial bond strength between a part and its coating is improved with the increasing of the surface roughness in a certain range [18]. When the roughness values exceed a certain value, due to the excessive uneven surface of the sample, the coating adhesion is on the decline [19]. The pickling process can reduce the surface roughness, and correspondingly, coating bonding strength is increased [20]. The coating bonding strength is related to the pickling process because it can remove the sample scale cinder, dirt and rust; the many tiny pores are also beneficial to the infiltration of the subbing [21,22,23]. Moreover, more advanced manufacturing methods are proposed in this research to obtain novel coatings on the alloy substrate [24,25,26]. In achieving these research results, quantitative description is important considering the part surface, coating material sub-strategies and the micro-scale.
To study the surface morphology of cutting parts, we simply considered the influence of the roughness of the surface on the interfacial bond strength between the part and its coating, and a mathematical model was established in this research. Moreover, we simulated the static micro-geometric structure and derived a mechanical model for the bonding strength of thermal sprayed metal step anti-corrosion coatings. The influence of interface geometric structure parameters and processing parameters on the bonding strength and lifespan was therefore obtained.
2. The Actual Surface Geometry Error of the Part and Its Constituent
The available roughness of the liner counter, waviness and macroscopic shape, was consistent with the normal direction of a part’s surface and intersected with the plane, corresponding to the surface roughness of the contour. Figure 1 shows the contour of waviness and the substrate contour of the macro shape.
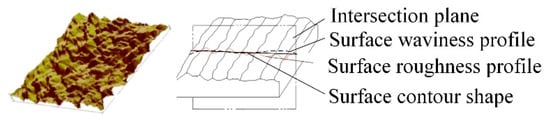
Figure 1.
Actual parts surface contour.
2.1. The Contour Surface Roughness
A machining part’s surface always displays microscopic errors when compared with the ideal surface. The contour surface roughness is one of the main technical indexes to evaluate the surface quality of parts. The roughness affects the beautiful outlook, surface wearing, faying surface sealing and the reliability of the mating surface. The fatigue strength and corrosion resistance of rotor parts are also connected to the roughness of the part’s surface. Currently, machining surfaces with small spacing and a peak valley of micro-geometry features have a relatively complete linear evaluation system. On the other hand, the surface roughness assessment system based on multi-directional and simultaneous evaluation is not yet complete [5].
2.2. The Contour Waviness
Contour waviness is an essential ingredient for the actual contour surface, composed by the spacing, which is larger than the roughness, random or close to cycle forming, as seen in Figure 1. It usually contains the roughness of the surface when machining surfaces are affected by accidents, such as contour mutations on the surface of parts caused by an out-of-control tool. The component materials and manufacturing methods should be described with sufficient detail to allow researchers to replicate and build on the published results.
3. Classification of Machining Surface Roughness
Micro-geometric morphologies of part surfaces were formed by different mechanical processing methods. The micro-grain forming a micro-surface roughness was distributed in different directions. Using traditional forming methods (planing, milling, turning, grinding etc.), a comparison of surface features is described in Table 1.

Table 1.
Classification of surface structures according to machining direction.
4. Roughness Measurement of Machining Parts
Generally, one of the following parameters for quantitative evaluation of surface roughness is adopted:
- (a)
- The arithmetical mean deviation of the profile and the sampling length is the arithmetic mean value that the contour offsets the distances of the absolute value in Equation (1).
Similar to
where the contour offset distance is the distance between the contour points and the baseline on the measuring direction. Baseline is the least squares midline of the profile. The line dividing the contour and the sampling length offsets the contour from the line sum of the square minimum.
- (b)
- Ten points height of microscopic irregularities in the sampling length is the mean value of the five biggest contour peaks plus the mean value of the five biggest contour valleys.where stands the i’th largest contour peak and stands the i’th largest contour valley.
- (c)
- The maximum height of the profile is the distance between the peak contour line within the sampling length l and the contour line of the valley.
Surface roughness parameters , and prescribe the numerical value, respectively, divided into two series and the first series should be considered firstly. Using electronic or optical instruments, the numerical of , and is measured. The surface roughness is evaluated quantitatively.
5. Mathematical Model
Experimental results show that the coating on the part of the characteristic parameters is closely related to the properties and surface roughness of the substrate (a special area with coating bonding parts, also known as the substrate) [4]. The size of the peaks and valleys of the micro-surface was used to evaluate the roughness and its composition unit width, which influenced the interfacial bond strength.
5.1. The Basic Assumptions
- The surface of the substrate is connected without oil, scale cinder and other foreign bodies. The performance gradient caused by uneven material is ignored. The ideal plane of the same substrate is consistent with the coating interfacial bond strength of the normal direction. The adhesion force induced within the interface is considered to be perfectly uniform. The infiltration depth of all interfacial coating is the same.
- The coating material is enough to infiltrate the substrate at peak and valley parts caused by the machining tool nose.
- The change of adhesive strength caused by the thermal expansion effect of the coating during manufacture can be ignored, and only the mutual attraction between the coating and adjacent parts of the substrate needs to be considered. The thickness of the anti-corrosion coating is sufficient to exceed the peak line of the substrate contour.
- When the number of samples is enough to measure the roughness values, the values can completely meet the geometrical features of the substrate surface morphology characterization requirements.
5.2. Coordinate System
Based on the roughness evaluation criteria, the local Cartier coordinate system established for the evaluation of coating bond strength. The coordinate parallel to the local substrate surface and consistent with the least squares midline is used to measure surface roughness, and coordinate is perpendicular to the substrate surface (as shown in Figure 2).
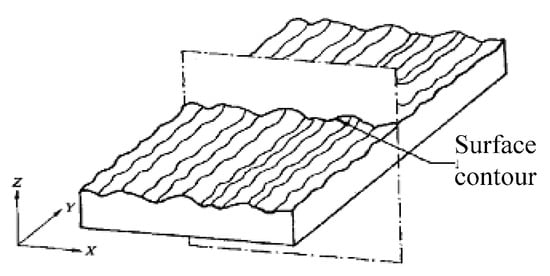
Figure 2.
Coordinate system of the substrate surface.
5.3. Local Coating Bond Strength
Local coating bond strength B is the comprehensive of the tensile stress v and perpendicular to the substrate surface and the shear stress parameters c, related to the size of the slope. The local angle of the inclined plane is assumed to be φ (as shown in Figure 3).
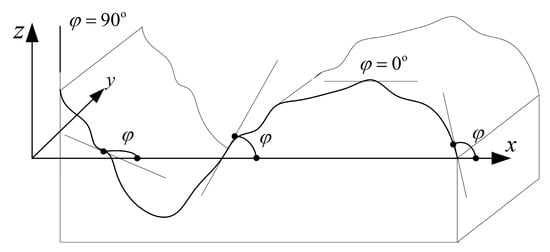
Figure 3.
The local angle of inclined plane.
That is,
5.4. Model of Bond Strength and Simplified of Substrate Curve Contour
5.4.1. Unidirectional Curve Contour
The coordinates z of the unidirectional contour curve within the scope of the sampling length is the coordinate average of the contour curve, defined by the substrate surface contour curve as l(x,y) and the sampling length is the average in all the evaluation process; that is, (as shown in Figure 4).
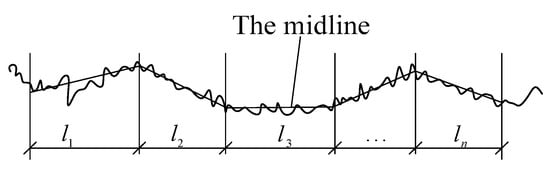
Figure 4.
The sampling length l.
- (1)
- The least squares midline as the surface roughness contour midline is used, namely (as shown in Figure 5).
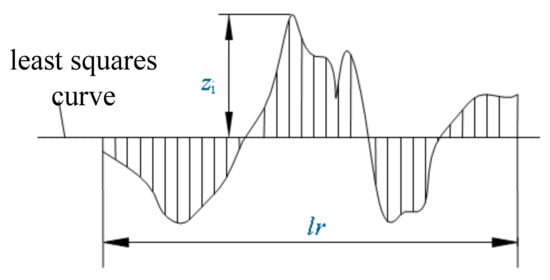 Figure 5. The surface roughness of the contour midline.
 - (2)
- The substrate surface roughness value reflects the arithmetic average deviation of the substrate surface wave crests and troughs, namely,
- (3)
- The composition unit is composed of a total of n contour crests and troughs within the evaluation length; the spacing parameters xSn are shown in Figure 6.
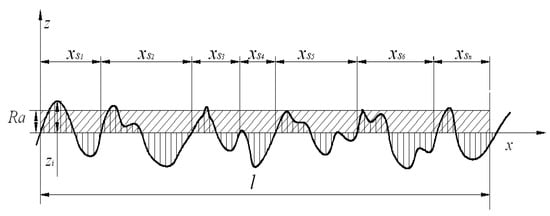 Figure 6. The spacing parameters.
 - (4)
- The substrate bearing length ratio curve of the contour surface. Defining the bearing length ratio of the substrate surface contour is within the scope of the evaluation length, and the substrate bearing length ratio curve of the contour surface is composed of the cumulative probability distribution function curve by sampling the coordinates . The curve reflects the contour bearing rate, changed by the sampling horizontal coordinates.
The contour bearing length ratio is defined as follows:
The value is 100% in the position of the substrate entity. Corresponding to the certain bearing length ratio of coordinates and the average of the composition unit (as shown in Figure 7), the actual calculation process is simplified to .
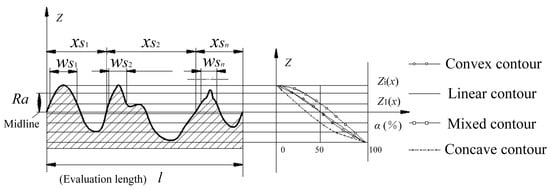
Figure 7.
The curve of the bearing length ratio.
- (5)
- Equivalent contour curve. According to the bearing length ratio , the contour curve of the simplified composition unit can be approximately defined.
The space parameters among the composition units take their average value .The parameters of the wave crests and troughs are . The substrate surface contour curve can be simplified as the periodic wave surface, in which the period is and the peak height and depth valley is , respectively (contour unit height is ). Within the evaluation length, the period number is n, namely . The different contour curves of the equivalent single periodic are shown in Figure 8.
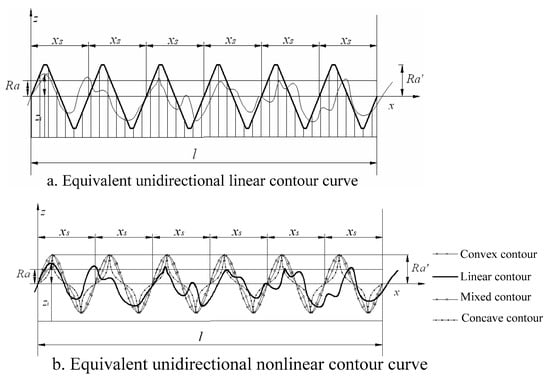
Figure 8.
Equivalent unidirectional contour curve.
The equivalent linear contour curve located in the wave crest horizontal responds to the substrates, which makes the substrate surface contour line consistent with the contour midline of the roughness of the substrate. The percentage of the actual contour line depends on the processing method of the surface formation. The horizontal of the wave trough reflects the substrates which may be formed by the tool tip or are completely parallel to the midline of the contour assessment, and the substrates are determined by the contour bearing length ratio.
The equivalent nonlinear contour curve takes the average root value of the ordinate slope within the sampling length to evaluate the slope of the contour. It is further divided into three conditions, including pure convex contours, concave contours and mixed contours.
- (6)
- Calculation of unidirectional linear contour coating bond strength. The local contour curve slope is supposed as , as shown in Figure 9.
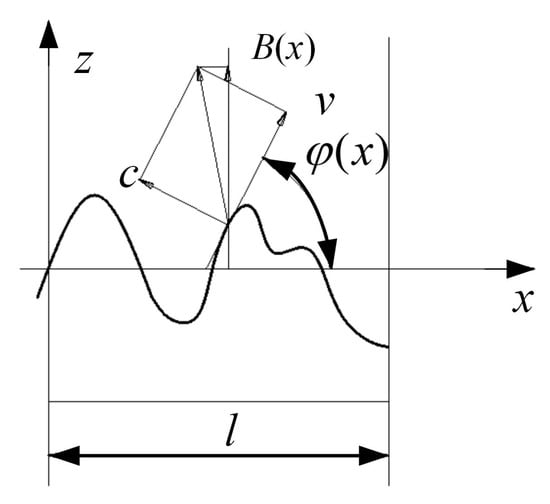 Figure 9. Local contour curve slope.
The coating bond strength is divided into the bond strength component perpendicular to the local substrate surface and shear component , parallel to the local substrate surface. The value of and is determined by the coating system of the substrate material which ensures the coating and ensures that the roughness is sufficiently small. The standard values are obtained using finite element calculations and through tests.
The bond strength of the coating system and any point of interface can be expressed as follows:
The macroscopic bonding strength of the substrate surface can be expressed as follows:
To consider the stress formed by the thermal expansion and contraction of the coating, the influence function is introduced. The bonding strength is a function with the change of the contour curve, and it can be seen as the non-uniform stress field along the sample length.
The influence function is a function that takes into account the residual stress in the coating and the substrate; however, it only takes into account the impact on the bond strength component v. Neglecting the local strain at room temperature when spraying the coating system, the high temperature coating has a greater impact on the bond strength because of the substrate surface roughness. The function is related to the bearing length ratio and the geometry of the substrate contour.
where the value of is the linear thermal expansion ratio of the coating material and is Young’s modulus of elasticity of the coating material parallel to the length direction of the evaluation. Considering the linear thermal expansion of the coating material and the macroscopic bonding strength of the substrate surface, it can be expressed as follows:
The actual bonding strength varies with the roughness. The limit loads acting on the substrate surface sampling length can be expressed as follows:
On the sampling length, the assessment value of the bonding strength can be expressed as follows:
5.4.2. The Orthogonal Bidirectional Contour Curve
The least square midline that defines the surface micro-error of the orthogonal bidirectional contour curve surface is composed of the datum plan assessing the contour roughness, namely . The reference plane used to evaluate the bidirectional curve contour roughness is shown in Figure 10.
Figure 10.
The reference plane used to evaluate the bidirectional curve contour roughness.
- (1)
- The contour surface roughness of the orthogonal bidirectional curve assessment. The contour surface roughness of the orthogonal bidirectional curve reflects the arithmetical deviation of the substrate surface bidirectional wave crests and troughs. In the plane, the assessment length within n cycles is and . Parameter definitions are shown in Figure 11.
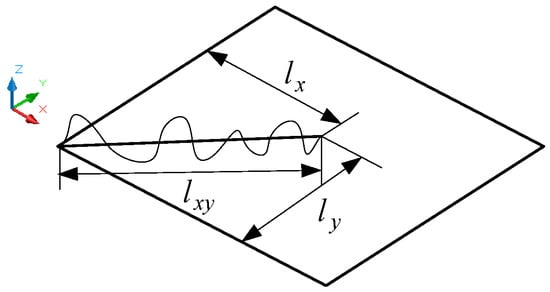 Figure 11. Parameter definitions.
The assessment length composed of the combination unit within n contour peak and valley; the spacing parameters is , as shown in Figure 12.
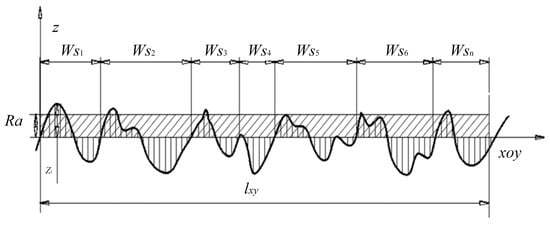
Figure 12.
Spacing parameters.
- (2)
- The bearing length ratio curve of the substrate surface contour. When defining the bearing length ratio of the substrate surface contour within the scope of the evaluation length, the curve consists of the cumulative probability distribution function curve of the sampling coordinate value . The curve reflects that the contour bearing rate changes according to the sampling horizontal coordinate position.
The contour bearing length ratio is defined as follows:
The value of the substrate essential position is 100%. According to the certain coordinates , the bearing length ratio and the assembly unit , the actual calculation process is simplified to , similar to what is shown in Figure 7.
According to the bearing length ratio , the assembly unit contour curve of simplification can be approximately defined as:
The space parameters among the composition units take their average value . The parameters of the wave crests and troughs are . The substrate surface contour curve can be simplified as the periodic wave surface, in which the period is and the peak height and depth valley is , respectively (contour unit height is ). Within the evaluation length, the period number is n, namely . The different contour curve of the equivalent single periodic is shown in Figure 13.
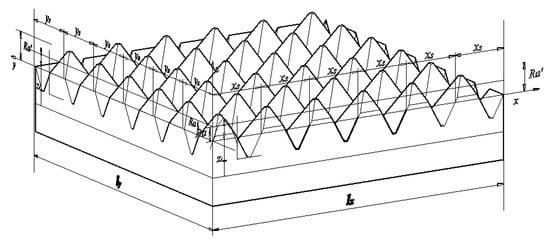
Figure 13.
Orthogonal bidirectional curve of the equivalent bidirectional linear contour.
The equivalent linear contour curve is located in the horizontal wave crest which responds to the substrates, which, furthermore, makes the substrate surface contour line consistent with the contour midline of the roughness of the substrate. The percentage of the actual contour line depends on the processing method of the surface formation. The horizontal of the wave trough reflects the substrates, which may be formed by the tool tip or completely parallel to the midline of the contour assessment, and the substrates are determined by the contour bearing length ratio .
The equivalent nonlinear contour curve is divided into three conditions, including pure convex contours, concave contours and mixed contours (as shown in Figure 14).
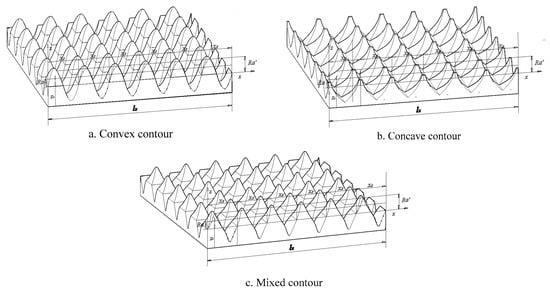
Figure 14.
Orthogonal bidirectional curve of the equivalent bidirectional nonlinear contour.
- (3)
- The bonding strength model of the orthogonal bidirectional curve surface contour. The orthogonal bidirectional curve surface contour is made up of a result from the 3D Boolean intersection operation between the space curved surface equation and , namely .
The bonding strength is a function within the change of the contour curves and . It can be seen as the non-uniform stress field along the sample length. The coating bond strength on any substrate surface point is the comprehensive embodiment of the drawing stress parameters perpendicular to the substrate surface, and the pressure and shear stress parameters c. A wave crest and trough period based on certain roughness and parameters assessed via its contour (as shown in Figure 15) is used as the representative bond strength evaluation unit.
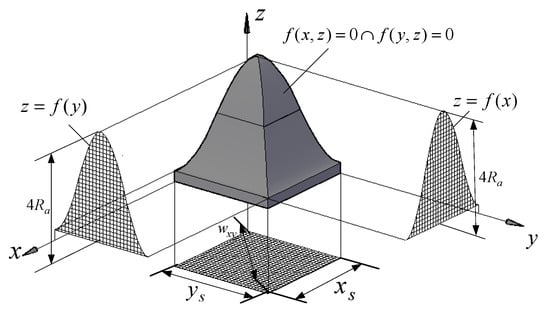
Figure 15.
A wave crest and trough period.
The coating and substrate of the evaluation unit have four bonding surfaces (space curved surface). A single wave crest and trough coating average bond strength is available to express, along with tension stress and shear stress , in relation to the projection area in the local contour surface coordinate planes.
The surface projection area of evaluation units is as follows:
The surface projection area is as follows:
The surface projection area is as follows:
The coating average bond strength of the representative single wave crest and trough can be obtained by (14), (15) and (16).
Parameter B can be used as a local evaluation value of the substrate surface bonding strength, along with the sampling length.
6. Results and Discussion
6.1. The Relationship between the Unidirectional Linear Contour Roughness and Its Bond Strength
According to the contour bearing length ratio curve and the equivalent contour curve, the unidirectional linear contour roughness and the bonding strength of the coating can be calculated, as shown in Figure 8.
The coating bond strength of the same coating and substrate materials is related to the unit length used to evaluate the roughness, the bearing length ratio and the surface wave. This paper has simplified the linear wave crests and troughs as an example.
Equation (5) shows that, under certain roughness conditions, the linear contour shape depends on the supporting length ratio. Supposing the bearing length ratio is 0 at the top of the peak and 100% at the trough, the unidirectional linear contour curve can be simplified as a polygonal line. Namely,
Equation (11) can be simplified, as follows:
where .
From the above Equation, under the average spacing parameters of composition unit length , the relationship between the linear contour roughness and its bonding strength is shown in Figure 16.
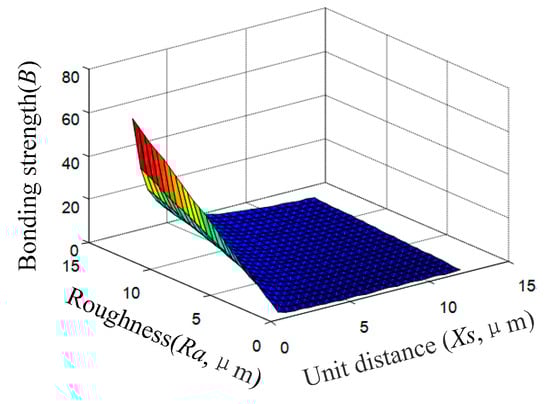
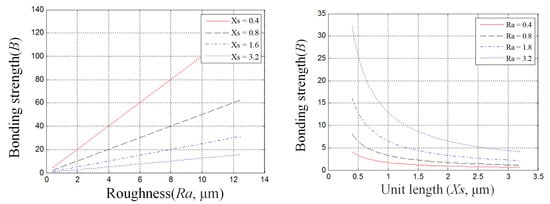
Figure 16.
The relationship between linear contour roughness and its bonding strength.
The predicted results show that under certain average evaluation unit lengths of roughness, with the increasing degree of the unidirectional linear contour rough numerical, the bonding strength of the coating increases (shown in Figure 16). According to the identical kind of roughness, with the average evaluation unit length increasing, the coating bond strength decreases (shown in Figure 16). Thus, the linear substrate contour roughness is not the only factor affecting the bond strength. Oversize roughness only affects the geometry of the coating, and the bonding strength of the coating will be further evaluated.
6.2. The Relationship between the Unidirectional Nonlinear Contour Roughness and Its Bonding Strength
When forming the unidirectional nonlinear contour roughness, it was mainly generated by the geometry of the knifepoint, as shown in Figure 9. According to the value of the bearing length ratio, the simplified convex contour can be fit using multiple curves.
The simplified convex contour is as follows:
Supposing a point on the substrate surface micro-curve contour is within a unit length , then all the points exist as the second derivative or piecewise derivable. A function fitted as a unidirectional nonlinear contour is defined as follows:
Take the unit of the single wave crest and trough and establish a coordinate system, as shown in Figure 17, and suppose the bearing length ratio , then .
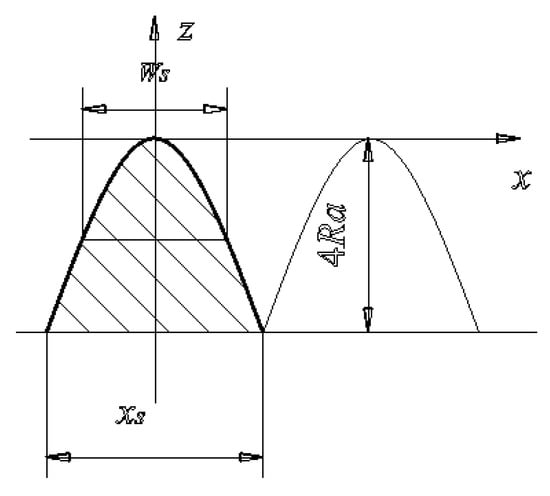
Figure 17.
Single wave crest, trough and coordinate system.
Equation (20) can be simplified as into Equation (12), and the unit suffered load is as follows:
The relationship between the unidirectional nonlinear convex contour roughness and its bonding strength is shown in Figure 18.
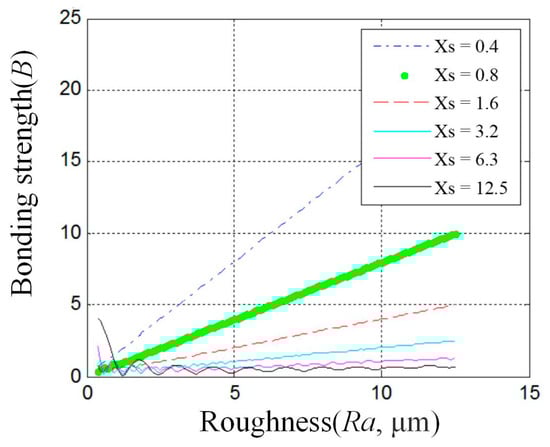
Figure 18.
The relationship between the unidirectional nonlinear convex contour roughness and its bonding strength.
The Simplified Concave Contour
The case can correspond to the rough surface of the circular cutter process, supposing the circular radius of the tool tip is (). Take the unit of the single wave crest and trough and establish a coordinate system, as shown in Figure 19, and suppose that the bearing length ratio is , then . The function is a substrate of the circle of the radius .
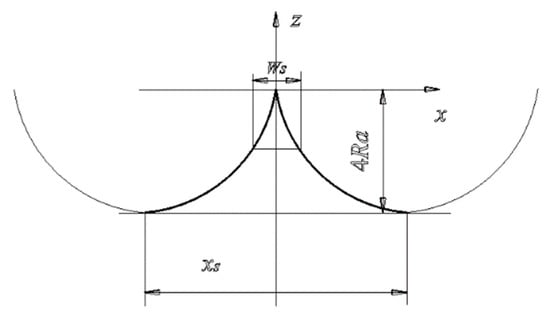
Figure 19.
The unit of a single wave crest and trough and establish a coordinate system.
According to Equations (22)and (23), the results can be driven as shown in Figure 20. Within the scope of a certain roughness evaluation length, the coating bond strength increases with the increase in the roughness and changes slowly along with the increase in the assessed roughness length, and the trend is not stable. When considering the same coating system with the same roughness and evaluation length, the substrate contour roughness on the surface of the concave substrate is bigger than the convex substrate. Thus, it can be proven theoretically that the shot peening process improves the coating bond strength and service life.
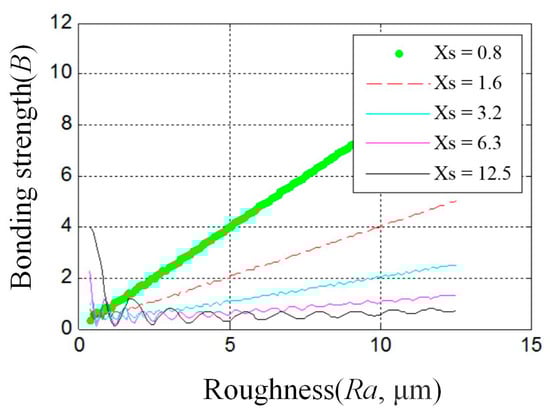
Figure 20.
The relationship between the unidirectional nonlinear concave contour roughness and its bonding strength.
7. Experimental Verification
In order to investigate the influence of substrate surface roughness on the coating bond strength, this research adopted different mechanical cutting methods to process the substrate surface. Thus, different substrate surfaces with a plurality of different sets of roughness were obtained. By measuring the bonding strength between coating and substrate by stretching them out via scanning electron microscopy and by observing the microstructure of the surface and cross-sectional, the effects of surface roughness of the substrate coating and the substrate bonding strength were obtained.
7.1. The Experimental Matearials and Methods
7.1.1. Production of Samples and Roughness Measurement
A total of 45 quenched and tempered steel units were the part materials used in this experiment. A one-way linear processing method was adopted, using different precision one-way fine planning and surface grinding. Substrate samples with square samples were used, each processing five. When cutting, the cutting direction was along the short side of each sample block. Before roughness testing, ultrasonic cleaning was performed with an acetone sample for 10 min, and then oil-free compressed air was used on the sample. Substrate surface roughness was measured using a portable surface roughness tester TR240.
The parameter was measured as the arithmetic average value of 10 peak-to-valley heights (5 peaks and 5 valleys) on the surface of the substrate. The sampling point length was 0.8 mm, and the measured average length mean as well as the cutting direction perpendicular to the direction of the sample were sampled 10 times and the measurements were averaged.
The appropriate tool and feed rate were used on the planning sample to control surface roughness and each five measured 100–200 μm in scope and 50–100 μm; the sample is based on an actual number. There were five pieces of the flat grinding sample controls to the surface roughness within 25–50 μm and 5–12.5 μm in scope.
7.1.2. Preparation of Coating
The test material was an alloy coating material, and the coating was Al–Zn–Si. In order to prevent the substrate alloy from oxidizing at a high temperature environment and improve the bonding strength of the coating, we sprayed a priming layer on the sample for preparation and then sprayed an anti-corrosion coating.
7.1.3. Determination of Coating and Substrate Bonding Strength
Cylindrical tensile test specimens were prepared with a diameter of 25.4 mm, and the adhesive tensile bond strength test method of the coating and the substrate was performed. A box was sprayed with a coating of the cylindrical tensile specimen sample and bonded using Shanghai E-7 glue bonding, which was neat and with no dislocation. The pressure was fixed, then the sample was put into the incubator with the thermostat at 100 °C. Heat curing occurred for 3 h, and the spilled glue was cleaned from the outer surface. Using each set of five pairs of the coated test specimens, the mean value was measured as the binding strength of the coating.
7.2. Results and Discussion
7.2.1. Experimental Results
The experimental results demonstrated that when the surface roughness of the substrate increases, the bonding strength will be improved. The greater roughness is beneficial to the bonding between the surface of the coating and the substrate. The increasing groove modifies the bonding strength of the coating and reduces the cracking tendency of the coating. With surface roughness increasing, the contact areas between the coating and the substrate expanded in multiples, which is conducive to the occurrence of various physical and chemical effects on the contact interface. When the roughness exceeded a certain value, it was against the combination of the coating and the substrate.
In addition, due to the unevenness of the surface, molten particles impacted the substrate surface and formed thin sheets, forming an interlocking layered structure between the deformed particles, which is conducive to mechanical bonding. When the roughness exceeded a limited value, it was not conducive to the bonding between the coating and substrate as the surface roughness increased. The occurrence of this situation is related to the characteristics of the spraying process, the process of forming material characteristics and roughness and the particle size of the coating powder used.
The velocity and temperature distribution of the plasma spraying flame flow were uneven, which lead to the particles not moving fast enough and not melting well during the spraying process. In addition, the size of the alloy powder particles was relatively large. When the particles hit the substrate surface, the defects easily appeared on the bonding interface due to the relatively large particles and were not fast enough and not melting well enough. Pressure was generated during the impact of the molten particles on the surface of the substrate and during the spreading process. The resistance of molten particles on the surfaces with lower roughness was relatively small, while the resistance on the surfaces with higher roughness was relatively large. The smaller the particle size of the molten metal particles, the higher the spraying speed, and the easier it was to form a dense coating. The strength of the coating was also increased.
When the roughness exceeded 50 μm, the bonding strength was on a declining tendency. It was seen that when the substrate surface becomes rougher, the combination of the coating may not get better. When the roughness was kept within 10 μm and the bonding strength coating changed irregularly, the substrate surface became smoother and the bonding intensity was greater. The roughness of the surface should be confined to the optimum range, and should only be confined within this range, thus the combining effect between the coating and substrate will be ensured.
7.2.2. Influence of Unit Average Spacing on Coating Bond Strength
The measurement of the parameter has no direct influence on the measurement of roughness and the effects among the united units, which consist of the substrate surface’s contour crest and through. In addition, the bonding strength was greatly affected. The results show that even though the substrate’s roughness was the same, the bonding strength was significantly different when achieved by diverse processing methods. According to this study, when the measurement of xs, which is based on the substrate’s surface of the same roughness, is bigger, the bonding strength is weaker. Corresponding to the research termination, the results preliminarily indicate that the strength of a substrate’s surface with the same roughness ruled grinding is much stronger than the chipping surfaces.
8. Conclusions
- A reasonable roughness value can increase the bonding strength between the substrate and its coating. The bonding strength between the substrate and its coating was affected by the roughness of the substrate surface and evaluation parameters. When the roughness was within a certain range (the range of the contents in 10–50 μm), the substrate surface roughness was evaluated to be the same average pitch length of the same unit; the coarser it was, the higher the coating adhesion strength. The bonding strength changed irregularly when the roughness was smaller. Additionally, the experimental results also proved the theoretical predictions. The bonding strength which was beyond a certain range of roughness was not enhanced when the roughness increased. Different coating systems exist within the best range of roughness, but it is not the only range. With different processing methods, the change of roughness influences the coating bond strength differently. Moreover, the high strength coating system was found to correspond to the reasonable range of the substrate roughness.
- The trend of the coating strength was not in accord with the roughness, and the unit length was negatively correlated with the coating strength. It was greatly influenced by the measurement of the average length unit . Under the condition of roughness at the same value and within a certain limit, the measured average spacing between units was smaller and the coating strength was stronger.
- The mathematical model, which was based on the linear substrate surface micro-contour, was verified by the experiment, and the universality of the mathematical model needs to be further improved. The coating bonding strength was somewhat related to the microstructure formation of the roughness contour, which could be calculated before manufacture with cost reduction. A difference can be seen in the theoretical prediction. Therefore, the diversity and complexity of the substrate surface micro-contour and the universality of the mathematical model need to be further improved. In addition, further theoretical and experimental research is needed for the coating system roughness selection range.
Author Contributions
Conceptualization, J.L. and Z.M.; methodology, J.L.; software, J.L.; validation, J.L., C.J. and Z.Z.; formal analysis, R.M.; investigation, J.L. writing—original draft preparation, Z.M.; writing—review and editing, J.L.; visualization, C.J.; supervision, C.J.; project administration, Z.M. All authors have read and agreed to the published version of the manuscript.
Funding
This research was funded by National Natural Science Foundation of China (Grant No. 51405135), Key Scientific Research Project of Colleges and Universities in Henan Province of China (Grant No. 23A580002) and Henan Science and Technology Projects (Grant No. 212102210064).
Data Availability Statement
Data is contained within the article.
Conflicts of Interest
The authors declare no conflict of interest.
References
- Mao, F.; Guo, J.; Zhang, G.; Zhang, P.; Xiong, M.; Chen, C.; Wang, C.; Xiao, L. Effect of Si and P Content on the Si Phase and Solidification Behavior of Al-40Zn-xSi Alloys Using Synchrotron Radiation Real-Time Imaging. Coatings 2022, 12, 1127. [Google Scholar] [CrossRef]
- Su, F.; Zhang, P.; Wei, D.; Chen, X.; Ding, F.; Wang, B. Corrosion behavior of hot-dip Al-Zn coating doped with Si, RE, and Mg during exposure to sodium chloride containing environments. Mater. Corros. 2018, 69, 714–724. [Google Scholar] [CrossRef]
- Chen, W.; Wang, Z.; Xu, G.; Song, W.; Xie, Y.; Zhao, L.; Xia, M.H.; Li, W. Friction and anti-corrosion characteristics of arc sprayed Al+Zn coatings on steel structures prepared in atmospheric environment. J. Mater. Res. Technol. 2021, 15, 6562–6573. [Google Scholar] [CrossRef]
- Jia, R.; Unsal, T.; Xu, D.; Lekbach, Y.; Gu, T. Microbiologically influenced corrosion and current mitigation strategies: A state of the art review. Int. Biodeterior. Biodegrad. 2019, 137, 42–58. [Google Scholar] [CrossRef]
- Xing, Y.Z.; Wang, K.; He, L.; Liu, Z.; Chen, Y.-N. Investigation of the Bonding Formation of a Plasma-Sprayed Cast Iron Splat on a Preheated Aluminum Substrate Using an Experimentally Based Numerical Simulation Method. J. Therm. Spray Technol. 2020, 29, 947–954. [Google Scholar] [CrossRef]
- Toloei, A.; Stoilov, V.; Northwood, D. The Relationship Between Surface Roughness and Corrosion. In Proceedings of the ASME 2013 International Mechanical Engineering Congress and Exposition, San Diego, CA, USA, 15–21 November 2013. [Google Scholar]
- Zhang, D.; Huang, Y.; Wang, Y. Bonding performances of epoxy coatings reinforced by carbon nanotubes (CNTs) on mild steel substrate with different surface roughness. Compos. Part A Appl. Sci. Manuf. 2021, 147, 106479. [Google Scholar] [CrossRef]
- Fukanuma, H.; Huang, R.; Tanaka, Y.; Uesugi, Y. Mathematical Modeling and Numerical Simulation of Splat Cooling in Plasma Spray Coatings. J. Therm. Spray Technol. 2009, 18, 965–974. [Google Scholar] [CrossRef]
- Lei, Y.; Shengyu, F.; Suyou, W.; Yunpeng, Z. Dynamic mechanical analysis of durable and anticorrosive coatings. Surf. Technol. 2007, 36, 25–27. [Google Scholar]
- Özdemir, M. Modelling and Prediction of Effect of Machining Parameters on Surface Roughness in Turning Operations. Teh. Vjesn. 2020, 27, 751–760. [Google Scholar]
- Bobzin, K.; Wietheger, W.; Heinemann, H.; Wolf, F. Simulation of thermally sprayed coating properties considering the splat boundaries. IOP Conf. Ser. Mater. Sci. Eng. 2021, 1147, 012026. [Google Scholar] [CrossRef]
- Chen, Y.; Gong, W. KANGR Review and propositions for the sliding/impact wear behavior in a contact interface. Chin. Soc. Aeronaut. 2018, 33, 391–406. [Google Scholar] [CrossRef]
- Connelly, M.C.; Reddy, G.S.; Nadagouda, M.N.; Sekhar, J.A. Antimicrobial and anticorrosive efficacy of inorganic nanoporous surfaces. Clean Technol. Environ. Policy 2016, 19, 845–857. [Google Scholar] [CrossRef]
- Nugroho, F.A.; Garhuom, W.; Andresen-Paulsen, G.; Ehlers, S. Numerical analysis of the correlation between the pitting severity and surface roughness of corroded specimens. Ships Offshore Struct. 2022, 17, 2699–2714. [Google Scholar] [CrossRef]
- Cakir, M.C.; Ensarioglu, C.; Demirayak, I. Mathematical modeling of surface roughness for evaluating the effects of cutting parameters and coating material. J. Mater. Process. Technol. 2009, 209, 102–109. [Google Scholar] [CrossRef]
- Sekhar, J. Tunable coefficient of friction with surface texturing in materials engineering and biological systems. Chem. Eng. 2018, 19, 94–106. [Google Scholar] [CrossRef]
- Martin, A.; Texier-Mandoki, N.; Crusset, D.; Sabot, R.; Creus, J.; Refait, P. Corrosion Behavior and Sacrificial Properties of Zn and Zn-Al Coatings in Conditions Simulating Deep Geological Disposal of Radioactive Waste at 80 °C. Coatings 2022, 12, 1044. [Google Scholar] [CrossRef]
- Hui, Y.; Shaoming, P. Effect of Substrate Surface Roughness on Bond Strength of Coatings. Hot Work. Technol. 2008, 37, 118–121. [Google Scholar]
- Zhang, J.; Saha, D.C.; Behravesh, B.; Jahed, H. Adhesion properties of plasma transferred wire arc low-carbon steel coating sprayed on diecast aluminum alloys: Experiment and simulation. Surf. Coat. Technol. 2022, 447, 128867. [Google Scholar] [CrossRef]
- Regel-Rosocka, M. A review on methods of regeneration of spent pickling solutions from steel processing. J. Hazard. Mater. 2010, 177, 57–69. [Google Scholar] [CrossRef]
- Devi, A.; Singhal, A.; Gupta, R.; Panzade, P. A study on treatment methods of spent pickling liquor generated by pickling process of steel. Clean Technol. Environ. Policy 2014, 16, 1515–1527. [Google Scholar] [CrossRef]
- Wang, S.; Chen, Y.; Gu, C.; Sai, Q.; Lei, T.; Williams, J. Antifouling Coatings Fabricated by Laser Cladding. Coatings 2023, 13, 397. [Google Scholar] [CrossRef]
- Yang, J.; Shang, L.; Sun, J.; Bai, S.; Wang, S.; Liu, J.; Yun, D.; Ma, D. Restraining the Cr-Zr interdiffusion of Cr-coated Zr alloys in high temperature environment: A Cr/CrN/Cr coating approach. Corros. Sci. 2023, 214, 111015. [Google Scholar] [CrossRef]
- Lu, J.; Chen, Y.; Ding, M.; Fan, X.; Hu, J.; Chen, Y.; Li, J.; Li, Z.; Liu, W. A 4arm-PEG macromolecule crosslinked chitosan hydrogels as antibacterial wound dressing. Carbohydr. Polym. 2022, 277, 118871. [Google Scholar] [CrossRef] [PubMed]
- Li, J.; Li, W.; Rao, Y.; Shi, F.; Yu, S.; Yang, H.; Min, L.; Yang, Z. Synthesis of highly ordered AgNPs-coated silica photonic crystal beads for sensitive and reproducible 3D SERS substrates. Chin. Chem. Lett. 2021, 32, 150–153. [Google Scholar] [CrossRef]
- Du, J.; Zhang, R.; Wang, F.; Zhou, H.; Wang, X.; Du, X. Facile fabrication of novel cobalt-based carbonaceous coatings on nickel-titanium alloy fiber substrate for selective solid-phase microextraction. Chin. Chem. Lett. 2022, 33, 3119–3122. [Google Scholar] [CrossRef]


Disclaimer/Publisher’s Note: The statements, opinions and data contained in all publications are solely those of the individual author(s) and contributor(s) and not of MDPI and/or the editor(s). MDPI and/or the editor(s) disclaim responsibility for any injury to people or property resulting from any ideas, methods, instructions or products referred to in the content. |
© 2023 by the authors. Licensee MDPI, Basel, Switzerland. This article is an open access article distributed under the terms and conditions of the Creative Commons Attribution (CC BY) license (https://creativecommons.org/licenses/by/4.0/).