Article

Preparation, Characterization, Release and Antibacterial Properties of Cinnamon Essential Oil Microcapsules

1
School of Perfume & Aroma and Cosmetics, Shanghai Institute of Technology, Shanghai 201418, China
2
Engineering Research Center of Perfume & Aroma and Cosmetics, Ministry of Education, Shanghai 201418, China
*
Author to whom correspondence should be addressed.
Coatings 2023, 13(6), 973; https://doi.org/10.3390/coatings13060973
Submission received: 11 April 2023 / Revised: 6 May 2023 / Accepted: 19 May 2023 / Published: 23 May 2023

Abstract

:
In this study, the antibacterial microcapsules of cinnamon essential oil (CEO) were prepared by complex condensation method. Chitosan quaternary ammonium salt (HACC) combined with gum arabic (GA) was selected as the coated wall material. The optimal preparation conditions of CEO microcapsules (CMSs) were determined by response surface methodology (RSM): the core/wall mass ratio was 1:1, the pH value was 4.5, the mass concentration of CaCl2 was 0.7 wt% and the actual encapsulation rate of microcapsules was 90.72% ± 1.89%. The morphology, size, composition and thermal stability of the prepared CMSs were characterized by scanning electron microscopy (SEM), laser particle size analysis (LPDA), Fourier transform infrared spectroscopy (FTIR), thermogravimetric differential thermal analysis (TG–DTA) and differential scanning calorimetry (DSC). In addition, the in vitro drug release and antibacterial properties of CMS were also evaluated. The results showed that CMS was spherical, with an average particle size of 6.31 µm. The obvious weight loss occurred at 269 °C and the corresponding DSC curve had an obvious exothermic peak at 265.5 °C, which had an increase compared with CEO. Microcapsules can achieve slow release, with the lowest and highest release rates being 19.66% and 49.79%, within 30 days. The drug release curve of essential oil of microcapsules was consistent with a first-order release model named ExpDec1. Based on the above research results, the CMS can effectively improve the stability of essential oil, achieve slow release and prolong the antibacterial effect, indicating its potential applications in food, cosmetics and medicine.

1. Introduction

Cinnamon, derived from the dried or curled bark of the cinnamon plant, has a wide range of applications. As a spicy herbal medicine with a warming effect on the kidney [1], cinnamon is often used in daily products such as food, medicine and cosmetics. Cinnamon contains many components, the main component of which is cinnamaldehyde, which includes trans-cinnamic acid, cinnamon glucoside and other substances. In addition, it also contains 1.98 to 2.06% volatile oil. Generally speaking, cinnamon essential oil (CEO) can be extracted as a yellow or amber liquid that has a special sweet smell and demonstrates effective broad-spectrum antibacterial performance, resisting a large number of bacteria, mold and yeast, due to the presence of its main component, cinnamaldehyde [2,3,4]. CEO is also an efficient and environmentally friendly natural antioxidant, food stabilizer and natural preservative [1,5,6] because it excels in many aspects, including sensory, nutritional, antioxidant, anti-inflammatory and antibacterial performance [7]. However, CEO has certain undesirable characteristics such as instability and volatility, as shown in its degree of vulnerability to oxygen, light, heat, moisture and other adverse external factors [8,9]. Moreover, it displays certain irritation to skin and eyes, which ultimately leads to its limitations in practical applications.
Therefore, in order to solve these drawbacks and improve the usage value of CEO, it can be considered as the core material in prepared microcapsules [10]. It was found that microencapsulation technology can protect materials from external conditions by changing the physical state of the material and reducing the reactivity of the substance [11]. In addition, this can also effectively decelerate the fluctuation of its active ingredients, thus improving the stability of the core, masking unpleasant flavors [7,12], reducing the irritation of the plant essential oil, in turn providing strong support for the further development and usage of the plant essential oil [13].
There are many methods to prepare microcapsules. The existing methods for CMS preparation include using silicon dioxide (SiO2)/polymelamine–formaldehyde (PMF) as a hybrid shell to prepare a silicon dioxide-stabilized Pickering emulsion template by in situ polymerization, so as to further prepare CEO-loaded antibacterial composite microcapsules. In this paper, we used complex coalescence to prepare the CEO microcapsules. Many studies have proven that complex coalescence is a unique and promising method for microencapsulation since it is a phase separation process based on the simultaneous desolation of oppositely charged polyelectrolytes induced by a medium modification, resulting in superior encapsulation efficiency, excellent controlled release properties and thermal resistance [14]. Composite condensation microencapsulation is considered to be one of the most effective technologies for the coating of volatile compounds such as essential oils because very high payloads and mechanical stresses can be achieved [15], the conditions of composite condensation are milder than previous methods, no high temperatures are involved and the microencapsulation efficiency of the prepared microcapsules is higher. However, there are relatively few studies about CEO microcapsule preparation by the complex coalescence method.
There are many materials that can be used as microcapsule wall materials. In recent years, many researchers have chosen natural polymer materials as wall materials. Among them, chitosan is one widely used wall material [16]. The results showed that different molecular weights and concentrations of chitosan had significant effects on the texture and appearance of microcapsules. Hu et al. used chitosan as wall material to prepare cinnamon–thyme–ginger composite essential oil nano-capsules (CEO-NPs) by ionic gelation reaction. The thermal stability of CEO-NPs was improved compared with that of CEO and the cumulative release of CEO-NPs was 38.77% after 18 days, which means it could be used as a potential long-term natural preservative [17]. However, chitosan itself has weak antibacterial and antioxidant activities and poor water solubility, which cannot meet the demand for efficient development [18]. Chitosan quaternary ammonium salt (HACC) exhibited better water solubility and higher antibacterial activity than chitosan over the entire pH range [19], resulting in the increased potential of chitosan for drug release and antimicrobial applications [20], expanding the range of applications of chitosan [21]. On the one hand, it can provide a positive charge and react easily with negatively charged substances; on the other hand, the superb surface activity provides an easier dispersion for microcapsules, thereby reducing the agglomeration of microcapsules. As for the non-toxic chitosan derivative chitosan quaternary ammonium salt, there is no potential toxicity, theoretically. By complexing Cu2+ with HACC to assess the toxicity of oral mice on rabbit skin, coating irritation studies have shown that there is indeed no toxicity associated with ingestion nor skin irritation [22]. Gum arabic (GA) is a biocompatible and biodegradable polymer with exceptional film-forming properties, good hydrophilicity and lipophilicity [23]. The dissociation of its hydroxyl group makes it easier to open its extremely tight structure and ionize H+ at neutral pH, resulting in a high level of negatively charged groups [24]. This increases the number of reactive sites and negative charges of GA compared to other biomolecules, thus providing suitable conditions for the reaction with HACC. In addition, the considerable water solubility and low viscosity increase the possibility of encapsulating essential oils [25]. It is the strong electrostatic interaction between the quaternary ammonium group of chitosan quaternary and the carboxyl group of GA that makes the combination of HACC and GA (oppositely charged polyelectrolytes) beneficial for the use as wall material in the preparation of plant essential oil-loaded microcapsules.
In this work, HACC and GA were used as wall materials, CEO was used as core material and a cinnamon essential oil microcapsule was prepared by composite condensation method. The purpose of this study is to optimize the technological conditions for the preparation of microcapsules and, at the same time, through the characterization of the microcapsule morphology, size, thermal stability, slow release performance and antibacterial performance, to obtain a microcapsule that can improve the efficiency of a single use of CEO by serving as a preservative, prolonging the action time.

2. Materials and Methods

2.1. Materials

Quaternary ammonium salt of chitosan (HACC), gum arabic (GA), Tween-60, Span-80, 10% sodium hydroxide (which was used to adjust the pH value of microcapsules) and solidification agent calcium chloride (CaCl2) were all purchased from Shanghai Titan Technology Co., Ltd. (Shanghai, China). The CEO was obtained from Jiangxi Yisengyuan (Jiangxi, China). Glacial acetic acid (1%) was provided by Sinopharm Chemical Reagent Co., Ltd. (Shanghai, China). All other chemicals and reagents were of analytical grade. The water used in all experiments was distilled water (1 μs/cm).

2.2. Experimental Design

Response surface analysis (RSM) is a mathematical and statistical method for optimizing process parameters, which can obtain desirable results with a smaller number of trials compared to approaches such as orthogonal experimental design and homogeneous design [26,27]. There are a variety of experimental design methods for response surface models and one of the most widely used means is the Box–Behnken design method. BBD is a three-level design that indicates the interaction effects between multiple single factors through a three-dimensional response surface plot and a two-dimensional contour plot of the correlated measured response, with the former being very useful for understanding the interaction effects of independent factors and the latter providing a visual representation of the response values [28,29]. Finally, a multiple quadratic regression equation was used to fit the function between the independent variables and the response values. Then, the regression equation was analyzed to find the optimal process parameters [30]. Accordingly, the BBD method was used to explore the optimal conditions for the microencapsulation of essential oils. In this experiment, 3 factors and 3 levels were used; the corresponding factors and levels are shown in Table 1.
The core-to-wall ratio (X1, 1:2 to 3:2), pH (X2, 4.0 to 5.0) and CaCl2 mass concentration (X3, 0.6 to 0.8, w/v%) were used as independent variables (factors), which were varied at low (−1), medium (0) and high (+1) levels to design 17 encapsulation schemes. The encapsulation efficiency (EE, %) (Y) was used as the dependent variable (response value) to construct a model using the software Design Expert for statistical analysis of the results. Y was estimated by a quadratic polynomial regression equation as follows:
Y = β0 + β1X1 + β2X2 + β3X3 + β12X1X2 + β13X1X3 + β23X2X3 + β11X12 + β22X22 + β33X32
where Y represents the response variable; β0 is a constant; β1, β2 and β3 are the coefficients of the linear effects; β12, β13 and β23 symbolize the coefficients of the interactions between the factors and β11, β22 and β33 designate the coefficients of the quadratic effect.

2.3. Encapsulation Process

The CMSs were prepared by the composite coalescence method of GA and HACC. The detailed preparation process of the CEO drug-laden microcapsules was as follows. Firstly, two solutions were developed separately. Solution A: HACC powder 0.5 g, dissolved in 50 mL of distilled water and 1.0% glacial acetic acid was added. Solution B: GA powder 2 g, dissolved in 50 mL of distilled water and different volumes of CEO in proportion to the wall material (1:2, 1:1, 3:2) were added, followed by 0.12 g of Span-80 and 0.18 g of Tween-60, after which the mixture was homogenized at 10,000 r/min for 3 min at room temperature, to make a consistent solution to obtain an oil-in-water (O/W) emulsion [7]. The emulsion was dropped into the beaker containing solution A with a disposable rubber-tipped dropper, while the recondensation reaction was carried out at 560 r/min in a 50 °C water bath. The microcapsule suspension was made by mixing 10% sodium hydroxide solution to adjust the pH (pH = 4.0, 5.0 and 6.0), using the pH meter to measure the pH value of solution, stirring for 30 min and then adding different concentrations of CaCl2 solution (0.6%, 0.7% and 0.8%), before finally stirring in a 45 °C water bath for 2 h. After high-pressure homogenization, vacuum freeze-drying was performed for 48 h to eventually obtain microcapsule powder [31].

2.4. Physical and Chemical Characterizations of CMS

2.4.1. Encapsulation Efficiency

The amount of free essential oil on the surface of the microcapsules is defined as the weight of unembedded oil on the surface of the dry state sample. Encapsulation efficiency (EE) was defined as the percentage of the mass of the encapsulated CEO to the total mass of the CEO added during the encapsulation process [32,33]. This experiment was performed using an indirect assay. Three measurements were performed on each sample to obtain the average amount of oil present in the microcapsules [34]. An amount of 10 mg of the sample was washed twice with anhydrous ethanol to collect the unwrapped core material (free oil) extracted into anhydrous ethanol. Then, the extract, fixed to 40 mL, was poured into a colorimetric tube to measure the absorbance value of cinnamon essential oil at 282 nm. The free essential oil content on the surface of the CMS was computed according to the standard curve. The encapsulation efficiency (EE%) is calculated as follows:
EE   ( % ) = m 2 m 1 m 2 × 100 %
where m1 denotes the mass of plant essential oil on the surface of microcapsules (g) and m2 indicates the mass of initial plant essential oil (g).

2.4.2. Particle Size and Scanning Electron Microscopy (SEM)

Particle size of the microcapsules were analyzed by the laser particle size analyzer (Mastersizer 3000, Malvern Instruments Ltd., Malvern, UK). The dispersion index set by the instrument was 1.59 and the analytical model was universal. A small amount of well-dispersed cured microcapsule solution was pipetted and added drop by drop to the cuvette, using clean water as the dispersant. The morphology of the optimized microcapsules and blank microcapsules was observed with a scanning electron microscope (Hitachi S-3400N, Osaka, Japan). A small piece of conductive adhesive was cut and attached to the sample stage and the dried solid microcapsule powder was spread evenly on the conductive adhesive, gently pressed to fix the microcapsules, then gold sprayed and put into the scanning electron microscope for observation [35].

2.4.3. Zeta Potential

Zeta potential of microcapsules was measured by the laser particle size analyzer (Mastersizer 3000, Malvern Instruments Ltd., Malvern, UK) to investigate the stability of the prepared microcapsules. A certain amount of cinnamon essential oil microcapsule samples were taken and prepared into solution with mass fraction of 0.01%. The pH value was adjusted from 4 to 9 at room temperature and 1 mL sample solution was absorbed each time. Zeta potential was determined at 25 °C under different pH values.

2.4.4. Fourier Transform Infrared (FTIR) Spectroscopy

FTIR spectroscopic analysis was performed using FTIR spectrometer (VERTEX 70, BRUKER, Brooke, Germany) to inspect the chemical structure of optimized and blank microcapsules. The resolution was 4 cm−1 and the range was 4000 to 400 cm−1. A small amount of sample was placed in a mortar and ground with KBr at a mass ratio of 1:200 to make a sample for testing.

2.4.5. Thermal Gravity–Differential Thermal Analysis (TG-DTA)

Thermogravimetric analyzer (TGAQ5000, TA, New Castle, DE, USA) was used to determine the thermogravimetric and differential curves of blank microcapsules (BMS) and CMS powder, in order to determine the drug loading. After automatic zero calibration of the instrument, 2~5 mg of the sample to be measured was weighed for thermogravimetric analysis.

2.4.6. Differential Scanning Calorimetry (DSC)

To verify the encapsulation of CMS, differential scanning calorimetry (DSC) (STA 449/DSC 200, NETZSCH, Selb, Germany) was employed to acquire differential scanning calorimetry curves for three samples: (a) CEO, (b) BMS and (c) CMS. The samples (4.0 mg ± 0.01 mg) were weighed into 50 μL closed alumina crucibles and their thermal behavior was studied in the temperature range of 25 to 600 °C. The scanning was performed in nitrogen and the thermal stability was measured at a ramp rate of 10 °C/min [36]. The data were analyzed using Mettler Toledo Star SW 9.10 software.

2.5. In Vitro Release Studies

2.5.1. Effect of Temperature on the Release of Cinnamon Oil and Microcapsule

A certain amount of CMS was weighed in conical flasks and placed in biochemical incubators at 32% relative humidity and 4 °C, 28 °C and 37 °C. Afterwards, samples were taken at 1, 2, 3, 4, 5, 6, 7, 8, 9, 10, 15, 20, 25 and 30 days and the free essential oil on the surface was dissolved using 50 mL anhydrous ethanol, which was then centrifuged (10,000 r/min, 5 min). Later, the absorbance of the supernatant was measured at 282 nm by UV spectrophotometer. Each measurement was repeated three times and the average value was counted. The relative cumulative release rate was calculated and the corresponding curve was plotted [37].
The cumulative release (CR) of CEO from the microcapsules was acquired by the following formula:
CR   ( % ) = t = 0 t M t M 0   ×   100
where Mt and M0 are the weight of CEO released from the microcapsules and the weight of CEO initially in the microcapsules, respectively.

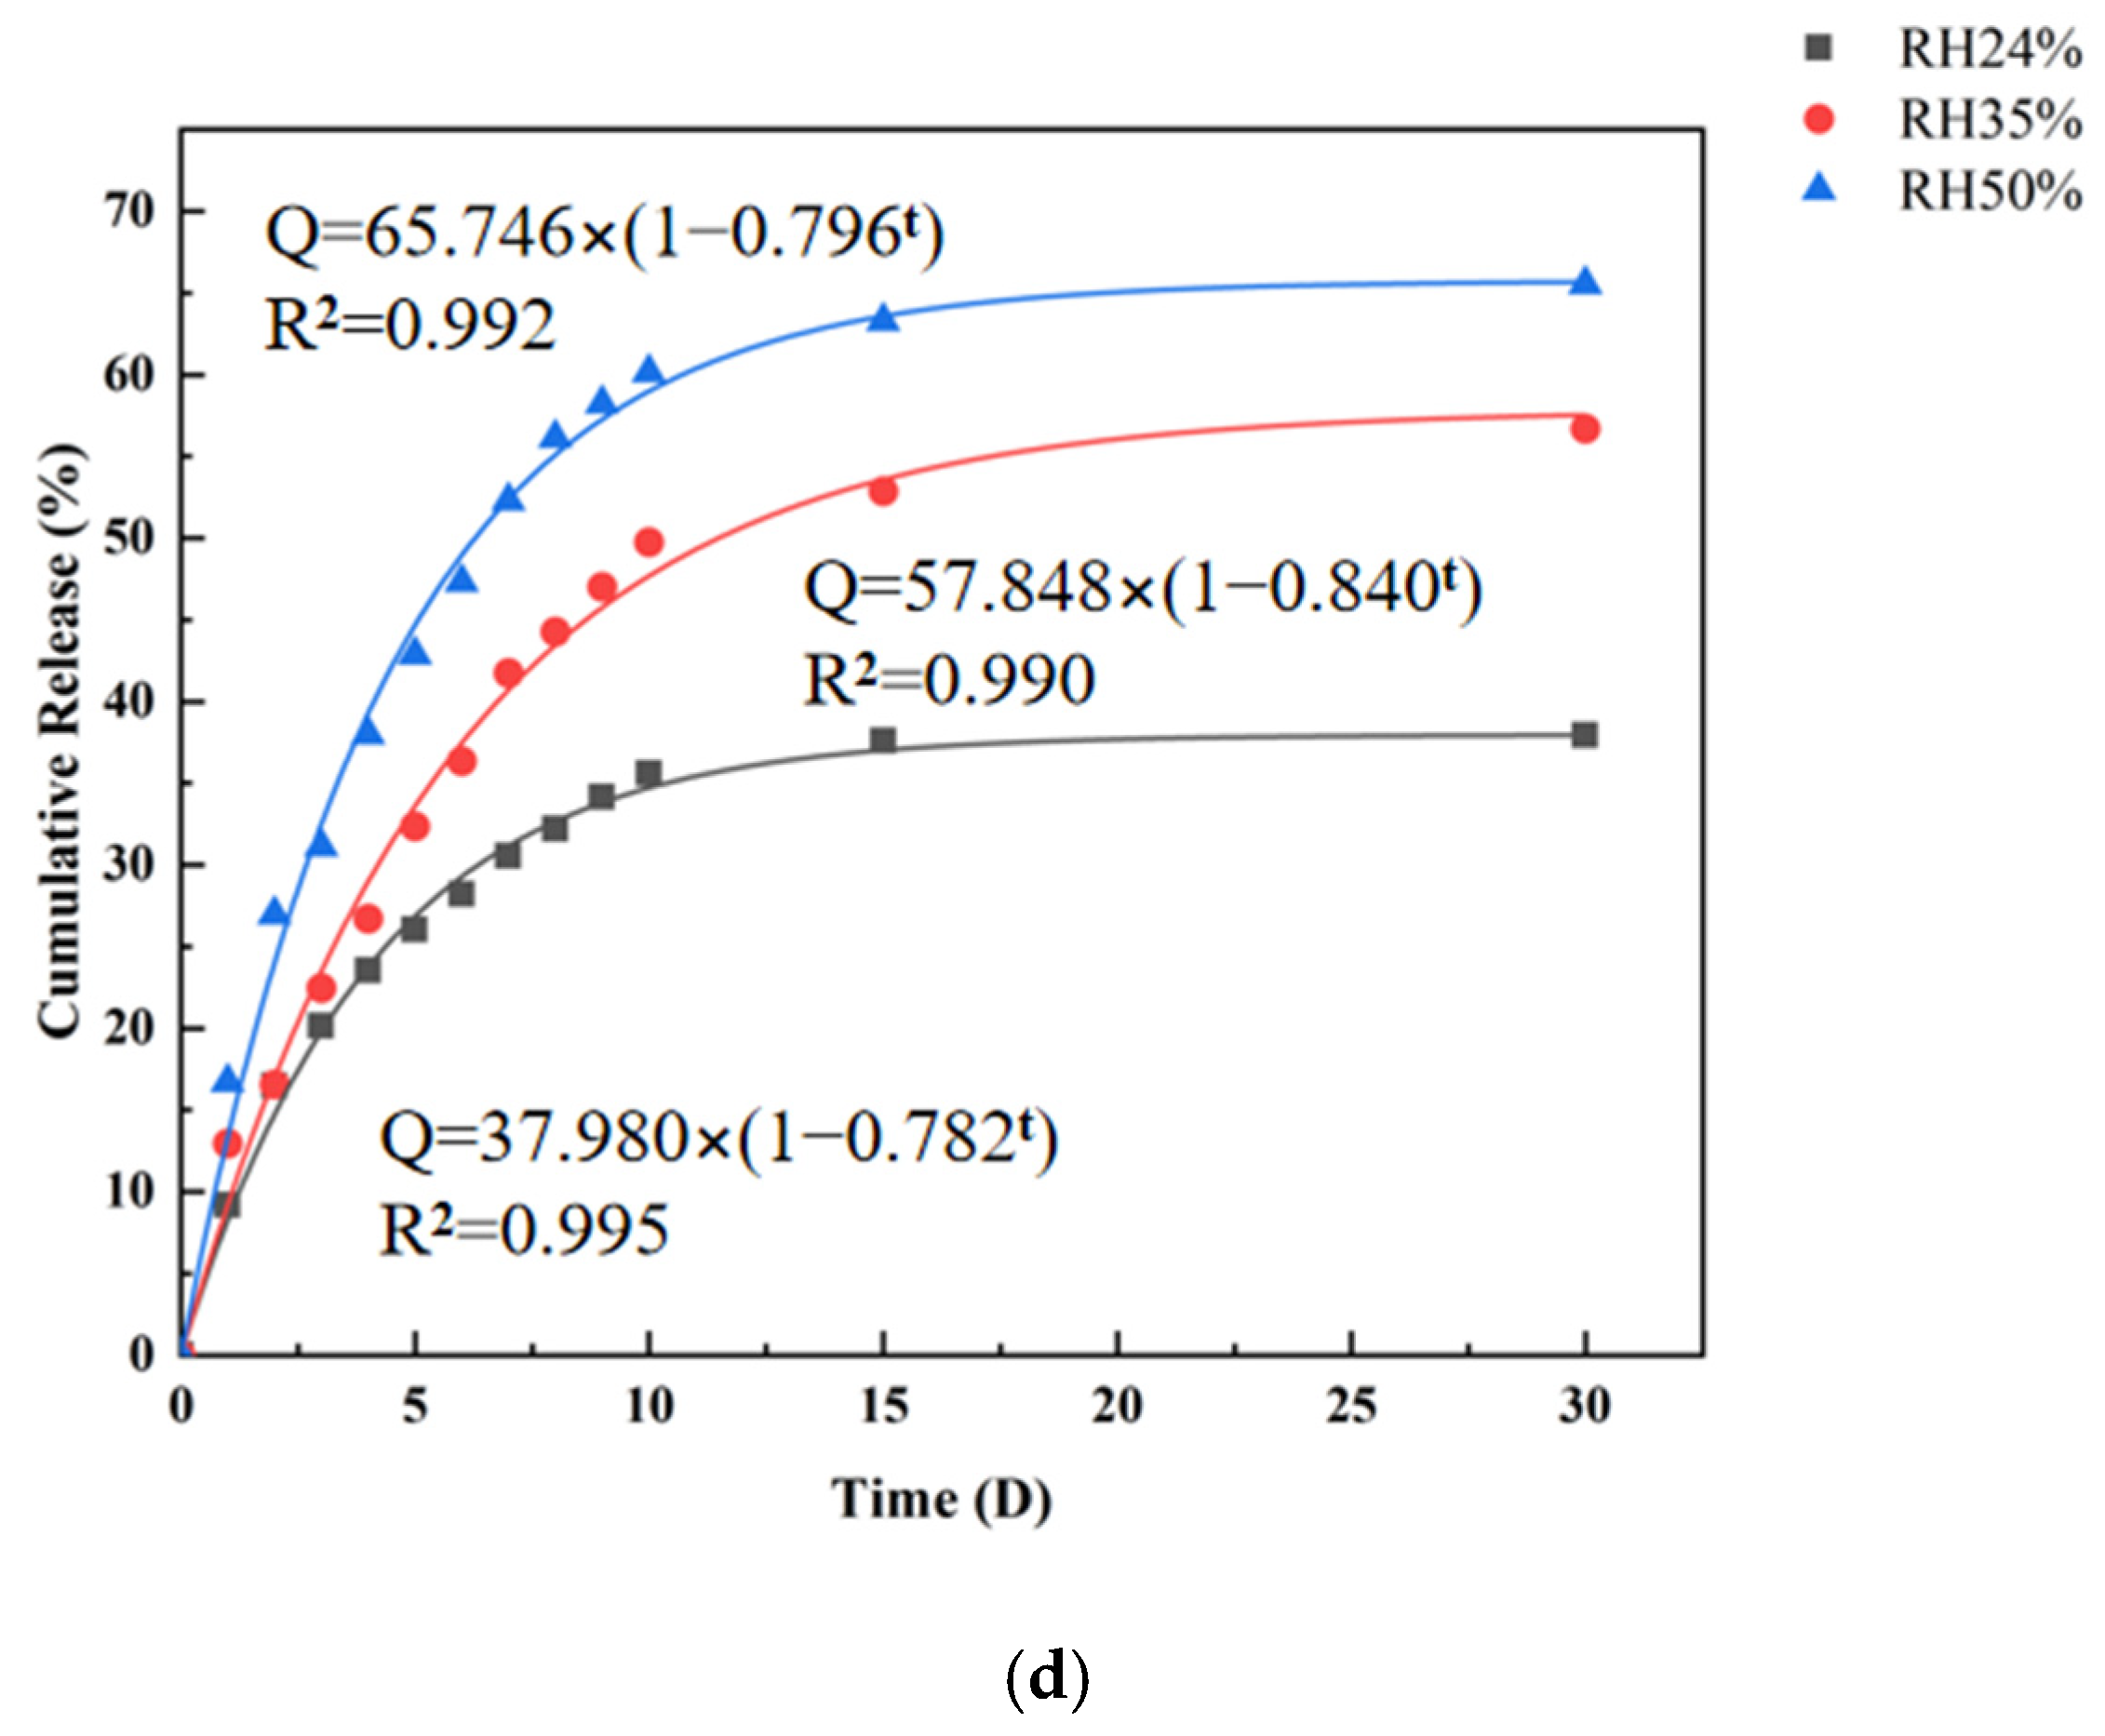
2.5.2. Effect of Relative Humidity on the Release of Cinnamon Oil and Microcapsule

A certain quantity of CMS was weighed in a conical flask and placed in an airtight container at 25 °C. The relative humidity was adjusted to 24%, 35% and 50% and samples were taken at 1, 2, 3, 4, 5, 6, 7, 8, 9, 10, 15, 20, 25 and 30 days. Finally, the operation in Section 2.5.1 was repeated. The relative cumulative release rate was calculated and the corresponding curve was plotted.

2.6. Antimicrobial Properties

2.6.1. Antimicrobial Activity of Cinnamon Oil and Microcapsule

In our study, the microbial strains we used were all laboratory-conserved strains of Staphylococcus aureus (S. aureus) (ATCC6538), Escherichia coli (E. coli) (ATCC8739), Pseudomonas aeruginosa (P. aeruginosa) (ATCC9027), Candida albicans (C. albicans) (ATCC10231) and Aspergillus niger (A. niger) (ATCC16404). The main reason for selecting the 5 tested bacteria is that this study is mainly aimed at application in the field of cosmetic antisepsis. The 5 selected bacteria are required to be detected in cosmetics and they are also the 5 most common microorganisms in cosmetics. Qualitative and quantitative methods were employed to identify the activity of CEO as well as microcapsules to inhibit or slow down the growth of the tested microorganisms.
Agar diffusion method was carried out as follows. The circle of inhibition of the extracts was determined by agar perforation method [38]. A volume of 15 mL of medium was first poured, allowing it to cool and solidify, and then 100 μL of bacterial suspension was added dropwise onto the plate and punched evenly with a 6 mm diameter agar punch. An amount of 50 μL of each sample was taken into the wells and then the bacteria were incubated at 37 °C for 24 h (fungi at 28 °C for 48 h). The diameter of the inhibition circle was observed and measured with Vernier calipers. Each group was repeated 3 times and the mean value was taken. Sterile water was a negative control, while the uninhibited sample was a positive control.
MIC determination took place as follows. The minimum inhibitory concentration (MIC) was the lowest concentration of active substance in the medium that could inhibit the growth and reproduction of microorganisms [39]. The MIC was determined by microplate dilution method. The microdilution test was performed on a sterile 96-chamber microtiter plate to ascertain the initial concentration, followed by a series of twofold dilutions [40]. Firstly, 100 µL 107 CFU/mL bacterial suspension and 100 µL gradient concentration of the sample were added per well and then the microtiter with 100 µL of the corresponding medium was added as a positive control and the microtiter without bacterial suspension was added as a negative control. After that, the OD600 value was measured immediately. After incubating for the corresponding time, the OD600 value was gauged again and the smallest concentration with a difference lower than 0.05 between the two times was considered as the final result.

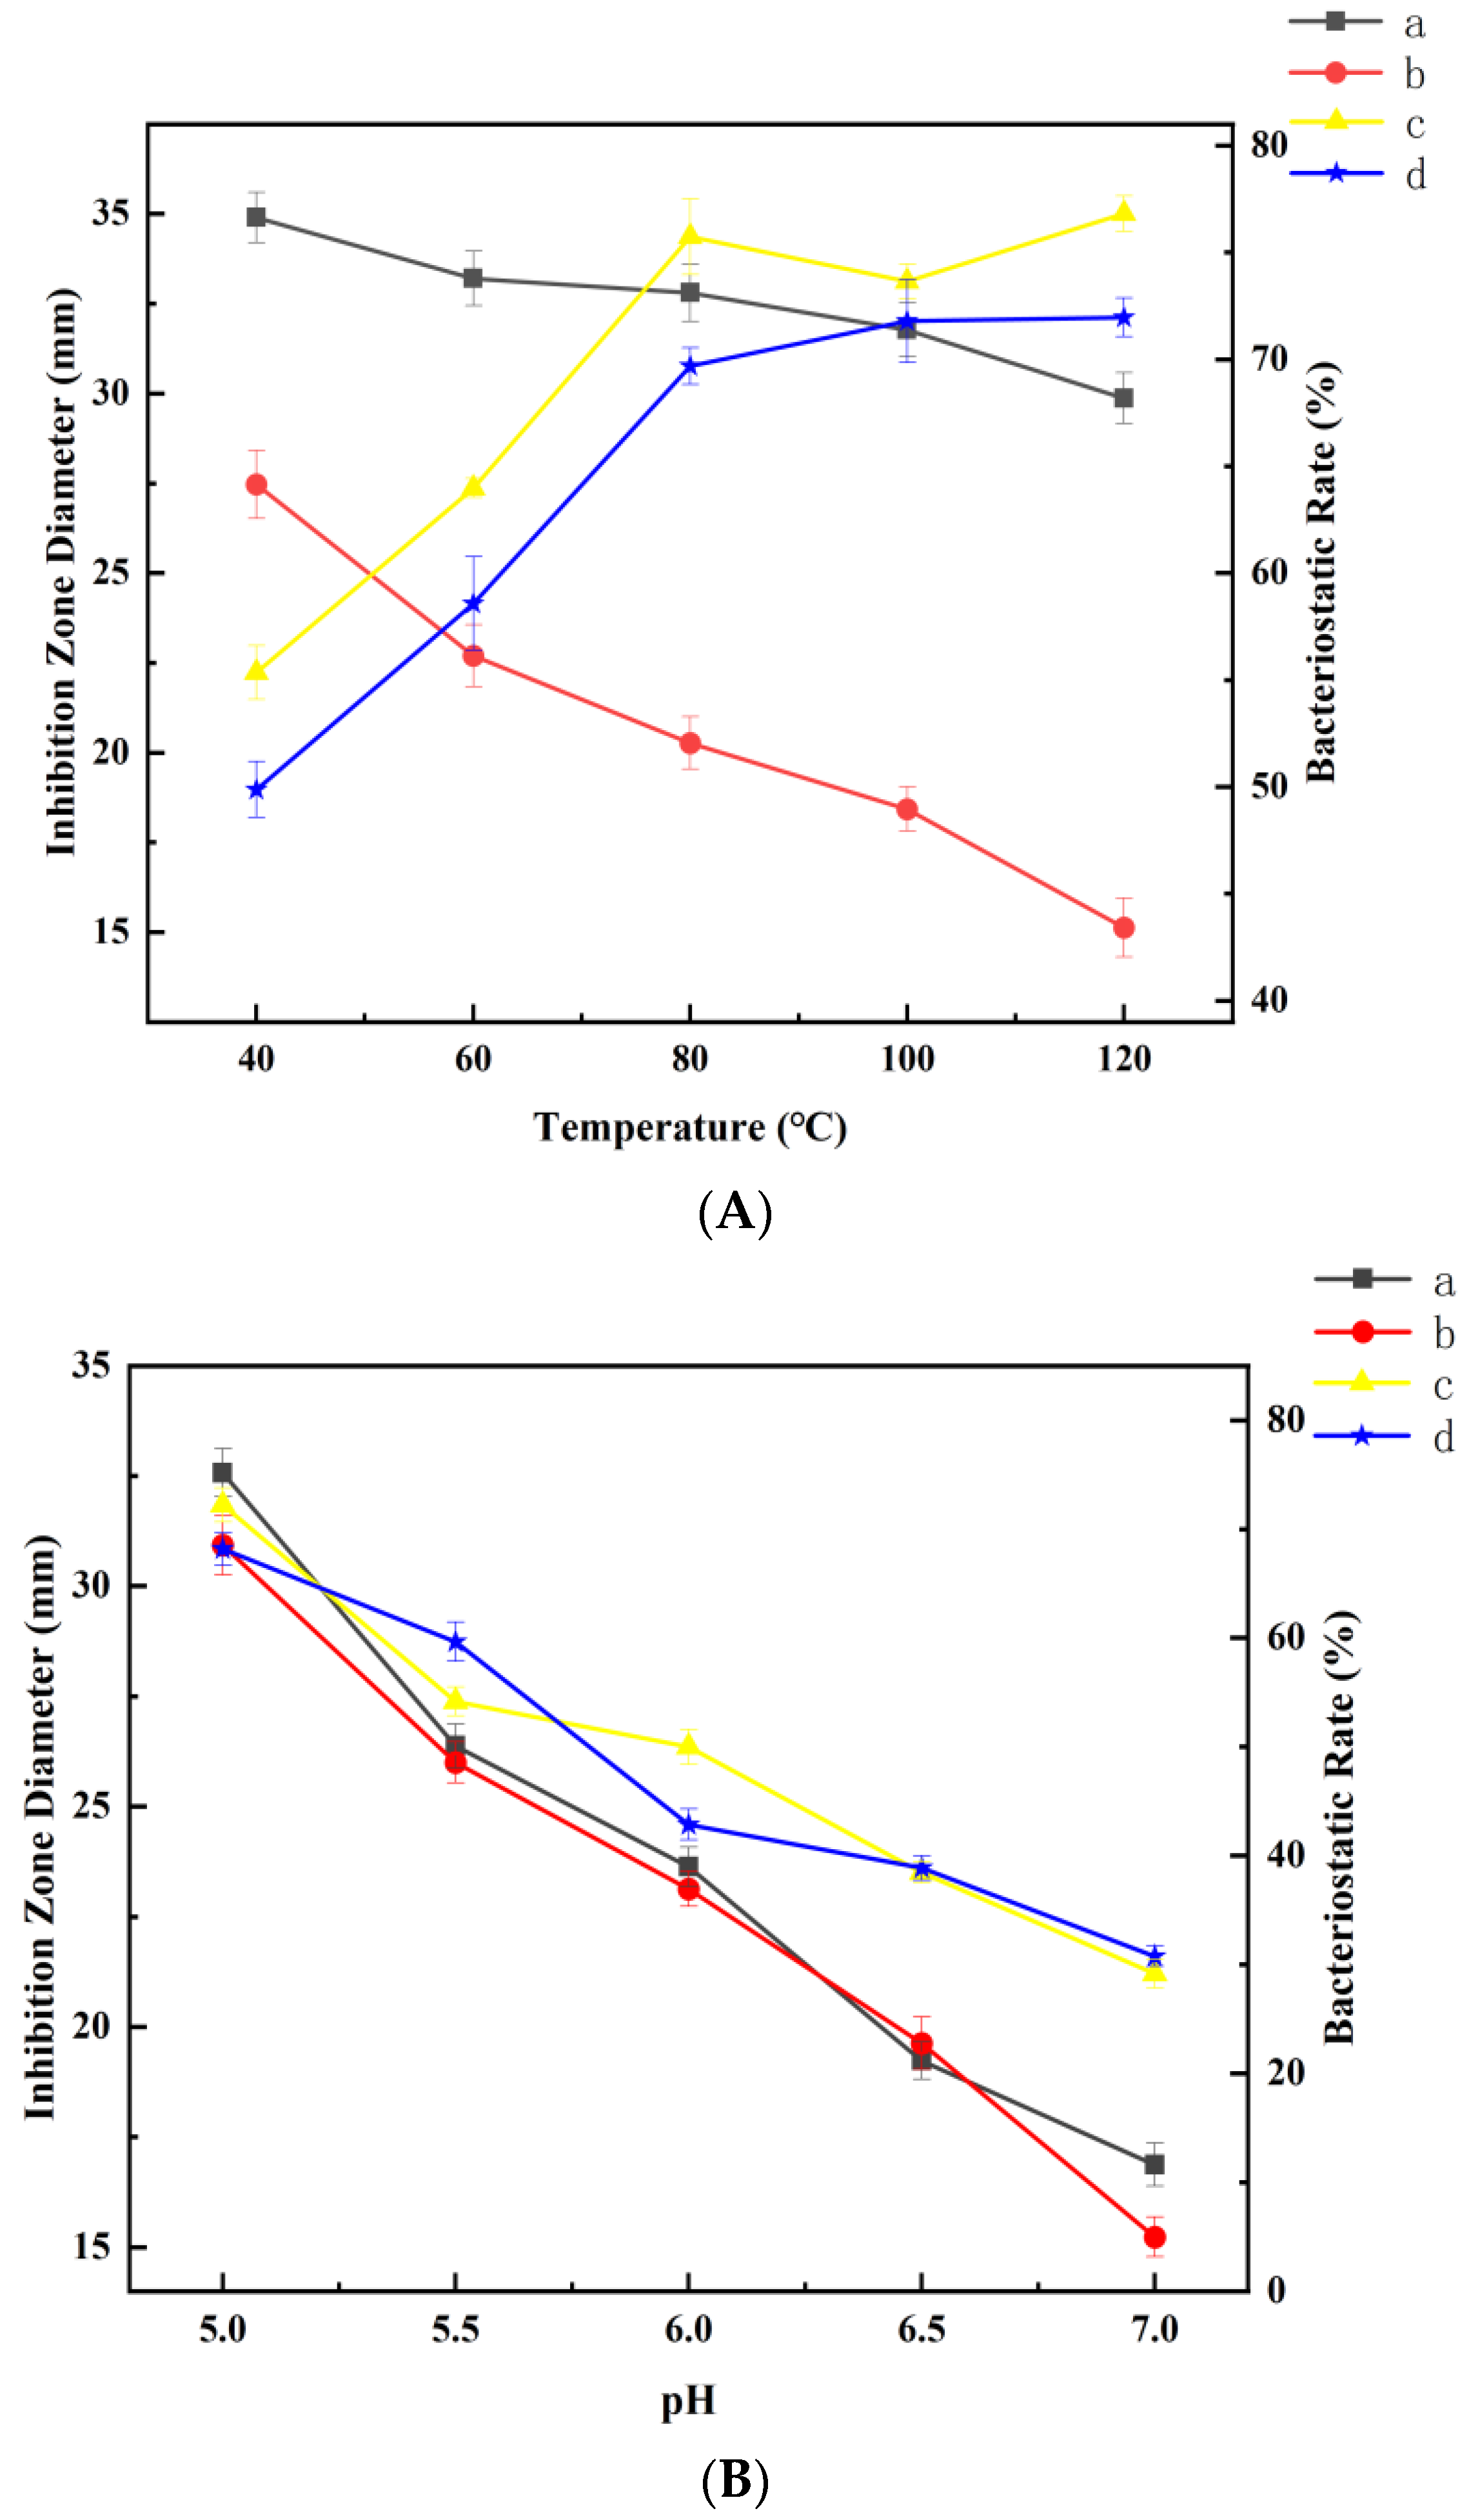
2.6.2. Effect of Temperature on Antibacterial Stability

In this experiment, two representative bacteria were selected as the test organisms: a Gram-positive bacterium, S. aureus, and a Gram-negative bacterium, E. coli. The airtight CEO and microcapsules were placed at 40, 60, 80, 100 and 121 °C for 20 min and 0.85% saline at the same temperature was used as a control. The diameter of the inhibition circle of CEO was measured by injecting 100 µL of CEO in the center of the Oxford cup and incubating at 37 °C for 24 h. For the microencapsulation group, we used the bacteriostatic rate as the index of its bacteriostatic stability. Bacteriostatic rate refers to the percentage of reduced colony population in the experimental group after exposure to the test substance compared to the control group. After heating, 100 µL of the sample solution was added to the sterile plates by the culture medium infusion method, with 100 µL of 107 CFU/mL bacterial suspension added into the sterile plates for incubation simultaneously [41], and then TSA was poured in. The control plate was inoculated with 0.85% saline in the same way. All plates were nurtured at 37 °C for 24 h. The number of colonies was then counted and the bacteriostatic rate was calculated according to Equation (4):
Q = A B A × 100
where Q is the inhibition rate of microcapsules, A is the mean colony forming unit (CFU/mL) of the control group and B is the mean colony forming unit (CFU/mL) of the sample group.

2.6.3. Effect of pH on Antibacterial Stability

The pH of TSA and saline were adjusted to 5.0, 5.5, 6.0, 6.5 and 7.0 with 0.1 mol/L hydrochloric acid and 0.1 mol/L sodium hydroxide. For CEO, the diameter of the inhibition circle was determined by Oxford cup method and 0.85% saline supplied to the same pH of TSA instead of oil was used as a control group. The diameter of the microbial inhibition zone was measured after 24 h of incubation at 37 °C. Microcapsules were sterilized and prepared at a concentration of 20 mg/mL; 100 μL of the above treatment solution was poured into the sterile plate along with 100 μL of 107 CFU/mL bacterial suspension and then TSA was introduced. Saline (0.85%) of different pH values was used instead of the sample solution as the control group.

2.7. Statistical Analysis

All experiments were replicated at least three times for each treatment. Values are reported as mean ± standard deviation (SD). Mean analysis was set at p < 0.05. p values < 0.05 were regarded as significant, calculated using SPSS 26.0 software.

3. Results and Discussion

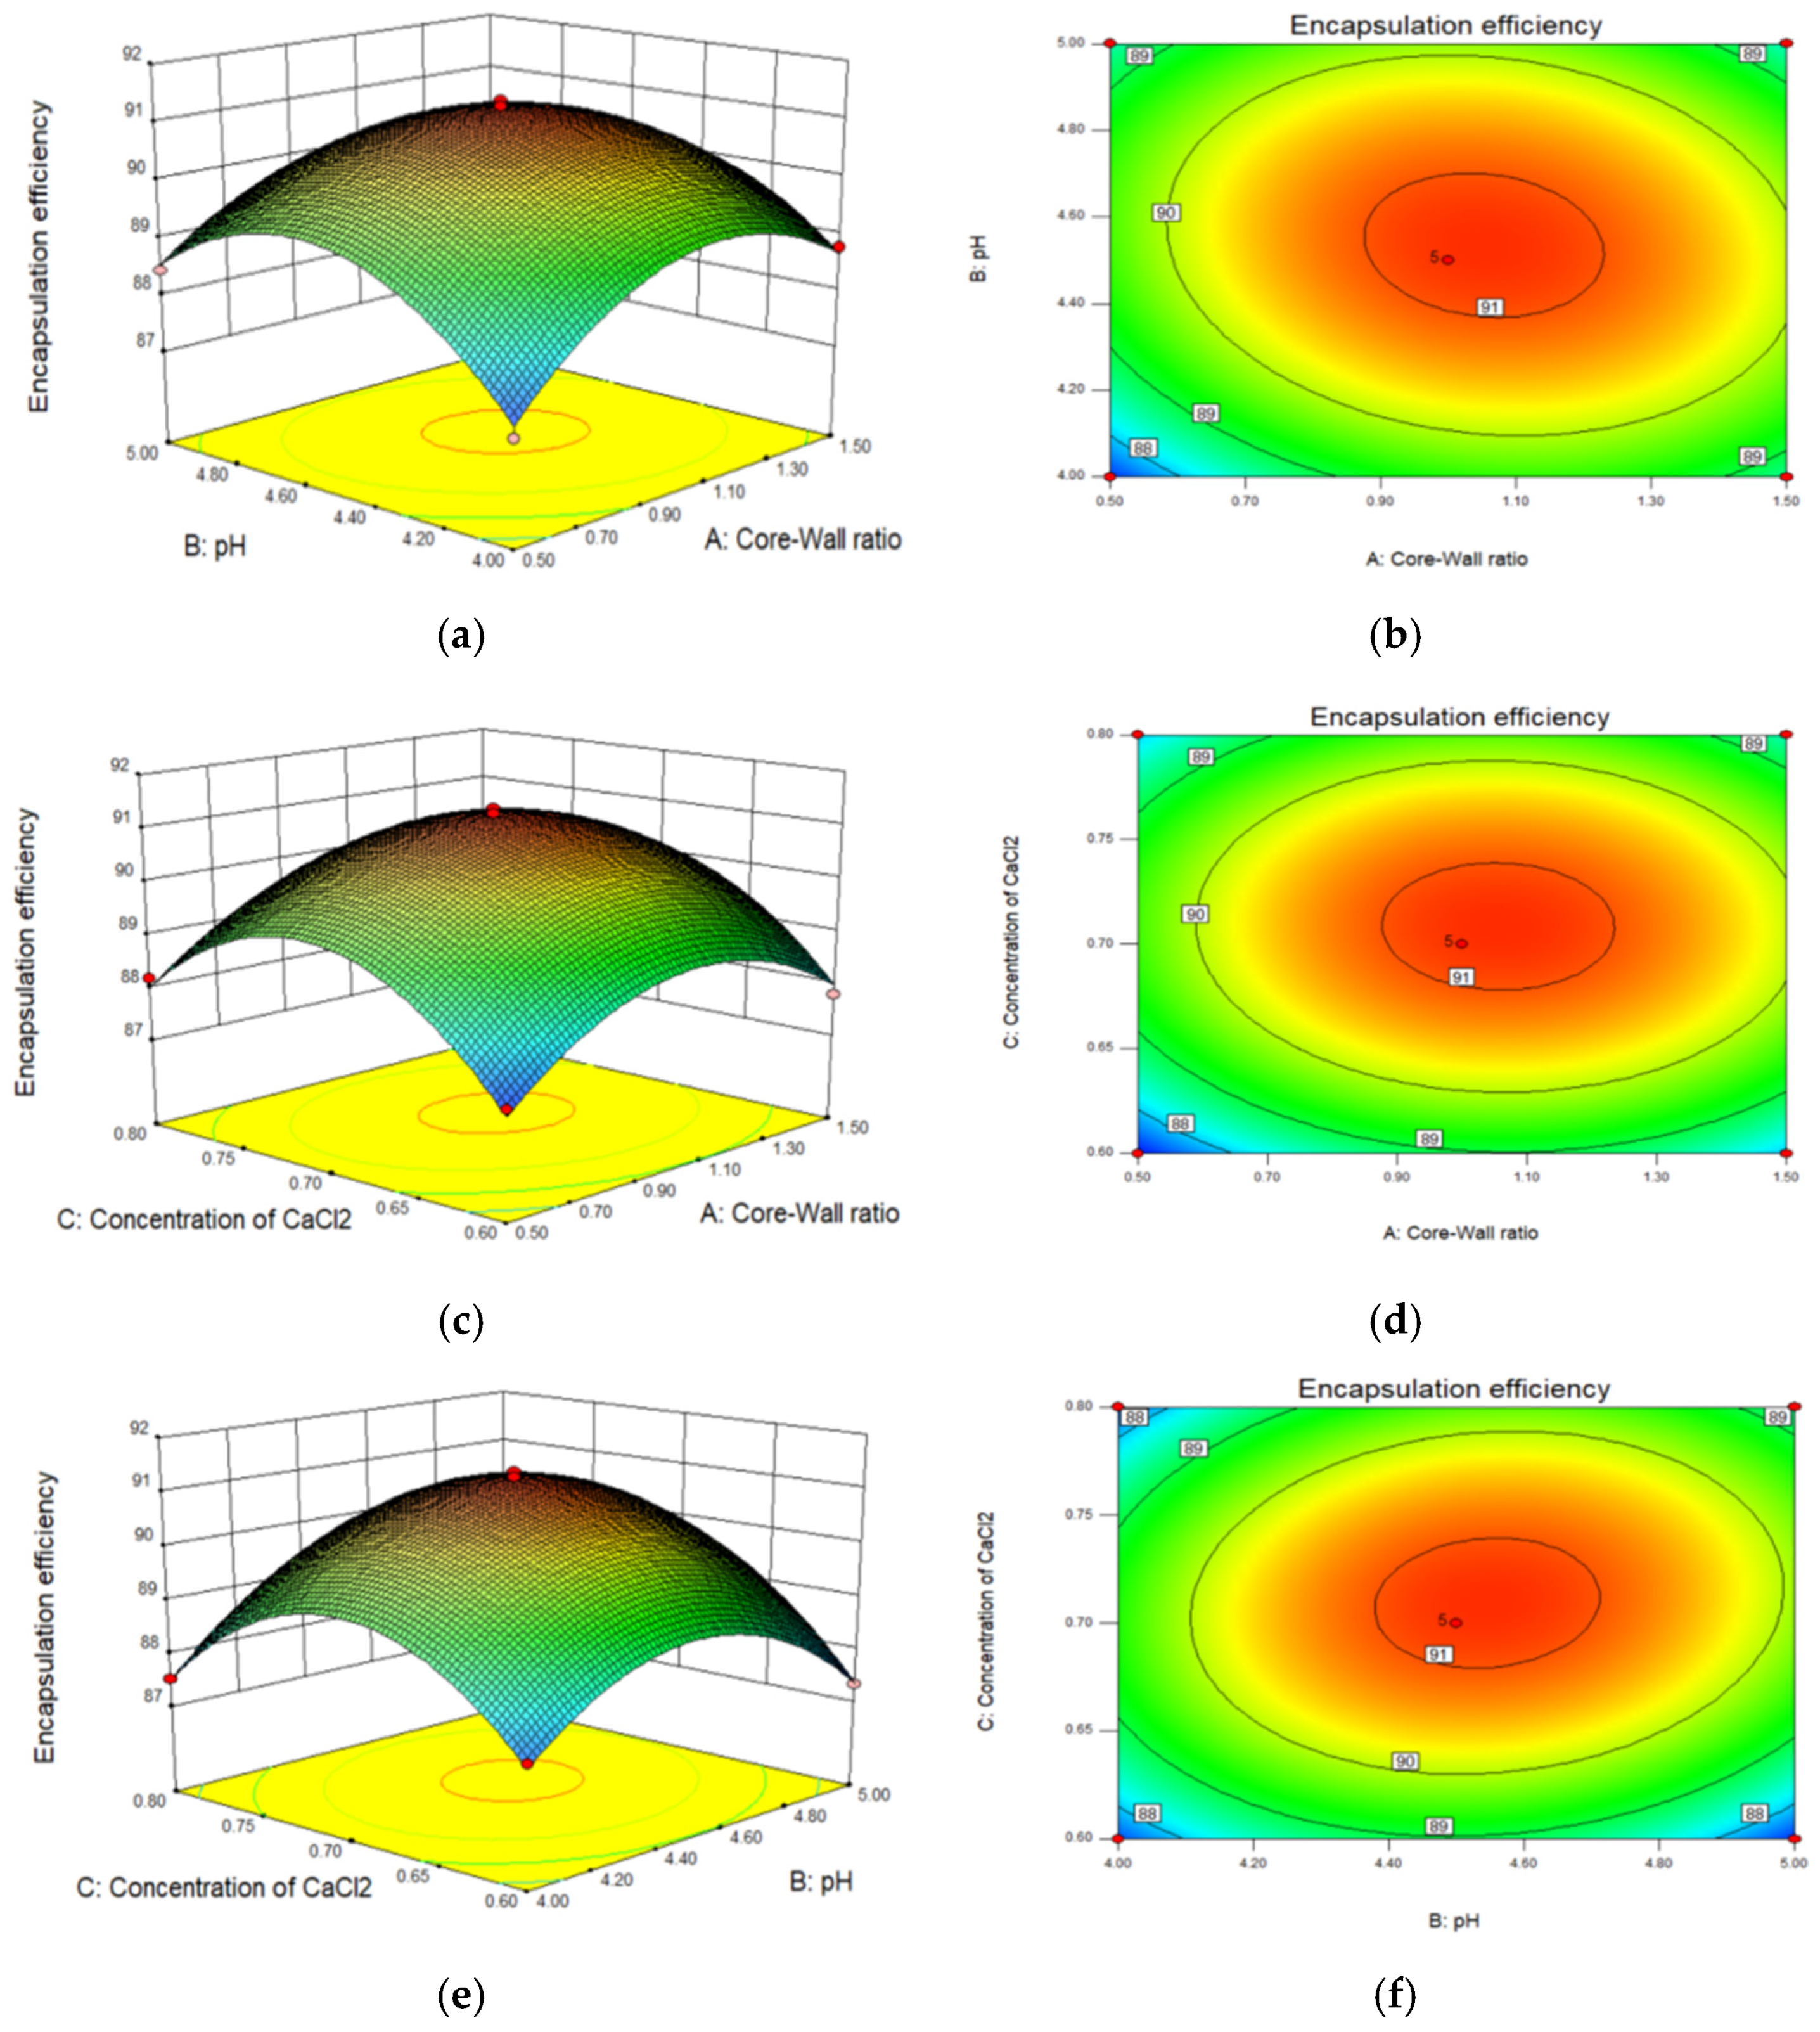
3.1. Optimization of CEO Microcapsules by RSM

The three independent variables were established according to the single-factor experiments. Meanwhile, the conditions for the preparation of CMS were optimized using RSM, with the EE as the optimization index; the experimental design and related results are shown in Table 2, where the EE varied between 87.15% and 91.35%.
The regression equation describing the mathematical relationship between the independent and response variables is indicated in Equation (5):
Y = 91.14 + 0.31 × A + 0.25 × B + 0.33 × C − 0.34 × A × B − 0.07 × A × C + 0.31 × B × C − 1.35 × A2 − 1.54 × B2 − 1.87 × C2
Analysis of variance (ANOVA) was used to evaluate the significance of each coefficient of the quadratic polynomial model. The Model F-value of 87.55 implies the model is significant. There is only a 0.01% chance that a large “Model F-value” could occur due to noise. According to Table 3, it can be seen that the regression coefficient (R2) of the model is 0.9912, indicating that only 0.89% of the variables cannot be explained by the model, and the p-value is less than 0.0001, indicating that the model is significant and appropriate.
The Radj2 value of the model is 0.9799 (reasonably consistent with PRED R2 0.9025), suggesting that the model predicts well and the actual value is closer to the predicted value. The signal-to-noise ratio ADEQ accuracy is 22.985 > 4, demonstrating that the signal is adequate and the model fits well with EE (%). In addition, the highly significant F-value (p < 0.0001) and non-significant fit (p > 0.05) also denote that the model is excellent and the error is negligible. Table 3 also reveals that the linear and quadratic terms of core-to-wall ratio (X1), pH (X2) and CaCl2 concentration (X3), the cross-correlation of core-to-wall ratio and pH (X12) and the interaction between pH and CaCl2 concentration (X23) had a significant effect on the encapsulation rate (p < 0.05). As is known, the F-value can determine the effect of each factor on the response variable and the larger the F-value, the greater the effect on the response variable.
In this study, the variables that have a higher effect on the encapsulation rate are the quadratic term of CaCl2 concentration (X32), the quadratic term of pH (X22) and the quadratic term of core-to-wall ratio (X12). This is because the core-to-wall ratio affects the balance of macromolecular charges and the strength of the electrostatic interactions driving the formation of complexes between the two biopolymers. In addition, a moderate pH contributes to the complete electrostatic interaction between the positively charged HACC and the negatively charged GA, leading to zero total electrostatic. Increasing the concentration of the solidification agent CaCl2 up to a certain limit will enhance the drug encapsulation rate, since it enhances the solidification of the polymer and the denseness of the insoluble dense matrix formed, thus producing the ability to encapsulate substantial amounts of drug [42], while the presence of high concentration CaCl2 solution negatively affects the EE [43]. Response surface and contour plots show the effect of the interaction of three factors, core-to-wall ratio (X1), pH (X2) and CaCl2 concentration (X3), on EE. As shown in Figure 1a,b, with the increase in core-to-wall ratio and pH, EE exhibits a trend of increasing and then decreasing, the response surface plot of the interaction is steeper and the contour plot is elliptical, indicating that the interaction of the two has a significant effect on EE.
The embedding rate reached the highest point when the core-to-wall ratio was 1:1. Figure 1c,d shows that the contour plots are circular, indicating that the interaction between core-to-wall ratio and CaCl2 concentration has no significant effect on EE, which is consistent with the results presented in Table 3. Additionally, the interaction shown in Figure 1e,f, i.e., between pH and CaCl2 concentration, is similar to the interaction between core-to-wall ratio and pH, which has a significant effect on EE. The optimized EE was achieved when the pH value was 4.54. Therefore, the optimal process parameters for the microcapsule preparation process were as follows: core-to-wall ratio of 1.05:1, pH 4.54 and CaCl2 solution mass concentration of 0.71 wt%, with a theoretical EE of 91.18%, which was consistent with most of the encapsulation efficiencies of the drug-laden microcapsules prepared by the composite coalescence method, provided that the maximum utilization rate was satisfied. The encapsulation conditions of 1:1 core-to-wall ratio, pH 4.5 and 0.7 wt% mass concentration of CaCl2 solution were chosen to facilitate the operation. After six experiments, the actual encapsulation rate of the resulting microcapsules was 90.72 ± 1.89% and the EE predictions were in excellent agreement with the observed values, suggesting that the model was feasible.

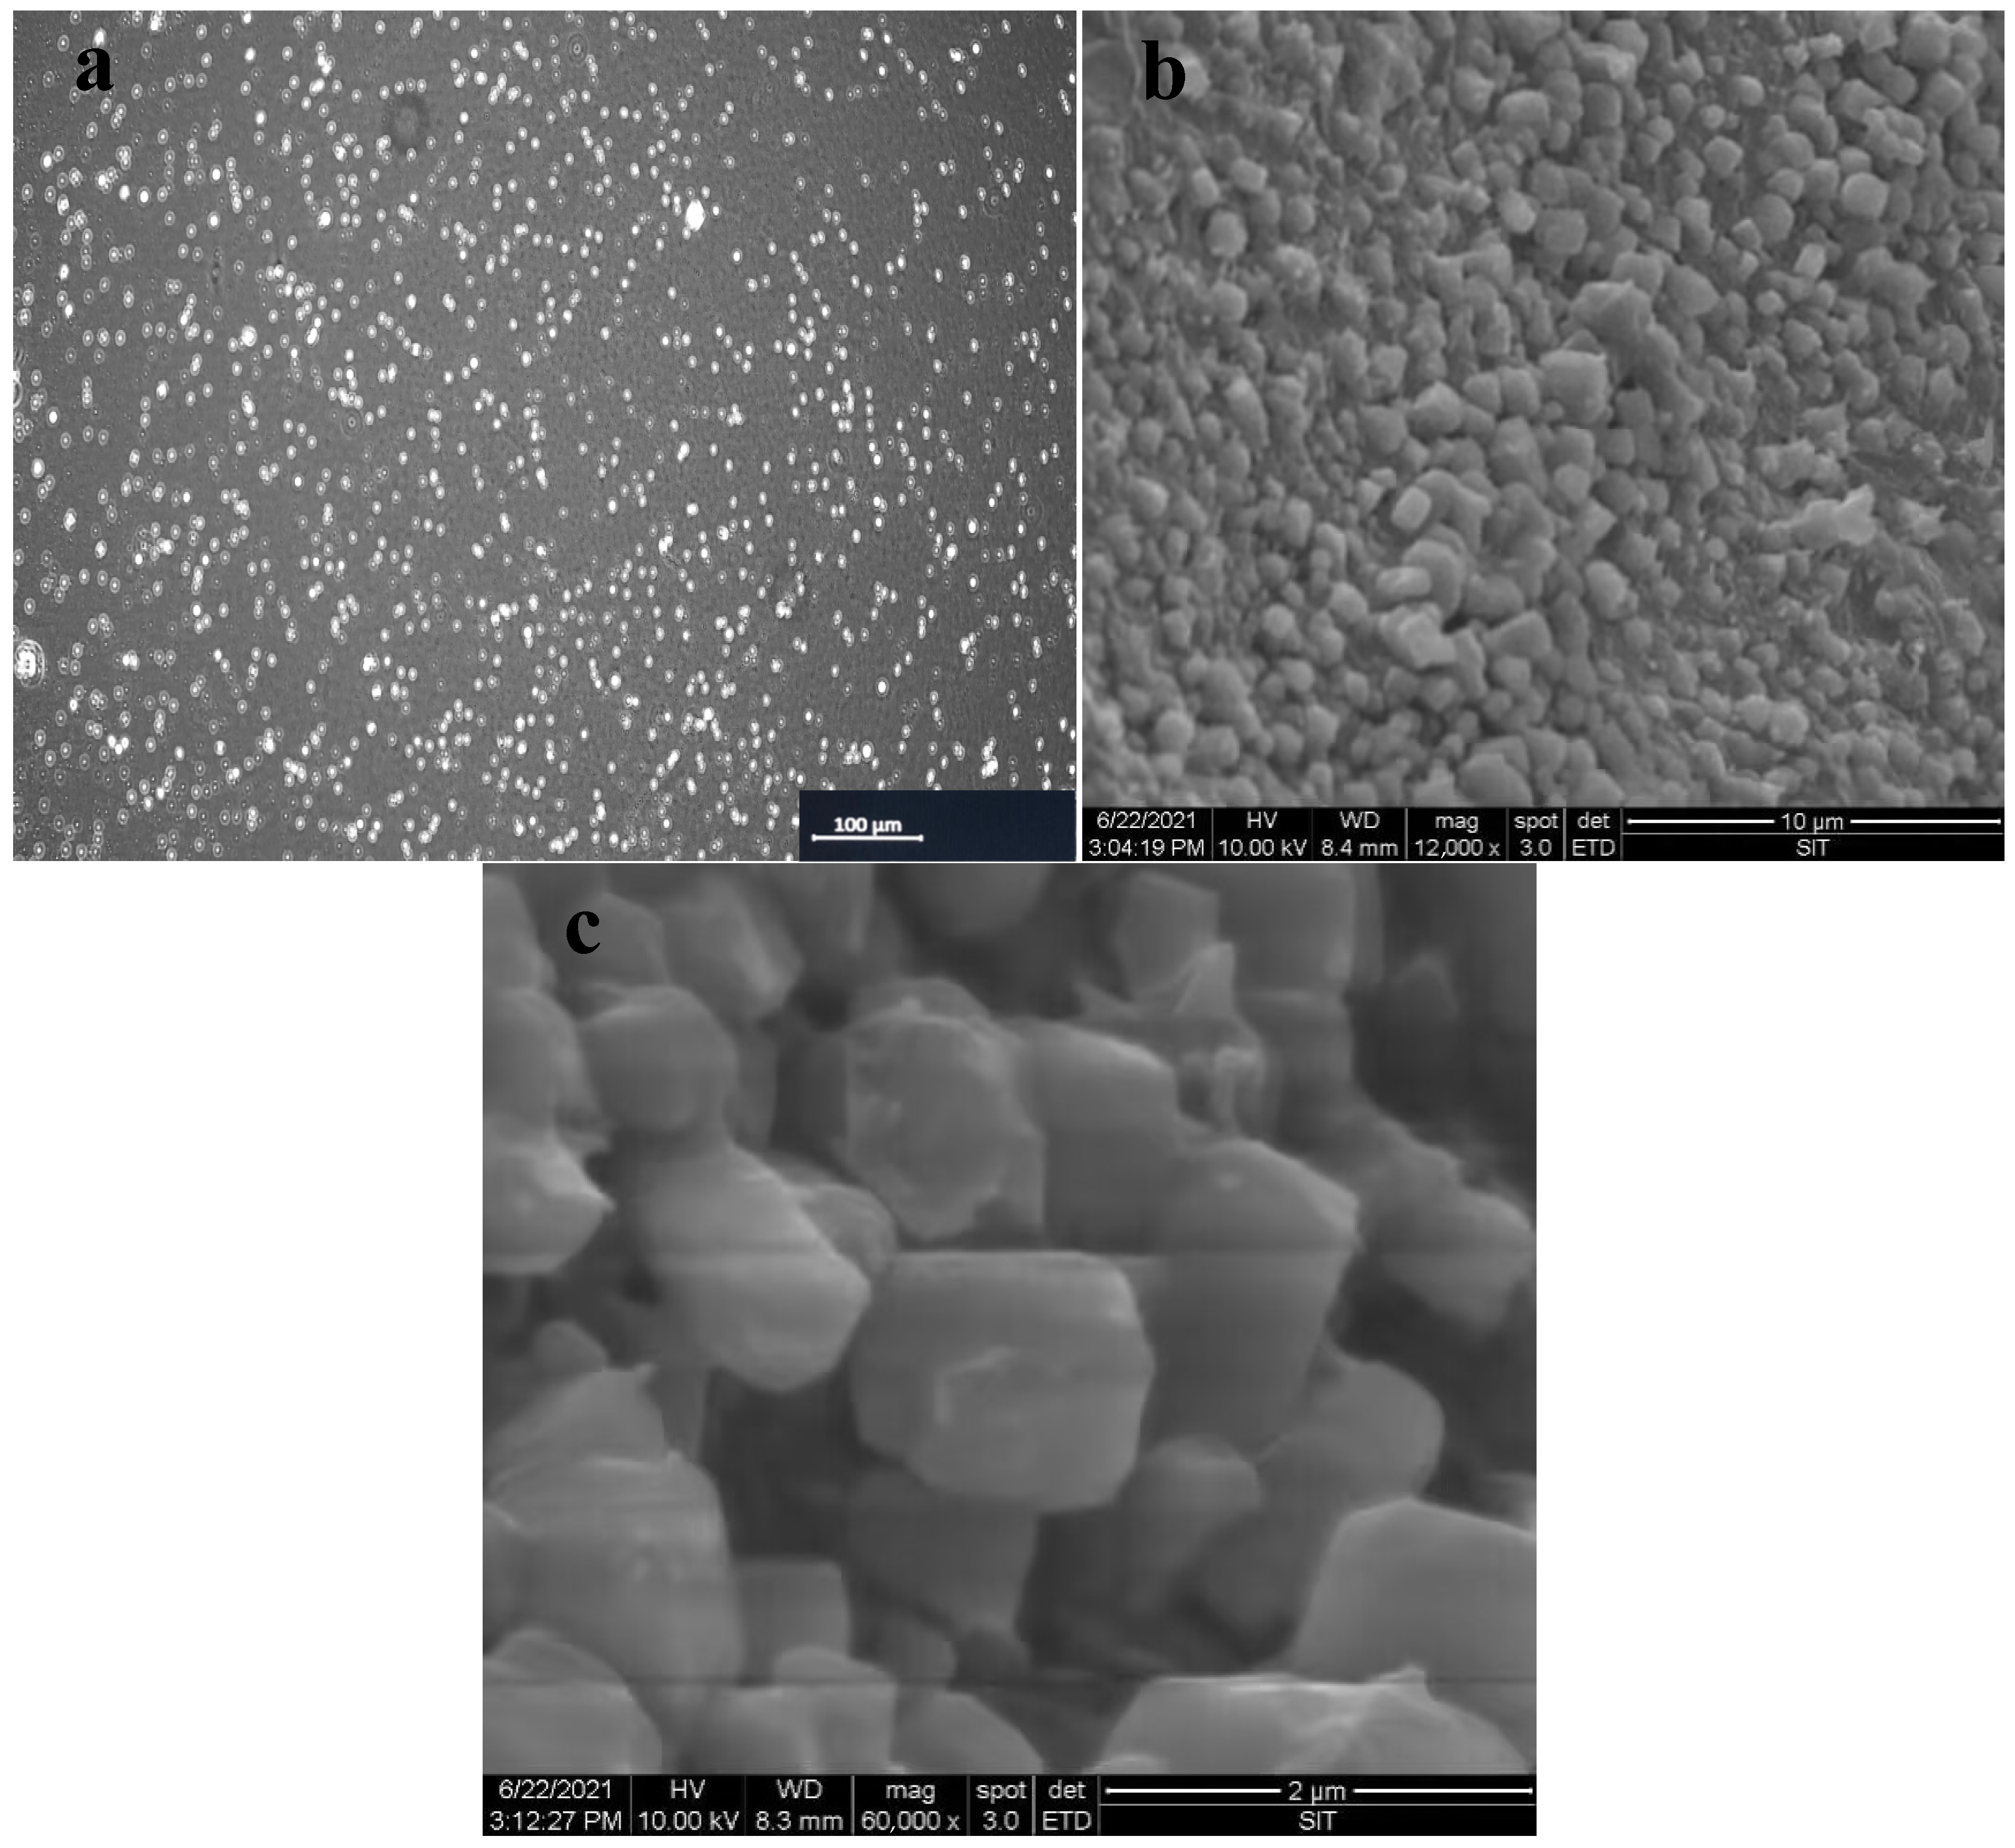
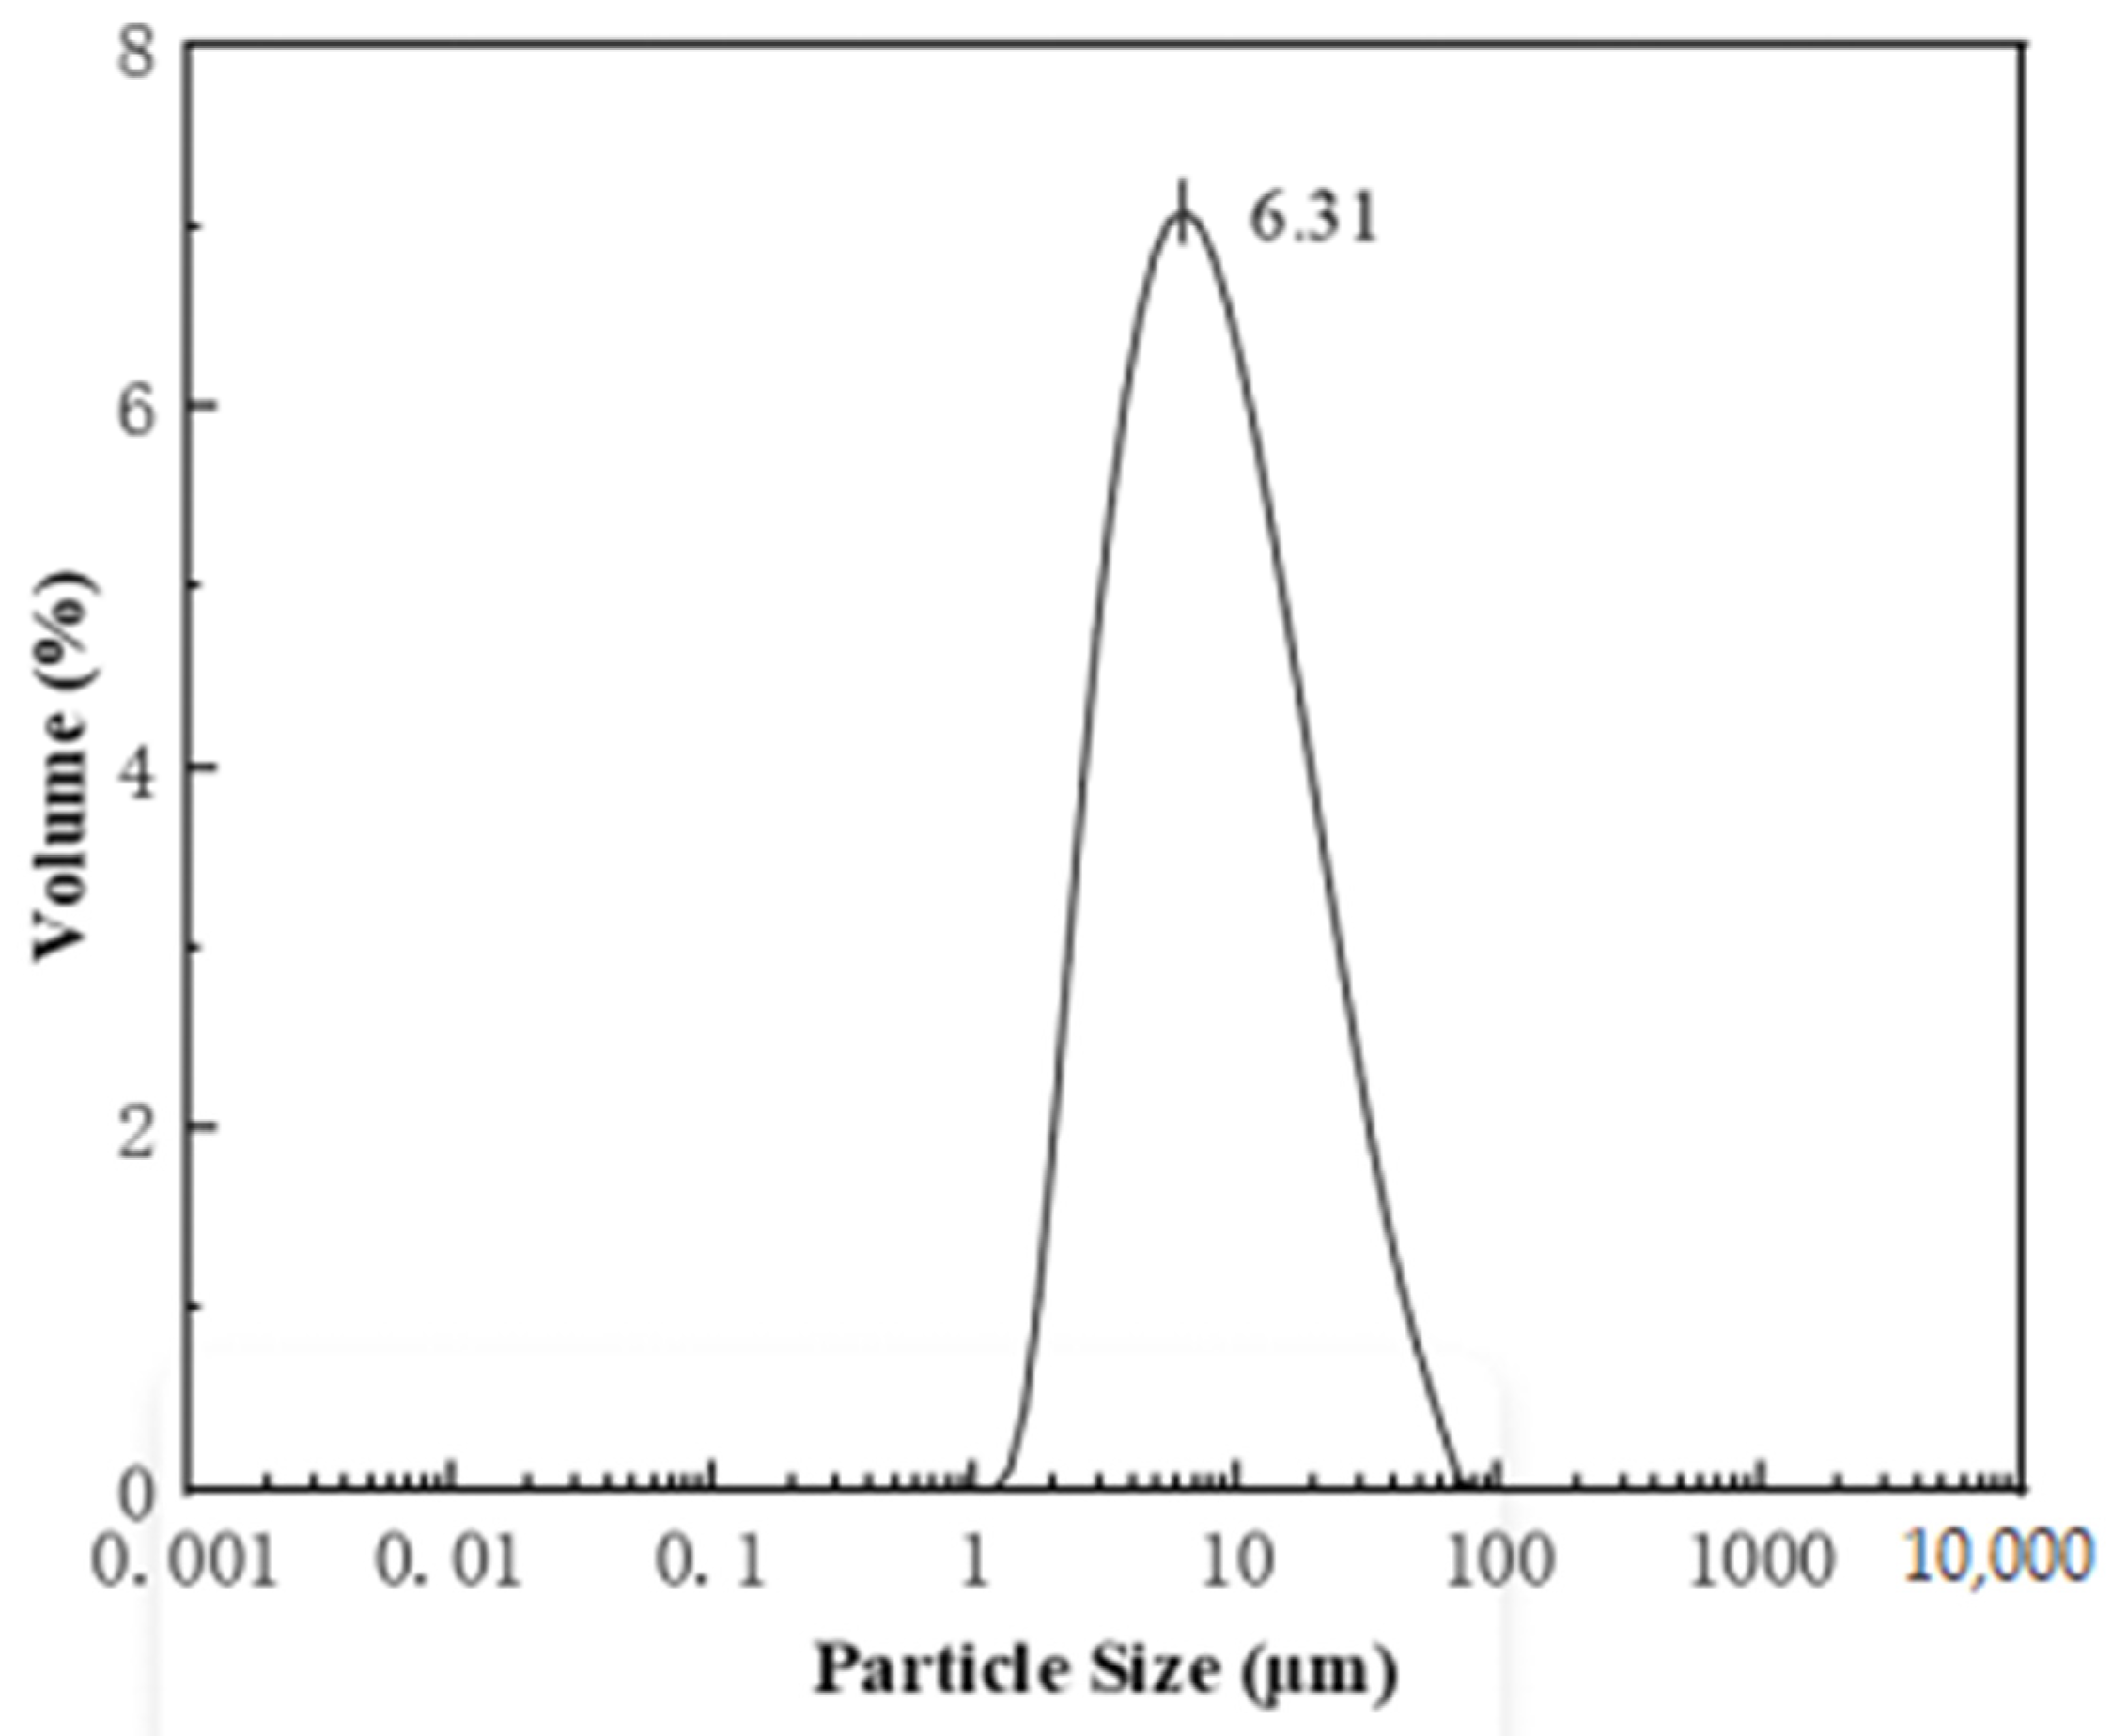
3.2. Morphology and Particle Size Distribution of CMS

The microscopic and SEM images of the CMS prepared under optimal conditions are shown in Figure 2. It can be seen that the microcapsules were subspherical with a smooth surface and no observable obvious pores, but the outer wall was slightly wrinkled and the microcapsules were agglomerated and connected into sheets between them. This may be due to the evaporation of water inside during the freeze-drying process and the crumpling of the wall material, causing depression [44].
However, the overall structure of the microcapsules remained intact, indicating that the microcapsule had good rigidity which could protect the CEO from the influence of air, light and high temperature, thus contributing to the stability of the CEO. At the same time, the particle size distribution of the microcapsules of CEO measured by laser particle size analyzer (Figure 3) ranged from 1.06 to 81.01 μm, with an average size of 6.31 μm. This particle size is similar to that measured for many essential oil microcapsules [13,45,46]. The image was normally distributed and relatively narrow, clarifying that the microcapsules prepared under optimal process conditions were of uniform size, which was consistent with the results in the literature [47].
The significantly larger particle size compared to the freeze-dried dry capsule is mainly because the wall materials prepared from the microcapsules were hydrophilic polymers with strong swelling properties [48], which also indicated that they can be easily redispersed into the aqueous media.

3.3. Zeta Potential

According to the principle of complex condensation reaction, when the potential is zero, the positive and negative charges on the molecules of chitosan quaternary ammonium salt and acacia gum are equal and the pH at this time is the optimized condition for complex condensation. As can be seen from Figure 4, the optimum pH of the compound formed by chitosan quaternary ammonium salt and gum acacia is about 4.8 and the Zeta potential value of the microcapsule under the optimum preparation condition obtained in this experiment is 5.97 mV at pH 4.5, which is closest to 0 mV at 4.8. Meanwhile, the Zeta potential range of the microcapsules in this study is close to the value studied by Chloe Butstraen and colleagues [49]. When pH is 4.8, Zeta potential is always positive because the dissociation of -COOH in gum arabic is limited, which affects the electrostatic recombination with -NH3+ in chitosan quaternary ammonium salt. When pH is between 4.5 and 5.0, Zeta potential of microcapsule solution changes from positive to negative because, with the increase in pH, acacia gradually dissociates COO and the compound effect with chitosan quaternary ammonium salt is gradually strengthened, gradually changing the potential from positive to negative. When pH is between 7 and 9, Zeta potential of microcapsule solution is about −20 mV and remains stable.

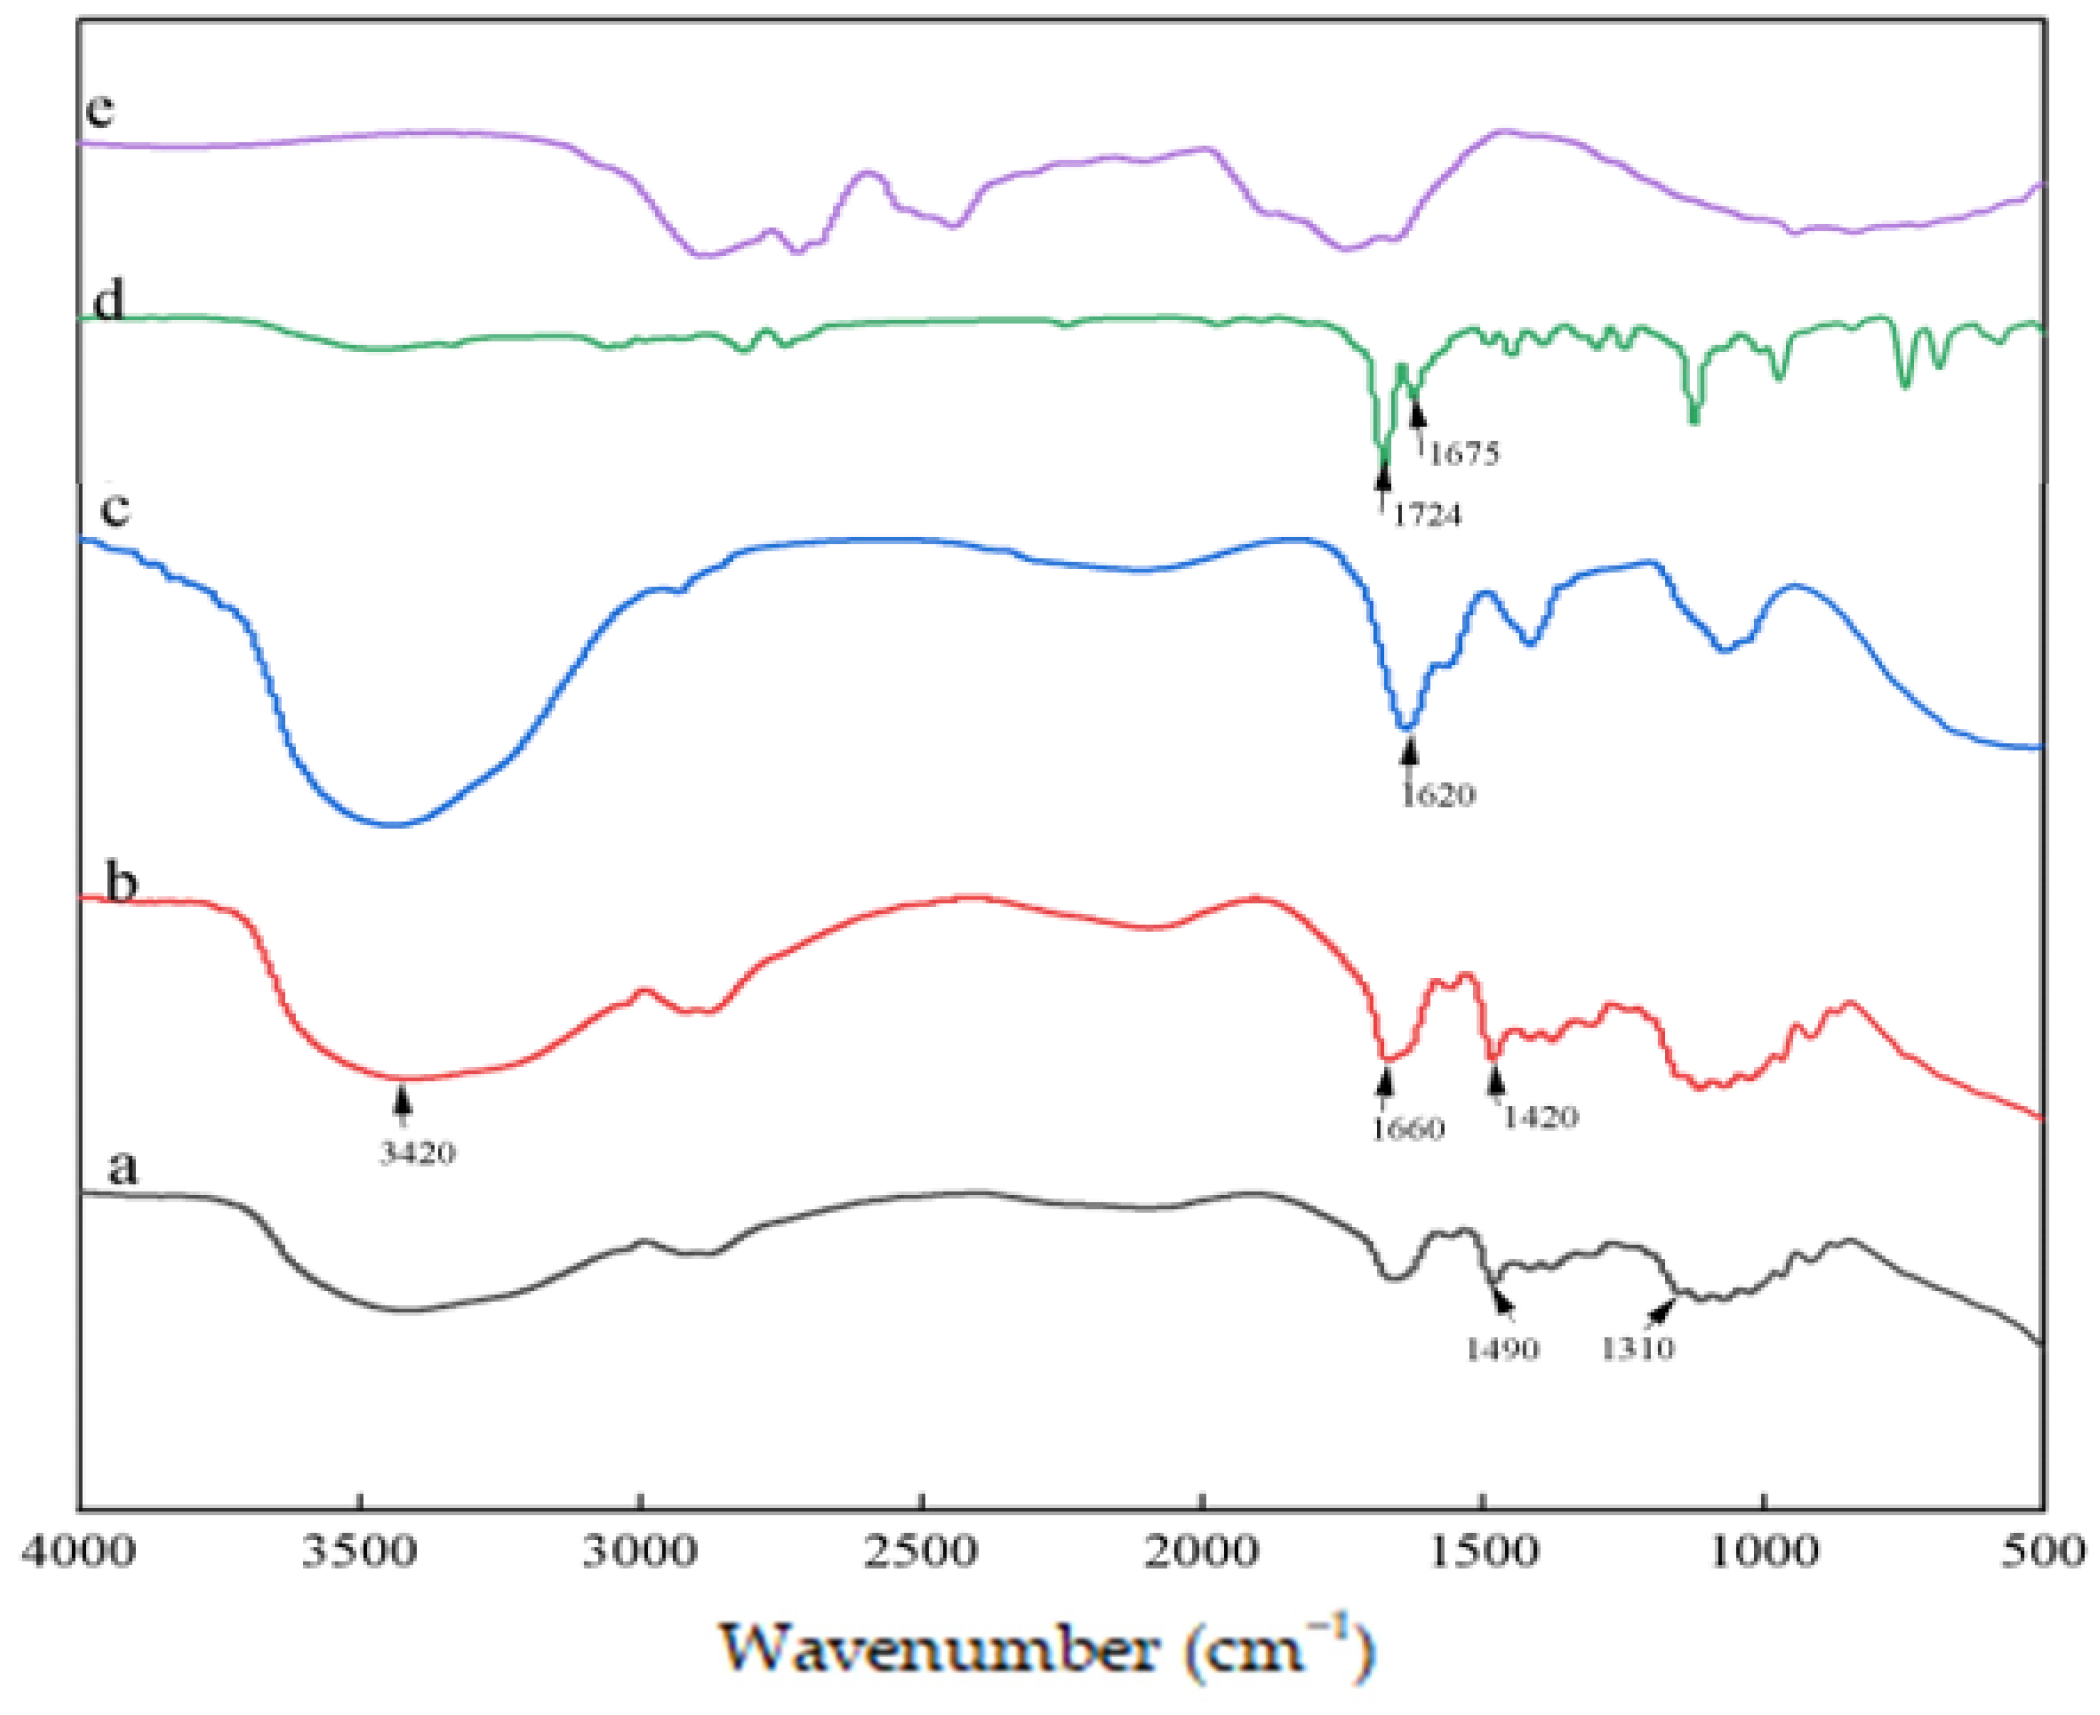
3.4. FTIR Determination of CMS

FTIR studies further validated the successful preparation of CMS. Figure 5 illustrates the FTIR spectra of HACC (a), GA (b), BMS (c), CEO (d) and CMS (e). In the FTIR spectrum of HACC (Figure 5a), the peaks at 1490 cm−1 and 1310 cm−1 were attributed to the bending vibration of -CH3 and the stretching vibration of C-N+ of the quaternary ammonium group, respectively. In the FTIR spectrum of GA (Figure 5b), the two characteristic peaks formed by the symmetric and asymmetric stretching vibrations of carboxylic acid appeared at 1660 cm−1 and 1420 cm−1, respectively. When comparing the IR spectrograms of HACC and GA, the characteristic absorption peak of GA at 1660 cm−1 was shifted to 1620 cm−1 in the IR spectrogram of BMS (Figure 5c), indicating that the complex condensate was formed by the electrostatic interaction between -C-N+ of HACC and -COO- of GA, which shifted the association between the groups to the lower field [50].
Comparing the IR spectra of BMS as well as CEO (Figure 5d), the absorption peak of microcapsules (Figure 5e) diminished at 1724 cm−1 and showed a new stretching vibration peak near 2750 cm−1, which revealed that CEO was successfully encapsulated in microcapsules, mainly because 1724 cm−1 and 1675 cm−1 belonged to the -CH=O and C=C peaks of cinnamic acid, respectively. In addition, the absorption peak of CEO at 1625 cm−1 indicated that the composition of CEO contained small molecules of aromatic hydrocarbons such as aldehydes, phenols and ketones [51,52].

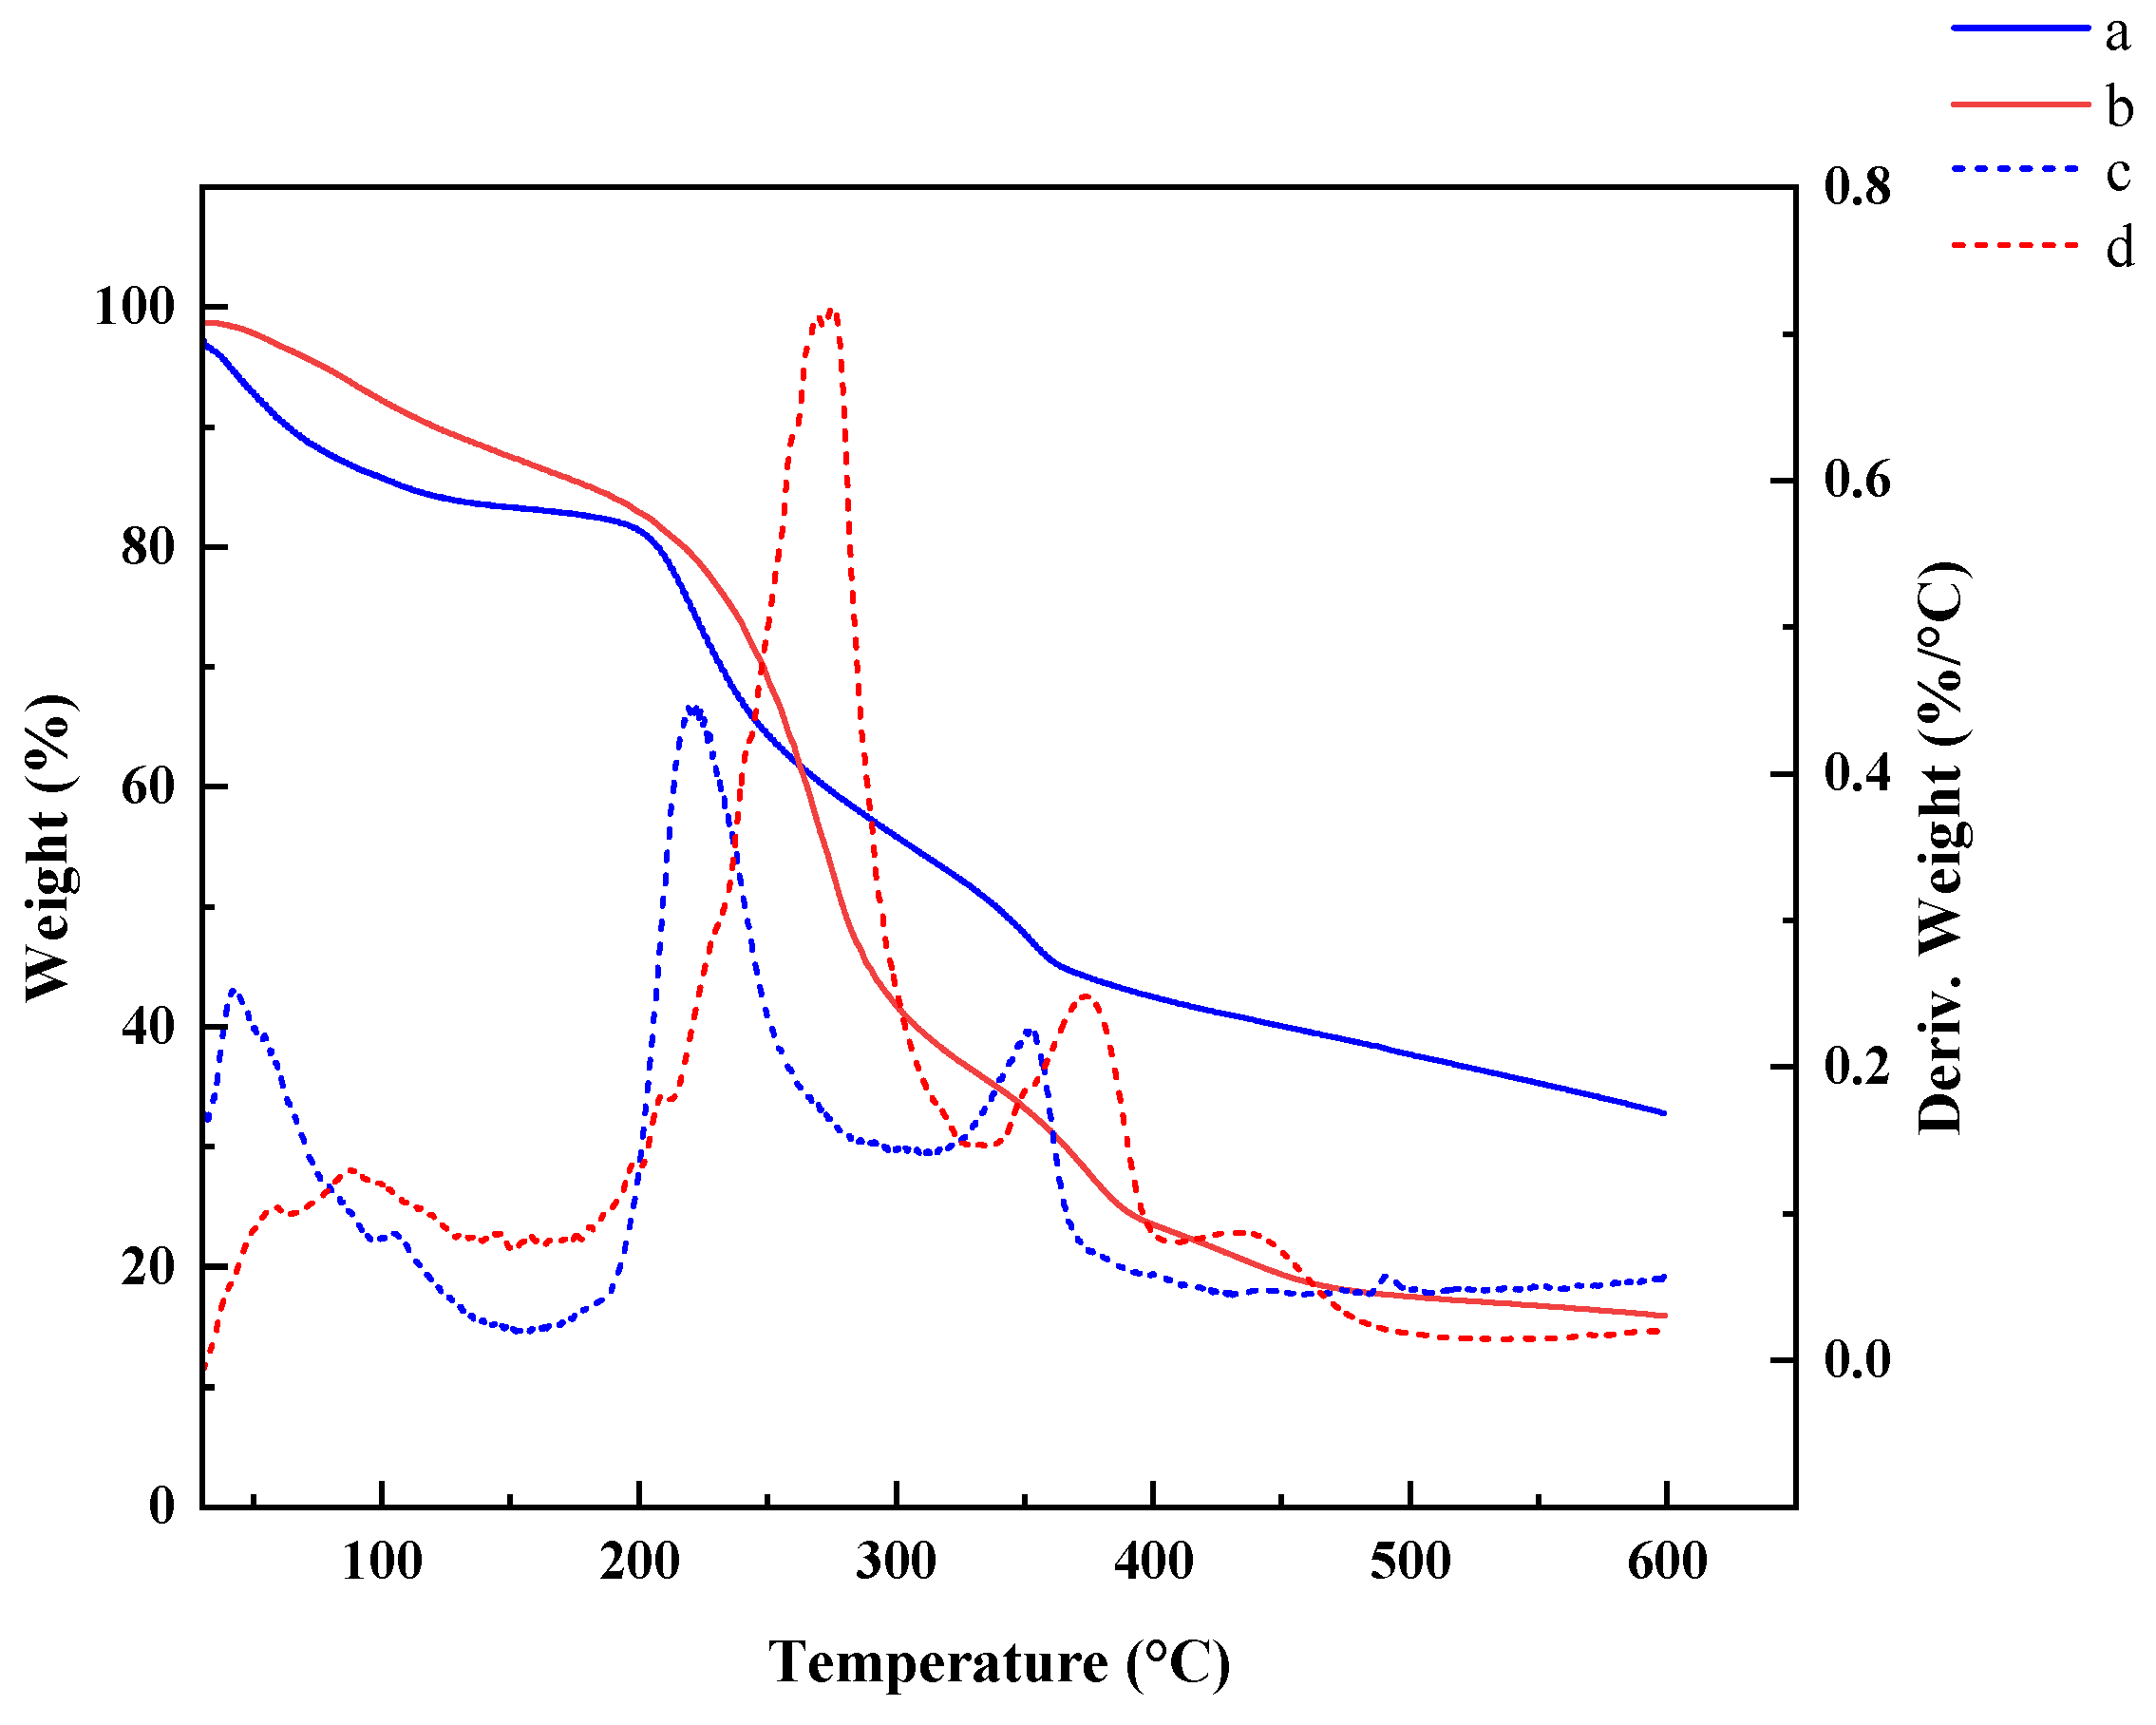
3.5. Thermal Stability Analysis of CMS

The thermal stability of the CMS was studied by thermogravimetric–differential thermal analysis and differential scanning calorimetry. As shown in Figure 6, significant thermal decomposition of CMS (a) and BMS (b) occurred during two temperature intervals: 189.59 to 277.32 °C and 318.35 to 404.66 °C. Both BMS and CMS showed thermal weight loss around 100 °C due to the departure of bound water [53]; the decrease in weight at temperatures above 100 °C was due to the evaporation of surface essential oils as the temperature reached the boiling point of the CEO. The significant reduction in weight of CMS around 269 °C was probably due to the release of its internal core material as a result of the decomposition of a portion of the wall material [43,54].
A new weight loss step in the microencapsulation of CEO near 374 °C could be explained by the decomposition associated with the wall material residues. Thus, the microencapsulation process significantly improved the thermal stability of the CEO. Differential scanning calorimetry (DSC) is a technique for measuring the power difference between the delivery substance and the reference substance in relation to temperature under programmed temperature control. Many substances undergo physicochemical changes such as melting, solidification, crystalline transformation, decomposition, chemistry, adsorption and desorption during heating or cooling and these physicochemical changes are accompanied by changes in the heat capacity of the system, thus producing thermal effects. Temperature has a significant effect on the stability of microcapsules and the change in temperature affects the properties of wall and core materials. It can be clearly observed from Figure 7 that BMS and CMS had obvious endothermic peaks at 50.7 °C and 71.9 °C, respectively, which indicated the evaporation of surface water. Secondly, when the temperature rose to 173.6 °C, the CEO surface essential oil volatilized and obvious endothermic peaks appeared because the temperature reached the boiling point. On the contrary, the DSC curve of CMS did not have the endothermic peak of CEO at this temperature.
At 247.0 °C and 265.5 °C, BMS and CMS showed an obvious exothermic peak due to partial decomposition of wall materials. Only at 294.3 °C did CMS produce essential oil volatilization due to partial decomposition of wall materials on the surface. The above results were consistent with the TG–DTA results. The results showed that the complete or partial disappearance of the guest peak after inclusion was usually regarded as a sign that the guest was encapsulated in the microcapsule [55], so the CEO was successfully encapsulated in HACC–GA. Meanwhile, the gentle endothermic peak of CMS still appeared at 383.4 °C and 439.4 °C, indicating that the essential oil achieved a slow-release effect inside the microcapsules. The combined TG–DTA and DSC analysis demonstrated that the CMS had ideal thermal stability.

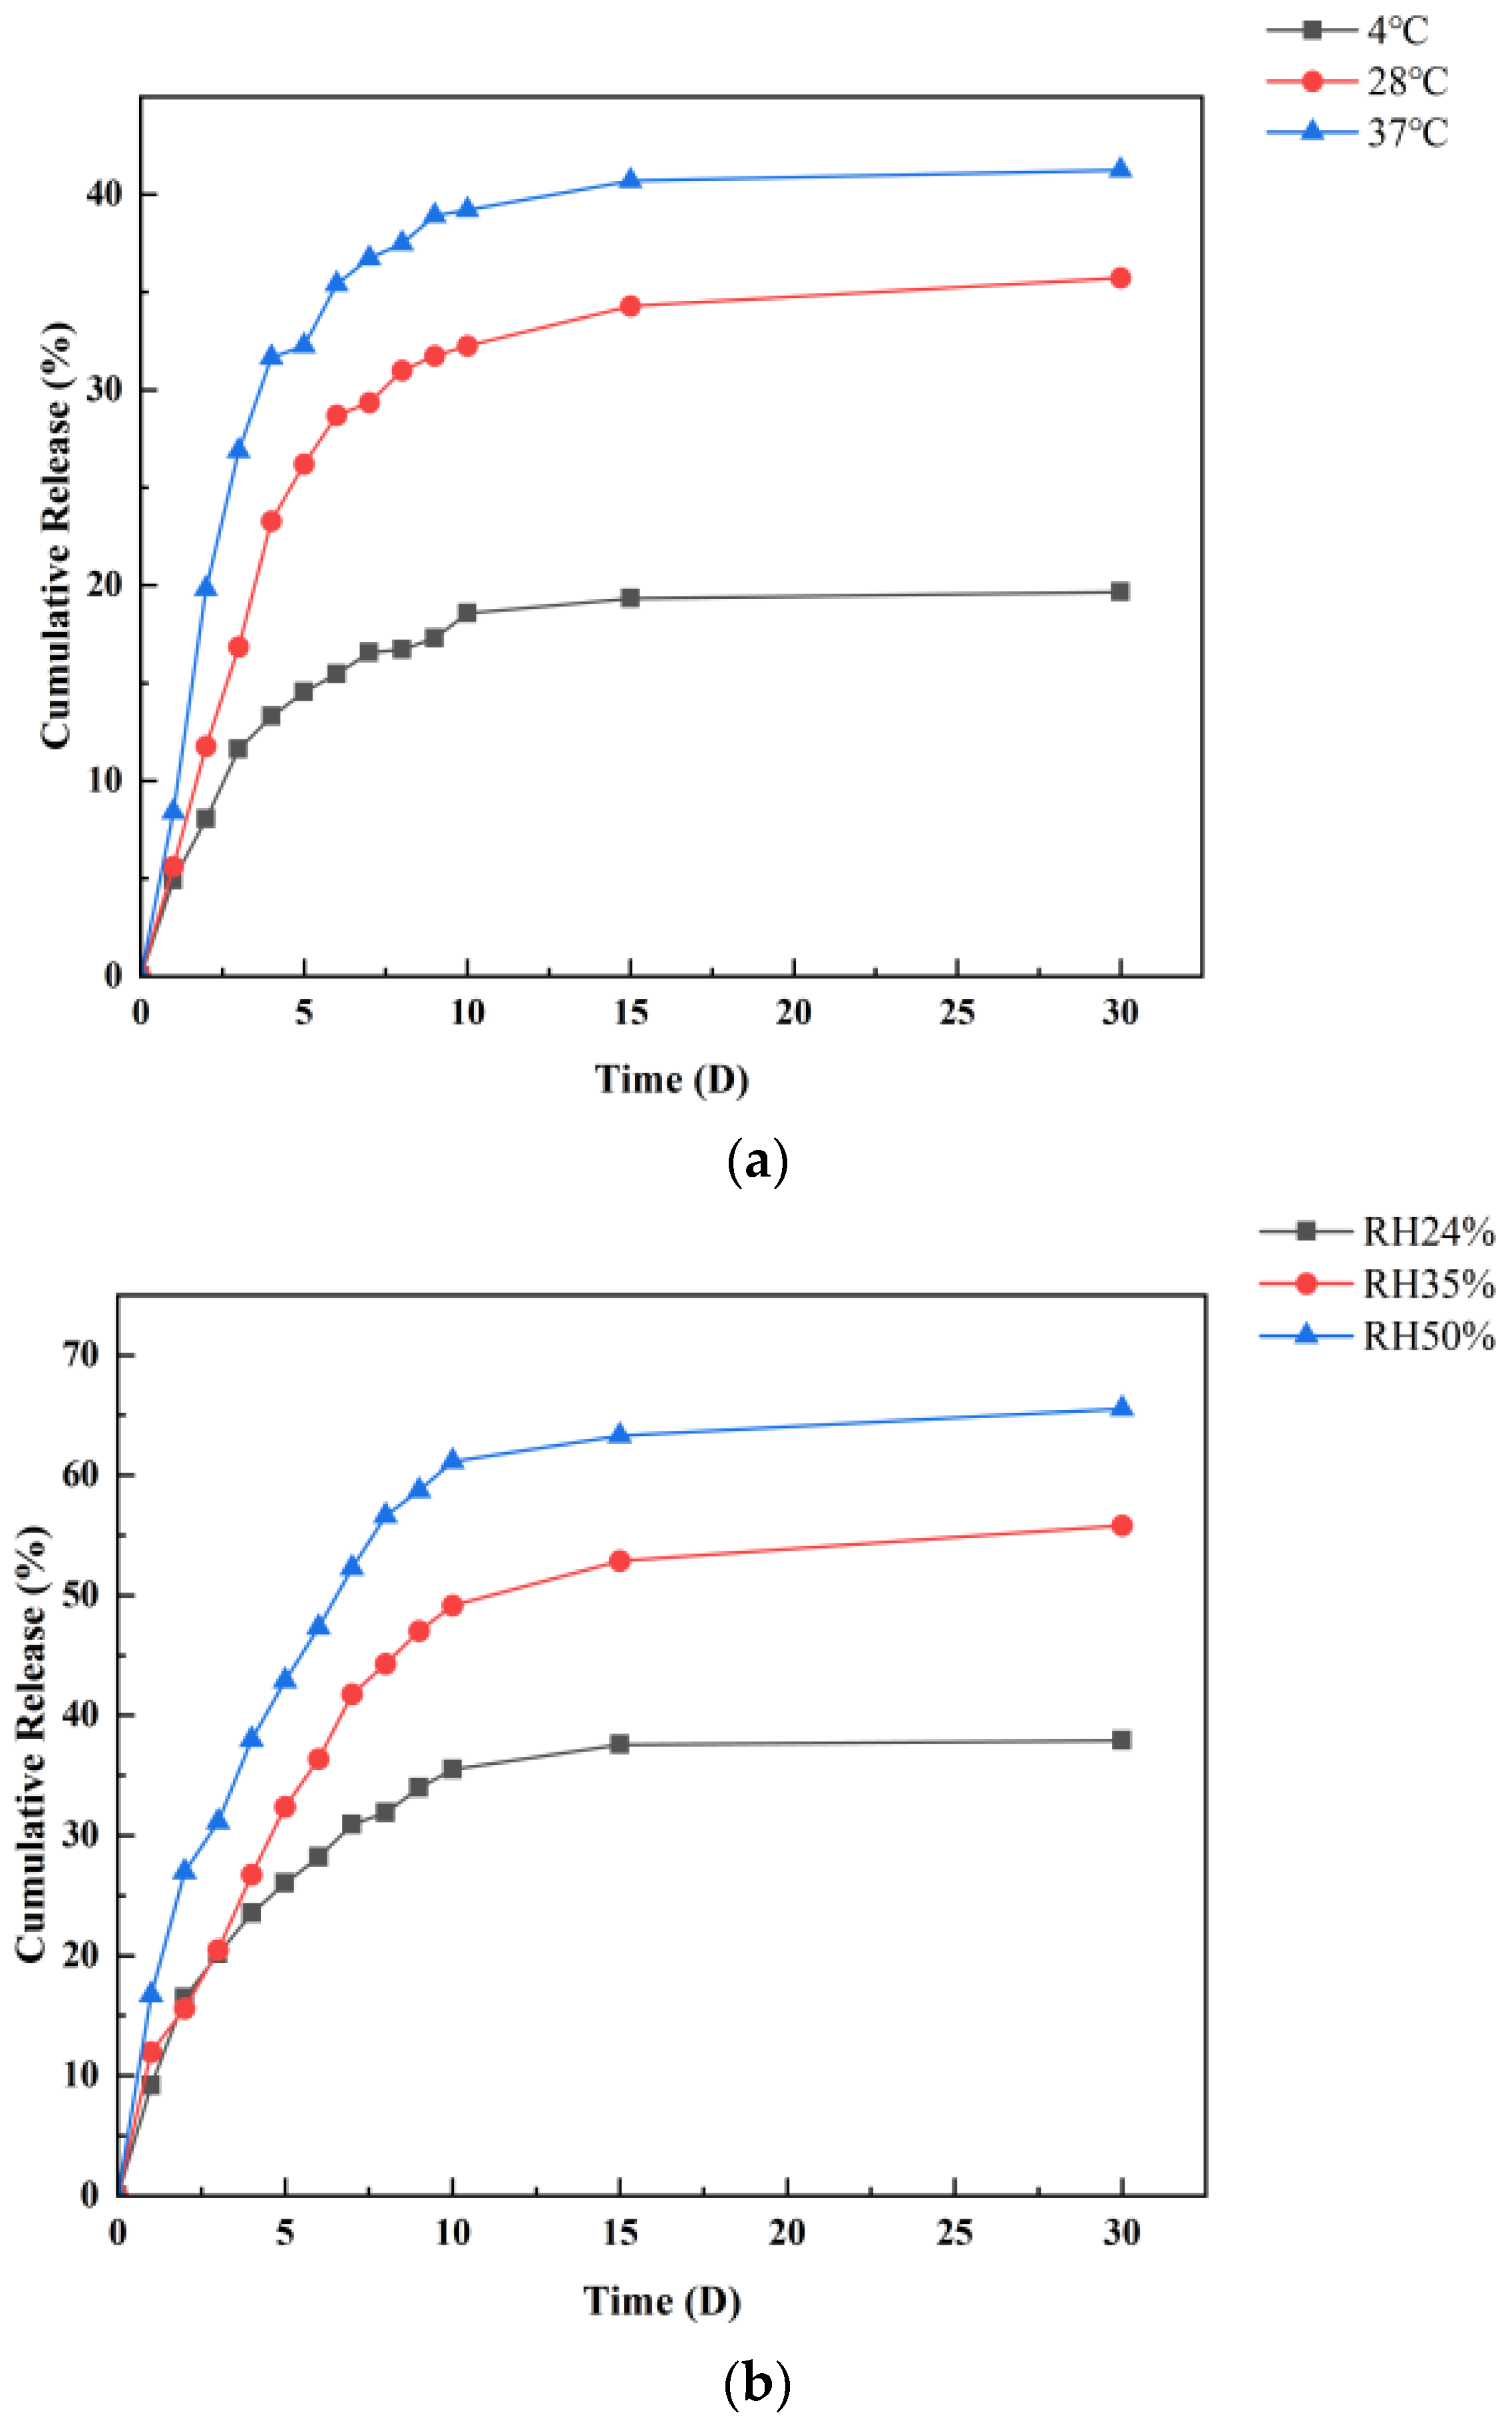
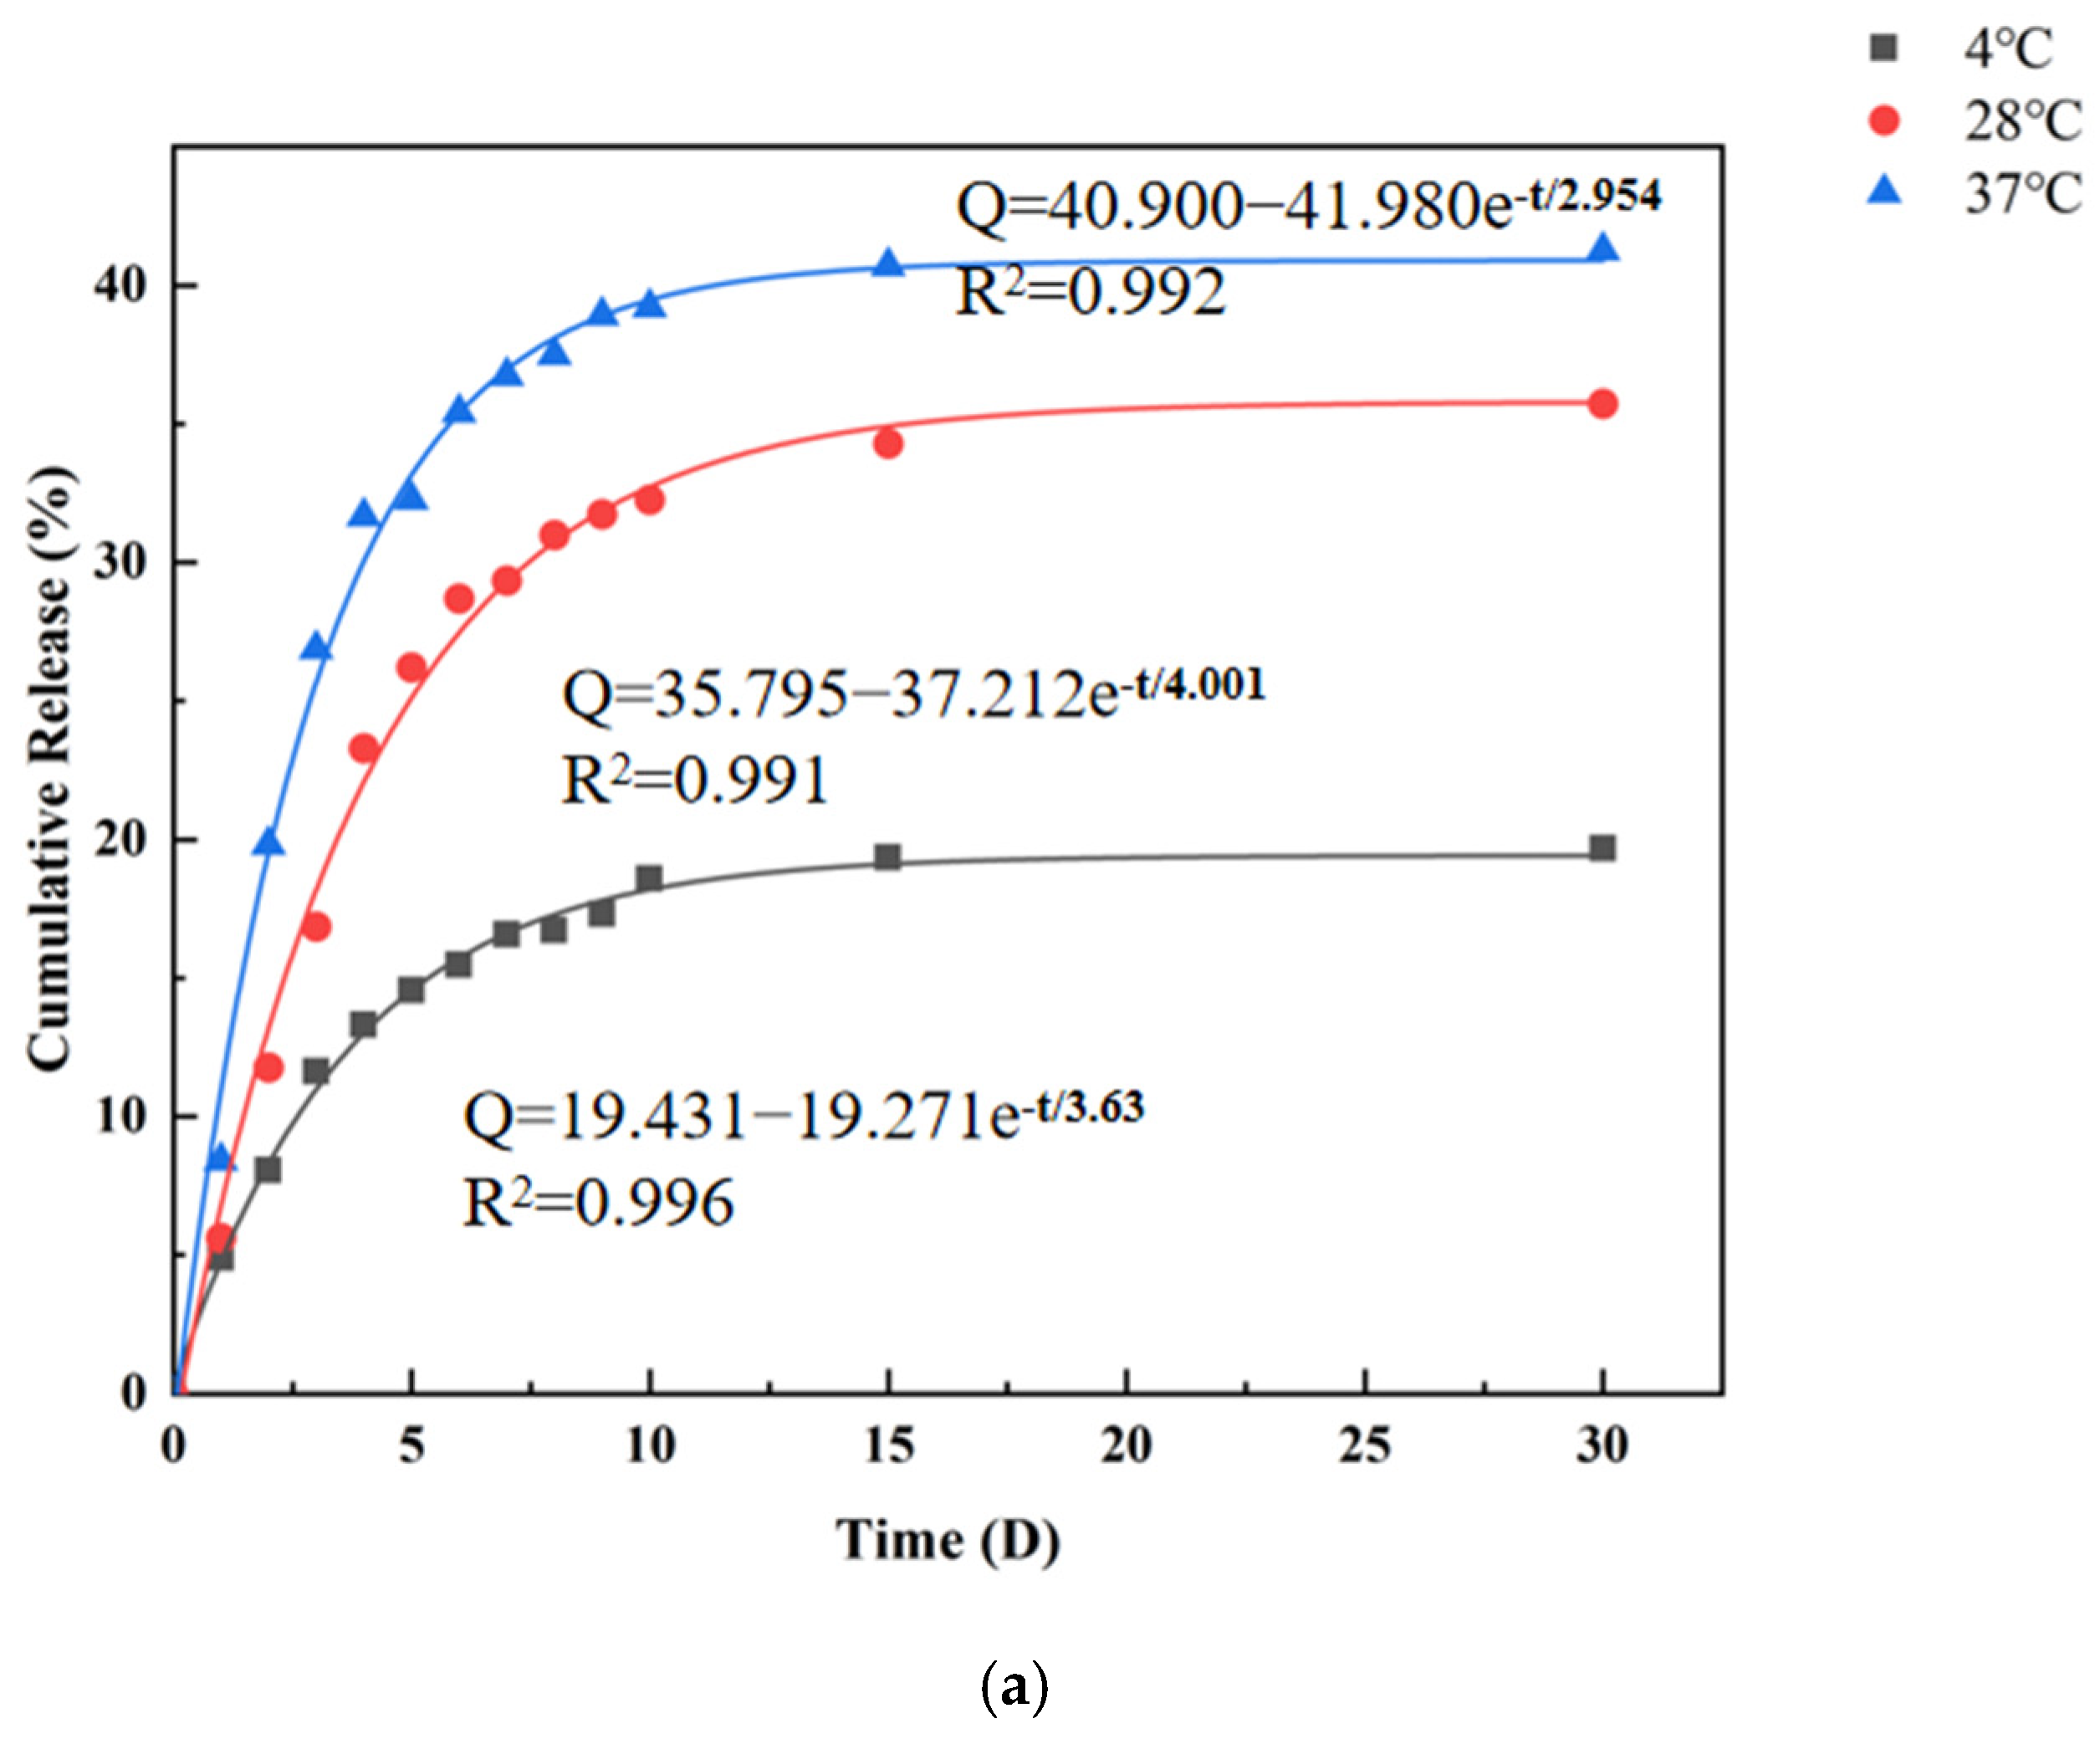
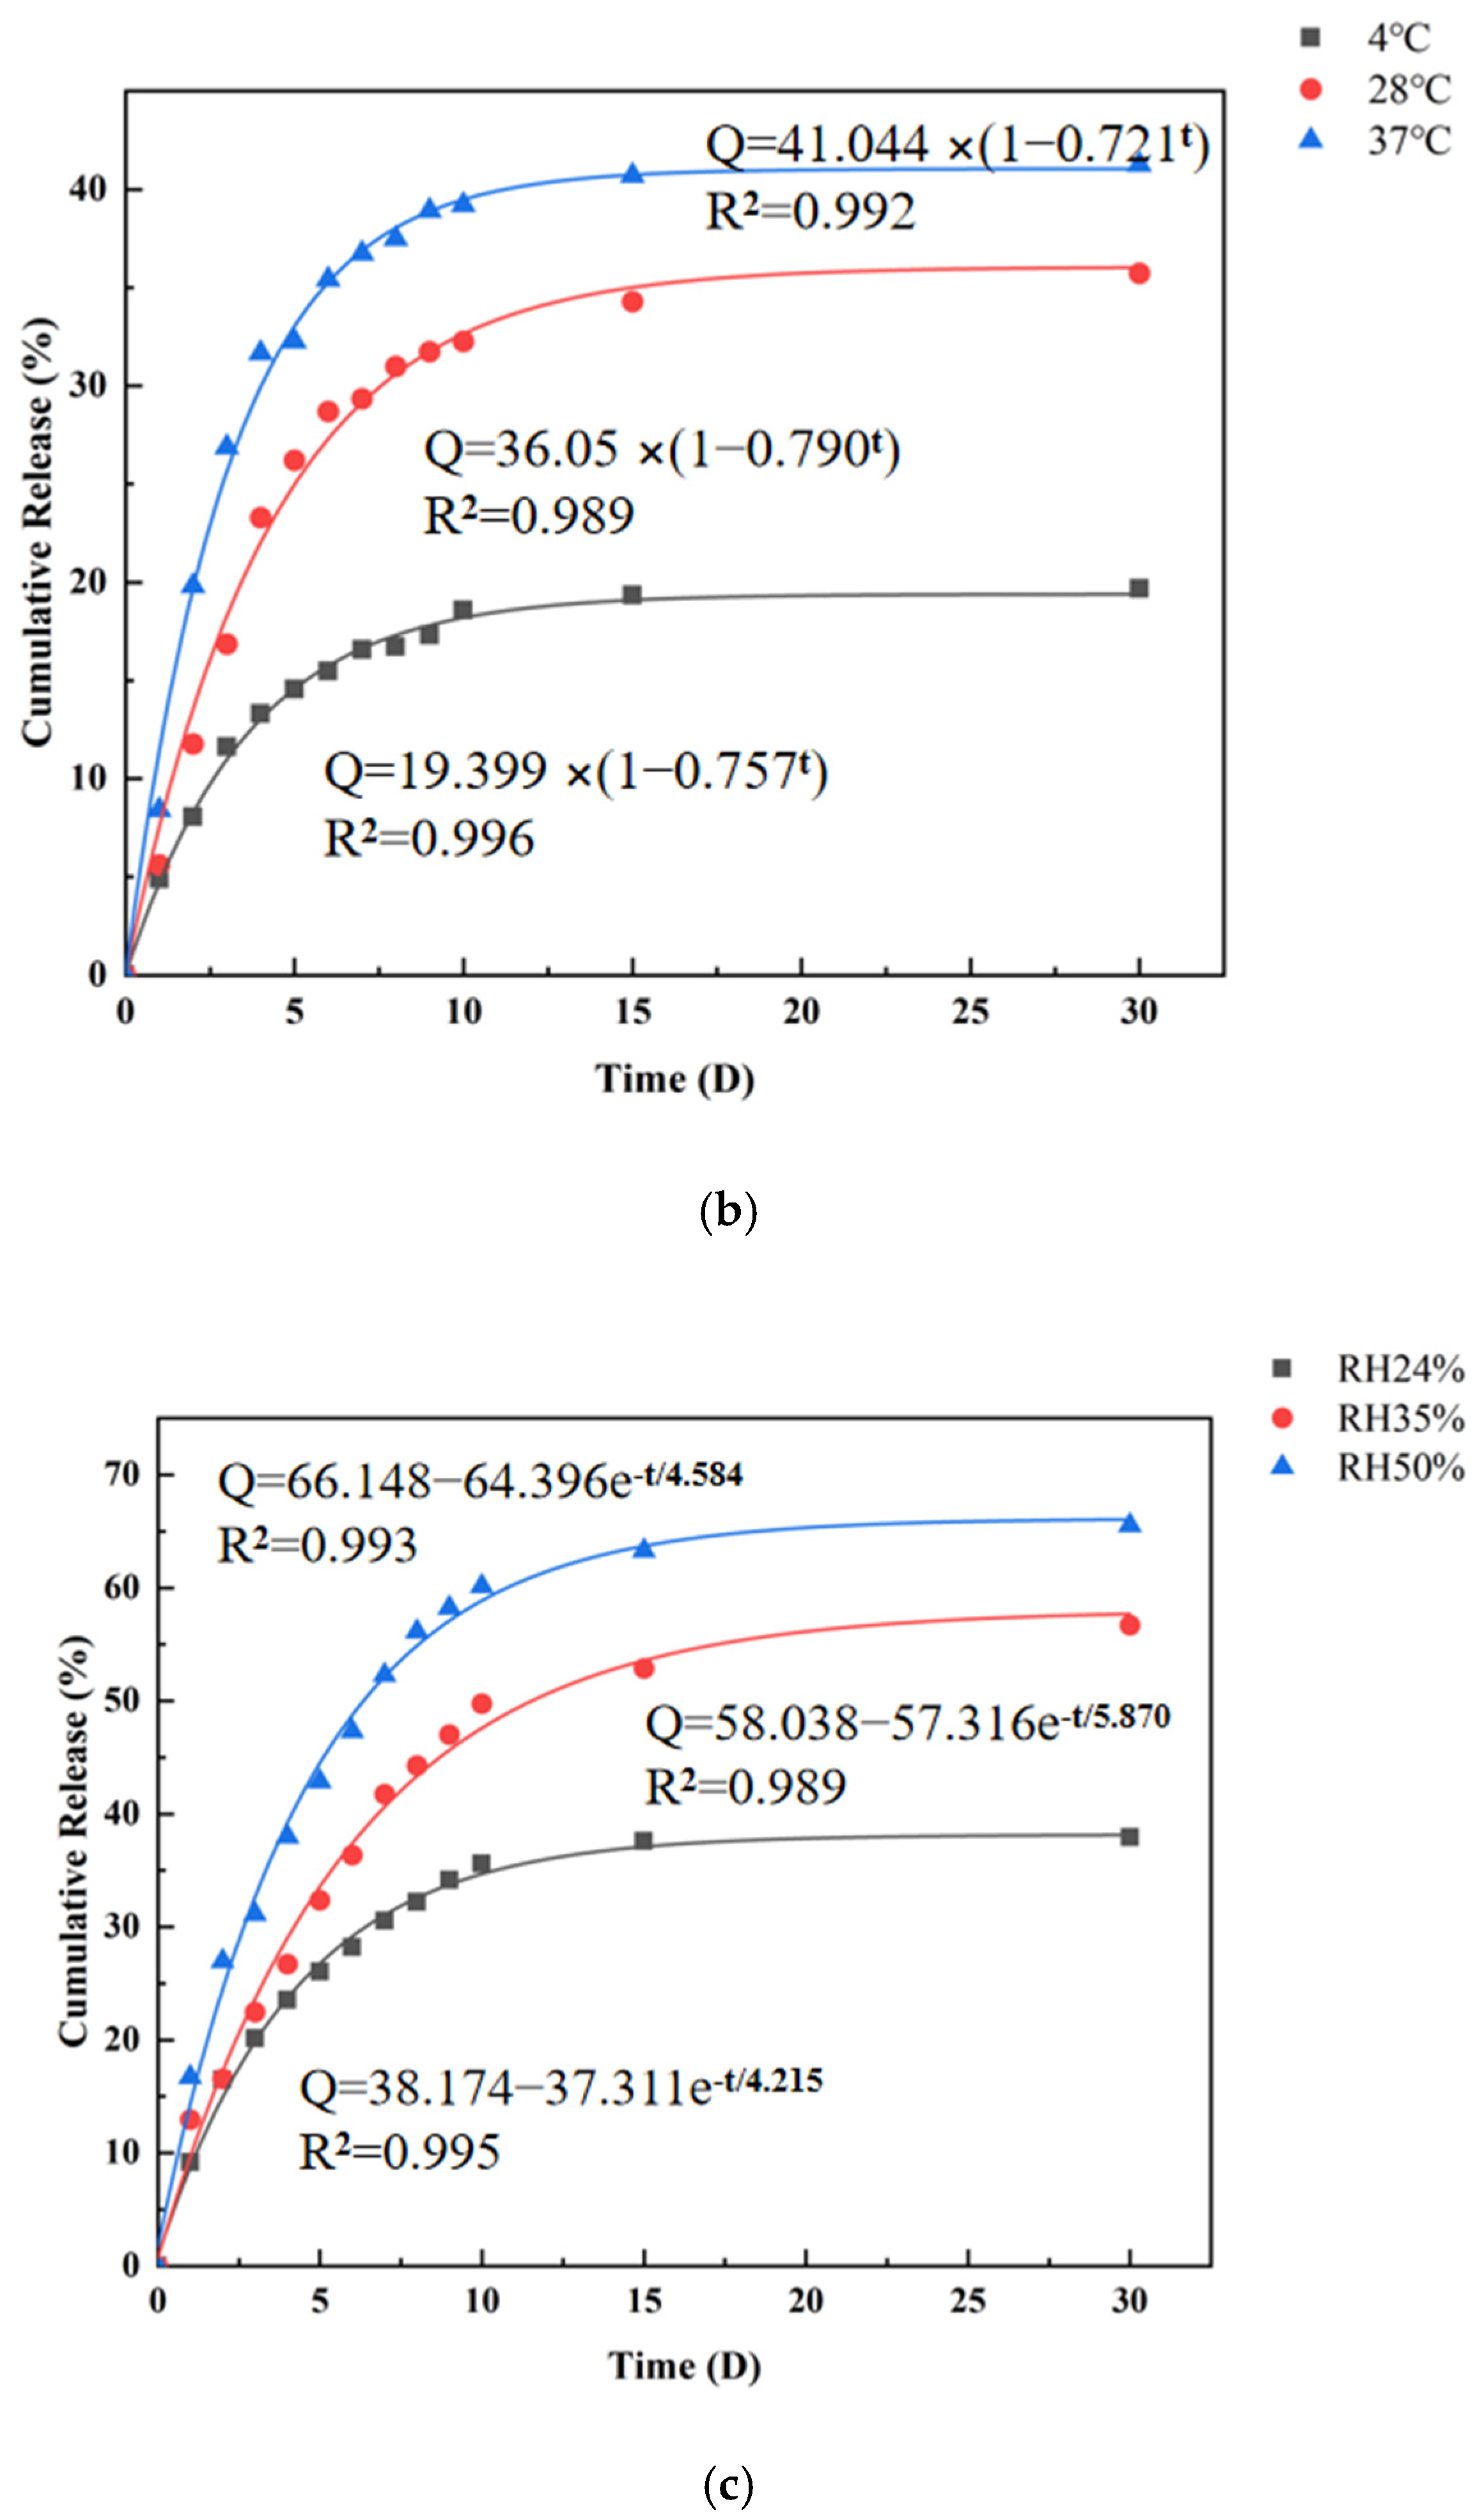
3.6. In Vitro Release Study of CMS

According to the results obtained in study [56], food samples containing microencapsulated bioactive compounds can be effectively studied by placing them under conditions simulating the gastrointestinal tract, which can be released at specific targets in the gastrointestinal tract after food intake. However, when applied to cosmetics, this study is based on in vitro release only, as oral administration is not involved and the microcapsules are of micron size and, therefore, are not very absorbable through the skin. For drug-carrying microcapsules, their release in vitro is affected by many factors, such as ambient temperature, ambient humidity and microcapsule size. On this basis, the in vitro drug release behavior of microcapsules prepared under the optimum technology conditions was investigated under different temperature and humidity conditions. Figure 8a,b show the release curves of loaded microcapsules studied at different temperatures and humidities. All microcapsule samples showed similar slow-release behavior throughout the study period, with a consistent overall trend. The samples exhibited two distinct stages: a relatively fast release rate in the first stage and a slower release rate in the second stage. Specifically, the CEO release rate from the microcapsule was very significant in the first release stage (within the first 5 days) and the cumulative release volume was greatly improved within the specified time. This is mainly attributed to the rapid release of the CEO near the surface or inner surface of the microcapsule. After 5 days, the cumulative release rate and amount of CEO gradually stabilized because the presence of wall material extended the diffusion path length inside and outside the CEO, thus extending the release time of microcapsules. After 30 days of cumulative release, the cumulative release rates of microcapsules at 4 °C, 28 °C and 37 °C were 19.66%, 35.73% and 38.91%, respectively.
The cumulative release rates of microcapsules were 49.79%, 54.81% and 65.53% when the relative humidities were 24%, 35% and 50%, respectively. The above results showed that the microcapsules prepared under higher temperature and relative humidity conditions had higher release quantity and rate. This phenomenon could be attributed to the increase in CEO Brownian motion and volatility with the increase in temperature, while another reason may be that the release of essential oil from microcapsules is an endothermic process that needs to overcome the interaction between molecules. Exposing the microcapsule to high relative humidity may result in partial dissolution of the microcapsule wall composed of hydrophilic polymers, thus shortening the diffusion distance of the CEO from the microcapsule.
Therefore, higher relative humidity leads to faster release of CEO from microcapsule. Based on the above discussion, microcapsules loaded with CEO should be stored at low temperature and humidity. In addition, in order to study the CEO release kinetics model, two different dynamic models (ExpDec1 model and BoxLucas1Mod model) were used to fit the CEO release curves of microcapsules prepared under the optimal conditions, as shown in Figure 9. It can be observed from Table 4 that the fitting results of the two models are very close, but, according to the R2-value obtained by linear regression, the correlation coefficient of the fitting curves using the ExpDec1 model under three different temperatures and humidities is generally greater than those using the BoxLucas1Mod model. Therefore, ExpDec1 model can better fit the release curve of CEO.

3.7. The Antibacterial Activities of CMS

3.7.1. Antimicrobial Activity of CEO and Microcapsule

Inhibition tests were conducted on three common bacteria and two fungi; S. aureus, E. coli, P. aeruginosa, C. albicans and A. Niger were involved to evaluate the inhibition effect of the core, wall and microcapsules, using the diameter of the inhibition zone and MIC as indicators. Table 5 and Table 6 show that, in this experiment—except for GA, which did not show any antibacterial activity—each of the remaining antibacterial active ingredients showed strong inhibition against these five microorganisms. In particular, the essential oil of cinnamon alone displayed the strongest inhibition effect, followed by microcapsules of CEO. Both CEO and CMS displayed better antibacterial activity than HACC alone, which was consistent with the results of the study about the antimicrobial activities of citronella oil (CTO)-loaded composite microcapsules and hydroxyapatite (HAp)/quaternary ammonium salt of chitosan (HACC)/sodium alginate (SA) shells [50].
Although the essential oil showed better inhibition effect compared to that of the microcapsules [41], both represented high sensitivity (inhibition circle ≥20 mm is highly sensitive). However, CEO is highly volatile and CMS can not only ensure the stability of the core, but also have excellent antibacterial properties. Therefore, CMS is more practical from a comprehensive view.

3.7.2. Effect of Temperature on Antibacterial Stability

After the CEO and CMS were treated at 40, 60, 80, 100 and 121 °C for a period of time, the inhibition zone diameter and bacteriostatic rate against S. aureus and E. coli were determined. As shown in Figure 10A, with the gradual increase in temperature, the inhibition zone diameter of CEO against S. aureus did not decrease significantly and remained in a highly sensitive state, probably because CEO belongs to the body-flavored category with less volatility [57].
For E. coli, the inhibition zone diameter was reduced from 27.47 mm to 15.13 mm. As shown in Figure 10A, when the temperature rose from 40 °C to 80 °C, the bacteriostatic rate of microcapsules increased significantly, which may be caused by the enhanced release of encapsulated CEO due to the partial decomposition of microcapsule wall material. When the temperature continued to rise to 121 °C, the bacteriostatic rate of microcapsule against the two kinds of bacteria began to stabilize, the wall material no longer decomposed and the encapsulated essential oil began to enter the slow-release stage.

3.7.3. Effect of pH on Antibacterial Stability

After the CEO and microcapsules were treated at pH 5.0, 5.5, 6.0, 6.5 and 7.0 for a period of time, the antibacterial zone diameter and bacterial inhibition rate against S. aureus and E. coli were determined. As shown in Figure 10B, when pH was 5.0, both CEO and CMS showed highly sensitive inhibition degree to the two kinds of bacteria and then, with the increase in pH, the antibacterial effect of both decreased. On the one hand, the increase in antibacterial activity of essential oil at low pH was related to the decrease in self-activity of tested strains in the acidic environment. On the other hand, it was also related to the structural form of the active ingredients of essential oil in the acidic environment. Specifically, the decrease in pH could reduce the ionization degree of the hydroxyl group on the phenolic compounds in essential oil and increase their hydrophobicity; therefore, it was easier for such active ingredients to combine with the cell membrane and its lipoprotein, resulting in improved antibacterial activity. At lower pH values, essential oil components tended to remain undissociated and be more hydrophobic, which facilitated the binding to the hydrophobic parts of proteins and increased the solubility of the lipids of bacterial cell membranes. It can also be seen from the figures that, although the antibacterial effect of microcapsules was also somewhat weakened, the declining trend of CMS microcapsules was relatively gentle compared with that of CEO, which also indicated that microencapsulation can greatly reduce the influence of different pH values on the stability of essential oils.

4. Conclusions

In this study, GA and HACC were selected as complex wall materials for the first time and CEO was selected as core material to successfully prepare CMS microcapsules by composite condensation method. According to RSM–BBD, the optimal preparation conditions of CMS were as follows: 1:1 core-to-wall ratio, pH 4.5 and 0.7 wt% mass concentration of CaCl2 solution. The actual encapsulation rate reached 91.18%, which was consistent with the predicted value. Microcapsules were subspherical in size, ranging from 1.06 to 81.01 µm, with an average size of 6.31 µm. Thermogravimetric differential calorimetry and differential scanning calorimetry showed that the microcapsules had high thermal stability. Fourier transform infrared spectroscopy showed that the essential oil was successfully coated. In vitro release results showed that the release of essential oil was delayed by microcapsules and increased with the increase in temperature and humidity. The release of CEO from microcapsules was consistent with the ExpDec1 model. In addition, CMS had good inhibition effect on all five tested bacteria and showed considerable inhibition stability when changing temperatures and pH values. Based on the above advantages of CMS, it is expected that CMS will have good antimicrobial application prospects in the food, cosmetic and pharmaceutical industries. However, there are some limitations in this study, which only focuses on the preparation and characterization of microcapsules. However, there is no in-depth study on their application in cosmetics or food, including their functional evaluation and toxicity test, which is a problem to be solved in the future. At the same time, the mechanism by which cinnamon essential oil microcapsules act on five kinds of bacteria commonly found in cosmetics is not mentioned in this paper, which can also be the focus of future research.

Author Contributions

Conceptualization, H.L. and Z.Z.; methodology, W.X.; software, Y.C.; validation, M.C., M.X. and Q.L.; formal analysis, H.L.; investigation, Z.Z.; resources, W.X.; data curation, H.L.; writing—original draft preparation, H.L.; writing—review and editing, Z.Z.; visualization, Z.Z.; supervision, W.W.; project administration, W.W.; funding acquisition, H.L. All authors have read and agreed to the published version of the manuscript.

Funding

This research received no external funding.

Institutional Review Board Statement

Not applicable.

Informed Consent Statement

Not applicable.

Data Availability Statement

Data are contained within the article.

Conflicts of Interest

The authors declare no conflict of interest.

References

  1. Felix, P.H.C.; Birchal, V.S.; Botrel, D.A.; Marques, G.R.; Borges, S.V. Physicochemical and thermal stability of microcapsules of cinnamon essential oil by spray drying. J. Food Process. Preserv. 2017, 41, 9. [Google Scholar] [CrossRef]
  2. Shan, B.; Cai, Y.-Z.; Brooks, J.D.; Corke, H. Antibacterial Properties and Major Bioactive Components of Cinnamon Stick (Cinnamomum burmannii): Activity against Foodborne Pathogenic Bacteria. J. Agric. Food Chem. 2007, 55, 5484–5490. [Google Scholar] [CrossRef]
  3. Li, L.; Zhang, W.; Peng, J.; Xue, B.; Liu, Z.; Luo, Z.; Lu, D.; Zhao, X. A Novel Shell Material-Highland Barley Starch for Microencapsulation of Cinnamon Essential Oil with Different Preparation Methods. Materials 2020, 13, 1192. [Google Scholar] [CrossRef] [PubMed]
  4. Li, Y.; Liu, J.; He, X.; Kong, D.; Hu, Y. Preparation of Cinnamon Oil-Loaded Antibacterial Composite Microcapsules by In Situ Polymerization of Pickering Emulsion Templates. Macromol. Mater. Eng. 2020, 305, 1900851. [Google Scholar] [CrossRef]
  5. Hu, J.; Wang, X.; Xiao, Z.; Bi, W. Effect of chitosan nanoparticles loaded with cinnamon essential oil on the quality of chilled pork. LWT-Food Sci. Technol. 2015, 63, 519–526. [Google Scholar] [CrossRef]
  6. Maia, G.A.; de Carvalho, W.M.; Alexandrino, A.C.; Rodrigues, M.D.P.; Brasil, I.M. Freshness retention of minimally processed melon using different packages and multilayered edible coating containing microencapsulated essential oil. Int. J. Food Sci. Technol. 2014, 49, 2192–2203. [Google Scholar]
  7. Chaib, S.; Benali, N.; Arhab, R.; Ajmi, I.S.; Bendaoued, H.; Romdhane, M. Preparation of Thymus vulgaris Essential Oil Microcapsules by Complex Coacervation and Direct Emulsion: Synthesis, Characterization and Controlled Release Properties. Arab. J. Sci. Eng. 2021, 46, 5429–5446. [Google Scholar] [CrossRef]
  8. Noghabi, M.S.; Molaveisi, M. Microencapsulation optimization of cinnamon essential oil in the matrices of gum Arabic, maltodextrin, and inulin by spray-drying using mixture design. J. Food Process Eng. 2020, 43, e13341. [Google Scholar] [CrossRef]
  9. Zhang, S.; Lu, B.A.; Han, X.; Xu, L.N.; Qi, Y.; Yin, L.H.; Xu, Y.W.; Zhao, Y.Y.; Liu, K.X.; Peng, J.Y. Protection of the flavonoid fraction from Rosa laevigata Michx fruit against carbon tetrachloride-induced acute liver injury in mice. Food Chem. Toxicol. 2019, 132, 2. [Google Scholar] [CrossRef] [PubMed]
  10. Li, Y.; Wu, C.H.; Wu, T.T.; Wang, L.P.; Chen, S.G.; Ding, T.; Hu, Y.Q. Preparation and characterization of citrus essential oils loaded in chitosan microcapsules by using different emulsifiers. J. Food Eng. 2018, 217, 108–114. [Google Scholar] [CrossRef]
  11. Sun, Y.J.; Fan, S.Y.; Liang, R.; Ni, X.J.; Du, Y.B.; Wang, J.; Yang, C. Design and characterization of starch/solid lipids hybrid microcapsules and their thermal stability with menthol. Food Hydrocoll. 2021, 116, 106631. [Google Scholar] [CrossRef]
  12. Ma, Y.B.; Lv, S.S.; Yao, X.R.; Zhang, Y.H.; Gu, J.Y. Preparation of isocyanate microcapsules as a high-performance adhesive for PLA/WF. Constr. Build. Mater. 2020, 260, 120483. [Google Scholar] [CrossRef]
  13. Zhang, T.; Luo, Y.; Wang, M.X.; Chen, F.; Liu, J.K.; Meng, K.; Zhao, H.J. Double-Layered Microcapsules Significantly Improve the Long-Term Effectiveness of Essential Oil. Polymers 2020, 12, 1651. [Google Scholar] [CrossRef] [PubMed]
  14. Chang, P.G.; Gupta, R.; Timilsena, Y.P.; Adhikari, B. Optimisation of the complex coacervation between canola protein isolate and chitosan. J. Food Eng. 2016, 191, 58–66. [Google Scholar] [CrossRef]
  15. Yang, X.; Gao, N.; Hu, L.D.; Li, J.L.; Sun, Y.B. Development and evaluation of novel microcapsules containing poppy-seed oil using complex coacervation. J. Food Eng. 2015, 161, 87–93. [Google Scholar] [CrossRef]
  16. Pudziuvelyte, L.; Siauruseviciute, A.; Morkuniene, R.; Lazauskas, R.; Bernatoniene, J. Influence of Technological Factors on the Quality of Chitosan Microcapsules with Boswellia serata L. Essential Oil. Pharmaceutics 2022, 14, 1259. [Google Scholar] [CrossRef] [PubMed]
  17. Hu, J.; Zhang, Y.D.; Xiao, Z.B.; Wang, X.G. Preparation and properties of cinnamon-thyme-ginger composite essential oil nanocapsules. Ind. Crops Prod. 2018, 122, 85–92. [Google Scholar] [CrossRef]
  18. Li, D.H.; Liu, L.M.; Tian, K.L.; Liu, J.C.; Fan, X.Q. Synthesis, biodegradability and cytotoxicity of water-soluble isobutylchitosan. Carbohydr. Polym. 2007, 67, 40–45. [Google Scholar] [CrossRef]
  19. Tan, H.; Ma, R.; Lin, C.; Liu, Z. Quaternized Chitosan as an Antimicrobial Agent: Antimicrobial Activity, Mechanism of Action and Biomedical Applications in Orthopedics. Int. J. Mol. Sci. 2013, 14, 1854–1869. [Google Scholar] [CrossRef]
  20. Agrawal, A.K.; Urimi, D.; Jain, S. Multifunctional Polymeric Nano-Carriers in Targeted Drug Delivery. In Targeted Drug Delivery: Concepts and Design; Springer: Cham, Switzerland, 2015. [Google Scholar]
  21. Hu, Y.; Yang, Z.M.; Liu, J.Y.; Cheng, J.H.; Yang, Z.H. Preparation and Controlled Release Analysis of Patchouli Oil Complex Microcapsules. Adv. Mater. Res. 2011, 236–238, 2669–2672. [Google Scholar] [CrossRef]
  22. Li, H.; Xing, Z.; Li, R.; Zhang, M.X.; Wang, M.L.; Tan, Y.Z.; Wu, G.Z. Preparation of Cu2+-Chitosan Quaternary Ammonium Salt-g-Poly(acrylicacid) with Efficient Antibacterial Activity. Chem. J. Chin. Univ. Chin. 2017, 38, 902–906. [Google Scholar] [CrossRef]
  23. Argin, S.; Kofinas, P.; Lo, Y.M. The cell release kinetics and the swelling behavior of physically crosslinked xanthan-chitosan hydrogels in simulated gastrointestinal conditions. Food Hydrocoll. 2014, 40, 138–144. [Google Scholar] [CrossRef]
  24. Avadi, M.R.; Sadeghi, A.; Mohammadpour, N.; Abedin, S.; Atyabi, F.; Dinarvand, R.; Rafiee-Tehrani, M. Preparation and characterization of insulin nanoparticles using chitosan and Arabic gum with ionic gelation method. Nanomedicine 2010, 6, 58–63. [Google Scholar] [CrossRef] [PubMed]
  25. Cai, C.C.; Ma, R.J.; Duan, M.W.; Lu, D. Preparation and antimicrobial activity of thyme essential oil microcapsules prepared with gum arabic. Rsc. Adv. 2019, 9, 19740–19747. [Google Scholar] [CrossRef]
  26. Li, C.; Li, B.G.; Zhu, C.H.; Meng, X. Modeling and optimization of tea polyphenol-alginate/chitosan magnetic microcapsules. J. Mol. Struct. 2020, 1208, 127827. [Google Scholar] [CrossRef]
  27. Zhao, D.; Jiao, X.; Zhang, M.M.; Ye, K.; Shi, X.D.; Lu, X.H.; Qiu, G.; Shea, K.J. Preparation of high encapsulation efficiency fragrance microcapsules and their application in textiles. Rsc. Adv. 2016, 6, 80924–80933. [Google Scholar] [CrossRef]
  28. Nayak, A.K.; Pal, D.; Santra, K. Development of calcium pectinate-tamarind seed polysaccharide mucoadhesive beads containing metformin HCl. Carbohydr. Polym. 2014, 101, 220–230. [Google Scholar] [CrossRef]
  29. Chen, M.J.; Hu, Y.; Zhou, J.; Xie, Y.R.; Wu, H.; Yuan, T.; Yang, Z.H. Facile fabrication of tea tree oil-loaded antibacterial microcapsules by complex coacervation of sodium alginate/quaternary ammonium salt of chitosan. Rsc. Adv. 2016, 6, 13032–13039. [Google Scholar] [CrossRef]
  30. Li, D.H.; Wu, H.J.; Huang, W.; Guo, L.; Dou, H.T. Microcapsule of Sweet Orange Essential Oil Encapsulated in Beta-Cyclodextrin Improves the Release Behaviors In Vitro and In Vivo. Eur. J. Lipid Sci. Technol. 2018, 120, 1700521. [Google Scholar] [CrossRef]
  31. Yang, Y.H.; Li, X.Z.; Zhang, S. Preparation methods and release kinetics of Litsea cubeba essential oil microcapsules. Rsc. Adv. 2018, 8, 29980–29987. [Google Scholar] [CrossRef] [PubMed]
  32. Luo, W.; Tappi, S.; Wang, C.F.; Yu, Y.; Zhu, S.M.; Dalla Rosa, M.; Rocculi, P. Effect of High Hydrostatic Pressure (HHP) on the Antioxidant and Volatile Properties of Candied Wumei Fruit (Prunus mume) During Osmotic Dehydration. Food Bioprocess Technol. 2019, 12, 98–109. [Google Scholar] [CrossRef]
  33. Lucia, A.; Toloza, A.; Guzman, E.; Ortega, F.; Rubio, R.G. Novel polymeric micelles for insect pest control: Encapsulation of essential oil monoterpenes inside a triblock copolymer shell for head lice control. PEERJ 2017, 5, e3171. [Google Scholar] [CrossRef] [PubMed]
  34. Chen, Y.X.; He, N.N.; Yang, T.; Cai, S.Y.; Zhang, Y.; Lin, J.J.; Huang, M.Q.; Chen, W.Z.; Zhang, Y.P.; Hong, Z.A. Fucoxanthin Loaded in Palm Stearin- and Cholesterol-Based Solid Lipid Nanoparticle-Microcapsules, with Improved Stability and Bioavailability In Vivo. Mar. Drugs 2022, 20, 237. [Google Scholar] [CrossRef] [PubMed]
  35. Xiao, Z.B.; Kang, Y.X.; Hou, W.J.; Niu, Y.W.; Kou, X.R. Microcapsules based on octenyl succinic anhydride (OSA)-modified starch and maltodextrins changing the composition and release property of rose essential oil. Int. J. Biol. Macromol. 2019, 137, 132–138. [Google Scholar] [CrossRef]
  36. Yang, Z.M.; Peng, Z.; Li, J.H.; Li, S.D.; Kong, L.X.; Li, P.W.; Wang, Q.H. Development and evaluation of novel flavour microcapsules containing vanilla oil using complex coacervation approach. Food Chem. 2014, 145, 272–277. [Google Scholar] [CrossRef]
  37. Franca, D.; Medina, A.F.; Messa, L.L.; Souza, C.F.; Faez, R. Chitosan spray-dried microcapsule and microsphere as fertilizer host for swellable—Controlled release materials. Carbohydr. Polym. 2018, 196, 47–55. [Google Scholar] [CrossRef]
  38. Bohora, A.A.; Kokate, S.R.; Khedkar, S.; Vankudre, A. Antimicrobial activity of probiotics against endodontic pathogens:- A preliminary study. Indian J. Med. Microbiol. 2019, 37, 5–11. [Google Scholar] [CrossRef]
  39. Golus, J.; Sawicki, R.; Widelski, J.; Ginalska, G. The agar microdilution method—A new method for antimicrobial susceptibility testing for essential oils and plant extracts. J. Appl. Microbiol. 2016, 121, 1291–1299. [Google Scholar] [CrossRef]
  40. Bugiereck, A.M.; Pereira, A.T.; Gussati, E.; Magro, J.D.; Mello, J.; Dalcanton, F.; Ternus, R.Z.; Soares, C.; Riella, H.G. Microencapsulation of eugenol molecules by β-cyclodextrine as a thermal protection method of antibacterial action. Mater. Sci. Eng. C 2017, 75, 259–271. [Google Scholar]
  41. Tu, Q.B.; Wang, P.Y.; Sheng, S.; Xu, Y.; Wang, J.Z.; You, S.; Zhu, A.H.; Wang, J.; Wu, F.A. Microencapsulation and Antimicrobial Activity of Plant Essential Oil Against Ralstonia solanacearum. Waste Biomass Valorization 2020, 11, 5273–5282. [Google Scholar] [CrossRef]
  42. Odeku, O.A.; Okunlola, A.; Lamprecht, A. Formulation and In vitro Evaluation of Natural Gum-Based Microbeads for Delivery of Ibuprofen. Trop. J. Pharm. Res. 2014, 13, 1577–1583. [Google Scholar] [CrossRef]
  43. Leng, P.F.; Zhang, Z.M.; Li, Q.; Zhao, M.J.; Pan, G.T. Microemulsion Formulation of Carbendazim and Its In Vitro Antifungal Activities Evaluation. PLoS ONE 2014, 9, e109580. [Google Scholar] [CrossRef] [PubMed]
  44. Rojas-Moreno, S.; Osorio-Revilla, G.; Gallardo-Velazquez, T.; Cardenas-Bailon, F.; Meza-Marquez, G. Effect of the cross-linking agent and drying method on encapsulation efficiency of orange essential oil by complex coacervation using whey protein isolate with different polysaccharides. J. Microencapsul. 2018, 35, 165–180. [Google Scholar] [CrossRef]
  45. Lee, A.R.; Han, C.H.; Yi, E. Preparation and Characterization of Melamine-formaldehyde Microcapsules Containing Citrus unshiu Essential Oil. Fibers Polym. 2014, 15, 35–40. [Google Scholar] [CrossRef]
  46. Zhu, Z.M.; Hu, J.F.; Zhong, Z.C. Preparation and characterization of long-term antibacterial and pH-responsive Polylactic acid/Octenyl succinic anhydride-chitosan @ tea tree oil microcapsules. Int. J. Biol. Macromol. 2022, 220, 1318–1328. [Google Scholar] [CrossRef]
  47. Ferreira, I.V.W.; Focke, W.W.; du Toit, E.L. Spontaneous microencapsulation of geraniol by zein. Express Polym. Lett. 2018, 12, 986–995. [Google Scholar] [CrossRef]
  48. Huang, Y.Y.; Sun, B.Y.; Muhoza, B. Influence of processing conditions on the physical properties, retention rate, and antimicrobial activity of cinnamaldehyde loaded in gelatin/pectin complex coacervates. Food Biophys. 2022, 17, 289–301. [Google Scholar] [CrossRef]
  49. Butstraen, C.; Salaun, F. Preparation of microcapsules by complex coacervation of gum Arabic and chitosan. Carbohydr. Polym. 2014, 99, 608–616. [Google Scholar] [CrossRef]
  50. Wang, J.G.; Li, X.; Chen, M.J.; Chen, Z.M.; Wu, H.; Zhang, P.; Yuan, T.; Yang, Z.H.; Hu, Y. Fabrication of sustained-release and antibacterial citronella oil-loaded composite microcapsules based on Pickering emulsion templates. J. Appl. Polym. Sci. 2018, 135, 46386. [Google Scholar] [CrossRef]
  51. Lb, A.; Nk, B.; Ss, A.; Sk, B.; Ml, A. Correlation between chemical composition and antimicrobial properties of essential oils against most common food pathogens and spoilers: In-vitro efficacy and predictive modelling—ScienceDirect. Microb. Pathog. 2020, 147, 104212. [Google Scholar]
  52. Yu, D.W.; Xu, Y.S.; Jiang, Q.X.; Xia, W.S. Effects of chitosan coating combined with essential oils on quality and antioxidant enzyme activities of grass carp (Ctenopharyngodon idellus) fillets stored at 4 degrees C. Int. J. Food Sci. Technol. 2017, 52, 404–412. [Google Scholar] [CrossRef]
  53. Torini, L.; Argillier, J.F.; Zydowicz, N. Interfacial Polycondensation Encapsulation in Miniemulsion. Macromolecules 2005, 38, 995–1004. [Google Scholar] [CrossRef]
  54. Yang, K.; Liu, A.P.; Hu, A.X.; Li, J.X.; Zen, Z.; Liu, Y.T.; Tang, S.Y.; Li, C. Preparation and characterization of cinnamon essential oil nanocapsules and comparison of volatile components and antibacterial ability of cinnamon essential oil before and after encapsulation. Food Control 2021, 123, 107783. [Google Scholar] [CrossRef]
  55. Xiao, Z.; Hou, W.; Kang, Y.; Niu, Y.; Kou, X. Encapsulation and sustained release properties of watermelon flavor and its characteristic aroma compounds from γ-cyclodextrin inclusion complexes. Food Hydrocoll. 2019, 97, 105202. [Google Scholar] [CrossRef]
  56. Correa, L.C.; Moldao-Martins, M.; Alves, V.D. Advances in the Application of Microcapsules as Carriers of Functional Compounds for Food Products. Appl. Sci. 2019, 9, 571. [Google Scholar] [CrossRef]
  57. Hui-Qing, W.U.; Qing-Ping, W.U.; Shi, L.S.; Cheng-Si, L.I. Study on Inhibitory Effects of Plant Essential Oils against Microorganisms. Food Sci. 2008, 29, 83–86. [Google Scholar]
Figure 1. Response surfaces (a,c,e) and contour plots (b,d,f) for the effects of core–wall ratio (X1), pH (X2) and concentration of CaCl2 (X3) on EE.
Coatings 13 00973 g001
Figure 2. Microscopic images of CMS (a) and SEM images of CMS × 12,000 times (b) and CMS × 60,000 times (c).
Coatings 13 00973 g002
Figure 3. The particle size distribution of CMS.
Coatings 13 00973 g003
Figure 4. Zeta potential of CMS at different pH values.
Coatings 13 00973 g004
Figure 5. FTIR spectra of HACC (a), GA (b), BMS (c), CEO (d) and CMS (e).
Coatings 13 00973 g005
Figure 6. The thermogravimetric and differential thermal analysis curves of BMS (a,c) and CMS (b,d).
Coatings 13 00973 g006
Figure 7. Differential scanning calorimetry curves of CEO (a), BMS (b) and CMS (c).
Coatings 13 00973 g007
Figure 8. Release curve of CMS at different temperatures (a); release curve of CMS at different humidities (b).
Coatings 13 00973 g008
Figure 9. Fitting curves of CMS to ExpDec1 model (a,c) and BoxLucas1Mod model (b,d) at different temperatures and different humidities.
Coatings 13 00973 g009aCoatings 13 00973 g009bCoatings 13 00973 g009c
Figure 10. (A) Different temperatures: DIZ of CEO to S. aureus (a); DIZ of CEO to E. coli (b); DIZ of CMS to S. aureus (c) and DIZ of CMS to E. coli (d). (B) Different pH values: DIZ of CEO to S. aureus (a); DIZ of CEO to E. coli (b); DIZ of CMS to S. aureus (c) and DIZ of CMS to E. coli (d).
Coatings 13 00973 g010
Table 1. Three factors and three levels for RSM.
FactorsLevels
−10−1
Core than wall (X1)1:21:13:2
pH (X2)4.04.55.0
The concentration of CaCl2 (X3)0.60.70.8
Table 2. Design of Box–Behnken experiments.
RunIndependent VariablesResponse Variables
NoX1X2X3 (%)EE (%)
11.504.000.7088.76
21.004.000.6087.56
31.004.500.7091.35
40.505.000.7088.44
51.005.000.8088.53
61.004.000.8087.52
70.504.000.7087.15
80.504.500.6087.34
91.004.500.7091.13
100.504.500.8088.20
111.505.000.7088.68
121.504.500.8088.36
131.005.000.6087.32
141.504.500.6087.78
151.004.500.7091.24
161.004.500.7090.89
171.004.500.7091.10
Table 3. Analysis of variance of quadratic response surface regression model.
SourceSum of SquaresDfMean SquareF-Valuep-ValueSignificant
Model39.0594.3487.55<0.0001**
X10.7510.7515.140.0060**
X20.4910.499.890.0163*
X30.8510.8517.180.0043**
X1X20.4710.479.470.0179*
X1X30.02010.0200.400.5494
X2X30.3910.397.880.0262*
X127.6617.66154.50<0.0001**
X229.9319.93200.45<0.0001**
X3214.78114.78298.22<0.0001**
Residual0.3570.050
Lack of fit0.2330.0762.580.1914
Pure error0.1240.030
Cor total39.4016
R2 = 0.9912; Radj2 = 0.9799; Adeq Precision = 22.985
Note: * means the difference is significant at the 0.05 level. ** means the difference is significant at the 0.01 level.
Table 4. Kinetic release parameters of CMS at different temperature and humidity conditions.
Mathematical ModelRH24%RH35%RH50%
ExpDec1Q = 38.174 − 37.311e−t/4.215
R2 = 0.995
Q = 58.038 − 57.316e−t/5.870
R2 = 0.989
Q = 66.148 − 64.396e−t/4.584
R2 = 0.993
BoxLucas1ModQ = 37.980 × (1 − 0.782t)
R2 = 0.995
Q = 57.848 × (1 − 0.840t)
R2 = 0.990
Q = 65.746 × (1 − 0.796t)
R2 = 0.992
Mathematical model4 °C28 °C37 °C
ExpDec1Q = 40.900 − 41.980e−t/2.954
R2 = 0.996
Q = 35.795 − 37.212e−t/4.001
R2 = 0.991
Q = 40.900 − 41.980e−t/2.954
R2 = 0.992
BoxLucas1ModQ = 41.044 × (1 − 0.721t)
R2 = 0.996
Q = 36.05 × (1 − 0.790t)
R2 = 0.989
Q = 41.044 × (1 − 0.721t)
R2 = 0.992
Table 5. Diameter of bacteriostatic circle of each active ingredient.
Active IngredientInhibition Zone Diameter (mm)
S. aureusE. coliP. aeruginosaC. albicansA. niger
HACC9.48.510.311.49.1
GA-----
CEO31.822.725.128.718.9
CEO-microcapsule19.517.518.118.716.3
Note: “-” indicates that the substance has no inhibition circle.
Table 6. The minimum inhibitory concentration value of each antibacterial active ingredient.
Active IngredientMinimum Inhibitory Concentration (μL/mL)
S. aureusE. coliP. aeruginosaC. albicansA. niger
HACC820.50.254
GA-----
CEO0.390.390.780.10.2
CEO-microcapsule7147714
Note: “-” indicates that no antibacterial activity was detected for the substance.
Disclaimer/Publisher’s Note: The statements, opinions and data contained in all publications are solely those of the individual author(s) and contributor(s) and not of MDPI and/or the editor(s). MDPI and/or the editor(s) disclaim responsibility for any injury to people or property resulting from any ideas, methods, instructions or products referred to in the content.

