Article

1,4-Bis(trimethylsilyl)piperazine—Thermal Properties and Application as CVD Precursor

1
Laboratory of Functional Films and Coatings, Nikolaev Institute of Inorganic Chemistry, SB RAS, Novosibirsk 630090, Russia
2
Laboratory of Thermodynamics of Inorganic Materials, Nikolaev Institute of Inorganic Chemistry, SB RAS, Novosibirsk 630090, Russia
3
Laboratory of Medical and Pharmaceutical Chemistry, A.E. Favorsky Irkutsk Institute of Chemistry, SB RAS, Irkutsk 664033, Russia
*
Authors to whom correspondence should be addressed.
Coatings 2023, 13(6), 1045; https://doi.org/10.3390/coatings13061045
Submission received: 18 May 2023 / Revised: 1 June 2023 / Accepted: 2 June 2023 / Published: 5 June 2023
(This article belongs to the Section Surface Characterization, Deposition and Modification)

Abstract

:
We report an investigation into 1,4-Bis-N,N-(trimethylsilyl)piperazine (BTMSP) as a novel precursor for the synthesis of silicon carbonitride films by chemical vapor deposition (CVD). The thermal stability, temperature dependence of vapor pressure and thermodynamic constants of the evaporation process of BTMSP were determined by static tensimetry with a glass membrane zero manometer. The transformation of the compound in low-power (25 W) plasma conditions was investigated by optical emission spectroscopy. It was shown that BTMSP undergoes destruction, accompanied by H and CH elimination and CN formation. SiCN(H) films were deposited in a hot-wall plasma-enhanced CVD reactor. The optical properties of the films were studied by spectral ellipsometry (refractive index: 1.5–2.2; absorption coefficient: 0–0.12) and UV–Vis spectroscopy (transmittance: up to 95%; optical bandgap: 1.6–4.9 eV). Information on the aging behavior of the films is also provided. The transformation of the films occurred through water adsorption and the formation of Si–O bonds with the degradation of Si–H, N–H and Si–CHx–Si bonds.

1. Introduction

Interest in silicon carbonitride thin films and coatings has accelerated over the last forty years due to their important chemical, electrical, optical and mechanical properties and their potential to enable new devices [1,2,3,4,5].
At present, different deposition techniques for SiCxNy films synthesis are developed, and new field of their applications are searching. Amorphous SiCxNy thin films and coatings can be obtained both by physical (PVD) [6,7,8,9] and chemical (CVD) [10,11,12,13] vapor deposition techniques. It should be noted that plasma-enhanced chemical vapor deposition (PECVD) is now widely being used to form these films and coatings. Silicon carbonitride films can be obtained in several ways, which can be classified by the nature of their precursors as follows: (a) multi-source precursors based on silane or silicon halides and hydrocarbons (CH4, C2H2) in a mixture with H2, NH3 or N2; and (b) organosilicon volatile compounds as single-source precursors with the addition of Ar, He, H2, N2 or NH3. It should be noted that these compounds have important advantages, namely non-toxicity, incombustibility, a high volatility and storage stability under normal conditions. The compounds include all the elements that are necessary for silicon carbonitride film formation (silicon, carbon, nitride), and also bonds between them. The use of these single-source precursors simplifies the CVD setup and technological process.
The PECVD method allows us to reduce the film growth temperature, achieving a high growth rate and good adhesion to substrates. The elemental composition, chemical bonding structure, physicochemical properties and functional characteristics of the synthesized SiCxNy films substantially depend on the nature of the organosilicon precursor, on the features of the method used for film formation and on characteristics of the process, such as the deposition temperature and composition of the reaction gas phase. Numerous studies on the PECVD process involving different classes of organosilicon compounds have been carried out and are continuing to be carried out as novel precursors are developed. To date, many organosilicon compounds, such as organosilanes, linear and cyclic silazanes, aminosilanes, carbodiimides and hydrazinosilanes, have been tested as CVD precursors [14].
Although films and coatings of silicon carbonitride have been studied for a long time, its structure and properties are still the subject of research and discussion, which can be explained by a wide variety of methods for synthesizing layers and the deposition parameters, which determine the properties of the material. An analysis of the literature allows us to draw the following generalizations on CVD synthesis processes and film properties:
(a)
It is possible to change both the elemental composition with a wide range and the local environment of atoms of silicon carbonitrides by varying experimental conditions, including the gas-phase activation method (thermal, plasma, laser); the substrate material; the nature of the precursors, additional gases, and gas activator; the substrate temperature; the composition of the reaction gas mixture; the total pressure in the reactor chamber; as well as the parameters of the plasma generator (in the case of PECVD processes), the laser wavelength and power (in the case of LCVD processes), and other deposition parameters appropriate to a particular method. The desired properties of SiCxNy films are achieved by the optimization of the deposition process, including the choice of the proper precursor and deposition parameters.
(b)
Given that the properties of the films, in addition to the above parameters, are affected by the geometry of the reactor, it is interesting to identify the influence of the design of the precursors in a series of works in which the processes using various organosilicon compounds were studied with the same experimental setup [15,16,17,18,19,20,21,22].
(c)
Films obtained at low synthesis temperatures (below 300 °C) and a low input power of plasma are a polymer-like hydrogenated material. They contain organic functionalities, such as Si–CH3, CHx, NHx and Si–H bonds. The compositions of these films are described by the general formula of SiCxNy(Oz):H. The high input power or the high substrate temperature contribute to the destruction of organic groups and hydrogen-containing bonds and to the formation of a silicon carbonitride network, leading to the growth in the density of SiCxNy films [15].
(d)
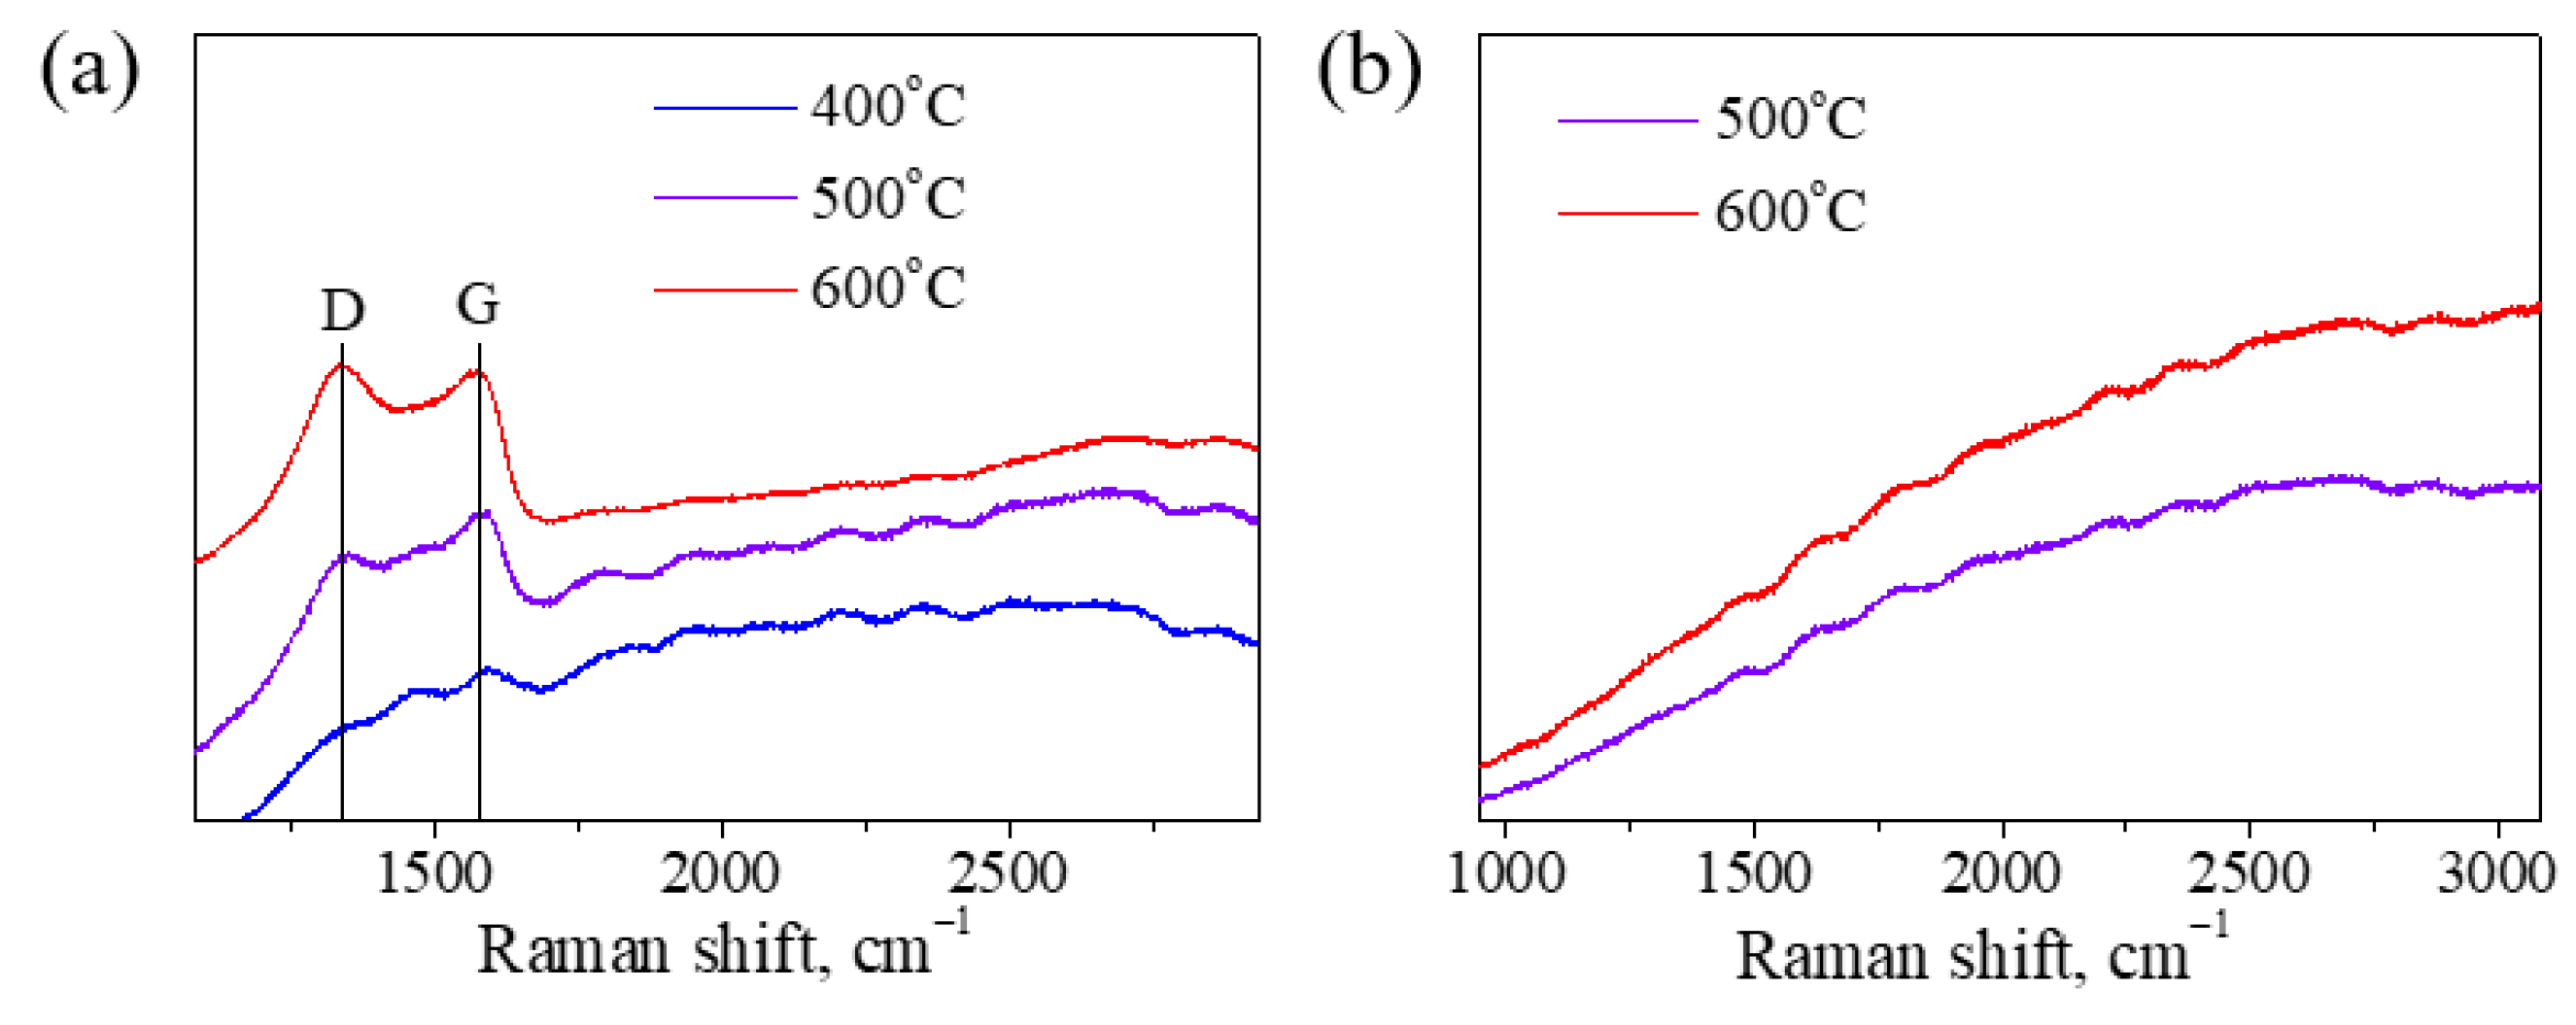
High decomposition temperatures (≥500 °C) of the precursor promote the appearance of an additional phase of amorphous graphite-like carbon in the films.
(e)
The structure of the precursor has a strong influence on the composition and chemical structure of the films. The silicon-to-nitrogen ratio of the precursor molecule is also an important factor. For example, some studies were carried out with dimethylaminosilanes [HxMeySi(NMe2)4–x–y]. The authors [22] reported that in the case of using a precursor with a ratio of Si:N = 1:1, films close to SiC were obtained, and with a ratio of 1:3, SiNx-like films were produced.
(f)
The addition of N2 or NH3 to organosilicon compounds in the initial gas mixture was used in order to increase the [N]:[Si] ratio and to control the carbon content in the films.
(g)
The silicon carbonitride films contained up to 20 at.% of oxygen, which is believed to be due to the plasma etching of the walls of the quartz reactor, as well as the moisture or oxygen uptake during the CVD process and/or after exposure to air. An increase in the synthesis temperature contributes to a decrease in the oxygen content in the films.
(h)
Low-temperature SiCxNy(Oz):H films have a low dielectric constant, high transmittance (IR and visible regions of the spectrum) and a large band gap. High-temperature SiCxNy films possess high values for their hardness and Young’s modulus. A smooth change in the element composition of the films makes tuning the functional performance possible, such as the refractive index and band gap.
(i)
The increase in the content of Si−C bonds in a-SiCN films causes an increase in their density, refractive index, adhesive critical load, hardness, elastic modulus and plasticity index [15,16].
(j)
A limited number of works are devoted to studying the aging and stability of the composition and functional properties of silicon carbonitride films during storage in air and upon annealing.
(k)
Very few works have been conducted on the study of the decomposition processes of organosilicon compounds in plasma. The information on mechanisms of monomer transformation in gas phase and film formation is limited. The plasma diagnostic provides the information on the species involved in the PECVD process, which is necessary both for controlling the elemental composition and the chemical bonding structure of films as well as for further improving the film deposition technology.
During the plasma-stimulated CVD process, the components of the initial gas mixture are ionized and dissociated by electron impact; as a result, chemically active ions and radicals are formed, which take part in the reactions in the gas phase and at the surface of the substrate and growth of film. Infrared absorption (IR) spectroscopy and optical emission spectroscopy (OES) are used as diagnostic tools for the in situ study of the plasma phase. The first one is useful in obtaining an overview of the infrared active species present in the plasma; as a rule, these are active fragments of the precursor molecules. The second one is a diagnostic technique to obtain information on the active species in the plasma, namely the atoms, molecules, ions and radicals emitting in the UV–Vis region. It should be emphasized that these species are not determined by IR spectroscopy. Thus, these methods complement each other; therefore, for a more complete description of the composition of the gas phase, it is useful to use them together. Unfortunately, we are aware of only two works [23,24], in which this approach for the study of PECVD SiCxNy films was used.
The authors of [23] used inductively coupled plasma CVD with bis(dimethylamino)dimethylsilane Me2Si(NMe2)2 (BDMADMS). Their results indicated that the precursor is destroyed even at a low level of plasma power, and in the IR spectra, the intensity of all absorption bands of the precursor drastically decrease and the bands disappear almost completely at 700 W. Thus, the precursor fragmentation increases with increasing power. The IR spectra study also showed the presence of the fragments with the Me and SiMe groups, as well as CH4, HCN, C2H2 and CO2 species in the plasma. The authors suggested that the main fragmentation steps of the precursor involve the cleavage of the Si–N bond and the conversion of the –NMe2 group. The OES spectra showed the presence of H, CH, H2, CN, NH and N2 species. Silicon emissions were observed only when Ar was added to the initial gas mixture.
In the second work [24], OES and IR spectroscopy was used for the plasma decomposition of hexamethyldisilazane (Me3Si)2NH (HMDSN) in a mixture with Ar + H2 + N2 in the MWCVD process. The authors found that immediately after the plasma ignition, all the absorption bands of HMDSN in the IR spectra vanished, which indicates the precursor’s dissociation. At the same time, the absorption bands of new particles (CH4, C2H2, HCN) appeared in the spectra. Studying the effect of nitrogen concentration in the gas phase, the authors found that the nitrogen addition led to a higher formation of HCN and a diminishing of CH4 and C2H2 species. An increase in the intensity of CN and NH emission lines in the OES spectra was also found with the introduction of nitrogen. The formation of CN radicals caused a decrease in the carbon content in the SiCxNy films. The increase in the nitrogen content in the initial mixture contributed to the appearance of a greater number of Si–N bonds and the films becoming SiNx-like.
A similar trend of the substitution of Si–C by the Si–N bonds in SiCxNy films was also observed in [25], in which the plasma-phase composition was studied by the OES method with the decomposition of a mixture of tetramethyldisilazane with Ar + N2 in the ICP CVD process.
The composition of the films is also affected by the presence of the NH radical. According to [26], there is a correlation between the concentration and the film deposition rate, as well as the chemical structure of the SiCxNy film. An increase in the NH concentration leads to an increase in the deposition rate, which is attributed to the reactions of NH, resulting in the formation of the Si–NH–C bonds in the films.
Table 1 presents the above-mentioned information and other examples of studying the composition of the gas phase during the decomposition of organosilicon compounds in PECVD processes. It should be noted that silicon was detected only in ICP CVD processes, which indicates a deep destruction of the organosilicon precursors.
1,4-Bis-N,N-(trimethylsilyl)piperazine (BTMSP) is interesting for SiCxNy:H deposition because it contains Me3Si–N–Cx units. This article considers some aspects of the synthesis and characterization of BTMSP Me3SiN(CH2CH2)2NSiMe3 (Figure 1). Particular attention is paid to the study of the volatility of this compound and the characterization of its activation in the plasma process. A novel PECVD process for the deposition of silicon carbonitride films and the problem of correlating plasma-phase chemistry with deposited film composition will be described.

2. Materials and Methods

2.1. Materials

1,4-Bis-N,N-(trimethylsilyl)piperazine (BTMSP) Me3SiN(CH2CH2)2NSiMe3 was obtained as described below using freshly distilled precursors. The solvents were dried using standard methods. The purity (99.6%) of the compounds obtained was controlled by 1H NMR and capillary chromatography.
For PECVD syntheses, high-purity helium, hydrogen and ammonia were applied as plasma-forming gases. The films were deposited on the polished Si(100) and Ge(111) wafers and fused silica slides. All the substrates were preliminarily degreased by boiling them in trichlorethylene and acetone and then washed in deionized water. Si(100) substrates were then treated in ammonia peroxide and hydrochloric peroxide solutions. Native SiO2 layer was removed by HF solution. Ge substrates were treated in HNO3/HF/HCOOH solution after degreasing them. After a final clean in deionized water, the films were dried in a flow of nitrogen. All reagents were ‘extra pure’.

2.2. Synthesis

2.2.1. 1,4-Bis(trimethylsilyl)piperazine

Volumes of 300 mL of diethyl ether (2.86 mol), 52.9 mL of triethylamine (380 mmol) and 14.64 g of piperazine (170 mmol) were placed into a flask equipped with a stirrer, drop funnel and reflux condenser. With stirring, 41.60 g of trimethylchlorosilane (380 mmol) was added drop-wise, after which the reaction mixture was kept for 1 h at room temperature and then moderate heated for 6 h. The precipitate was filtered off and washed with ether. The filtrate was combined and the solvent was removed by distillation. The final product, 1,4-Bis-N,N-(trimethylsilyl)piperazine, was isolated by fractional distillation under reduced pressure (bp: 210–216 °C; mp: 23.5–24 °C; 1H NMR (CDCl3) ppm: 0.02 (9H, s, Me3Si), 2.69 (4H, s, 2CH2); 13C NMR (CDCl3), ppm: 1.11 (Me3Si), 47.85 (CH2); 29Si NMR (CDCl3), ppm: 5.18; MS m/z (Irel, %): 230 ([M]+, 45), 215 ([M]+-15, 30), 186 (3), 157 (15), 128 (55), 116 (52), 101 (35), 86 (35), 73 (100), 59 (30), 45 (22), 43 (10)).

2.2.2. Thin Film Preparation

SiCN(H) films were produced by PECVD. The films were deposited on silicon, germanium and fused silica substrates. The deposition temperature was varied in the range of 200–600 °C. The experimental setup was powered by RF generator (40.68 MHz) operated at 25 W. BTMSP was utilized as precursor. The precursor container was heated to 25 °C by a thermostatic water bath. Helium, hydrogen or ammonia were used as plasma-forming and reactive gases. These gases were passed through the inductor, and then the activated plasma was combined with the precursor vapors. The base pressure in the reactor was 4·10−3 Torr, and the working pressures of plasma-forming gas and precursor were 6·10−3 and 1.5·10−2 Torr, respectively.

2.3. Characterization

2.3.1. Volatility of BTMSP

Saturated vapor pressures were measured using static tensimetry with a glass membrane zero manometer. The scheme of the equipment is described in detail in [29]. The fundamentals of the method and details of the experimental technique are presented in [30]. To measure vapor pressure over the liquid BTMSP, the static tensimetry method was used in the range of T  =  295–418 K. The uncertainty in the pressure measurements was within 65 Pa, and the temperature was maintained and measured with an error of 0.5 K. The compound was placed in a closed vacuumed volume bordered by a sensitive membrane. Direct measurements of saturated vapor pressure were performed after reaching equilibrium at a given temperature. The data were processed by the method of least squares to obtain the values of evaporation characteristics, according to [31]. The data were used to calculate the thermodynamic characteristics of the vaporization process (Δevap.H(Tav.) and ΔS°(Tav.)), where Tav. is the average temperature of the studied temperature range.

2.3.2. Plasma Composition

The chemical composition of plasma was studied by means of optical emission spectroscopy. The plasma emission spectra were recorded with multichannel spectrometer ‘Kolibri-2′ (VMK ‘Optoelectronika’, Novosibirsk, Russia) in the wavelength range from 200 to 1000 nm with resolution of 1 nm. The spectrometer detector consists of a 2580-element linear photodiode array. Temperature stabilization of photodiode array was supported by a two-stage Peltier module and digital temperature sensor. Atomic line identification was carried out in correspondence with NIST atomic line database in [32,33].

2.3.3. Chemical Bonding Structure and Elemental Composition of the Films

Chemical bonding structure of SiCN(H) films deposited on Si(100) substrates was analyzed by Fourier transform infrared spectroscopy (FTIR) and Raman spectroscopy.
FTIR spectra were recorded at room temperature by use of FTIR spectrophotometer SCIMITAR FTS 2000 (Digilab, Hopkinton, MA, USA) in transmission mode in the range of 400–4000 cm−1 with a resolution of 2 cm−1. The cleaned Si(100) wafer was used to subtract the background spectrum. Each spectrum was normalized to the thickness of the film in order to compare the data.
Raman spectra were obtained at room temperature using a LabRAM HR Evolution (Horiba, Kyoto, Japan) spectrometer, equipped with 632.8 nm excitation from He-Ne laser in a wavenumber range of 400–1800 cm−1.
Elemental composition of the SiCN(H)/Ge(111) samples was investigated by energy-dispersive X-ray (EDX) spectroscopy. For the analysis, scanning electron microscope JEOL JSM 6700F (Jeol, Tokyo, Japan) equipped with EX-23000 BU EDX system was used at an accelerated voltage of 5 keV in secondary electron mode.

2.3.4. Thickness and Optical Properties

The film thickness, refractive index n and extinction coefficient k of the films deposited on Si(100) wafers were determined using spectroscopic ellipsometer Ellis-1991 (produced by ISP SB RAS, Novosibirsk).
Transmittance of the SiCN(H)/SiO2 samples was determined by UV–Vis spectroscopy by use of Shimadzu UV–3101PC scanning spectrophotometer (Shimadzu, Kyoto, Japan) in the range of 200–2000 nm with a resolution of 2 nm. The optical bandgap values were estimated from transmittance curves using Tauc’s model [34].

3. Results and Discussion

3.1. Volatility of BTMSP

Data on the volatility of a substance and its thermal stability are important parameters for determining its suitability as a precursor in CVD processes. Knowledge of the temperature dependence of vapor pressure allows us to choose the optimal conditions for precursor utilization. The volatility of BTMSP was characterized by static tensimetry using a glass membrane zero manometer. Two series of measurements upon heating and cooling in the temperature range of 293–417 K were carried out to obtain the data set. The experimental vapor pressures are listed in Table 2 and depicted in Figure 2.
The results for all of the heating–cooling series are in good agreement. Figure 2a demonstrates that there is no systematic deviation between the measured and calculated values of vapor pressure in the whole experimental temperature range, pointing out that the evaporation of the compound takes place without its decomposition. The temperature dependence in the range of 295–417 K is described by the following equation:
ln (P/) ± t·σ = AB/T
where A = 9.91, B = 4798, t is the Student’s t coefficient and σ2(ln(P/)) = 274.70/T2–1.4065/T + 0.0018.
The values of the standard enthalpy and entropy of vaporization were calculated using the following equation:
P/P° = exp(–Δevap.H(Tav.)/RT + ΔS°(Tav.)/R)
where is the standard pressure, T is the temperature, and Δevap.H(Tav.) and ΔS°(Tav.) are the evaporation enthalpy and entropy at the average temperature Tav. of the experimental temperature range. The following values were obtained: Δevap.H(Tav.) = 39.9 ± 0.1 kJ/mol and ΔS°(Tav.) = 82.4 ± 0.4 J/mol·K.
In order to select the impact of the structure of the molecule and its molecular mass on the volatility of the substances, the vapor pressure temperature dependence of BTMSP (M = 230 g/mol) was compared with that of the literature data of the volatility for N(SiM3)3 and PhN(SiMe3)2 with M = 233 and 237 g/mol, respectively [29,35] (Figure 2b). The data are also presented for hexamethyldisilazane (M = 161 g/mol) [29], which is the most utilized precursor for the synthesis of silicon carbonitride films. Hexamethyldisilazane, having a significantly lower molecular weight, possesses a higher volatility among the compounds, but the vapor pressure of all four substances is enough to use them as precursors. When comparing compounds of similar molecular weights, it should be noted that the saturated vapor pressure differs mainly in the low temperature region; however, this temperature range is mainly used to perform CVD processes. In conclusion, the saturated vapor pressure decreases in the following order: trisilazane—disilazane—BTMSP.

3.2. Synthesis and Characterization of PECVD SiCN(H) Films

The BTMSP compound was tested as a precursor for the synthesis of silicon carbonitride films by PECVD. Three additional gases were chosen as plasma-forming and reactive gases—He, NH3 and H2. The plasma chemistry was characterized by OES. The film deposition was carried out in the deposition temperature range of 200–600 °C and a plasma power of 25 W. Using a low plasma power allows us to serve large fragments from the precursor with certain bonds between elements and promote its incorporation into the growing film. The SiCN(H) films were investigated in terms of their chemical bonding structure and elemental composition. The stability of the films during storage in ambient conditions was also studied. The optical and dielectric properties of the films were measured. Information on the deposition conditions, deposition rate, elemental composition and optical properties of the films is collected in Table 3. The thicknesses of the films were 150–900 nm, depending on the deposition conditions.

3.2.1. Plasma Characterization

The chemical composition of the plasma was investigated at different operating conditions by OES. This method is commonly used for diagnostics on low-temperature plasma [36]. All the analyzed gas mixtures were formed with the same partial pressures of BTMSP and an additional gas. Figure 3 represents the emission spectra of different gas mixtures at 25 W at room temperature. The emitting species were attributed according to [32]. The spectra were normalized to the intensity of the band at 387 nm related to the CN radical. The emitting species registered are attributed to H, H2, CH radicals, and also N-containing CN and N2 species. The emission spectra of the plasma are similar for pure BTMSP and its mixture with H2 or He. The most intensive bands are attributed to the CN and H species. The presence of the CN radical is explained by the high affinity of carbon to nitrogen. It could originate from two potential sources. First, the deep decomposition of the precursor molecule with the elimination of this species could occur. Second, it could be formed in the gas phase in the reaction of the CH radical with the N-containing species from the residual air in the reactor. Another intensive band is attributed to atomic H. The appearance of this line is expected, as an elimination of H radicals from –CH3 groups is typical for organosilicon plasmas. For this reason, hydrogen’s addition into the reactive mixture did not change the chemistry of the gas phase, as presented in Figure 3a. The spectrum of the BTMSP/NH3 mixture differed significantly. It is characterized by a predominance of the molecular bands of the second positive nitrogen system N2 and the bands of the violet and red systems of the free radical cyanide CN. The atomic lines and molecular bands of hydrogen are also clearly detected. The band of the CH free radical at 430 nm is detectable but has a relatively low intensity.
To elucidate the influence of the deposition temperature on the intensity of the lines and bands of the plasma components, the reactor was heated up to 600 °C. Figure 3b demonstrates the ratio of the CH free radical band intensity to the Hγ hydrogen line intensity for the BTMSP/He mixture. I(CH)/I(Hγ) can be considered as an indicator of the depth of the precursor decomposition, which is expressed as the elimination of methyl groups from the BTMSP molecule. The growth of this parameter with the temperature in the reactor can be explained by the presence of thermal decomposition along with plasma chemical decomposition. The emission spectra do not include bands of silicon-containing species: SiH signals or atomic lines of silicon. In this regard, it is assumed that the decomposition of BTMSP occurs within the trimethylsilyl substituent.

3.2.2. Chemical Bonding Structure and Elemental Composition

Figure 4 shows the evolution of the FTIR spectra of SiCN(H) films deposited using BTMSP as a precursor and He, NH3 and H2 as plasma-forming gases, with an increase in deposition temperature. The characteristic absorption bands assigned according to the literature data are listed in Table 4.
The low-temperature films contained a variety of different bonds, which are expressed as a set of intensive peaks in the FTIR spectra. The absorption bands at 816, 926, 1020 and 1105 cm−1 are assigned to the Si–C, Si–N, Si–CHx–Si and Si–O vibration modes, respectively. These absorption bands were registered for the spectra of the low-temperature films (200–300 °C) deposited using every plasma-forming gas. The most intensive band in spectra of the films produced using the BTMSP/He and BTMSP/NH3 gas mixtures was attributed to the Si–N vibration. The use of H2 as a plasma-forming gas led to a change in the character of the FTIR spectra. The peaks attributed to the Si–C and Si–CHx–Si vibration modes became the most intensive, probably due to the destruction of the Si–N fragment by the active hydrogen species formed by the decomposition of the molecular hydrogen in plasma.
The rise in the deposition temperature (400–600 °C) led to a narrowing of the absorption band at 800–1200 cm−1 with the domination of components attributed to the Si–C and Si–CHx–Si modes for the films produced from the BTMSP/He and BTMSP/H2 gas mixtures (Figure 4a,c). In contrast, for the BTMSP/NH3 gas mixture, a gradual shift in the single maximum from 820 to 850 cm−1 was observed (insert in Figure 4b), pointing to the presence of both Si–C and Si–N or the transition to the SiNx film with the formation of Si–N3 bonds in high-temperature films. The bonding structure of the film will be discussed below, along with the elemental composition data.
The absorption bands at 1255 and 2850–3000 cm−1 are assigned to the deformation Si–CH3 and valence C–H modes, respectively. The intensity of these bands decreased with the rise in the deposition temperature up to 500 °C, regardless of the additional gas, showing that the temperature induced the elimination of the hydrocarbon groups. The absorption bands at 1600 and 2180 cm−1 are attributed to the C=N and C≡N vibration modes. These bonds are not presented in the precursor molecule but were formed in the PECVD process with a rise in the deposition temperature. According to the FTIR data, the spectra of the samples prepared using the BTMSP/He gas mixture contained a C=N bond at 600 °C and a C≡N bond even at 400 °C and higher. The use of reactive ammonia as a plasma-forming gas resulted in the additional incorporation of nitrogen into the growing film with the formation of a C=N bond at 500 °C and a nitrile group in the whole deposition temperature range. In contrast, these bands are not pronounced in the spectra of the films deposited from the BTMSP/H2 mixture. The absorption bands at 3200–3400 cm−1 and 1180 cm−1, assigned to the valence and bending N–H bond vibrations, correspondingly, were detected only in the FTIR spectra of the SiCN(H) films deposited using BTMSP/NH3, and its relative intensity rose with the increasing deposition temperature. As this bond was not presented in the precursor molecule, it seems that its formation was due to the incorporation of the fragments that appeared in ammonia plasma. For most of the samples, an absorption band at 1100 cm−1 attributed to the vibrations of the Si–O bond was observed.
To determine the state of carbon in the films, the Raman spectra were recorded. Figure 5 presents the spectra of the SiCN(H) films produced from the BTMSP/H2 and BTMSP/NH3 initial gas mixtures. The spectra of the films deposited from the BTMSP/He mixture are similar to that of the BTMSP/H2 mixture and are not presented here. All of the spectra contained a strong fluorescent background, which is typical for SiCN prepared at temperatures below 1000 °C [46]. The spectra of films produced using the BTMSP/H2 (and BTMSP/He) gas mixtures at the deposition temperatures of 500–600 °C differed in terms of the presence of additional peaks. Two characteristic absorptions at Raman shifts of 1340 and 1580 cm−1 were detected. The set of these peaks is typical for the disordered carbon phase. The vibration band at 1340 is due to the disorder-induced D-mode. The signal at 1580 cm−1 is assigned to the tangential G-band derived from the graphite-like in-plane mode [47]. The use of ammonia as a plasma-forming gas allowed us to avoid the formation of the free carbon phase, which is confirmed by the absence of peaks in the spectra in Figure 5b.
The elemental composition of the films was estimated by EDX. The analysis showed that the films were formed of silicon, carbon, nitrogen and oxygen. The oxygen content differed depending on the synthesis temperature and the composition of the initial gas mixture. The main reasons for the appearance of oxygen in the films are the low residual vacuum, as well as the oxidation of the samples after their removal from the reaction chamber. The highest oxygen content was observed for the low-temperature films. A rise in the synthesis temperature resulted in the formation of less oxidized films. The mostly O-rich samples were formed using the BTMSP/NH3 reactive mixture. The same observations are presented in the literature; the authors of [25] proposed the oxidation of N–H bonds during storage in ambient conditions as a main reason for the increase in oxygen concentration.
The evolution of Si, C, N and O content for various gas mixtures with an increase in the deposition temperature is shown in Figure 6. It should be noted that the replacement of helium by hydrogen in the initial gas phase did not cause significant changes in the elemental composition. A slight difference is associated with the lowering of carbon content, which is assumed to originate from the more effective elimination of hydrocarbon fragments in the case of the BTMSP/H2 gas mixture, as was shown by FTIR spectroscopy.
The introduction of ammonia into the reactive gas mixture led to a drastic change in elemental composition. The decrease in carbon concentration was accompanied by a growth of the nitrogen and silicon content. According to OES data, the intensity of the CN emission line increased while the ammonia was added to the gas phase. It could be proposed that the carbon from the precursor molecule was involved in the reactions, leading to creation of volatile CN species. The [N]/[Si] ratio rose from 1 to 1.54 with a deposition temperature change from 300 to 600 °C, indicating the reaction of the growing film with activated ammonia, along with the thermally induced elimination of hydrocarbon fragments. This is in consistent with the FTIR spectroscopy data, which showed the appearance of absorption bands of N–H, C=N and nitrile bonds. As the temperature rose to 500 °C, the carbon content reached a minimum, which was less than 10 at.%. Taking into account the data of the FTIR analysis, which showed a shift in the position of the main maximum to 850 cm−1, it can be concluded that the the film was transformed into the SiNx-like material with the inclusions of N–H, C=N and nitrile fragments.

3.2.3. Evolution of Bonding Structure during Storage in Ambient Conditions

The stability of the films during storage under ambient conditions was investigated by FTIR spectroscopy. Figure 7a,b shows the change in the FTIR spectra of the films synthesized at temperatures of 200 and 400 °C from a BTMSP/NH3 gas mixture. The behavior of samples during storage in air is different for samples obtained at various temperatures.
The low-temperature films underwent changes throughout the whole storage time. The evolution of the FTIR spectra concerned absorption bands in the region of 3000–3700 cm−1, as well as 1670 cm−1, corresponding to the stretching and bending vibrations of the O–H bonds, which may indicate both the oxidation of silicon with the formation of the Si–OH groups and the adsorption of water by the film surface. At the same time, a decrease in the intensity of the peak corresponding to the vibration of the Si–H bond was observed.
Figure 7c,d shows the deconvolution of a wide absorption band in the region of 600–1350 cm−1 of the SiCN(H) film (deposited at 200 °C) recorded directly after synthesis and after 52 days of storage. An increase in the intensity of the components corresponding to the Si–O and O–H vibrations was observed along with a decrease in the relative intensity of Si–CHx–Si and N–H. The correlation between the intensities of the Si–C and Si–N components remained nearly the same. Thus, the process of the degradation of the films during storage under ambient conditions is probably associated with the oxidation of Si–H and Si–CHx–Si bonds with the formation of Si–O and Si–OH bonds. The instability of the N–H bond was also observed. The contribution of its component in the spectrum of the as-deposited film was comparable to the peak related to the Si–CH3 vibration, but after 52 days, the peak was not observed.
The sample deposited at 400 °C demonstrated a greater stability (Figure 7b). The same position of the maximum of the main peak and the absence of additional absorption bands were observed. Changes in the FTIR spectra in this case included the absorption bands at 3000–3700 cm−1 and 1110 cm−1, which indicated a slight oxidation of the sample with the formation of the Si–O bond and the absorption of water from the environment by the film.
A limited number of works have studied the aging of SiCN(H) film. In [25], the degradation of the Si–H/nitrile absorption band along with the appearance of a Si–O–Si bond were observed. Several groups of researchers [48,49] have suggested that the Si–H bond, which has the lowest energy among other, undergoes a transformation with formation of Si–O bond. In [50], it was shown that the oxidation resistance of the film decreased with the rise in the ammonia concentration in the initial gas mixture. The authors demonstrated that the oxidation goes through the formation of Si–O and C–O bonds. In [51], it was also shown that oxygen from the environment easily diffuses to Si–H and C–H bonds, forming –OH bonds over time. The presented literature data are consistent with the changes presented in this study.
Under the ‘silicon carbonitride’ material, two types of non-stochiometric compounds are understood: ceramic-like SiCxNy and highly hydrogenated SiCxNy:H. The first one possesses a stability in its composition and properties, even while being annealed at a high temperature, which was demonstrated in [52]. Low-temperature films of SiCxNy:H, which contain an excess of carbon and are characterized by intense peaks of hydrogen-containing bonds absorptions in the FTIR spectra, can be regarded as plasma polymers with heteroatoms. The processes of changing the composition and properties of plasma polymer films (PPF) are well studied [53,54,55]. In general, PPFs contain free radicals trapped within the plasma polymer network, which is formed in cross-linking reactions. The presence of such highly reactive radicals leads to post-deposition changes that take place for most PPFs. Nitrogen-containing groups, such as amines, imines and nitriles, also undergo reactions with air [56,57]. The aging processes involve the incorporation of polar groups into the surface layers and surface restructuring accompanied by the transport of polar groups away from the immediate surface region to deeper regions of the polymer. Post-deposition aging processes that occur on the surface include the recombination of near-surface free radicals by interacting with gas-phase species, such as atmospheric oxygen or water vapor. Several approaches have been proposed to lower the change in the film’s structure and properties. The most reliable way to reduce the number of free radicals is to improve the cross-linking structure of the film and reduce its porosity (changing plasma power, deposition temperature or gas phase composition). Another way to reduce post-deposition interactions with water vapors is to increase the hydrophilicity of the surface. However, this will inevitably change the structure of the films and their functional properties. In order to serve the functionality of the films, other strategies can be applied as follows: (1) the formation of a vertical chemical gradient structure in the coating; and (2) post-plasma grafting (e.g., annealing at the deposition temperature). The described methods can be applied for the stabilization of the composition of low-temperature plasma-polymerized SiCN(H) films.

3.2.4. Deposition Rate and Surface Morphology

The deposition rate is one of the main technological parameters that characterizes the suitability of a compound as a precursor in the CVD process. The growth rate of the SiCN(H) films was calculated by dividing the ellipsometric thickness by the deposition time. The dependences of the deposition rate on the synthesis temperature for the different initial gas mixtures are presented in Figure 8. The low-temperature films are characterized by a growth rate of 16–28 nm/min. The change in the plasma-forming gas from helium to hydrogen led to a decrease in the rate value. Taking into account the FTIR spectra, it can be proposed that the densification of the film due to the elimination of hydrocarbon fragments took place. For the BTMSP/H2 mixture, it was accompanied by the breaking of the Si–N bonds in the reaction with the active hydrogen species. An increase in the deposition temperature to 400 °C led to a decrease in the deposition rate to 5–7 nm/min, and further heating the substrate did not change the values of the growth rate. Such behavior is typical for PECVD processes [15]. One of the reasons explaining this tendency is the decrease in the adsorption of the precursor’s moieties on the surface of the substrate. The second is due to the increased influence of thermal annealing provided by the heating of the growing film. It should be noted that the thermal decomposition of BTMSP at the temperatures of 400–600 ℃ shown by OES did not change the deposition rate. Thus, a polymeric-like low-temperature film which included a set of hydrogen-containing bonds was gradually transformed to a highly crosslinked film. It was confirmed by FTIR and EDX analyses that showed a decrease in the concentration of the C–H bonds along with a decrease in the carbon content.
Figure 8 presents typical SEM images of the surface morphologies for SiCN(H) films produced at deposition temperatures of 200, 400 and 600 °C. No cracks were detected and no oriented crystalline forms were observed, indicating their amorphous state. The surface morphologies were determined by deposition temperatures and were similar for all three of the initial gas mixtures. According to these images, the surfaces of the films are uniform, covered with ‘globule-like’ features. Their average size decreased from 80 to 10 nm with the increasing deposition temperature. The analogous change in the surface was presented in [58], in which the authors proposed the Volmer–Weber mechanism for the growth of low-temperature films: the species coming from the gas phase gets absorbed on the substrate, and the film formation occurs without the migration of the particles on the surface. The rise in the deposition temperature leads to a supply of additional energy and a change to the Frank–Vander Merwe growth regime with a formation of dense film. The presence of large globules on the surface of low-temperature films may indicate its porosity, which, in turn, could contribute to the active change in the structure of the films, which was demonstrated above.

3.2.5. Optical Properties

The optical properties of the films were studied in terms of the refractive index n, extinction coefficient k, transmittance and optical bandgap.
The temperature dependences of the refractive index and extinction coefficient of the SiCN(H) films determined by spectral ellipsometry are presented in Figure 9. The tendencies of changes in n are similar for all three gas mixtures. The minimum refractive index was registered at deposition temperatures of 200–300 °C and was 1.50–1.60. It can be noticed that the n value of the SiCN(H) film deposited using the BTMSP/He mixture is slightly higher than those obtained from the BTMSP/H2 and BTMSP/NH3 mixtures. A further rise in the synthesis temperature led to the monotonic growth in the n values up to 1.8–2.2. The films produced from the BTMSP/NH3 mixture are characterized by the lowest refractive index in the whole deposition temperature range. According to the Lorentz–Lorenz correlation, the refractive index depends mainly on the density of the films and chemical composition [59]. The general rise in n with the deposition temperature could be associated with the densification of the film, which was shown by Prof. Wrobel’s group for a number of organosilicon precursors [16]. Additionally, it was determined that the increasing content of the Si–C crosslinks in the network (among other bonds) was the most important factor for the increase in film density, which in turn led to an increase in the refractive index. The difference in n at the same temperature for various gas mixtures may be explained by a change in composition. In [60], a model for the interpretation of the refractive index in terms of the combination of Si–C (n = 2.5), C–N (n = 2.8) and Si–N (n = 1.85) bonds is proposed. Additionally, Si–O bonds should be regarded. The refractive index for SiO2 is 1.45; thus, the presence of the Si–O bonds in the film additionally lowered the n value. This model can be applied only for the SiCN films deposited at temperatures above 400 ℃, as the low-temperature films included a set of hydrogen-containing bonds. The high-temperature films deposited using the BTMSP/He and BTMSP/H2 mixtures containing predominantly Si–C bonds possessed n = 2.1–2.2. As shown above, the films produced from the BTMSP/NH3 mixture are characterized by a high nitrogen content and a Si–N bond concentration which decreased the n value to 1.9. The values of the refractive index obtained in this study are typical for PECVD SiCN films produced using organosilicon precursors. For comparison, the values of the refractive index of the SiCN films produced by RF PECVD from hexamethyldisilazane were 1.7–2.1 [61], the atmospheric pressure CVD from tetramethyldisilazane was 1.45–1.95 [62], the PECVD from the tetramethylsilane and ammonia mixture was 1.57–1.90 [63], the PECVD from bis(trimethylsilyl)phenylamine was 1.53–1.78 [64] and the PECVD from 1,3-divinyl-1,1,3,3-tetramethyldisilazane was 1.51–1.90 [65]. The refractive indices for the films prepared by PVD methods and CVD using simple gas mixtures differed: the ECR PECVD from the CH4/N2/SiH4 gas mixture was 1.95–2.08 [66], the MW-CVD from the CH4/NH3/H2/SiH4 gas mixture was 2.00–2.17 [67] and the magnetron sputtering was 2.0–2.4 [68].
Regarding the extinction coefficient, the values changed in the range of 0–0.12. The low-temperature region (T < 500 °C) was characterized by k ≈ 0, while the rise in the deposition temperature induced a significant increase in k. Such a tendency can be explained by the appearance of the free carbon phase, as was shown by Raman spectroscopy. Moreover, as the Raman spectra included the fluorescent background, complicating their interpretation, the data on k’s evolution probably can be used to refine the starting temperature for carbon inclusions’ formation, which is expressed by the rise in k.
The transmittance of the test samples of SiCN(H)/SiO2 was determined by UV–Vis spectroscopy (Figure 10a–c). For comparison, the transmittance of the bare quartz glass is added to the figures. The spectral dependences exhibited the basic sinusoidal behavior due to the interference induced by the difference in the refractive indices of the substrate and the film. The spectra of the films produced from the three gas mixtures at a deposition temperatures of 200–300 °C were close, and the transmittance was 85–90% at the wavelength ranging from 500 to 2000 nm. For the BTMSP/He and BTMSP/H2 gas mixtures, the redshift of the transmittance spectra accompanied by a lowering of the transparency was observed with the rise in deposition temperature. The results of the FTIR and EDX analyses showed that the increase in the synthesis temperature led to the elimination of hydrocarbon fragments with the formation of the crosslinked structure. Additionally, the absorbing free carbon phase was formed at temperatures above 500 °C. The introduction of ammonia into the reactive mixture resulted in formation of N-rich SiCN(H) film without free carbon contamination; the spectra of the films possessed a transmittance of 80–95% (λ > 500 nm) in the whole deposition temperature range.
The transmission spectra were calculated to evaluate the optical bandgap according to Tauc’s equation as follows:
α = B(Eg)n
where α is the absorption coefficient, is the incident photon energy, B is the dimensionless constant and n is the parameter related to the density of the state’s distribution [34]. The value of n was chosen as 2, which is characteristic for SiCN films [16].
The deposition temperature dependences of the optical bandgap for the SiCN(H) films are presented in Figure 10d. If helium or hydrogen were introduced into the reactive mixture, a monotone decrease in the optical band gap from 3.8 eV to 1.6 eV was observed. A different curve of Eg was observed for the films produced using the BTMSP/NH3 gas mixture. An increase in the value from 3.2 to 4.9 eV was detected as the deposition temperature changed from 200 to 500 °C.
The change in the optical bandgap detected could be analyzed in terms of the rearrangement of the electronic structure, defined by the chemical bonds included in the film. Three main reasons should be considered for this. First, hydrogen elimination is responsible for Eg narrowing. As shown by FTIR spectroscopy, the changes in the chemical bonding structure with the rise in the deposition temperature mainly concerned the lowering of the concentration of the hydrogen-containing bonds. It is well known that hydrogen is very effective in reducing the density of localized states in amorphous material [69]. Thus, lowering the H-containing bond content increases the localized mid-bandgap states in the band structure, which results in the narrowing of the optical bandgap. The similar tendencies were previously shown for silicon carbonitride films in [16,70].
Another important factor that influenced the optical bandgap values is the nitrogen concentration. Introducing ammonia into the deposition chamber, the elemental analysis showed the formation of nitrogen-rich films with the N content increasing with the rise in the deposition temperature. At the same time, the FTIR analysis revealed the move of the most intensive peak to 840 cm−1, which could be attributed to the absorption band of Si–N in the Si–N4 configuration, which is characteristic for SiNx films [71]. The optical bandgap was correlated with the silicon to nitrogen ratio for all three initial gas mixtures (Figure 10e). The result showed the nearly linear behavior of this parameter: the higher amount of Si/N in the film, the lower the value of the optical bandgap. This result is consistent with theoretical calculations, which demonstrated that carbon’s incorporation in the Si3N4 network reduces the conduction band minimum due to the high localization of C compared to that of Si [72]. For the BTMSP/NH3 gas mixture, it can be concluded that the nitrogen concentration has a strong impact on Eg. The optical bandgap reaches its maximum at 500 ℃, which is 4.9 eV. This value is close to the bandgap of Si3N4, which is 4.7 eV for the single crystal (calculated for α-Si3N4 [73]) and 4.8–5.1 eV for the amorphous SiNx:H [74,75].
The third point that should be noted is the formation of carbon clusters at elevated temperatures, which led to the additional narrowing of the bandgap. This tendency confirms the growth of defects, which produce localized states in the gap. The temperature intervals of these changes are consistent with those obtained for the ellipsometrical extinction coefficient, which increased at a deposition temperature of 600 °C. The narrowing of the optical bandgap with the graphitization of the material is also discussed in [76,77,78].
Thus, it can be concluded that the optical properties of the films changed significantly depending on both the synthesis temperature and initial gaseous mixture. In this case, the silicon environment and the presence of an additional carbon phase had a significant effect. Firstly, with the transition from C-rich SiCN(H) to N-rich SiCN(H) films, decreases in the refractive index and optical band gap as well as an increase in transmittance were observed. Secondary, the formation of a small admixture of free carbon led to an increase in the absorption of the film, which was expressed in the growth of the absorption coefficient and a decrease in transparency. At the same time, a rise in the refractive index and a lowering of the optical band gap were observed. Summing up, when changing the synthesis conditions, it is possible to tune the refractive index in the range of 1.5–2.2 and the optical band gap from 1.7 to 4.3 eV.

4. Conclusions

Considering the suitability of 1,4-Bis-N,N-(trimethylsilyl)piperazine (BTMSP) as a precursor for the production of functional SiCN(H) films, the following comments can be made.
(i)
A study of the volatility of the compound by static tensimetry showed that its saturated vapor pressure is comparable with that of similar organosilicon CVD precursors and it is sufficient for its use in film deposition processes.
(ii)
The BTMSP behavior under conditions of low-temperature plasma (25 W) studied by OES revealed that the monomer undergoes a fragmentation with the formation of H, CH and CN radicals. The decomposition is not complete, as no Si-containing species were detected. An appearance of CN radicals, registered by the OES method, could be regarded as the main way carbon is excluded from the monomer composition.
(iii)
SiCN(H) films were produced in the PECVD process using BTMSP as a precursor. It was possible to produce films with a tunable refractive index in the range of 1.5–2.2 and an optical band gap from 1.7 to 4.9 eV by changing the synthesis conditions and thus the composition of the films.
(iv)
The aging of the films during storage in ambient conditions was studied. It was shown that the low-temperature film (200 °C) underwent changes. The water adsorption and degradation of the Si–H, N–H and Si–CHx–Si bonds with the formation of the Si–O bond were observed. The film deposited at 400 °C was found to be more stable.

Author Contributions

Conceptualization, E.E. and M.K.; methodology, M.K.; Formal analysis, O.M., I.Y., V.S. and E.M.; Investigation—S.S., V.S., I.T. and A.M.; Writing—original draft preparation, E.E.; Editing, M.K.; supervision, M.K.; Project administration, M.K. All authors contributed to the discussion and interpretation of the results. All authors have read and agreed to the published version of the manuscript.

Funding

This research was funded by Russian Science Foundation, grant number 23-79-00026.

Institutional Review Board Statement

Not applicable.

Informed Consent Statement

Not applicable.

Data Availability Statement

Not applicable.

Acknowledgments

The authors acknowledge the Ministry of Science and Higher Education of the Russian Federation.

Conflicts of Interest

The authors declare no conflict of interest.

References

  1. Sha, B.; Lukianov, A.N.; Dusheiko, M.G.; Lozinskii, V.B.; Klyui, A.N.; Korbutyak, D.V.; Pritchin, S.E.; Klyui, N.I. Carbon-rich amorphous silicon carbide and silicon carbonitride films for silicon-based photoelectric devices and optical elements: Application from UV to mid-IR spectral range. Opt. Mater. 2020, 106, 109959. [Google Scholar] [CrossRef]
  2. Khatami, Z.; Bleczewski, L.; Neville, J.J.; Mascher, P. X-ray Absorption Spectroscopy of Silicon Carbide Thin Films Improved by Nitrogen for All-Silicon Solar Cells. ECS J. Solid State Sci. Technol. 2020, 9, 083002. [Google Scholar] [CrossRef]
  3. Khatami, Z.; Nowikow, C.; Wojcik, J.; Mascher, P. Annealing of silicon carbonitride nanostructured thin films: Interdependency of hydrogen content, optical, and structural properties. J. Mater. Sci. 2018, 53, 1497. [Google Scholar] [CrossRef]
  4. Chou, T.H.; Kuo, T.W.; Lin, C.Y.; Lai, F.S. A low cost n-SiCN/p-PS/p-Si heterojunction for high temperature ultraviolet detecting applications. Sens. Actuators A Phys. 2018, 279, 462. [Google Scholar] [CrossRef]
  5. Saloum, S.; Shaker, S.A.; Alkafri, M.N.; Obaid, A.; Hussin, R. Hydrogenated Silicon Carbonitride Thin Film Nanostructuring Using SF6 Plasma: Structural and Optical Analysis. Silicon 2020, 12, 2957. [Google Scholar] [CrossRef]
  6. Li, Q.; Chen, C.; Wang, M.; Lv, Y.; Mao, Y.; Xu, M.; Wang, Y.; Wang, X.; Zhang, Z.; Wang, S.; et al. Study on photoelectricity properties of SiCN thin films prepared by magnetron sputtering. J. Mater. Res. Technol. 2021, 15, 460. [Google Scholar] [CrossRef]
  7. Jiang, M.; Xu, K.; Liao, N.; Zheng, B. Effect of sputtering power on piezoresistivity and interfacial strength of SiCN thin films prepared by magnetic sputtering. Ceram. Int. 2022, 48, 2112. [Google Scholar] [CrossRef]
  8. Tanaka, I.; Matuoka, S.; Harada, Y. Mechanical properties of amorphous SiCN films deposited by ion-beam-assisted deposition. Diamond Relat. Mater. 2022, 121, 108732. [Google Scholar] [CrossRef]
  9. Li, Q.; Wang, Y.; Shan, X.; Shan, X.; Wang, X.; Zhao, W. Preparation and optical properties of SiCN thin films deposited by reactive magnetron sputtering. J. Mater. Sci.: Mater. Electron. 2017, 28, 6769. [Google Scholar] [CrossRef]
  10. Lavareda, G.; Vygranenko, Y.; Amaral, A.; Nunes de Carvalho, C.; Barradas, N.P.; Alves, E.; Brogueira, P. Dependence of optical properties on composition of silicon carbonitride thin films deposited at low temperature by PECVD. J. Non-Cryst. Solids 2021, 551, 120434. [Google Scholar] [CrossRef]
  11. Peter, S.; Ehrler, R.; Seyller, T.; Speck, F. Annealing effects on a-SiC:H and a-SiCN:H films deposited by plasma CVD methods. Vacuum 2020, 178, 109410. [Google Scholar] [CrossRef]
  12. Cheng, Y.L.; Lin, Y.L. Comparison of SiCxNy barriers using different deposition precursors capped on porous low-dielectric-constant SiOCH dielectric film. Thin Solid Films 2020, 702, 137983. [Google Scholar] [CrossRef]
  13. Plujat, B.; Glénat, H.; Bousquet, A.; Frézet, L.; Hamon, J.; Goullet, A.; Tomasella, E.; Hernandez, E.; Quoizola, S.; Thomas, L. SiCN:H thin films deposited by MW-PECVD with liquid organosilicon precursor: Gas ratio influence versus properties of the deposits. Plasma Process. Polym. 2020, 17, 1900138. [Google Scholar] [CrossRef]
  14. Ermakova, E.; Kosinova, M. Organosilicon compounds as single-source precursors for SiCN films production. J. Organomet. Chem. 2022, 958, 122183. [Google Scholar] [CrossRef]
  15. Wrobel, A.M.; Uznanski, P. Hard silicon carbonitride thin-film coatings produced by remote hydrogen plasma chemical vapor deposition using aminosilane and silazane precursors. 1: Deposition mechanism, chemical structure, and surface morphology. Plasma Process. Polym. 2021, 18, e2000240. [Google Scholar] [CrossRef]
  16. Wrobel, A.M.; Uznanski, P. Hard silicon carbonitride thin-film coatings by remote hydrogen plasma chemical vapor deposition using aminosilane and silazane precursors. 2: Physical, optical, and mechanical properties of deposited films. Plasma Process. Polym. 2021, 18, 2000241. [Google Scholar] [CrossRef]
  17. Wrobel, A.M.; Walkiewicz-Pietrzykowska, A.; Blaszczyk-Lezak, I. Reactivity of organosilicon precursors in remote hydrogen microwave plasma chemical vapor deposition of silicon carbide and silicon carbonitride thin-film coatings. Appl. Organometal. Chem. 2010, 24, 201. [Google Scholar] [CrossRef]
  18. Du, L.; Bai, Y.; Chu, W.; Ding, Y. Synthesis of two aminosilanes as CVD precursors of SiCxNy films: Tuning film composition by Molecular Structures. Phosphorus Sulfur Silicon Relat. Elem. 2018, 193, 568. [Google Scholar] [CrossRef]
  19. Chang, W.Y.; Chang, C.Y.; Leu, J. Optical properties of plasma-enhanced chemical vapor deposited SiCxNy films by using silazane precursors. Thin Solid Films 2017, 636, 671. [Google Scholar] [CrossRef]
  20. Fainer, N.I.; Nemkova, A.A. Optical Properties of Silicon Carbonitride Films Produced by Plasma-Induced Decomposition of Organic Silicon Compounds. High Energ. Chem. 2015, 49, 273. [Google Scholar] [CrossRef]
  21. Imada, T.; Nakata, Y.; Ozaki, S.; Kobayashi, Y.; Nakamura, T. Systematic investigation of silylation materials for recovery use of low-k material plasma damage. Jpn. J. Appl. Phys. 2015, 54, 071502. [Google Scholar] [CrossRef]
  22. Di Mundo, R.; Ricci, M.; d’Agostino, R.; Fracassi, F.; Palumbo, F. PECVD of Low Carbon Content Silicon Nitride-Like Thin Films with Dimethylaminosilanes. Plasma Process. Polym. 2007, 4, S21. [Google Scholar] [CrossRef]
  23. Di Mundo, R.; Palumbo, F.; Fracassi, F.; d’Agostino, R. Methylaminosilane fed Inductively Coupled Plasmas for Silicon Nitride Deposition. Plasma Process. Polym. 2008, 5, 770. [Google Scholar] [CrossRef]
  24. Belmahi, M.; Bulou, S.; Thouvenin, A.; de Poucques, L.; Hugon, R.; Brizoual, L.L.; Miska, P.; Geneve, D.; Vasseur, J.-L.; Bougdira, J. Microwave Plasma Process for SiCN:H Thin Films Synthesis with Composition Varying from SiC:H to SiN:H in H2/N2/Ar/Hexamethyldisilazane Gas Mixture. Plasma Process. Polym. 2014, 11, 551. [Google Scholar] [CrossRef]
  25. Chagin, M.N.; Sulyaeva, V.S.; Shayapov, V.R.; Kolodin, A.N.; Khomyakov, M.N.; Yushina, I.V.; Kosinova, M.L. Synthesis, Properties and Aging of ICP-CVD SiCxNy:H Films Formed from Tetramethyldisilazane. Coatings 2022, 12, 80. [Google Scholar] [CrossRef]
  26. Wrobel, A.M.; Błaszczyk, I.; Walkiewicz-Pietrzykowska, A.; Tracz, A.; Klemberg-Sapieha, J.E.; Aokic, T.; Hatanaka, Y. Remote hydrogen–nitrogen plasma chemical vapor deposition from a tetramethyldisilazane source. Part 1. Mechanism of the process, structure and surface morphology of deposited amorphous hydrogenated silicon carbonitride films. J. Mater. Chem. 2003, 13, 731. [Google Scholar] [CrossRef]
  27. Bulou, S.; Le Brizoual, L.; Miska, P.; de Poucques, L.; Bougdira, J.; Belmahi, M. Wide variations of SiCxNy:H thin films optical constants deposited by H2/N2/Ar/hexamethyldisilazane microwave plasma. Surf. Coat. Technol. 2012, 208, 46. [Google Scholar] [CrossRef]
  28. Di Mundo, R.; Palumbo, F.; Fracassi, F.; d’Agostino, R. Thin Film Deposition in Capacitively Coupled Plasmas Fed with Bis(dimethylamino)-dimethylsilane and Oxygen: An FTIR study. Plasma Process. Polym. 2009, 6, 506. [Google Scholar] [CrossRef]
  29. Ermakova, E.N.; Sysoev, S.V.; Nikulina, L.D.; Tsyrendorzhieva, I.P.; Rakhlin, V.I.; Kosinova, M.L. Synthesis and characterization of organosilicon compounds as novel precursors for CVD processes. Thermochim. Acta 2015, 622, 2. [Google Scholar] [CrossRef]
  30. Davydova, E.I.; Sevastianova, T.N.; Suvorov, A.V.; Timoshkin, A.Y. Molecular complexes formed by halides of group 4,5,13–15 elements and the thermodynamic characteristics of their vaporization and dissociation found by the static tensimetric method. Coord. Chem. Rev. 2010, 254, 203. [Google Scholar] [CrossRef]
  31. Kuznetsov, F.A.; Titov, V.A.; Titov, A.A.; Chernyavskii, L.I. Data bank of properties of microelectronic materials. In Proceedings of the International Symposium on Advanced Materials, Tsukuba, Japan, 24–30 September 1995; pp. 24–30. [Google Scholar]
  32. Kramida, A.; Ralchenko, Y.; Reader, J.; NIST ASD Team. NIST Atomic Spectra Database (ver. 5.10); National Institute of Standards and Technology, Gaithersburg, MD, USA. 2022. Available online: https://physics.nist.gov/asd (accessed on 15 October 2022).
  33. Cui, J.H.; Xu, Z.F.; Zhang, J.L.; Nie, Q.Y.; Xu, G.H.; Ren, L.L. Online diagnosis of electron excitation temperature in CH4+H2 discharge plasma at atmospheric pressure by optical emission spectra. Sci. China Ser. G Phys. Mech. Astron 2008, 51, 1892. [Google Scholar] [CrossRef]
  34. Tauc, J.; Grigorovici, R.; Vancu, A. Optical Properties and Electronic Structure of Amorphous Germanium. Phys. Stat. Sol. B 1966, 15, 627. [Google Scholar] [CrossRef]
  35. Sysoev, S.V.; Nikulina, L.D.; Kolontaeva, A.O.; Kosinova, M.L.; Titov, A.A.; Rakhlin, V.I.; Tsyrendorzhieva, I.P.; Lis, A.V.; Voronkov, M.G. N-substituted hexamethyldisilazanes as new substances for the synthesis of functional films in the system Si-Ge-C-N-H. Russ. J. Gen. Chem. 2011, 81, 2501. [Google Scholar] [CrossRef]
  36. Fantz, U. Basics of plasma spectroscopy. Plasma Sources Sci. Technol. 2006, 15, S137. [Google Scholar] [CrossRef] [Green Version]
  37. Ivashchenko, V.I.; Porada, O.K.; Kozak, A.O.; Manzhara, V.S.; Sinelnichenko, O.K.; Ivashchenko, L.A.; Shevchenko, R.V. An effect of hydrogenation on the photoemission of amorphous SiCN films. Int. J. Hydrogen Energy 2022, 47, 7263. [Google Scholar] [CrossRef]
  38. Silva, J.A.; Quoizola, S.; Hernandez, E.; Thomas, L.; Massines, F. Silicon carbon nitride films as passivation and antireflective coatings for silicon solar cells. Surf. Coat. Technol. 2014, 242, 157. [Google Scholar] [CrossRef]
  39. Matsutani, T.; Tai, Y.; Kawasaki, T. Nitrogen ion beam thinning of a-SiCN diaphragm for environmental cell prepared by low-energy ion beam enhanced chemical vapor deposition. Vacuum 2020, 182, 109770. [Google Scholar] [CrossRef]
  40. Wrobel, A.M.; Walkiewicz-Pietrzykowska, A.; Uznanski, P.; Glebocki, B. a-SiC:H Films by Remote Hydrogen Microwave Plasma CVD From Ethylsilane Precursors. Chem. Vap. Depos. 2013, 19, 242–250. [Google Scholar] [CrossRef]
  41. Li, Q.; Chen, C.; Xu, M.; Wang, Y.; Wang, X.; Zhang, Z.; Zhao, W.; Stiens, J. Blue-violet emission of silicon carbonitride thin films prepared by sputtering and annealing treatment. Appl. Surf. Sci. 2021, 546, 149121. [Google Scholar] [CrossRef]
  42. Wrobel, A.M.; Uznanski, P.; Walkiewicz-Pietrzykowska, A.; Glebocki, B.; Bryszewska, E. Silicon Oxycarbide Thin Films by Remote Microwave Hydrogen Plasma CVD Using a Tetramethyldisiloxane Precursor. Chem. Vap. Depos. 2015, 21, 88. [Google Scholar] [CrossRef]
  43. Zhuang, C.; Schlemper, C.; Fuchs, R.; Zhang, L.; Huang, N.; Vogel, M.; Staedler, T.; Jiang, X. Mechanical behavior related to various bonding states in amorphous Si–C–N hard films. Surf. Coat. Technol. 2014, 258, 353. [Google Scholar] [CrossRef]
  44. Langford, A.A.; Fleet, M.L.; Nelson, B.P.; Lanford, W.A.; Maley, N. Infrared absorption strength and hydrogen content of hydrogenated amorphous silicon. Phys. Rev. B 1992, 45, 13367. [Google Scholar] [CrossRef]
  45. Kozak, A.O.; Ivashchenko, V.I.; Porada, O.K.; Ivashchenko, L.A.; Tomila, T.V.; Manjara, V.S.; Klishevych, G.V. Structural, optoelectronic and mechanical properties of PECVD Si-C-N films: An effect of substrate bias. Mater. Sci. Semicon. Proc. 2018, 88, 65. [Google Scholar] [CrossRef]
  46. Wilamowska, M.; Graczyk-Zajac, M.; Riedel, R. Composite materials based on polymer-derived SiCN ceramic and disordered hard carbons as anodes for lithium-ion batteries. J. Power Sources 2013, 244, 80. [Google Scholar] [CrossRef]
  47. Bokobza, L.; Bruneel, J.-L.; Couzi, M. Raman Spectra of Carbon-Based Materials (from Graphite to Carbon Black) and of Some Silicone Composites. J. Carbon Res. 2015, 1, 77–94. [Google Scholar] [CrossRef] [Green Version]
  48. Wrobel, A.M. Aging process in plasma-polymerized organosilicon thin films. J. Macromol. Sci.-Chem. 1985, 22, 1089. [Google Scholar] [CrossRef]
  49. Huber, C.; Stein, B.; Kalt, H. Plasma-enhanced chemical vapor deposition of amorphous silicon carbonitride: Deposition temperature dependence of bonding structure, refractive index, mechanical stress and their aging under ambient air. Thin Solid Films 2017, 634, 66. [Google Scholar] [CrossRef]
  50. Jiang, L.; Tian, H.; Li, J.; Xiang, P.; Peng, Y.; Wang, T.; Hou, P.; Xiao, T.; Tan, X. The influence of NH3 flow rate on the microstructure and oxidation properties of a-Si-C-N:H films prepared by PECVD technology. Appl. Surf. Sci. 2020, 513, 145861. [Google Scholar] [CrossRef]
  51. Rahman, M.A.A.; Goh, B.T.; Chiu, W.S.; Haw, C.Y.; Mahmood, M.R.; Khiew, P.S.; Rahman, S.A. Aging- and thermal-annealing effects on the vibrational- and microstructural-properties of PECVD grown hydrogenated amorphous silicon carbon nitride thin films. Vib. Spectrosc. 2018, 94, 22. [Google Scholar] [CrossRef]
  52. Riedel, R.; Kleebe, H.J.; Schönfelder, H.; Aldinger, F. A covalent micro/nano-composite resistant to high-temperature oxidation. Nature 1995, 374, 526. [Google Scholar] [CrossRef]
  53. Vandenbossche, M.; Hegemann, D. Recent approaches to reduce aging phenomena in oxygen- and nitrogen-containing plasma polymer films: An overview. Curr. Opin. Solid St. M. 2018, 22, 26. [Google Scholar] [CrossRef]
  54. Siow, K.S.; Brichter, L.; Kumar, S.; Griesser, H.J. Plasma methods for the generation of chemically reactive surfaces for biomolecule immobilization and cell colonization—A review. Plasma Process. Polym. 2006, 3, 392. [Google Scholar] [CrossRef]
  55. Chatelier, R.C.; Xie, X.; Gengenbach, T.R.; Griesser, H.J. Quantitative analysis of polymer surface restructuring. Langmuir 1995, 11, 2576. [Google Scholar] [CrossRef]
  56. Holländer, A.; Thome, J. Chapter 7—degradation and stability of plasma polymers. In Plasma Polymer Films; Biederman, H., Ed.; Imperial College Press: London, UK, 2004; pp. 247–277. [Google Scholar]
  57. Girard-Lauriault, P.-L.; Retzko, I.; Swaraj, S.; Matsubayashi, N.; Gross, T.; Mix, R.; Unger, W.E.S. Non-destructive sub-surface chemical characterization of airexposed plasma polymers by energy-resolved XPS. Plasma Process. Polym. 2010, 7, 474. [Google Scholar] [CrossRef]
  58. Guruvenket, S.; Andrie, S.; Simon, M.; Johnson, K.W.; Sailer, R.A. Atmospheric Pressure Plasma CVD of Amorphous Hydrogenated Silicon Carbonitride (a-SiCN:H) Films Using Triethylsilane and Nitrogen. Plasma Process. Polym. 2011, 8, 1126. [Google Scholar] [CrossRef] [Green Version]
  59. Sinha, A.K.; Lugujjo, E. Lorentz-Lorenz correlation for reactively plasma deposited Si-N films. Appl. Phys. Lett. 1978, 32, 245. [Google Scholar] [CrossRef]
  60. Jedrzejowski, P.; Cizek, J.; Amassian, A.; Klemberg-Sapieha, J.E.; Vlcek, J.; Martinu, L. Mechanical and optical properties of hard SiCN coatings prepared by PECVD. Thin Solid Films 2004, 447–448, 201–207. [Google Scholar] [CrossRef]
  61. Sobczyk-Guzenda, A.; Oleśko, K.; Gazicki-Lipman, M.; Szymański, W.; Balcerzak, J.; Wendler, B.; Szymanowski, H. Chemical structure and optical properties of a-SiNC coatings synthesized from different disilazane precursors with the RF plasma enhanced CVD technique—A comparative study. Mater. Res. Express 2019, 6, 016410. [Google Scholar] [CrossRef]
  62. Guruvenket, S.; Andrie, S.; Simon, M.; Johnson, K.W.; Sailer, R.A. Atmospheric pressure plasma-enhanced chemical vapor deposition of a-SiCN:H films: Role of precursors on the film growth and properties. Appl. Mater. Interfaces 2012, 4, 5293. [Google Scholar] [CrossRef] [PubMed]
  63. Ermakova, E.; Mogilnikov, K.; Asanov, I.; Fedorenko, A.; Yushina, I.; Kichay, V.; Maksimovskiy, E.; Kosinova, M. Chemical Structure, Optical and Dielectric Properties of PECVD SiCN Films Obtained from Novel Precursor. Coatings 2022, 12, 1767. [Google Scholar] [CrossRef]
  64. Ermakova, E.; Kolodin, A.; Fedorenko, A.; Yushina, I.; Shayapov, V.; Maksimovskiy, E.; Kosinova, M. Controlling of Chemical Bonding Structure, Wettability, Optical Characteristics of SiCN:H (SiC:H) Films Produced by PECVD Using Tetramethylsilane and Ammonia Mixture. Coatings 2023, 13, 310. [Google Scholar] [CrossRef]
  65. Chang, W.Y.; Chen, W.Z.; Lee, H.T.; Leu, J. Embedded carbon bridges in low-k PECVD silicon carbonitride films using silazane precursors. Jpn. J. Appl. Phys. 2019, 58, SHHB01. [Google Scholar] [CrossRef] [Green Version]
  66. Khatami, Z.; Simpson, P.J.; Mascher, P. Process-dependent mechanical and optical properties of nanostructured silicon carbonitride thin films. Nanotechnology 2019, 30, 14003. [Google Scholar] [CrossRef] [PubMed]
  67. Chen, C.W.; Huang, C.C.; Lin, Y.Y.; Chen, L.C.; Chen, K.H. The affinity of Si–N and Si–C bonding in amorphous silicon carbon nitride (a-SiCN) thin film. Diamond Relat. Mater. 2005, 14, 1126. [Google Scholar] [CrossRef]
  68. Peng, X.; Song, L.; Meng, J.; Zhang, Y.; Hu, X. Preparation of silicon carbide nitride thin films by sputtering of silicon nitride target. Appl. Surf. Sci. 2001, 173, 313. [Google Scholar] [CrossRef]
  69. Malhotra, A.K.; Neudeck, G.W. Effects of hydrogen contamination on the localized states in amorphous silicon. Appl. Phys. Lett. 1976, 28, 47. [Google Scholar] [CrossRef]
  70. Khatami, Z.; Bosco, G.B.F.; Wojcik, J.; Tesslerand, L.R.; Mascher, P. Influence of Deposition Conditions on the Characteristics of Luminescent Silicon Carbonitride Thin Films. ECS J. Solid State Sci. Technol. 2018, 7, N7. [Google Scholar] [CrossRef] [Green Version]
  71. Plujat, B.; Glénat, H.; Hamon, J.; Gazal, Y.; Goullet, A.; Hernandez, E.; Quoizola, S.; Thomas, L. Near-field scanning microscopy and physico-chemical analysis versus time of SiCN:H thin films grown in Ar/NH3/TMS gas mixture using MW-Plasma CVD at 400 °C. Plasma Process. Polym. 2018, 15, e1800066. [Google Scholar] [CrossRef]
  72. Chen, C.W.; Lee, M.-H.; Chen, L.C.; Chen, K.H. Structural and electronic properties of wide band gap silicon carbon nitride materials—A first-principles study. Diamond Relat. Mater. 2004, 13, 1158. [Google Scholar] [CrossRef]
  73. Zhao, G.L.; Bachlechner, M.E. Electronic structure, charge distribution, and charge transfer in α- and β-Si3N4 and at the Si(111)/Si3N4 interface. Phys Rev. B 1998, 58, 1887. [Google Scholar] [CrossRef]
  74. Dong, H.; Chen, K.; Yang, H.; Ma, Z.; Xu, J.; Li, W.; Yu, L.; Huang, X. Innovative all-silicon based a-SiNx:O/c-Si heterostructure solar-blind photodetector with both high responsivity and fast response speed. APL Photonics 2022, 7, 026102. [Google Scholar] [CrossRef]
  75. Nguyen, H.H.; Jayapal, R.; Dang, N.S.; Nguyen, V.D.; Trinh, T.T.; Jang, K.; Yi, J. Investigation of charge storage and retention characteristics of silicon nitride in NVM based on InGaZnO channels for system-on-panel applications. Microelectron. Eng. 2012, 98, 34. [Google Scholar] [CrossRef]
  76. Fainer, N.I.; Kosinova, M.L.; Rumyantsev, Y.M.; Maximovskii, E.A.; Kuznetsov, F.A. Thin silicon carbonitride films are perspective low-k materials. J. Phys. Chem. Solids 2008, 69, 661. [Google Scholar] [CrossRef]
  77. Jana, S.; Das, S.; De, D.; Gangopadhyay, U.; Ghosh, P.; Mondal, A. Effect of annealing on structural and optical properties of diamond-like nanocomposite thin films. Appl. Phys. A 2014, 114, 965. [Google Scholar] [CrossRef]
  78. De Falco, G.; Commodo, M.; Bonavolontà, C.; Pepe, G.P.; Minutolo, P.; D’Anna, A. Optical and electrical characterization of carbon nanoparticles produced in laminar premixed flames. Combust. Flame 2014, 161, 3201. [Google Scholar] [CrossRef]
Figure 1. Molecular structure of 1,4-Bis-N,N-(trimethylsilyl)piperazine.
Coatings 13 01045 g001
Figure 2. Deviation between measured and calculated values of vapor pressure in the experimental temperature range (a); temperature dependences of vapor pressure determined using static tensimetry for HN(SiMe3)2, PhN(SiMe3)2 (reproduced with permission from Ref. [29], Copyright 2015, Elsevier), N(SiM3)3 (reproduced with permission from Ref. [35], Copyright 2012, Springer Nature) and BTMSP (this study) (b).
Coatings 13 01045 g002
Figure 3. Emission spectra of RF discharge plasma of pure BTMSP and of its mixture with H2, He or NH3 recorded at room temperature (a). CH/Hγ ratio in the emission spectra of BTMSP/He plasma at various temperatures in reactor (b).
Coatings 13 01045 g003
Figure 4. FTIR spectra of SiCN(H) films deposited using BTMSP/He (a), BTMSP/NH3 (b) and BTMSP/H2 (c) gas mixtures. Shift in the main maximum in the spectra of the films deposited from BTMSP/NH3 mixture ((b), insert).
Coatings 13 01045 g004
Figure 5. Raman spectra of SiCN(H) films deposited using BTMSP/H2 (a) and BTMSP/NH3 (b) gas mixtures.
Coatings 13 01045 g005
Figure 6. Evolution of EDX element concentration in SiCN(H) films deposited using BTMSP/He, BTMSP/NH3 and BTMSP/H2 gas mixtures with deposition temperature for Si (a), C (b), N (c) and O (d).
Coatings 13 01045 g006
Figure 7. Evolution of FTIR spectra of SiCN(H) films prepared at 200 (a) and 400 °C (b) from BTMSP/NH3 gas mixture, and deconvolution of 600–1350 cm−1 area for films produced at 200 °C: as deposited (c), after 50–52 days storage (d).
Coatings 13 01045 g007
Figure 8. Deposition rate of SiCN(H) films deposited using BTMSP/He, BTMSP/NH3 and BTMSP/H2 gas mixtures as a function of synthesis temperature and SEM images.
Coatings 13 01045 g008
Figure 9. Evolution of refractive index (a) and extinction coefficient (b) of SiCN(H) films deposited using different reactive mixtures.
Coatings 13 01045 g009
Figure 10. Transmittance spectra of SiCN(H) films deposited using BTMSPA/He (a), BTMSPA/NH3 (b) and BTMSPA/H2 (c) gas mixtures. Temperature dependences of optical bandgap (d). Variation in optical bandgap of SiCN(H) films with various Si/N (e).
Coatings 13 01045 g010
Table 1. The results of plasma composition studies on the decomposition of organosilicon compounds used as CVD precursors.
PrecursorsAdditional GasesCVD
Process
Plasma Parameters.
Frequency,
Power
Plasma-Phase CompositionRef.
IR
Spectroscopy
OES
1,1,1,3,3,3-Hexamethyl-disilazane
(Me3Si)2NH
H2 + N2 + ArMW CVD2.45 GHz
600 W
CH4, C2H2, HCNCN, NH[24,27]
1,1,3,3-Tetramethyldisilazane
(Me2HSi)2NH
N2 + ArICP CVD13.56 MHz
50–400 W
-CN, NH, H, N2, Si, Ar[25]
Bis(dimethylamino)-
dimethylsilane Me2Si(NMe2)2
-ICP CVD13.56 MHz
700 W
CH4, HCN, C2H2, CO2H, CH, H2, CN, NH, N2[23]
Bis(dimethylamino)-
dimethylsilane Me2Si(NMe2)2
ArICP CVD13.56 MHz
700 W
-H, CH, H2, CN, NH, N2, Si[23]
Bis(dimethylamino)-
dimethylsilane Me2Si(NMe2)2
ArICP CVD13.56 MHz
500 W
≈25% monomer (fragments containing
Si–N, Si–Me and N–Me),
CH4, C2H2, HCN, (NH)
-[28]
Bis(dimethylamino)-
dimethylsilane Me2Si(NMe2)2
Ar
(NH3)
ICP CVD13.56 MHz-CN, NH, CO, OH, O, N2, H2[22]
Bis(dimethylamino)-
Piperazine
Me3SiN(CH2CH2)2NSiMe3
He
(NH3)
RF PECVD40.68 MHz
25 W
-CN, H, H2, CH, N2This study
CVD—chemical vapor deposition; IR—infrared spectroscopy; OES—optical emission spectroscopy; MW CVD—microwave plasma chemical vapor deposition; RP CVD—remote plasma chemical vapor deposition; ICP CVD—inductively coupled plasma chemical vapor deposition.
Table 2. Experimental data on BTMSP saturated vapor pressure measurements by static tensimetry.
SeriesTemperature, KSaturated Vapor Pressure, Pa
First heating295.4155
321.5567
340.31521
358.93242
380.36645
First cooling369.24592
359.33126
349.92272
289.2237
Second heating319.4589
337.71341
348.02132
367.74293
387.68541
407.215,450
417.620,603
Second cooling397.611,641
378.06170
367.74368
347.82042
293.7161
Table 3. Experimental conditions of SiCN(H) films’ production and data on their optical properties and elemental composition.
Additional
Gas
TDeposition Rate, nm/minOptical PropertiesElemental Composition, at.%
nkEgSiCNO
He200281.560.0013.714611411
300211.570.0033.31857169
40091.800.0052.42455165
50061.950.0522.12561123
60062.190.111.82464102
NH3200171.5103.213541221
300161.5103.620401921
400111.7704.32919439
50051.8604.93313513
60041.90.0134.23215503
H2200221.503.214591314
300111.5403.216541614
40041.8701.52450206
500520.0273.02455174
60052.110.11.72458144
T—deposition temperature, n—refractive index, k—extinction coefficient, Eg—optical bandgap.
Table 4. FTIR absorptions.
VibrationBand Position
(This Study), cm−1
Band Position
(Literature Data), cm−1
Ref.
Si–C stretching816796–805[3,37]
Si–N stretching
Si–N in SiN4 configuration
926
850
911–940
850
[3,37]
[38]
Si–CHx–Si wagging1020990–1020[39,40]
Si–O stretching11051070[28]
N–H bending11701156–1185[15,41]
Si–CH3 symmetric
bending
12551260–1264[38,42]
C=C/C=N stretching16001500 (C=C)
1600 (C=N)
[43]
Si–H stretching21102000–2100[44]
C≡N21802200[39]
C–H stretching2800–30002865–2953[37,45]
N–H stretching3200–34003370–3385[37,45]
Disclaimer/Publisher’s Note: The statements, opinions and data contained in all publications are solely those of the individual author(s) and contributor(s) and not of MDPI and/or the editor(s). MDPI and/or the editor(s) disclaim responsibility for any injury to people or property resulting from any ideas, methods, instructions or products referred to in the content.

