1. Introduction
Natural fibers are becoming increasingly popular among engineers due to their cost-effectiveness, environmental friendliness, and high performance. They offer a favorable balance between strength and weight and are also lightweight, renewable, and biodegradable [
1,
2]. This makes them a more sustainable alternative to synthetic fibers.
One natural fiber that has gained attention in recent years is flax. This plant is commonly grown in regions of Western Europe with cooler climates [
3]. The flax plant has a growth cycle of 90–125 days and reaches a height of roughly 80 cm, with 75% of the stem being usable for fiber production [
4,
5]. The fibers, also known as bast fibers, are located within the stem of the plant. The stem undergoes a process of retting and scutching to extract the final material [
6]. The unique properties of fibers derive from their specific composition, which includes cellulose at 64.1%–71.9%, hemicellulose at 16.7%–20.6%, lignin at 2.0%–2.2%, and 1.8%–2.3% wax materials [
7,
8].
These properties make flax fibers highly suitable for use in polymeric composites [
9]. However, their compatibility with hydrophobic thermoplastic matrices remains limited [
10]. To address this issue, modifications are needed to enhance the bond between the matrix and the fibers [
11]. In this context, surface treatment is a practical solution that is already used in industry. By increasing the surface energy, the bond between the fibers and the matrix can be strengthened. This leads to a more efficient transfer of stress from the matrix to the fibers [
12]. The elimination of wax-like substances on the exterior cell of fibers significantly affects the final adhesion [
13,
14]. Dissolving the waxy substances exposes the hydroxyl and carboxyl groups on the fiber surface. This leads to more homogeneous and stronger interactions with the matrix [
15,
16].
Various surface modification techniques such as chemical and physical treatments have been utilized [
17]. Chemical treatments have been found to be effective, but they come with the drawbacks of high costs and environmental pollution [
18]. Today, it is advisable to consider alternative methods that have a lower environmental footprint. In light of this, there has been a growing interest in the use of plasma treatment [
19]. Plasma treatment is a dry and clean process that does not produce chemicals waste, making it a more cost-effective and environmentally friendly process [
20,
21].
Researchers have utilized a variety of plasma systems and highlighted the improved surface properties, such as wettability, roughness, and adhesion, to a wide range of materials [
22]. One notable study in this field focused on the removal of the waxy layer from fiber surfaces using a plasma method with oxygen gas as the carrier gas [
23]. The researchers found that this approach led to the introduction of oxygen groups onto the fiber’s surface, resulting in a rougher texture and improved adhesion properties.
In a related study, Barani et al. [
19] investigated the influence of oxygen plasma treatment on wool fiber yarn. The researchers aimed to reveal the transformative effects by meticulously controlling the treatment parameters, which included the use of low-pressure plasma equipment and oxygen gas. The outcomes revealed a visible impact on the wool fiber surfaces, characterized by a notable increase in surface roughness and enhanced clarity of scale boundaries. Simultaneously, the treatment exhibited remarkable efficacy in eliminating surface lipids. In addition, the plasma treatment reduced the crystallinity of the wool fibers while inducing the formation of distinct amide characteristic bands.
Furthermore, other studies have demonstrated that plasma-treated natural fibers can lead to improved mechanical properties and interfacial shear strength in composites [
24]. For instance, the researchers investigated the effects of argon (Ar) and oxygen (O2) gases on the modification of bamboo fibers using dielectric barrier discharge (DBD) plasma. They used a generated power of 180 W and varied the treatment times. The results showed that the plasma etching reduced the functional groups of lignin and hemicellulose, increased the crystallinity percentage, and resulted in a higher surface roughness and area. The mechanical properties of the fiber-reinforced epoxy (FRE) composites were improved by the Ar gas treatment for 30 min [
25].
As such, atmospheric plasma treatments have significant potential in enhancing the performance of natural fibers in composite materials [
26].
Overall, all research tends to agree that the observed improvements are mainly due to chain scission, surface etching, cleaning, and surface functionalization [
27]. This understanding contributes to a better grasp of how plasma treatments can be utilized to modify natural fibers, ultimately leading to improved adhesion and mechanical properties in composite materials.
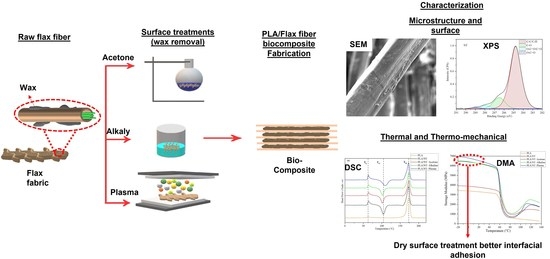
This study examines the impact of different surface modifications, such as acetone, alkali, and air-plasma, on the properties of flax fiber-reinforced PLA composites. The work compares treated fibers with untreated fibers to determine the most effective modification to enhance the compatibility between the fibers and matrix. The mechanical and thermal properties of flax/PLA composites are examined using differential scanning calorimetry (DSC) and dynamic mechanical analysis (DMA). The research aims to obtain a comprehensive insight into the utilization of plasma treatment as a means of enhancing the performance of natural fiber composites.
2. Experimental
2.1. Materials
The unidirectional flax fabric with an average fiber diameter of approximately 0.22 mm, as determined by optical microscopy, was supplied by Fibers Recherches Développement (FRD) in France. The sample size used for the plasma treatment was 6 × 4 cm2. PLA 4032D sheets were supplied by GENEQ Inc., Montréal, Canada. Chemicals were used for the acetone, and alkaline treatments were purchased from Sigma-Aldrich, Oakville, Canada.
2.2. Extraction of Lipids/Waxes
A method devised by Sedan et al. [
28] was employed to extract lipids, waxes, and free sugars from dried fibers. Initially, 15 g of fibers were placed in 2 L of ethanol at a temperature of 60 °C for 6 h. Afterward, the solution was filtered, and the fibers were soaked in 500 mL of chloroform at room temperature while being stirred for 30 min. Both the chloroform and ethanol solutions underwent thorough filtration and were then evaporated using a rotavapor until the volume was reduced to 100 mL. Following this, the two solutions were combined in a separating funnel and gently agitated. To facilitate liquid–liquid separation, 75 mL of deionized water was introduced. The chloroform solution contained the waxes, while the ethanol/water solution contained the free sugars. The extracted fibers were subsequently dried to determine their masses.
2.3. Treatment of Flax Fibers
Untreated flax fibers were subjected to different treatments to remove the wax. For the first method, flax fibers were subjected to boiled acetone for 45 min under reflux. In the second approach, fibers were immersed in a 5% sodium hydroxide solution for 40 min to remove lignin associated with the flax. In order to neutralize the pH, a 5% acetic acid solution prepared by carefully adding 5 mL of glacial acetic acid into 95 mL of distilled water was added, followed by rinsing with distilled water. The fibers were placed in dry air for 48 h at room temperature and then dried in an oven overnight at 70 °C to eliminate any residual moisture.
A plasma surface treatment was also carried out in a reactor to compare the conventional modifications with an eco-friendlier approach. The plasma cell where the fibers were placed consists of two parallel electrodes made with a conductive silver–platinum paste (area: 6.5 × 5.5 cm2). The metallic layers were applied on two alumina plates (635 μm in thickness). In this work, the gas gap was fixed at 1 mm. Plasma was induced in the gap between the alumina plates by applying a 10 kHz frequency voltage with a peak-to-peak amplitude of 10 kilovolt (kV). This operation resulted in a power dissipation of 0.22 W/cm2 during the discharge process. The samples that were tested included non-treated flax fiber (NT), acetone-treated fiber (NT-acetone), alkaline-treated fiber (NT-alkaline), and fiber treated with air plasma (NT-plasma).
2.4. Composite Processing
After modification, all fibers were dried in an oven at 60 °C for 24 h to eliminate any residual moisture. Six layers of PLA were placed simultaneously with five unidirectional flax fabrics to create the composite. Flax fabrics were all oriented in the same way to create unidirectional composites. The composite was created by thermocompression molding. Best conditions were obtained using two Teflon sheets between the samples and setting the press to 180 °C at 44 Mpa of pressure for 5 min.
2.5. Characterization Methods
The employed analysis methods encompass a range of common techniques. A concise overview of each approach is presented below.
2.5.1. Scanning Electron Microscope (SEM)
SEM images of the sample surfaces were obtained using an FEI system manufactured by Thermo Fisher Scientific, Waltham, MA, USA. The microscope operated at 1 kV, providing a resolution of 1.4 nanometers. To improve imaging quality on low-conductivity flax fiber substrates, a thin layer of gold–palladium (Au–Pd) was applied to all samples before imaging.
2.5.2. Fourier Transform Infrared Spectroscopy (FTIR)
The fiber composition and structure were analyzed using FTIR spectrophotometry, with a Cary 660 FTIR spectrophotometer provided by Agilent Technologies, Mulgrave, Australia. The spectrophotometer was outfitted with a deuterated triglycine sulfate (DTGS) detector from Harrick Scientific Products and a silicon-based attenuated total reflectance (ATR) attachment. In order to perform a thorough analysis, 128 scans were performed at a spectral resolution of 4 cm
−1. To ensure accuracy, measurements were taken at three equally spaced points on each layer. An important parameter was the penetration depth of the analysis. By applying Equation (1), it was found that, in this study, the penetration depth was 0.4 microns at 4000 cm
−1 and 2.7 microns at 400 cm
−1.
where
λ represents the wavelength of infrared light,
n1 is the refractive index of the internal reflection element (IRE),
n2 represents the refractive index of the substrate, and
θ symbolizes the angle of incidence of the IR beam. The value of
n1 was determined to be 2.41;
n2 was found to be 1.59 for the flax fibers; and
θ was set at 45°.
Peak Fitting
The FTIR spectra were analyzed using OriginPro 2019 (9.6), a software developed by OriginLab Corporation Version. To fit the spectral data peaks, a peak analyzer based on the Levenberg–Marquardt algorithm was used. The baseline was corrected using a second derivative approach. The peaks were fitted using the Voigt function, which combines a Gaussian and a Lorentzian function. This function is described by Equation (2), where
y0 represents the offset,
xc is the center,
A is the area,
WG stands for the Gaussian full width at half maxima (FWHM),
WL denotes the Lorentzian FWHM,
t represents the wavenumber, and
n symbolizes the number of peaks.
To streamline the process, the baseline, peak center, and peak width parameters were first fixed, and then allowed to vary during the fitting process. The iteration process was discontinued when an optimal fit was achieved, as indicated by a chi-square value lower than 1 × 10⁻⁶.
2.5.3. Gas Chromatography–Mass Spectroscopy Analysis
Samples were injected (1 µL) on a GCMS-QP2010 (Shimadzu, Kyoto, Japan) via a split injector with 10:1 split ratio at 250 °C with helium gas carrier on a HP-5ms, 30 m, 0.25 mm i.d., 0.25 μm film column (Agilent Technologies, Santa Clara, CA, USA). Detailed GC and MS parameters are listed in
Supplementary Materials. Identification of compound was based on matching with NIST mass spectral library.
2.5.4. X-ray Photoelectron Spectroscopy (XPS)
The surface composition of the flax fibers was analyzed using a PHI 5600-ci spectrometer from Physical Electronics. Photoelectron detection was performed at a 45° incidence angle under high vacuum (8 × 10⁻⁹ Torr) conditions. Surface charging effects were adjusted by correcting the C–C/C–H aliphatic carbon binding energy peak to 285.0 eV. The C1s envelopes were analyzed using Gaussian–Lorentzian functions after subtracting the Shirley-type background with Casa XPS software v 2.3.16. Three analyses were conducted per sample to assess chemical homogeneity and produce mean values and standard deviations.
2.5.5. Differential Scanning Calorimetry (DSC)
DSC measurements were performed in a nitrogen environment using a Q200 instrument from TA Instruments. The weight of the samples used in the experiments ranged from 7 to 10 milligrams. The temperature range for the measurements was from 0 °C to 220 °C. The DSC curves were recorded during three stages: initial heating, cooling, and a second heating. The temperature increase rate during the measurements was 10 °C per minute. To ensure that the results were not influenced by the thermal history of the samples, the analysis was performed using data from the second heating stage.
For the analysis, Equation (3) was employed. This equation allowed the determination of a relevant quantity (Xc) based on the variables , ΔHf, and ΔHf0. The weight fraction (ω) of the components and their respective changes in enthalpy of formation (ΔHf) were considered, and the resulting value was divided by the standard change in enthalpy of formation (ΔHf0).
2.5.6. Dynamic Mechanical Analysis (DMA)
A comprehensive DMA was carried out using the Q850 DMA from TA Instruments Ltd., New Castle, DE, USA. The study was designed to investigate the mechanical behavior of a composite material as a function of temperature. To perform the DMA measurements, the temperature was increased gradually from −20 °C to 140 °C at a constant rate of 3 °C per minute. The frequency was maintained at 1 Hz throughout the entire experiment. The single cantilever bending method was utilized to analyze the mechanical properties of the composite samples. The samples were made with exact dimensions of 2 × 12 × 17.5 mm to guarantee comparability among them.
3. Results and Discussion
3.1. Images of Flax Fibers before and after Wet and Dry Treatments
Figure 1 shows the SEM images of flax fibers before and after wet and dry treatments. The fibers in
Figure 1a,b exhibited the presence of natural waxy substances on their surface, characterized by a cylindrical stem. In contrast,
Figure 1c,d illustrates the result of treating the NT fibers with acetone, which led to a smoother appearance. This outcome signifies the effective removal of the waxy layer. This most likely occurred because acetone is a solvent that can remove some of the waxes and other impurities on the surface of the fiber [
29]. However, some authors have highlighted that it may not have been sufficient to form a rougher surface or improve adhesion to the polymer matrix [
30]. Moreover, the alkali treatment significantly removed wax, pectin, lignin, and other contaminants from the surface of the flax fibers, as shown in
Figure 1e,f. Studies have shown that alkali treatment can roughen flax fiber surfaces, but the current study did not show this effect, which was possibly due to the low concentration of NaOH utilized in the treatment process. This phenomenon was confirmed by [
31]. Finally, plasma treatment resulted in removing waxy substances and rougher surfaces. These results were consistent with the findings of [
32], who previously researched the impact of plasma treatment on the surface roughness of natural fibers. They also found that the rough surface of fibers resulting from plasma treatment improved the mechanical properties and increased the strength of the bond between the fibers and matrix. The findings of the study concur with the conclusions and demonstrate the effectiveness of plasma treatment as a means to modify the surface texture of flax fibers.
3.2. FTIR of Non-Treated and Treated Flax Fiber
The FTIR spectra of NT flax fibers were analyzed to identify the unique band assignments of the organic polymers present within the fiber. The NT fiber revealed a strong hydrogen bond at 3340 cm
−1, indicating the presence of hydroxyl (OH) stretching absorption. Additionally, a wide band between 3000 and 2800 cm
−1 was identified as being related to the C–H stretching of the aromatic methyl group found in polysaccharides such as cellulose. Moreover, two bands at 2915 and 2850 cm
−1 were linked to pectin and extractives, such as waxes [
33]. Additionally, the band at 1640 cm
−1 was attributed to the vibrational motion of water molecules adsorbed in the crystalline form of cellulose [
34]. Furthermore, the CH3 asymmetric deformations in lignin were indicated by the absorbance band at 1432 cm
−1. Moreover, the presence of microcrystalline cellulose resulted in the detection of three bands in the spectrum, located at 1370 cm
−1, 1335 cm
−1, and 1315 cm
−1. The results highlighted two key bands related to polysaccharides in cellulose: the 1160 cm
−1 band corresponding to the ring breathing, and the 1108 cm
−1 band representing the glycosidic ether band. Additionally, the presence of amorphous cellulose in the flax fibers was indicated by the C–O stretching peaks at 1056 and 1033 cm
−1 and the CH bending at 900 cm
−1. A summary of the characteristic band assignments is provided in
Table 1.
FTIR spectra were also analyzed for flax fibers treated with acetone, alkaline, and air plasma. The variations observed in the spectra between the non-treated and treated samples further highlight the potential for modification of these fibers using various treatment methods.
The results of the FTIR analysis, as depicted in
Figure 2b, offer compelling evidence of the plasma treatment effect on altering the surface structure of flax fibers. The detection of a peak around 1720 cm
−1, which is representative of the carbonyl group, indicates that plasma treatment has the capability to alter the functional groups on the fiber surface through interaction with the cellulose hydroxyl groups.
Additionally, the analysis of the CH region between 2750 and 3000 cm
−1, as shown in
Figure 2c, illustrates the impact of various treatment methods on the chemical composition of the fibers. It was observed that peaks associated with wax, around 2915 and 2850 cm
−1, were removed after treatment. Furthermore,
Figure 2c demonstrated that alkaline treatment also had an impact on other bonds primarily related to lignin, around 2940–2970 cm
−1, potentially altering the bulk of the flax fiber. These changes in the structure and composition of flax fibers, specifically through a reduction in the hemicelluloses and lignin content, had a significant impact on the properties of the fibers, as proven by the performed analysis [
35]. The study found that the strength of fibers treated with alkali decreased. This was a result of the removal of hemicelluloses and lignin and/or damage to the fibers during the treatment process, which caused the fibers to become separated.
3.3. Curve Fitting and FTIR of Purified Waxes
To quantify the impact of various treatments on the structure of flax fibers, the deconvolution of IR peaks was performed. The process of deconvolution involves separating overlapping peaks in a spectrum with an accurate peak location. Considering that plant waxes are very sensitive to changes in their environment, different type of flax usually alter the location of these compounds. To solve that, a method proposed by [
36] was employed for the extraction of waxes and an FTIR of the products was used to pinpoint the exact peak location for the complex mixture of different compounds in the waxes, such as hydrocarbons, esters, and free fatty acids.
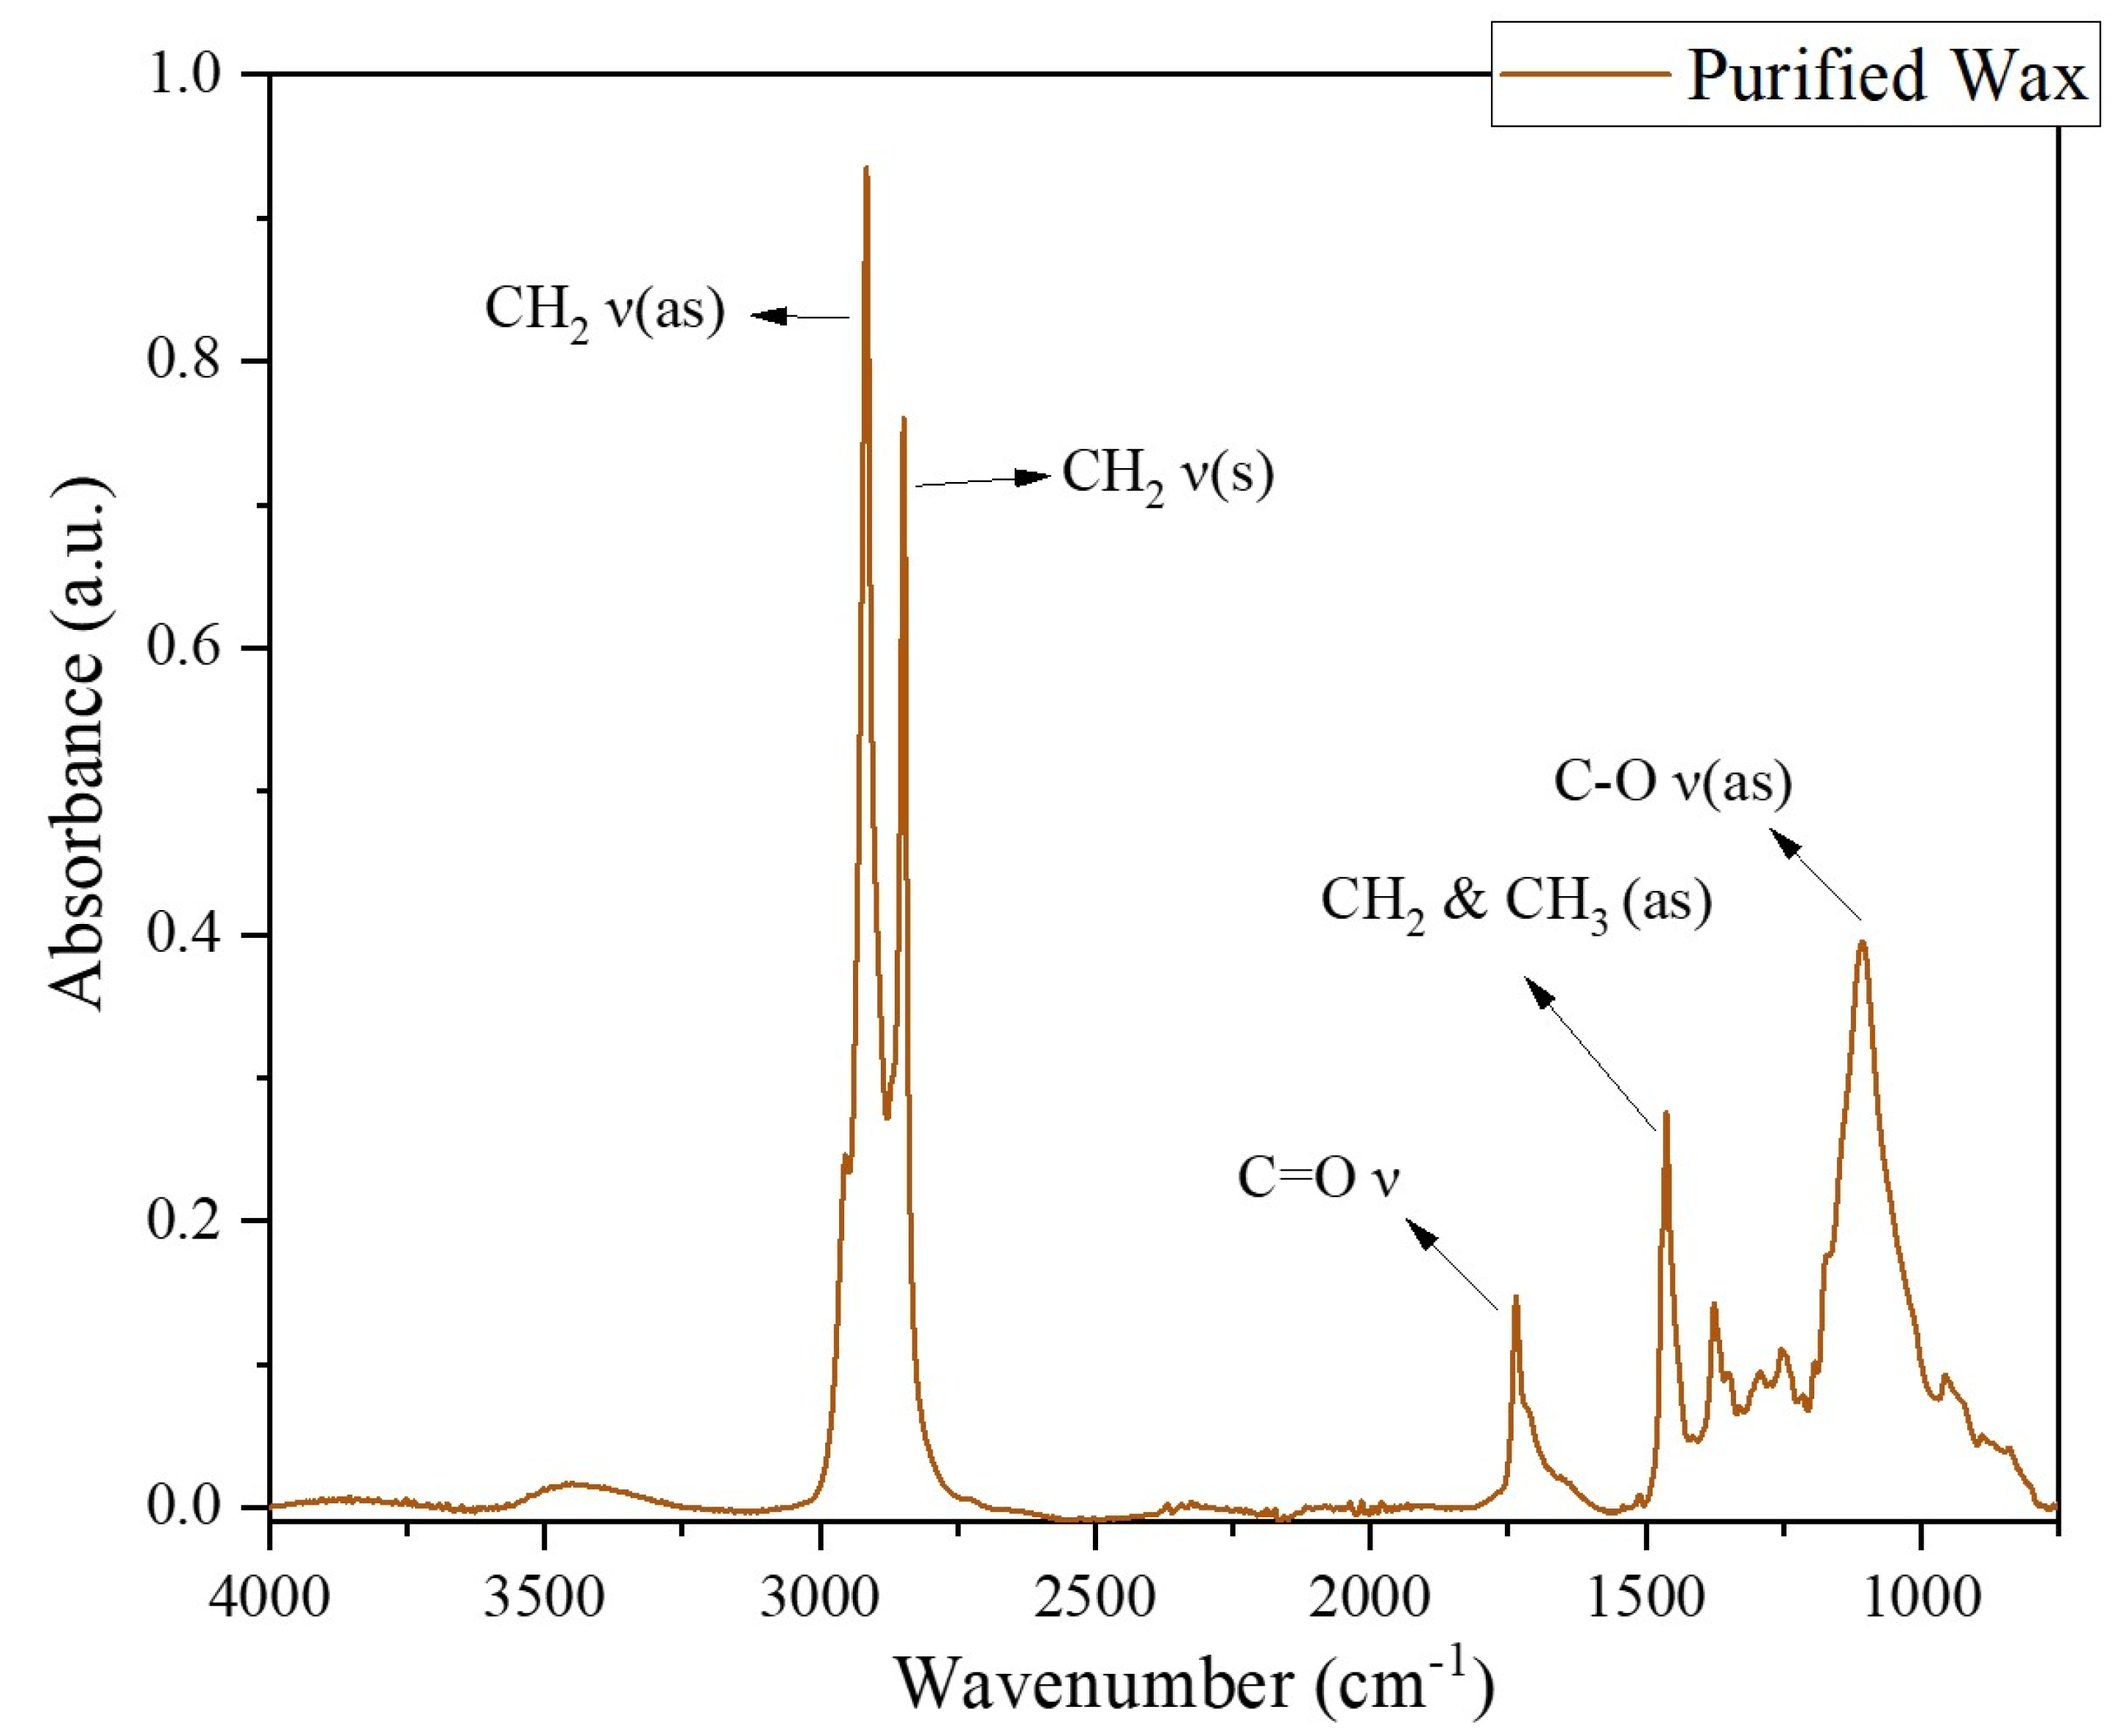
The results presented in
Figure 3 revealed a comprehensive understanding of the chemical composition of the purified wax after extraction. The spectrum showed two distinct peaks at 2920 and 2848 cm
−1, corresponding to the CH
2 stretching mode, giving insight into the saturated hydrocarbon makeup of the wax. Moreover, the presence of free carboxylic acids and esters was indicated by the peak at 1735 cm
−1, which corresponded to a carbonyl stretching vibration (C=O). Furthermore, the bands at 1463 and 1376 cm
−1 were attributed to the –CH
2 and –CH
3 bonds, respectively. Lastly, the bond at 1106 cm
−1, representing the –OH stretch, confirmed the presence of an alcoholic group in the wax.
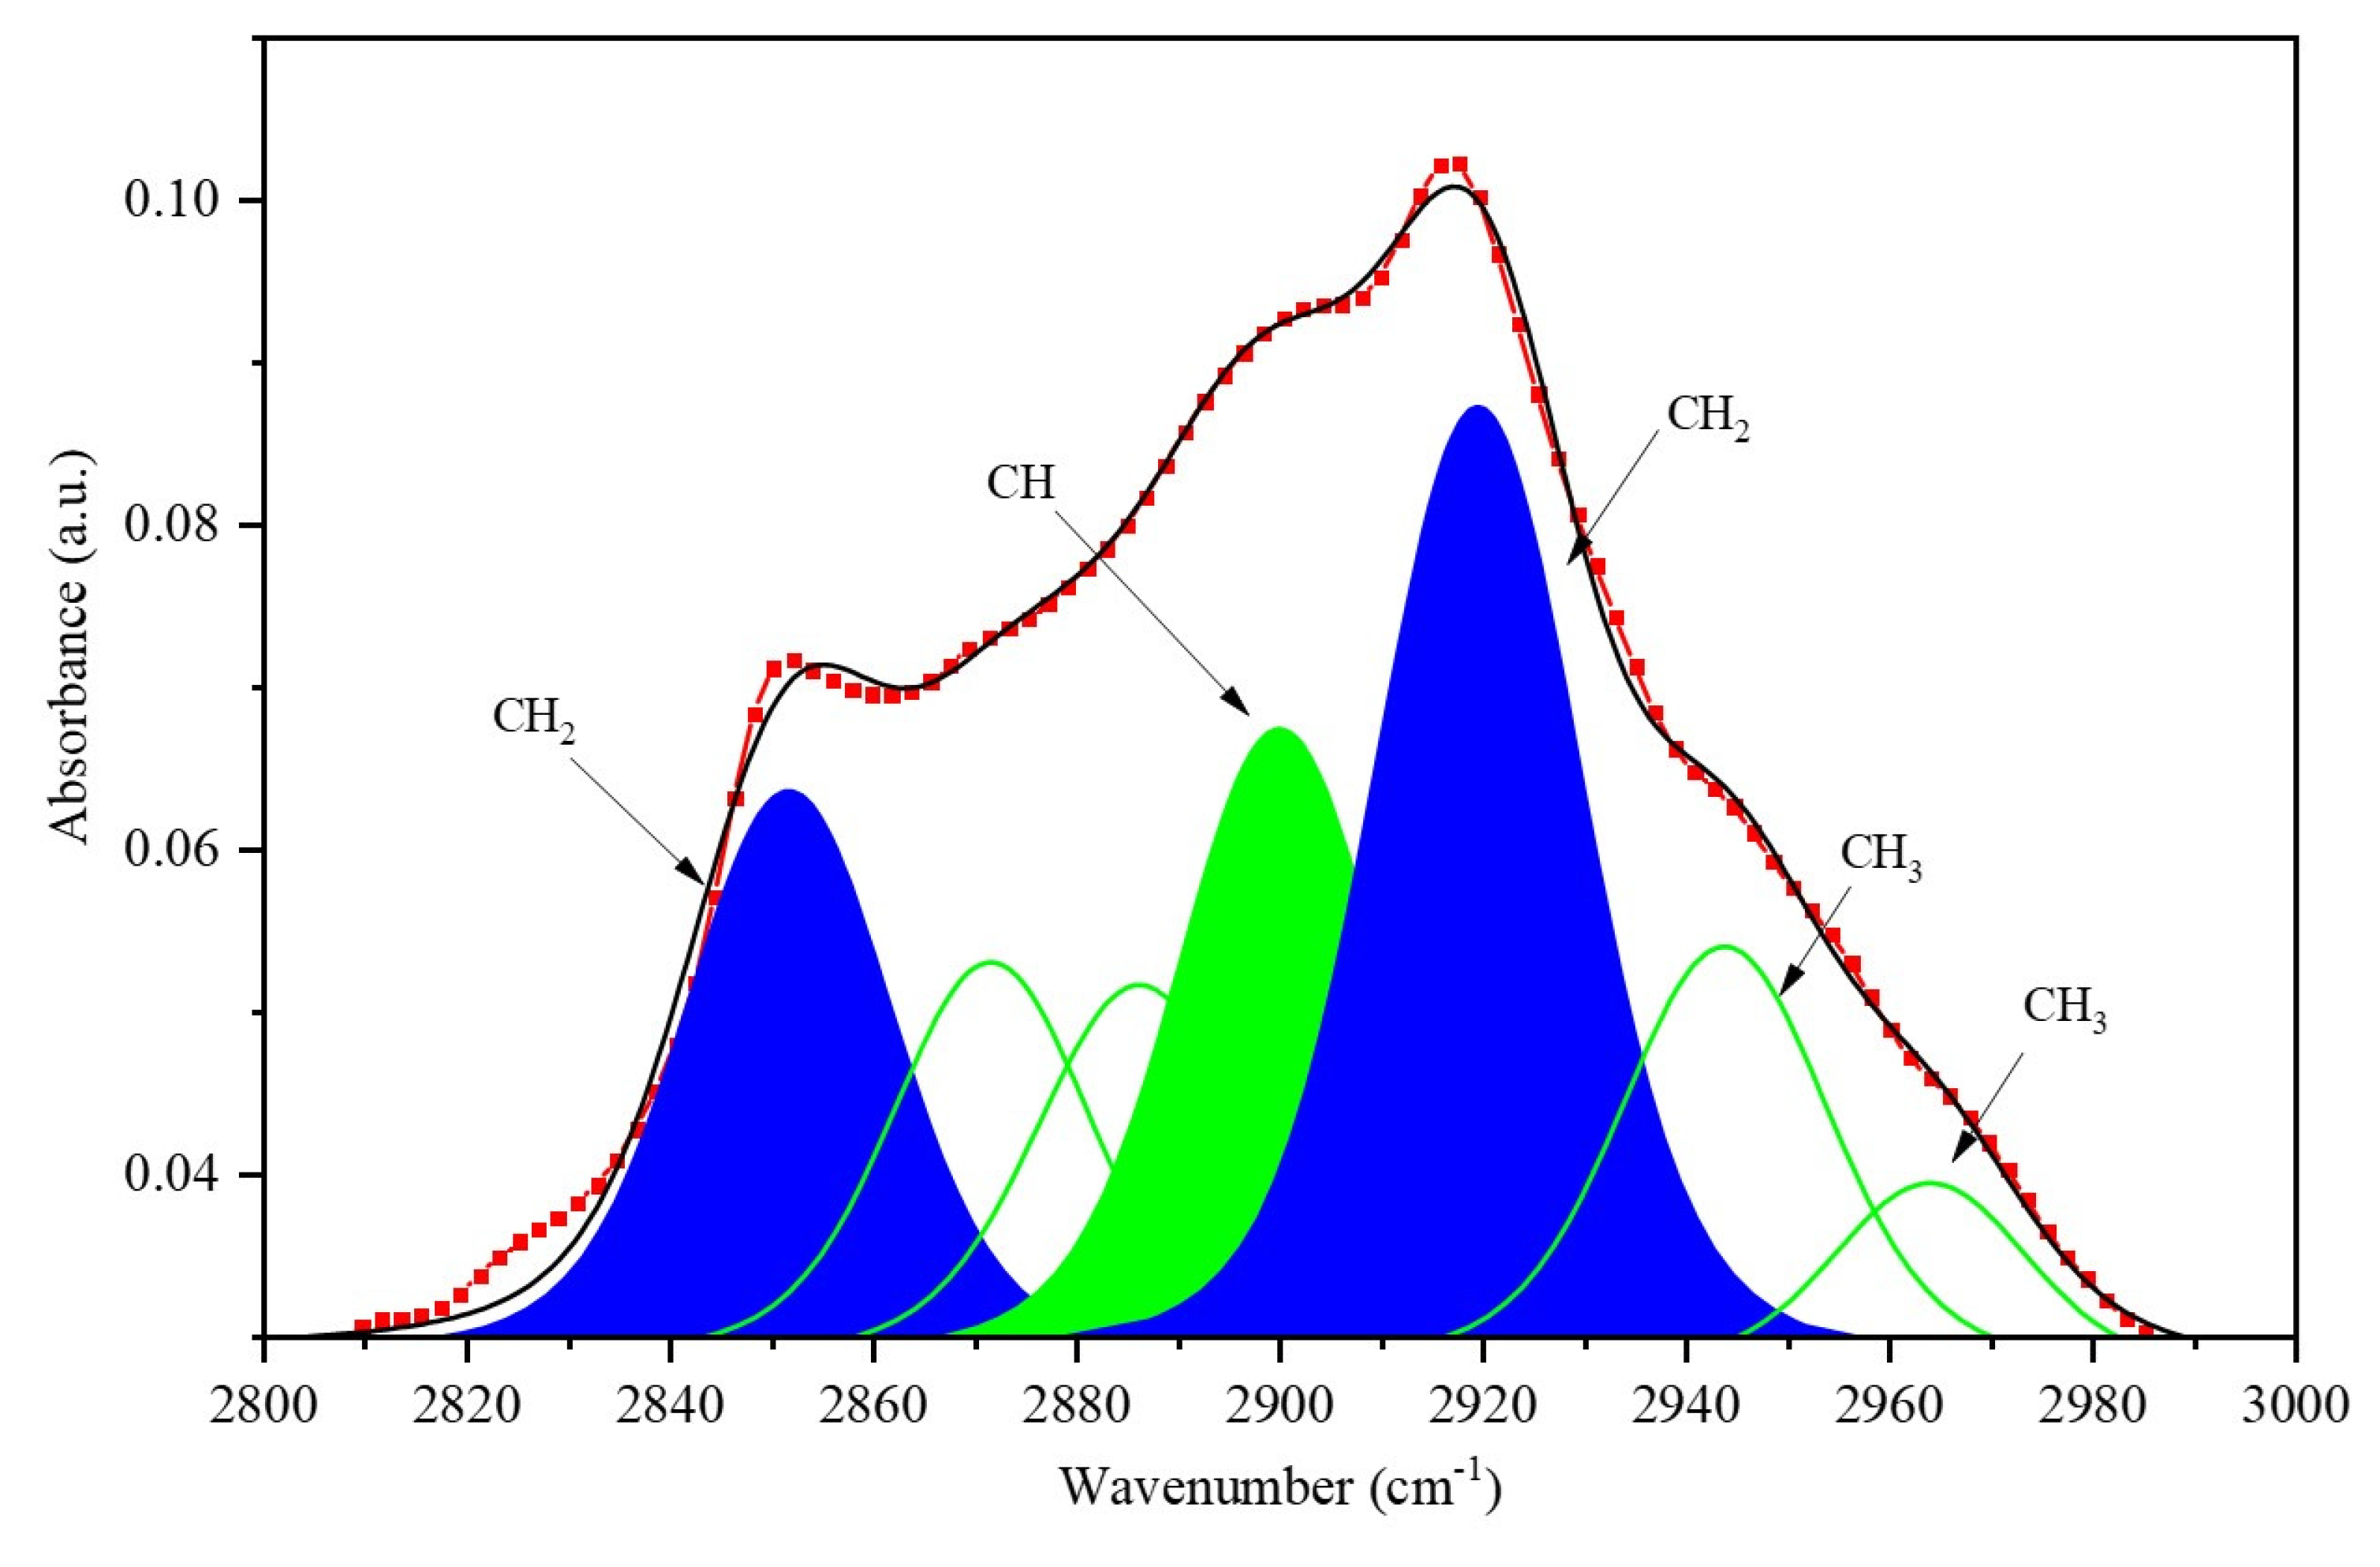
After the exact analysis of the extracted waxes, changes in the wax content for treated and untread samples were analyzed in detail by fitting the region between 2800 and 3000 cm−1. With this approach, it was possible to separate overlapping absorption bands in a sample and accurately quantify the concentration of functional groups present at a specific wavelength.
Figure 4 shows the peaks at 2848 and 2920 cm
−1, which are related to the wax material with the CH
2 vibration mode. The 2900 cm
−1 band is a result of the stretching of C–H bonds in either crystalline or amorphous cellulose. In addition, the lignin spectrum shows vibrations stretching from the CH
3 bond in the 2940–2970 cm
−1 range.
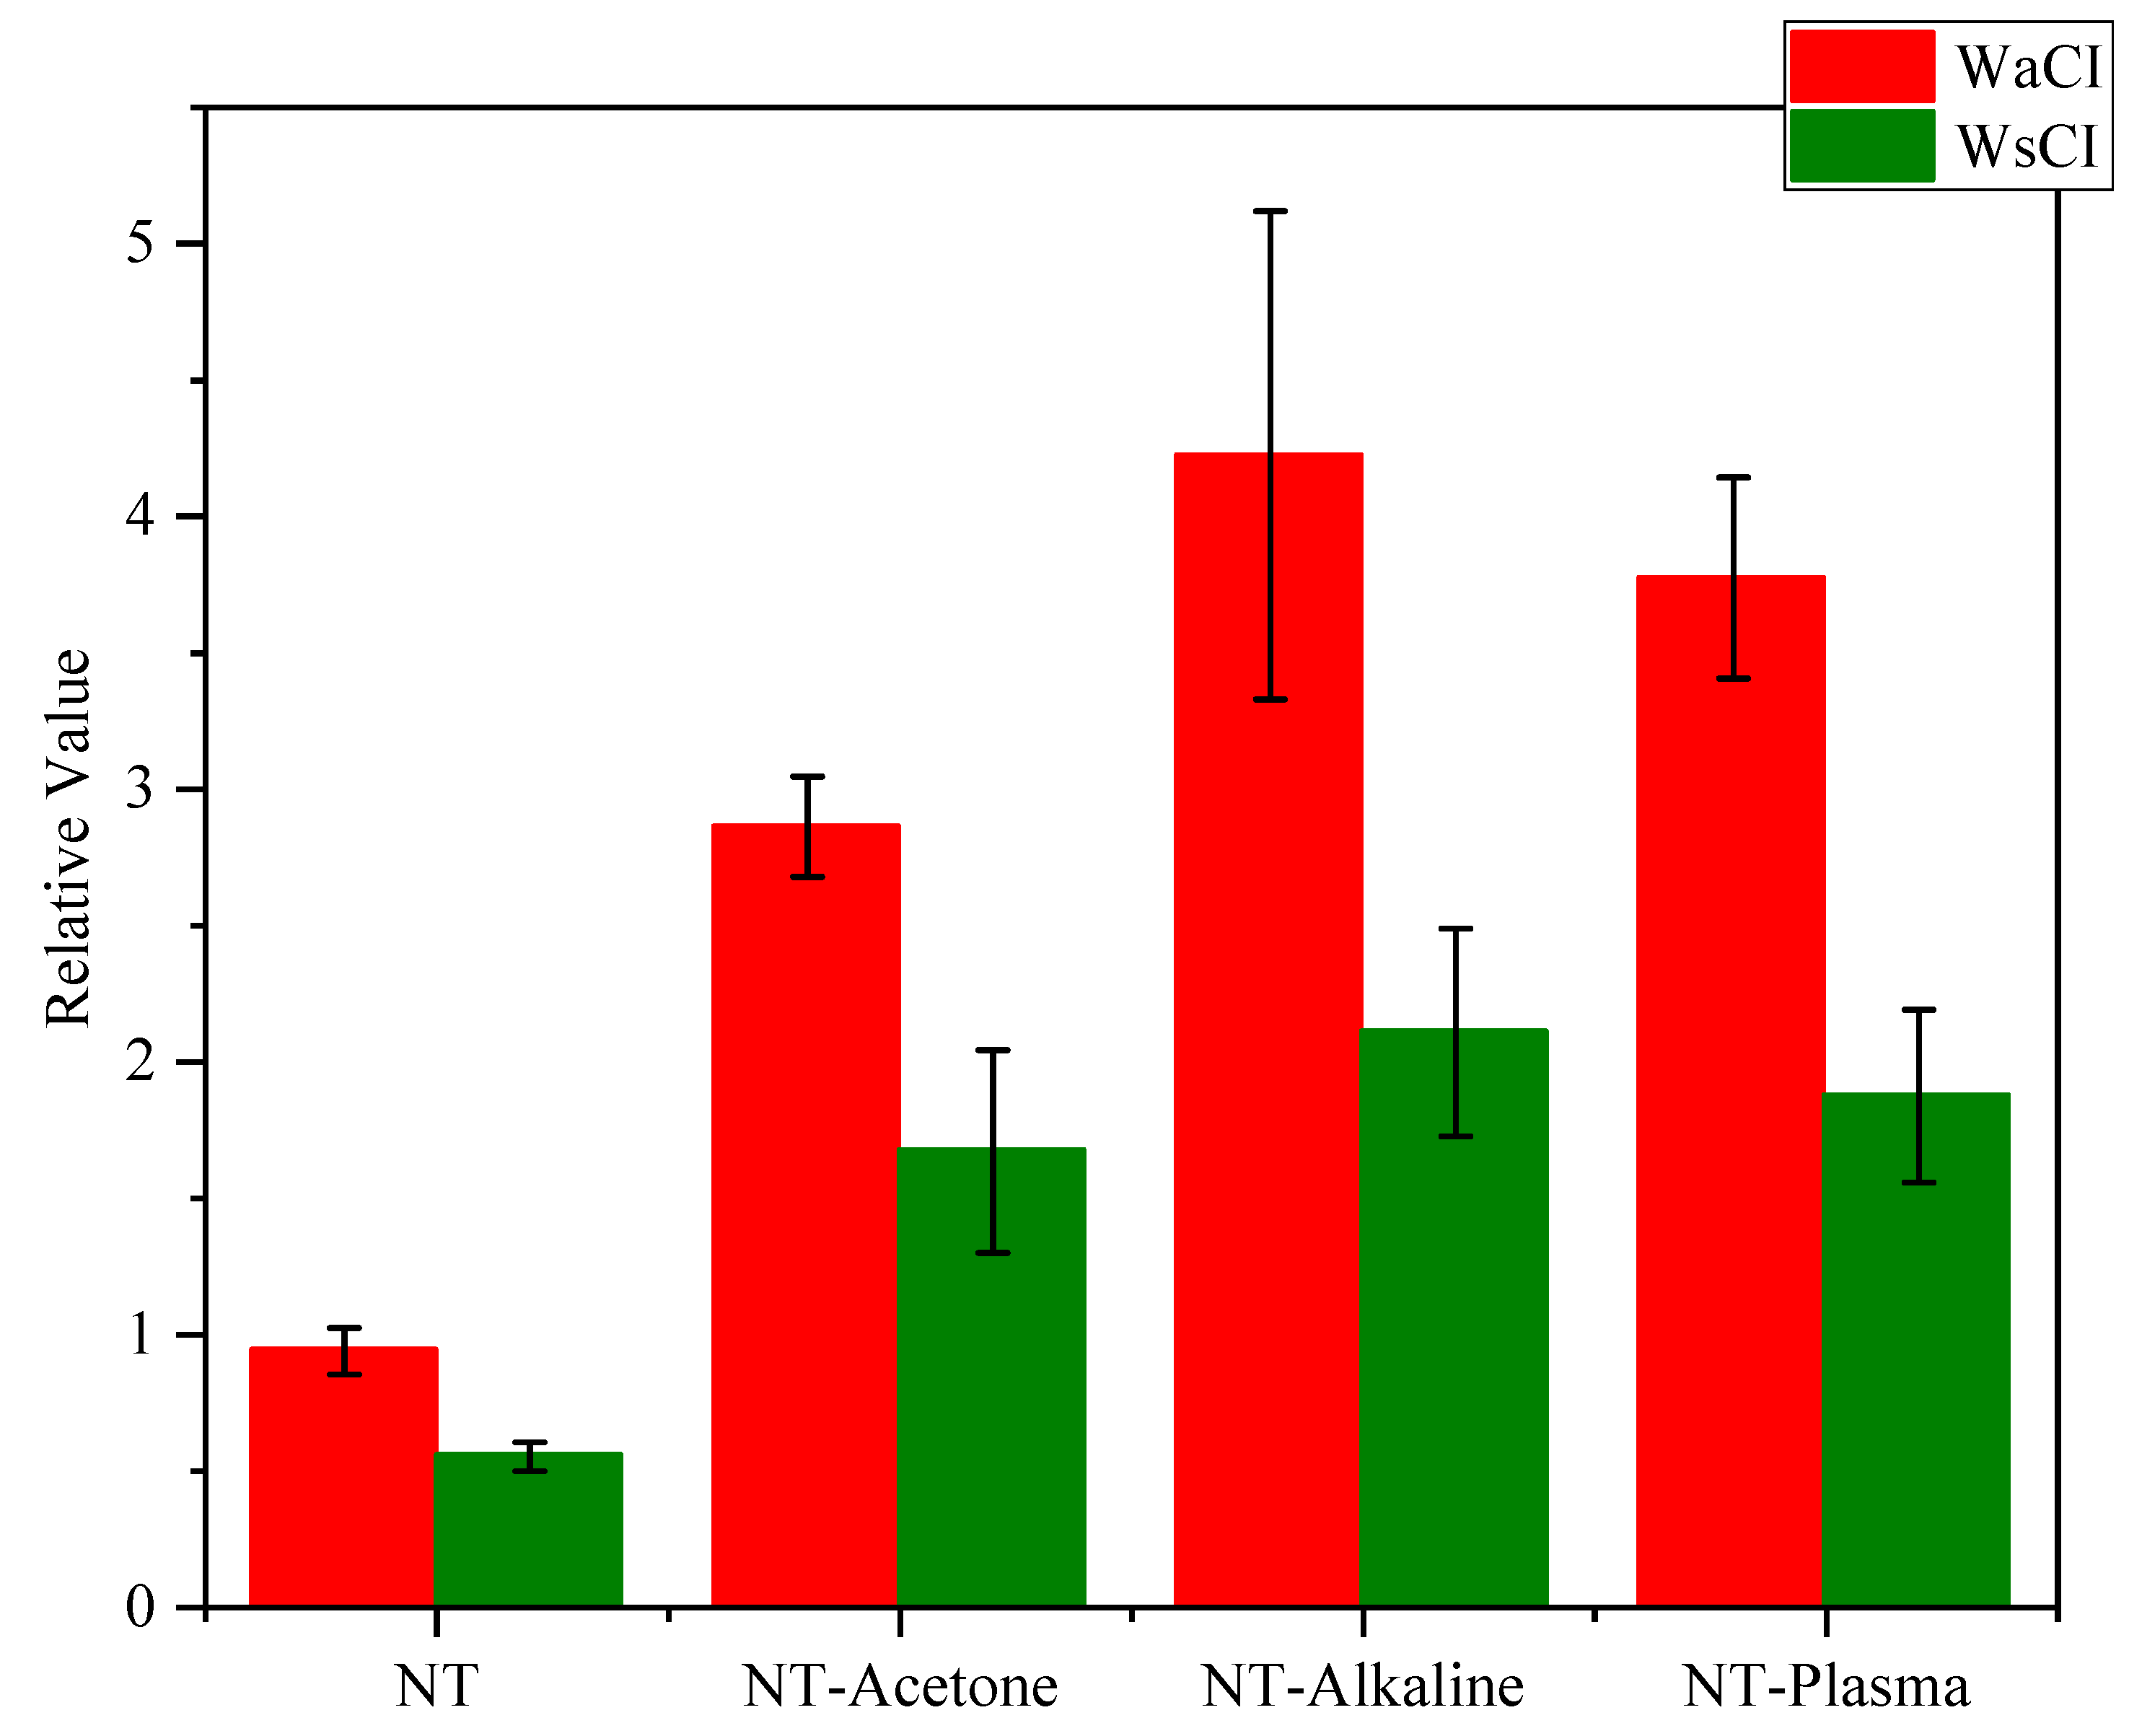
The treatments led to a clear trend: an increase in the cellulose concentration in the secondary cell wall, accompanied by a decrease in the wax content in the first cell wall. This suggests that reducing the wax content created more space for cellulose deposition, resulting in a higher cellulose concentration within the secondary cell wall. This is a significant finding, as the amount of cellulose is a crucial parameter in determining the crystallinity of the flax fiber, which affects the mechanical performances in composites, as highlighted by [
37]. Similarly, the amount of absorptions related to the waxes decreased after all treatments. In this sense, the FTIR results confirmed the preliminary observations made by SEM. To better evaluate the effectiveness of various treatments in terms of removing waxes and increasing the amount of cellulose, the wax crystallinity index (WCI) was also employed. In this regard, ratios of the peak areas of 2900 cm
−1/2850 cm
−1 and 2900 cm
−1/2920 cm
−1 were used to study the crystallinity by determining the wax content in the treatment process. The bands at 2920 cm
−1 and 2850 cm
−1 are attributed to the asymmetrical and symmetrical stretching of CH
2, respectively. Accordingly, the ratio of 2900 cm
−1/2920 cm
−1 and 2900 cm
−1/2850 cm
−1, referred to as the W
aCI and W
sCI, respectively. It has been observed that both alkaline and plasma treatments result in a significant increase in the amount of cellulose present on the surface.
Figure 5 showcases the results obtained from the study.
Figure 5 illustrates the outcomes obtained from the analysis of the area ratio of W
sCI and W
aCI, with varying treatment methods applied to flax fiber.
3.4. GC/MS of Purified Wax
The results of the GC/MS analysis performed on the plant wax sample revealed the presence of eleven distinct compounds, each characterized by its unique retention time, molecular weight, and percentage of peak area.
Table 2 presents a summary of the identified compounds. This analysis performed on the hydrophobic phase extracted from the wax material showed that many chemicals are present, including paraffins (C
nH
2n+2), phytosterols (sitosterol/campsterol), fatty acids (palmitic/nonadecanoic acid), fatty alcohols, and possibly detergents and adjuvants added during the manufacturing process.
This detailed summary of the identified compounds is important for providing a comprehensive understanding of the chemical makeup of the wax material of flax fiber. It serves as a valuable tool for quality control and regulatory purposes, as well as in further studies exploring the functional properties of wax materials.
3.5. Surface Analysis of Flax Fibers: Insights from XPS Spectroscopy
The surfaces of non-treated and treated flax fibers were studied through XPS. C1s deconvolution was used to study the XPS spectra of NT and treated fibers (
Figure 6) An analysis of the C1s deconvolution spectra of both fibers revealed four peaks at 284.8, 286.6, 288, and 289 eV. The first peak was attributed to a combination of sp
2 carbon from lignin aromatic cycles and sp
3 carbon (C-C/C-H) found in lignin, cellulose, hemicelluloses, and wax. The second peak represented carbon bonded with oxygen through a single bond (C-OH, C-O-C, or phenyl-OH). The third peak corresponded to carbonyl carbon (C=O), while the last peak was related to sp
3 carbon of ester and carboxyl groups (O-C=O).
The presence of a high amount of carbon in NT-flax fiber may indicate the existence of a waxy layer rich in hydrocarbons on the surface, as shown in
Figure 6. The surface of the fiber showed a slight increase in the oxygen content and a steady decrease in the carbon content for all treatments. The cause of this varied for each treatment, with the acetone treatment likely resulting from the removal of wax, whereas the alkali treatment was due to a combination of wax removal and the breaking of hydrogen bonds between hydroxyl groups, thereby revealing cellulose on the surface. On the other hand, the plasma treatment showed a greater proportion of carboxylic bond area, suggesting that it not only removed wax but also activated the fiber surface through plasma. These findings were supported by the FTIR analysis.
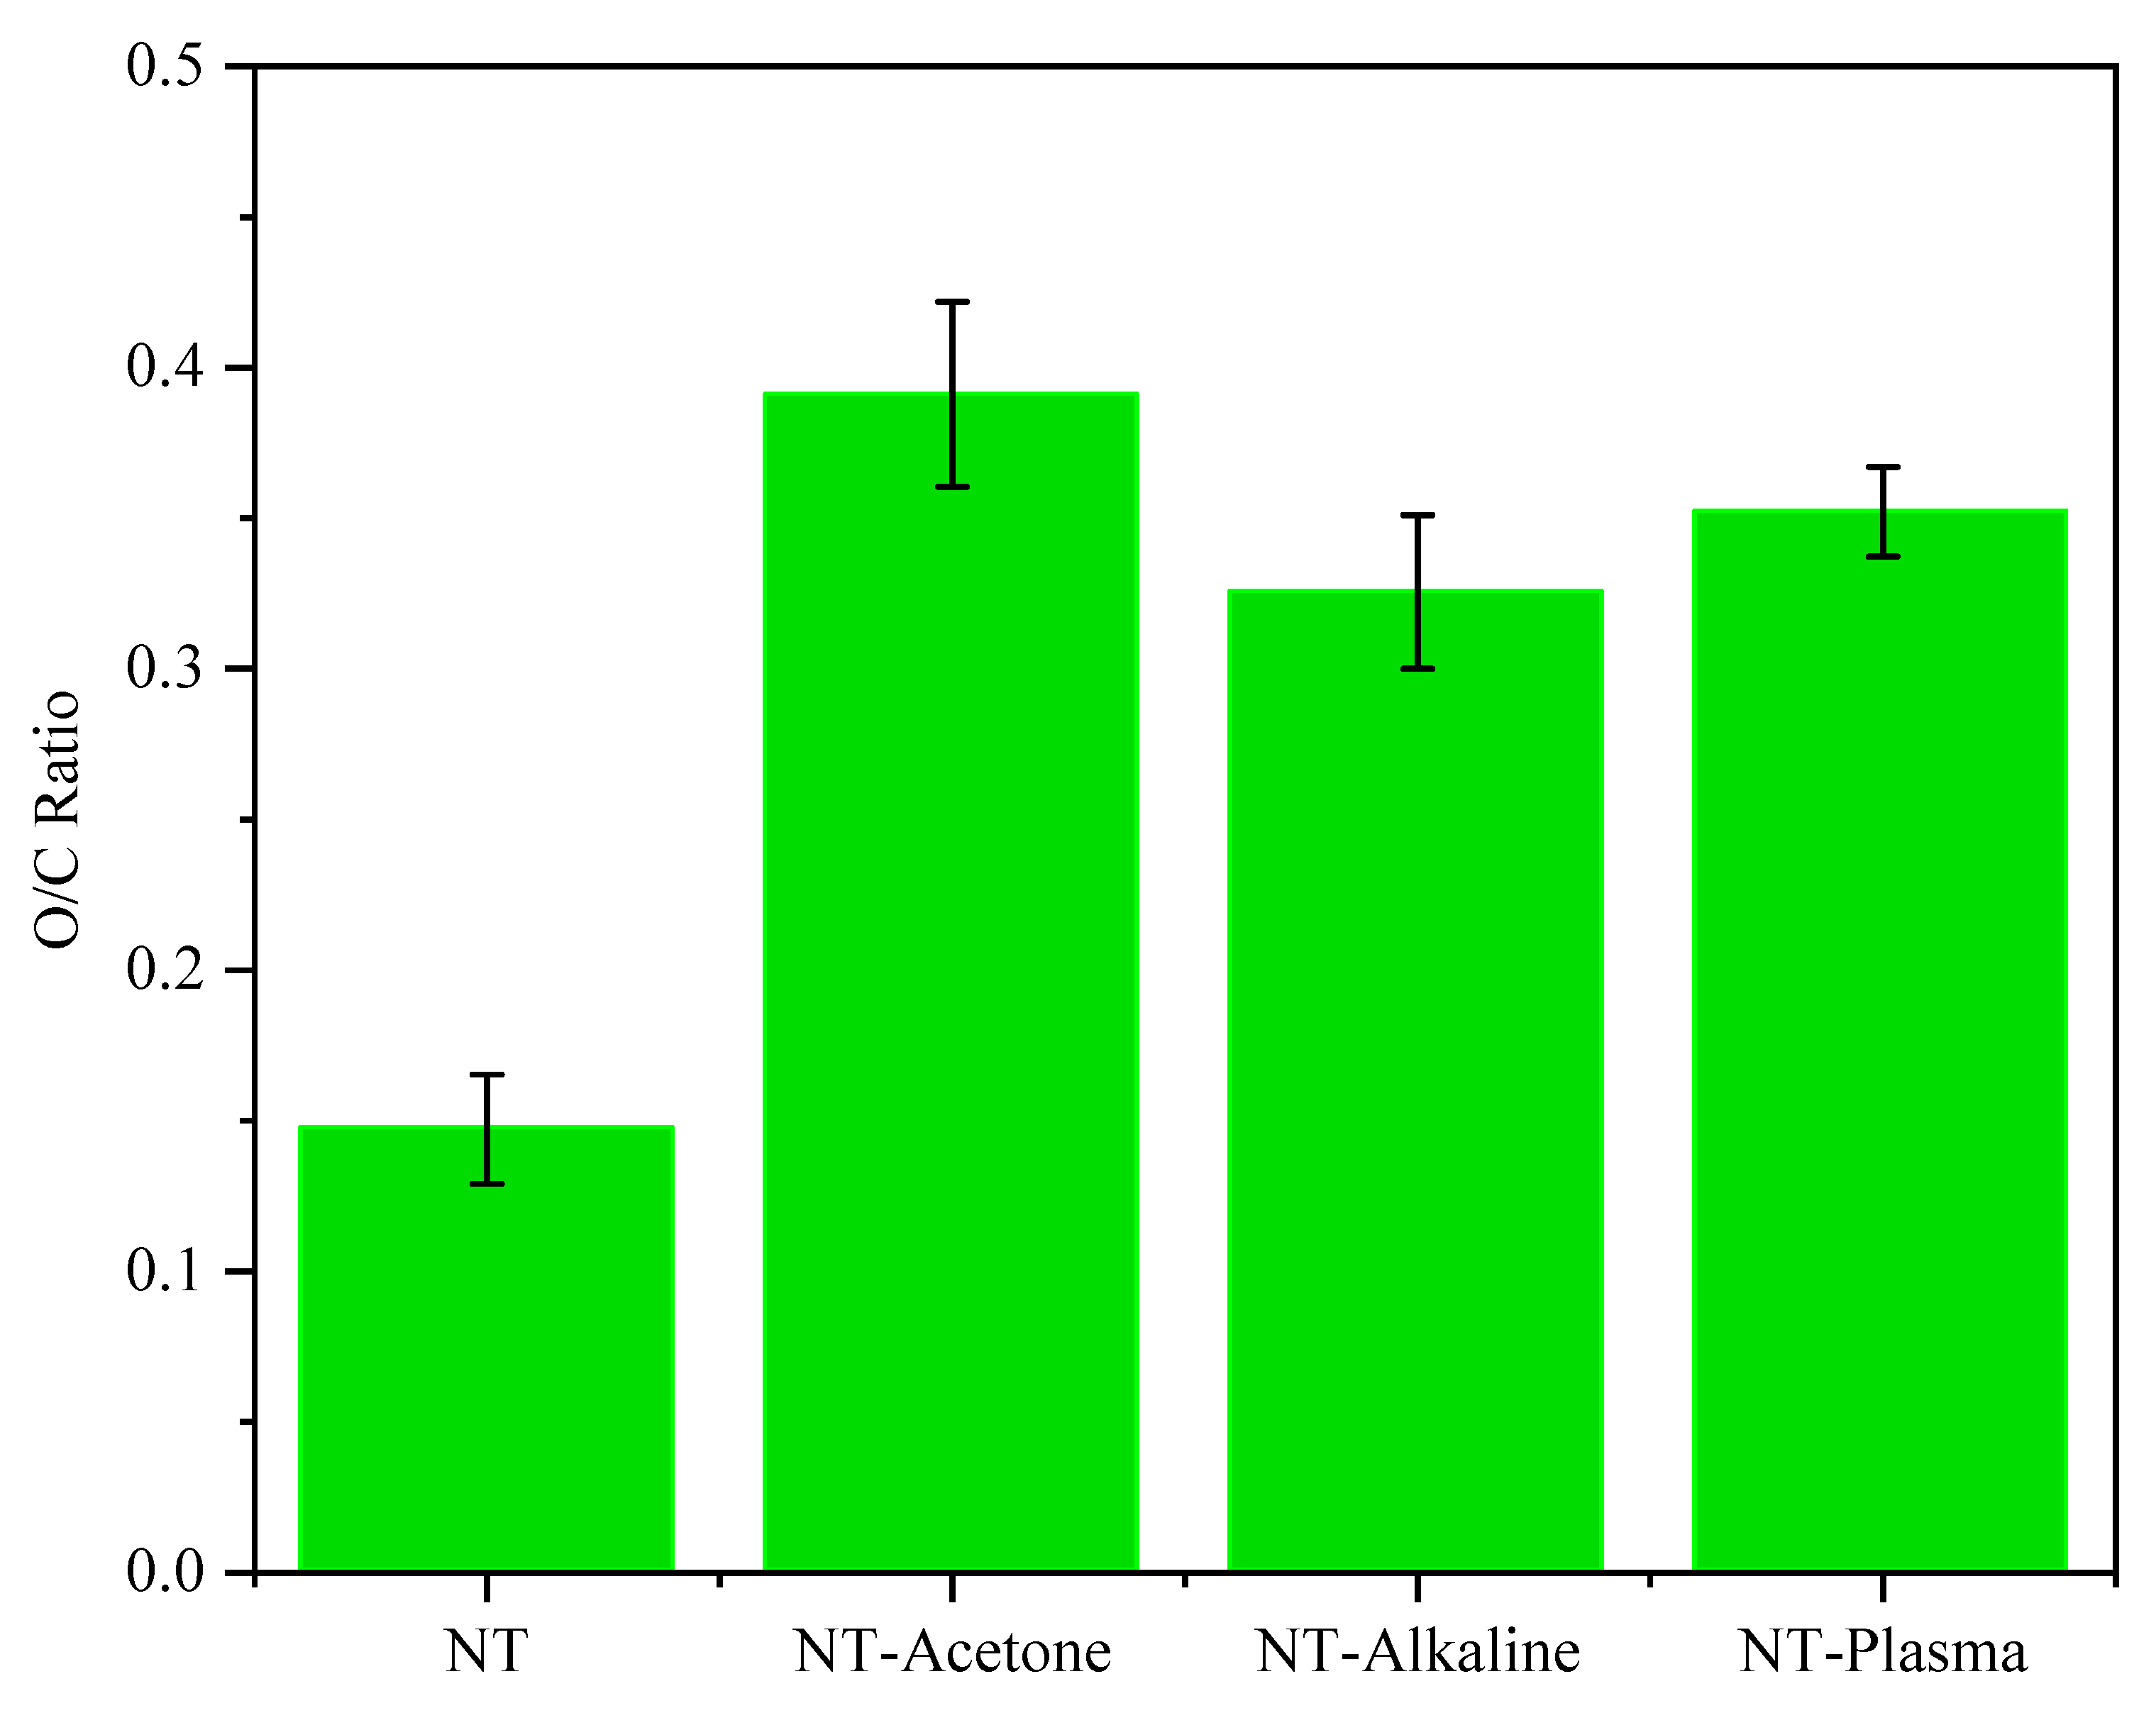
The results of the XPS analysis have shed light on the changes in the oxygen to carbon (O/C) ratio of flax fibers in
Figure 7. The XPS measurements of C1’s peak decomposition showed that the O/C ratio increased from 0.14 in NT to 0.39 in the NT-acetone sample. This increase is believed to be due to the presence of organic binding agents, such as residual middle lamellae on the primary cell wall, as well as the removal of components such as waxes and pectins.
Alkali treatment also contributed to the increase in the O/C ratio to 0.32 as a result of the degradation of hemicelluloses and the removal of lignin. Lignin is an important component of plant cell walls, and its removal through alkali treatment is known to improve the accessibility and reactivity of the remaining cellulose fibers. This removal of lignin results in an increased O/C ratio as oxygen-rich components become more prominent on the fiber surface.
The air plasma treatment was found to be effective in modifying the flax fiber surface, as evidenced by the increase in the surface O/C ratio from 0.14 to 0.35. The rise in intensity suggests that the air plasma treatment has led to oxidation of the flax fiber surface, as some groups containing oxygen were introduced onto the surface. The high-energy and reactive atomic of air oxygen excited by plasma are believed to be the underlying cause for the increase in oxygen content and O/C ratio on the air plasma-treated flax surface.
Overall, these XPS results provide a comprehensive understanding of the changes in the O/C ratio of flax fibers after various treatments and highlight the effectiveness of both alkali and air plasma treatments in modifying the surface properties of flax fibers.
3.6. Thermal Characterization of PLA/Flax Fiber Composites
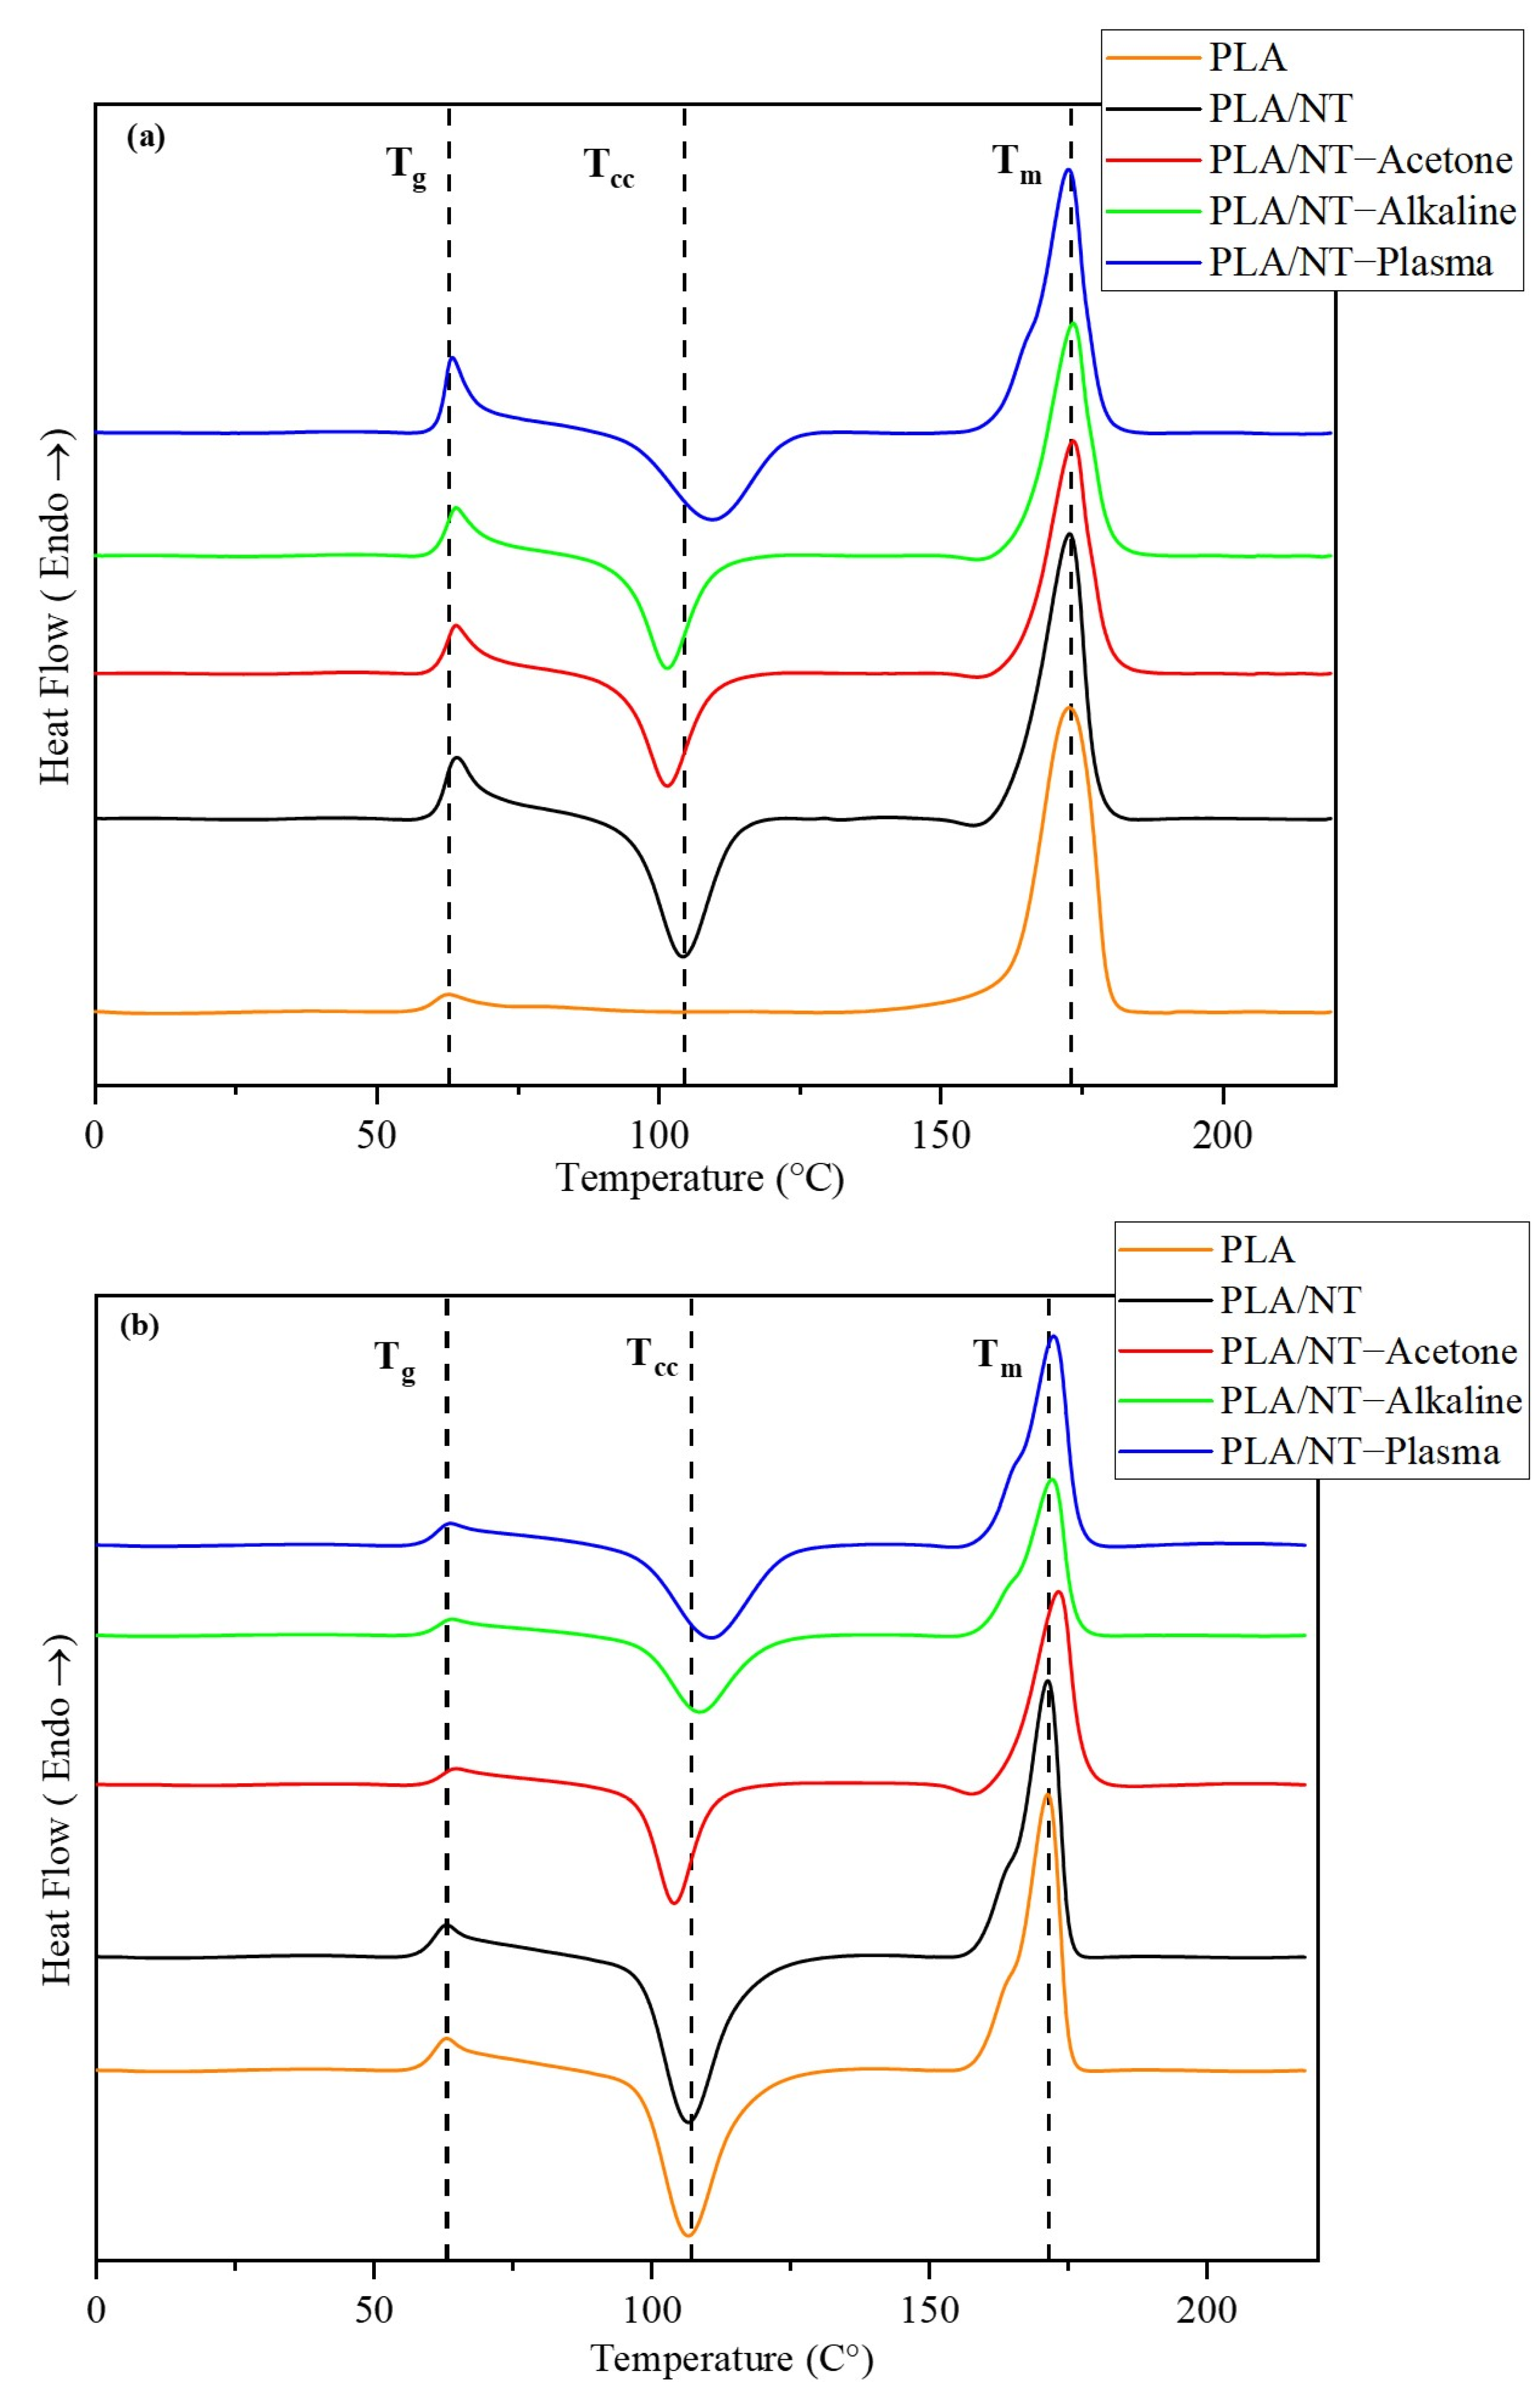
The melting and crystallization characteristics of PLA/flax fiber composites were investigated using DSC, and the results are illustrated in
Figure 8. The samples underwent three distinct transitions during the initial heating process, as evidenced by the DSC curves. These transitions were identified as the glass transition in the range of 58–68 °C, cold crystallization between 94 and 130 °C, and finally, melting at temperatures between 160 and 180 °C. The temperature at the peak of the cold crystallization transition is known as the “cold crystallization temperature” (T
cc). Additionally, the temperature at the peak of the melting transition is referred to as the “melting temperature” (T
m). In the glass transition region, an endothermic peak was seen in all samples. This peak is attributed to the relaxation and aging that comes from activating molecular mobility.
Figure 8a illustrates that neat PLA was unable to crystallize at a heating rate of 10 °C/min during the entire heating process. However, the addition of flax fiber content to PLA/flax fiber composites led to the appearance of cold crystallization peaks. This suggests that the inclusion of flax fiber improved the crystalline properties of the PLA. This is a common characteristic among natural fibers, which has also been observed in composites made from PLA (polylactic acid) and other natural fibers such as hemp, kenaf, and coir [
38,
39,
40].
The cold crystallization temperature of PLA/NT composites treated with acetone or alkali is lower than that of untreated composites, showing that the crystallization happened earlier. The decrease is due to the removal of hemicelluloses and other non-cellulosic components from the fiber surface. This results in a more highly crystalline cellulose structure, which serves as a nucleating agent for the polymer. The highly crystalline structure promotes the crystallization of the polymer at a lower temperature. On the other hand, the T
CC of PLA/NT-plasma composite occurs at a higher temperature, potentially requiring more energy to form a crystalline phase. By reinforcing the interface between the fiber and the matrix, the polymer chains are more firmly anchored to the fibers, limiting mobility, and delaying the start of crystallization. This phenomenon has been confirmed by [
41] using modified TiO
2 grafted onto flax fiber surfaces as reinforcing agents in PLA composites. The DSC parameters for PLA and PLA/flax fiber composites are summarized in
Table 3. These parameters provide valuable insights into the thermal behavior of the materials during the first and second heating cycles.
3.7. Thermal Mechanical Analysis of PLA/Flax Fiber Composites
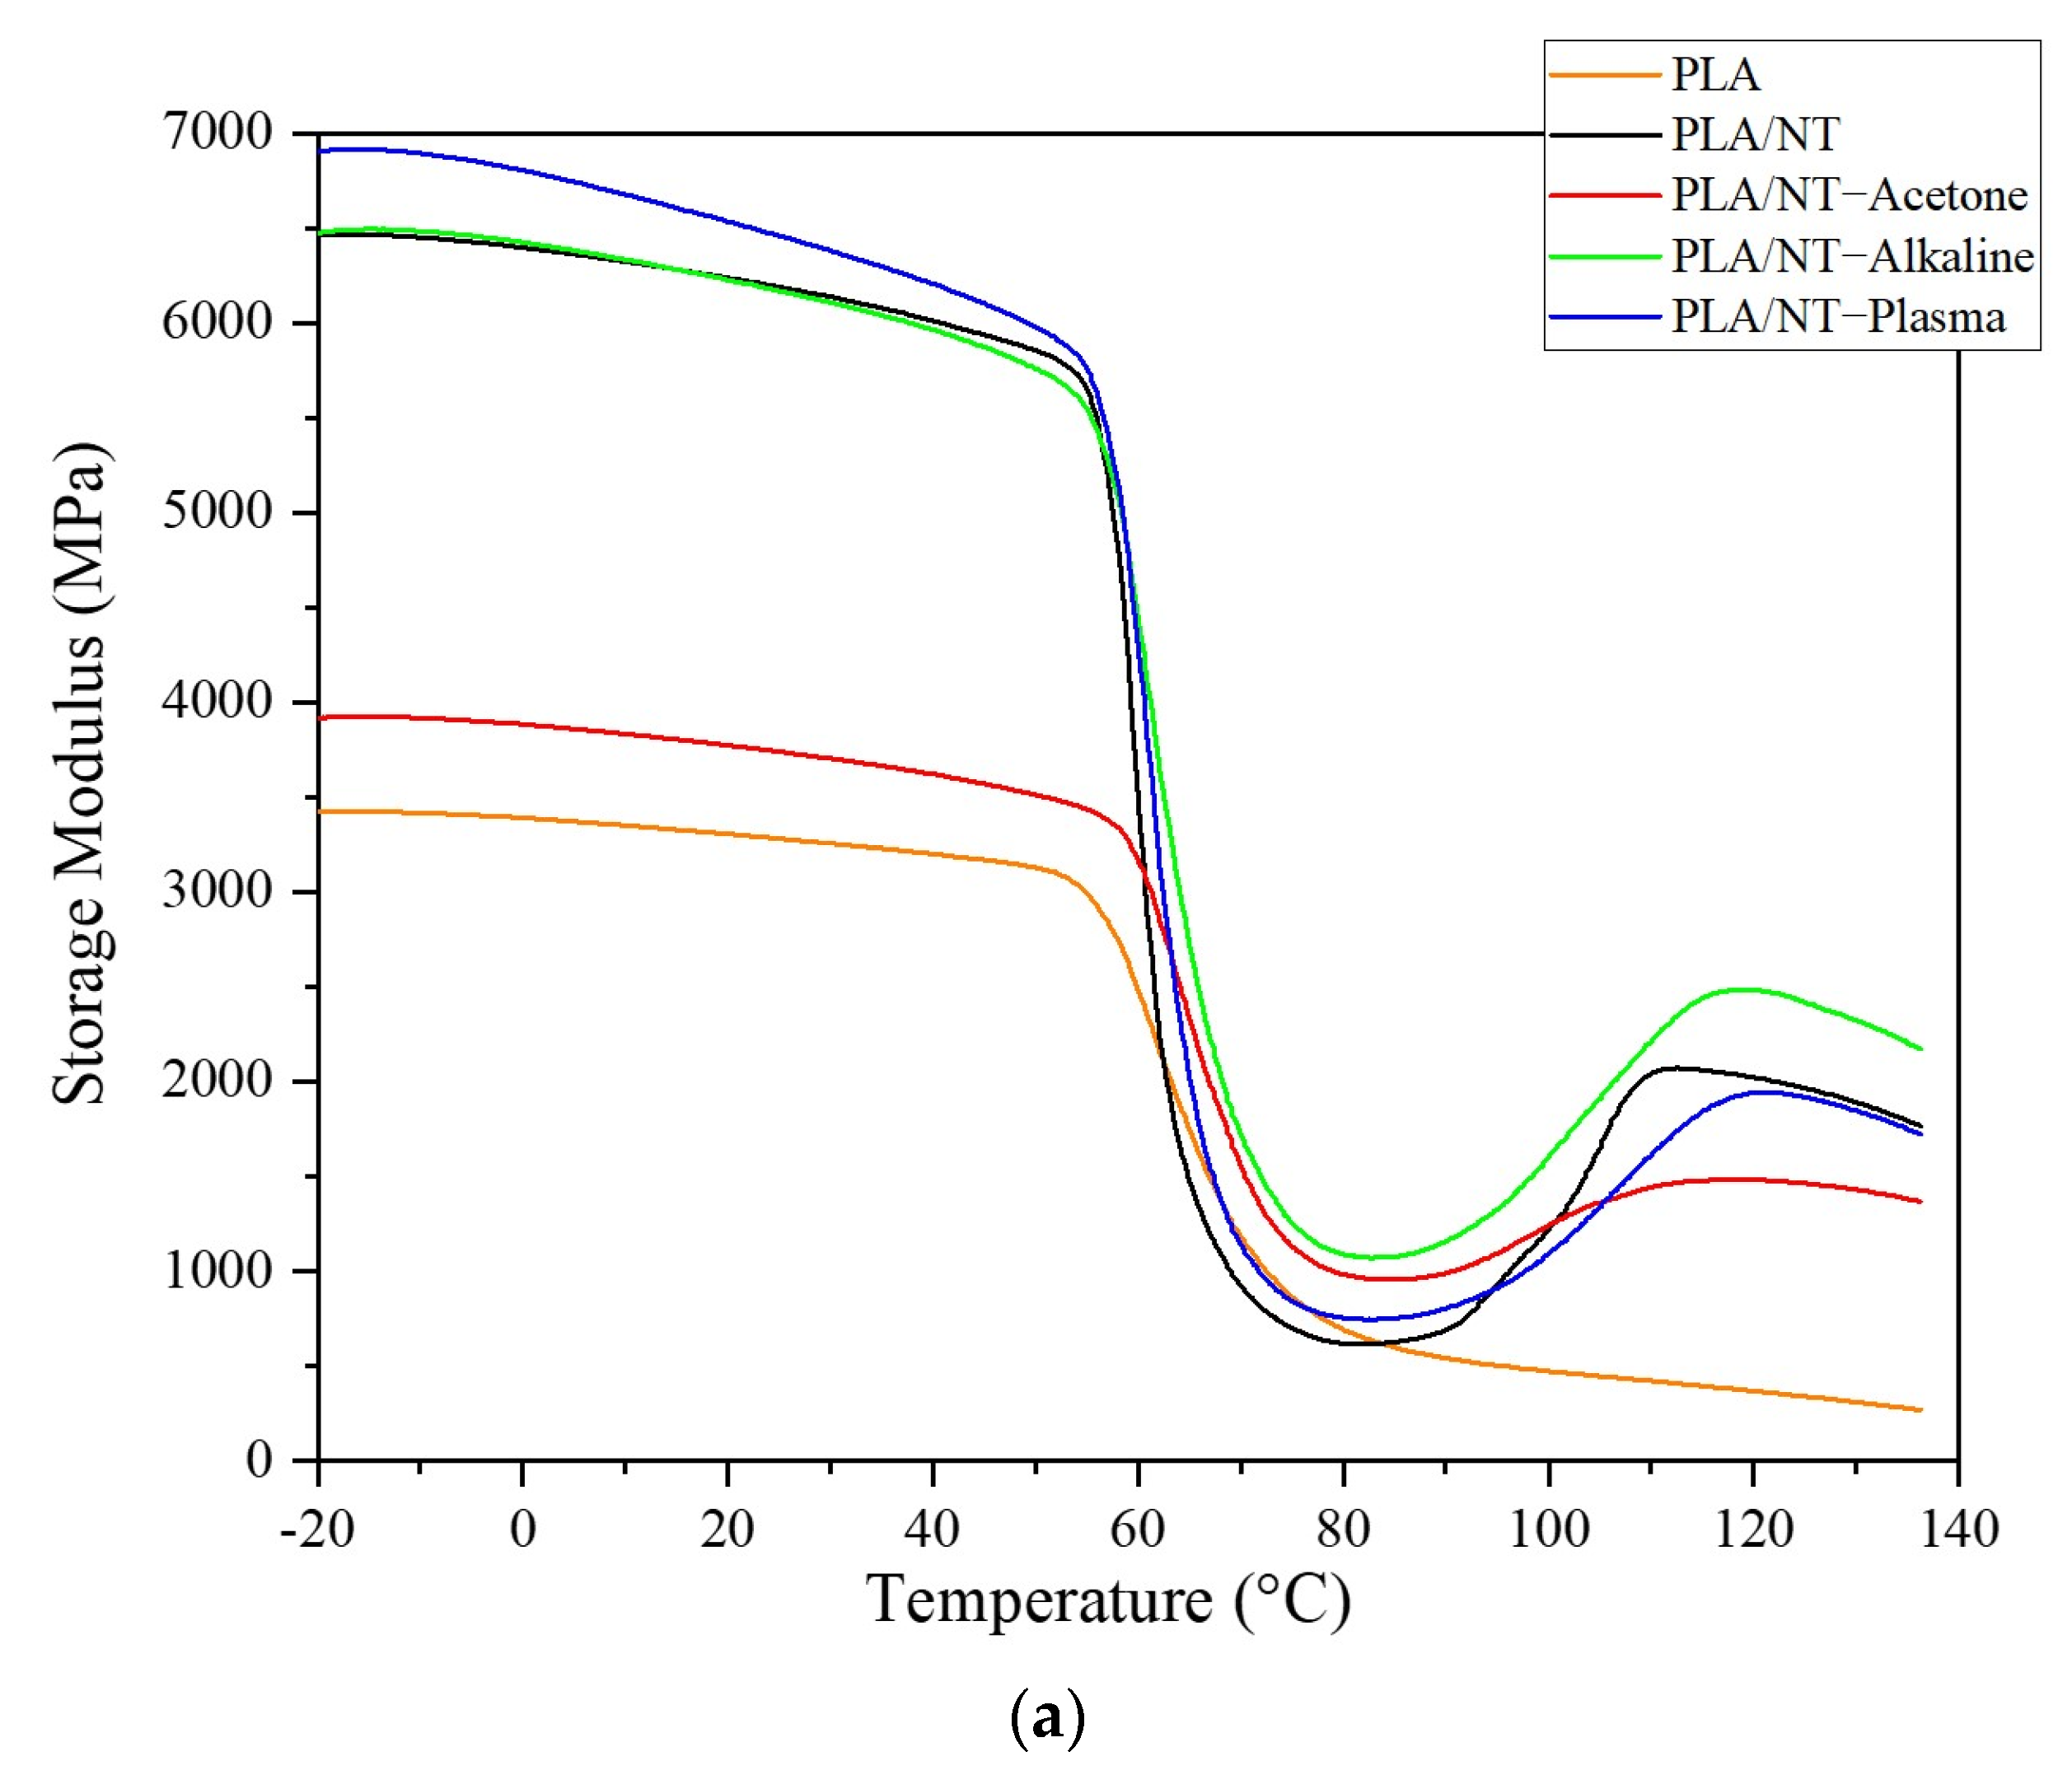
Figure 9 demonstrates the relationship between the temperature and both the storage modulus (E′) and the damping factor (tan δ), through graphs (a) and (b), respectively. It is a well-known fact that the storage modulus is a measure of a material’s capability to store the elastic energy that is applied to it. In the glassy region, which is below the glass transition temperature, all fiber-reinforced composite materials exhibit a higher initial storage modulus as compared to pure PLA because of the reinforcing effect provided by the fibers (Stanciu et al., 2020). Under temperatures below 100 °C, PLA exhibits behavior that is typical of amorphous or semicrystalline polymers above their glass transition temperature (T
g) with slow crystallization kinetics. The storage modulus of plasma-treated fiber composites was found to be significantly greater than that of other composites and slightly greater than alkaline-treated fiber composites (
Figure 9a). This would indicate that plasma-treated flax fibers adhered to the PLA matrix more effectively than alkaline- and acetone-treated flax fibers. The storage modulus of all flax/PLA composites dropped sharply around T
g and, subsequently, increased above 80 °C, due to cold crystallization. This effect was highlighted by [
42] using flax fiber as a nucleator to enhance the crystallization capability of polylactic acid composites in injection molding.
Figure 9b shows the patterns of the damp factor (tan δ) versus temperature (T) for each specimen. The tan δ curves demonstrated a distinct relaxation, which appeared as narrow peaks centered at approximately 70 °C for PLA. This relaxation is well known to be related to the mobility of amorphous chains. Interestingly, the tan δ relaxation of PLA/NT, PLA/NT-acetone, and PLA/NT-alkaline exhibit two tan δ relaxation peaks. The main PLA tan δ relaxation peak seems to split into two relaxation peaks that could be accounted for by changes in amorphous chain segment mobility. The mobility of amorphous chain segments or fractions near the flax fiber interface is constrained compared to chain segments located farther from the interface.
As a result, two tan δ relaxation peaks appear. Peaks with the lower and higher relaxation temperatures are attributed to mobile and hindered amorphous chain segments, respectively. However, and unlike the other composites, PLA/NT-plasma exhibits a lower and single tan δ relaxation peak. This behavior remains unclear, and further investigation is required, but it might be ascribed to plasma treatment, which affects the flax fiber deeper and could have induced a change in its microstructure.
4. Conclusions
In this study, atmospheric pressure plasma versus classical chemical treatments (acetone and alkaline) were used to improve the interfacial properties of PLA/flax composites. SEM images show that plasma treatment is an effective method to modify the surface roughness, making it beneficial for composite materials.
The utilization of the curve fitting technique enabled a more precise analysis of the wax content changes. It was observed that as the wax content decreased, the cellulose concentration increased, as evidenced by the WCI ratios. Both alkaline and plasma treatments resulted in a significant difference in the amount of cellulose on the surface. Moreover, the plasma treatment introduced a new functional group (C=O) on the surface, as indicated by the presence of this group.
The XPS analysis revealed that the O/C ratio increased by 156% and 135% following plasma treatment and the alkaline treatment, respectively. This indicates that the plasma treatment is more effective in removing wax and other contaminants from the surface of the flax fibers, leading to a higher proportion of carboxylic bond areas and improved surface roughness, interfacial bonding, and overall properties of the composite materials made from the fibers.
DSC analysis revealed that the inclusion of flax fibers in PLA increased the cold crystallization temperature of the PLA/flax fiber composites with the plasma treatment. This is likely due to the plasma treatment promoting a rougher surface of the fibers and better adhesion to the matrix compared with the other treatment.
The DMA results indicate that the plasma treatment of flax fibers leads to a significant increase in the storage modulus of the PLA/flax fiber composites, indicating improved mechanical properties due to increased adhesion between the fibers and the polymer matrix.
Overall, the study demonstrates the effectiveness of atmospheric pressure plasma treatment for improving the interfacial properties, surface roughness, crystalline properties, and mechanical properties of PLA/flax fiber composites. These findings highlight the potential of plasma treatment as a valuable technique for modifying composite materials and enhancing their overall performance.


