Article

Numerical and Experimental Investigations of CoNiCrAlY Particle Suspension Dynamics in Kerosene-Oxygen High Velocity Oxygen Fuel Spraying

1
Institute of High Performance Computing (IHPC), Agency for Science, Technology and Research (A*STAR), 1 Fusionopolis Way, Connexis #16-16, Singapore 138632, Singapore
2
Institute of Materials Research and Engineering (IMRE), Agency for Science, Technology and Research (A*STAR), 2 Fusionopolis Way, Innovis #08-03, Singapore 138634, Singapore
*
Author to whom correspondence should be addressed.
Coatings 2023, 13(4), 668; https://doi.org/10.3390/coatings13040668
Submission received: 31 January 2023 / Revised: 15 March 2023 / Accepted: 16 March 2023 / Published: 23 March 2023
(This article belongs to the Special Issue Recent Advances in High-Velocity Oxygen Fuel (HVOF) Coatings)

Abstract

:
Three-dimensional computational fluid dynamics (CFD) modelling is employed to simulate a typical high velocity oxygen fuel process (HVOF) under laboratory operating conditions. Two different modelling approaches, viz., the continuum and discrete models, are engaged to model the liquid fuel kerosene, and their influence on the resulting primary gas dynamics is investigated. Numerical results of the primary gas dynamics are validated against the available measurements and found to be in good agreement. It is observed that the fuel droplets less than 5 μm react completely inside the combustion chamber, whereas the larger droplets do not. With increasing fuel droplet size, the chemical reaction gets extended to the downstream of the combustion chamber, resulting in decreased flame temperature. Thus, it is inferred that a fuel droplet size of up to 5 μm yields better combustion characteristics. Discrete solid CoNiCrAlY particles are then injected into the high velocity primary gas stream, and their inflight dynamics are simulated. Results reveal that a maximum mean particle velocity of 700 m/s and a maximum particle temperature of 1350 K may be achieved under the given operating conditions. Particle deposit shape and size are determined both numerically and experimentally and found to be in good agreement. The influence of substrate stand-off distance on the particle deposit characteristics is investigated and reported in detail.

1. Introduction

Thermal spray coatings are developed by injecting solid particles into a high velocity high temperature spray system and impacting them on a required target surface at a critical particle velocity deemed for particle-target bonding initiation [1,2]. Thermal sprayed coatings have been widely used in the aerospace, power generation, automotive industries, etc., to provide protective coatings to their vital components that are often subjected to heat, corrosion, and wear. The high velocity oxygen fuel thermal spray process (HVOF) has been demonstrated to be one of the most efficient thermal spraying techniques to deposit high-grade coatings at moderate cost. Although HVOF spraying originated a century ago, its commercial usage came into existence only a couple of decades ago [1,2]. HVOF has many advantages than other conventional spray methods; for e.g., faster deposition, durable coatings, coating hardness, etc. However, the spray performance is dictated by the turbulent fluid dynamics inside the spray gun, which involves a complex physical and chemical processes, viz., fuel combustion and heat transfer, compressible supersonic flow, turbulent mixing, and multiphase interactions. A conventional HVOF system has a combustion chamber, where a highly pressurized mixture of oxygen-fuel is introduced and burnt into a complex gaseous mixture. The resulting mixture is then forced through a de Laval nozzle or convergent–divergent (CD) nozzle, which in turn discharges a supersonic gas flow into the atmosphere. The surface that needs to be coated is usually placed in the atmosphere at a pre-determined distance, referred to as stand-off distance, at the downstream of the spray system. The feedstock powders are introduced into the spray chamber with the help of a carrier gas or injected downstream after the nozzle outlet. The greatest advantage of the latter method is that it can fire the fine powder particles at high velocity without melting them. Thus, with elevated combustion dynamics, particles fly at velocities as high as 1000 m/s with jet temperatures of approximately 3000 K. The powder particles are usually spherical in shape and generally ranging from 5 µm to 80 µm. They are softened or melted by the hot gas while being carried to a targeted substrate to build coatings up to a thickness of a millimetre.
HVOF processes are developed to run on either gas or liquid fuels. However, the high velocity oxygen liquid-fuel (HVOLF) system creates a greater momentum output, which enables the production of denser coatings with a reduced level of porosity and superior corrosion resistance. The design of HVOLF systems is more complex because the liquid fuel needs to be atomised and, hence, efficient combustion is more difficult to achieve due to the variation of liquid fuel quality. Advanced computational models have been developed to gain insights into the thermochemical processes of thermal spraying [3]. A thorough review on modelling developments can be found in [1]. While most research has been focused on gas-fuel systems, not much research has been carried out on the most widely used liquid-fuel HVOF spray. Khan et al. [4] employed a factorial design approach to develop relationships between coating parameters and coating properties in the HVOF process. The results helped in identifying optimum parameters that produced the best coating quality. They also reported that HVOF produces superior coating quality compared to chrome plating. Jiangzhuo et al. [5] through a 2D axisymmetric model, presented an approach to parametrically simulate the coating thickness in the HVOF process. Particle distribution from a 2D model was extracted and then used to construct a 3D circular pattern with the help of nozzle details. Statistical methods were then deployed to smoothen the 3D profile and validated using the measurements. They also proposed a close-loop optimization model for the HVOF process, based on a sophisticated numerical simulation method, to understand inflight flame/particle behaviours [6]. Liu et al. [7] engaged an artificial neural network (ANN) model to predict the HVOF-sprayed Cr3C2–25NiCr coatings and analysed the influence of operating parameters. The real-time process parameters were used as inputs for the ANN model, and the porosity, microhardness, etc., were considered as targets for the model prediction. After training the model intensively, the predicted results were compared with experimental data and found to be in good agreement. Dolatabadi et al. [8] investigated the influence of a cylindrical shroud surrounding the gas core on the resulting particle dynamics using computational fluid dynamics (CFD) code. They found that the shroud significantly reduces the oxygen content in the field by protecting the supersonic jet from ambient air entrainment. They also validated through experiments most of the process parameters, such as shock formation, particle conditions, and coating oxygen content. Li et al. [9] proposed a dual model to investigate the complex combustion mechanism involved in a HVOF thermal spray process. Based on the proposed model, a comprehensive parametric analysis was carried out to study the relationship between the key process parameters and the particle inflight behaviour, as well as the resulting coating properties. Kamnis and Gu [10] developed a 3D model of a kerosene-fuelled HVOF thermal spray gun using a commercial CFD code. They examined the effects of liquid fuel droplets on the thermodynamics of the combusting gas flow. Tabbara and Gu [11] adopted computational fluid dynamics code to simulate the flow field in the commercial liquid-fuel HVOF gun, JP5000. Invoking continuum and discrete models, the HVOF dynamics were modelled, and the turbulent flow dynamics were revealed. The flow field was optimized by calibrating the nozzle and chamber dimensions. The influence of droplet characteristics on the flame combustion was also investigated. However, it is to be noted that Tabbara and Gu [11] assumed the flow domain to be two-dimensional and axisymmetric without considering the secondary discrete particle suspension dynamics. Hence, in this research we decided to analyse the secondary discrete particle suspension dynamics by further considering a full 3D flow model, which is the key objective of the proposed study. Jafari et al. [12] studied the effects of the combustion model and chemical kinetics through numerical modelling of a hydrogen-fuelled dual-stage HVOF system. The eddy dissipation concept (EDC) and eddy dissipation model (EDM) were deployed to model the combustion process, and their influence on the resulting temperature and velocity fields was studied. They inferred that these reaction models had significant influence on the gas flow and particle dynamics. Past studies on HVOF discussed so far are tabulated in Appendix A for easy and quick understanding, together with improvements that we have attempted in the present study.
Thus, we intend to optimize the process parameters and coating characteristics to meet the regulatory requirements through computational models in order to better understand the complex chemical processes and strong interactions between gas and discrete phases. Hence, in this paper we have attempted to build a full 3D computational fluid dynamics (CFD) model to understand both the kerosene-oxygen liquid fuel flow dynamics and solid particle spray characteristics by employing a commercially available HVOF gun configuration, viz., JP5000. This study is novel in investigating the 3D spray particle inflight characteristics (including the target substrate) coupled with the 3D primary gas flow dynamics and validated using in house experimental findings. A detailed and interesting discussion on the influence of substrate on the particle dynamics is provided in the Results and Discussion section. Such a study is scarce in the literature to the best of our knowledge.
The main objectives of our study are to understand (i) the kerosene-oxygen supersonic flow and its expansion characteristics in the ambient and (ii) CoNiCrAlY alloy particle inflight characteristics, deposit analysis, and validation against in-house measurements.

2. Materials and Methods

2.1. Model Description

A schematic diagram of a working JP5000 is shown in Figure 1 that consists of a fuel–oxygen inlet through the flow stabilizer (orange), the combustion tube that contains the convergent–divergent (CD) nozzle (purple), an interconnector (blue), and a 6” barrel (red). All dimensions were measured, to our best efforts, based on actual components.
A 2D cross-section of a 3D CFD model of the JP5000 HVOF system, together with the finite volume mesh, is shown Figure 2a. The full 3D model, together with the spray’s atmospheric domain, is shown in Figure 2b.
The circular substrate to be coated is shown as the shaded circular region in Figure 2b. It is 100 mm in diameter and placed at a stand-off distance of 300 mm from the torch exit, based on actual experimental setup. This stand-off is later varied to understand its influence on the particle dynamics and splat characteristics. The ambient atmosphere is modelled as a large circular cylinder whose diameter is 20 times the length and 160 times larger than the barrel diameter. The adoption of a 3D computational model coupled with particle dynamics makes the present work more comprehensive and closer to reality than the previous work by Tabbara and Gu [11], in which only a 2D axisymmetric model was used to represent the JP5000 HVOF gun design, which is not suitable to conduct particle dynamics. Although a 2D assumption employed by Tabbara and Gu may be good enough to approximate the primary fuel-oxy mixture characteristics, it is not sufficient to model the secondary particle phase, viz., discrete particle dynamics. Especially when the flow is highly turbulent, as is the case here, turbulent dispersion will influence the particle distribution to deviate from the simple symmetric assumption. Hence, it is important to model the HVOF process using a full 3D CFD model. The commercial CFD code ANSYS Fluent was employed to model and conduct steady state simulations. The total structured grid size employed for the present full 3D model is around 2 million cells including the ambient atmospheric domain. A mesh independence study was conducted using three different total mesh sizes, viz., 1, 2, and 3 million cells, and the results found negligible differences between 2 and 3 million cells. Thus, a 2 million grid size was considered the optimum mesh size for the present CFD calculations. A three-layer mesh strategy is adopted in the ambient domain, with the gas core having a very fine mesh and coarser meshes as we move away from the core region, Figure 2a. This is to ensure that the shocks appearing at high Mach numbers are correctly captured. Further discussion on the shock dynamics is given in the discussion section.

2.2. Mathematical Models

2.2.1. Gas Phase

Mathematical equations governing the flow of liquid fuel-oxygen mixture in the HOVF process are the classical continuity, momentum, energy, species, and ideal gas state equations described according to the law of mixtures [8]. For brevity, these equations are not presented again here. Liquid fuel is also assumed to be discrete droplets instead of continuum species in the present study. However, we found no significant difference in the gas flow dynamics beyond the CD nozzle, which is a critical finding of this study and will be discussed in detail later. Also, the size of liquid fuel droplets is found to influence only the gas temperature within the combustion chamber, and no significant difference in the gas velocity was observed. A detailed comparison of the results obtained from discrete droplet modelling and species modelling of the fuel mixture is presented in the Results and Discussion section. Therefore, based on those critical findings, the fuel mixture is assumed to be continuum, chemically reacting, viscous, compressible, and turbulent in the rest of the paper. Turbulence is assumed to be steady in its mean and, hence, the Reynolds averaged Navier-Stokes (RANS) approach is adopted here. The standard k-ε turbulent model [13] is used here to calculate the turbulent energy, k-, and its dissipation rate, ε, whose standard forms are given below. These turbulent quantities are then used to estimate the turbulent shear stress appearing in the equations of motion.
The Standard k-ε turbulent model:
ρ k t + x j ρ u i k μ + μ t σ k k x i = ρ P K ρ ε
ρ ε t + x j ρ u i ε μ + μ t σ ε ε x i = C ε 1 ε k ρ P K C ε 2 f ε ρ ε 2 k
where the turbulent viscosity is defined by
μ t = C μ f μ k 2 ε
Here, ρ, u i μ, μτ, and PK denote the mixture density, velocity, kinematic viscosity, turbulent viscosity, and turbulent production respectively. C ε 1 and C ε 2 are constants, σ k and σ ε are the turbulent Prandtl numbers for k and ε, respectively. The standard k-ε turbulence model proposed by Launder and Spalding can be recovered from the above equations by replacing the damping function with fμ = fε = 1. In this analysis, we employed the standard k-ε model, coupled together the standard wall treatment as explained in [13], to reproduce the near wall behaviour more correctly. However, the anomalous behaviour of the standard k-ε model around the stagnation flow points is well known [14]. When a stagnation point approaches the time scale, the estimate becomes too small, resulting low turbulent dissipation, which, in turn, returns to very high turbulent production. Hence, to avoid the build-up of turbulent kinetic energy in the stagnation regions, the production term in the turbulence equations is limited by the formulation given below:
P k = min   ( P k , C l i m ρ ε )
where the coefficient Clim is approximated to be 10 based on the inertial layer observations [13]. In the near wall parallel flows (y+~10), turbulent production doubles that of dissipation before reaching equilibrium in the log layer (y+~100). However, this ratio is higher in wall normal flows, e.g., impinging flows, and, hence, a value of 10 is good enough to limit the near wall turbulent production in most flows, thus justifying the above approximation. Values greater than 10 do not yield any significant advantages, as reported elsewhere. As mentioned earlier, this limiter does not affect the shear layer performance but simply avoids the stagnation point build-up in aerodynamic simulations.

2.2.2. Eddy Dissipation Model

In kerosene-oxygen HVOF combustion dynamics, the reaction products and their chemical kinetics are a very complex process. Especially, when the temperature increases above 2000 K, the reaction products, viz., CO2 and H2O, found in the kerosene-oxygen reaction (see Equation (4)) will dissociate into several species with low molecular weights due to strong thermal atomic vibration [15]. Previous studies have shown that a combustion model that does not account for the dissociation of combustion products will overpredict the combustion temperature [9,16]. Therefore, to reasonably model the combustion process with available computational resources, the most widely adopted eddy dissipation model (EDM) is employed here. The eddy dissipation model, which assumes that reactions occur infinitely fast, is limited by the turbulent mixing rate of fuel and oxidant, as described in [17]. In many practical situations, like the HVOF thermal spray process, the eddy-dissipation model describes the limiting rate and, thus, a knowledge of accurate Arrhenius rate data is not necessary. This conclusion has been validated by experimental observations [8]. Since the gas residence time in the combustion chamber (convergent section of the nozzle) is much longer than the subsequent parts, it is observed that most of the chemical reaction occurs in the chamber, and the reaction moves forward following an equilibrium chemistry model. Assuming that the reactants of the fuel mixture are composed of only oxygen and liquid kerosene, the reaction considered in this paper is represented by one global reaction scheme that accounts for dissociations and intermediate reactions and written in the following global form [18].
4 C 12 H 23   + 71 O 2 12.4 O 2 + 5.74 O + 31.84 H 2 O + 19.62 C O 2 + 28.38 CO + 12 OH + 4.76 H + 5.87 H 2
the equilibrium stoichiometric coefficients of each component in the above reaction formula are obtained at the experimental pressure, viz., 8 atm, which is the typical operating range of the JP5000 HVOF gun. Transport equations for each component of the above reaction are solved according to the law of mixtures [8].

2.2.3. Particle-Fluid Interaction

To obtain the solid coating particle flow characteristics, the built-in discrete phase modelling (DPM) toolbox in the commercial CFD code ANSYS Fluent is employed [19]. The motion of each discrete particle in the gas-particle flow is formulated by the Lagrangian particle tracking method. The volume fraction of the particulate phase is practically negligible and, hence, one-way coupling between the two-phase of gas–solid particles is adopted. Solid discrete particles are modelled as inert and spherical, and a uniform temperature is assumed inside each particle considered (lumped capacitance system). This formulation is assumed so that particle–particle interactions can be neglected. These facts impose the condition that the discrete phase must be present at low volume fractions. Enough evidence is available to support this condition in the HVOF sprays. Thus, the particle motion is described by the following equation of motion that is dominated by the drag force, Fd, exerted on the particles by the gas flow field,
d u p d t = F D u u p + g ρ p ρ ρ p + F
where u p is the particle velocity and ρ p , the particle density. The drag force, Fd, is calculated from.
F D = 18 μ ρ p d p 2 C D R e 24
The magnitude of the drag force depends on the drag coefficient, CD, that is estimated using Equation (7), the spherical drag law together with corrections to account for a particle Mach number greater than 0.4 at a particle Reynolds number greater than 20, Fluent [19],
C D = a 1 + a 2 R e + a 3 R e 2
The above formulation for drag estimation accommodates a wide range of experimental conditions often employed in HVOF sprays. To investigate the effect of turbulent flow on particle motion, the discrete random walk model (DRW) or ‘‘eddy lifetime’’ model is used, ANSYS Fluent [19]. The effect of particle and gas temperatures, as well as the specific heat ratio of the gas, is also considered. Using a lumped capacitance system and neglecting the radiative heat transfer, the energy equation for a single particle is given by
m p C p d T p d t = A p h c T g T p ,
where T is the mixture temperature, T p , the particle temperature, Cp, is the specific heat of the particle, and hc is the convective heat transfer coefficient that can be expressed in terms of the Nusselt number,
h c = N u λ d p
The Nusselt number, Nu, is a function of the Prandtl, Pr, and particle Reynolds numbers, Re, given by [20],
N u = 2.0 + 0.6 P r 0.33 R e 0.5
Employing approximations Equations (9) and (10) and integrating the particle energy balance—Equation (8)—results in the particle temperature predictions.

2.2.4. Boundary Conditions

Boundary conditions to solve both the primary and particle phases are shown in Figure 3, which is a 2D cross section/centre-plane of the full 3D computational domain. At the inlet to the combustion chamber pre-determined mixture (oxygen-fuel) mass flow rate, the inlet temperature and mass fractions of the reactants are supplied. The outer surface of the HVOF gun is assumed smooth and assumed to be maintained at a constant temperature, viz., 350 K. At the ambient pressure outlet boundaries, the pressure is assumed to be at atmospheric. Turbulent quantities, viz., turbulent intensity (TI) and turbulent viscosity ratio, are specified at the inlet and outflow boundaries from which k and ε are calculated. Particle mass flow rate is supplied at the particle injection inlets and assumed to rebound when they hit the torch walls. Whereas particles are assumed to get trapped at the substrate since the particles get attached/coated in the experimental conditions when they hit the substrate. At the outflow boundaries, discrete particles are assumed to escape the flow domain, as observed in the laboratory conditions.
For ease of reference, the above-mentioned boundary conditions and their settings are provided in Table 1.

2.2.5. The Method of Solution

The equations of motion coupled with equations of the turbulent energy and its dissipation expressed, described in Section 2.2, are solved using the commercial CFD code ANSYS Fluent [19] by employing a suitable pressure-based compressible flow solver. Spatial derivatives of the flow variables are approximated using a second-order upwind scheme built within the SIMPLE finite volume algorithm. The computational mesh spread over the entire flow domain is made up of fully structured mesh consisting of 2.1 million 3D hexahedral cells. Good quality near the wall mesh is ensured by maintaining y+ < 10, to capture the viscous flow effects accurately. Numerical iterations are assumed to be converged when the cell weighted residuals fall below 10−7. Once the gas flow variables are converged, the discrete particles are injected at the particulate inlet and solved using the Lagrangian approach through the DPM toolbox described earlier.

3. Results

3.1. Analysis of Gas Dynamics

We first performed a validation study of the gas flow characteristics against the best available measurements reported in the open literature [21].
Measurements are available only for the gas temperature along the radial axis at the torch nozzle exit. A comparison of the present 3D CFD predictions and measurements show good agreement (
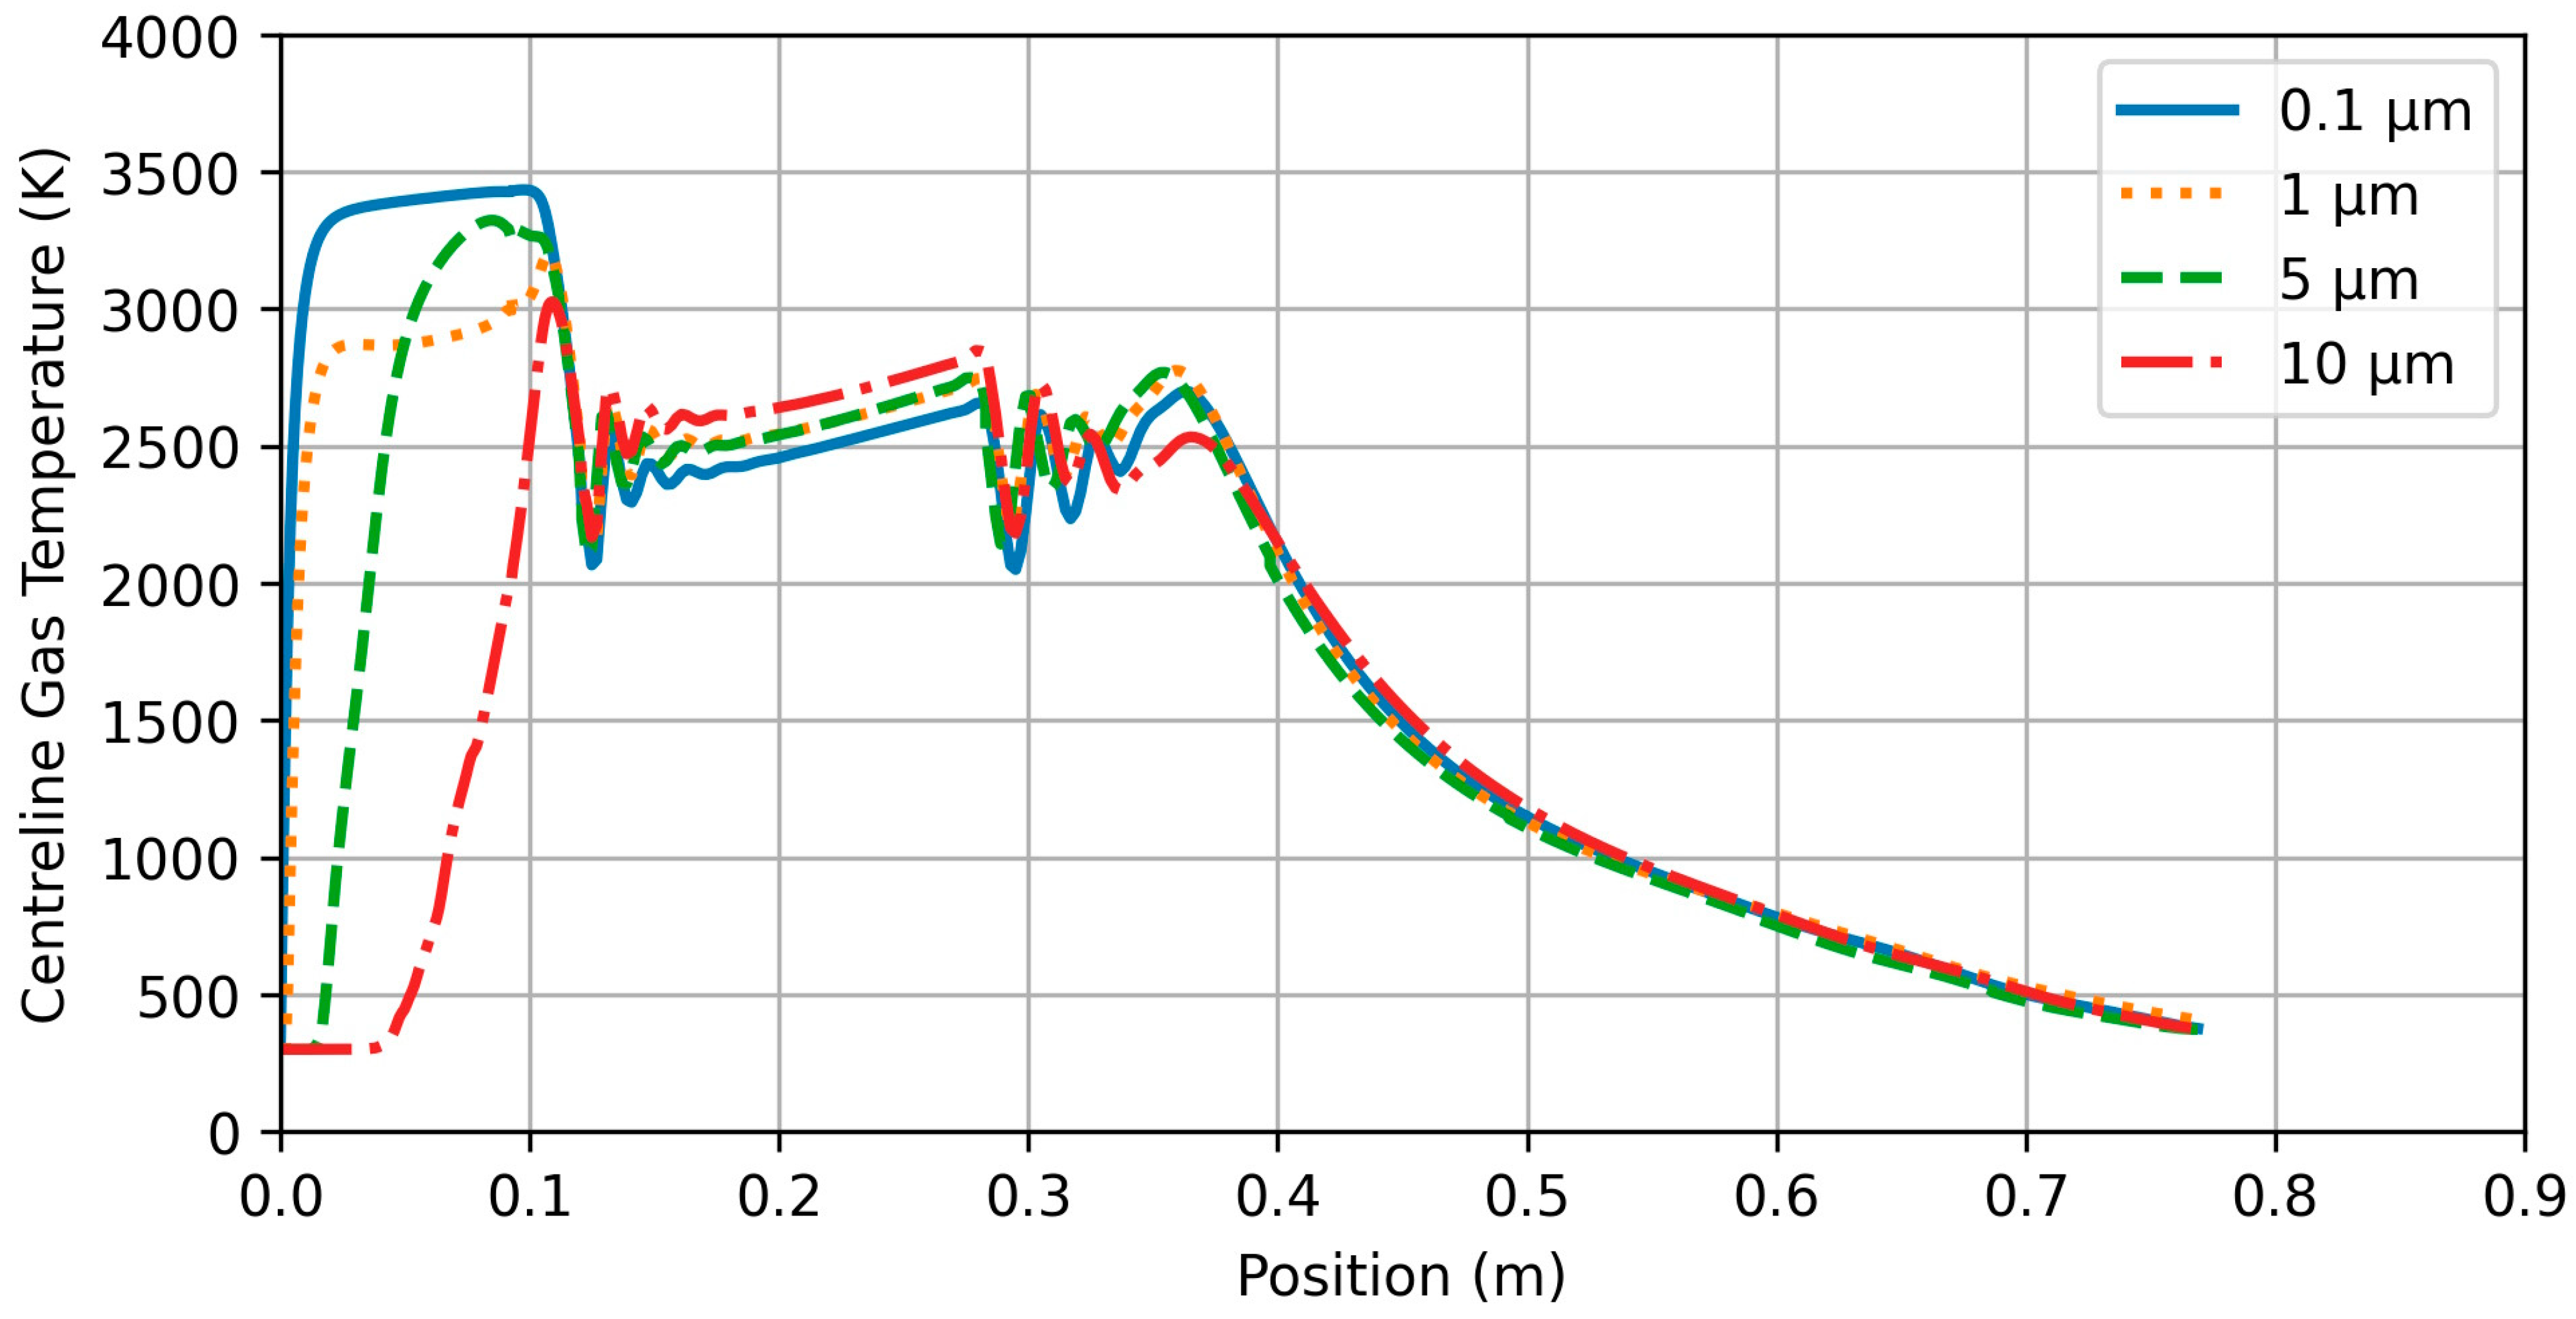
Figure 4). Modelling fuel as discrete droplets and using continuum models results in slight variations in the radial temperature distribution at the nozzle exit. If the discrete droplet size is small, the corresponding CFD predictions are a good match with the measurements, such as that of the continuum assumption where the fluid parcels are assumed to be infinitesimally small. However, when the discrete droplets are at 5 μm and above, there exist slight variations, about 200 K, in the gas temperature along the radial direction compared to that of measurements. This is anticipated because when the droplet size is larger, it experiences a large drag force due to the large surface area. Thus, the droplet results in a higher temperature due to prolonged heating in the barrel. However, it is vice-versa inside the combustion chamber. That is, for fuel droplets less than 5 μm, the fuel reacts quickly within the combustion chamber, and, hence, the elevated mixture temperature inside the combustion chamber is observed for small fuel droplets (<5 μm) (Figure 5).
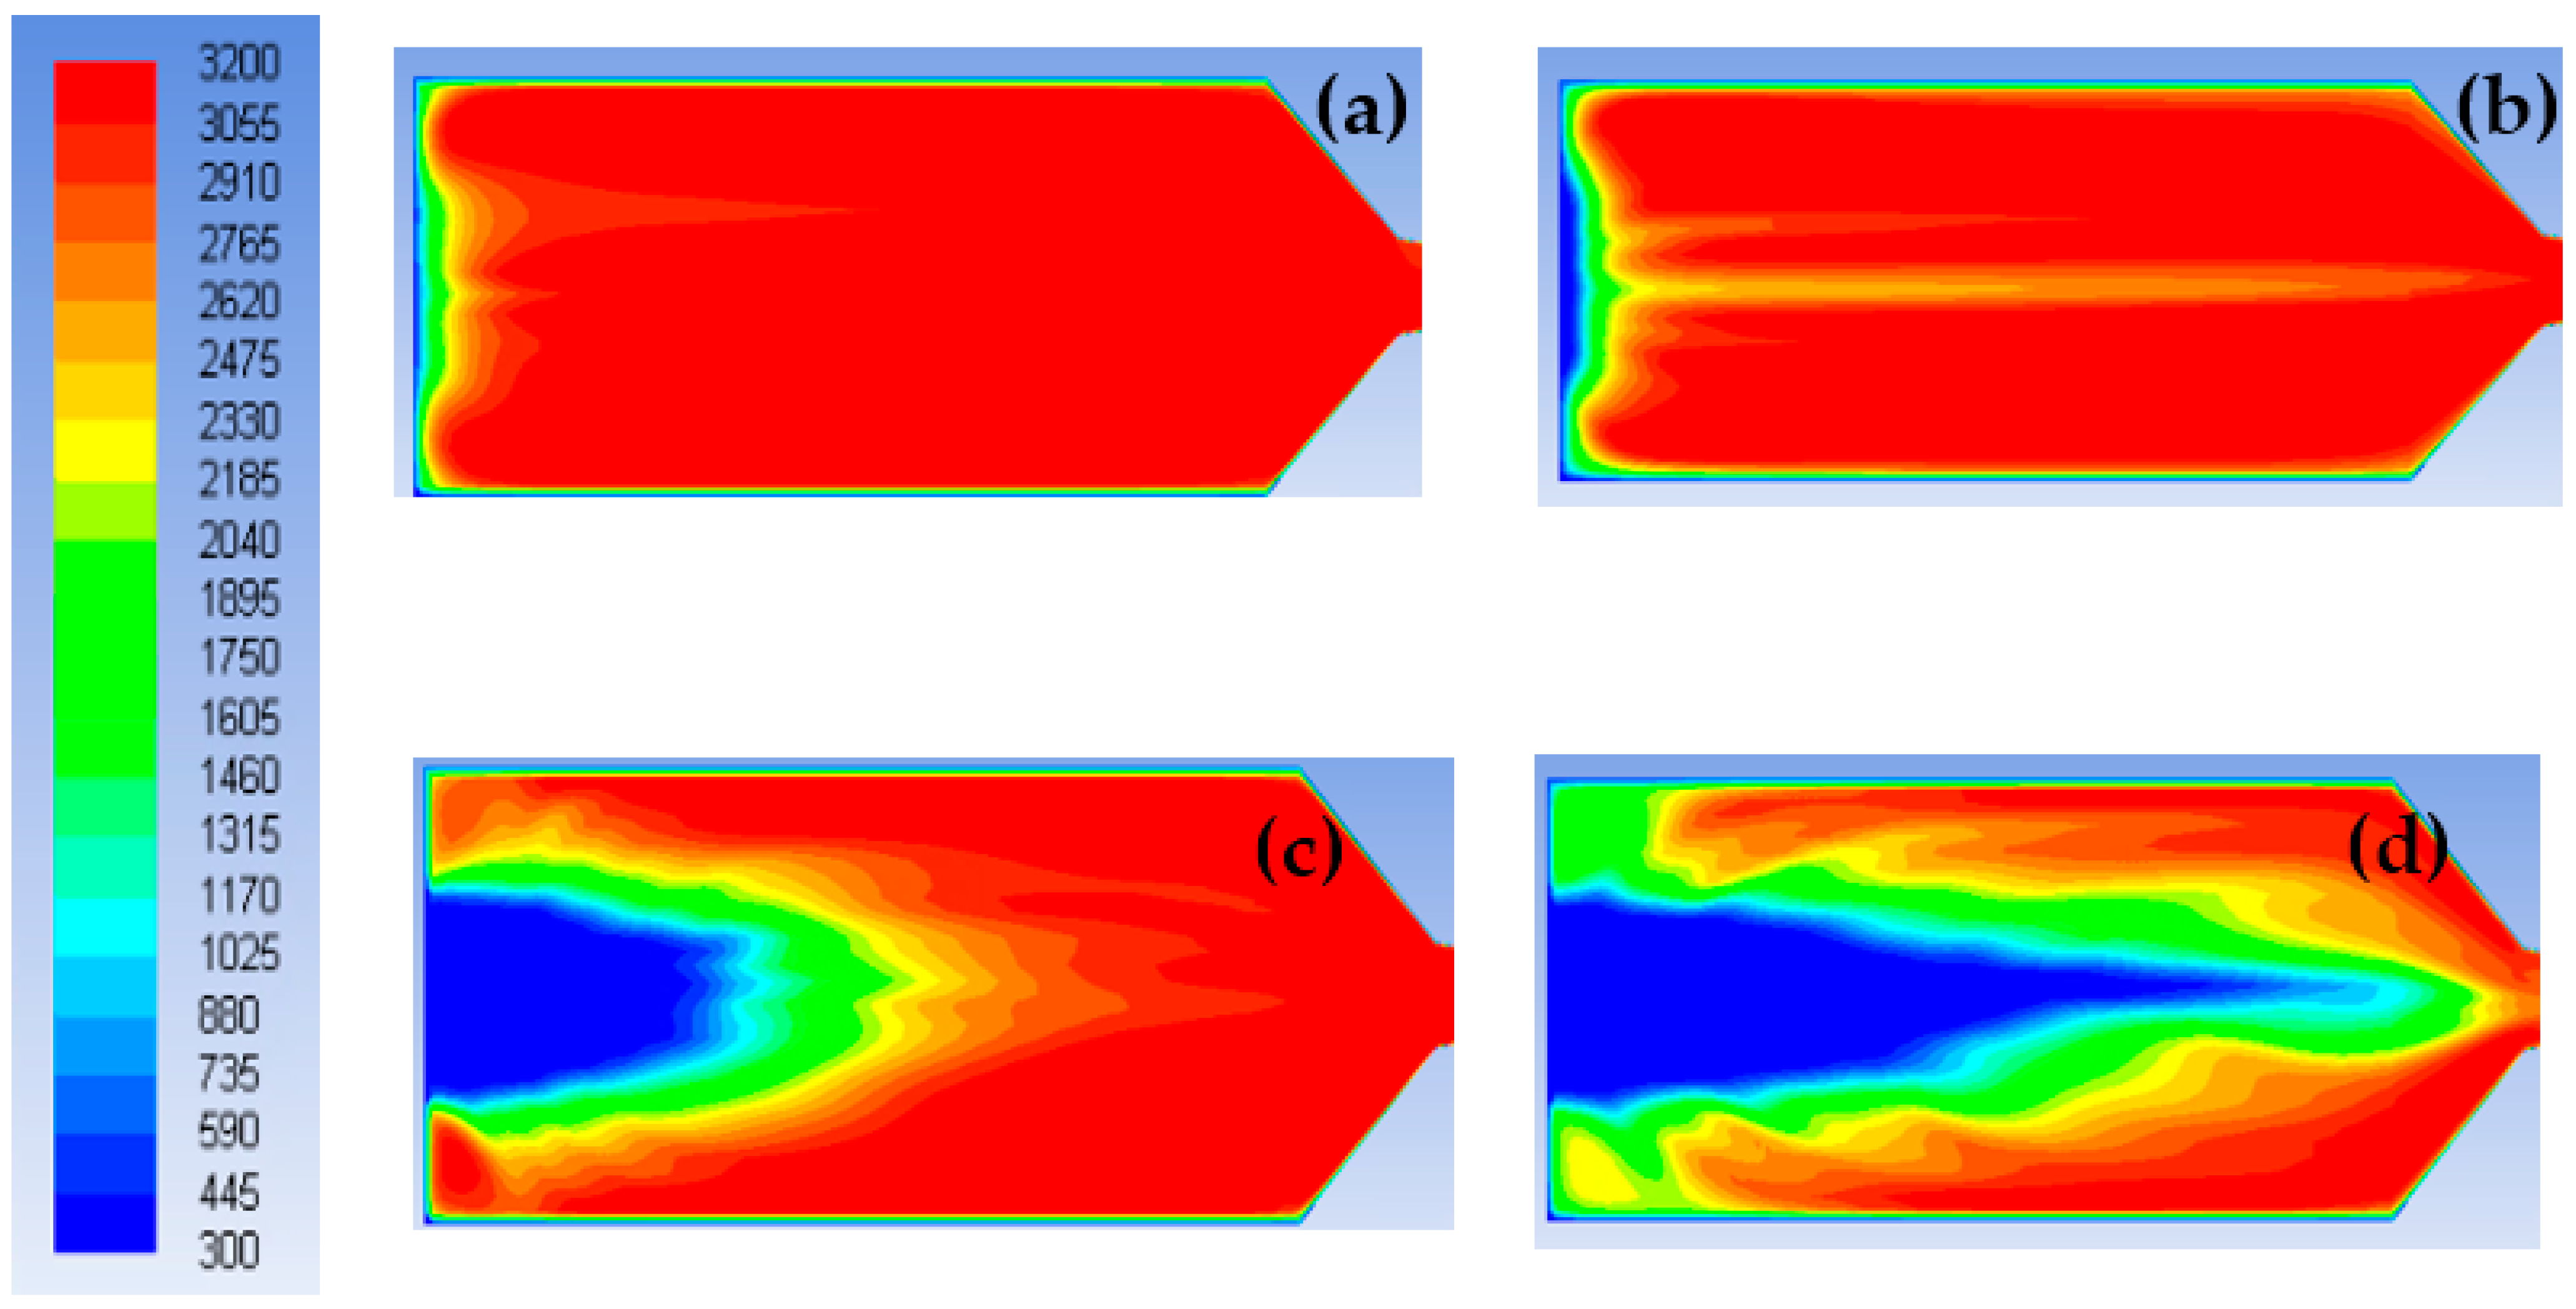
However, above 5 μm, fuel droplets experience less momentum, thus resulting in low reaction rates. This is due to a higher turbulent/eddy turn-over time, which leads to lower fuel centreline temperatures inside the combustion chamber (Figure 5). The contours of the mixture temperature depicted in Figure 6 also substantiate this finding.
Apparently, small droplets only endure short distances and are confined within a more uniform pattern, while large droplets travel much further and then get burnt completely. We also note here that the highest fuel temperature occurs inside the HVOF system rather than outside the system as reported in [9]. This implies that the external thermal field plays a less significant role in particle heating, as it is dominated by thermal transfer from the gas temperature.
The fuel droplet size above 1 μm significantly alters the centreline mass fraction [11], thus resulting in a drop in the temperature inside the combustion chamber. We observed that fuel droplets of sizes ≤5 μm react completely within the combustor, as reported earlier by Tabbara and Gu [11], whereas fuel droplet sizes >5 μm extend downstream in the combustion chamber, even entering the nozzle section, and continues to react there. For the same reason, there is a noticeable difference in the centreline gas temperature throughout the combustion chamber, in the CD nozzle, and in the first half of the barrel for droplets of 5 μm diameter and above (Figure 7). The magnitudes of burnt fuel mass fraction corresponding to different fuel droplet sizes are found to be slightly different here compared to that of Tabbara and Gu [11], which may be attributed to the slightly different reactant coefficients adopted here [18].
The centreline temperatures of the fuel mixture, corresponding to 10 µm fuel droplet size, are shown in Figure 8 with two different liquid fuel injection angles, viz., −15° and +15°, with reference to the centreline, assumed to be 0° injection here. These two injection angles correspond to upward and downward directions with reference to the combustor centreline.
As the injection angle is changed from 0° to −15°/+15° (downwards/upwards), the centreline fuel mixture temperatures are found to be altered significantly, resulting in higher/lower temperatures inside the combustor compared to 0° (Figure 8). It is inferred from this figure that the injection angle may be optimized to alter the fuel mixture characteristics inside the combustion chamber, especially when fuel droplets are larger than 1 μm. Figure 8 is for the fuel droplet size of 10 μm, and similar trends are observed for droplet sizes larger than 1 μm. Thus, it is inferred that by changing the fuel injection angles from 0° to ±15°, we may achieve higher temperatures inside the combustion chamber, such as that of 10 μm fuel droplet.
This conclusion is a new finding from the present investigation, which revealed that the injection angles, viz., −15°/+15°, do not alter the temperature profiles for the 1 μm droplet size significantly [10].
Having carried out detailed investigations of the influence of fuel droplet size on the mixture temperature characteristics, we now look at the influence of the assumption of fuel mixture as continuum. This will, in turn, make the numerical computations easier by the way of having one universal modelling approach for all primary phase species transport occurring inside and outside the HVOF spray system. A comparison of the centreline temperature profiles obtained using the continuum model against those of the discrete fuel droplet model is shown in Figure 9. It is shown clearly that the continuum model predicts temperatures close to the submicron fuel (0.1 μm) droplet predictions.
However, when compared to the 10 μm fuel droplet predictions, continuum model predictions are much higher inside the combustion chamber but relatively small downstream in the chamber that is in the barrel section. The difference (about 200 K) is only 10% of the peak temperature, and, hence, we consider this as insignificant. It is small because when the power particles are injected after the CD nozzle, the resulting particle temperatures are found to be insensitive to this 200 K difference.
The centreline velocity of the fuel mixture is shown in Figure 10 for both continuum and discrete fuel droplet models. It is found that both continuum and discrete fuel droplet models result in similar velocity predictions throughout the entire HVOF system, from the combustion chamber to the barrel exit. Unlike the centreline temperature, we hardly notice any difference in the velocity profiles between continuum and discrete fuel models. This may be attributed to the fact that the velocity regimes throughout the HVOF system are less sensitive to unburnt gaseous fuel, especially for smaller droplet sizes less than 5µm. However, there is a reduction of ~100 m/s throughout for the 10 μm droplet size. This reduction, in turn, does not influence the particle velocity significantly—this will be discussed shortly.
In spray processes (both cold and thermal), the compressed gases under high pressure are forced through the CD nozzle, and, hence, a rapid rise in velocity occurs. At the throat, the flow is chocked to Mach one. However, two small shocks in the HVOF sprays tend to occur as the gas expands and accelerates through the divergent section, marked by slight increases in the velocity the centreline (Figure 10). This characteristic is different from that of the cold spray process [22], as no shocks were observed in the CD nozzle throat region there, which is purely attributed to the CD nozzle throat diameter. In the case of cold spray CD nozzle, the throat diameter is half (50% smaller) that of HVOF nozzles, leading to no shocks in the flow characteristics at the throat. Whereas several shocks occur at the exit of the CD nozzle due to the expansion of the supersonic gas and strong reflections at the solid internal surface of the barrel, which are characterized by fluctuations in temperature along the centreline, Figure 10.
Having carried out detailed investigations and validation of the HVOF models using literature data, we now discuss the CFD simulation results of the flow characteristics resulting from in-house-designed laboratory HVOF particle spray conditions. A complete picture of the fuel mixture characteristics is shown below, based on the assumption that the fuel mixture is continuum. The continuum assumption for fuel mixture will be employed in the rest of the paper instead of discrete powder particle dynamics due to the difference in the gas characteristics between continuum and discrete fuel droplet model being insignificant, as discussed earlier.
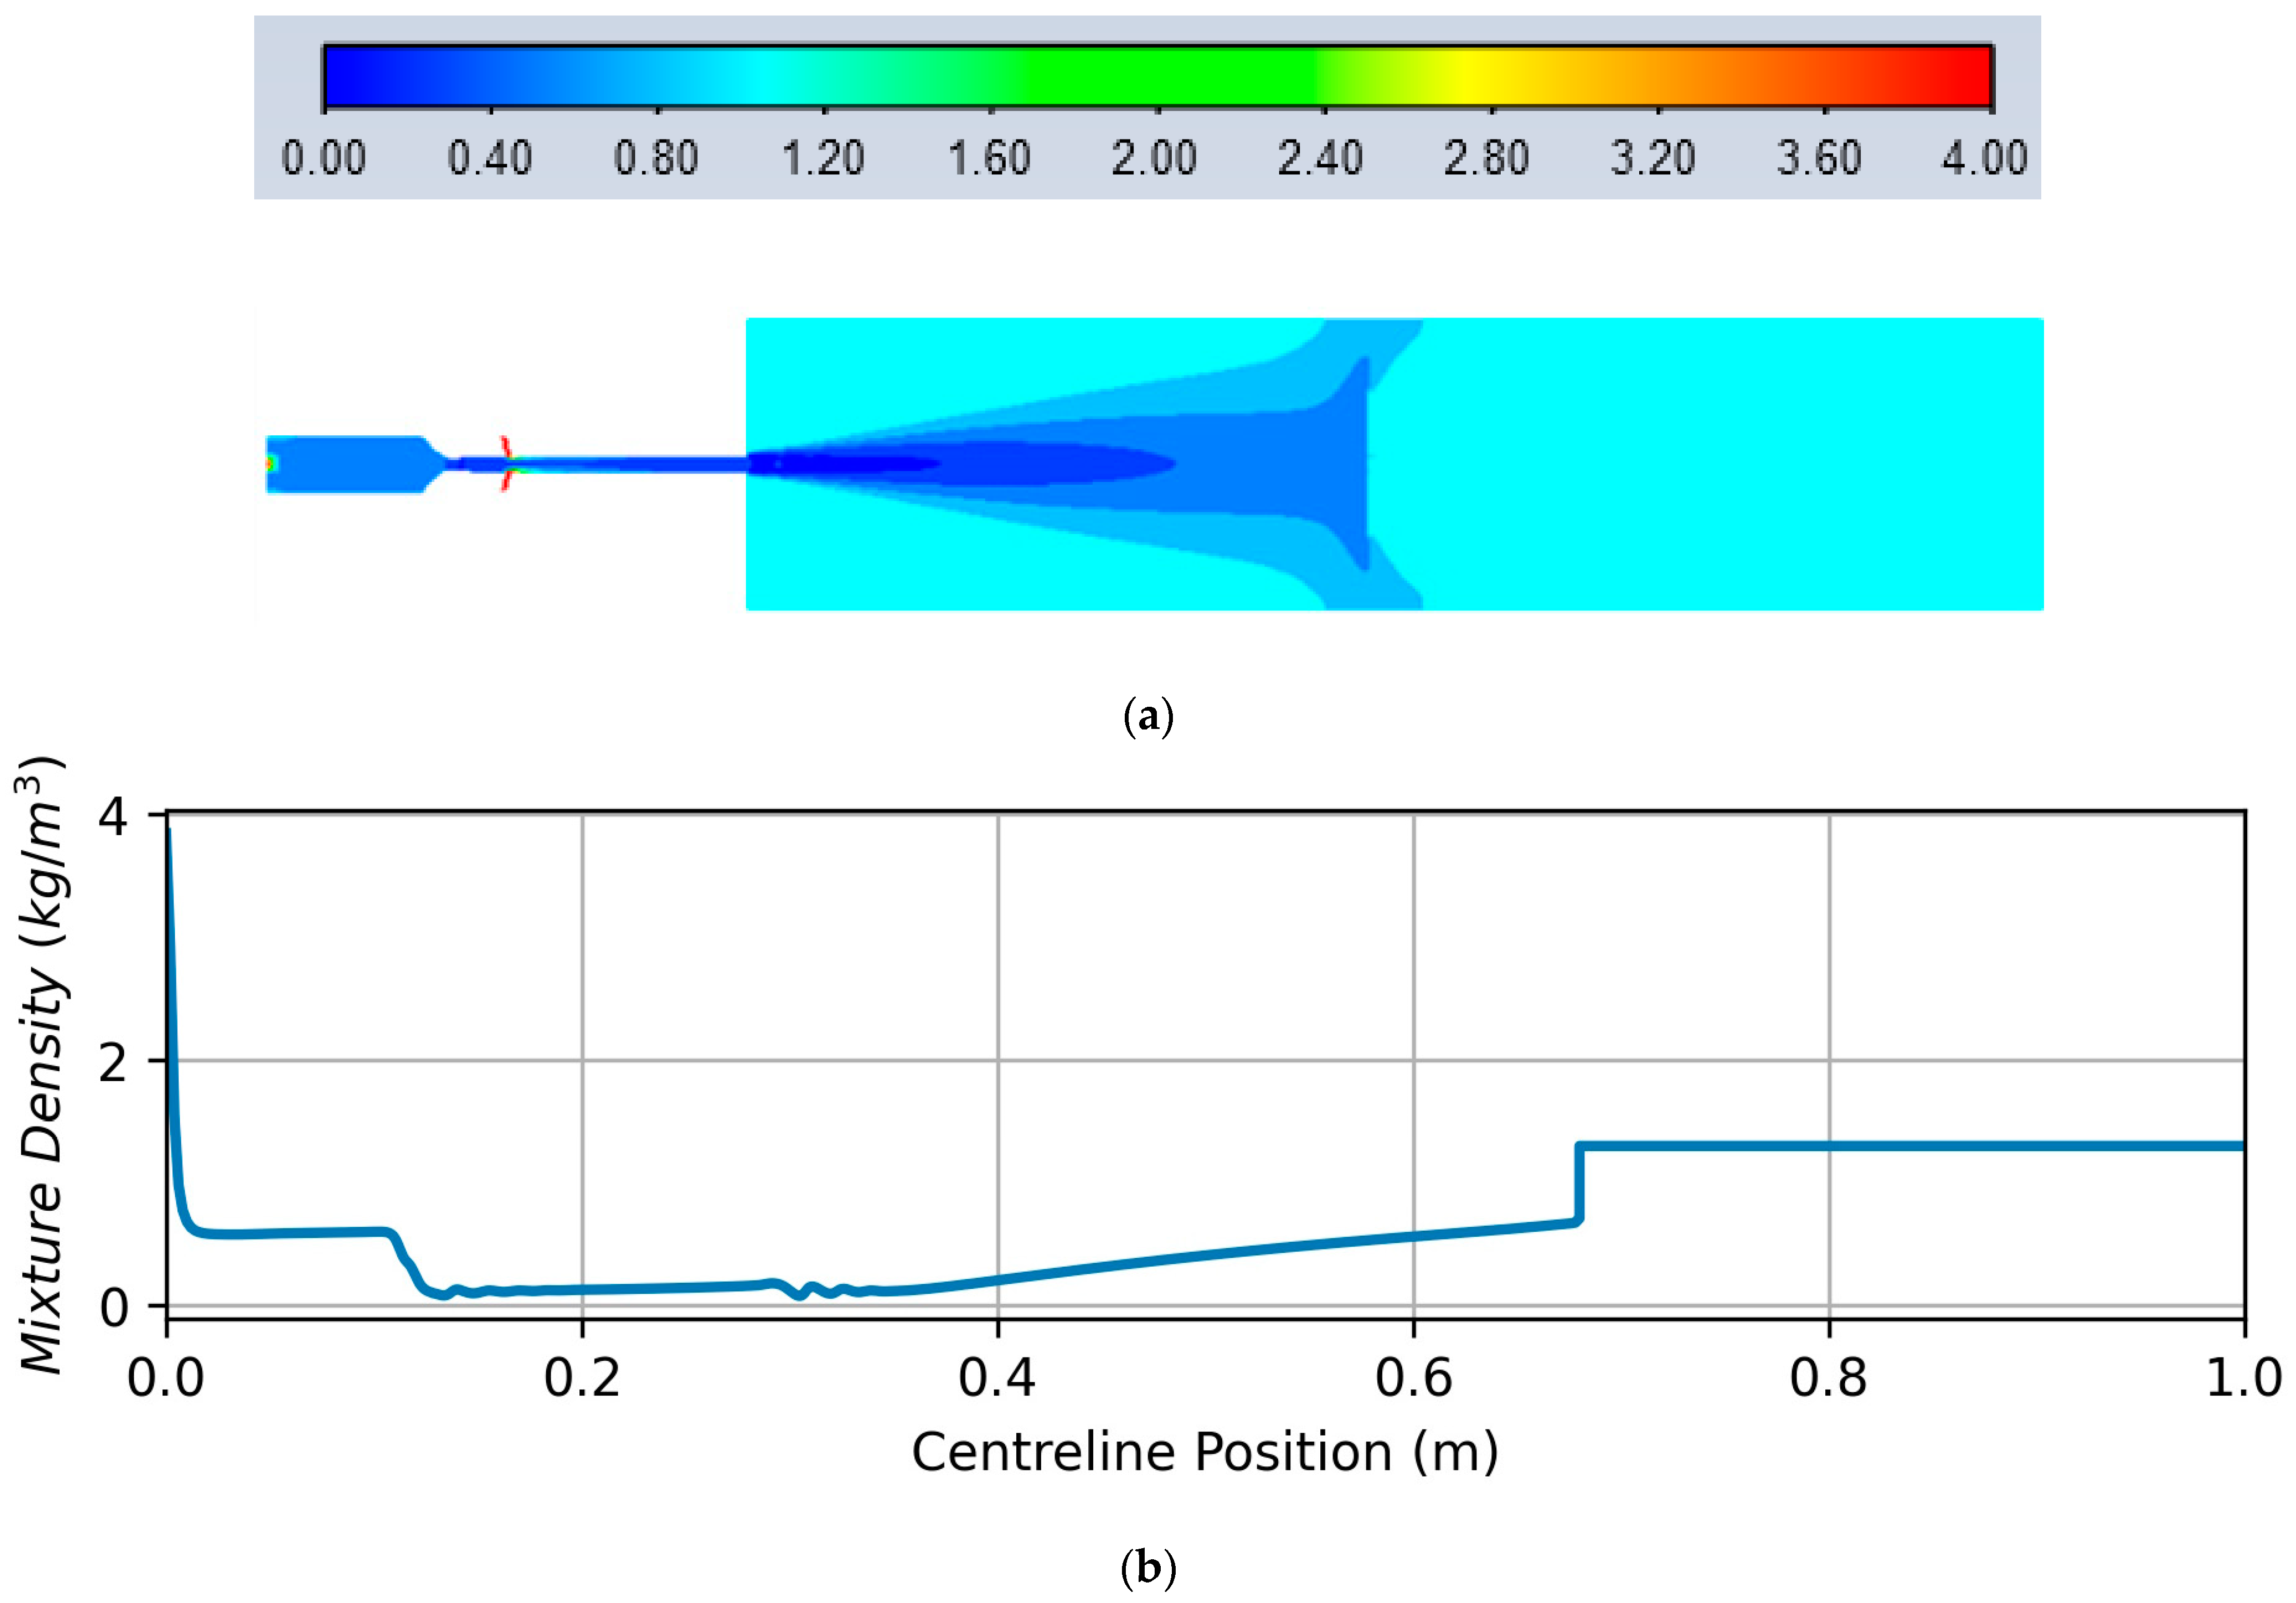
Simulated contours of density, axial velocity, temperature, and Mach number are shown in Figure 11a–d, respectively. High pressure and temperature field are maintained inside the combustion chamber due to the reaction kinetics. Temperature and static pressure are found to reach their respective maximums, viz., 3000 K and 6 × 10⁵ Pa. Pressure starts to decrease continuously from the CD nozzle throat as the burnt fuel expands, resulting in an increase of the fuel mixture velocity. Density contours depicted in Figure 11a,b clearly reveal the gas expansion from the CD nozzle throat to the ambient domain. As anticipated at the throat of the nozzle, the Mach number reaches unity (Figure 11d) and increases further, to around 2.3, immediately after the throat, before starting to decline. This peak in the Mach number plot is unique, unlike in the case of the cold spray systems or in the Diamond jet hybrid gun (Sulzer Metco) HOVF system reported earlier by Li and Christofides [9]. This characteristic may be attributed to the system design, as discussed earlier. Following the local maximum after the CD nozzle throat, there occur multiple diamond shocks, as reflected in the Mach number plots, that are caused due to the under-expansion of the burnt fuel. Analysing the nozzle exit flow pressure data reveals that the burnout fuel from the nozzle exit is over-expanded, leading to multiple diamond shocks. The resulting peak pressure at the exit was noted to be around 7 × 10⁴ Pa. As we don’t have an in-house pressure measurement facility, we correlated this simulated exit pressure data with that of the measurements reported earlier by Li and Christofides [9] under similar operating conditions but in a different HVOF system (Diamond jet hybrid gun, Sulzer Metco). The comparison is found be in good agreement and is not presented here for brevity. It should be noted that although HVOF system reported by Li and Christofides [9] is different from that considered in the present study, the CD nozzle and barrel dimensions are nearly the same as of the present model. Hence, the above crude comparison is still worth considering as we already validated the radial temperature profiles at the nozzle exit (Figure 4).
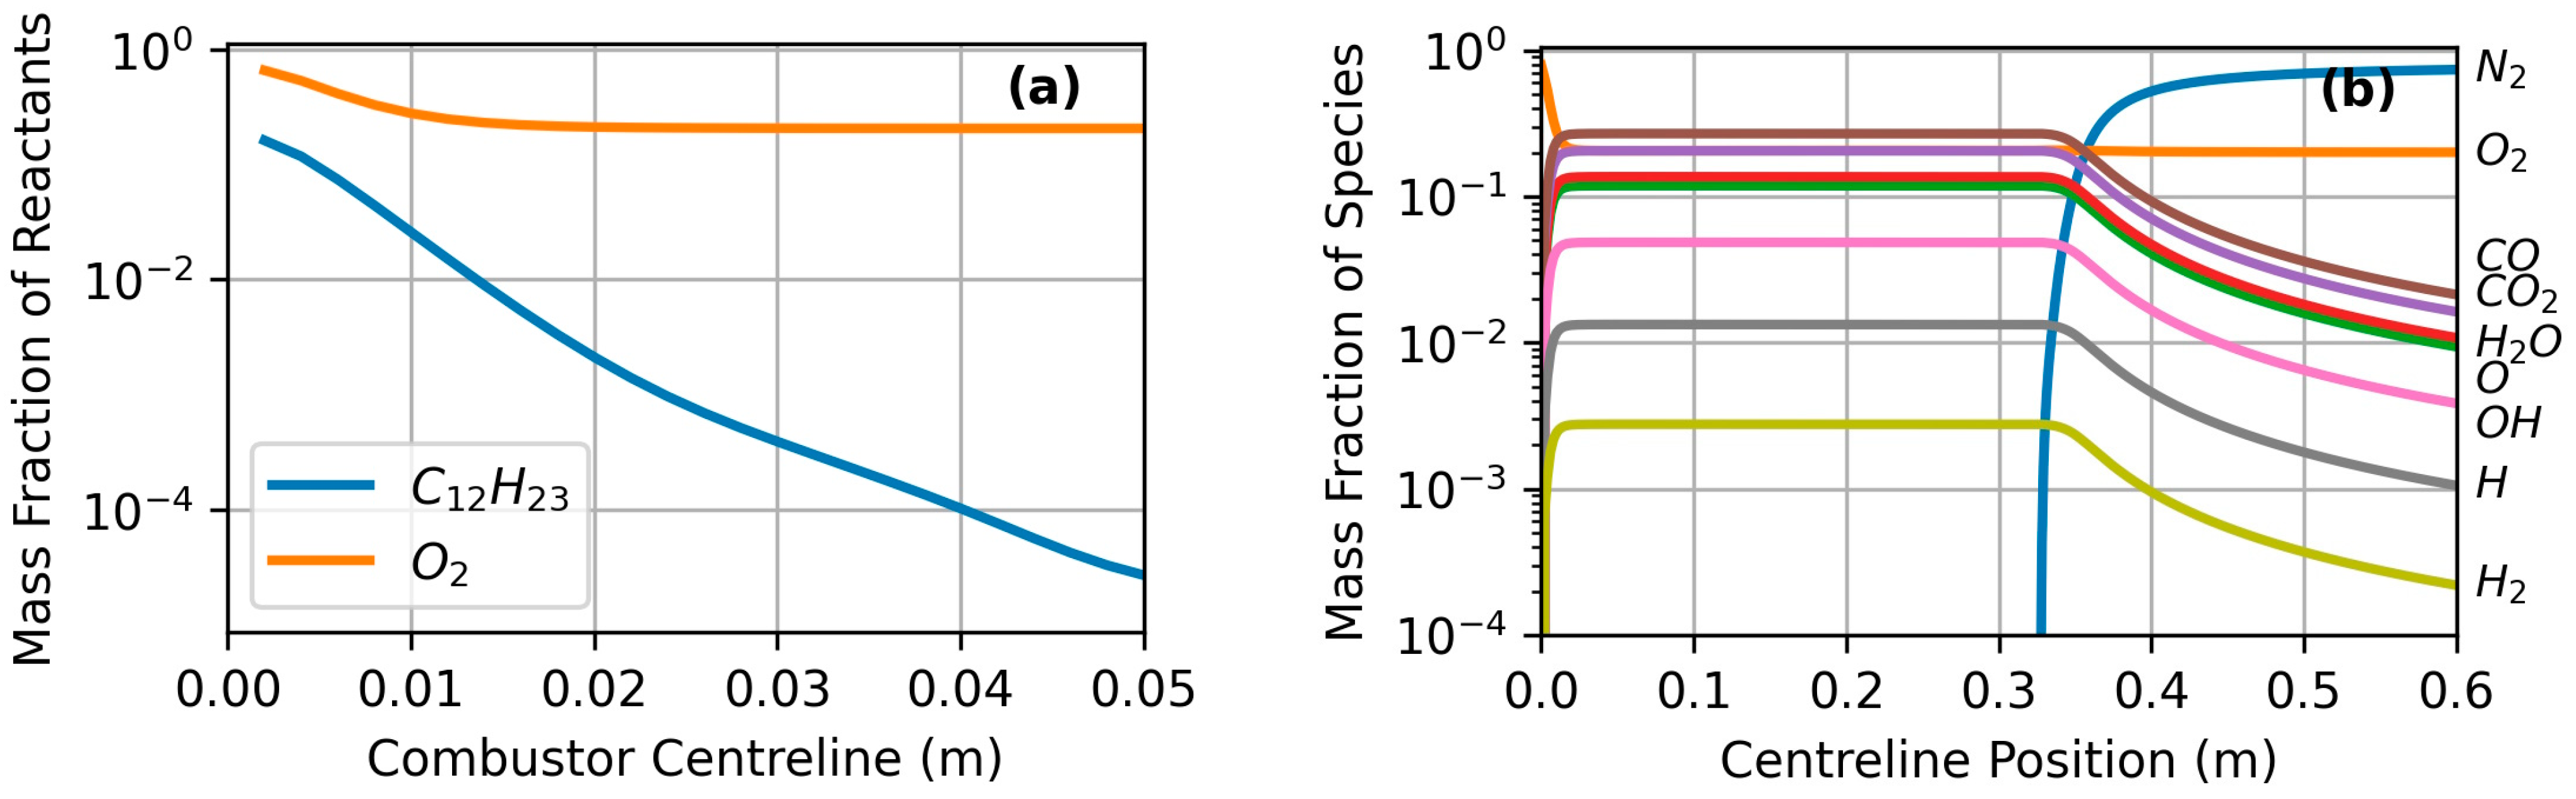
The solved mass fraction of each gas component of the reactants and products is shown in Figure 12a,b. Figure 12a is limited to the combustion chamber only, and we see that the liquid fuel gets burnt completely within this region; thus, the resulting mass fraction of liquid kerosene drops to zero at the end of the combustion chamber located roughly at the mid combustor, viz., x = 0.04 m. Consequently, the mass fraction of all species appearing in the RHS of chemical reaction, Equation (4), increases as the gas mixture passes through the CD nozzle and remains steady till the barrel exit. As the supersonic burnt fuel mixture exits the barrel, the mass fraction of N2 species increases to 0.8, leaving O2 at 0.2 because of the entrainment of the air from the ambient environment. However, the presence of oxygen composition at this level may influence the particle oxidation, which in turn may affect the coating characteristics. Therefore, one way to reduce the oxygen concentration is to introduce N2 gas at the fuel inlet, but this may in turn reduce the flame temperature. However, this subject is beyond the scope of the present study and, hence, no details are presented here.

3.2. Analysis of Discrete Particle Dynamics

The powder particle flight characteristics play a vital role in the coating microstructure formation. In general, to achieve good coating metrics, it is important to maintain high particle temperatures, without superheating/melting, at the point of impact on the substrate. This is because the small grain sizes, after impacting the melting particles, can lead to the superior qualities of coatings, especially nanostructured coatings [15]. It is also of great importance to maintain high particle velocity at the point of impact on the substrate since the higher the particle velocity, the denser the coating. All these critical parameters form a deposition window that must be calculated and understood. In the present simulations, a circular substrate 100 mm in diameter is assumed to be placed at a stand-off distance of 300 mm from the torch barrel exit to mimic the in-house experimental conditions. The substrate is given a wall boundary condition so that the gas flow and particles impinging on it will get altered greatly. Also, the presence of the substrate will retard the flow velocity, thus affecting the particle flight dynamics as well. However, it was understood from a previous in-house study that particles of smaller sizes (<10 μm) generally follow the gas contours, thus gliding down gently towards the wall, whereas larger particles (>10 μm) propel at their own momentum and are not affected by the presence of a substrate. Also, it is to be noted here that the substrate in the present simulations is located farther away, 300 mm, from the barrel exit, unlike in the cold spray, where the substrate is placed relatively closer to the barrel exit, approximately 30 mm. Hence, we may expect, at longer spray distances, such as 300 mm in HVOF, that the substrate should have a minimal influence on both the thermal and the flow field. This is because the impinging gas velocity and temperature are relatively low when the spray distance is long. Having calculated the gas flow characteristics, the particle inflight behaviour is then calculated (particle thermo-physical and flow data are given in Table 2) using the discrete phase modelling (DPM) described earlier by applying suitable boundary conditions. Two particle injection ports inclined at angle of 77° are in the y direction after the CD nozzle, Figure 2a.
The particle morphology and size distribution of the CoNiCrAlY (Diamalloy 4700, manufactured by Oerlikon Metco) particles are shown in Figure 13 below. The SEM image shows that the powders have a spherical shape with smaller satellite particles attached to the main powders (Figure 13a). The D10, D50, and D90 size of particles were measured by the Malvern Mastersizer 2000 and found to be 19.1, 31.2, and 50.6 μm, respectively (Figure 13b). The black curve in Figure 13b represents the volume fraction against the corresponding powder size. Each point represents the proportion of particles within a specific size range, which could help in understanding the dominant particle sizes and the spread of the distribution. The red curve in Figure 13b depicts the accumulated volume fraction against the powder size with each point here signifying the proportion of particles with sizes equal to or smaller than the certain powder size. This is useful for determining the proportion of particles below a certain size and thus identifying specific percentiles, such as D10, D50 and D90. The size distribution is modelled using logarithmic Rosin-Rammler (RR) distribution in the CFD code [19]. The RR fit against the measured cumulative fraction is shown in Figure 13c and found to be in good agreement.
Before we move on to discuss particle dynamics, it is to be noted that the turbulent dispersion model is activated through the discrete random walk model to ensure turbulent dispersion is well accounted. The particle shape is assumed to be spherical and, hence, a spherical drag law is applied to model the drag force term in the Lagrangian particle velocity model. Although agglomerations are seen in the particle morphology shown above (Figure 13a), some agglomerations can be removed when the particles are heated up and, hence, the particles remain spherical in shape. For the given particle loading rate, and with the other random walk particle settings, we could track about 104 particles in total from the point of injection until their impact on the substrate. Once particles hit the substrate located 300 mm from the barrel exit, they are assumed to deposited in the present model.
The results of the particle dynamics in terms of flight velocities and temperature are shown in Figure 14a,b.
Torch working conditions for simulating the inflight particle characteristics are provided in Table 1. These conditions are similar to Li et al. [23], in which the baseline mixture flow rate was assumed to be 0.018 kg/s and the carrier gas flow rate to be 28.5 scfh. Although the torch model used in [23] is different from the present study, the gas and particle flow characteristics in both the studies are still comparable as they exhibit similar dynamics. A detailed comparison and discussion of the results between the present study and Li et al. [23] are provided below.
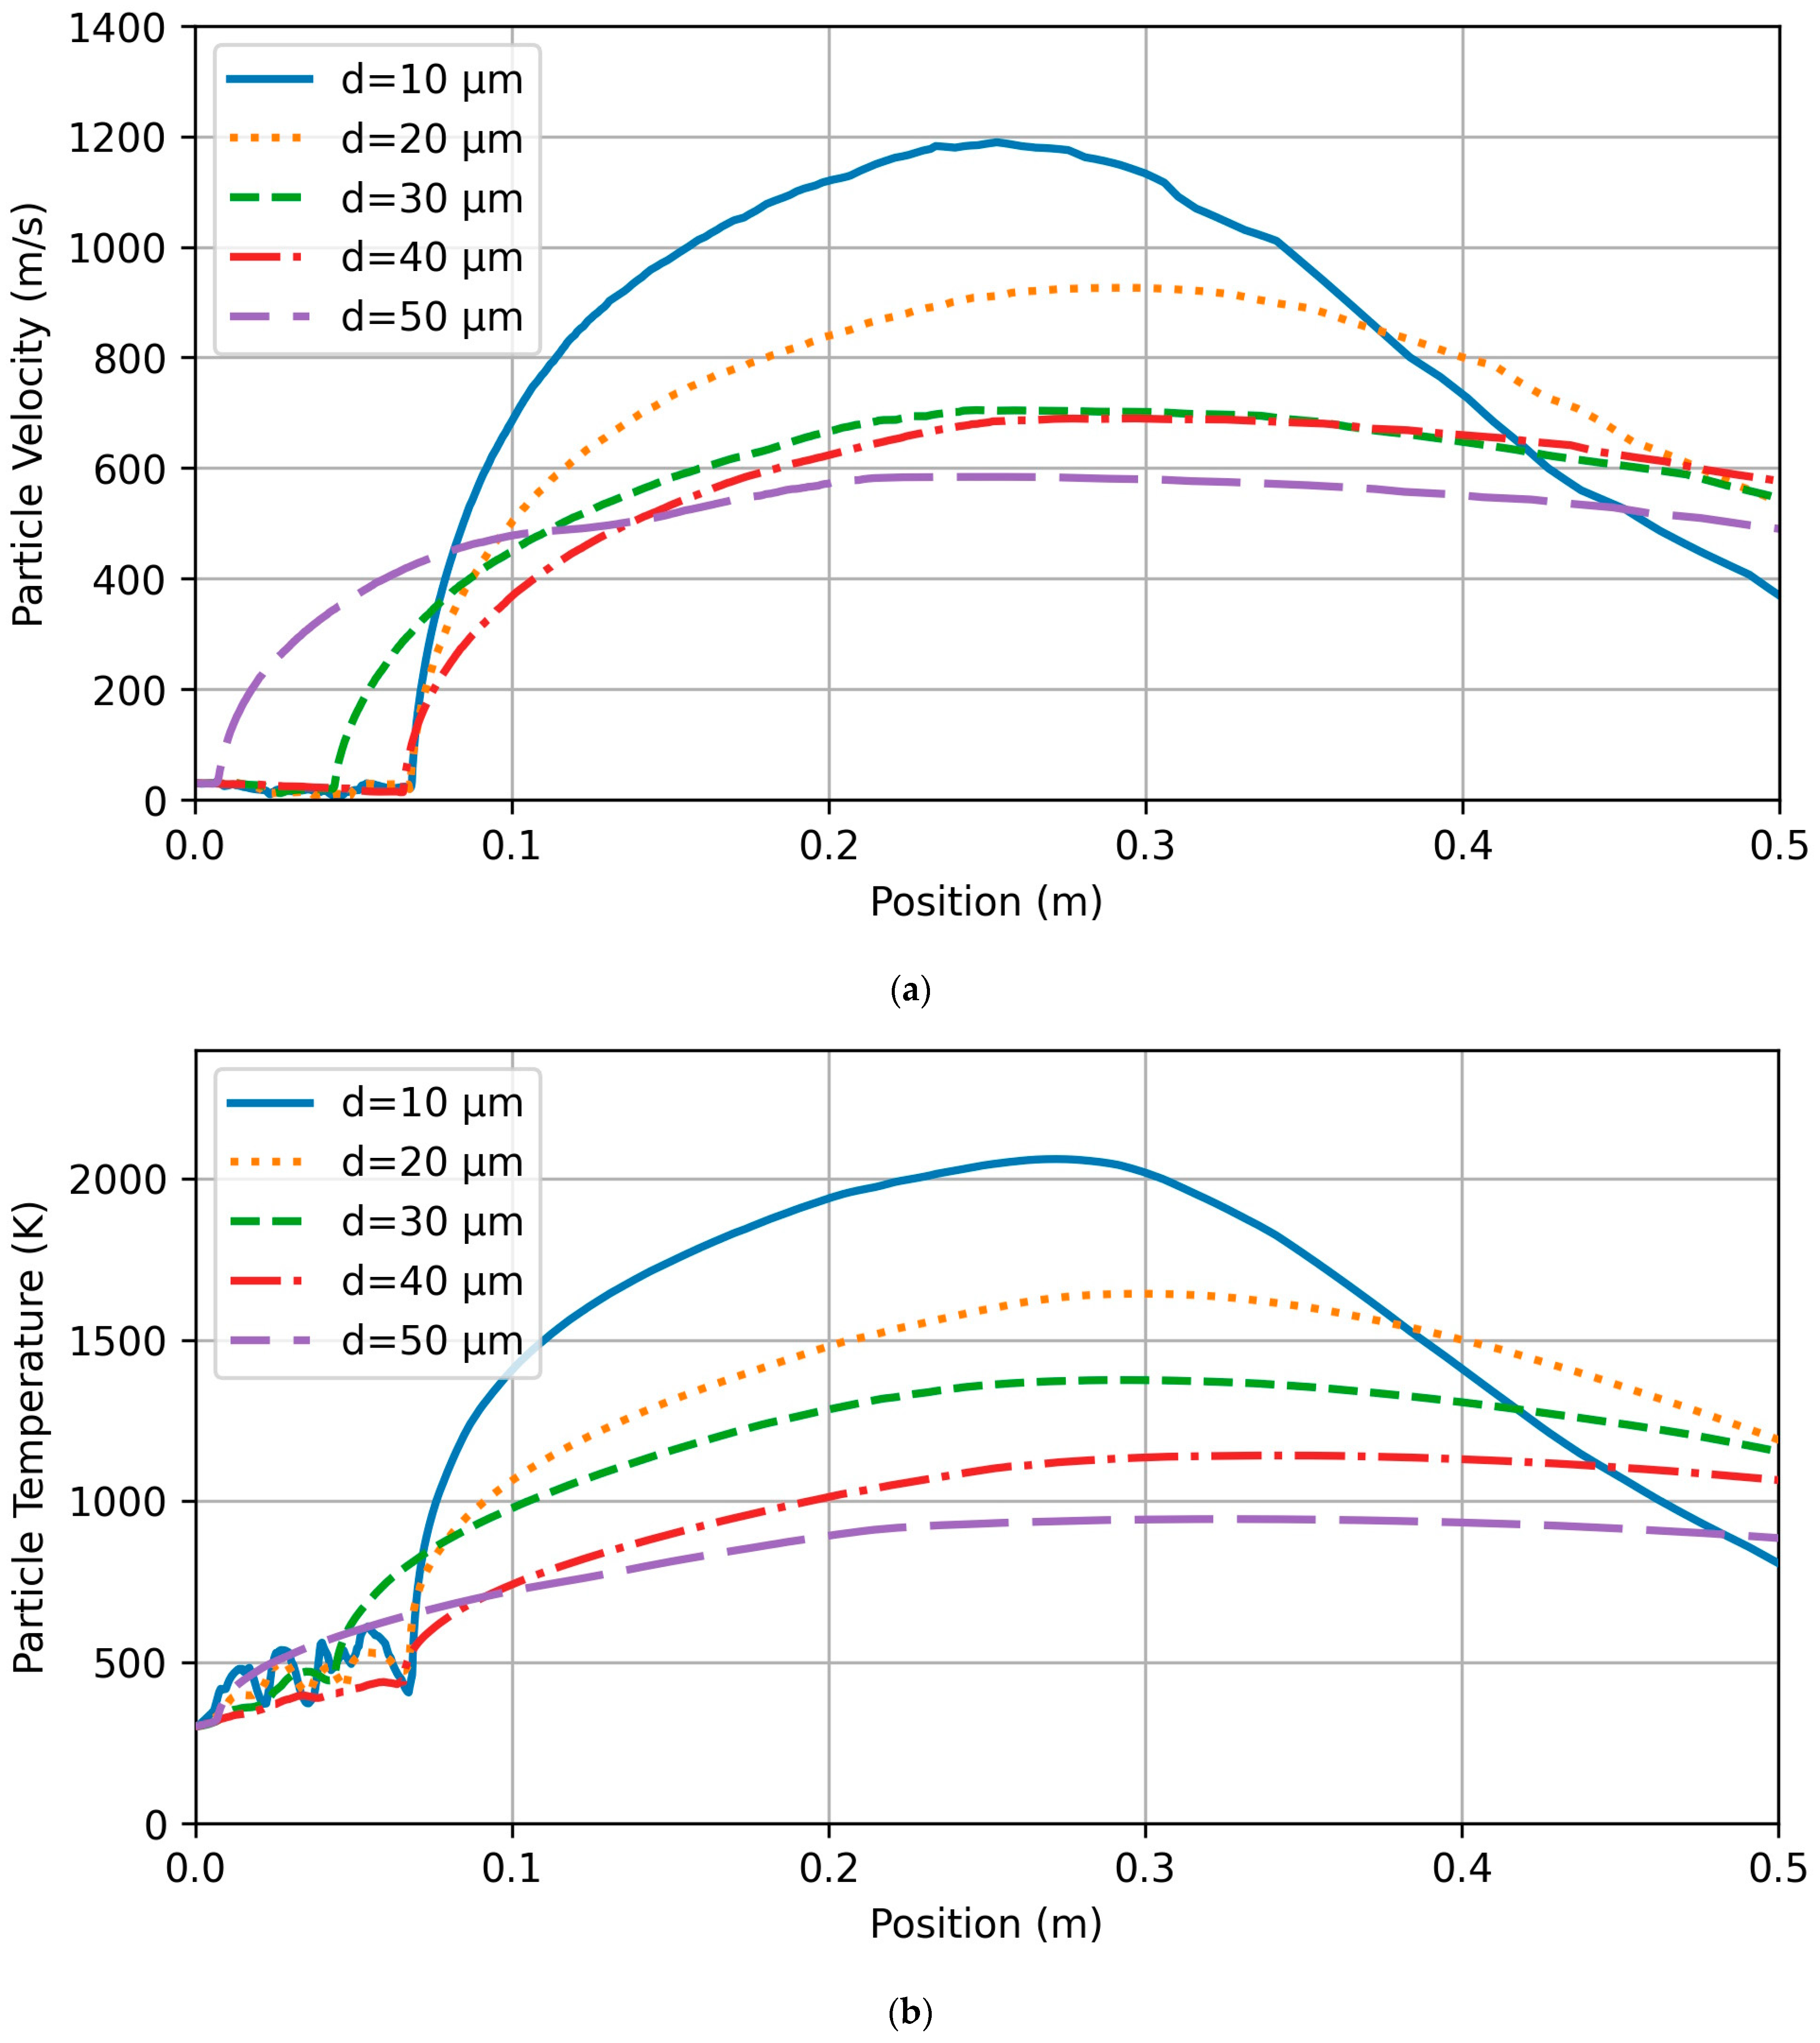
Although particles of small sizes reach very high velocities during the flight, their velocities drop more sharply after a critical flight distance than those of larger particles because of their smaller momentum inertias. In the diamond shock waves present at the nozzle exit, gas flow characteristics oscillate sharply, whereas particle velocity and temperature profiles do not exhibit any significant oscillations. The phenomenon is attributed to significantly larger mass inertia, and, hence, the particle velocity can exceed the gas velocity in the ambient domain throughout their entire flight, before impacting the substrate. However, if the particle sizes are too small (<5 μm), one may expect the particle flow oscillations like that of gas phase oscillations as reported in Li et al. [23]. This also depends on the particle density; for e.g., in the case of lighter particles such as aluminium, even larger particles may also exhibit flow oscillations like the gas phase oscillations. As anticipated, particle velocities drop with an increase in their size due to increased drag force associated with the increased particle surface area. However, as the gas jet approaches the solid substrate, the velocity of the gas flow gets retarded, and the smaller particles tend to follow gas behaviour, resulting in a sharp decrease in their velocities, even below the velocity of the large particles considered here. This inference is unique and is different from previous observations reported by Li et al. [23], where it was reported that smaller particles in the range 10 μm < dp < 60 μm, like the present range, always resulted in higher velocity, and large particles resulted in lower velocity magnitudes. This may be attributed to the fact that in the previous investigation, the presence of a solid substrate is not modelled and, therefore, the gas flow does not experience any flow retardation effect, which results in different particle impact velocities. Also, their computational domain is 2D axisymmetric, which might not be a correct assumption for the study of turbulent particle dynamics. This serves as a novelty of our study. It is interesting to infer from the particle velocity profiles that larger particles experience an almost constant velocity after exiting the nozzle into the ambient atmosphere, for reasons described earlier.
Particle impact velocities at different stand-off distances are shown in Figure 15a. In the above figure, a solid physical substrate was modelled at a stand-off distance of 381 mm. In addition to the particles impacting on the substrate, two other virtual substrates were created at 181 mm and 281 mm, respectively, and then the mean particle velocities were computed at these stand-off distances. It is observed from Figure 15a that when the stand-off distance is 181 mm, the particle impact velocity decreases with increase in particle size, as previously reported by Li et al. [23] and shown in Figure 15a. However, when the stand-off distance is increased to 281 mm and 381 mm, it is found that the smallest particles (10 μm here) have the lowest velocity compared to larger-sized particles (>10 μm). This observation is interesting and different from previous observations made by Li et al. [23]. This may be attributed to two reasons: (i) longer stand-off distances and (ii) lower particle mass compared to previous observations by Li et al. [23]. As the particle mass decreases, smaller particles tend to get trapped into the gas stream, the velocity of which is reduced at longer stand-off distances, resulting in lower particle velocity.
The particles at the injection inlets are assumed to be at ambient temperature, whereas their velocities are determined by the given flow rate. However, as particles travel in the supersonic gas flow inside the barrel, they acquire thermal energy from hot gas and, as a result, smaller particles are heated even beyond the melting point in a short duration (Figure 15b). Very small particles (<10 μm) get fully melted during their flight within the barrel, while particles of 10 μm < dp < 20 μm are melted after issuing from the nozzle; particles of sizes greater than 20 μm stay below the melting point but get softened. Although smaller particles are melted quickly, they also eventually turn into a semi-molten state by losing their temperature to the low temperature ambient air through convection before impacting the substrate. Due to small thermal inertias, smaller particles change their temperatures easily. However, larger particles undergo longer periods of acceleration and heating due to their larger surface area, and, hence, their velocity (or temperature) profiles become nearly plateau (Figure 15b). It is observed that particle temperature profiles tend to follow the same trend as their velocities. From the particle size analysis, we found that the mean diameter of the particle population used in the experimental spraying conditions is 38 µm. The impact mean velocity and temperature of this mean-sized particle, obtained from the numerical simulations, are around 700 m/s and 1350 K. Further, if the characteristic time scales of particle velocity and temperature are
τ = 4 ρ p d p 2 3 μ g C D R e
ϖ = d p 2 ρ p C P p 6 λ g N u ,
respectively, then the time scale ratio of particle temperature to particle velocity is calculated to be
ϖ τ = c P p μ g C D R e 8 λ g N u 2.3 μ g c P p R e 0.4 λ g N u .
This ratio is usually less than one (Li et al. [23]) and, therefore, it can be inferred that the particle temperature is more easily varied than the particle velocity. That is, by adjusting particle heating residence time by altering the stand-off distance, we may vary the particle temperature independent of the particle velocity. However, varying particle velocity independent of particle temperature may be attained by maintaining the equivalence ratio (fuel/oxygen ratio divided by its stoichiometric value) of close to but less 1, as per Li et al. [23]. Note that in the industrial HVOF processing environment, it is important to independently control the particle velocity and the particle temperature (or melting degree) to achieve the desired coating properties.
The particle’s impact temperature with stand-off distance is observed to have a similar trend as that of the particle’s impact velocities (Figure 15b). Also, it is observed from Figure 15b that good agreement between the present study and Li et al. [23] exits in terms of the particle impact temperature.

3.3. Particle Deposit Formation on Substrate

Particle locations on the substrate were tracked, and splat formation was determined numerically and compared against that of observed in-house measurements.
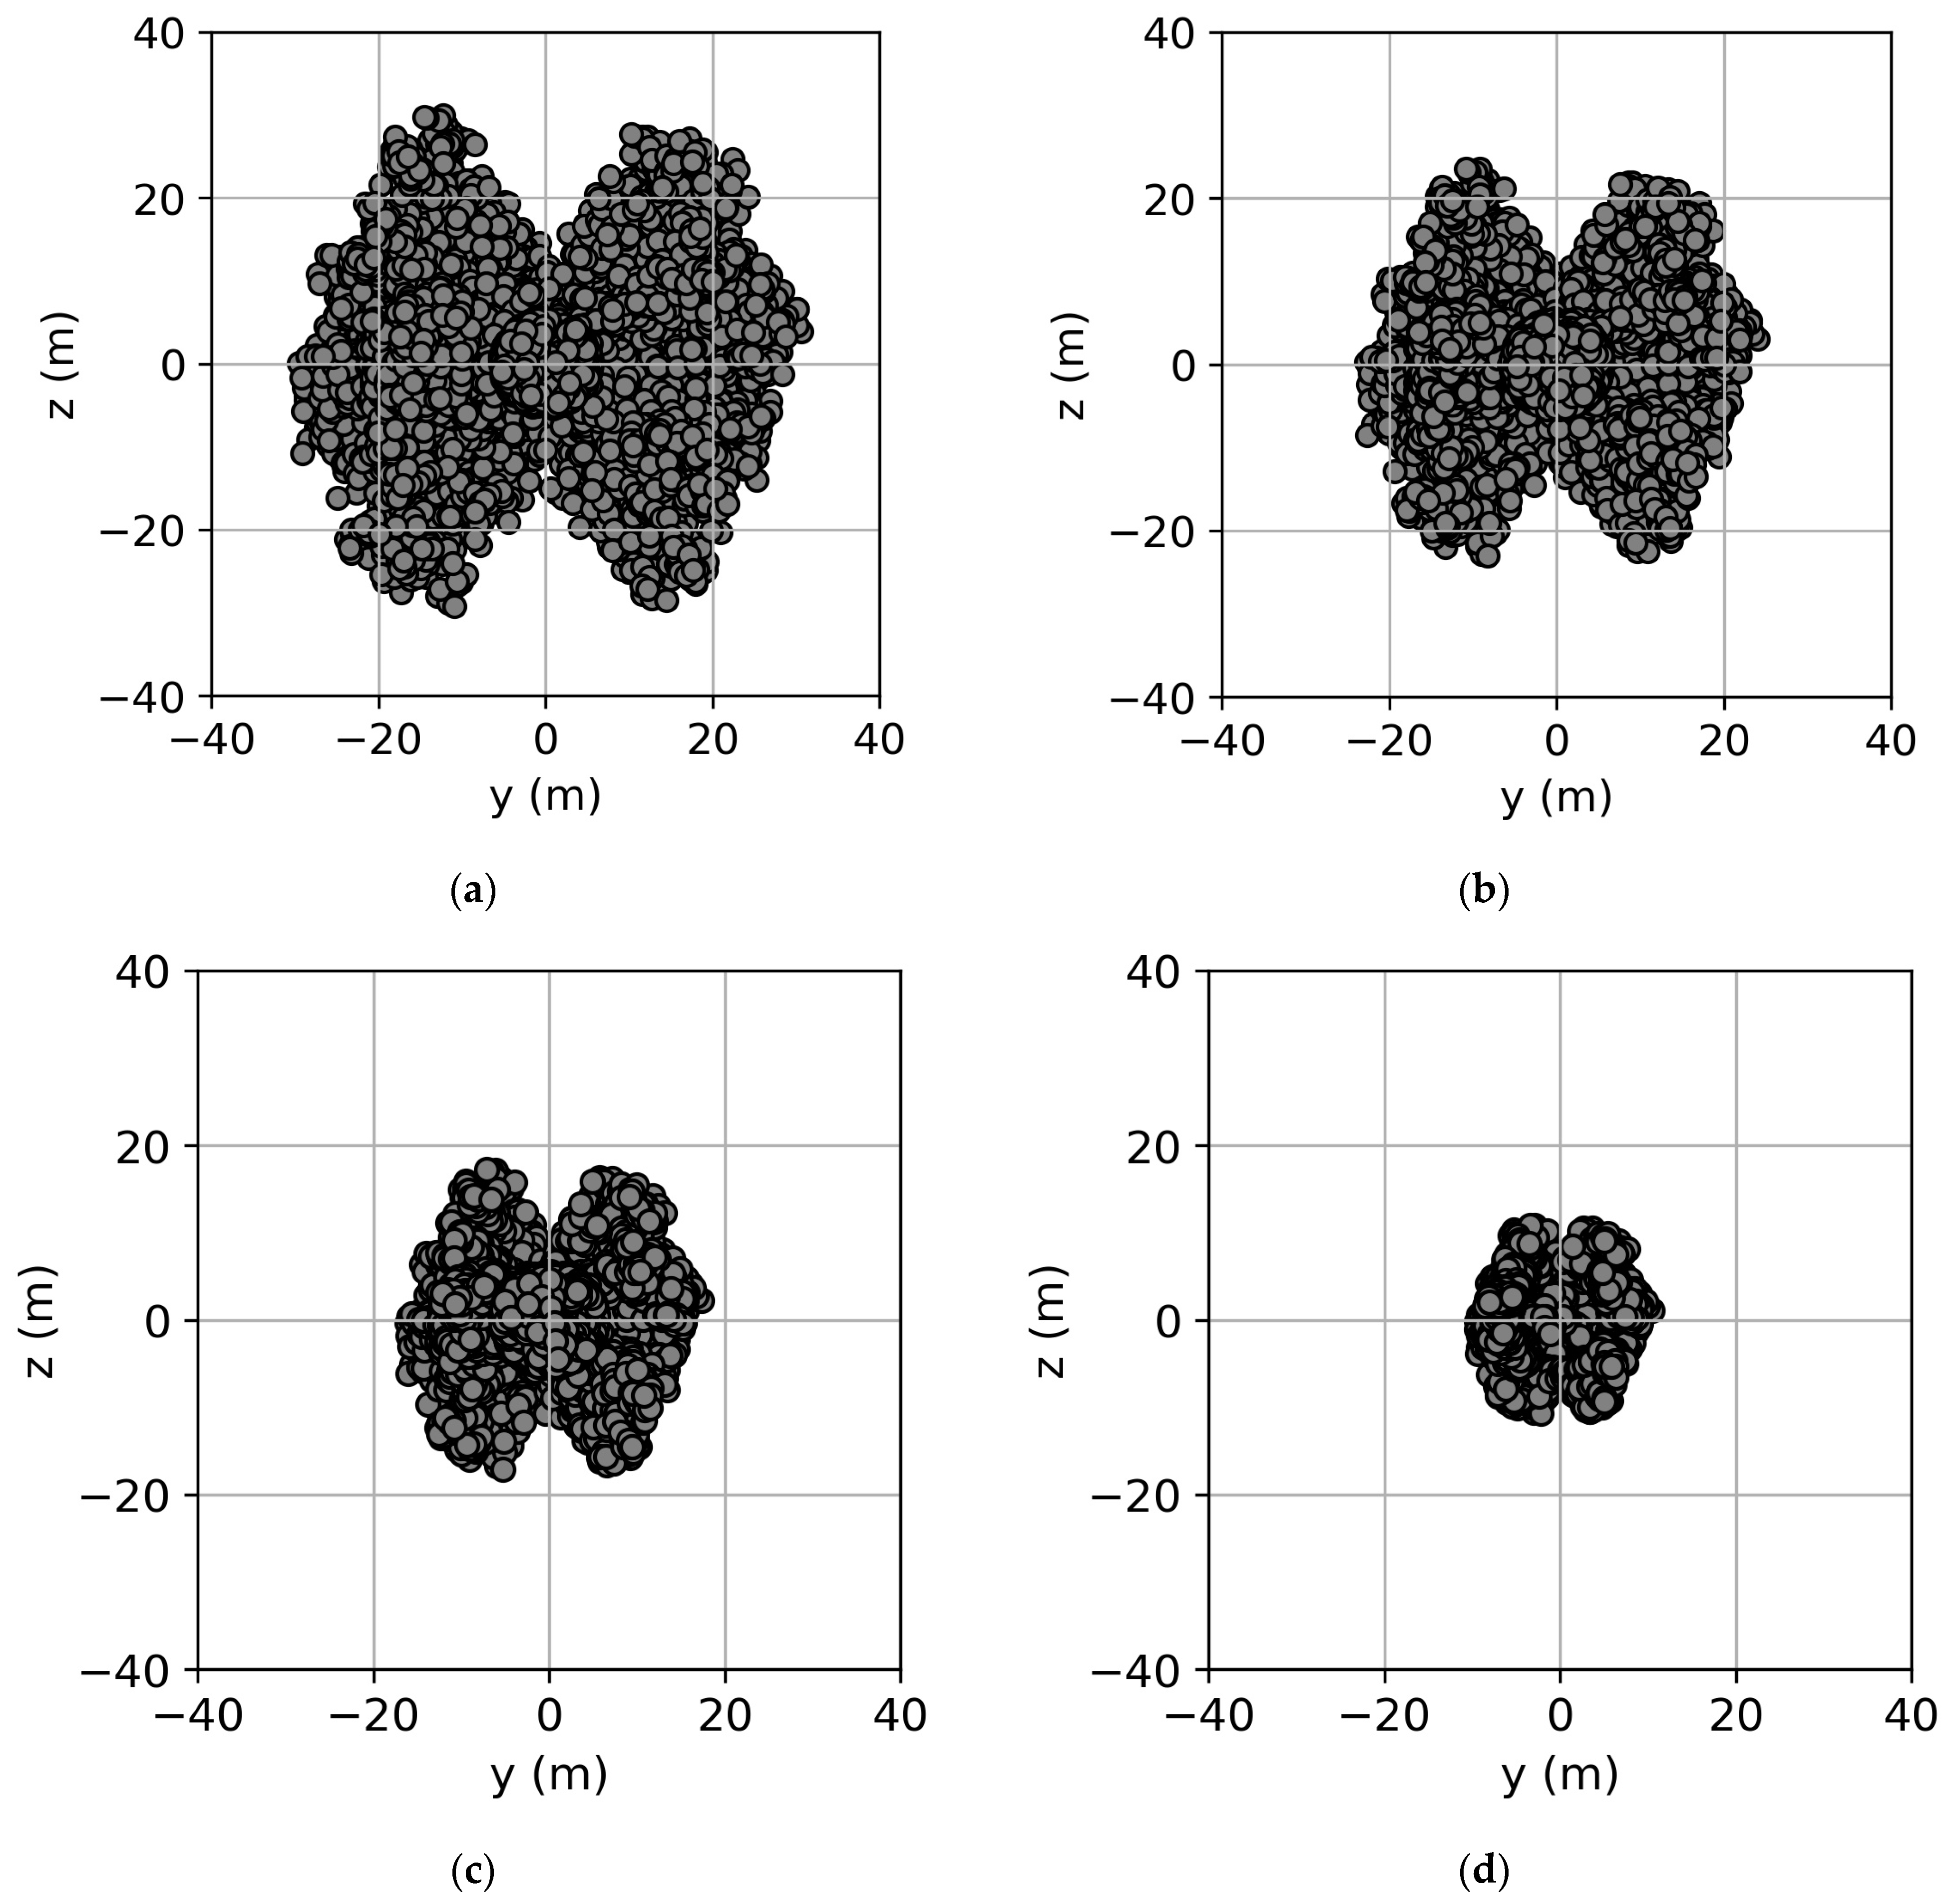
In the above splat analyses, it was assumed that all the particles impacting the substrate adhered to the substrate and formed a coating. Such an assumption is valid, especially in warm sprays, as most particles get partially melted/softened so that they will eventually stick to the substrate. Hence, based on this assumption, particle locations on the substrate were captured through simulations and qualitatively compared to the deposit observed and measured from experiments. Particle splats at different stand-off distances, viz., 381 mm, 281 mm, 181 mm, and 81 mm, are shown in Figure 16. It is evident that the splat diameter increases with the substrate stand-off distance. This is attributed to the increased particle turbulent dispersion with increasing stand-off distance. There also exist two islands or butterfly-like deposits/footprints a little away from the substrate centre, especially with the increase in the stand-off distance (Figure 16a–c). At the shortest stand-off distance of 81 mm, this butterfly-like footprint is least pronounced (Figure 16d).
These island formations can be clearly seen from their respective horizontal histogram plots, depicted in Figure 17. For the sake of simplicity, the histograms are plotted only for two stand-off distances, viz., 381 mm (Figure 17a,b) and 81 mm (Figure 17c,d).
The turbulent component of gas velocity magnitude contours obtained from turbulent kinetic energy is shown in Figure 18. This is essentially a x-y centreplane sliced in the direction of the powder injection (we can see the injection ports immediately after the CD nozzle). It is evident from this figure that turbulent velocity is stronger and concentrated in the gas core immediately after the barrel exit, up to a short axial distance (i.e., ~81 mm). After this distance, the turbulent velocity component spreads away from the gas core, viz., at stand-off distances of 281 mm and 381 mm, respectively. This spread in turn disperses particles to a larger radius on the substrate and creates island/butterfly-like particle deposits, as shown in Figure 16.
Histogram plots of the particle deposits along the y (parallel to injection direction) and z (normal to injection direction) axes are shown in Figure 17a–d. These plots further substantiate the island formation in the particle splats in the y direction but not in the z direction, although the turbulent velocity magnitude contours plotted in the x-z plane have similar characteristics to those of the x-y plane. This may be attributed to the influence of powder injection directions that are present in the x-y plane rather than in x-z plane.
To validate the numerical prediction of particle splat dynamics, we carried out a stagnation spot spray test by spraying CoNiCrAlY particles onto a nickel alloy (AMS 5536 Hastelloy X) substrate (7 × 14 cm2) located at a stand-off distance of 381 mm for about 20 s. The HVOF spray was performed using a Praxair JP-5000® HVOF system [24]. CoNiCrAlY powders were dried in an oven at 60 °C for a minimum of 2 h and fed into the centre of a JP5220 gun with 15.2 cm (or 6″) barrel by a GTV PF2/1 powder feeder. The substrate was cleaned using acetone and sand blasted using Al2O3 grit 60 at a pressure of 1.7–2.1 × 10⁵ Pa prior to the spray. The spray parameters are listed in 
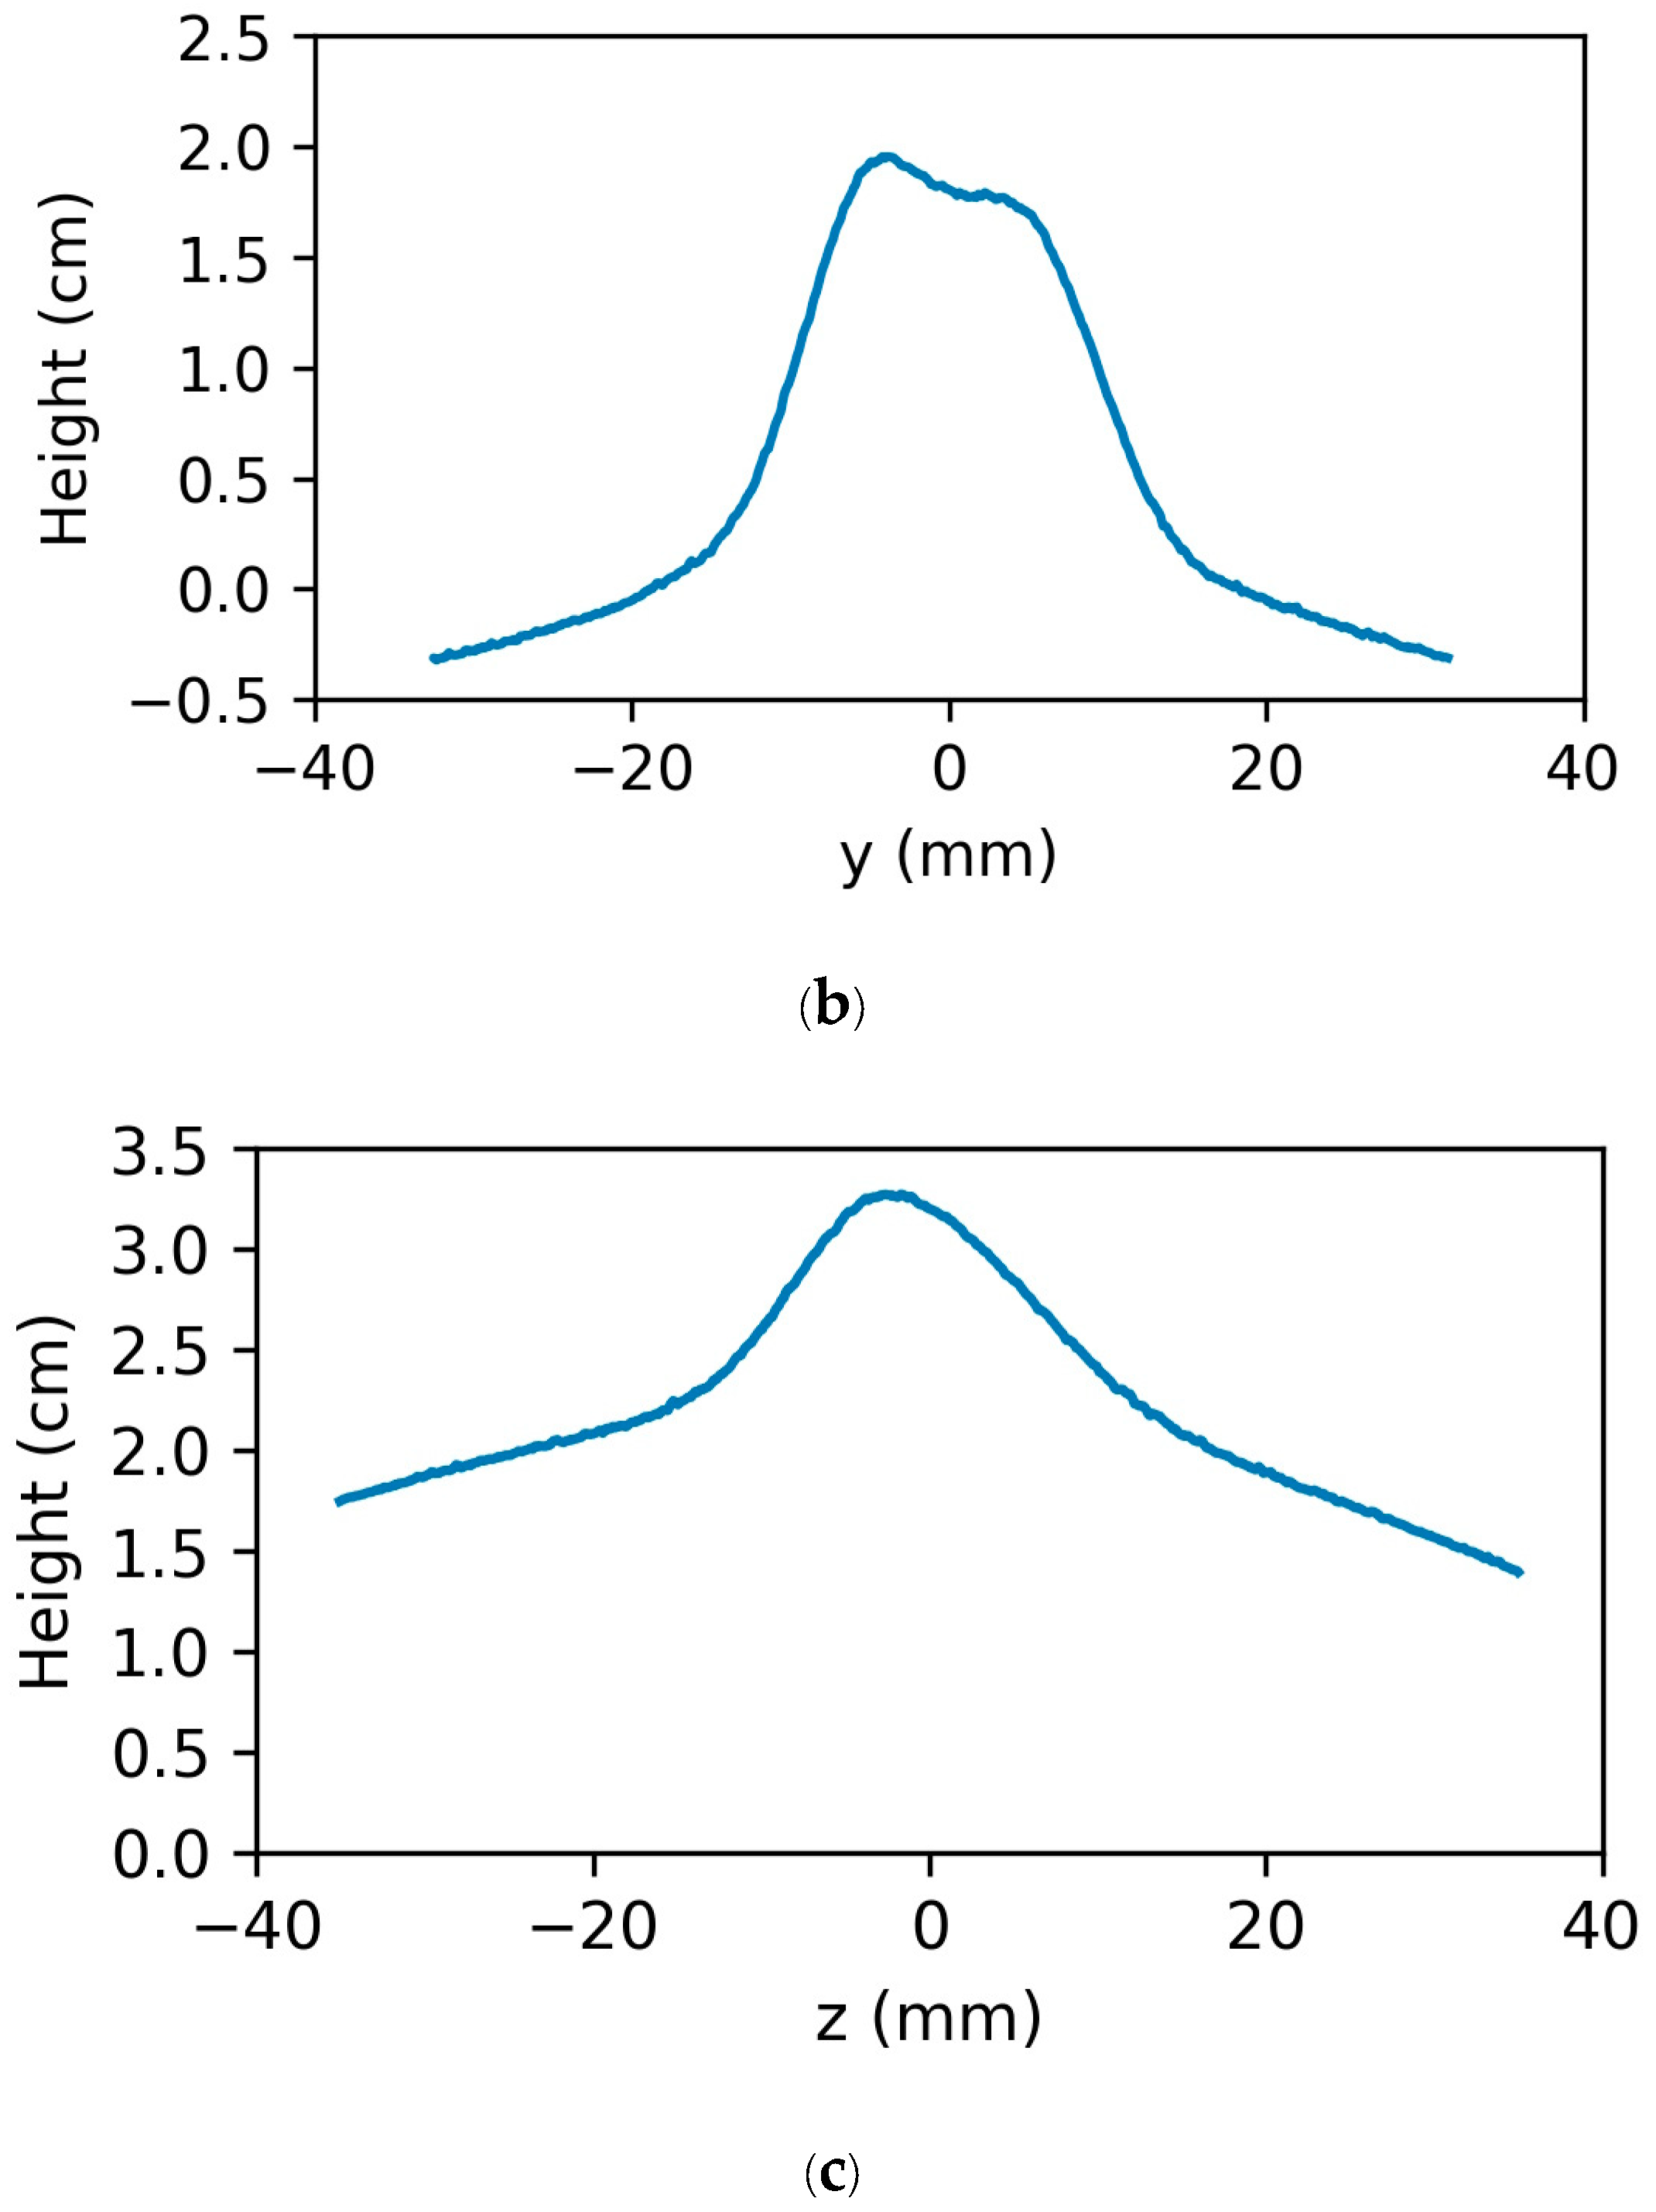
Table 3. The image of the spraying spot is shown in Figure 19a, while the y and z line profiles of spot height were measured by the Prismo Ultra high accuracy coordinate measuring machine (CMM) from Carl Zeiss and are shown in Figure 19b and Figure 19c, respectively.
Visual inspection suggests that the spot shape was nearly circular. However, the corresponding line profiles reveal double peaks existing along the y direction and a single peak in the z direction, located at the substrate centre. These line plots correspond to the particle density along the y and z directions. The existence of a double peak in the y direction is attributed to the two particle injectors located in the y direction. The diameter of the splat is found to be around 60 mm and the maximum height of the spray at the centre is found to be around 20 mm. Numerical predictions of the particle splat, together with their line profiles in y and z direction, are shown in Figure 17a and Figure 20 for the experimental stand-off distance of 381 mm. It is inferred that the general character of the numerical particle splat is like that of the experimental observations. Line profiles of particle number distributions along y and z directions obtained from the numerical simulations are found to replicate experimental observations with single and double peaks in the z and y directions. In the double peak feature of the y line profile, the dip at the centre is found to be significant when compared to that of the measurements. This may be attributed to the fact that, in measurements, the y profile reflects the deposit height, whereas in simulations, the particle-impacting probability is plotted in the y direction. Also, the peening effect may damp the bumps/peaks region, resulting in making the drop at the centre less severe. In the case of the z profile, it is more bell-shaped with a slight shift to one direction that may be due to slanted particle injectors. Further, it is clear from the numerical predictions that the splat diameter is in close agreement with that of measurements, viz., ~56 mm. The height/thickness of the splat profile was not investigated in the present numerical study and will be carried out in future with a detailed finite element model. Nevertheless, the splat profile agrees with the measurements reasonably well, as the particle density is higher at the central region of the substrate and decreases with increasing radial distance.

4. Conclusions

Numerical and experimental investigations of a typical kerosene-oxygen HVOF process are conducted to understand both the primary oxyfuel gas dynamics and the CoNiCrAlY particle deposit characteristics. A threshold for the fuel droplet size is determined to be <5 μm so that the fuel can be completely burnt inside the combustion chamber for better combustion performance. Numerical predictions of gas temperature at the torch exit are validated against the measurements and found to be in good agreement. CoNiCrAlY particles injected into the HVOF system are found to reach a maximum mean velocity of 700 m/s and mean temperature of 1350 K, closer to their melting point. These numbers are found to be well in the range of critical velocity/temperature for particle bonding onto the substrate. Peak particle velocities and temperatures of smaller particles are found to be significantly affected during their entire flight, whereas the mean and larger particles are found to be quite steady during their flight, owing to their greater momentum compared to the smaller particles. Also, it is revealed that the spray distance has significant detrimental effect on the particle characteristics, especially on small particles. Particle deposit sizes are found to grow with the increase of spray distance because of a wider gas plume, resulting in a larger particle dispersion phenomenon. Interestingly, double peaks in the particle density distribution are seen at large spray distances. Finally, predicted particle deposit size and shape are found to be in close agreement with in-house measurements. Further studies accounting for particle bonding onto the substrate at different operating conditions are underway and will be reported in future.

Author Contributions

S.K.: Conceptualization, methodology, preparing original draft; S.W.: Primary phase simulation & validation; T.B. & C.W.K.: Secondary phase modeling & simulation; Z.Z. & J.P.: HVOF spray experiments, post-spray measurements, results analysis. All authors reviewed and edited the manuscript. All authors have read and agreed to the published version of the manuscript.

Funding

This research was funded by the Agency for Science, Technology and Research (A*STAR), Singapore, under the Aerospace Program (A1815a0075), Structural Metal Alloy Program (A18b1B0061) and High-strength Lightweight Metals and Soft Magnetic Materials (A1898b0043).

Institutional Review Board Statement

Not applicable.

Informed Consent Statement

Not applicable.

Data Availability Statement

The data can be made available upon request.

Acknowledgments

The authors acknowledge the funding support received from the Agency for Science, Technology and Research (A*STAR), Singapore.

Conflicts of Interest

The authors declare no conflict of interest.

Appendix A. Past Studies on HVOF and Their Salient Features

Ref. No.Title of Publication.Year.Salient Feature.
2.Research and Application of High-Velocity Oxygen Fuel Coatings.2022.A very recent summary on HVOF processes.
3.Digital transformation of thermal and cold spray processes with emphasis on machine learning.2022.Applying machine learning to understand coating processes.
4.Investigation of operating parameters on high velocity oxyfuel thermal spray coating quality for aerospace applications.2022.Deployed factorial design approach to develop relationships between coating parameters and coating properties.
5.A parametric simulation model for HVOF coating thickness control.2021.Derive 3D coating characteristics from 2D axisymmetric simulation.
6.A feature-based model for optimizing HVOF process by combining numerical simulation with experimental verification.2021.Proposed a close-loop optimization model for HVOF process.
7.Prediction and analysis of high velocity oxy fuel (HVOF) sprayed coating using artificial neural network.2019.Application of artificial neural network to understand HVOF processes.
8.Effect of a cylindrical shroud on particle conditions in high velocity oxy-fuel spray process.2003.Shroud significantly reduces the oxygen content in the field by protecting the supersonic jet from ambient air entrainmentt that may help the coating characteristics.
11.Computational simulation of liquid fueled HVOF thermal spraying.2009.A key computational study on HVOF a decade ago.
12.Numerical investigation of dual-stage high velocity oxy-fuel (HVOF) thermal spray process: A study on nozzle geometrical parameters.2017.Influence of Eddy dissipation concept (EDC) and eddy dissipation model (EDM) on the combustion dynamics in HVOF was investigated.
15.Mathematical Modeling of High Velocity Oxygen Fuel Thermal Spraying.2001.Modeling chemical kinetics in HVOF.
18.CFD simulation of an HVOF process for the optimization of WC-C0 protective coatings.2003.Proposed one global reaction model for HVOF by simplifying multiple intermediate reactions equations.
21.A particle temperature sensor for monitoring and control of the thermal spray processes.1995.Good measurement datasets to validate thermal spray modeling.
23.Multi-scale modeling and analysis of an industrial HVOF thermal spray process.2005.Study on the influence of standoff distance on spray characteristics.
Present work We have attempted to model the 3D flow dynamics of both mixture and particle phase together with the modeling of a physical solid substrate in the ambient and carried out validations using in house measurements. This is different from previous studies in the sense that previous studies have attempted to approximate the flow dynamics either to (i) 2D axisymmetric model without a physical substrate or (ii) 3D half model without a physical substate or (iii) limiting to the HVOF gun region only or (iv) without any experimental validations.

References

  1. Tejero-Martin, D.; Rezvani Rad, M.; McDonald, A. Beyond Traditional Coatings: A Review on Thermal-Sprayed Functional and Smart Coatings. J. Therm. Spray Technol. 2019, 28, 598–644. [Google Scholar] [CrossRef] [Green Version]
  2. Yu, J.; Liu, X.; Yu, Y.; Li, H.; Liu, P.; Huang, K.; Sun, R. Research and Application of High-Velocity Oxygen Fuel Coatings. Coatings 2022, 12, 828. [Google Scholar] [CrossRef]
  3. Konstantina, M.; Konstantinos, D.; Bryan, A.; Kamnis, S. Digital transformation of thermal and cold spray processes with emphasis on machine learning. Surf. Coat. Technol. 2022, 433, 128138. [Google Scholar]
  4. Khan, M.N.; Shah, S.; Shamim, T. Investigation of operating parameters on high-velocity oxyfuel thermal spray coating quality for aerospace applications. Int. J. Adv. Manuf. Technol. 2019, 103, 2677–2690. [Google Scholar] [CrossRef]
  5. Jiangzhuo, R.; Rafiq, A.; Guofeng, Z.; Yiming, R.; Yongsheng, M. A parametric simulation model for HVOF coating thickness control. Int. J. Adv. Manuf. Technol. 2021, 116, 293–314. [Google Scholar]
  6. Jiangzhuo, R.; Guofeng, Z.; Yiming, R.; Yongsheng, M. A feature-based model for optimizing HVOF process by combining numerical simulation with experimental verification. J. Manuf. Process. 2021, 64, 224–238. [Google Scholar]
  7. Liu, M.; Yu, Z.; Zhang, Y.; Wu, H.; Liao, H. Prediction and analysis of high velocity oxy fuel (HVOF) sprayed coating using artificial neural network. Surf. Coat. Technol. 2019, 378, 124988. [Google Scholar] [CrossRef]
  8. Dolatabadi, A.; Mostaghimi, J.; Pershin, V. Effect of a cylindrical shroud on particle conditions in high velocity oxy-fuel spray process. J. Mat. Process. Technol. 2003, 137, 214–224. [Google Scholar] [CrossRef]
  9. Li, M.; Shi, D.; Christodes, P.D. Modeling and control of HVOF thermal spray processing of WC-Co coatings. Powder Technol. 2005, 156, 177–194. [Google Scholar] [CrossRef]
  10. Kamnis, S.; Gu, S. 3-D modelling of kerosene-fuelled HVOF thermal spray gun. Chem. Eng. Sci. 2006, 61, 5427–5439. [Google Scholar] [CrossRef]
  11. Tabbara, H.; Gu, S. Computational simulation of liquid-fuelled HVOF thermal spraying. Surf. Coat. Technol. 2009, 204, 676–684. [Google Scholar] [CrossRef] [Green Version]
  12. Jafari, H.; Emami, S.; Mahmoudi, Y. Numerical investigation of dual-stage high velocity oxy-fuel (HVOF) thermal spray process: A study on nozzle geometrical parameters. Appl. Therm. Eng. 2017, 111, 745–758. [Google Scholar] [CrossRef] [Green Version]
  13. Pope, S.B. Turbulent Flows; Cambridge University Press: Cambridge, UK, 2000. [Google Scholar]
  14. Durbin, P.A. On the k-ε Stagnation Point anomaly. Int. J. Heat Fluid Flow 1996, 17, 89–90. [Google Scholar] [CrossRef]
  15. Cheng, D.; Trapaga, G.; McKelliget, J.W.; Lavernia, E.J. Mathematical Modeling of High Velocity Oxygen Fuel Thermal Spraying: An Overview. Key Eng. Mater. 2001, 197, 1–25. [Google Scholar] [CrossRef]
  16. Oberkampf, W.L.; Talpallikar, M. Analysis of a high velocity oxygenfuel (HVOF) thermal spray torch, Part 2: Computational results. J. Therm. Spray Technol. 1996, 5, 62–68. [Google Scholar] [CrossRef] [Green Version]
  17. Magnussen, B.F.; Hjertager, B.H. On the mathematical modeling of turbulent combustion with 645 special emphasis on soot formation and combustion. Proc. Comb. Inst. 1976, 646, 719–729. [Google Scholar]
  18. Bartuli, C.; Cipri, F.; Valente, T.; Verdone, N. CFD simulation of an HVOF process for the optimization of WC-C0 protective coatings. Trans. Eng. Sci. 2003, 39, 71–83. [Google Scholar]
  19. ANSYS Fluent 6.3, Users Guide; Fluent Inc.: New York, NY, USA, 2006.
  20. Ranz, W.E.; Marshall, W.R. Evaporation from drops, Part I. Chem. Eng. Prog. 1952, 48, 141–146. [Google Scholar]
  21. Swank, W.D.; Fincke, J.R.; Haggard, D.C. A particle temperature sensor for monitoring and control of the thermal spray processes. In Proceedings of the 7th National Thermal Spray Conference, Houston, TX, USA, 11–15 September 1995; pp. 20–29. [Google Scholar]
  22. Faizan-Ur-Rab, M.; Zahiri, S.H.; Masood, S.H.; Phan, T.D.; Jahedi, M.; Nagarajaha, R. Application of a holistic 3D model to estimate state of cold spray titanium particles. Mater. Des. 2016, 89, 1227–1241. [Google Scholar] [CrossRef]
  23. Li, M.; Christofides, P.D. Multi-scale modeling and analysis of an industrial HVOF thermal spray process. Chem. Eng. Sci. 2005, 60, 3649–3669. [Google Scholar] [CrossRef]
  24. Zhang, Z.; Lim, S.H.; Chai, J.; Lai, D.M.Y.; Lim, P.C.; Cheong, A.K.H.; Wang, S.J.; Jin, H.; Pan, J.S. Kerosene-fuelled high velocity oxy-fuel (HVOF) spray of Ti2AlC MAX phase powders. J. Alloys Compd. 2018, 735, 377–385. [Google Scholar] [CrossRef]
Figure 1. Schematic of JP5000 HVOF gun.
Coatings 13 00668 g001
Figure 2. (a) 2D Cross section in the x-y plane of 3D CFD model of HVOF gun and spray domain; (b) 3D CFD model of HVOF gun and spray domain.
Coatings 13 00668 g002
Figure 3. Boundary conditions.
Coatings 13 00668 g003
Figure 4. Radial distribution of mixture temperature at the torch outlet with different assumed fuel droplet sizes and continuum.
Coatings 13 00668 g004
Figure 5. Axial distribution of mixture temperature along the centreline with different assumed fuel droplet sizes.
Coatings 13 00668 g005
Figure 6. Mixture temperature contours (K) inside the combustor with fuel droplet size of (a) 0.1, (b) 1, (c) 5, and (d) 10 μm.
Coatings 13 00668 g006
Figure 7. Axial distribution of mixture temperature along the centreline within the combustion chamber for different assumed fuel droplet sizes.
Coatings 13 00668 g007
Figure 8. Axial distribution of mixture temperature for different fuel injection angles with 10 µm fuel droplets.
Coatings 13 00668 g008
Figure 9. Comparison of axial distribution of mixture temperature along the centreline between the continuum model and different droplet sizes.
Coatings 13 00668 g009
Figure 10. Comparison of axial distribution of mixture velocity along the centreline between the continuum model and different droplet sizes.
Coatings 13 00668 g010
Figure 11. (a) Centreplane mixture density contours; (b) Axial variation of mixture density along the centreline; (c) Centreplane Mach number contours and (d) Axial variation of Mach number along the centreline.
Coatings 13 00668 g011aCoatings 13 00668 g011b
Figure 12. (a) Axial variation of fuel reactants along the centreline inside the combustion chamber; (b) Axial variation of fuel reaction products along the centreline.
Coatings 13 00668 g012
Figure 13. (a) Surface morphology by JEOL 7600F field emission scanning electron microscope (FE-SEM), (b) size distribution of Diamalloy 4700 CoNiCrAlY powders and (c) Rosin Rammler fit against the measured cumulative fraction.
Coatings 13 00668 g013
Figure 14. (a) Velocity profiles and (b) temperature profiles of particles with different mean sizes.
Coatings 13 00668 g014
Figure 15. (a) Velocity profiles and (b) temperature profiles of mean particle size at three stand-off distances. The data at 200 mm and 300 mm stand-off distances from Li et al. [23] are also included for reference.
Coatings 13 00668 g015
Figure 16. Numerical particle splat formation at different stand-off distances of (a) 381, (b) 281, (c) 181, and (d) 81 mm.
Coatings 13 00668 g016
Figure 17. Histogram of particle velocity along y and z directions for two stand-off distances, viz., 381 mm (a,b) and 81 mm (c,d).
Coatings 13 00668 g017
Figure 18. Fluctuating velocity contours (m/s) in the x-y centreplane.
Coatings 13 00668 g018
Figure 19. (a) Image of spraying spot on Inconel 600 substrate; (b) y-line profile of spot; (c) z-line profile of spot.
Coatings 13 00668 g019aCoatings 13 00668 g019b
Figure 20. y and z directions line profiles of the spot spray on aluminium substrate obtained from CFD simulations.
Coatings 13 00668 g020
Table 1. Boundary Conditions.
LocationMixture
Temperature
Mixture Flow RateParticle Flow RateParticle
Temperature
Combustion inlet300 K, const.0.022 kg/s,
O2 mass fraction set to 0.74,
C12 H23 mass fraction set to 0.26.
Reflect boundary condition, [19]Calculated
Torch walls350 K, const.-Reflect boundary condition, [19]-
Ambient300 K, const.O2 mass fraction set to 1,
All other reactants and products mass fraction set to 0
Escape boundary condition, [19]Calculated
Particle inlet--57 g/min300 K, const.
Substrate T n = 0-Trap boundary condition, [19]Calculated
Table 2. Thermophysical and flow properties of Diamalloy 4700 particles.
Density μp (kg/m3)3954
Heat capacity CP (J/kg K)460
Melting temperature, Tm (K)1338
Flow rate, (g/min)57
Table 3. Parameters used during HVOF deposition of the stagnation spot.
Gun Barrel (″)6
Spray Distance (″)15
Oxygen flowrate (SCFH)1900
Kerosene flowrate (Gallon per hour)5.4
Carrier flowrate (SCFH)21
Powder feedrate (g/min)57
Disclaimer/Publisher’s Note: The statements, opinions and data contained in all publications are solely those of the individual author(s) and contributor(s) and not of MDPI and/or the editor(s). MDPI and/or the editor(s) disclaim responsibility for any injury to people or property resulting from any ideas, methods, instructions or products referred to in the content.

