Abstract
The tribological behavior of dual-phase steels have been studied at the macroscopic scale taking the macrohardness as the main material property to control friction and wear. However, the contribution to the macroscopic behavior of the varying properties of the phase at the microscopic scale are yet to be fully understood. In this study, dual-phase microstructures with various grain sizes and martensite volume fraction are generated. Microhardness of ferrite and martensite are measured by nanoindentation tests while their friction and wear behavior are studied by conducting scratch tests with various conical tips. Results show that for martensite, friction coefficient and wear resistance are proportional to its carbon content, whatever the martensite grain size. Whereas changing the ferrite grain size has two effects on the tribological behavior of the microstructure. First, the friction and wear resistance of ferrite are related to its grain size through a Hall–Petch relationship. Second, at a given martensite volume fraction, the mean wear resistance changes from the Equal Wear mode to the Equal Pressure mode as the ratio of the contact size to the ferrite grain size increases, while the mean friction coefficient always correlates to the Equal Pressure mode.
1. Introduction
Dual-phase steels combine the hardness of martensite with the ductility of ferrite, which provides them with advantageous properties when applied as wear-resistant materials. Subsequently, the tribological behavior of dual-phase steels have been studied at the macroscopic scale, taking the macrohardness as the main material property to control friction and wear [1,2,3,4,5,6,7]. However, the contribution to the macroscopic behavior of the varying properties of the phase at the microscopic scale are yet to be fully understood. Indeed, Trevisiol et al. have recently shown that various microstructures with the same composition and similar macrohardness but different morphology of the microstructure show different friction and wear behavior under the same conditions [7]. Thus, in order to explain those differences, it is necessary to understand the variability of the microscopic friction and wear behavior of the ferrite and the martensite with the microstructure properties.
Some authors have already studied the mechanical properties of the phases of dual-phase steels at the microscopic scale by studying the hardness of ferrite and martensite in various conditions. Mazaheri et al. have related the martensite and ferrite hardness to the carbon content of the martensite and the grain size [8]. Delincé et al. have studied the evolution of microstructure hardness with increasing indentation depth [9]. Finally, some have studied the inhomogeneity of the hardness at the scale of each grain, relating it to the influence of the geometrically necessary dislocation in ferrite [10] or to the gradient of carbon concentration in martensite [11].
Nevertheless, few works try to correlate the mechanical properties of ferrite and martensite to their friction and wear behavior at the microscopic scale. Thus, our previous paper [12] focused on the effect of the variation of martensite volume fractions on the friction and wear behavior of ferrite and martensite individual phases through scratch tests with conical tips of different attack angles and performed under various constant normal loads. It has been shown that when the martensite volume fraction increases, the carbon content of the martensite decreases and causes the friction to increase and the wear resistance to decrease on martensite, while the friction and wear resistance of ferrite are almost constant. Nonetheless, the results still do not allow us to explain the various tribological behaviors of dual-phase microstructures with similar martensite volume fractions but different grain sizes.
Moreover, the individual tribological behavior of ferrite and martensite can be related to the macroscopic behavior of the microstructure. Axén et al. proposed two models for friction and wear of multiphase materials [13,14], allowing them to estimate the macroscopic friction coefficient and specific wear resistance of a microstructure knowing the individual friction coefficient and specific wear resistance of the phases. The first one is based on the assumption that all phases are worn at the same rate and is called Equal Wear (EW). The second one is based on the assumption that all phases are submitted to the same contact pressure and is called Equal Pressure (EP). Those two models are only limits to the expected behavior of multiphase materials that should generally be in between both, leading to the definition of an intermediate mode [15]. This intermediate mode for a given multi-phase material should depend on various material and tribological parameters but is still difficult to predict.
In this context, this study investigates the effect of grain sizes on the friction and wear behavior of dual-phase microstructures with similar martensite volume fraction and the same chemical composition. First, dual-phase microstructures with various grain sizes are generated from three different heat treatment for each martensite volume fraction. Then, microhardness of ferrite and martensite are measured by nanoindentation tests and are related to the ferrite grain size and to the martensite carbon content. Friction and wear behavior of the phases are measured by conducting scratch tests with various conical tips and are also related to the ferrite grain size and martensite carbon content. Finally, a comparison between experimental and modeling results of the mean friction and wear resistance of the microstructure based on EP and EW models is attained. A new intermediate model is then defined by taking into consideration both the grain sizes and the contact conditions.
2. Experimental Section
2.1. Material and Heat Treatment
In this study, all samples are prepared from a 25CD4 low alloy steel whose nominal composition is shown in Table 1.

Table 1.
Nominal chemical composition of 25CD4 low alloy steel.
The steel 25CD4 is supplied by the company MDS (Métaux Détail Services) Billy-Berclau, France.
First, samples of 16 mm in diameter are cut from an initial rod with the Labotom-15 cutting machine from Struers (Copenhagen, Denmark). Then, various heat treatments are conducted in order to generate dual-phase microstructures composed of martensite and ferrite, with the martensite volume fraction going from αM = 50% to αM = 100% and different grain sizes for each martensite volume fraction.
Three different thermal paths have been used to generate the microstructure. The furnace used for the heat treatments is Nabertherm, which is manufactured by Nabertherm Aubervillier France. Each heat treatment allows to obtain similar martensite volume fraction but different grain sizes. They are illustrated in Figure 1. The first one, called (a), is a step-quenched heat treatment composed of an austenitization at Ta = 900 °C during ta = 30 min followed by an intercritical annealing at Tia = 700 °C during tia = 0 to 10 min and finally by a water quench. The varying time of the intercritical annealing allows us to vary the martensite volume fraction of each sample. Indeed, during the intercritical annealing, ferrite grains nucleate and grow at the austenite grain boundaries. Then, increasing the intercritical annealing time allows the fraction of ferrite to increase. The second heat treatment, called (b), is the same as heat treatment (a) but with an austenitization temperature of Ta = 1000 °C. This higher temperature increases the size of the austenite grains from which the dual-phase microstructure is generated. Then, the final microstructures present bigger grain sizes than for heat treatment (a) for similar martensite volume fractions. The last heat treatment, called (c), is first composed of an austenitization at Ta = 900 °C, directly followed by a water quench in order to generate a fully martensitic microstructure. Only then, an intercritical annealing at Tia = 780 °C is conducted on the fully martensitic microstructure to allow the growth of ferrite in between the laths of martensite. This heat treatment produces dual-phase microstructures with finer martensite and ferrite grains.
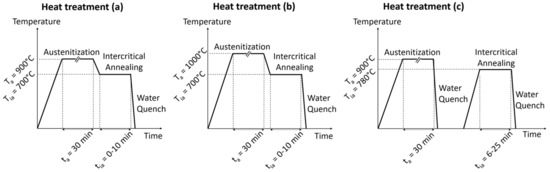
Figure 1.
Schematic drawings of the three heat treatments with their temperature and time parameters.
After heat treatment, the samples are mechanically polished with SIC papers from a grit size of 80 to 4000. Then, the finishing is conducted with diamond past of 3 µm and 1 µm before cleaning the samples by ultrasound with ethanol for at least 10 minutes. After polishing, the surface roughness Ra is about 0.1–0.15 µm. The measurements were carried out by the optical profilometer Sneox. It is manufactured by Sensofar (Barcelona, Spain).
2.2. Microstructure Characterization
First, the macrohardness of each microstructure is measured as the average of five Vickers hardness tests under a load of 2 kg.
Then, in order to measure the martensite volume fraction and the ferrite and martensite grain sizes, the samples are observed with a Field Emission Gun-Scanning Electron Microscope (FEG-SEM, Iéna, Berlin, Germany) ZEISS Sigma using a Back Scattering Electron (BSE, Iéna, Berlin, Germany) detector at 20 keV. Images of at least five different locations on each sample are numerically processed to measure both the martensite volume fraction (as the ratio of the surface of martensite phases over the total surface of the image) and the ferrite and martensite grain sizes (as the mean free paths in a given phase before encountering the other phase). Figure 2 presents SEM images of the generated microstructures. The martensite appears in light while ferrite appears in the dark. We can observe that for a given martensite volume fraction, heat treatment (b) generates the bigger grains while heat treatment (c) generates the finer grains.
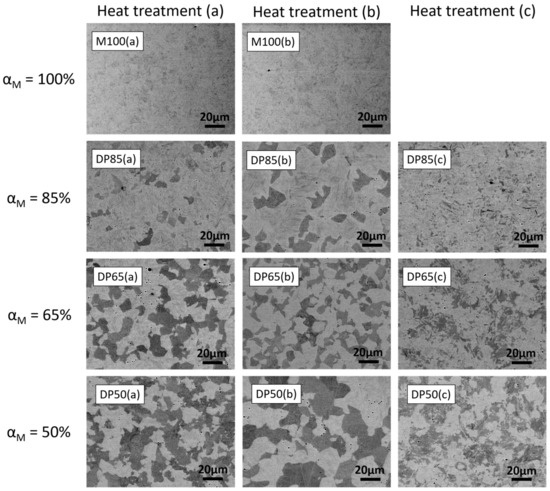
Figure 2.
SEM images of all samples tested.
Indeed, as indicated in Table 2, the ferrite size increases from 4.39 µm to 12.88 µm when the martensite volume fraction decreases from 85% to 50% for heat treatment (b), while they increase only from 1.45 µm to 3.77 µm for the same martensite volume fraction obtained with heat treatment (c). Heat treatment (a) presents intermediate sizes from 2.87 µm to 8.79 µm.
Table 2.
Description of the samples: heat treatment applied with corresponding intercritical annealing time tia, Vickers hardness under a load of 2 kg HV2, martensite volume fraction αM, martensite carbon content CM, and martensite and ferrite grain sizes dM and dF.
It is known that the carbon content of martensite has a great influence on the martensite properties. However, in dual-phase steels, it varies with martensite volume fraction. In this study, it is calculated as follows for each sample. During the intercritical annealing, because the carbon concentration of ferrite is limited to CF = 0.02 wt%, the carbon is forced to diffuse in the remaining austenite, increasing the carbon content of the subsequent martensite CM while the martensite volume fraction αM decreases. A rule of mixture can be used to calculate the carbon content of the martensitic phase CM in dual-phase steels as a function of the global carbon content of the steel C, the martensite volume fraction αM and the ferrite carbon content CF:
For 25CD4, the global carbon concentration is C = 0.25 wt%. Then, the martensite carbon content is calculated as:
Table 2 summarizes the heat treatment parameters mentioned above, Vickers hardness, martensite volume fraction and grains sizes for each of the 11 prepared samples.
2.3. Microhardness of Ferrite and Martensite
Ferrite and martensite individual microhardnesses are characterized by instrumented nanoindentation using a Nanoindenter G200 from Agilent (Santa Clara, CA, USA) and a diamond Berkovitch tip. Around 100 tests are conducted on each sample with a spacing of 50 µm between each print. Hardness is calculated from Continuous Stiffness Measurements (CSM) data. In order to obtain the evolution of hardness with the contact size, the maximum load for each test is 630 mN and specific values at a given depth or load are then extracted from the CSM data acquired during the loading part of the test. More precisely, values under loads L = 20 mN, 50 mN and 200 mN have been specifically extracted for this study in order to compare the hardness values with the friction and wear results obtained from scratch tests under the same loads.
In this study, the nanoindentation data are analyzed using the Loubet method [16], for which the contact depth hc, the contact area Ac and the hardness H are calculated from the measurement of the measured depth h, the load L and the stiffness of the contact S as follows:
where h0 is the tip defect, whose value is 55 nm in this study, and α is a coefficient equal to 1.2. In this study, the Loubet method is preferred to the more well-known Oliver and Pharr method [17] because it has been shown that it is a better fit for the mechanical behavior of dual-phase steels [12].
Each test is conducted on a random location on the surface, so it is necessary to determine which measure corresponds to martensite and ferrite. However, with the final loading being 630 mN, it is not possible to verify the position of each test at each load of interest. Consequently, a method based on the comparison between the grain size and the print size at a given load has been developed to sort the values between ferrite, martensite and mixed phase.
This method is based on the measurement of the grain sizes in ferrite and martensite. Indeed, these grain sizes are calculated as the mean free path in each phase. However, the cumulative frequency of the distribution of the lengths measured in each phase follows an exponential distribution, taking the mean grain size as the main parameter. Then, if we note i = M for martensite or i = F for ferrite, Fi is the cumulative frequency of the lengths in the phase i, di is the mean size of the phase and a is the distance to the other phase at a given position. Thus:
Considering the martensite volume fraction αM, we can consider the probability pi that a test randomly positioned on the surface that makes an imprint of diameter a is covering only the phase i:
The SEM images in Figure 3 are presented with the corresponding evolution of the probability pF and pM as function of the contact diameter. The blue and red bars are the values measured from the SEM images for the ferrite and martensite phases, respectively, while the blue and red curves are the corresponding approximated functions pF and pM. We can see that the probability of finding a measurement only on ferrite or martensite decreases quicker when the grain size is smaller and that the probability depends on the martensite volume fraction.
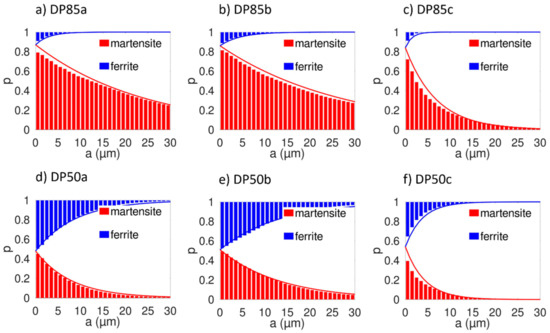
Figure 3.
Probability distribution of measuring martensite or ferrite properties as functions of the distance to the grain boundary: (a–c) martensite volume fraction of αM = 85% with heat treatments (a), (b) and (c), respectively; (d–f) martensite volume fraction of αM = 50% with heat treatments (a), (b) and (c), respectively.
For indentation attained with a Berkovitch tip, the side length of the triangle print of the tip is:
Then, N = 100 tests are conducted on each sample, which allows us to determine the number of tests associated to each phase Ni at a given depth of indentation h:
Consequently, because we know that martensite hardness is higher than ferrite hardness, the martensite hardness is considered to be the average of the NM higher values calculated from the 100 tests, while the ferrite hardness is considered to be the average of the NF lower values. The remaining values are considered as being mixed values from tests covering both ferrite and martensite at the same time.
2.4. Scratch Tests
The nanoindenter is also used to conduct the scratch tests. Scratches under constant normal loads of L = 20, 50 or 200 mN with conical tips of attack angles of β = 18.8°, 33.2° and 47.5° are found on each sample. Scratch length is 500 µm with a scratch velocity of 50 µm/s. For each scratch test, a profile over the entire wear track on the original surface is conducted under a load of 50 µN. Then, the indenter returns to the origin and performs the scratch under the imposed normal load. Three scratches are obtained for each set of parameters. For each scratch test, the normal load, the tangential load and the scratch depth are measured as functions of the scratch length. A schema of the procedure is illustrated on Figure 4.
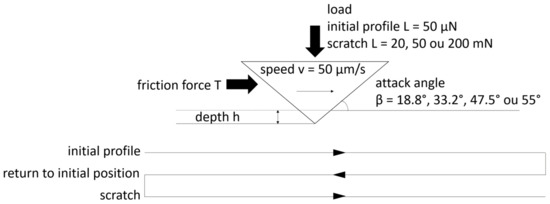
Figure 4.
Schematic representation of the procedure for scratch tests.
Consequently, the two main parameters studied in this paper are calculated from those results: the friction coefficient µ and the specific wear resistance Ω. The friction coefficient µ is defined as the ratio of the friction force T over the normal load L:
The specific wear resistance Ω is derived from the Archard’s equation:
where V is the volume loss, S is the sliding distance, L is the load, H is the hardness of the worn material and K is the wear coefficient that depends on material and contact properties. The specific wear resistance Ω is defined as the ratio of H over K. For a scratch test, the wear rate dV/dS corresponds to the wear per unit scratch length and should be taken as the wear ratio fab defined in Figure 5 multiplied by the cross-sectional area of the groove As.
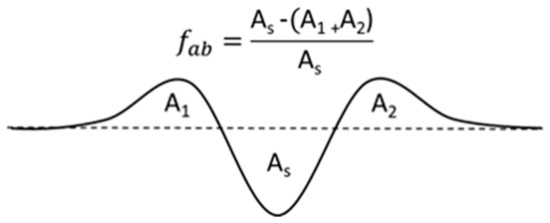
Figure 5.
Schematic view of the cross-sectional area of the wear groove and definition of the wear ratio fab.
In order to have an accurate value of this cross-sectional area, the precise geometry of the conical tips have been measured. In particular, it is important to take into account the tip defect of the conical tips. For this purpose, indentations on a eutectic 63%Sn-37%Pb sample have been obtained with the four conical tips and the topography of the prints were measured with a Bruker’s Dimension Icon Atomic Force Microscope (Bruker, Billerica, MA, USA). Then, the mean profiles for each tip has been extracted from the topography and the mean attack angles have been measured. Figure 6 presents the mean profiles of the three tips used in this study and the corresponding attack angles. The cross-sectional area of the groove is then calculated directly from the scratch depth measured and the known geometry of the tip.
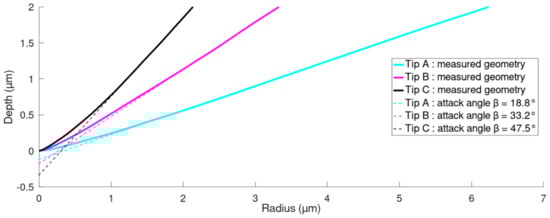
Figure 6.
Mean profile of the three conical tips used for scratch tests; full lines represent the measured profiles, dashed lines represents the perfect conical geometry for the equivalent attack angles β = 18.8°, 33.2° or 47.5°.
In contrast, the measurements of the wear ratio were not attained in this study, so its value was taken as fab = 1. In consequence, the specific wear resistance is calculated as the ratio of the load to the calculated scratch section.
Similar to the hardness, the depth and friction data are attributed to the ferrite and martensite phases using the probability function defined in Equation (7). For conical tips, the scratch width a is calculated from the depth h and the known geometry of the tips. Then, for a given scratch depth profile, the highest fraction pM of the measured points is attributed to martensite while the lowest fraction pF is attributed to ferrite. Finally, the points situated in the same position on the friction coefficient profile are attributed to the friction of each phase. Some examples of depth and friction coefficient profiles with the points associated to each phase are presented in Figure 7.
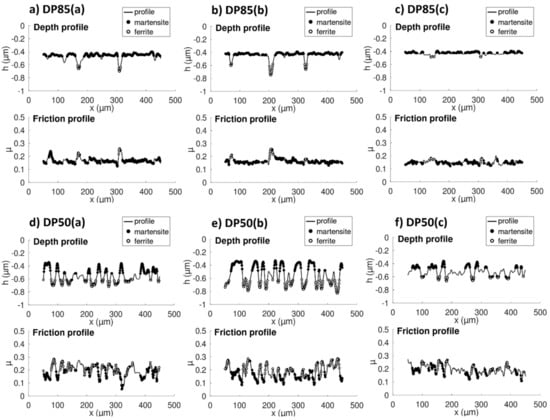
Figure 7.
Examples of depth and friction profiles from scratch tests conducted with an attack angle β = 18.8° under a load L = 50 mN for (a–c) three samples with a martensite volume fraction of αM = 85% and (d–f) three samples with a martensite volume fraction of αM = 50%.
3. Experimental Results
3.1. Microstructure and Hardness Characterization
Dual-phase microstructures with martensite volume fractions from αM = 50% to αM = 100% have been generated from three different heat treatments. For a given martensite volume fraction, each heat treatment produces different ferrite and martensite grain sizes. Figure 8a shows the evolution of ferrite and martensite grain size—dF and dM, respectively—with martensite volume fraction for the three sets of heat treatments. The dashed lines represent the linear regression for each set of heat treatment. Martensite grain size increases while ferrite grain size decreases when the martensite volume fraction increases; for similar martensite volume fractions, the grain sizes are increasing in the order of heat treatment (b), (a) and (c). Moreover, the ratio of ferrite over martensite grain size only depends on the martensite volume fraction, as shown on Figure 8b, and can be expressed by:
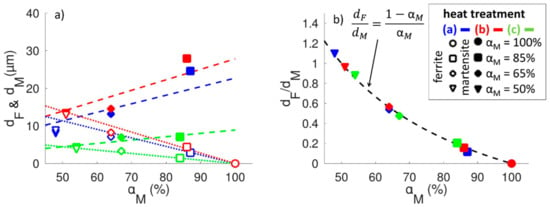
Figure 8.
(a) Evolution of ferrite size dF and martensite size dM as function of martensite volume fraction αM for the samples generated from each three sets of heat treatment (a) (blue), (b) (red) and (c) (green); (b) Evolution of the ratio of grain sizes dF/dM as function of martensite volume fraction αM.
Then, one microstructure can be identified by its martensite volume fraction and its ferrite grain size. For a martensite volume fraction of 50%, the ferrite size changes from 3.77 µm for heat treatment (c) to 12.88 µm for heat treatment (b). For a martensite volume fraction of 65%, the ferrite size goes from 3.31 µm to 8.26 µm. For a martensite volume fraction of 85%, it increases from 1.45 µm to 4.39 µm.
Next, the mechanical properties of ferrite and martensite on each sample are characterized from nanoindentation tests. Ferrite and martensite hardness are related to the microstructure parameters. As explained in paragraph 2.2, the carbon content of martensite increases when the martensite volume fraction decreases because the carbon is mainly concentrated in the martensite. In a synthetic study, Krauss [18] has shown that martensite hardness increases with its carbon content. Indeed, the martensite hardness is proportional to its carbon content until a concentration of 0.7 wt% and becomes almost constant for higher concentrations due to the increase of retained austenite. In this study, the calculated carbon content of martensite varies from 0.25 wt% to 0.5 wt% when the martensite volume fraction decreases from 100% to 48%, so a linear relationship between martensite hardness and its carbon content is assumed:
In contrast, ferrite hardness is often related to its grain size through a Hall–Petch relationship [8,9]:
Figure 9 shows the ferrite hardness as a function of the inverse of the square root of ferrite grain size as well as the martensite hardness as a function of the martensite carbon content under a load of 50 mN. We can see that the previous laws are unique regardless of the martensite volume fraction or the heat treatment of the samples. The coefficients of the approximated laws calculated for loads of 20 mN, 50 mN and 200 mN are shown in Table 3. There are some limitations on the values calculated for the ferrite at 200 mN. Indeed, at this load, the size of the indentation was always greater than the ferrite grain size for samples with the smallest ferrite grain size (Nf < 1). Then, the number of samples used for the regression changes from 9 at 20 mN to 8 at 50 mN and only 7 at 200 mN. Nonetheless, all values of H0 are between 0.9 GPa and 1.4 GPa and all values of kH are between 2.5 GPa·µm1/2 and 4 GPa·µm1/2. Peng-Heng et al. have measured the Hall–Petch relationship for dual-phase microstructures from tensile tests [19]. From a steel whose nominal composition is close to the 25CD4, they generated a dual-phase microstructure with a martensite volume fraction of αM = 50% and grain sizes from 6.5 µm to 67.4 µm, and determined that for tensile strength, the Hall–Petch coefficients are σ0 = 0.430 GPa and ky = 1.535 GPa·µm1/2. Using the correlation between the hardness and the tensile strength found by Tabor [20], we can estimate the corresponding values for hardness as H0 ≃ 3σ0 = 1.29 GPa and kH ≃ 3ky = 4.605 GPa·µm1/2. Then, the coefficients identified from the samples in this study seem reasonably close to the results of Peng-Heng et al.
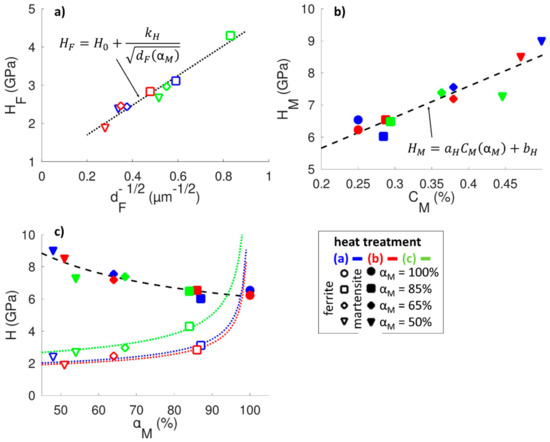
Figure 9.
Evolution of (a) ferrite hardness HF as a function of the inverse square root of the ferrite size dF, (b) martensite hardness HM as a function of the martensite carbon content CM and (c) ferrite and martensite hardness as functions of the martensite volume fraction αM. All values are shown for a load L = 50 mN.
Table 3.
Regression coefficients obtained from Equations (14) and (15) for loads of L = 20 mN, 50 mN and 200 mN.
For martensite, we can observe a decrease in the slope aH when the load increases, explained either by an increased indentation size effect for martensite with higher carbon content or by the increased influence of surrounding martensite in the dual-phase samples with lower martensite volume fractions. The macrohardness measurements shown by Krauss in a synthetic study [18] show that for martensite with carbon content between CM = 0.25% and CM = 0.5%, the slope should be around aH = 11 GPa/%, which is close to the value measured for low loads. Then, it suggests that the change in slope is better explained by the increased influence of the ferrite. In contrast, the coefficient bH should decrease because of the ISE effect, but instead increases because it is mainly influenced by the variation of the slope.
Figure 9 also shows the evolution of martensite and ferrite hardness as function of martensite volume fractions as well as their expected evolution due to the previous approximated laws applied to each set of heat treatment. Because martensite hardness depends only on the martensite carbon content, which is directly related to the martensite volume fraction, it appears that it is independent from the heat treatment applied. However, ferrite hardness directly depends on ferrite grain size, so each set of heat treatment presents different evolutions.
This difference in ferrite hardness regarding its size should have an impact on the macrohardness of the sample. Thus, a correlation between the individual hardness of ferrite and martensite and the macrohardness of the sample must be determined. For indentation tests conducted under a given load, the macrohardness is considered as the mean of the combined hardness measurements on ferrite, martensite and the interface between ferrite and martensite.
The macrohardness of dual-phase steels is usually related to its phase hardness with a proportional correlation [21,22]:
However, some authors criticize the reliability of this relationship because it does not take into account the variations of the phase properties regarding martensite volume fractions [23,24]. Alternatively, an inverse relationship has also been proposed [12]:
These laws can be interpreted in another way as the macrohardness. Indeed, the proportional laws should correspond to the weighted average hardness of a set of measurements attained separately on ferrite and martensite with a proportion determined by αM, which is what should happen when the load is low and most of the indentations are found on individual phases. In contrast, the inverse law could be interpreted as the hardness measured from indentation at high loads when the indent is loaded on several martensite and ferrite grains. Then, for intermediate loads, both situations should occur, so that the mean hardness measured is a weighted average of both relations. The proportion of each law can be determined thanks to the probabilities calculated in Equation (7) used to determine the number of tests corresponding to each phase. Indeed, they allow us to estimate that for a given microstructure, random contacts of a given size should be distributed with a proportion of pM on martensite, pF on ferrite and (1-pM-pF) on the interface.
Consequently, we define a new relation for this intermediate situation as:
Figure 10 shows the evolution of mean hardness and calculated proportional, inverse and intermediate modes with martensite volume fractions of the sample and for each set of heat treatments measured under a load of L = 50 mN. We can observe that, as expected, the intermediate mode is between the proportional and inverse mode and is close to the mean experimental values for most of the points.
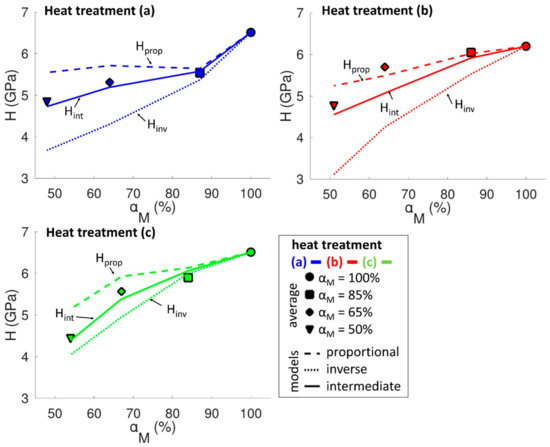
Figure 10.
Evolution of the experimental mean hardness H as a function of the martensite volume fraction αM under a load L = 50 mN, and comparison to calculated proportional, inverse and intermediate laws for samples tested with (a) heat treatment, (b) heat treatment and (c) heat treatment.
In order to better visualize the effect of contact size and grain size on the transition between the proportional and inverse modes, we can normalize the values by calculating the ratio RH:
The ratio RH calculated for the intermediate mode produces:
Introducing Equation (18), we have:
Or:
By definition of pM and pF shown in Equation (7):
Then, the proportion of proportional and inverse relations into the intermediate mode is only dependent on the martensite volume fraction and the ratio of contact size to ferrite and martensite grain size. Thanks to the relation between them shown in Equation (13), we can express the ratio for intermediate mode Rint only as a function of a/dF:
Here, we choose to compare our results to the ferrite grain size because it is more relevant in consequence of the previous results, but the same could be established with the martensite grain size.
Figure 11 shows the ratio calculated from the measured mean values compared to the proportional, inverse and intermediate ratios for the three loads L = 20 mN, 50 mN and 200 mN. The results are shown for a martensite volume fraction of αM = 50% as an example. The experimental hardness closely follows the intermediate mode until a/dF = 1. Indeed, when a/dF ≥ 1, this means that the contact size is greater than the ferrite grain size. Thus, the ferrite hardness measured and used for the calculation of the proportional, inverse and intermediate modes on the DP50(c) sample under a load of L = 200 mN might not be precise enough. Regardless, the results still allow us to observe that the average hardness of a sample with a given martensite volume fraction changes from the proportional to the inverse mode when the ratio a/dF increases—that is to say, when the load increases or when the ferrite grain size decreases.
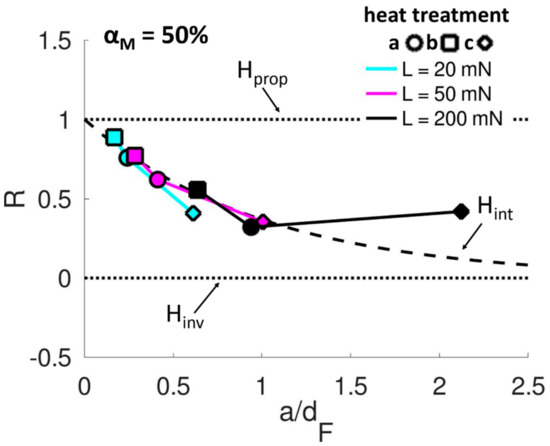
Figure 11.
Relative evolution of the measured mean hardness H as a function of the ratio of contact size over ferrite grain size a/dF under loads L = 20 mN, 50 mN and 200 mN compared to proportional, inverse and intermediate laws for samples with a martensite volume fraction αM = 50%.
For martensite volume fraction αM ≥ 50%, the results are similar. However, the intermediate mode remains closer to the proportional mode for a given ratio of contact size over ferrite grain size a/dF. Moreover, when the martensite volume fraction increases, the martensite hardness becomes more dominant over the ferrite hardness regardless of the mode considered. Consequently, the mean hardness increases while the differences between the proportional and inverse modes decrease.
Nonetheless, the results seem to correlate properly to the intermediate mode, which provides the criteria to determine the expected average hardness of a microstructure when knowing the ferrite and martensite hardness and grain size as well as the size of the contact.
3.2. Friction Coefficient and Specific Wear Resistance
Scratch tests were conducted on each sample with the three conical tips of attack angle β = 18.8°, 33.2° and 47.5° under normal loads of L = 20 mN, 50 mN and 200 mN. The friction coefficient and the specific wear resistance of ferrite and martensite are then calculated from scratch depth and friction force measurements, as detailed in the introduction to this paper.
First, we can correlate the friction coefficient µ and the specific wear resistance Ω of ferrite and martensite with their respective hardness, H, as shown on Figure 12. We can see that the friction coefficient of martensite decreases when the hardness increases and that this evolution is enhanced when the attack angle is higher. This effect could be explained by the change in the wear mechanism on martensite.
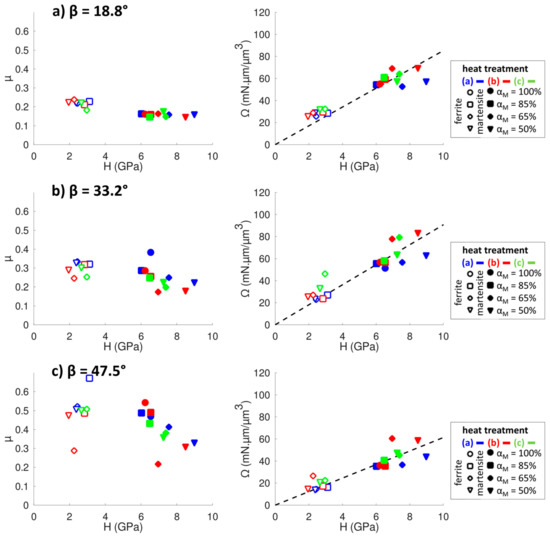
Figure 12.
Evolution of the friction coefficient µ and specific wear resistance Ω as functions of the hardness H for attack angles (a) β = 18.8°, (b) β = 33.2° and (c) β = 47.5°. All values are shown for a scratch under a load L = 50 mN.
Indeed, Figure 13 shows SEM images of the scratches for the three attack angles on one fully martensitic and three dual-phase microstructures with a martensite volume fraction of 50%. It is commonly accepted that the wear mechanisms can be ploughing, wedging or cutting depending on the attack angle of the asperity and the hardness of the material [25]. On martensite, we can observe that when the attack angle increases from β = 18.8° to β = 47.5°, the wear mechanism changes from ploughing to wedging and then cutting. The friction coefficient of martensite is then more influenced by the change in martensite hardness because the wear mechanism is closer to cutting. On the contrary, the wear mechanism for ferrite is mostly ploughing regardless of the attack angle. Then, the friction coefficient of ferrite is higher than the friction coefficient of martensite, but is less influenced by changes in ferrite hardness.
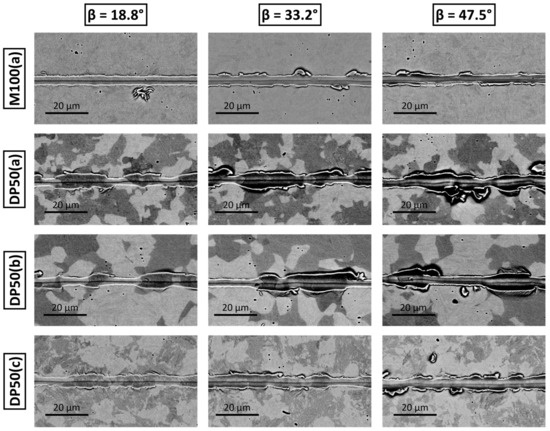
Figure 13.
SEM images of the scratches for attack angles of β = 18.8°, 33.2° and 47.5° under a load L = 50 mN for fully martensitic and dual-phase microstructures with a martensite volume fraction αM = 50%.
However, the differences between ferrite and martensite friction coefficients cannot be explained only from variations in hardness. Indeed, the friction coefficient should increase with the attack angle for all materials, which is what is observed in Figure 12. However, differences between materials are more often explained by the change in interfacial shear strength, either by directly influencing the ploughing friction coefficient or by adding an adhesive component to the friction [26,27,28]. Another explanation of a higher friction in ferrite could be that the friction coefficient on ferrite could be increased because of the presence of martensite in front of the tip when scratching in ferrite. In this case, we should observe an increase of the ferrite friction coefficient when the ferrite grain size decreases.
In the case of the specific wear resistance, we can see that it is directly proportional to the hardness and does not depend on the phase considered. Indeed, the definition of the specific wear resistance Ω shown in Equation (12) indicates that it is equal to the ratio of hardness H over the wear coefficient K. Then, we can calculate the wear coefficient K corresponding to each tip and load. Results are shown in Table 4. We can see that it increases with the load, but it increases with the attack angle only at higher loads.
Table 4.
Wear coefficient and regression coefficients obtained from Equations (25) to (28) for loads L = 20 mN, 50 mN and 200 mN and attack angles of β = 18.8°, 33.2° and 47.5°.
Then, we can estimate that friction and wear of ferrite and martensite are related to the properties of the microstructure in a similar way to the hardness. The friction and specific resistance of ferrite should follow a Hall–Petch type relationship with the ferrite grain size while those of martensite should be proportional to the carbon content:
Figure 14 shows the evolution of ferrite and martensite friction coefficient µ and specific wear resistance Ω as functions of the inverse of the square root of the ferrite grain size dF, martensite carbon content CM and martensite volume fraction αM, as well as the corresponding approximated laws in the case of a scratch with an attack angle of β = 18.8° under a load of L = 50 mN. The regression coefficients calculated for all attack angles and loads are shown in Table 4.
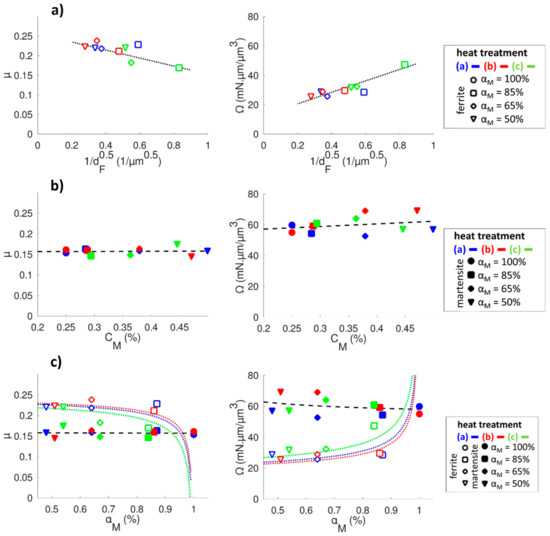
Figure 14.
Evolution of friction coefficient µ and specific wear resistance Ω as functions of (a) the inverse square root of the ferrite size dF for ferrite, (b) the martensite carbon content CM for martensite and (c) the martensite volume fraction αM for both ferrite and martensite under a load L = 50 mN and for scratches with an attack angle β = 18.8°.
The values measured during scratch tests present large variations, so it is hard to comment precisely the calculated values of the coefficients. However, the laws seems to be mostly respected in every case. In particular, they allow us to confirm the influence of attack angle on the variation of martensite friction with hardness. They also show that the ferrite friction coefficient tends to decrease with the ferrite grain size. Thus, the idea that the presence of martensite at the front of the tip when scratching in ferrite is responsible for the higher friction coefficient in ferrite than in martensite seems to be a subpar hypothesis.
4. Model for Friction and Wear Resistance
Axén et al. have defined models for the friction and wear of multiphase materials [13,14]. These models allow us to make a correlation between the individual phase friction and wear behavior and the macroscopic one. They are based on two hypotheses: the first one is the Equal Wear hypothesis (EW), for which the assumption is that the phases are worn at the same rate, with the hard phase supporting most of the pressure; the second one is the Equal Pressure hypothesis (EP), for which the assumption is that both phases are submitted to the same pressure and are worn independently.
Both models have been adapted for the case of dual-phase steels in our previous work [12]. The correlations expressing the total specific wear resistance and the total friction coefficient as functions of the ferrite and martensite individual behaviors for each mode should be, for Equal Wear:
and for Equal Pressure:
where αM is the martensite volume fraction, µM and µF are the friction coefficients and ΩM and ΩF are the specific wear resistances of martensite and ferrite, respectively.
Those two models are considered as the extreme behaviors of most tribological situations. Axén et al. have proposed an intermediate mode where the pressure distribution is defined as a fraction of the EP and EW mode at the same time [29].
In this study, we define the intermediate mode in a distinct way. Indeed, we can define the intermediate mode in the same way as we define it for the hardness, thanks to the measurement of grain sizes and the probability that the tip covers each phase. The two models are explicitly related in the case of the specific wear resistance. For a given attack angle and load, the specific wear resistances of the phase are related to their hardness by a unique value of the wear coefficient K. Thus, we have directly:
Then, by dividing Equation (18) by K, we have:
A similar expression is proposed for the friction coefficient:
In consequence, for low loads, the contact mode should be the Equal Wear mode, while at a higher load, the intermediate mode tends to approach the Equal Pressure mode.
Figure 15 shows the evolution of the mean friction coefficient as the function of the martensite volume fraction and the calculated EP, EW and intermediate modes in the case of scratches under a load of L = 50 mN, with an attack angle of β = 18.8° for each set of heat treatments. The mean friction coefficient always seems closer to the EP mode, while the mean specific wear resistance tends to follow the intermediate mode.
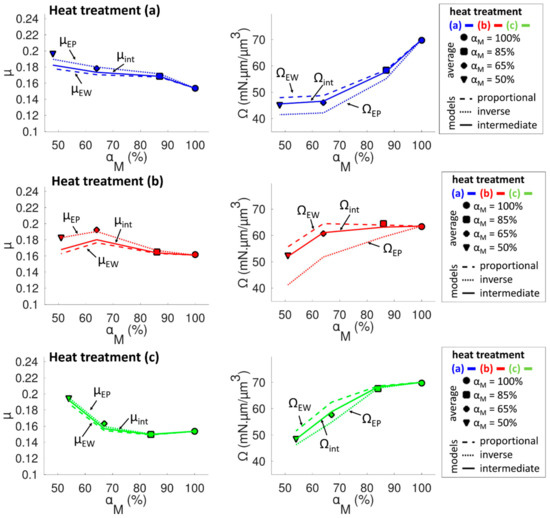
Figure 15.
Evolution of the experimental mean friction coefficient µ and specific wear resistance Ω as functions of martensite volume fraction αM for a scratch obtained with an attack angle β = 18.8° under a load L = 50 mN, and comparison to the calculated friction coefficient with EW, EP and intermediate laws.
The friction coefficient that only respects the EP model suggests that whatever the conditions, the total friction coefficient is only a weighted average of the ferrite and martensite friction coefficient.
In order to verify that the intermediate mode correctly represents the evolution of the specific wear resistance for all attack angles and loads, we also express the normalized ratio RΩ for the specific wear resistance Ω:
The normalized ratio for the intermediate mode Rint is the same as the ratio for hardness and depends only on martensite volume fraction αM and the ratio of contact size over ferrite grain size a/dF:
In the case of scratches with conical tips, the contact size is calculated from the measured contact depth and the known geometry of the tips.
Figure 16 represents the evolution of the normalized ratio RΩ as function of the ratio a/dF for samples with a martensite volume fraction αM = 50%. The results for scratch tests with the three attack angles β = 18.8°, 33.2° and 47.5° under the three loads L = 20 mN, 50 mN and 200 mN are all represented. For a/dF ≤ 1, all values are close to the intermediate mode. For a/dF ≥ 1, the calculation of the EW, EP and intermediate mode might not be precise enough because the specific wear resistance of ferrite measured when the scratch width is larger than the ferrite grain size might be influenced by surrounding martensite. Anyway, it seems that the attack angle has no influence on the relative value of the intermediate mode compare to the EP and EW mode.
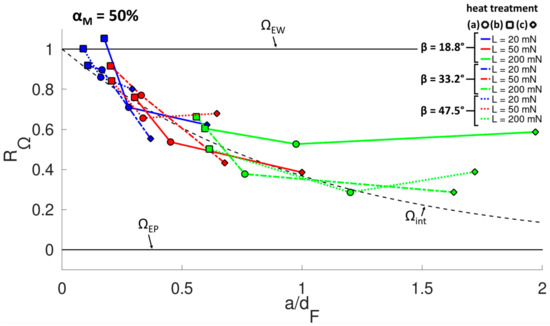
Figure 16.
Relative evolution of the measured specific wear resistance Ω as function of the ratio of contact size over ferrite grain size a/dF compared to EW, EP and intermediate laws. The values are for scratches found on samples with martensite volume fraction αM = 50% under loads L = 20 mN, 50 mN and 200 mN and with attack angles β = 18.8°, 33.2° and 47.5°.
For martensite volume fraction αM ≥ 50%, the same remarks made for hardness can be repeated. Indeed, the intermediate mode remains closer to the EW mode for a given ratio of contact size over ferrite grain size a/dF. Moreover, when the martensite volume fraction increases, the specific wear resistance of martensite becomes more dominant over ferrite, leading to an increase in specific wear resistance and a decrease in the difference between EW and EP modes.
These results show that the ratio of contact size over ferrite grain size might be a good criterion to anticipate the pressure distribution for specific wear resistance. Nonetheless, the global tribological behavior of dual-phase steel is influenced by numerous parameters. First, the individual behavior of ferrite and martensite are influenced by their grain size and their proportion in the microstructure. Martensite presents the highest wear resistance and the lowest friction coefficient, but as the martensite volume fraction increases, its wear resistance decreases and its friction coefficient increases. While the opposite trends observed for ferrite could compensate, especially if the ferrite grain size is low, the total wear resistance is influenced by the increase of the ratio of contact size to ferrite grain size that induces a transition from the EW conditions to the EP conditions, which suggests a lower wear resistance. Consequently, the choice for the microstructure parameters should be a compromise between martensite volume fraction and grain sizes. At a high martensite volume fraction, reducing the ferrite grain size should increase the total wear resistance and reduce the friction, whereas at low martensite volume fractions, minimizing the ferrite grain size should always reduce the friction but not necessarily increase the wear resistance.
Finally, it should be noted that those conclusions are validated in the case of scratch tests with a single abrasive asperity. However, the results are in accordance to previous results obtained by Trevisiol et al. on similar dual-phase microstructures at the macroscopic scale [6]. Indeed, by conducting a friction test against SiC grinding papers presenting various abrasive particle sizes, they have shown that the contact mode changes from Equal Wear to Equal Pressure when the particle size increases. The load applied during the tests is the same, and the contact conditions are many small contacts when the abrasive particles are smaller and fewer, but bigger contacts emerge when the abrasive particle size increases. Consequently, the increase of the contact size and of the ratio a/dF could explain the transition from EW mode to EP mode when the abrasive particle size increases. Finally, the results obtained at the scale of a single scratch with a single abrasive asperity are consistent with those of friction tests with an abrasive surface.
5. Conclusions
The friction and wear behaviors of dual-phase steels with similar composition and martensite volume fractions from 50% to 100%, but various grain sizes, are studied through scratch tests with conical tips of attack angles from 18.8° to 47.5° under loads from 20 mN to 200 mN. The friction coefficient and the specific wear resistance of the ferrite and martensite phases are measured at the microscopic scale and related to the microstructure properties and the phase hardness. It is shown that the friction coefficient and the specific wear resistance of martensite are proportional to its hardness through its carbon content, while those of ferrite are related to the ferrite size through the Hall–Petch law. The individual properties of the phase at the microscopic scale are then related to the macroscopic behavior of each microstructure thanks to the Equal Pressure and Equal Wear models for multiphase materials. Results show that the friction coefficient always follows the Equal Pressure model, while the specific wear resistance varies from the Equal Wear to the Equal Pressure model. It is shown that this transition in the behavior of the contact depends on the martensite volume fraction and the ratio of the scratch width to the ferrite grain size. These results should help form a better understanding of abrasive wear at the microscopic scale. This knowledge could help design materials that are more wear resistant, or improve machining processes based on abrasion like grinding, belt grinding or polishing.
Author Contributions
C.P., A.J. and P.-E.M. prepared tested materials; C.P. analyzed the microstructure and phase composition; C.P. carried out the indentation and scratching tests; C.P., A.J. and P.-E.M. analyzed and interpreted the results; C.P. wrote the paper; A.J. and P.-E.M. supervised this work. All authors have read and agreed to the published version of the manuscript.
Funding
This research received no external funding.
Institutional Review Board Statement
Not applicable.
Informed Consent Statement
Not applicable.
Data Availability Statement
The data presented in this study are available on request from the corresponding author.
Conflicts of Interest
The authors declare no conflict of interest.
References
- Saghafian, H.; Kheirandish, S. Correlating microstructural features with wear resistance of dual phase steel. Mater. Lett. 2007, 61, 3059–3063. [Google Scholar] [CrossRef]
- Modi, O.P.; Pandit, P.; Mondal, D.P.; Prasad, B.K.; Yegneswaran, A.H.; Chrysanthou, A. High-stress abrasive wear response of 0.2% carbon dual phase steel: Effects of microstructural features and experimental conditions. Mater. Sci. Eng. A 2007, 458, 303–311. [Google Scholar] [CrossRef]
- Abouei, V.; Saghafian, H.; Kheirandish, S. Dry Sliding Oxidative Wear in Plain Carbon Dual Phase Steel. J. Iron Steel Res. Int. 2007, 14, 43–48. [Google Scholar] [CrossRef]
- Tyagi, R.; Nath, S.K.; Ray, S. Effect of martensite content on friction and oxidative wear behavior of 0.42 Pct carbon dual-phase steel. Metall. Mater. Trans. A Phys. Metall. Mater. Sci. 2002, 33, 3479–3488. [Google Scholar] [CrossRef]
- Trevisiol, C.; Jourani, A.; Bouvier, S. Effect of Martensite Morphology on Tribological Behaviour of a Low-Alloy Steel. Metallogr. Microstruct. Anal. 2019, 8, 123–134. [Google Scholar] [CrossRef]
- Trevisiol, C.; Jourani, A.; Bouvier, S. Experimental study and modelling of the effect of microstructure on friction and wear mechanisms of low alloy steel. Mater. Res. Express 2017, 4, 125802. [Google Scholar] [CrossRef]
- Trevisiol, C.; Jourani, A.; Bouvier, S. Effect of microstructures with the same chemical composition and similar hardness levels on tribological behavior of a low alloy steel. Tribol. Int. 2018, 127, 389–403. [Google Scholar] [CrossRef]
- Mazaheri, Y.; Kermanpur, A.; Najafizadeh, A. Nanoindentation study of ferrite-martensite dual phase steels developed by a new thermomechanical processing. Mater. Sci. Eng. A 2015, 639, 8–14. [Google Scholar] [CrossRef]
- Delincé, M.; Jacques, P.J.; Pardoen, T. Separation of size-dependent strengthening contributions in fine-grained Dual Phase steels by nanoindentation. Acta Mater. 2006, 54, 3395–3404. [Google Scholar] [CrossRef]
- Kadkhodapour, J.; Schmauder, S.; Raabe, D.; Ziaei-Rad, S.; Weber, U.; Calcagnotto, M. Experimental and numerical study on geometrically necessary dislocations and non-homogeneous mechanical properties of the ferrite phase in dual phase steels. Acta Mater. 2011, 59, 4387–4394. [Google Scholar] [CrossRef]
- Farivar, H.; Richter, S.; Hans, M.; Schwedt, A.; Prahl, U.; Bleck, W. Experimental quantification of carbon gradients in martensite and its multi-scale effects in a DP steel. Mater. Sci. Eng. A 2018, 718, 250–259. [Google Scholar] [CrossRef]
- Penfornis, C.; Jourani, A.; Mazeran, P.E. Experimental and modelling study of the effect of martensite volume fraction on friction and wear of dual-phase steel at microscopic scale. Wear 2021, 484, 203878. [Google Scholar] [CrossRef]
- Axén, N.; Jacobson, S. A model for the abrasive wear resistance of multiphase materials. Wear 1994, 174, 187–199. [Google Scholar] [CrossRef]
- Axén, N.; Hutchings, I.M.; Jacobson, S. A model for the friction of multiphase materials in abrasion. Tribol. Int. 1996, 29, 467–475. [Google Scholar] [CrossRef]
- Axén, N.; Lundberg, B. Abrasive wear in intermediate mode of multiphase materials. Tribol. Int. 1995, 28, 523–529. [Google Scholar] [CrossRef]
- Loubet, J.L.; Bauer, M.; Tonck, A.; Bec, S.; Gauthier-Manuel, B. Nanoindentation with a surface force apparatus. In Mechanical Properties and Deformation Behavior of Materials Having Ultra-Fine Microstructures; Springer: Berlin/Heidelberg, Germany, 1993; ISBN 9789401047753. [Google Scholar]
- Oliver, W.C.; Pharr, G.M. An improved technique for determining hardness and elastic modulus using load and displacement sensing indentation experiments. J. Mater. Res. 1992, 7, 1564–1583. [Google Scholar] [CrossRef]
- Krauss, G. Martensite in steel: Strength and structure. Mater. Sci. Eng. A 1999, 273, 40–57. [Google Scholar] [CrossRef]
- Peng-Heng, C.; Preban, A.G. The effect of ferrite grain size and martensite volume fraction on the tensile properties of dual phase steel. Acta Metall. 1985, 33, 897–903. [Google Scholar] [CrossRef]
- Tabor, D. The Hardness of Metals; Oxford University Press: Oxford, UK, 1951. [Google Scholar] [CrossRef]
- Ashrafi, H.; Shamanian, M.; Emadi, R.; Saeidi, N. Correlation of Tensile Properties and Strain Hardening Behavior with Martensite Volume Fraction in Dual-Phase Steels. Trans. Indian Inst. Met. 2017, 70, 1575–1584. [Google Scholar] [CrossRef]
- Mazaheri, Y.; Kermanpur, A.; Najafizadeh, A. Strengthening Mechanisms of Ultrafine Grained Dual Phase Steels Developed by New Thermomechanical Processing. ISIJ Int. 2015, 55, 218–226. [Google Scholar] [CrossRef]
- Fereiduni, E.; Banadkouki, S.G. Reliability/unreliability of mixture rule in a low alloy ferrite-martensite dual phase steel. J. Alloys Compd. 2013, 577, 351–359. [Google Scholar] [CrossRef]
- Zhang, F.; Ruimi, A.; Wo, P.C.; Field, D.P. Morphology and distribution of martensite in dual phase (DP980) steel and its relation to the multiscale mechanical behavior. Mater. Sci. Eng. A 2016, 659, 93–103. [Google Scholar] [CrossRef]
- Hokkirigawa, K.; Kato, K.; Li, Z.Z. The effect of hardness on the transition of the abrasive wear mechanism of steels. Wear 1988, 123, 241–251. [Google Scholar] [CrossRef]
- Goddard, J.; Wilman, H. A Theory of Friction and Wear During the Abrasion of Metals. Wear 1962, 5, 114–135. [Google Scholar] [CrossRef]
- Sin, H.; Saka, N.; Suh, N.P. Abrasive wear mechanisms and the grit size effect. Wear 1979, 55, 163–190. [Google Scholar] [CrossRef]
- Subhash, G.; Zhang, W. Investigation of the overall friction coefficeint in single-pass scratch test. Wear 2002, 252, 123–134. [Google Scholar] [CrossRef]
- Axén, N.; Hutchings, I.M. Analysis of abrasive wear and friction behaviour of composites. Mater. Sci. Technol. 1996, 12, 757–765. [Google Scholar] [CrossRef]


Disclaimer/Publisher’s Note: The statements, opinions and data contained in all publications are solely those of the individual author(s) and contributor(s) and not of MDPI and/or the editor(s). MDPI and/or the editor(s) disclaim responsibility for any injury to people or property resulting from any ideas, methods, instructions or products referred to in the content. |
© 2023 by the authors. Licensee MDPI, Basel, Switzerland. This article is an open access article distributed under the terms and conditions of the Creative Commons Attribution (CC BY) license (https://creativecommons.org/licenses/by/4.0/).