Article

Investigating the Effects of Geometrical Parameters of Re-Entrant Cells of Aluminum 7075-T651 Auxetic Structures on Fatigue Life

by
Amir Ghiasvand
1,
Alireza Fayazi Khanigi
2,
John William Grimaldo Guerrero
3,
Hamed Aghajani Derazkola
4,*,
Jacek Tomków
5,*,
Anna Janeczek
5 and
Adrian Wolski
5
1
Department of Mechanical Engineering, University of Tabriz, Tabriz 5166616471, Iran
2
Department of Materials Science and Engineering, Tarbiat Modares University, Tehran 1435685553, Iran
3
Departamento de Energía, Univesidad de la Costa, Barranquilla 080001, Colombia
4
Department of Mechanics, Design and Industrial Management, University of Deusto, Avda Universidades 24, 48007 Bilbao, Spain
5
Faculty of Mechanical Engineering and Ship Technology, Gdansk University of Technology, 11/12 Gabriela Narutowicza Str., 80-229 Gdansk, Poland
*
Authors to whom correspondence should be addressed.
Coatings 2023, 13(2), 405; https://doi.org/10.3390/coatings13020405
Submission received: 26 December 2022 / Revised: 7 February 2023 / Accepted: 7 February 2023 / Published: 10 February 2023

Abstract

:
In this study, the effects of two geometrical parameters of the re-entrant auxetic cells, namely, internal cell angle ( θ ) and H/L ratio in which H is the cell height, and L is the cell length, have been studied on the variations of Poisson’s ratio and fatigue life of Aluminum 7075-T6 auxetic structures. Five different values of both the H/L ratio and angle θ were selected. Numerical simulations and fatigue life predictions have been conducted through the use of ABAQUS (version 2022) and MSC Fatigue (version 11.0) software. Results revealed that increases in both the H/L ratio and angle θ improved the average value of Poisson’s ratio. Increasing the H/L ratio from 1 to 1.4 and θ from 50° to 70° increased the values of Poisson’s ratio, respectively, 7.7% and 80%. In all angles, increasing the H/L values decreased the fatigue life of the structures significantly. Furthermore, in all H/L values, an increment in θ caused a reduction in fatigue life. The effects of H/L and θ parameters on fatigue life were dominant in the low cycle fatigue regime. Results also showed that the H/L ratio parameter had greater influence as compared to the θ angle, and the structures with higher auxeticity experienced higher fatigue resistance. It was found that the auxetic property of the structure has a direct relationship with the fatigue resistance of the structure. In all samples, structures with greater auxetic property had higher fatigue resistance.

1. Introduction

Poisson’s ratio is one the most important parameters for describing the mechanical behavior of materials undergoing various loadings. It defines the pattern of deformation and stress state within the material perpendicular to the loading direction. The value of Poisson’s ratio for a wide range of materials is positive; however, based on some thermodynamics considerations and strain energies in theory of elasticity, this quantity for some homogeneous isotropic solid materials can vary between 0.5 and −1. Theoretically, there are materials with negative Poisson ratios [1,2,3].
In recent decades, structures with negative Poisson ratios have been introduced named auxetic structures. According to Figure 1, these materials show different behaviors under various kinds of loadings compared to other materials which have positive Poisson ratios, so that when the structure undergoes a tension in longitudinal direction, it experiences a positive strain in lateral direction as well. The Poisson ratio of the structures can change with any variation in part geometry, properties, stiffness, and matrix characterization. The auxetic phenomenon is independent from the size of the component [4,5,6]. These characteristics are associated with the internal geometry of the part and with the deformation that occurs while undergoing an off-axis tension. The auxetic phenomenon has been seen in nano scale in materials such as silicates, in microscopic scale such as foams and polymers, and in macro scale such as re-entrant, chiral, and ant-chiral systems. Some auxetic materials can often be found in nature including cubic elemental metals, cristobalites, biological tissues, and bones [7].
A negative Poisson ratio is an abnormal property that can have significant effects on the mechanical properties of the structures such as corrosion resistance or roughness, compression, shear strength, and other aspects of the dynamic performance of the structure [8,9,10]. The auxetic structures show better practical performances as compared with those traditional structures which are widely used in different sectors such as automotive industries. A unique characteristic of an auxetic structure is its ability of shrinkage when undergoing the compression loads, enabling improvements in shear resistance, energy absorption, fracture toughness, and fatigue strength of the auxetic structure [11].
Although there has been an extensive number of studies dealing with the auxetic structures so far, most of the investigations have been concentrated on the behavior or performance of the structures subjected to the quasi-static or impact loads and their ability for energy absorption. Investigations regarding the fatigue strength of the auxetic structures can rarely be found in the literature. Choi et al. [12] studied the fracture toughness of two different copper foams with both positive and negative Poisson’s ratios. They evidenced that the fracture toughness of the auxetic structure was higher than that with positive Poisson’s ratio. Necember et al. [13] studied the effects of geometrical parameters of chiral auxetic cell on the mechanical properties and deformation patterns of the structure undergoing multiaxial loading conditions. They concluded that the geometrical parameters affected noticeably the mechanical response of the auxetic structure. Kramberger et al. [14] studied the impact of auxetic cell geometrical factors on the fracture behavior of the auxetic structures fabricated from Al 7075-T6 alloy. They showed that the cell geometry was the main factor in determining the crack propagation trajectory of the auxetic structure. Necember et al. [15] conducted numerical analysis and experimental tests to study the influence of re-entrant cell orientation on the fatigue crack initiation and crack growth in auxetic structures. They showed that the crack initiation occurred in the cell edges with maximum stress magnitudes. Bezazi et al. [16] studied the behavior of two different polyurethane foam structures with positive and negative Poisson ratios undergoing cyclic loads. They reported that the auxetic foam possessed higher fatigue strength compared to that with a positive Poisson ratio. Francesconi et al. [17] studied fatigue strength and crack propagation in two aluminum structures with both positive and negative Poisson ratios, numerically and experimentally. Their test results showed that the aluminum auxetic structure had greater fatigue life compared to the normal aluminum structure at similar load levels. Necember et al. [18] predicted low cycle fatigue lives in two different auxetic structures with re-entrant and chiral cells through conducting numerical analysis. They evidenced that the auxetic structures with chiral cells possessed higher fatigue life compared to those with re-entrant cells. Necember et al. [19] investigated fatigue behavior of the re-entrant and rotated re-entrant auxetic specimens made of Al-alloy 7075-T651. Two geometric layouts of the base unit cell were analyzed (re-entrant and rotated re-entrant structure). For the fatigue life calculation, the strain life approach was used, based on the Coffin–Manson model with a Morrow mean stress correction. The comparison between computational and experimental results regarding fatigue-life curves and observed fatigue failure path showed a reasonable agreement. Necember et al. [20] presented the experimental and computational analysis for determining the fatigue life of the auxetic cellular structures made of aluminum alloys. The experimental and computational results showed that the chiral and re-entrant auxetic structures have significantly different rigidity. Compared to the chiral auxetic specimen, the re-entrant auxetic specimen demonstrated approximately ten times higher rigidity at almost the same relative porosity (chiral structure 67%, reentrant structure 70%). Lvov et al. [21] proposed a three-dimensional auxetic structure and analyzed the mechanical characteristics using static and low-cycle compression tests. According to the tests results, auxetic structures are able to withstand cyclic loads longer than reverse non-auxetic cellular structures. Buckling at sufficiently low strain causes stresses along the rods that form an auxetic structure. Necembe et al. [22] investigated the fatigue behavior of the re-entrant auxetic structures made of the aluminum alloy AA 7075-T651. The influence of the unit cell orientation on the crack path and fatigue life was studied using experimental and computational approaches. The experimental and computational results showed that the unit cell’s orientation has a minor influence on the fatigue life of both analyzed auxetic structures, but impact on the direction of the fatigue failure path significantly. Ulbin et al. [23] studied the effects of fillet radius of the auxetic cell on the fatigue life of the auxetic structures subjected to the cyclic loads. Based on the variations in the fillet radius, five different samples with negative Poisson ratios were examined. Results revealed that in decreasing the Poisson ratio, the fatigue life increased. Michalski and Strek [24] studied the high-cycle fatigue phenomenon in re-entrant auxetic and hexagonal honeycomb cells. They reported that re-entrant auxetic cell experienced higher fatigue lives as compared to hexagonal honeycomb cell structure.
Since the number of works regarding fatigue life of auxetic structures are very limited, further investigations on fatigue strength of these structures are necessary. More specifically, there have been no comprehensive investigations in the literature dealing with the effects of geometrical features of the re-entrant auxetic cells on fatigue life of the structures. It has been mentioned in the research literature that resistance to fatigue loading of auxetic structures has a direct relationship with the auxeticity property of the structure, but the parametric investigation in this field has not been conducted so far. It is considered that in the available literature, no research has discussed the effect of geometrical parameters of the re-entrant cell on the fatigue life of the structure. Therefore, in the current research, these two effective parameters (H/L ratio and θ) are used, and the effect of these parameters on the auxeticity property and fatigue life is investigated. This study intends to examine the effects of geometrical parameters of re-entrant auxetic cells on both Poisson’s ratio and fatigue life of the Al 7075-T6 auxetic structures. To do so, numerical simulations and fatigue life predictions were performed through the use of ABAQUS and MSC Fatigue FE software. The implemented method was validated through appropriate case studies and the experimental test data available in the literature.

2. Numerical Simulations

2.1. Subsection

The stress analysis of the auxetic structures was performed through ABAQUS FEA package. To this end, first, the re-entrant auxetic structures were designed as shown in Figure 2.
In a re-entrant auxetic cell, L is the length, H is the height, and θ is the internal angle of the cell. In this study, the effects of two geometrical parameters, namely, H/L and θ , were examined on the Poisson ratio and fatigue life of auxetic structures. Each mentioned factor was studied in five different levels. Table 1 shows all studied factors and their levels. In order to investigate comprehensive interactions between the two mentioned factors, a full factorial design was used in the numerical simulations. In total, 50 auxetic samples were designed and modelled. Among the models, 25 samples were utilized for examining the variations in Poisson ratios and the rest were used for fatigue life predictions. For all samples, the cell length L was set to be 10 mm, and the thickness of the structure’s depth was considered to be 2 mm. It is worth mentioning that the strut thickness parameter was designed in such a way that the structure’s mass for all samples was the same, enabling to have a better comparison between the results.
Samples with different dimensions were utilized to assess the Poisson ratios and fatigue lives. To obtain Poisson ratios, samples with the dimensions of 60 × 60 mm were modelled, while to predict fatigue lives, the auxetic structures which have been introduced in Ref. [25] were employed. In order to apply a uniform load to the whole auxetic structures, thin films were placed at both ends of the structures. This enables the load to be distributed in the central part of the structures. The width of these thin films was constant and considered to be 3 mm for all models. The schematic view of the samples’ geometry used for assessing Poisson’s ratio and fatigue lives are illustrated, respectively, in Figure 3a,b.
The two-dimensional plain stress CPS4R Lagrangian elements were used in numerical modelling and simulations. A mesh-sensitivity analysis was performed to obtain an optimum mesh size. Based on this analysis, the ratio of mesh size to cell thickness was selected to be 0.2. Figure 3c illustrates the meshed model and mesh pattern in a re-entrant auxetic cell.

2.2. Material Properties, Loading, and Boundary Conditions

The aluminum 7075-T6 alloy was used for the auxetic structures undergoing static and cyclic loadings. The mechanical properties of the aluminum 7075-T6 alloy which has been extracted from the literature and assigned to the ABAQUS and MSC Fatigue software are listed in Table 2. In the simulations for performing the static and fatigue analyses, two different steps were carried out. In the first step, ABAQUS software was employed to assess the Poisson ratios of the auxetic structures subjected to static loads. To do so, the geometrical conditions, material properties, and loading type were assigned to the software. Then, all 25 auxetic structures were subjected to a displacement-controlled loading until the tensile strain reached to 0.1. After that, each sample was numerically analyzed, and the initial Poisson ratios, as well as the variations in the average magnitudes of the Poisson ratios with the strain values, were calculated. In the second step, the remaining 25 fatigue sample models were subjected to cyclic loads with the load ratio of 0.1. Fatigue life predictions for each auxetic structure were conducted at five different strain levels. Stress analysis was carried out in ABAQUS software, and the results of the stress states were imported to the MSC Fatigue software to predict fatigue lives. The authors of [25] chose the same material and experimental fatigue tests. It should be noted that the aforementioned reference was used only for the verification stage. Considering that in auxetic structures, the main factor affecting the auxetic properties of the structure is the geometrical parameters of the cells that make up the structure. In re-entrant cells, the geometrical parameters of the H/L ratio, the thickness of the cell arm, and θ are three geometrical parameters, and by changing each of these parameters, the structure’s response against loading changes drastically.
According to the amount of loading of the samples and the presence of plastic behavior in the auxetic structures under the load investigated in this research, the bilinear elastic–plastic physical material model has been used to define the behavior of the material. The parameters required to develop this model are given in Table 2. It should be noted that the hardening is also considered as Isotropic. Each of the fatigue analyzes carried out in the present research is performed as follows:
  • In the first stage, stress analysis has been performed in Abaqus software. In the stress analysis stage, considering that the loading has exceeded the elastic limit, it is necessary to repeat the loading cycles until the shape of the stress cycles becomes stable. Therefore, to stabilize each of the models, 50 cycles have been simulated so that the stress becomes stable and can be used in the next step;
  • In the second stage, the results of the stabilized stress analysis have been imported into the fatigue life estimation software, and the fatigue life estimation for each model has been performed by the fatigue model mentioned in the text of the article and the parameters presented in Table 2.

2.3. Fatigue Life Prediction

Fatigue fracture can take place at any number of cyclic reversals depending on the load levels and other test conditions. High cycle fatigue (HCF) and low cycle fatigue (LCF) regimes are usually defined based on a transition fatigue life ( N t ). Normally, reversals lower than 104 are classified as LCF and greater than 104 cycles are categorized as HCF [26]. In HCF, elastic strains are dominant since the plastic strain magnitudes are very small and can be negligible as opposed to LCF conditions. The strain-based approaches are usually utilized to predict fatigue life of structures based on the strain components and their ranges. This approach is suitable to predict the fatigue life of metallic parts especially in low cycle fatigue regime. An appropriate strategy to perform the fatigue analysis is to consider both elastic and plastic strain components and develop the method based on their magnitudes. The Manson–Coffin criterion has been developed based on the above-mentioned concept [27].
ε 2 = σ f E ( 2 N f ) b + ε f ( 2 N f ) c
In this equation, ε is the strain range, E is the elastic modulus, and N f is the number of cycles to failure. Furthermore, σ f , ε f , b, and c are, respectively, the fatigue strength coefficient, fatigue ductility coefficient, fatigue strength exponent, and fatigue ductility exponent. It is worth mentioning that, in the Manson–Coffin criterion, the effects of mean stress ( σ m ) has not been included. A number of criteria have been proposed to consider the effects of mean stress [28]. In a criterion which has been proposed by Smith–Watson–Topper (SWT) for each mean stress condition, the product of maximum stress ( σ m a x ) and strain amplitude ( ε a ) has been considered to be equal to that of completely reversed condition at a same number of cycles to failure. The SWT criterion can be expressed as follows [29]:
σ m a x ε 2 = ( σ f ) 2 E ( 2 N f ) 2 b + σ f ε f ( 2 N f ) b + c
It has been proven that the SWT parameter led to appropriate results for a wide range of aluminum alloys [30]. However, this criterion can lead to erroneous results for loading conditions with negative mean stresses. In this study, the selected material is an aluminum alloy [31], and mean stresses are non-zero positive values; therefore, it seems that the SWT criterion is a suitable method for fatigue life predictions [32]. The fatigue parameters of Al 7075-T6 alloy required for the SWT criterion are summarized in Table 2.

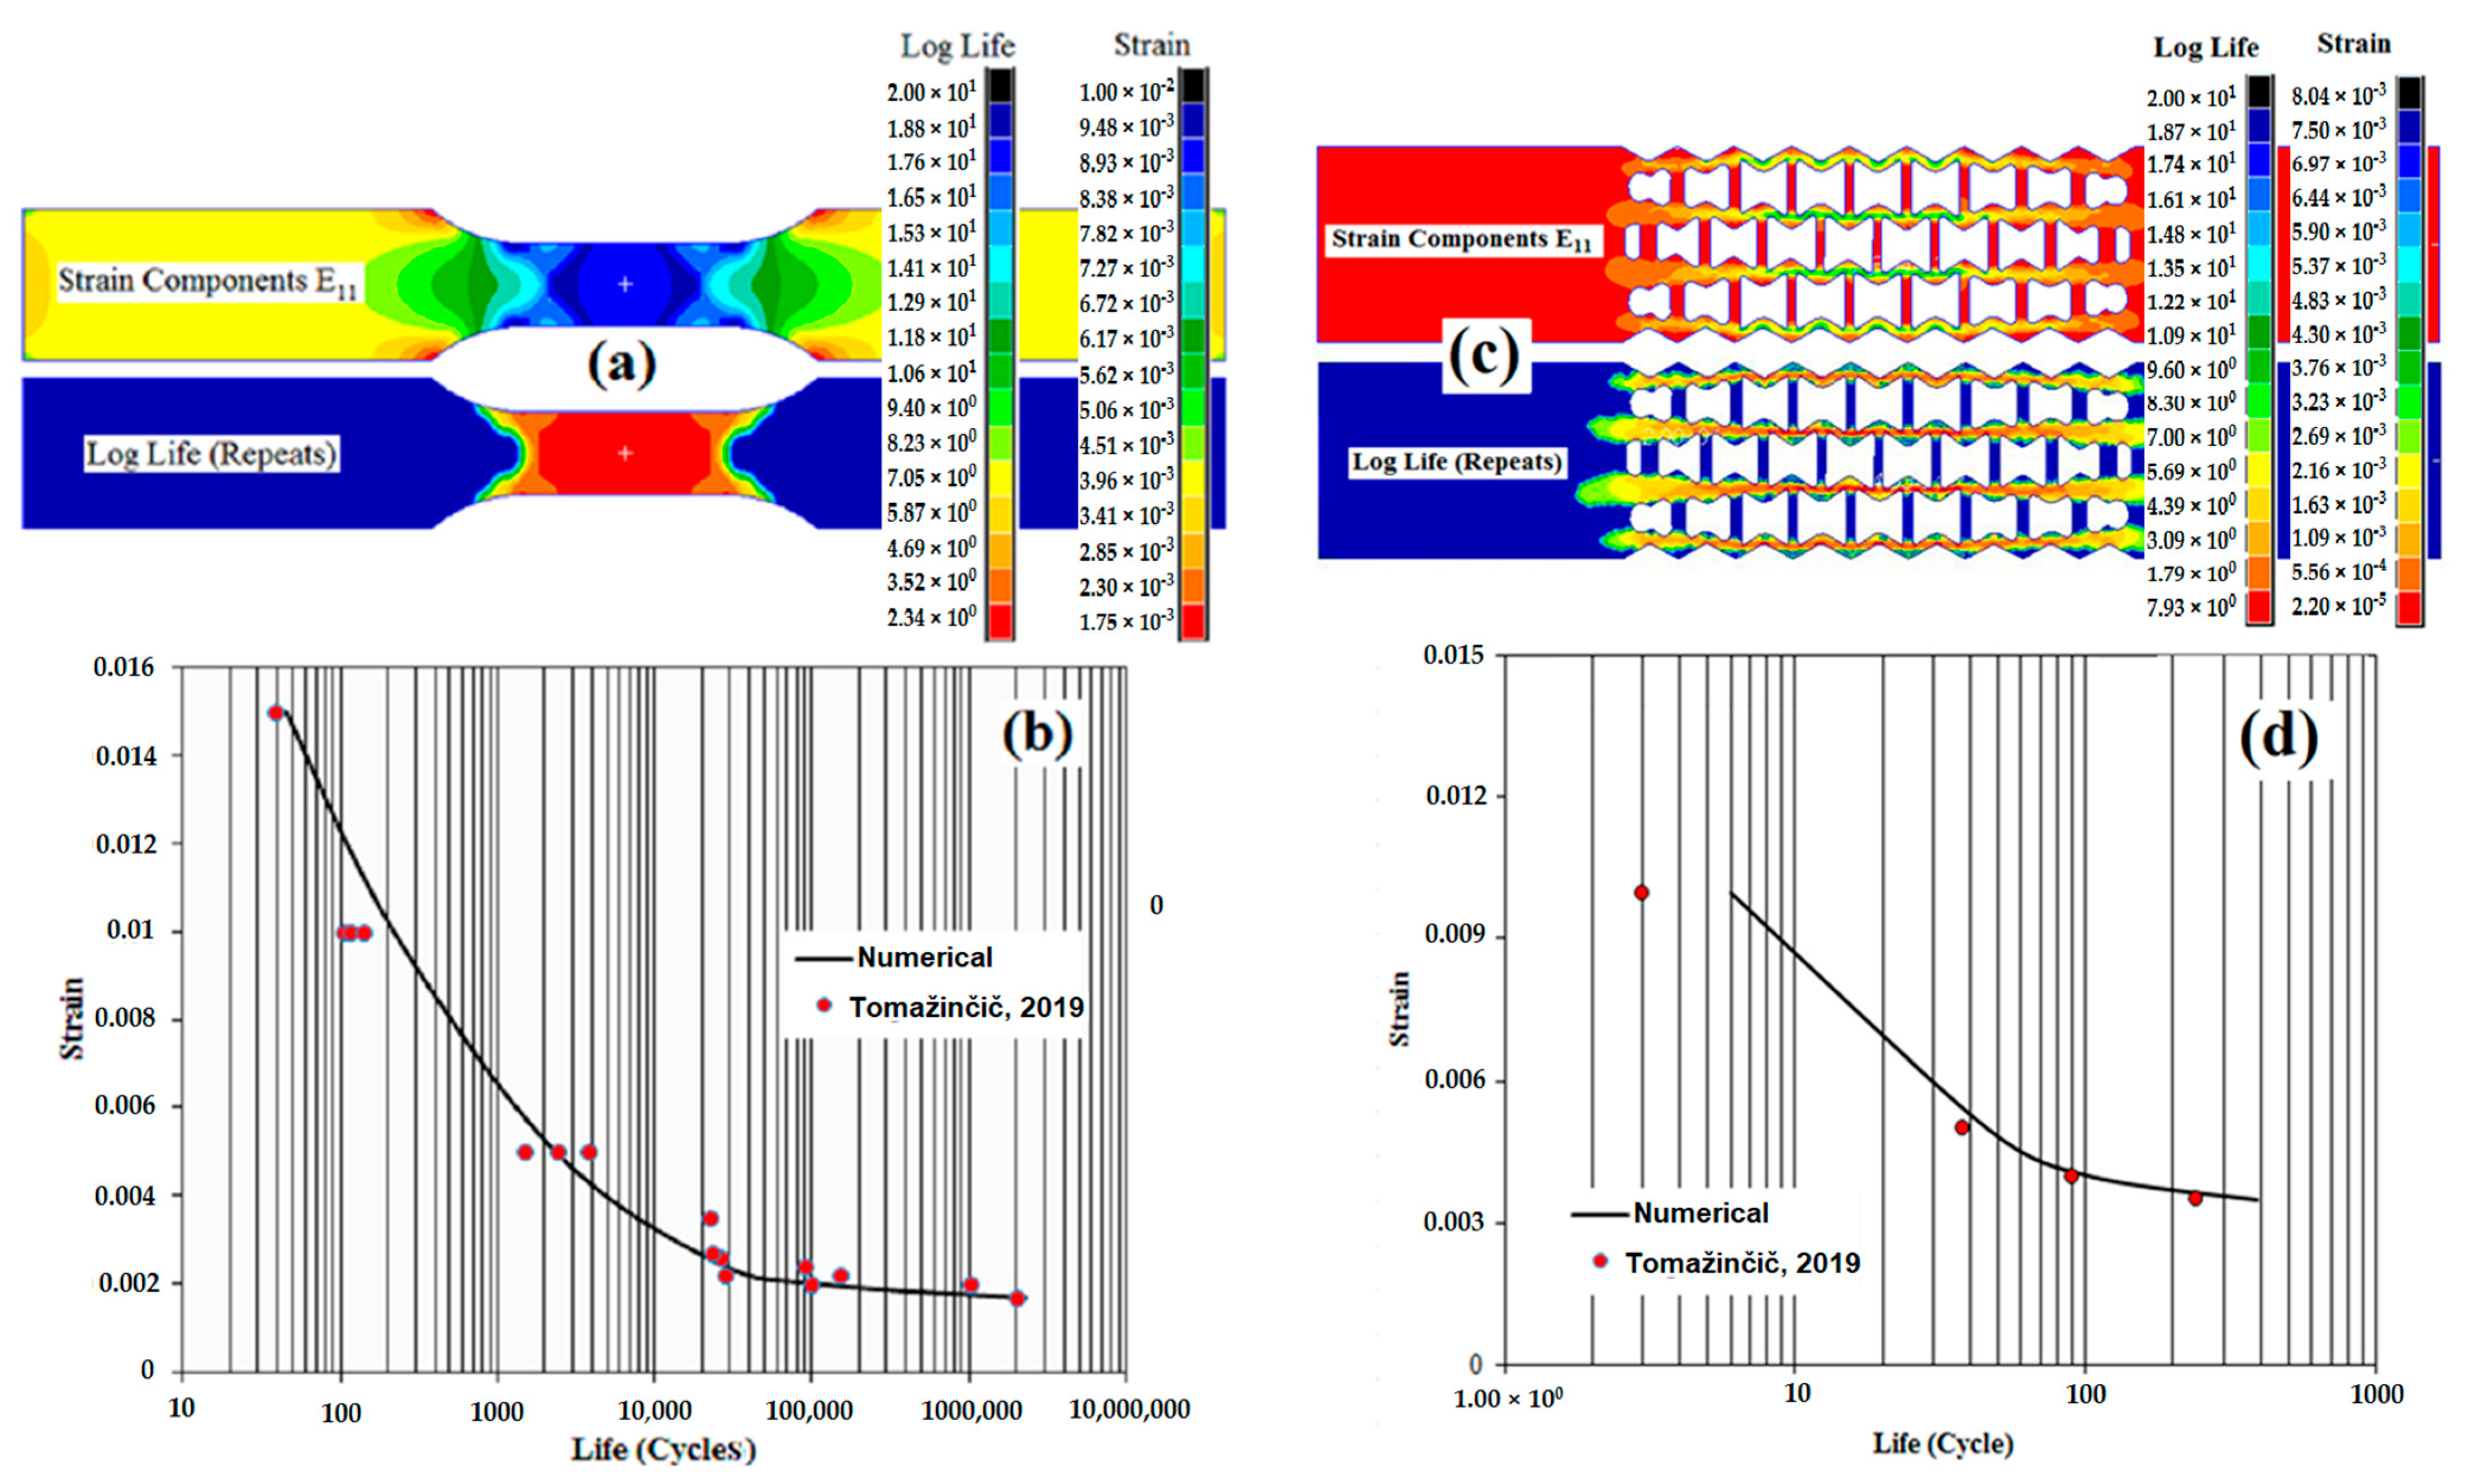
3. Verification Procedure

One of the necessities and prerequisites of any numerical models such as finite element methods is implementing and conducting the validation process.
To ensure the accuracy and correctness of the numerical models, the validation results need to be reported prior to present other results of the simulations. In this study, to validate the results of simulations, a comparison made between the experimental data available in the literature and the numerical results of two different specimens undergoing both static and cyclic loads. To this end, some numerical models of the standard fatigue specimens, as well as the auxetic fatigue samples similar to those used in Ref. [25], were created and the results were compared with associated fatigue test data. The dimensions of the standard fatigue sample were in accordance with the ASTM-E606 standard. The geometry of the studied fatigue samples for validation process are shown in Figure 4.

4. Results and Discussions

4.1. Results of Case Studies for Validation

Figure 5a shows the fatigue life and strain contours of the standard fatigue sample at 0.01 strain level. Figure 5b depicts the numerically obtained strain versus fatigue life curve of the standard fatigue sample, and compares the numerical results with experimental test data. The results show that the maximum strain component (E11) was in the sample’s center, near 0.01. Similarly, to maximum strain, the maximum fatigue life predicted in the center of the sample was 234 repeats. Figure 5c presents the simulation results of strain distribution and fatigue life of auxetic sample. Figure 5d compares the numerically obtained fatigue lives of the auxetic fatigue samples with experimental fatigue test data. As seen in Figure 5b,d, the numerically obtained fatigue lives are in good agreement with the experimental fatigue test data. This accuracy between the results proves the reliability of the procedure used for other case studies.

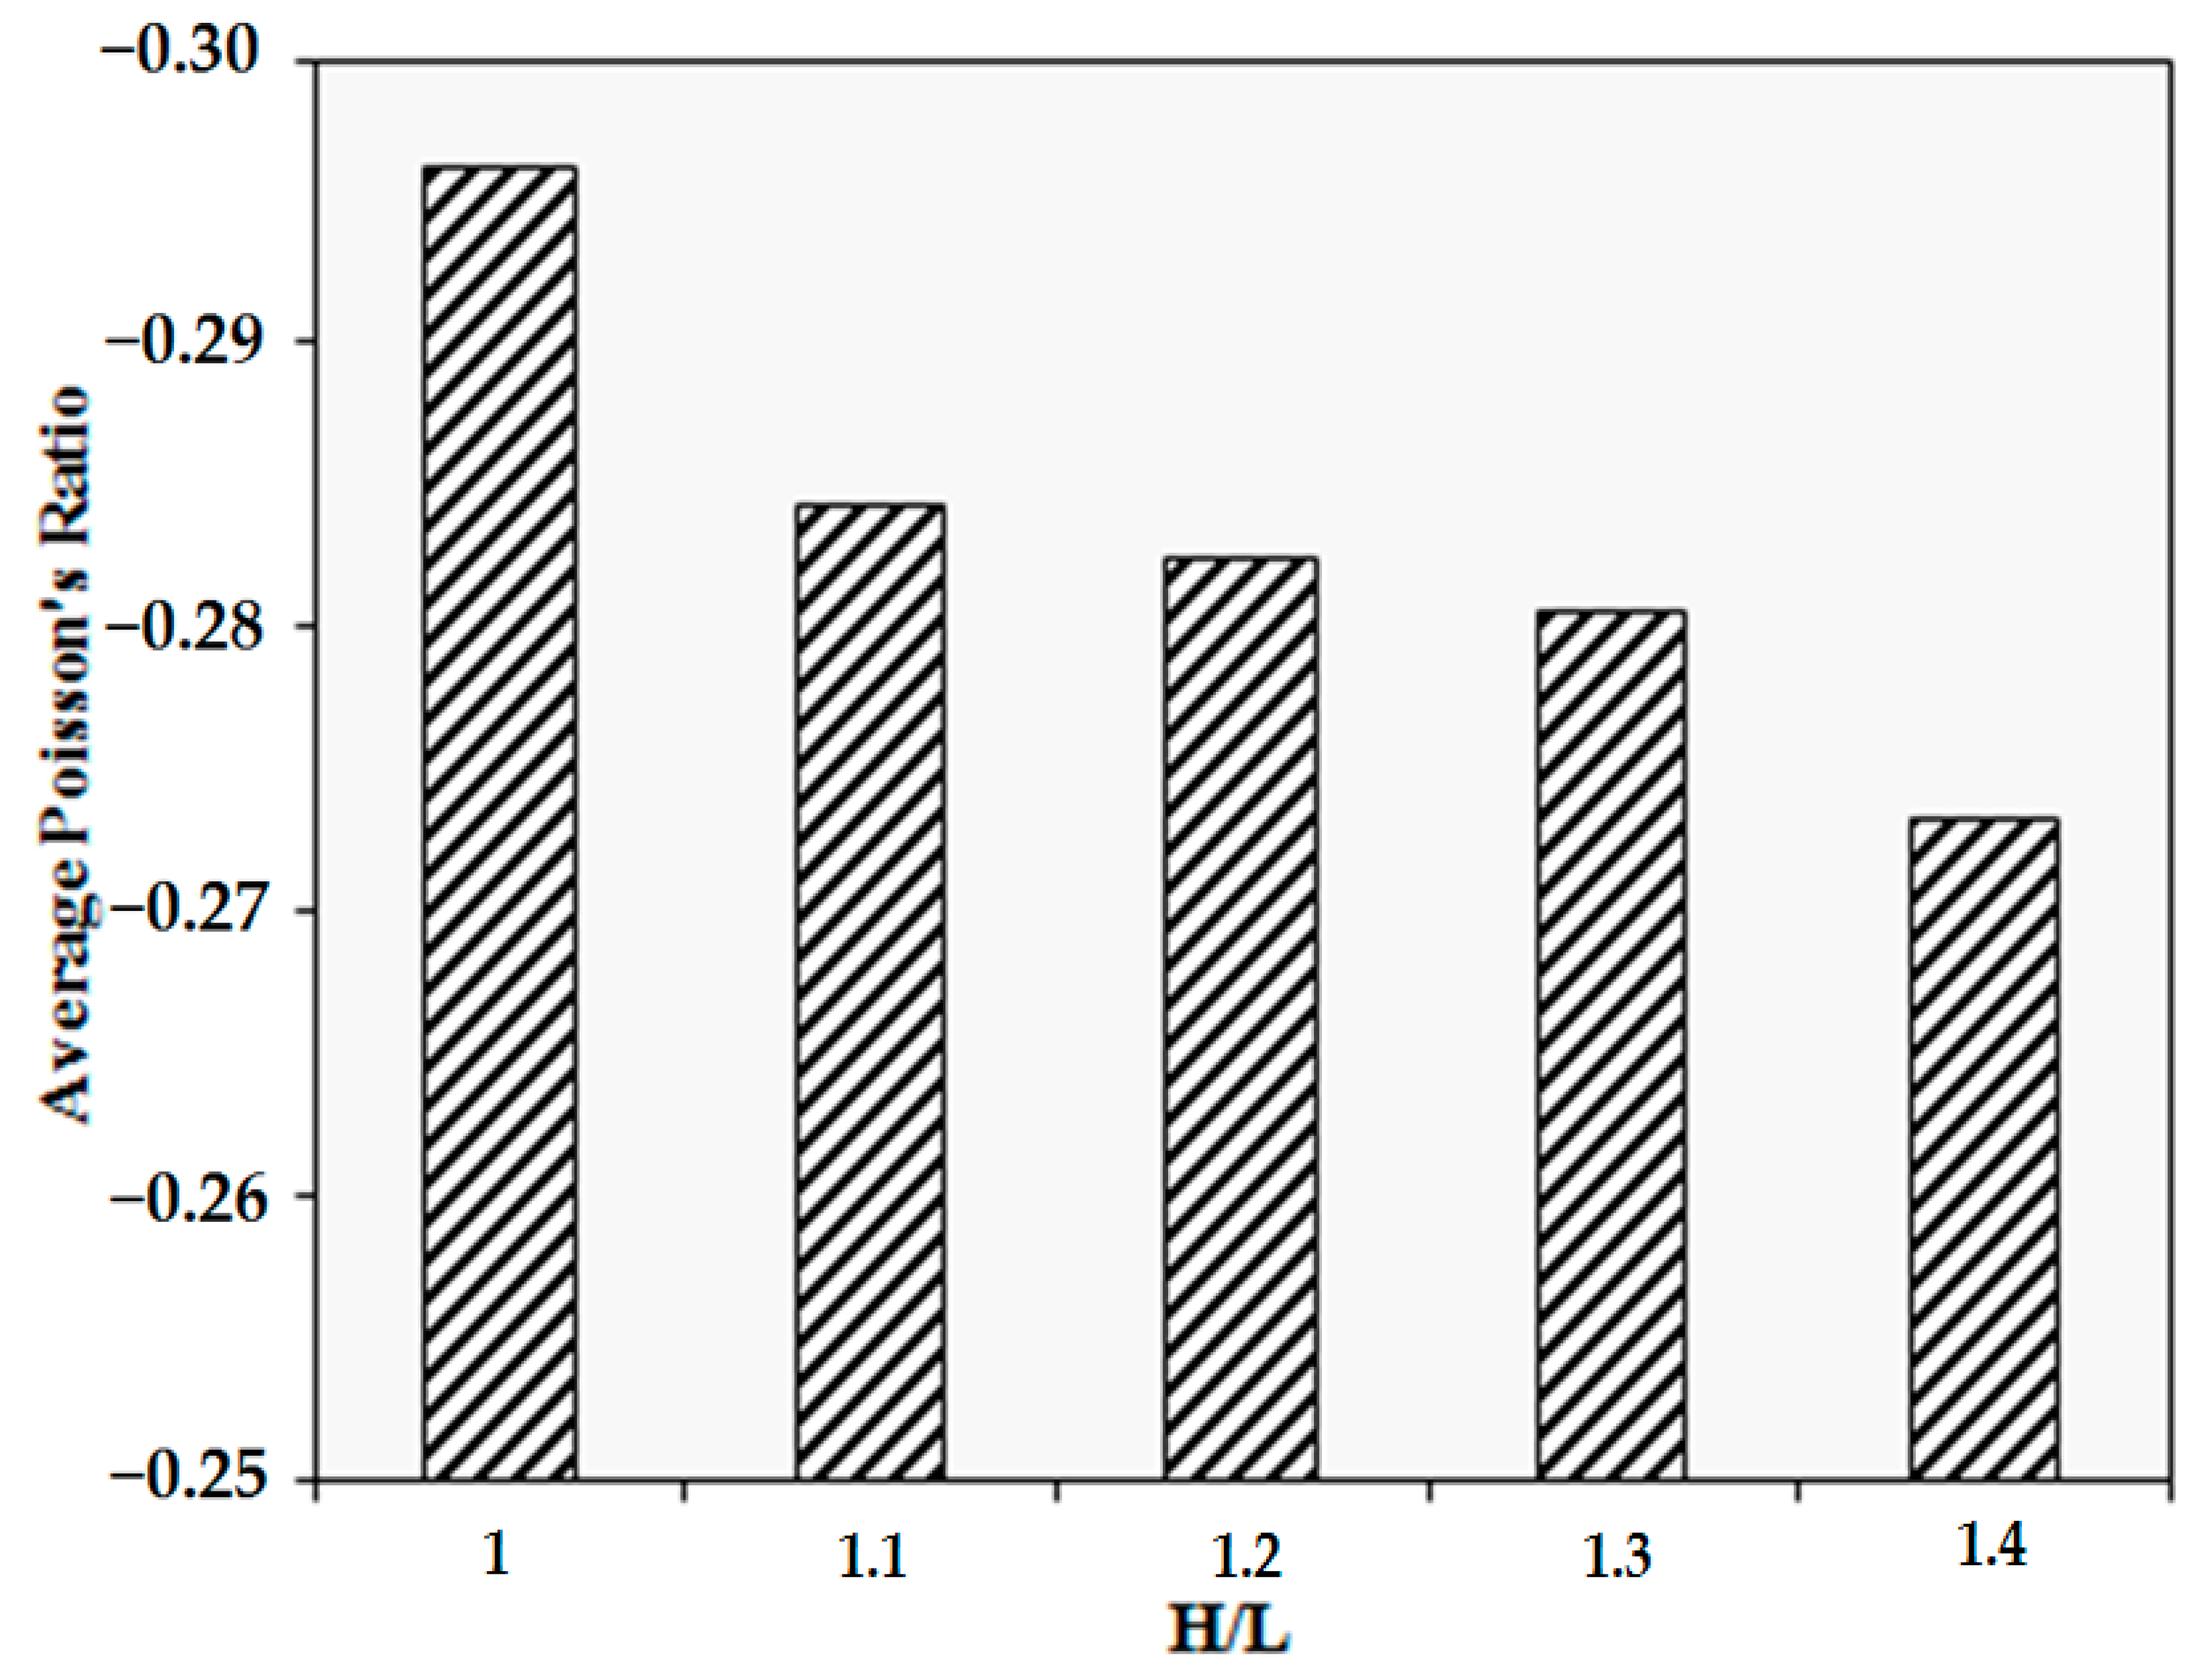
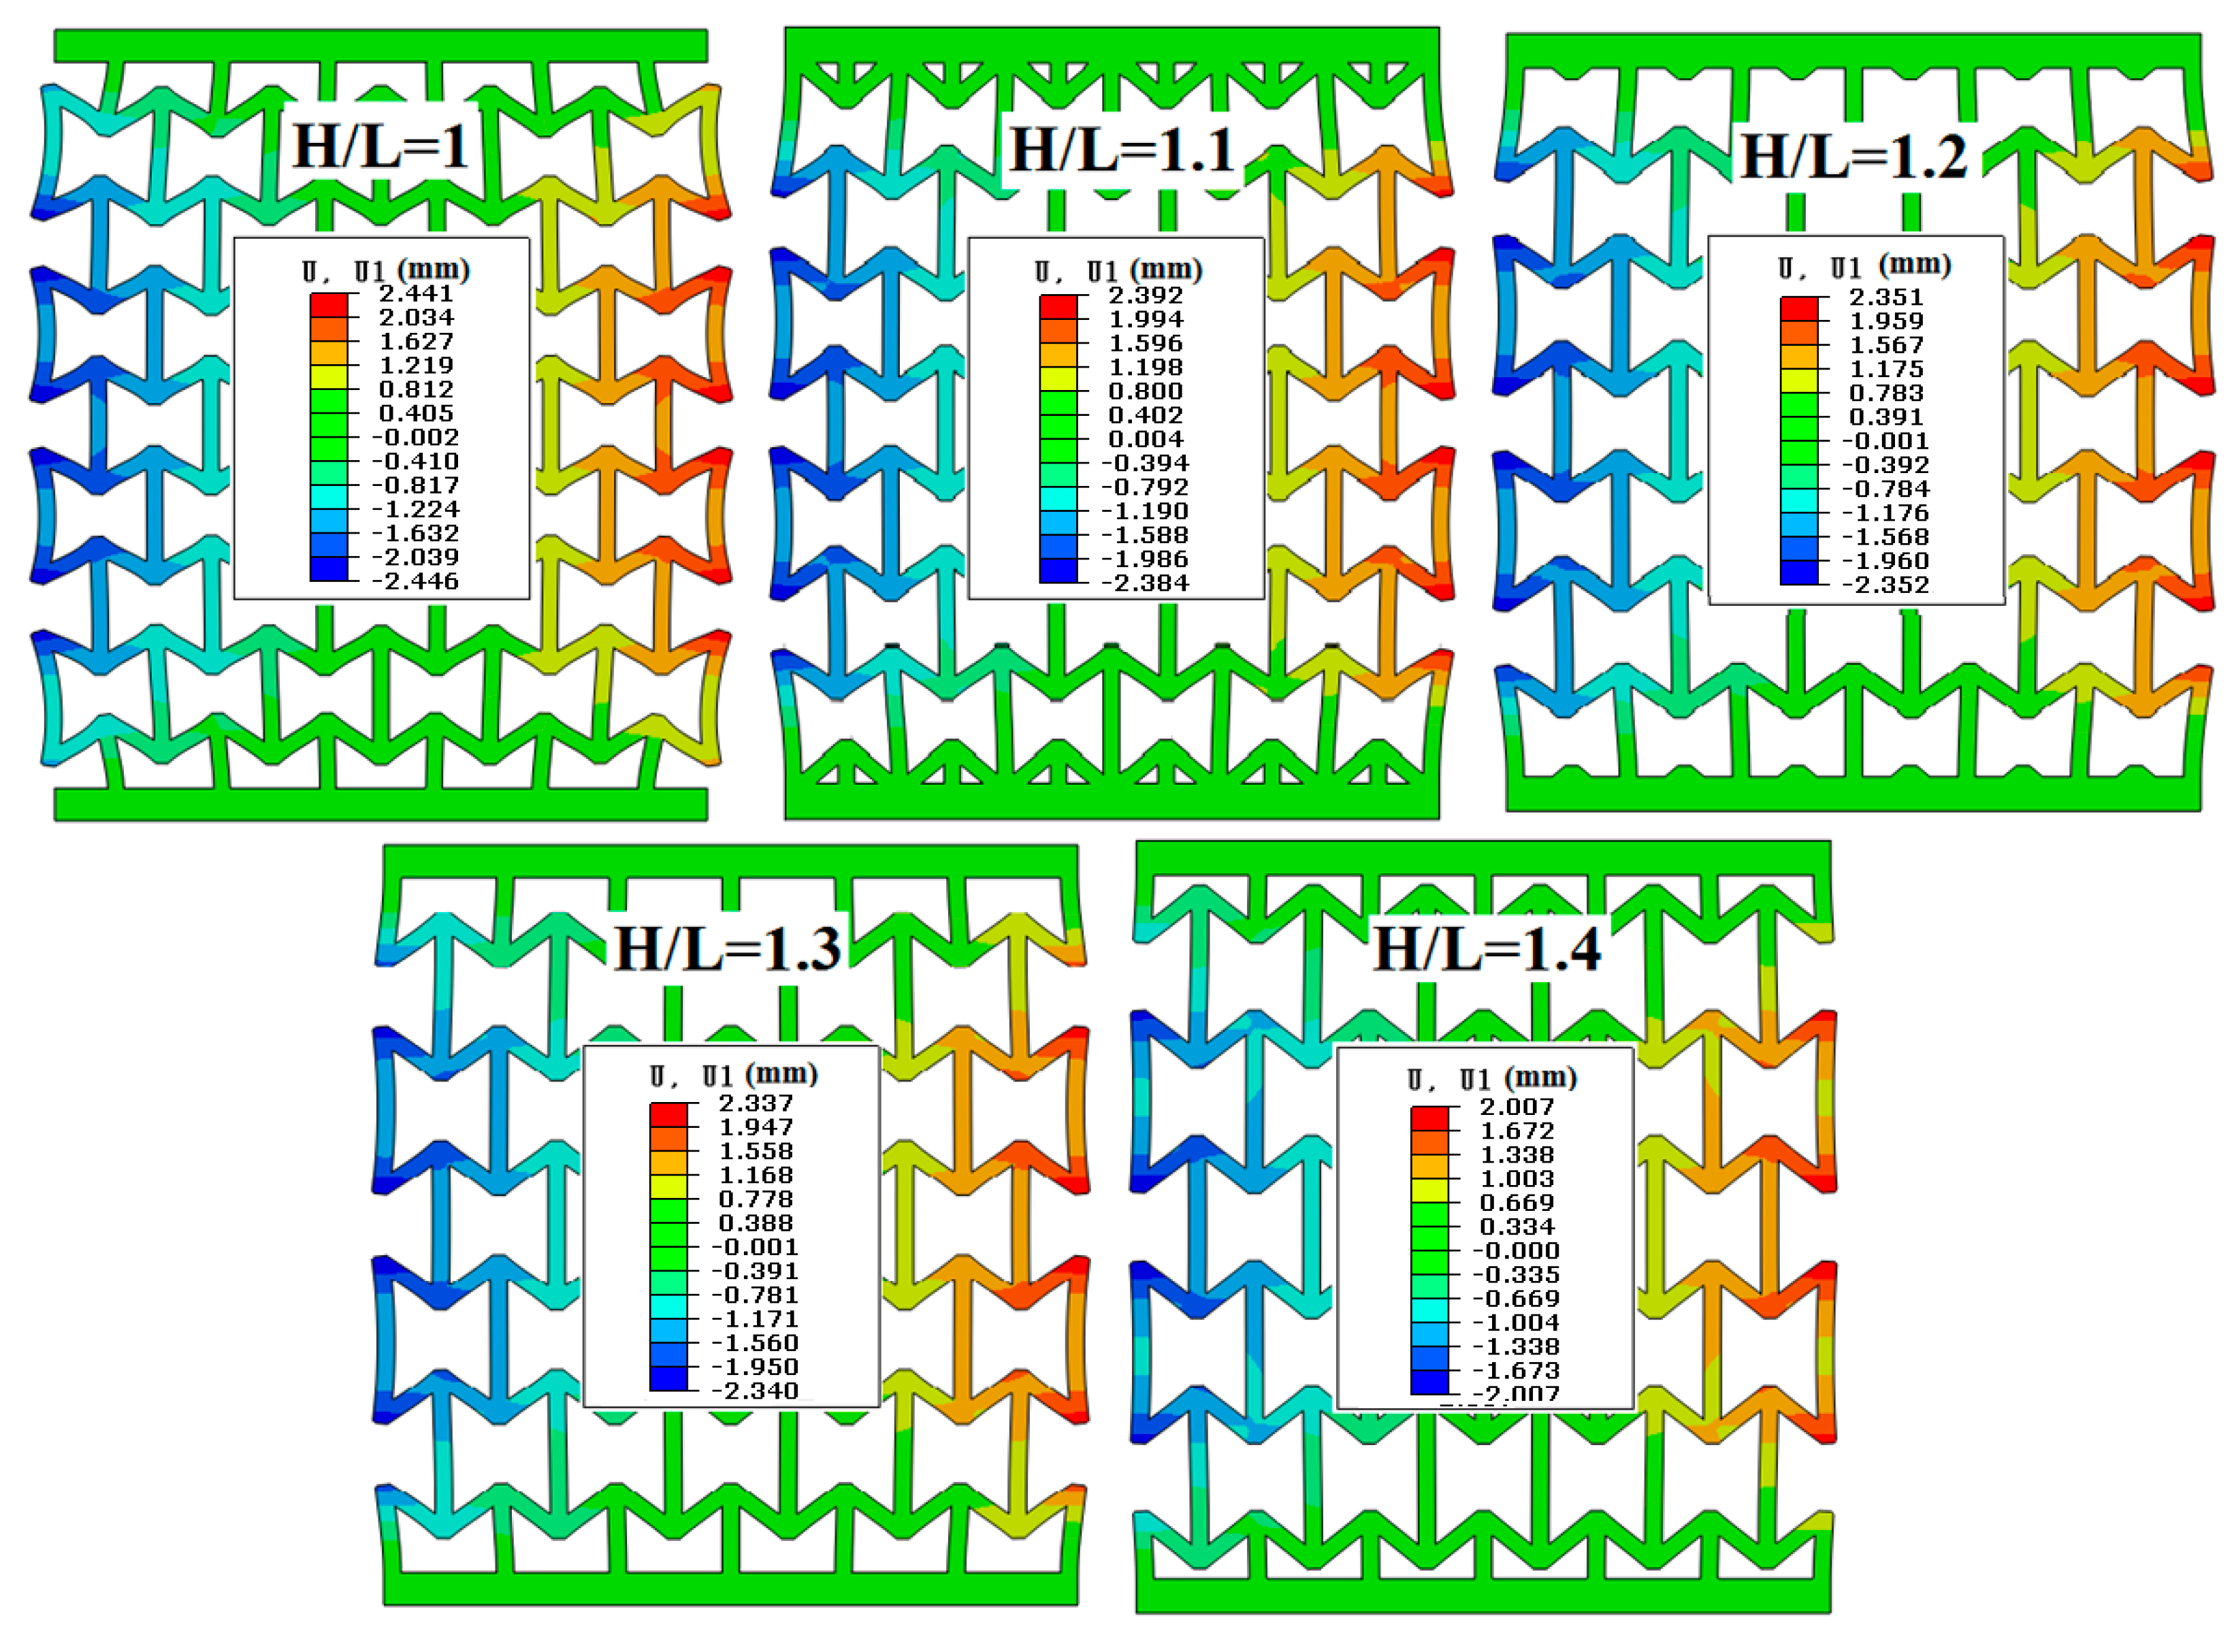
4.2. Effects of H/L Parameter on Poisson’s Ratio

The influence of variation of height to the length of the re-entrant cell has been studied on Poisson ratios of different auxetic structures. Figure 6 shows the variations of the average of the Poisson ratios of the auxetic structures versus H/L ratios. As seen, any geometrical changes in the re-entrant cell led to a relatively slight variation in Poisson ratios. In the case of constant cell’s length, increasing in cell’s height resulted in an improvement in the Poisson ratio of the structure. As an average, an increment in H/L ratio from 1 to 1.4 led to 7.7% increase in the average value of the Poisson ratio.
The behavior of auxetic cells subjected to different loadings and deformation patterns vary with the cell’s dimensional ratios [30,31]. In general, with increasing the cell’s height, the number of cells along the loading direction decrease, leading to an increase in the length of longitudinal arms of the cells and a reduction in transverse displacements. As an example, a deformation pattern in an auxetic structure in θ = 50 ° and various H/L values is shown in Figure 7. As can be seen in Figure 7, in structures with a larger H/L ratio, the amount of displacement in the direction perpendicular to the loading has decreased. By reducing the transverse displacement of the sample under the same axial loading, the Poisson ratio of the structure decreases. The changes in Poisson ratio in three H/L ratios of 1.1, 1.2, and 1.3 are small, but when this ratio reaches 1.4, the increase in Poisson ratio occurs with a larger slope.

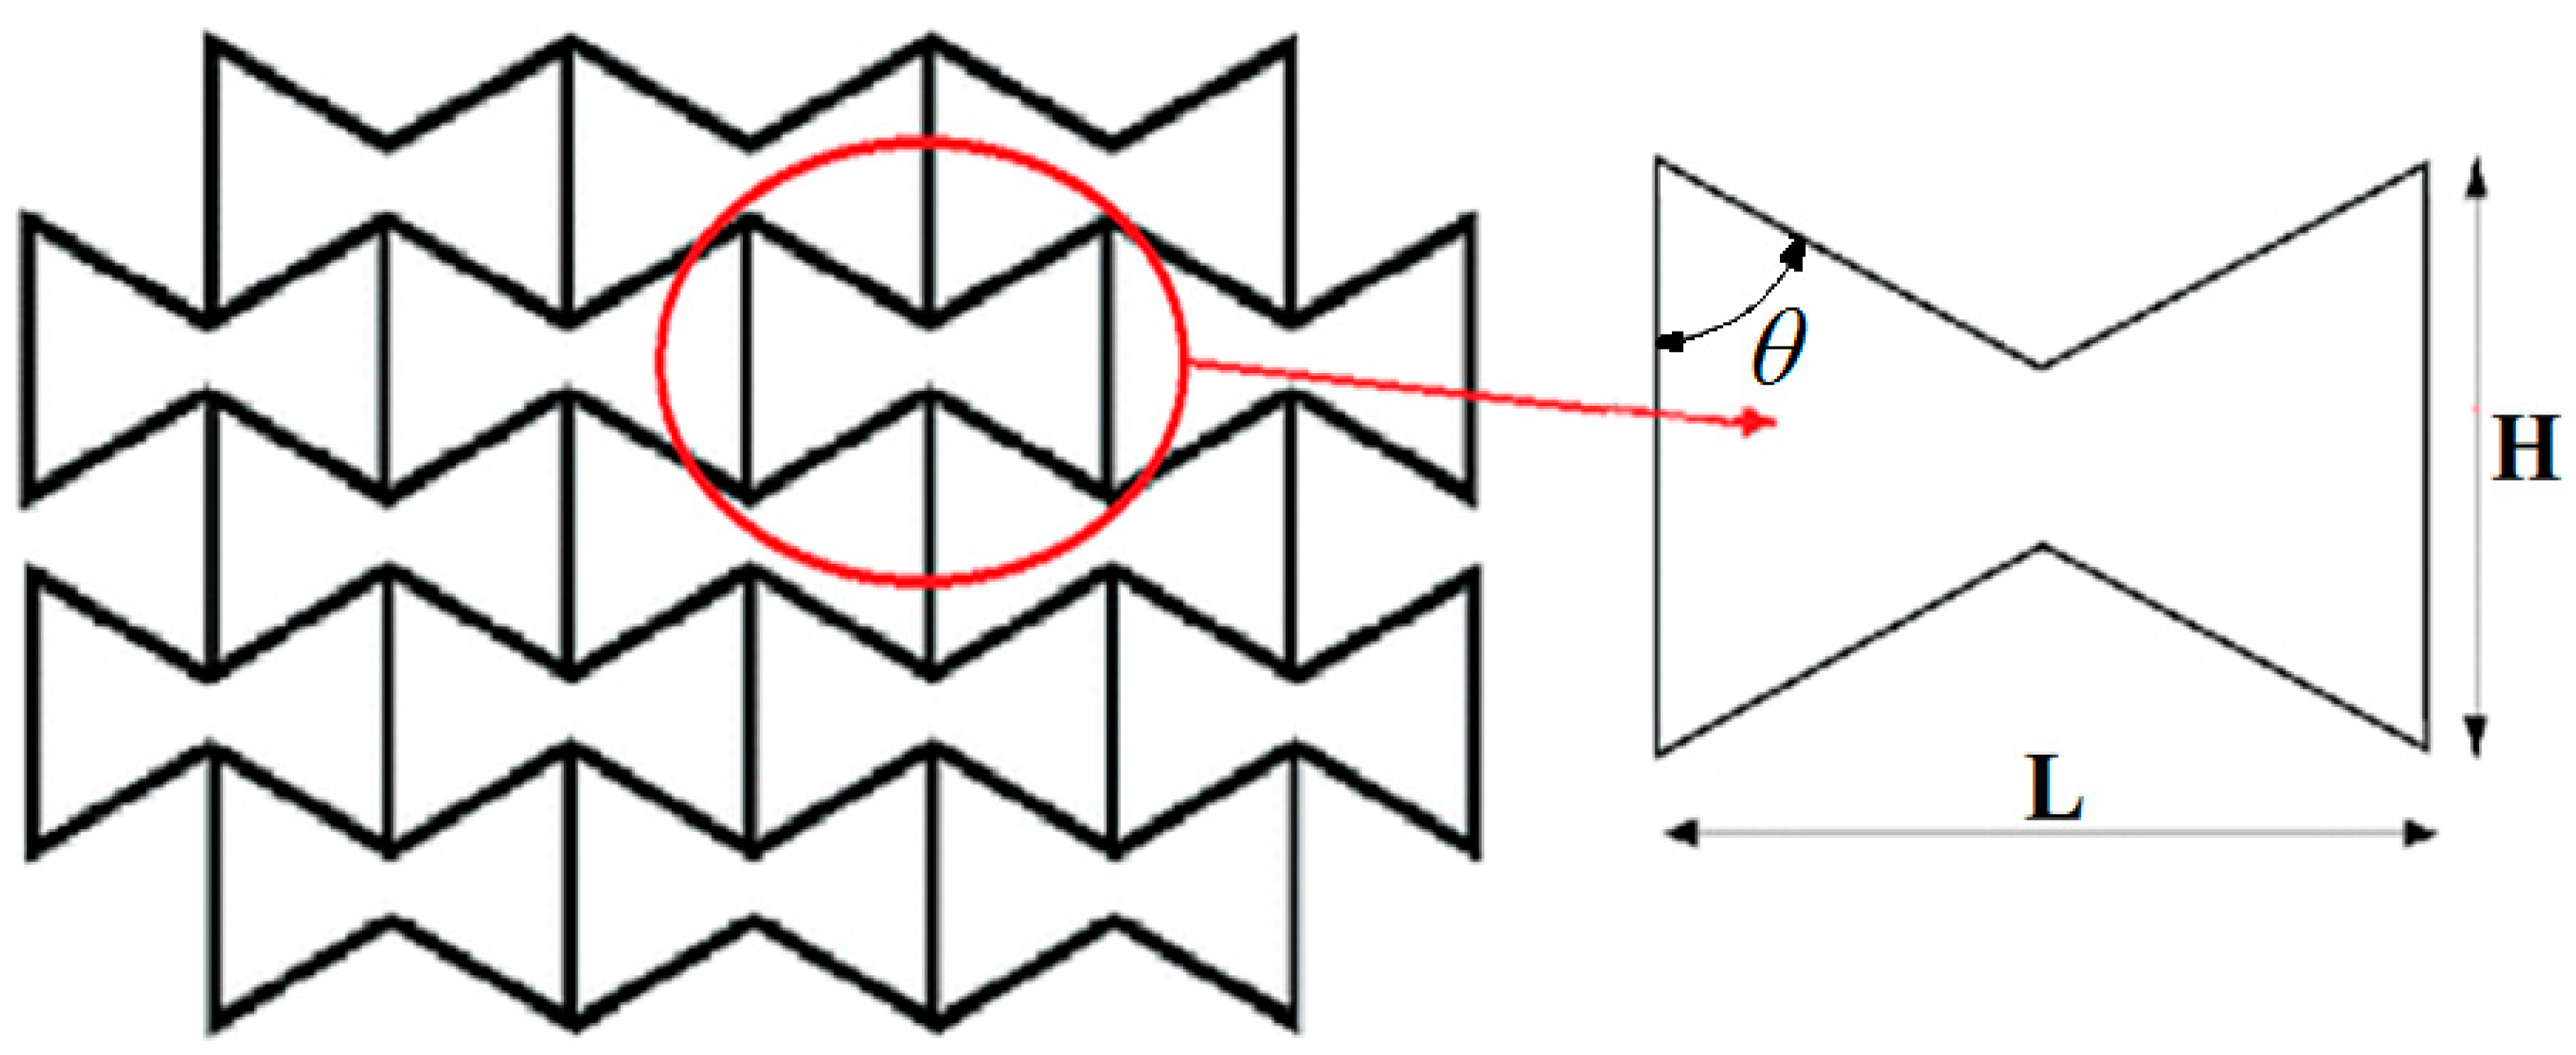
4.3. Effects of Cell’s Angle (θ) on Poisson’s Ratio

Figure 8 illustrates the average value of Poisson’s ratio of the re-entrant auxetic structures versus the cell’s angle.
A variation in cell’s angle results in a significant change in the structure’s Poisson ratio. An increase in θ leads to an elevation in the average value of Poisson’s ratio and a noticeable reduction in the structure’s auxeticity. The highest and lowest values of the average of Poisson’s ratios occurred, respectively, at θ = 70 ° and θ = 50 ° . Increasing θ from 50° to 70° resulted in 80% improvement in Poisson’s ratio. Moreover, increasing θ would lead to change the cell’s shape from a re-entrant cell to a square honeycomb shape, resulting in a reduction in the structure’s auxeticity. Figure 9 shows the variations in deformation patterns of the auxetic structures in different cell angles.
According to Figure 10, with the increase in θ of the auxetic cell, the overall shape of the cell undergoes geometrical changes, and the auxetic structure under axial loading shows behavior similar to the typical honeycomb structures. As the angle θ increases, the load shifts from the transverse arms to the longitudinal arms of the cell, and this causes local buckling in the longitudinal arms. With local buckling of these longitudinal arms, the amount of transverse positive displacement of the structure under tensile load is reduced. As can be seen in Figure 9, the auxetic structure with angle θ equal to 70, which was the largest angle examined, showed almost the same deformation pattern as the square honeycomb structure.

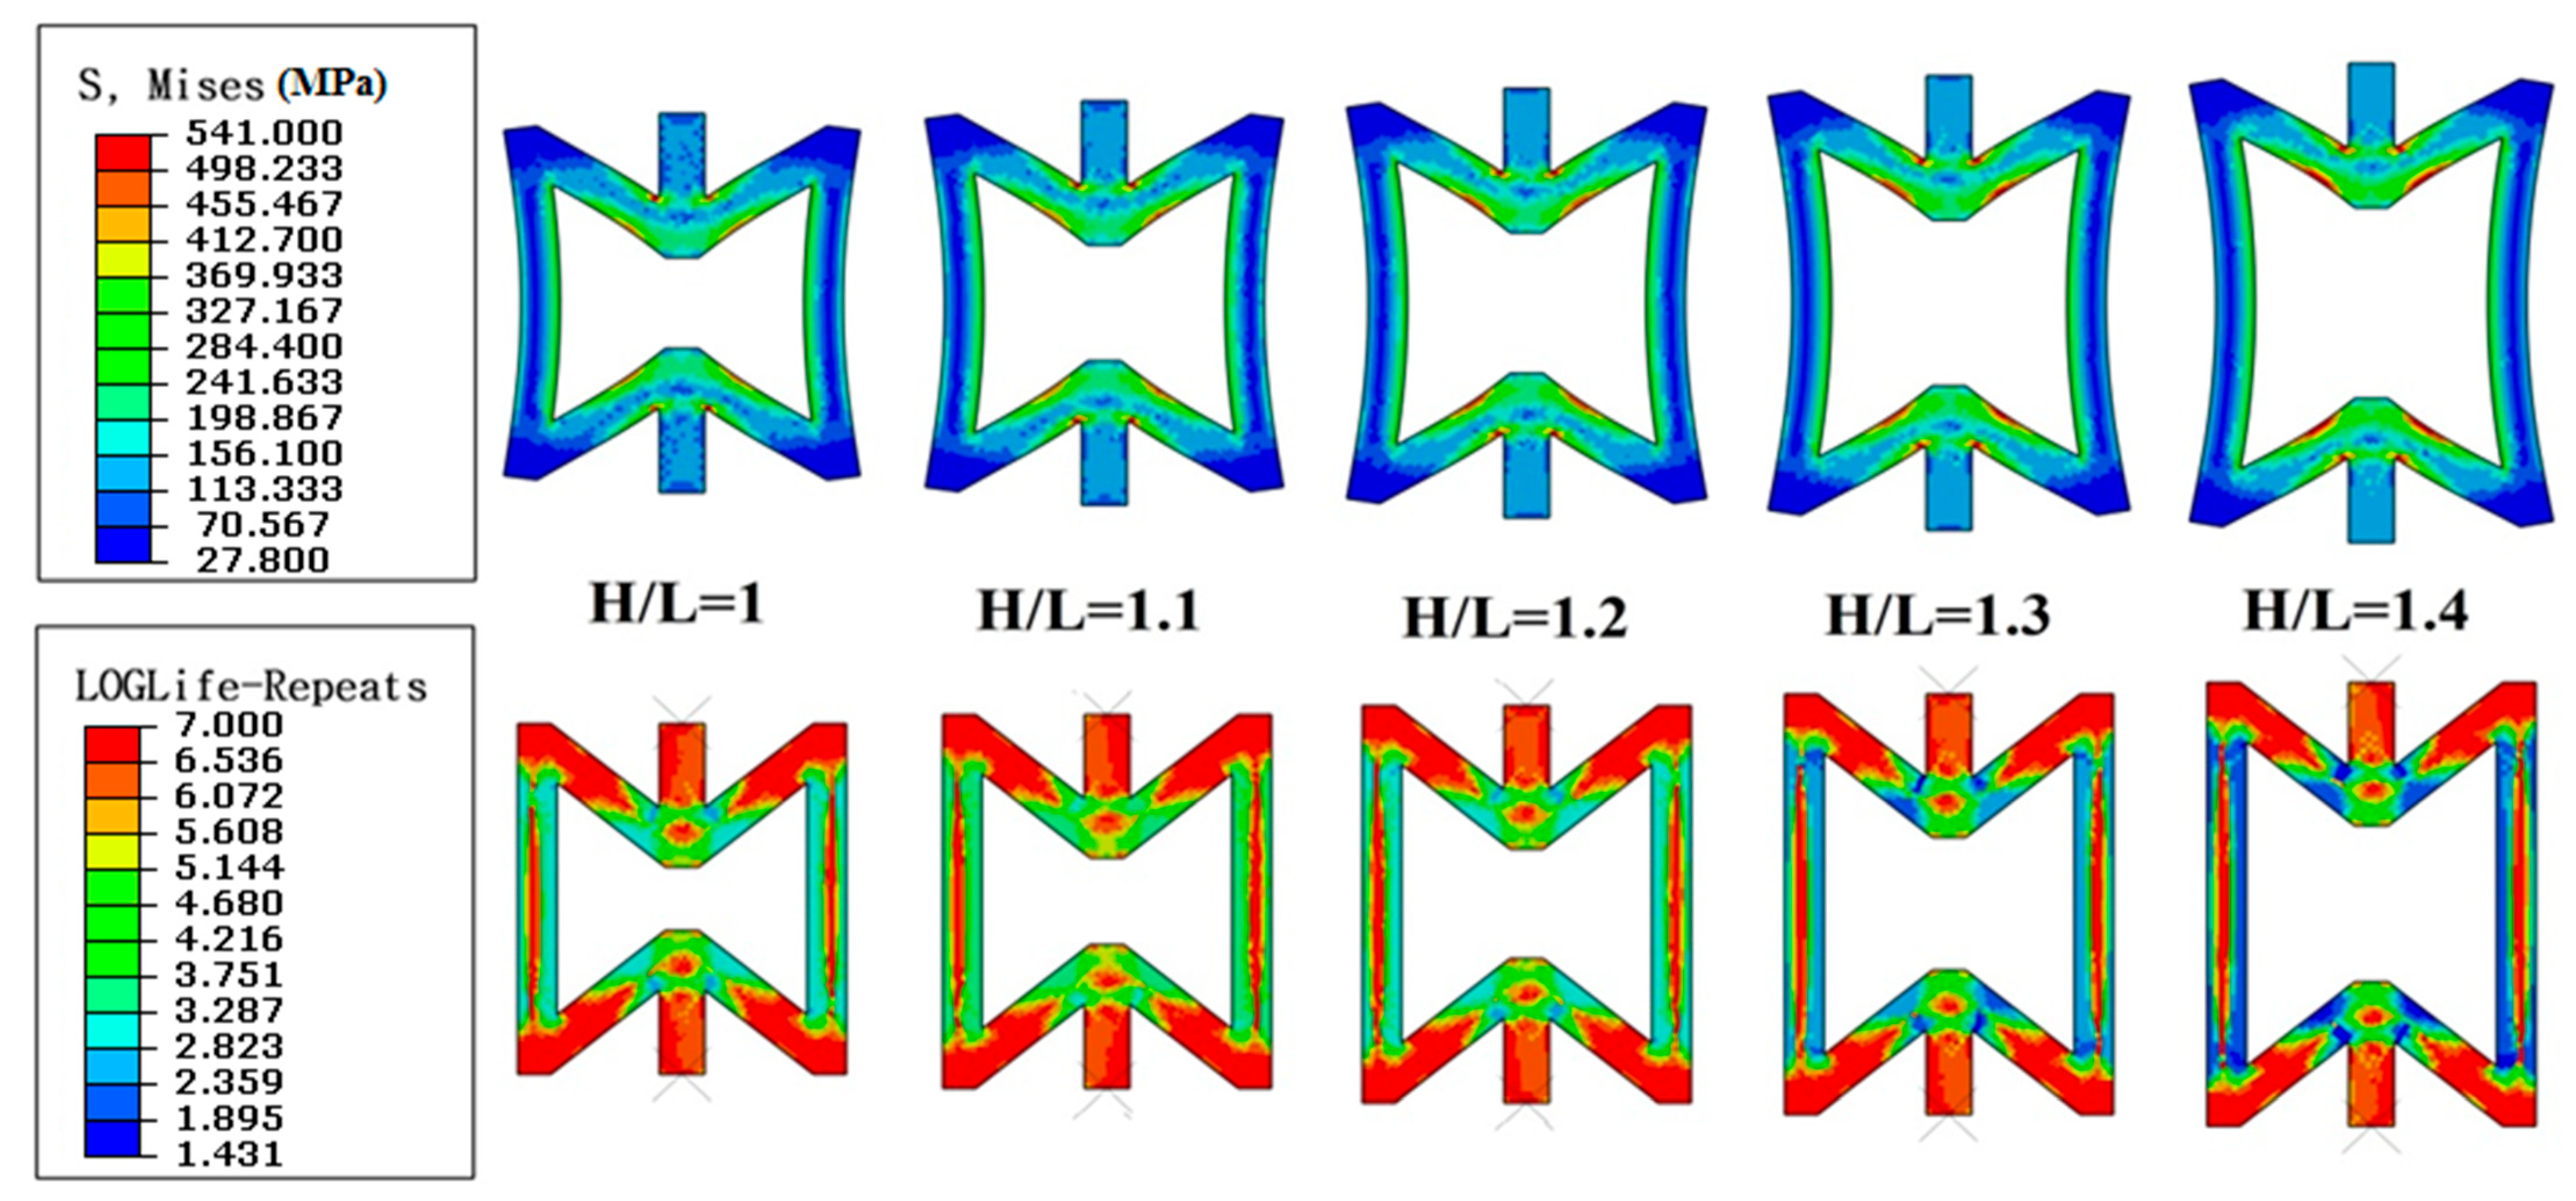
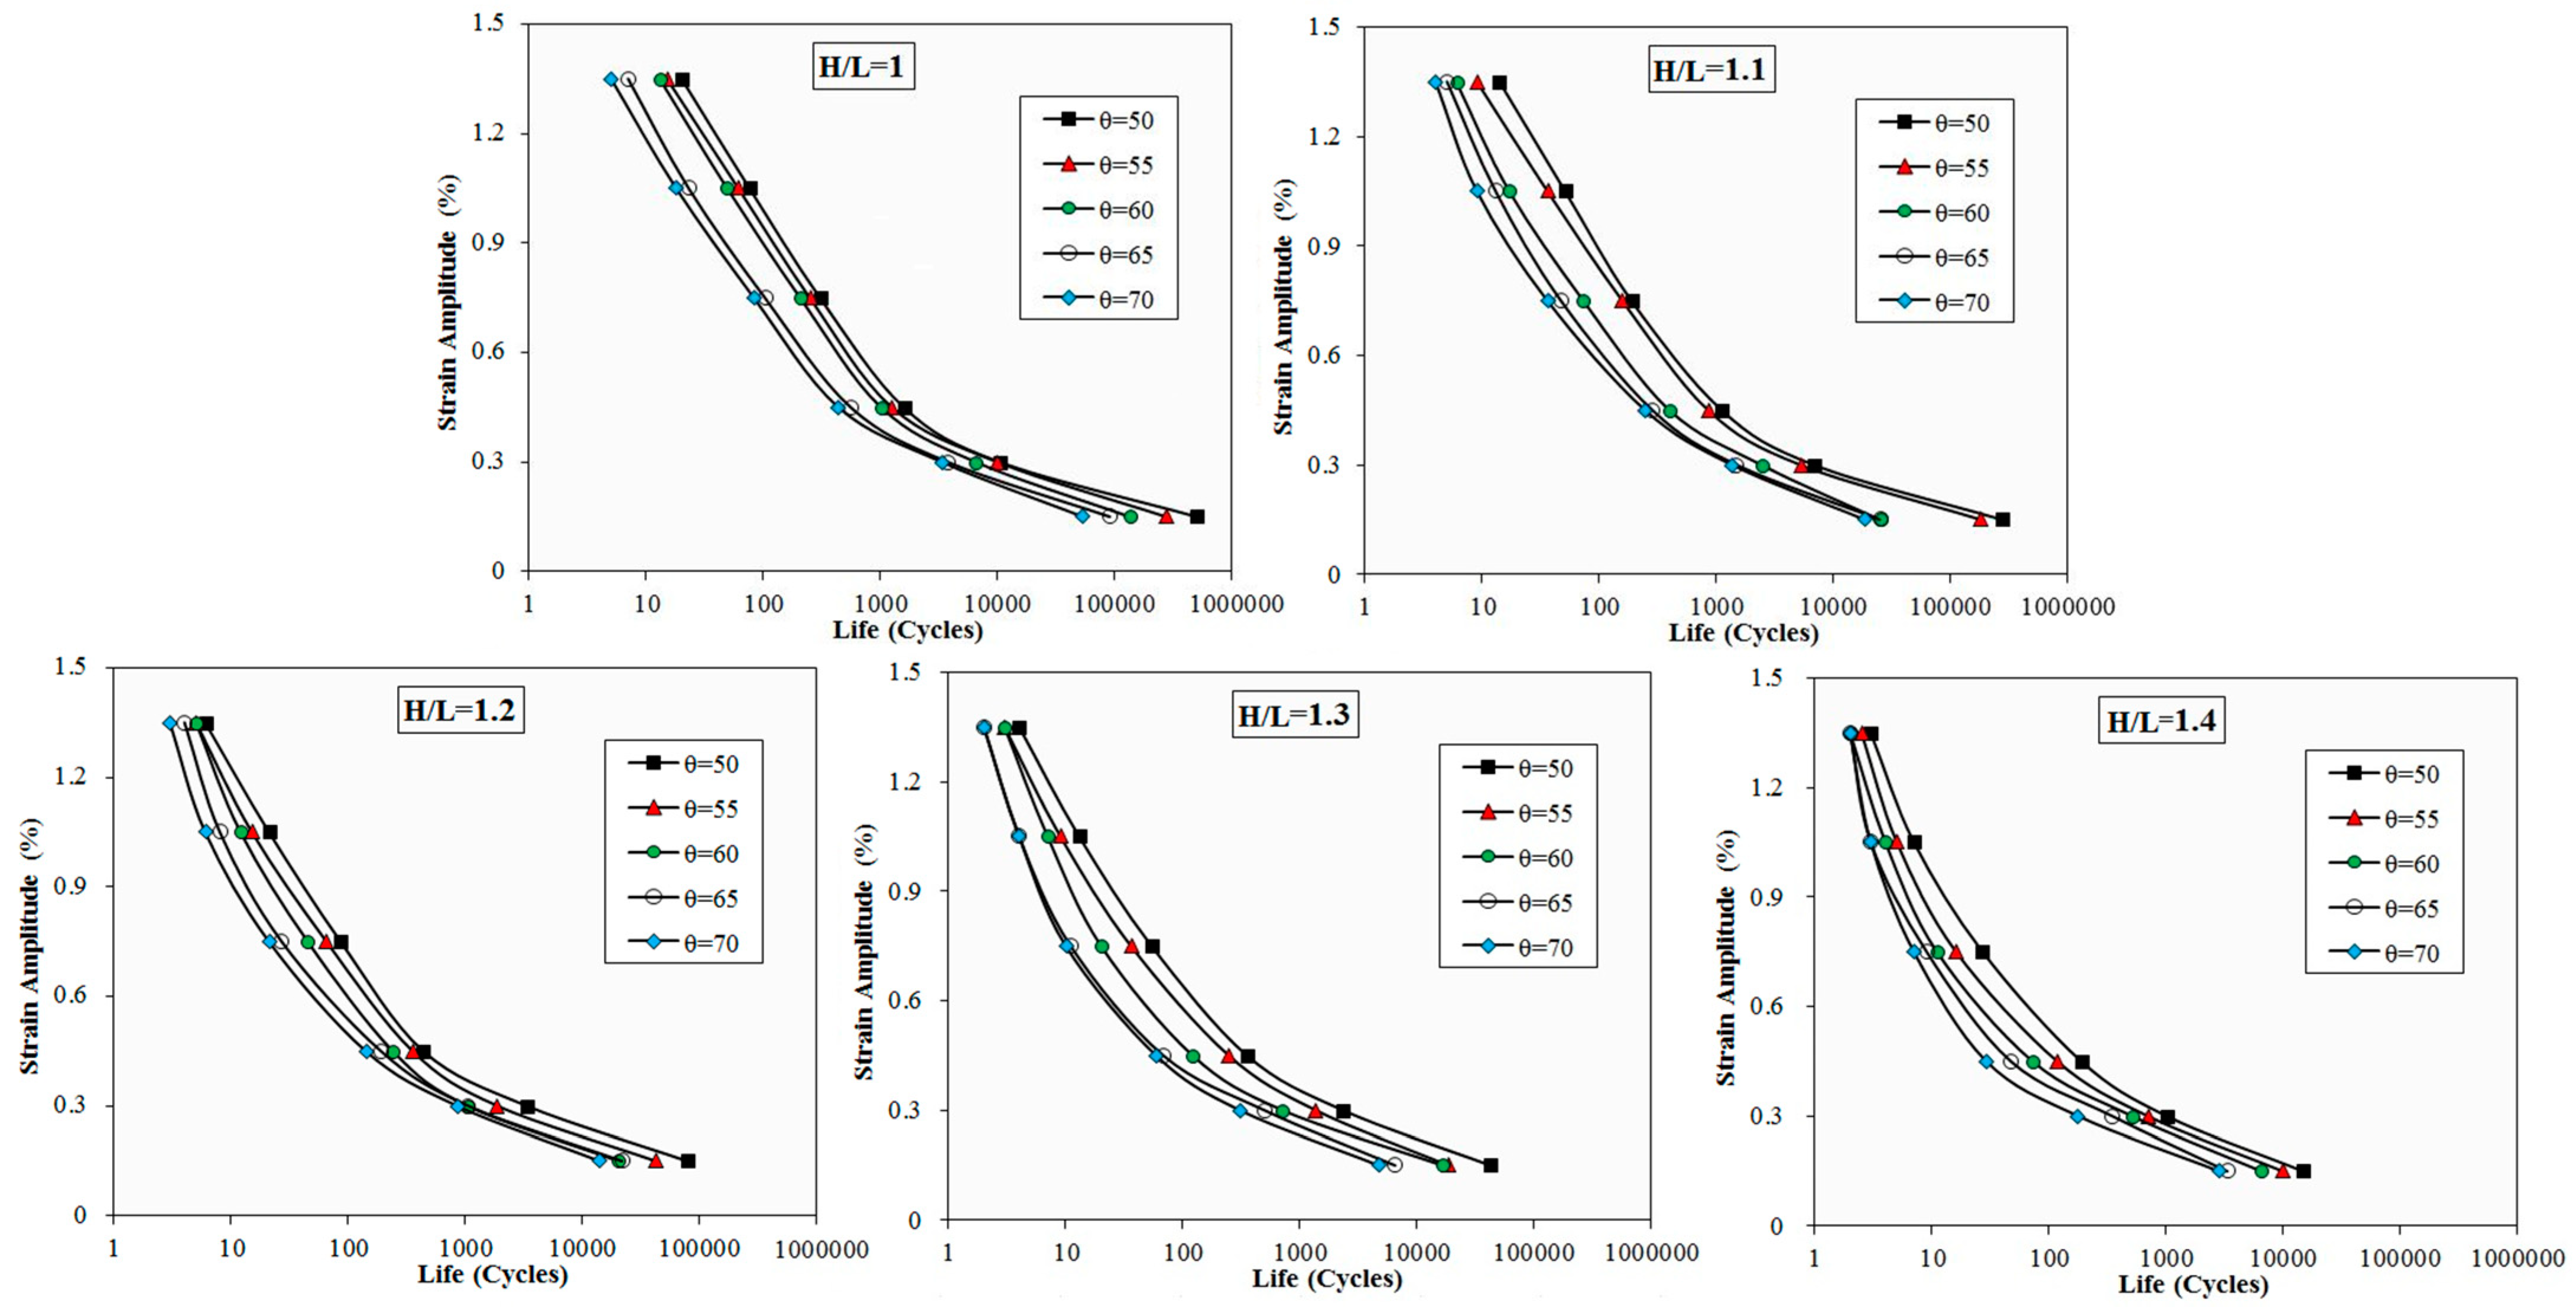
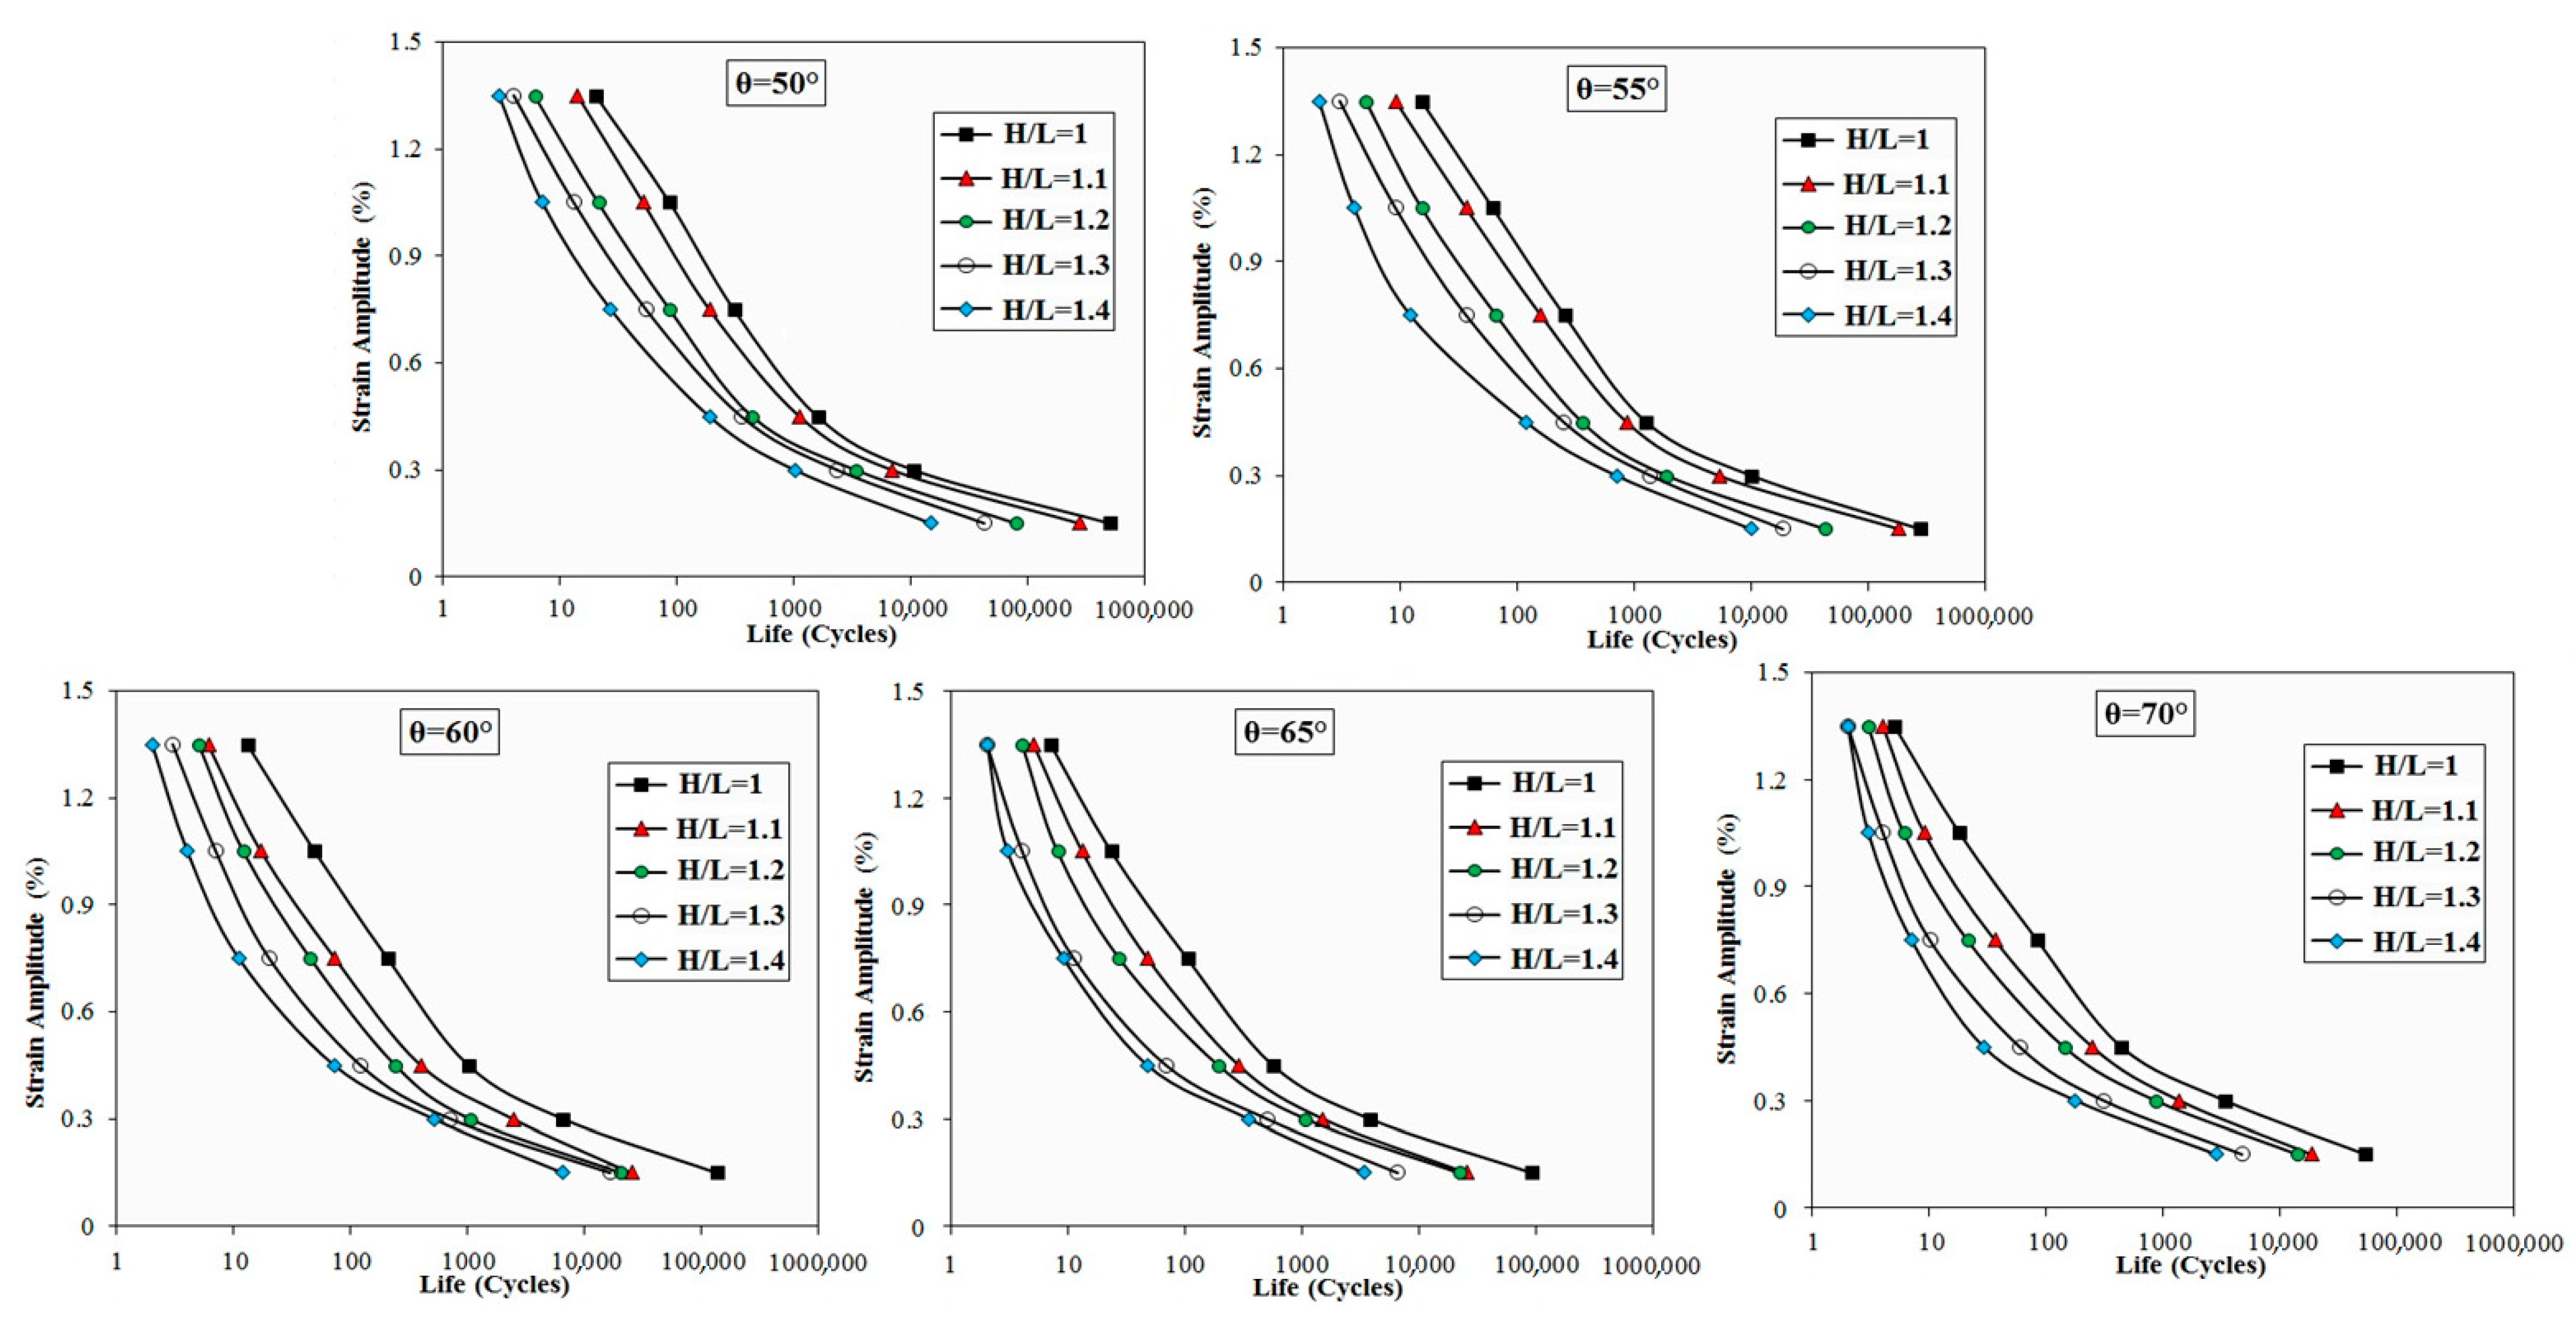
4.4. Effects of H/L Ratio on Fatigue Life

For the studied models in this investigation, the fatigue strength of the structure was studied in five different stress levels. Figure 11 depicts the effects of H/L ratio on the fatigue resistance of the auxetic structures in different cell’s angle ( θ ).
In all angles, the fatigue strength decreased significantly with increasing the H/L ratio. The variation in H/L value in LCF regime had a greater influence on fatigue strength compared to that of HCF regime, causing a larger reduction in fatigue life. Results revealed that the structure’s auxeticity had a direct relationship with fatigue strength. The structures with higher auxeticity values possessed greater fatigue strength. Figure 11 shows stress contours and fatigue life contours in logarithmic scale in one cell at different H/L values. As evidenced in Figure 11, regardless of the cell’s H/L value, the maximum stress occurred in the conjunction area of the internal cell’s arm. It is obvious in Figure 11 that the stress value has a direct relationship with cell’s H/L value. With increasing the H/L value, the maximum stress values and the stress concentration areas have been increased. As evidenced in fatigue life contour, fatigue crack initiation areas are exactly matched with stress concentration regions. The joints between the nodes of the re-entrant cell’s arms are the most susceptible points for fatigue cracking. In the nodes connecting the transverse and longitudinal arms of the cell, load transfer occurs and this load transfer leads to more stress concentration in these areas. With the increase in stress concentration in these areas, the probability of fatigue crack formation under fatigue loading increases, which is also evident in the contours of the log of life shown in Figure 11. After the mentioned areas, the longitudinal arms of the cells are prone to fatigue cracks. In the longitudinal arms of the cell, the internal parts of the longitudinal spans have a shorter fatigue life than the peripheral areas, and cracks generally grow along the thickness from the inside to the outside of the cell wall.

4.5. Effects of Cell’s Angle (θ) on Poisson’s Ratio

In Figure 12, the effects of θ on the fatigue life of auxetic structures at different θ angles are shown.
Furthermore, in Figure 13, the stress contours and the log of life contours of the life of a cell representing the entire structure with different θ angles are displayed. According to Figure 12, in all different H/L ratios, the fatigue life of the structure decreases with the increase in cell angle θ. By comparing Figure 10 and Figure 12, it can be seen that the changes in the H/L ratio have a stronger effect on the fatigue life than the changes in the θ angle. For the θ parameter, it is also observed that the changes in this parameter in the low cycle region have a stronger effect on the fatigue life of the structure and its increase in the larger strain ranges has caused a sharper decrease in the fatigue life.
According to Figure 13, regardless of θ of the cell, the highest stress occurred in the joint area of the middle sides of re-entrant auxetic cells. According to the contours of the log of life, the upper and lower nodes are the most prone areas to initiate fatigue damage. According to the stress contours, a strong stress concentration has occurred in the nodes connecting cells to adjacent cells due to the presence of shear stress. In all samples, in the connecting areas of the middle arms, the angle and orientation of the maximum stress areas have a phase difference of 45 degrees with the direction of loading.
By studying the effect of θ parameter on the fatigue life and Poisson’s ratio of the structure, it was found that the auxetic property of the structure has a direct relationship with the fatigue resistance of the structure. In all samples, it was observed that structures with greater auxetic property have higher fatigue resistance.

5. Conclusions

In this study, the influence of the θ angle and H/L ratio of the re-entrant auxetic cells on the variations in Poisson’s ratio and fatigue life of the auxetic structures were numerically examined. Five different θ angles and five various H/L ratios were studied. The following conclusions were drawn out from the results:
  • Increasing the H/L ratios of the re-entrant cell relatively increased the average value of the Poisson ratio of the structure. As an average, the increasing H/L ratio from 1 to 1.4 elevated the Poisson ratio by 7.7%;
  • It was found that the parameter θ angle had a direct relationship with the Poisson ratio of the structure. Increasing θ from 50° to 70° elevated the value of the Poisson ratio by about 80%;
  • In general, with increasing the H/L ratio, the number of cells along the loading direction decreased, resulting in an enlargement of the longitudinal arms of the cells along the loading direction and a reduction in the ability of the lateral displacement of the structure. Moreover, with increasing θ angle, the re-entrant cell’s shape changed to square honeycomb cell, leading to a drop in the structure’s auxeticity;
  • In all θ angles, with increasing H/L value, the fatigue life of the structure decreased significantly. The effect of the variation in H/L value in the LCF regime was greater than that in the HCF regime, resulting in greater reduction in fatigue life;
  • In all H/L values, it was evidenced that increasing θ angle of the re-entrant cell would decrease the fatigue strength of the auxetic structure. The impact of the variation in θ angle in the LCF regime was more influential than that in the HCF regime.
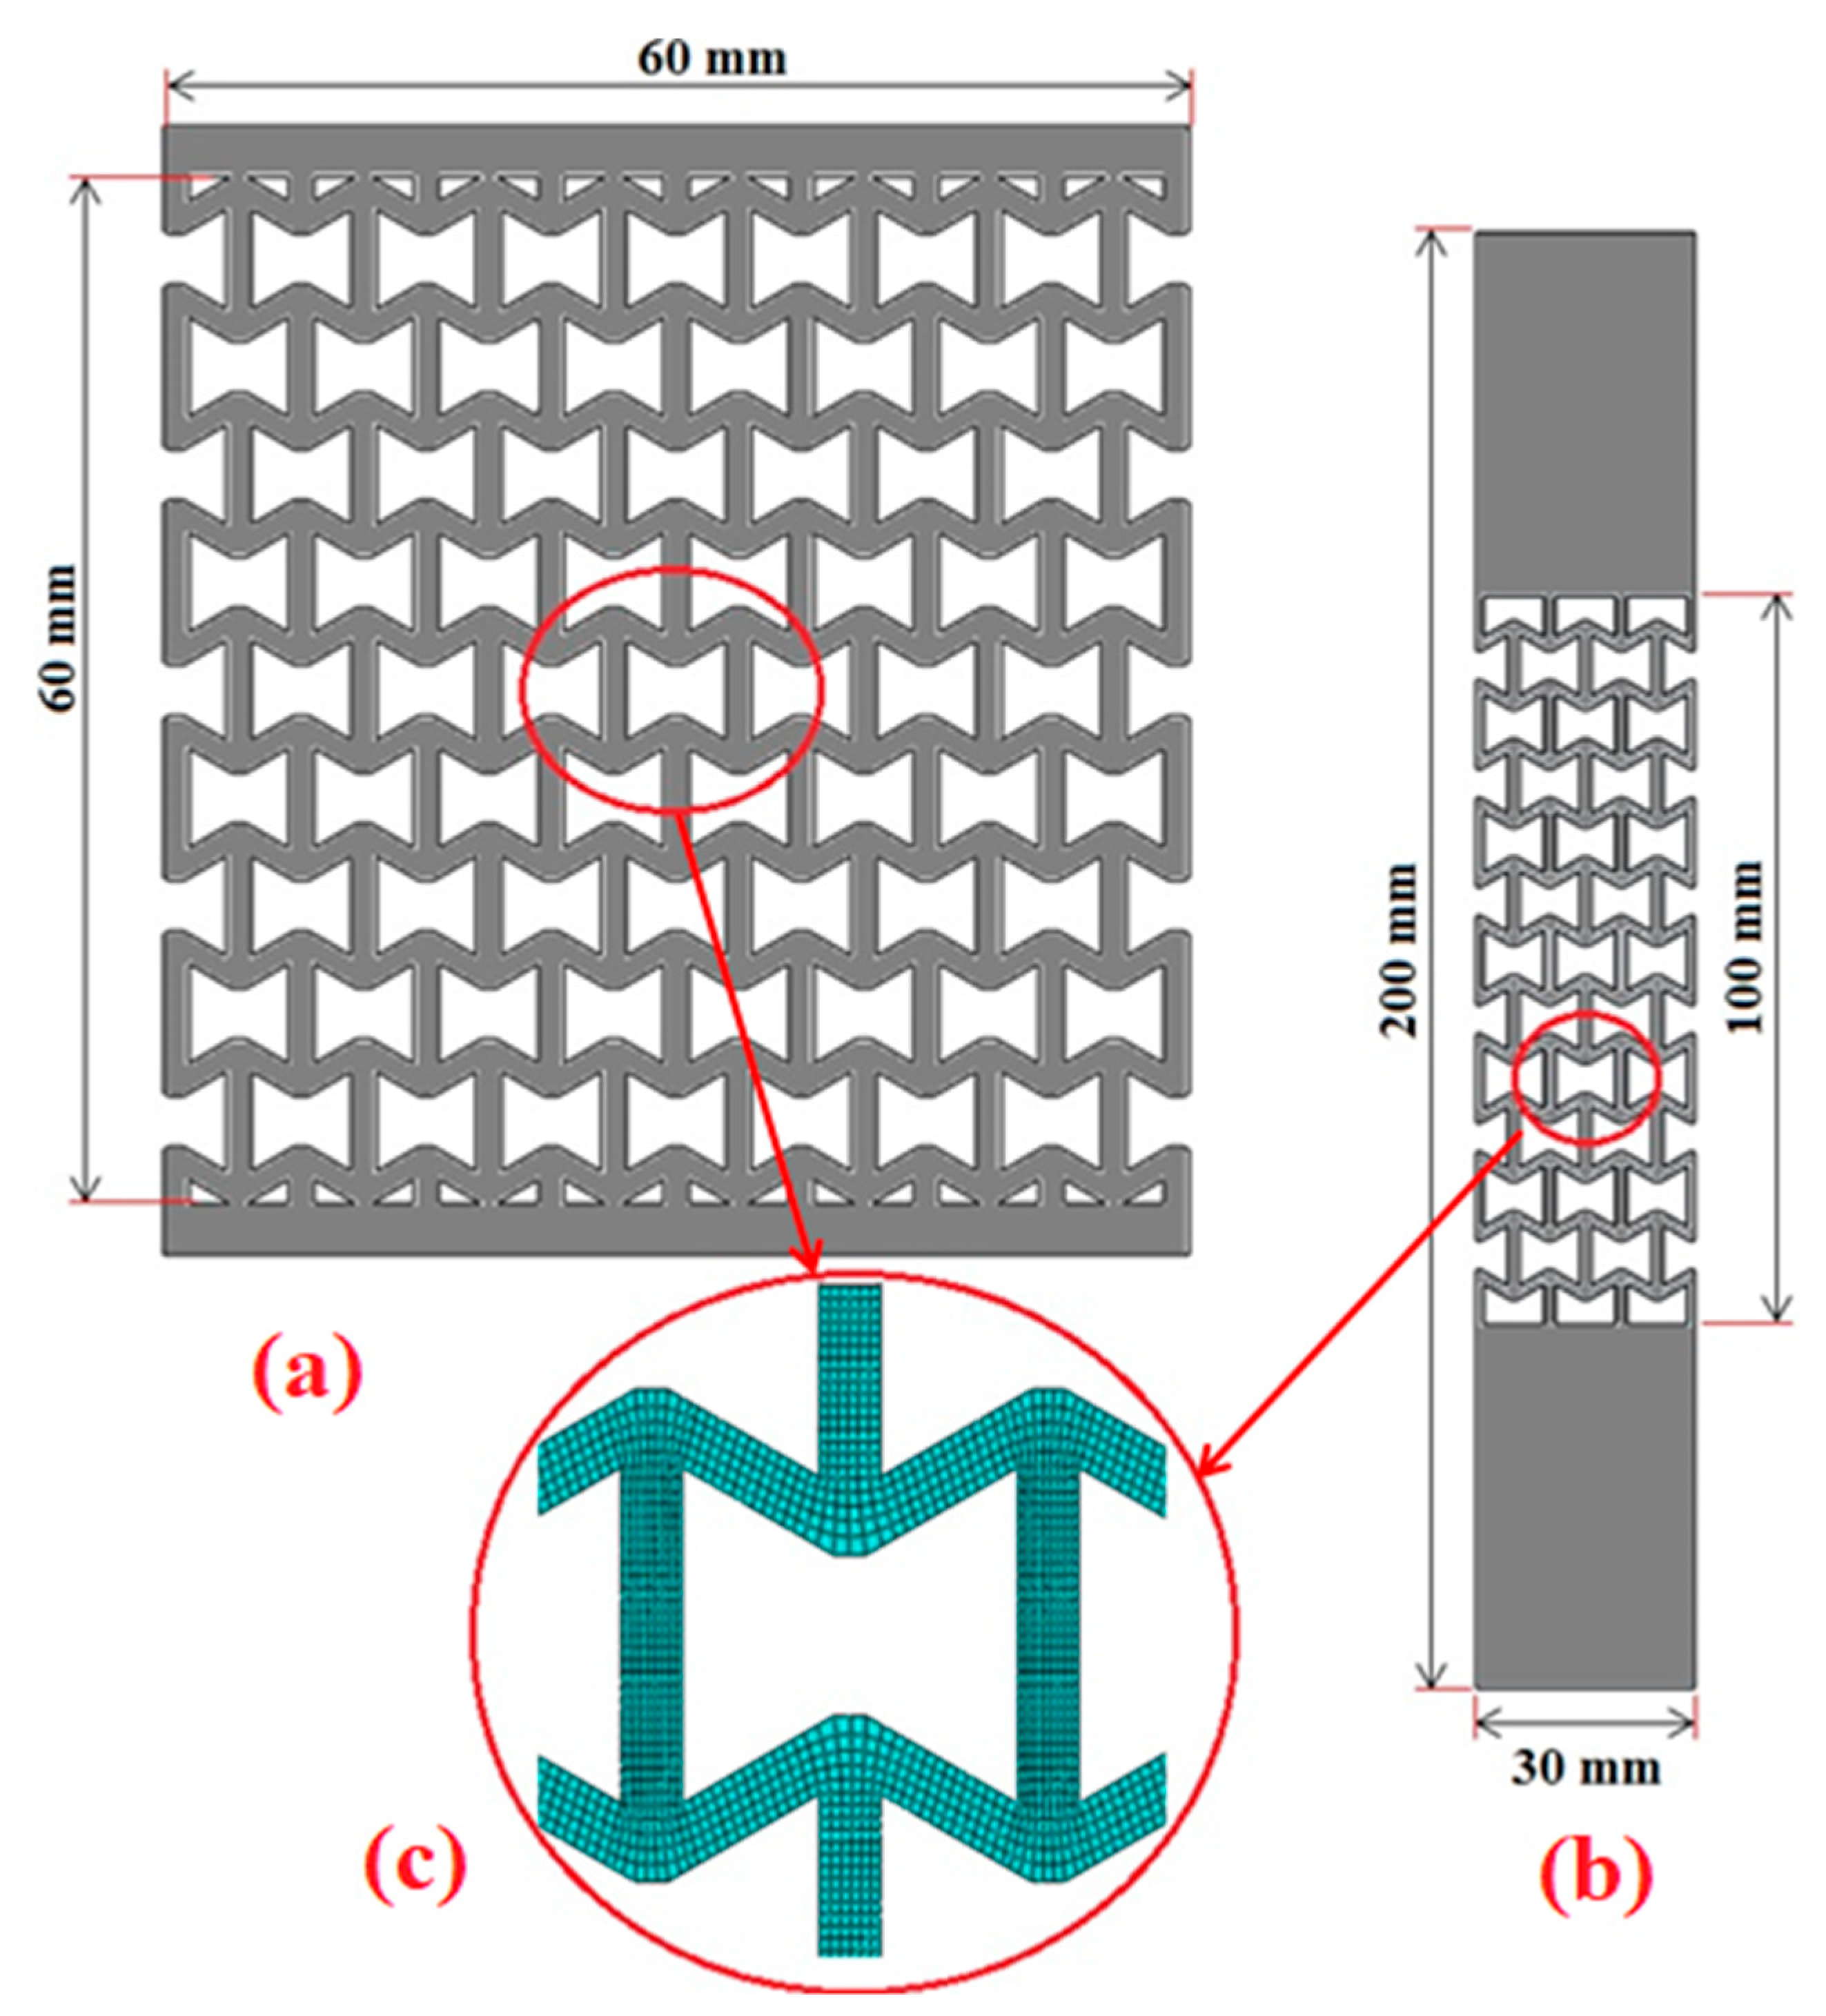
  • Overall, the effects of H/L parameter on fatigue life were greater than that of θ angle. Regardless of the values of H/L ratio or θ angle, the maximum stresses occurred in the conjunction of the cell’s arms. According to the fatigue analysis, the crack initiation areas were the stress concentration regions of the internal cells of the auxetic structure.

Author Contributions

Conceptualization, A.G., A.F.K., J.W.G.G., H.A.D. and J.T.; methodology, A.G., A.F.K. and J.W.G.G.; software, A.G. and A.F.K.; validation, A.G. and A.F.K.; formal analysis, A.G., A.F.K., J.W.G.G., H.A.D., J.T., A.J. and A.W.; investigation, A.G., A.F.K., J.W.G.G. and H.A.D.; resources, A.G., A.F.K., J.W.G.G., H.A.D. and J.T.; data curation, A.G., A.F.K., J.W.G.G. and H.A.D.; writing—original draft preparation, A.G. and A.F.K.; writing—review and editing, A.G., A.F.K., J.W.G.G., H.A.D., J.T., A.W. and A.J. All authors have read and agreed to the published version of the manuscript.

Funding

This research received no external funding.

Institutional Review Board Statement

Not applicable.

Informed Consent Statement

Not applicable.

Data Availability Statement

Not applicable.

Conflicts of Interest

The authors declare no conflict of interest.

References

  1. Gao, Q.; Ge, C.; Zhuang, W.; Wang, L.; Ma, Z. Crashworthiness analysis of double-arrowed auxetic structure under axial impact loading. Mater. Des. 2019, 161, 22–34. [Google Scholar] [CrossRef]
  2. Imbalzano, G.; Linforth, S.; Ngo, T.; Lee, P.; Tran, P. Blast resistance of auxetic and honeycomb sandwich panels: Comparisons and parametric designs. Compos. Struct. 2018, 183, 242–261. [Google Scholar] [CrossRef]
  3. Ren, X.; Shen, J.; Tran, P.; Ngo, T.; Xie, Y. Design and characterisation of a tuneable 3D buckling-induced auxetic metamaterial. Mater. Des. 2018, 139, 336–342. [Google Scholar]
  4. Lim, T.-C. Auxetic Materials and Structures; Springer: Berlin/Heidelberg, Germany, 2015. [Google Scholar]
  5. Wang, Z.; Zulifqar, A.; Hu, H. Auxetic Composites in Aerospace Engineering, Advanced Composite Materials for Aerospace Engineering; Elsevier: Amsterdam, The Netherlands, 2016; pp. 213–240. [Google Scholar]
  6. Munteanu, L.; Dumitriu, D.; Donescu, Ş.; Chiroiu, V. On the complexity of the auxetic systems. In Proceedings of the European Computing Conference; Springer: Berlin/Heidelberg, Germany, 2009; pp. 631–636. [Google Scholar]
  7. Lakes, R. Negative-Poisson’s-ratio materials: Auxetic solids. Annu. Rev. Mater. Res. 2017, 47, 63–81. [Google Scholar] [CrossRef]
  8. Albag, O. Auxetic Materials, Material Balance; Springer: Berlin/Heidelberg, Germany, 2021; pp. 65–74. [Google Scholar]
  9. Khare, E.; Temple, S.; Tomov, I.; Zhang, F.; Smoukov, S. Low fatigue dynamic auxetic lattices with 3D printable, multistable, and tuneable unit cells. Front. Mater. 2018, 5, 45. [Google Scholar] [CrossRef]
  10. Nasim, M.S.; Etemadi, E. Three dimensional modeling of warp and woof periodic auxetic cellular structure. Int. J. Mech. Sci. 2018, 136, 475–481. [Google Scholar] [CrossRef]
  11. Essassi, K.; Rebiere, J.-L.; El Mahi, A.; Ben Souf, M.A.; Bouguecha, A.; Haddar, M. Experimental and analytical investigation of the bending behaviour of 3D-printed bio-based sandwich structures composites with auxetic core under cyclic fatigue tests. Compos. Part A Appl. Sci. Manuf. 2020, 131, 105775. [Google Scholar] [CrossRef]
  12. Choi, J.; Lakes, R. Non-linear properties of metallic cellular materials with a negative Poisson’s ratio. J. Mater. Sci. 1992, 27, 5375–5381. [Google Scholar] [CrossRef]
  13. Nečemer, B.; Glodež, S.; Novak, N.; Kramberger, J. Numerical modelling of a chiral auxetic cellular structure under multiaxial loading conditions. Theor. Appl. Fract. Mech. 2020, 107, 102514. [Google Scholar] [CrossRef]
  14. Kramberger, J.; Nečemer, B.; Glodež, S. Assessing the cracking behavior of auxetic cellular structures by using both a numerical and an experimental approach. Theor. Appl. Fract. Mech. 2019, 101, 17–24. [Google Scholar] [CrossRef]
  15. Nečemer, B.; Kramberger, J.; Vuherer, T.; Glodež, S. Fatigue crack initiation and propagation in re-entrant auxetic cellular structures. Int. J. Fatigue 2019, 126, 241–247. [Google Scholar] [CrossRef]
  16. Bezazi, A.; Scarpa, F. Mechanical behaviour of conventional and negative Poisson’s ratio thermoplastic polyurethane foams under compressive cyclic loading. Int. J. Fatigue 2007, 29, 922–930. [Google Scholar] [CrossRef]
  17. Francesconi, L.; Baldi, A.; Dominguez, G.; Taylor, M. An investigation of the enhanced fatigue performance of low-porosity auxetic metamaterials. Exp. Mech. 2020, 60, 93–107. [Google Scholar] [CrossRef]
  18. Nečemer, B.; Klemenc, J.; Glodež, S. The computational LCF-analyses of chiral and Re-entrant auxetic structure using the direct cyclic algorithm. Mater. Sci. Eng. A 2020, 789, 139618. [Google Scholar] [CrossRef]
  19. Nečemer, B.; Kramberger, J.; Glodež, S. Fatigue crack growth in the re-entrant auxetic structure. Procedia Struct. Integr. 2022, 39, 34–40. [Google Scholar] [CrossRef]
  20. Nečemer, B.; Klemenc, J.; Zupanič, F.; Glodež, S. Modelling and predicting of the LCF-behaviour of aluminium auxetic structures. Int. J. Fatigue 2022, 156, 106673. [Google Scholar] [CrossRef]
  21. Lvov, V.; Senatov, F.; Stepashkin, A.; Veveris, A.; Pavlov, M.; Komissarov, A. Low-cycle fatigue behavior of 3D-printed metallic auxetic structure. Mater. Today Proc. 2020, 33, 1979–1983. [Google Scholar] [CrossRef]
  22. Nečemer, B.; Vuherer, T.; Glodež, S.; Kramberger, J. Fatigue behaviour of re-entrant auxetic structures made of the aluminium alloy AA7075-T651. Thin-Walled Struct. 2022, 180, 109917. [Google Scholar] [CrossRef]
  23. Ulbin, M.; Borovinšek, M.; Vesenjak, M.; Glodež, S. Computational Fatigue Analysis of Auxetic Cellular Structures Made of SLM AlSi10Mg Alloy. Metals 2020, 10, 945. [Google Scholar] [CrossRef]
  24. Michalski, J.; Strek, T. Fatigue Life of Auxetic Re-entrant Honeycomb Structure, International Scientific-Technical Conference Manufacturing; Springer: Berlin/Heidelberg, Germany, 2019; pp. 50–60. [Google Scholar]
  25. Tomažinčič, D.; Nečemer, B.; Vesenjak, M.; Klemenc, J. Low-cycle fatigue life of thin-plate auxetic cellular structures made from aluminium alloy 7075-T651. Fatigue Fract. Eng. Mater. Struct. 2019, 42, 1022–1036. [Google Scholar] [CrossRef]
  26. Schijve, J. Fatigue of Structures and Materials; Springer Science & Business Media: Berlin/Heidelberg, Germany, 2001. [Google Scholar]
  27. Niesłony, A.; el Dsoki, C.; Kaufmann, H.; Krug, P. New method for evaluation of the Manson–Coffin–Basquin and Ramberg–Osgood equations with respect to compatibility. Int. J. Fatigue 2008, 30, 1967–1977. [Google Scholar] [CrossRef]
  28. Suresh, S. Fatigue of Materials; Cambridge University Press: Cambridge, UK, 1998. [Google Scholar]
  29. Li, J.; Sun, Q.; Zhang, Z.; Qiao, Y.-J.; Liu, J. A modification of Smith-Watson-Topper damage parameter for fatigue life prediction under non-proportional loading. Fatigue Fract. Eng. Mater. Struct. 2012, 35, 301–316. [Google Scholar] [CrossRef]
  30. Tamadon, A.; Pons, D.J.; Sued, K.; Clucas, D. Internal Flow Behaviour and Microstructural Evolution of the Bobbin-FSW Welds: Thermomechanical Comparison between 1xxx and 3xxx Aluminium Grades. Adv. Mater. Sci. 2021, 21, 40–64. [Google Scholar] [CrossRef]
  31. Mohan, D.G.; Tomków, J.; Gopi, S. Induction Assisted Hybrid Friction Stir Welding of Dissimilar Materials AA5052 Aluminium Alloy and X12Cr13 Stainless Steel. Adv. Mater. Sci. 2021, 21, 17–30. [Google Scholar] [CrossRef]
  32. Tu, X.; Shahba, A.; Shen, J.; Ghosh, S. Microstructure and property based statistically equivalent RVEs for polycrystalline-polyphase aluminum alloys. Int. J. Plast. 2019, 115, 268–292. [Google Scholar] [CrossRef]
Figure 1. The behavior of conventional and auxetic structure subjected to a tension load.
Coatings 13 00405 g001
Figure 2. Schematic view of a re-entrant auxetic cell.
Coatings 13 00405 g002
Figure 3. The schematic view of the auxetic samples for (a) static test modelling, (b) fatigue test modelling, and (c) mesh pattern of a typical cell.
Coatings 13 00405 g003
Figure 4. Dimensions of fatigue specimens: (a) standard fatigue sample and (b) auxetic fatigue sample (All dimensions are in mm) [25].
Coatings 13 00405 g004
Figure 5. Case study of the standard fatigue sample: (a) the contour of strain and fatigue lives in logarithmic scale and (b) the strain versus fatigue life curve. (c) The contour of strain and fatigue life in logarithmic scale and (d) the strain versus fatigue life curve of auxetic sample [25].
Coatings 13 00405 g005
Figure 6. The variations of the average of the Poisson ratios of the auxetic structures versus H/L ratios.
Coatings 13 00405 g006
Figure 7. Deformation pattern in an auxetic structure in θ = 50° and various H/L values.
Coatings 13 00405 g007
Figure 8. The average value of Poisson’s ratio of the re-entrant auxetic structures versus the cell’s angle.
Coatings 13 00405 g008
Figure 9. Effects of H/L ratio on the fatigue resistance of the auxetic structures in different cell’s angle θ.
Coatings 13 00405 g009
Figure 10. The variations in deformation patterns of the auxetic structures in different cell angles.
Coatings 13 00405 g010
Figure 11. Stress contours and fatigue life contours in logarithmic scale in one cell at different H/L values.
Coatings 13 00405 g011
Figure 12. Stress contours and fatigue life contours in logarithmic scale in one cell at different H/L values.
Coatings 13 00405 g012
Figure 13. Stress contours and fatigue life contours in logarithmic scale in one cell at different cell’s angle θ.
Coatings 13 00405 g013
Table 1. Studied factors and levels.
Levelθ (Degrees)H/L
1501
2551.1
3601.2
4651.3
5701.4
Table 2. Mechanical properties of Al7075-T651 used in static and fatigue analysis [25].
PropertiesStaticFatigue
Young Modulus (GPa)68.9-
Poisson Ratio0.33-
Yield Stress (MPa)539-
Ultimate Tensile Stress (MPa)596-
Elongation at The Break (%)0.12-
Fatigue Strength Coefficient (MPa)-1145
Fatigue Ductility Coefficient-0.0686
Fatigue Strength Exponent-−0.0048
Fatigue Ductility Exponent-−0.3605
Disclaimer/Publisher’s Note: The statements, opinions and data contained in all publications are solely those of the individual author(s) and contributor(s) and not of MDPI and/or the editor(s). MDPI and/or the editor(s) disclaim responsibility for any injury to people or property resulting from any ideas, methods, instructions or products referred to in the content.

