
The Effect of Opto-Electronic Transition Type on the Electric Resistivity of Cr-Doped Co3O4 Thin Films


Abstract
:1. Introduction
2. Materials and Methods
3. Results
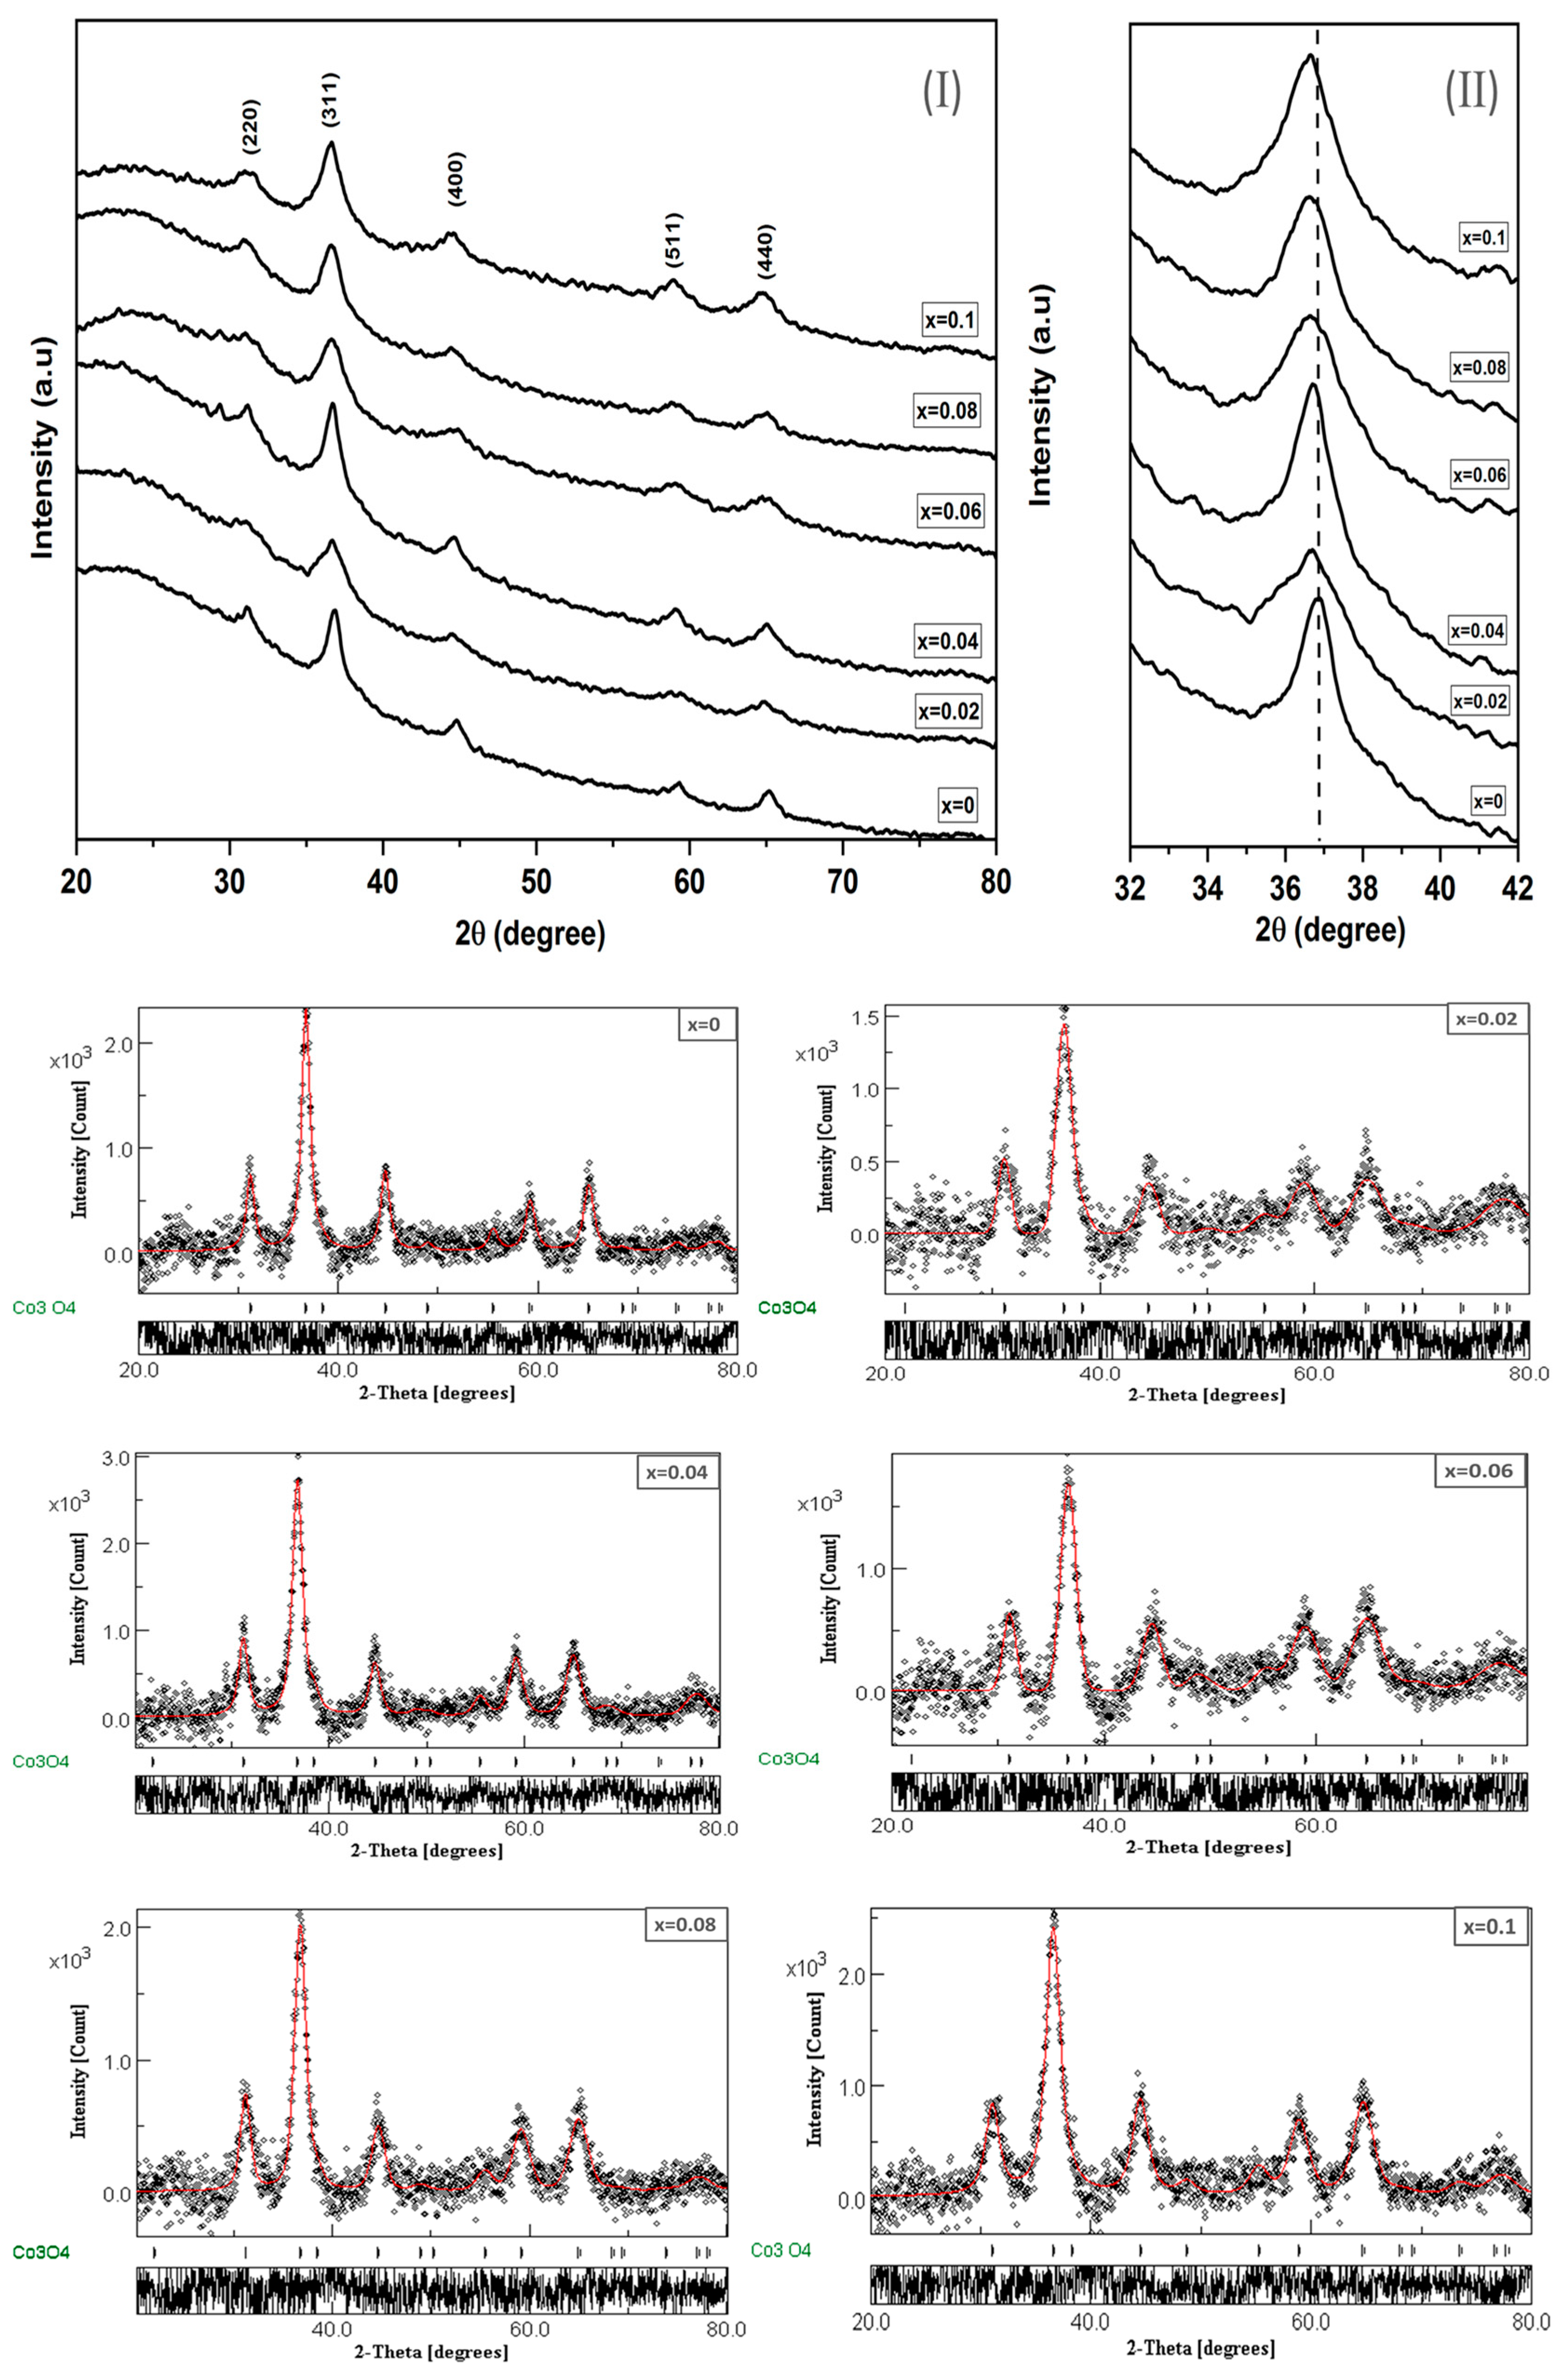
3.1. X-ray Analysis
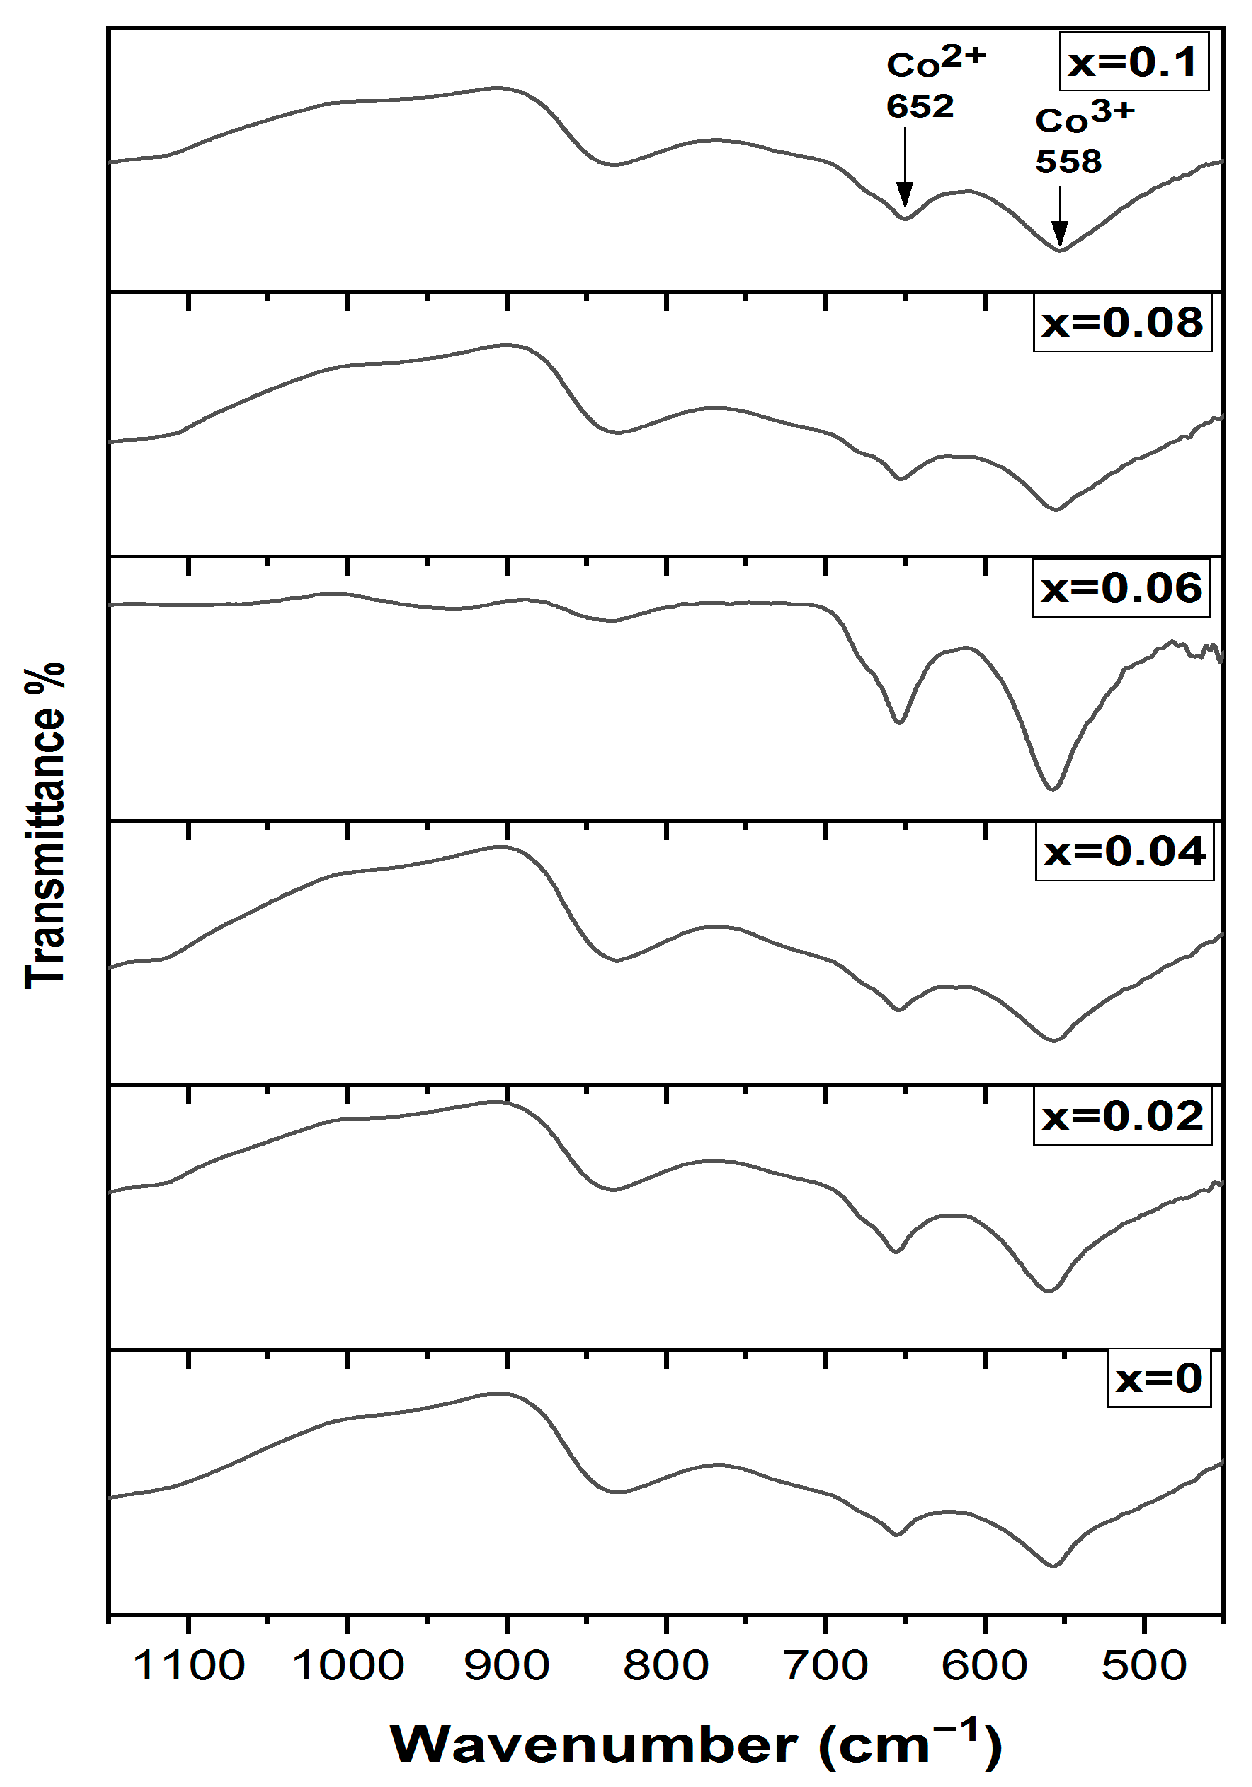
3.2. FTIR Analysis
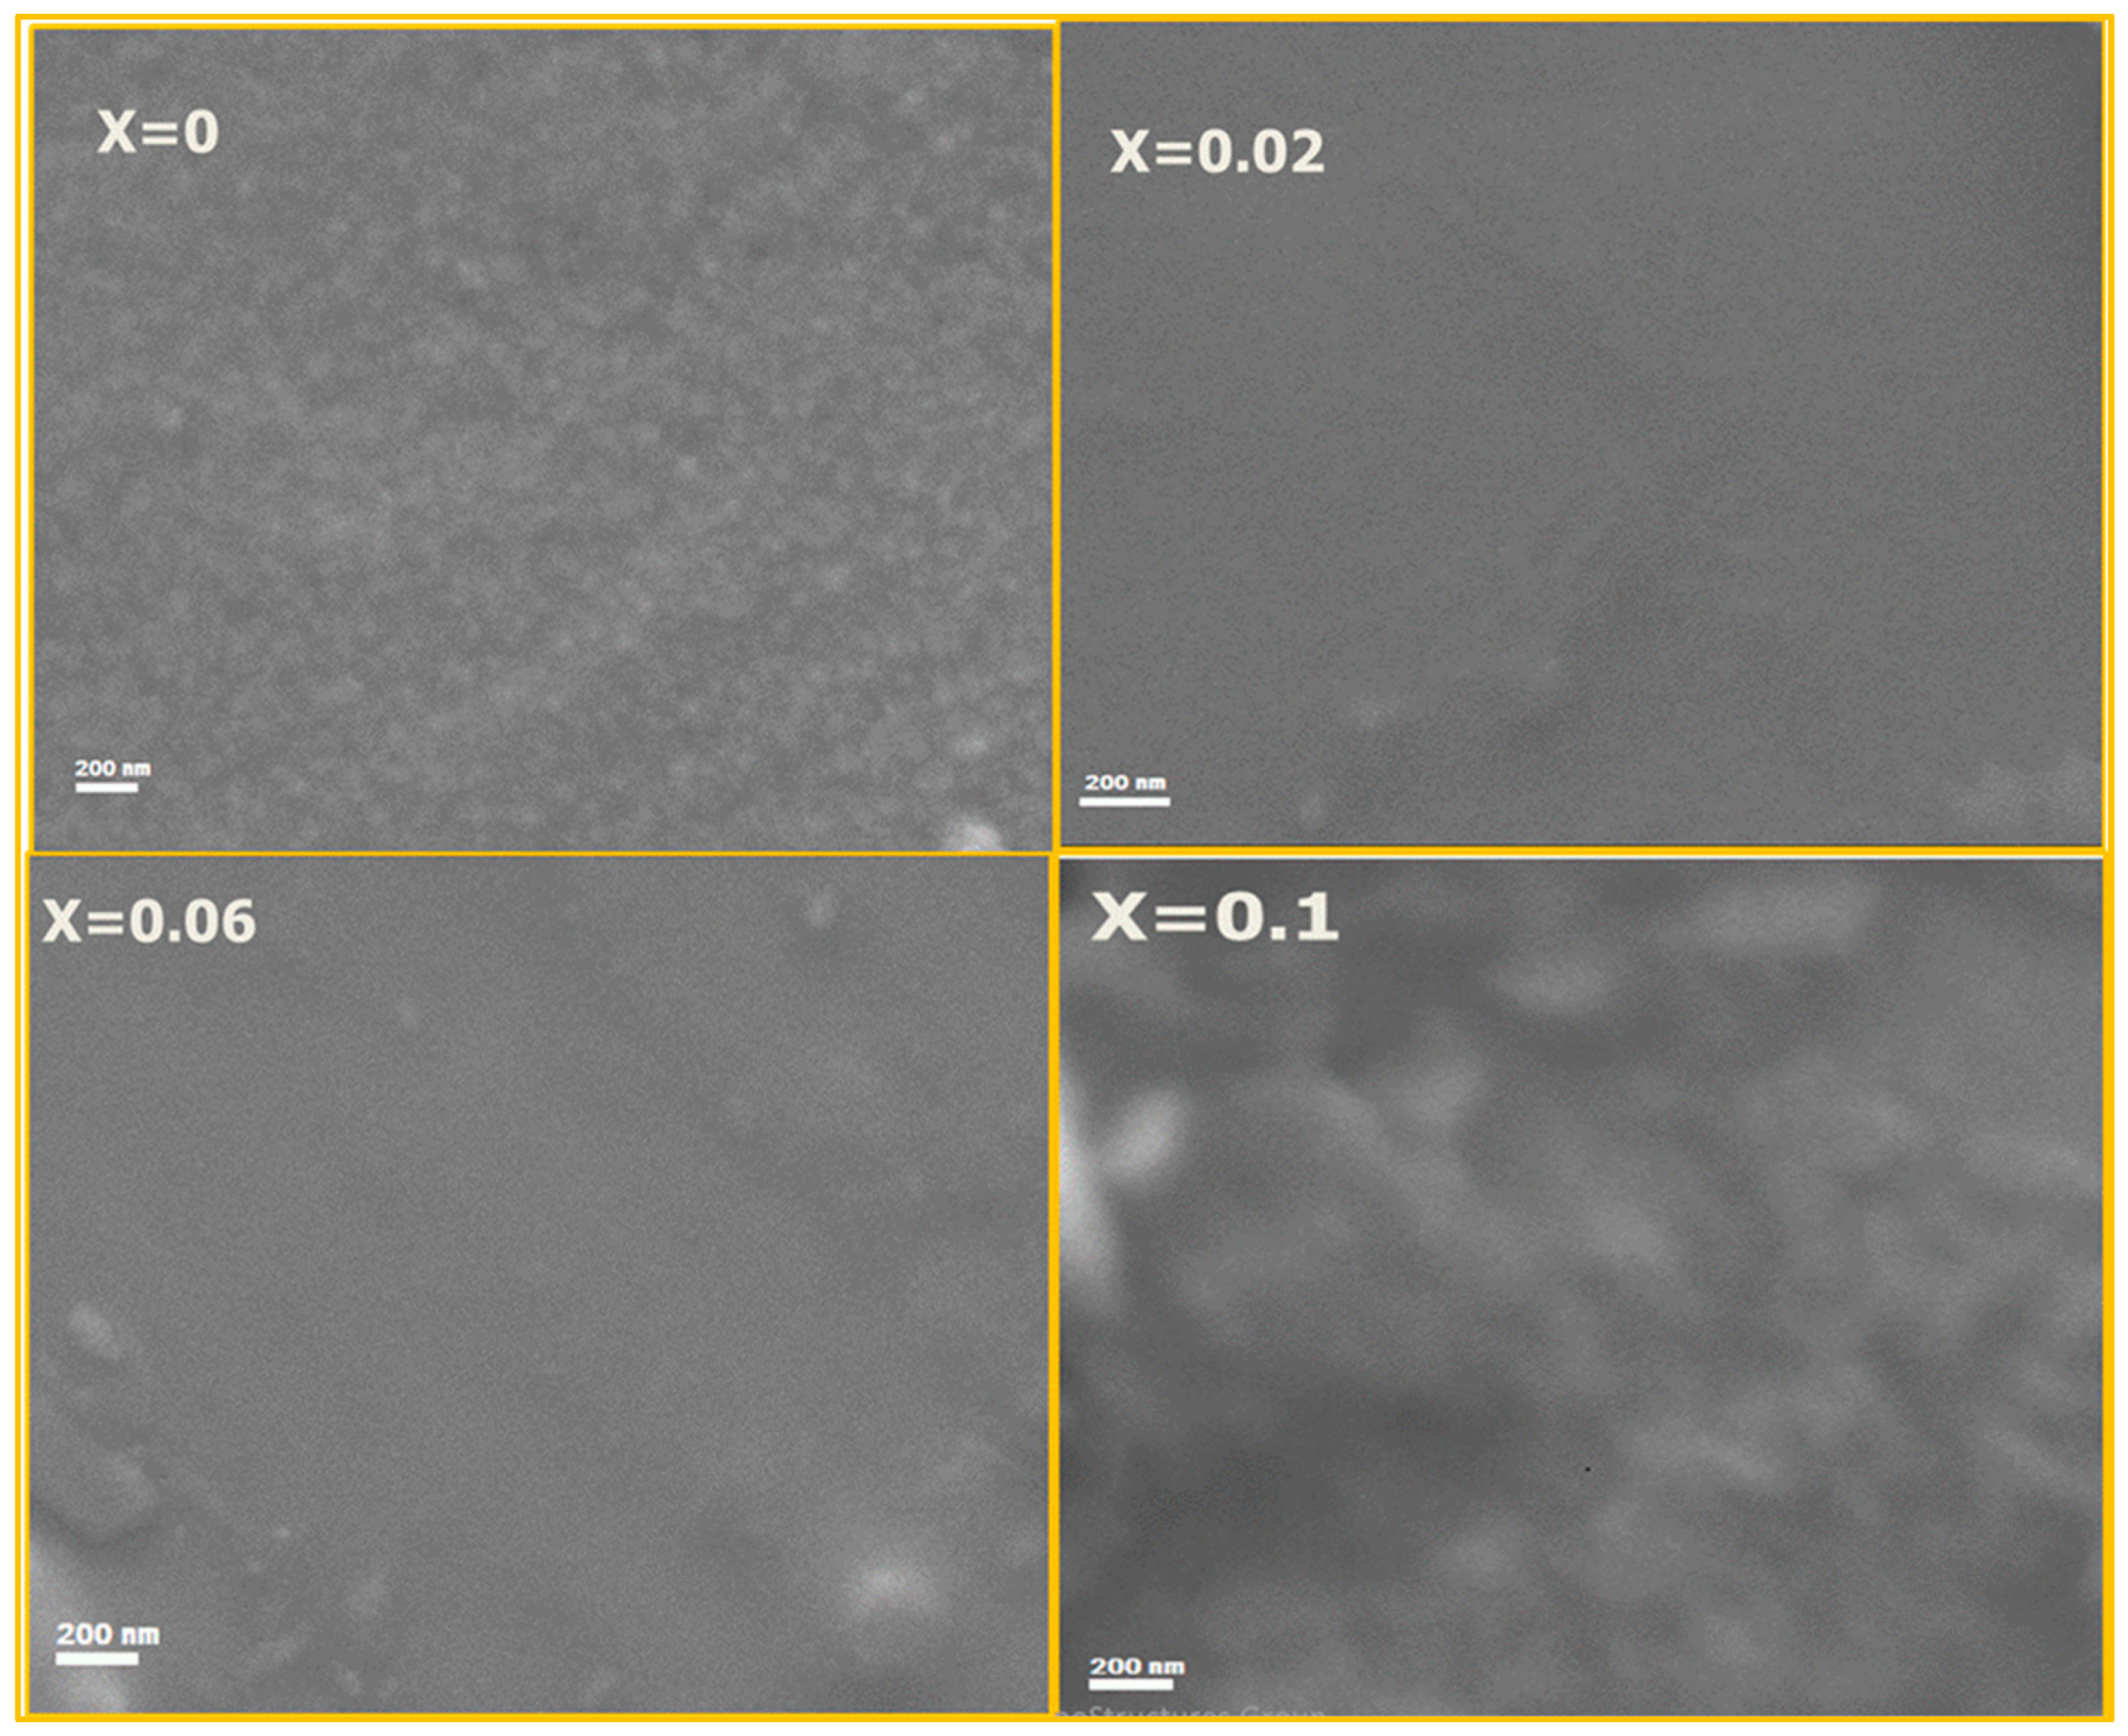
3.3. Scanning Electron Microscope (SEM)
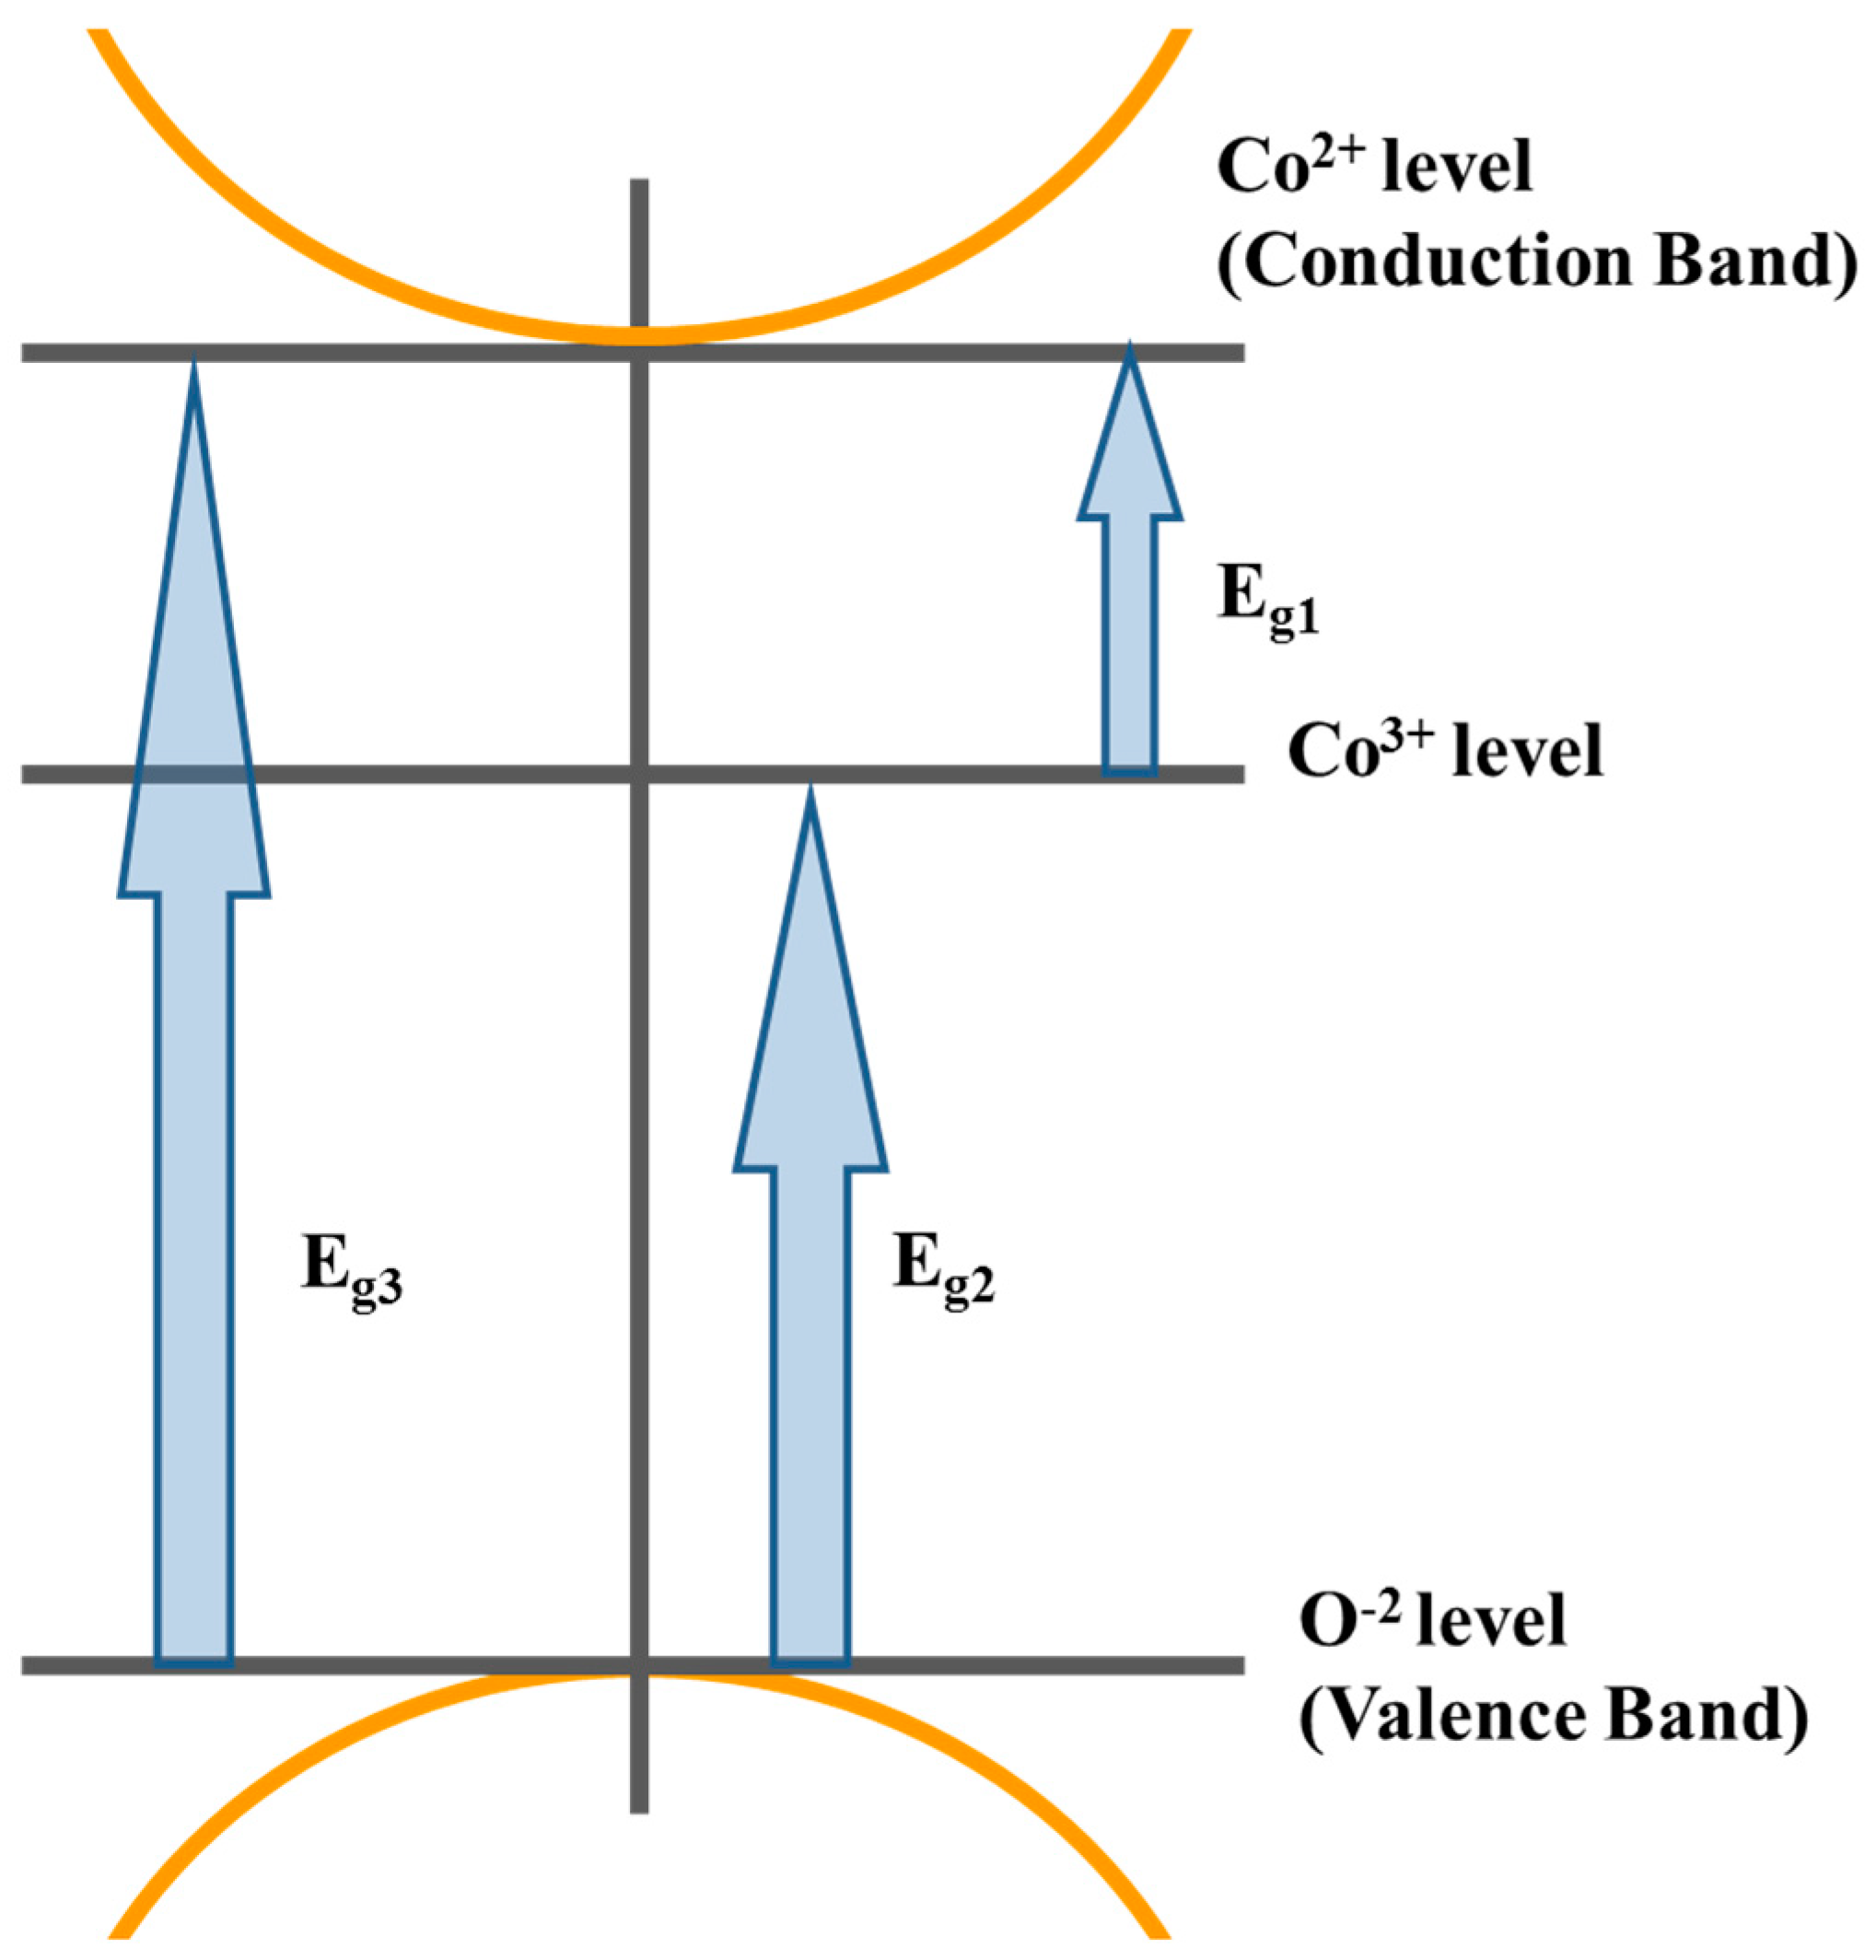
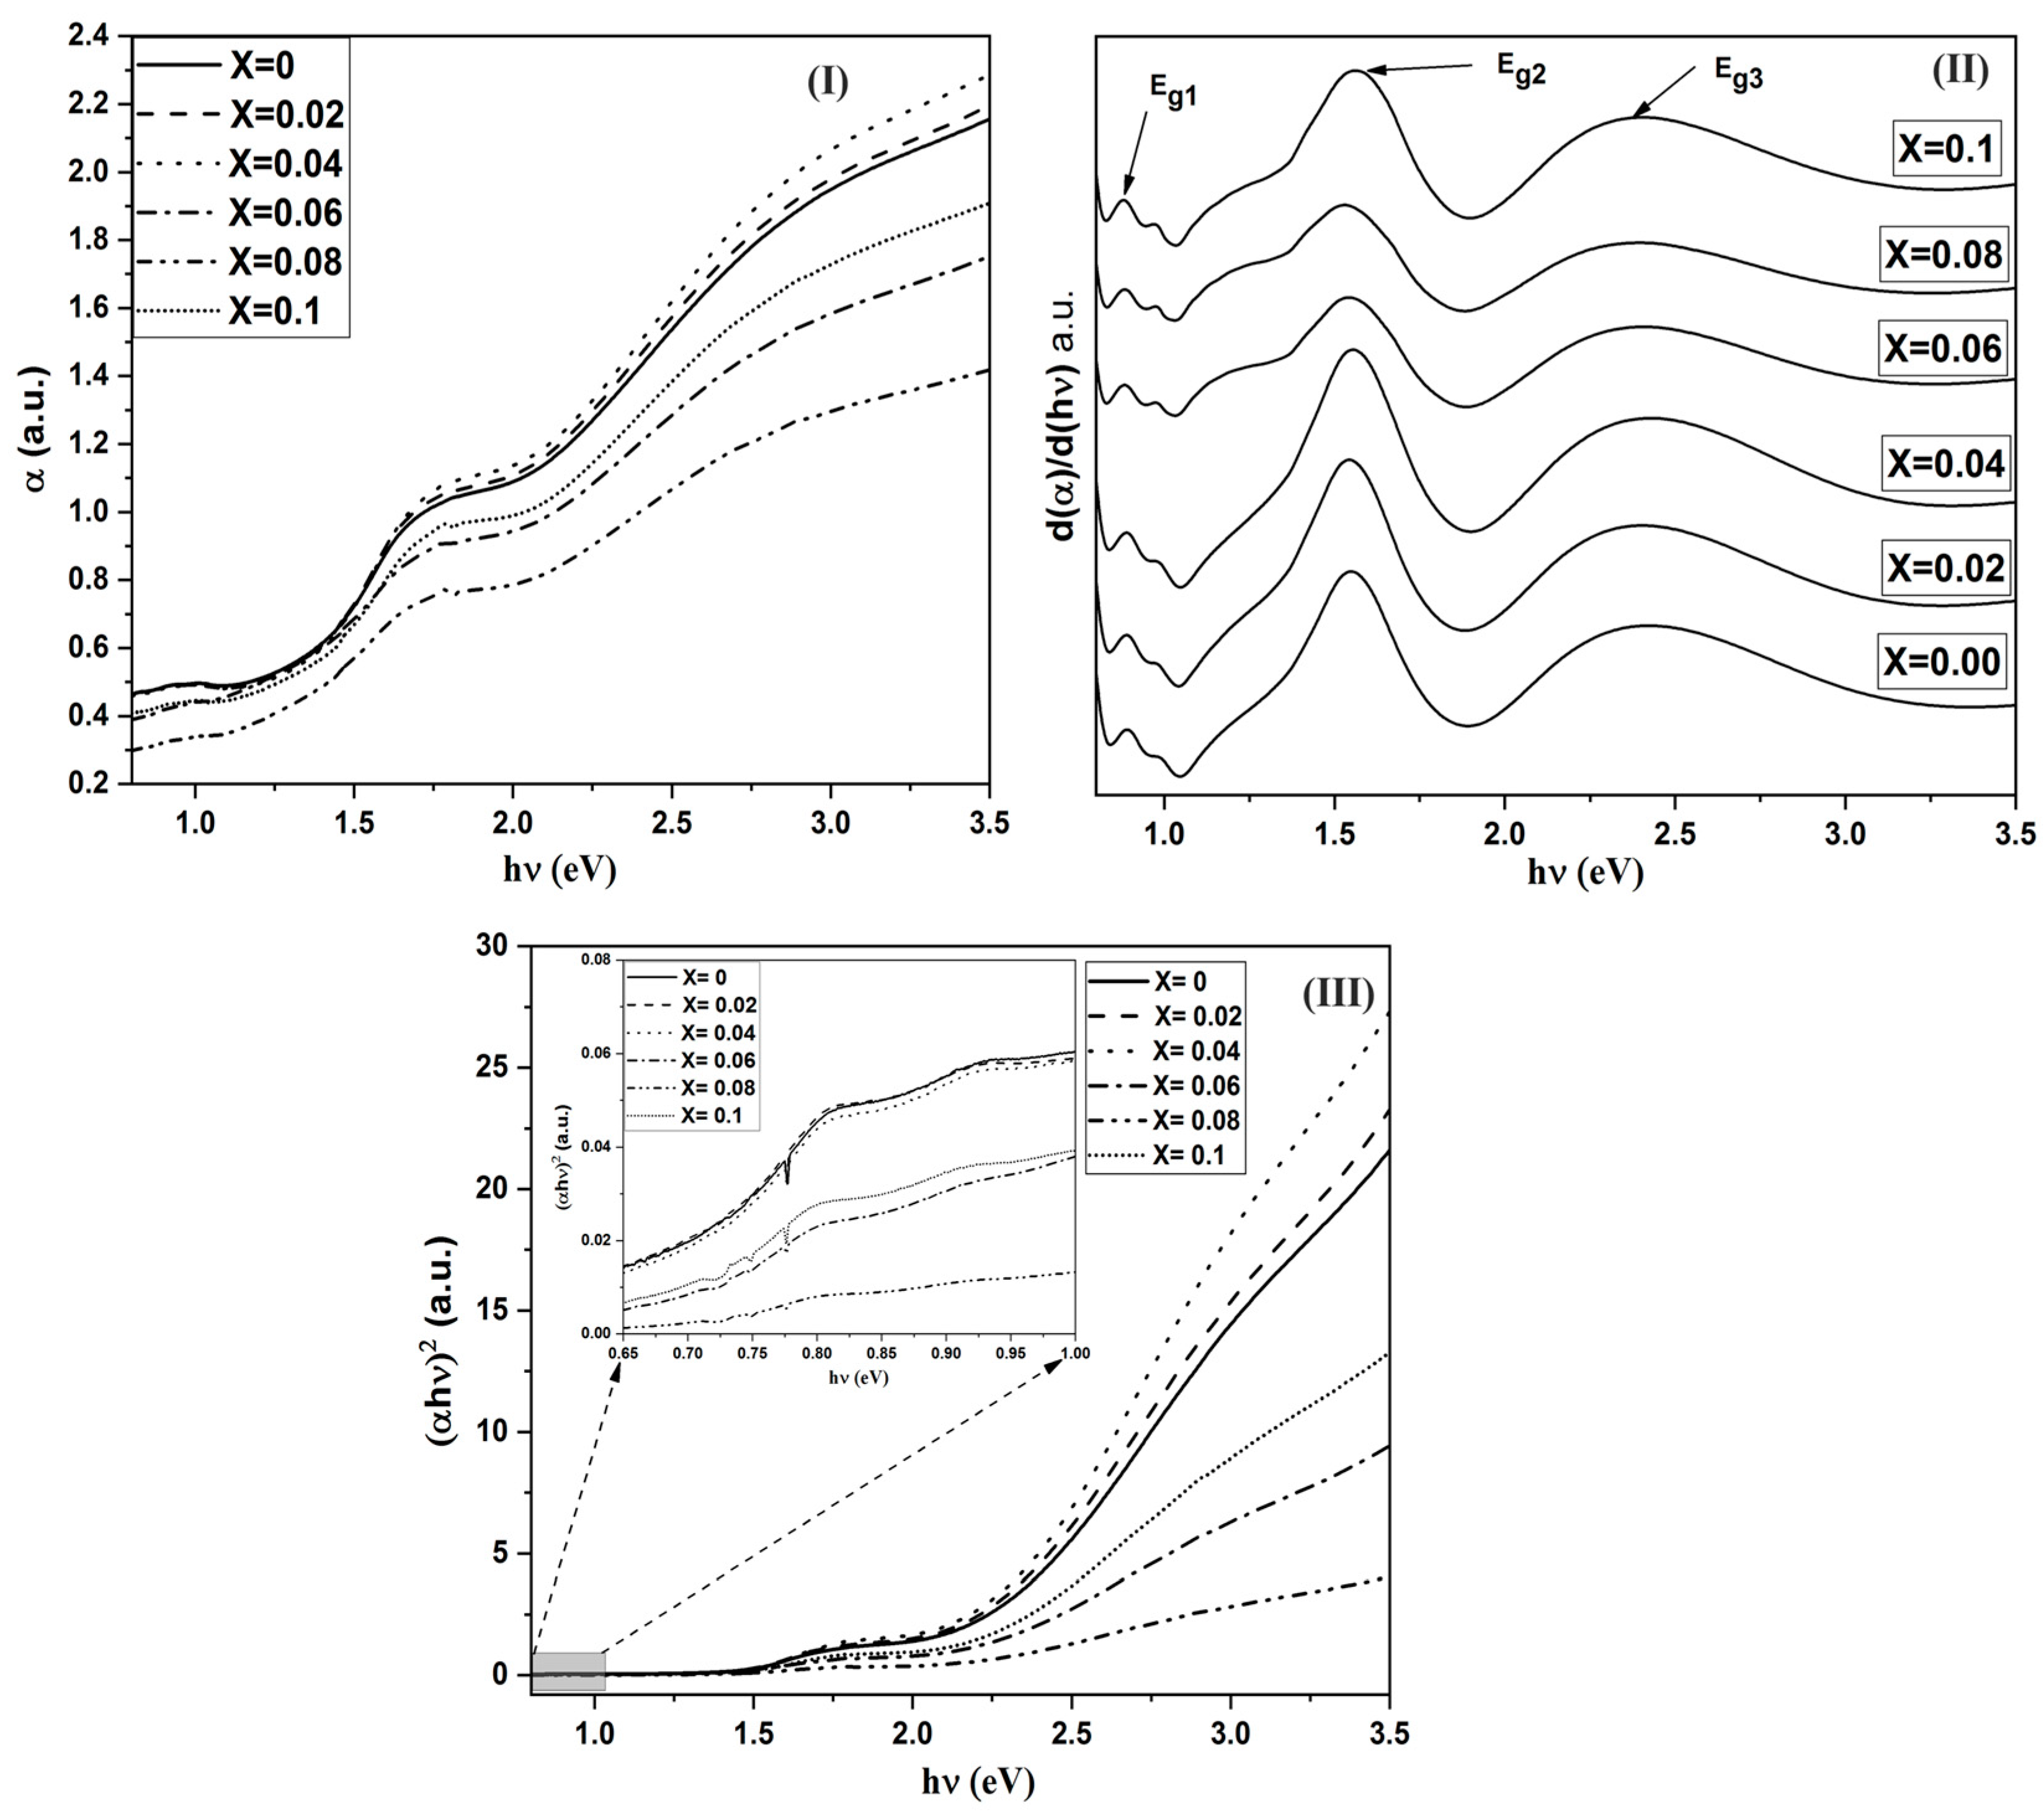
3.4. Optical Properties and Band Gap
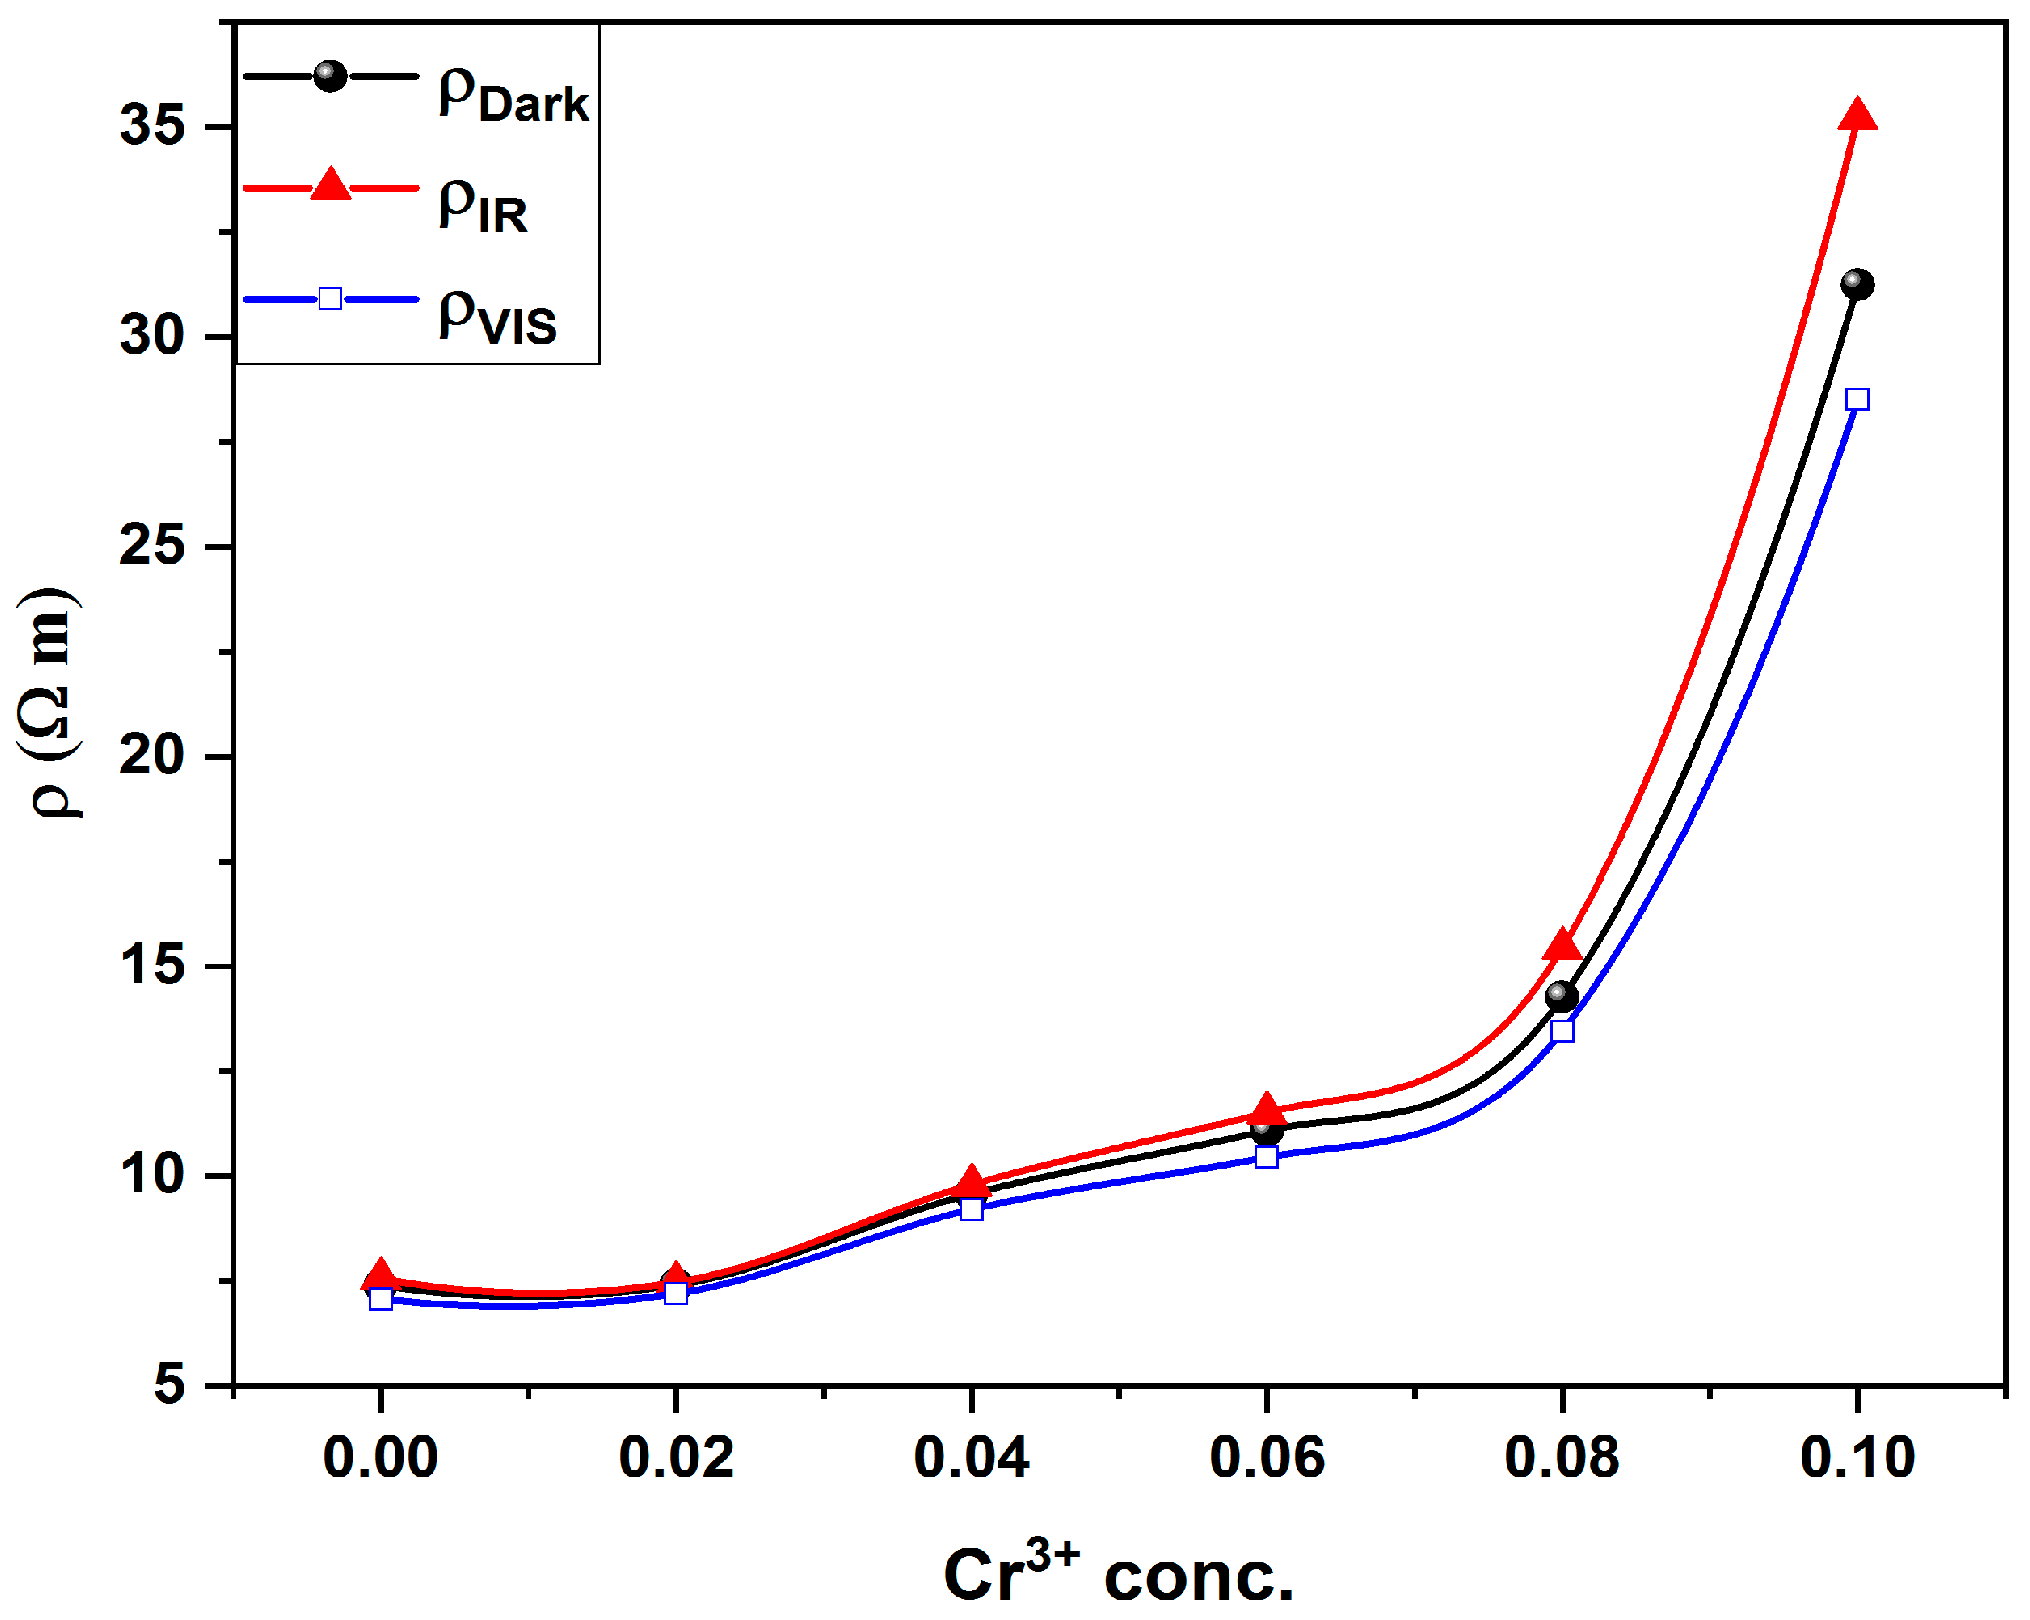
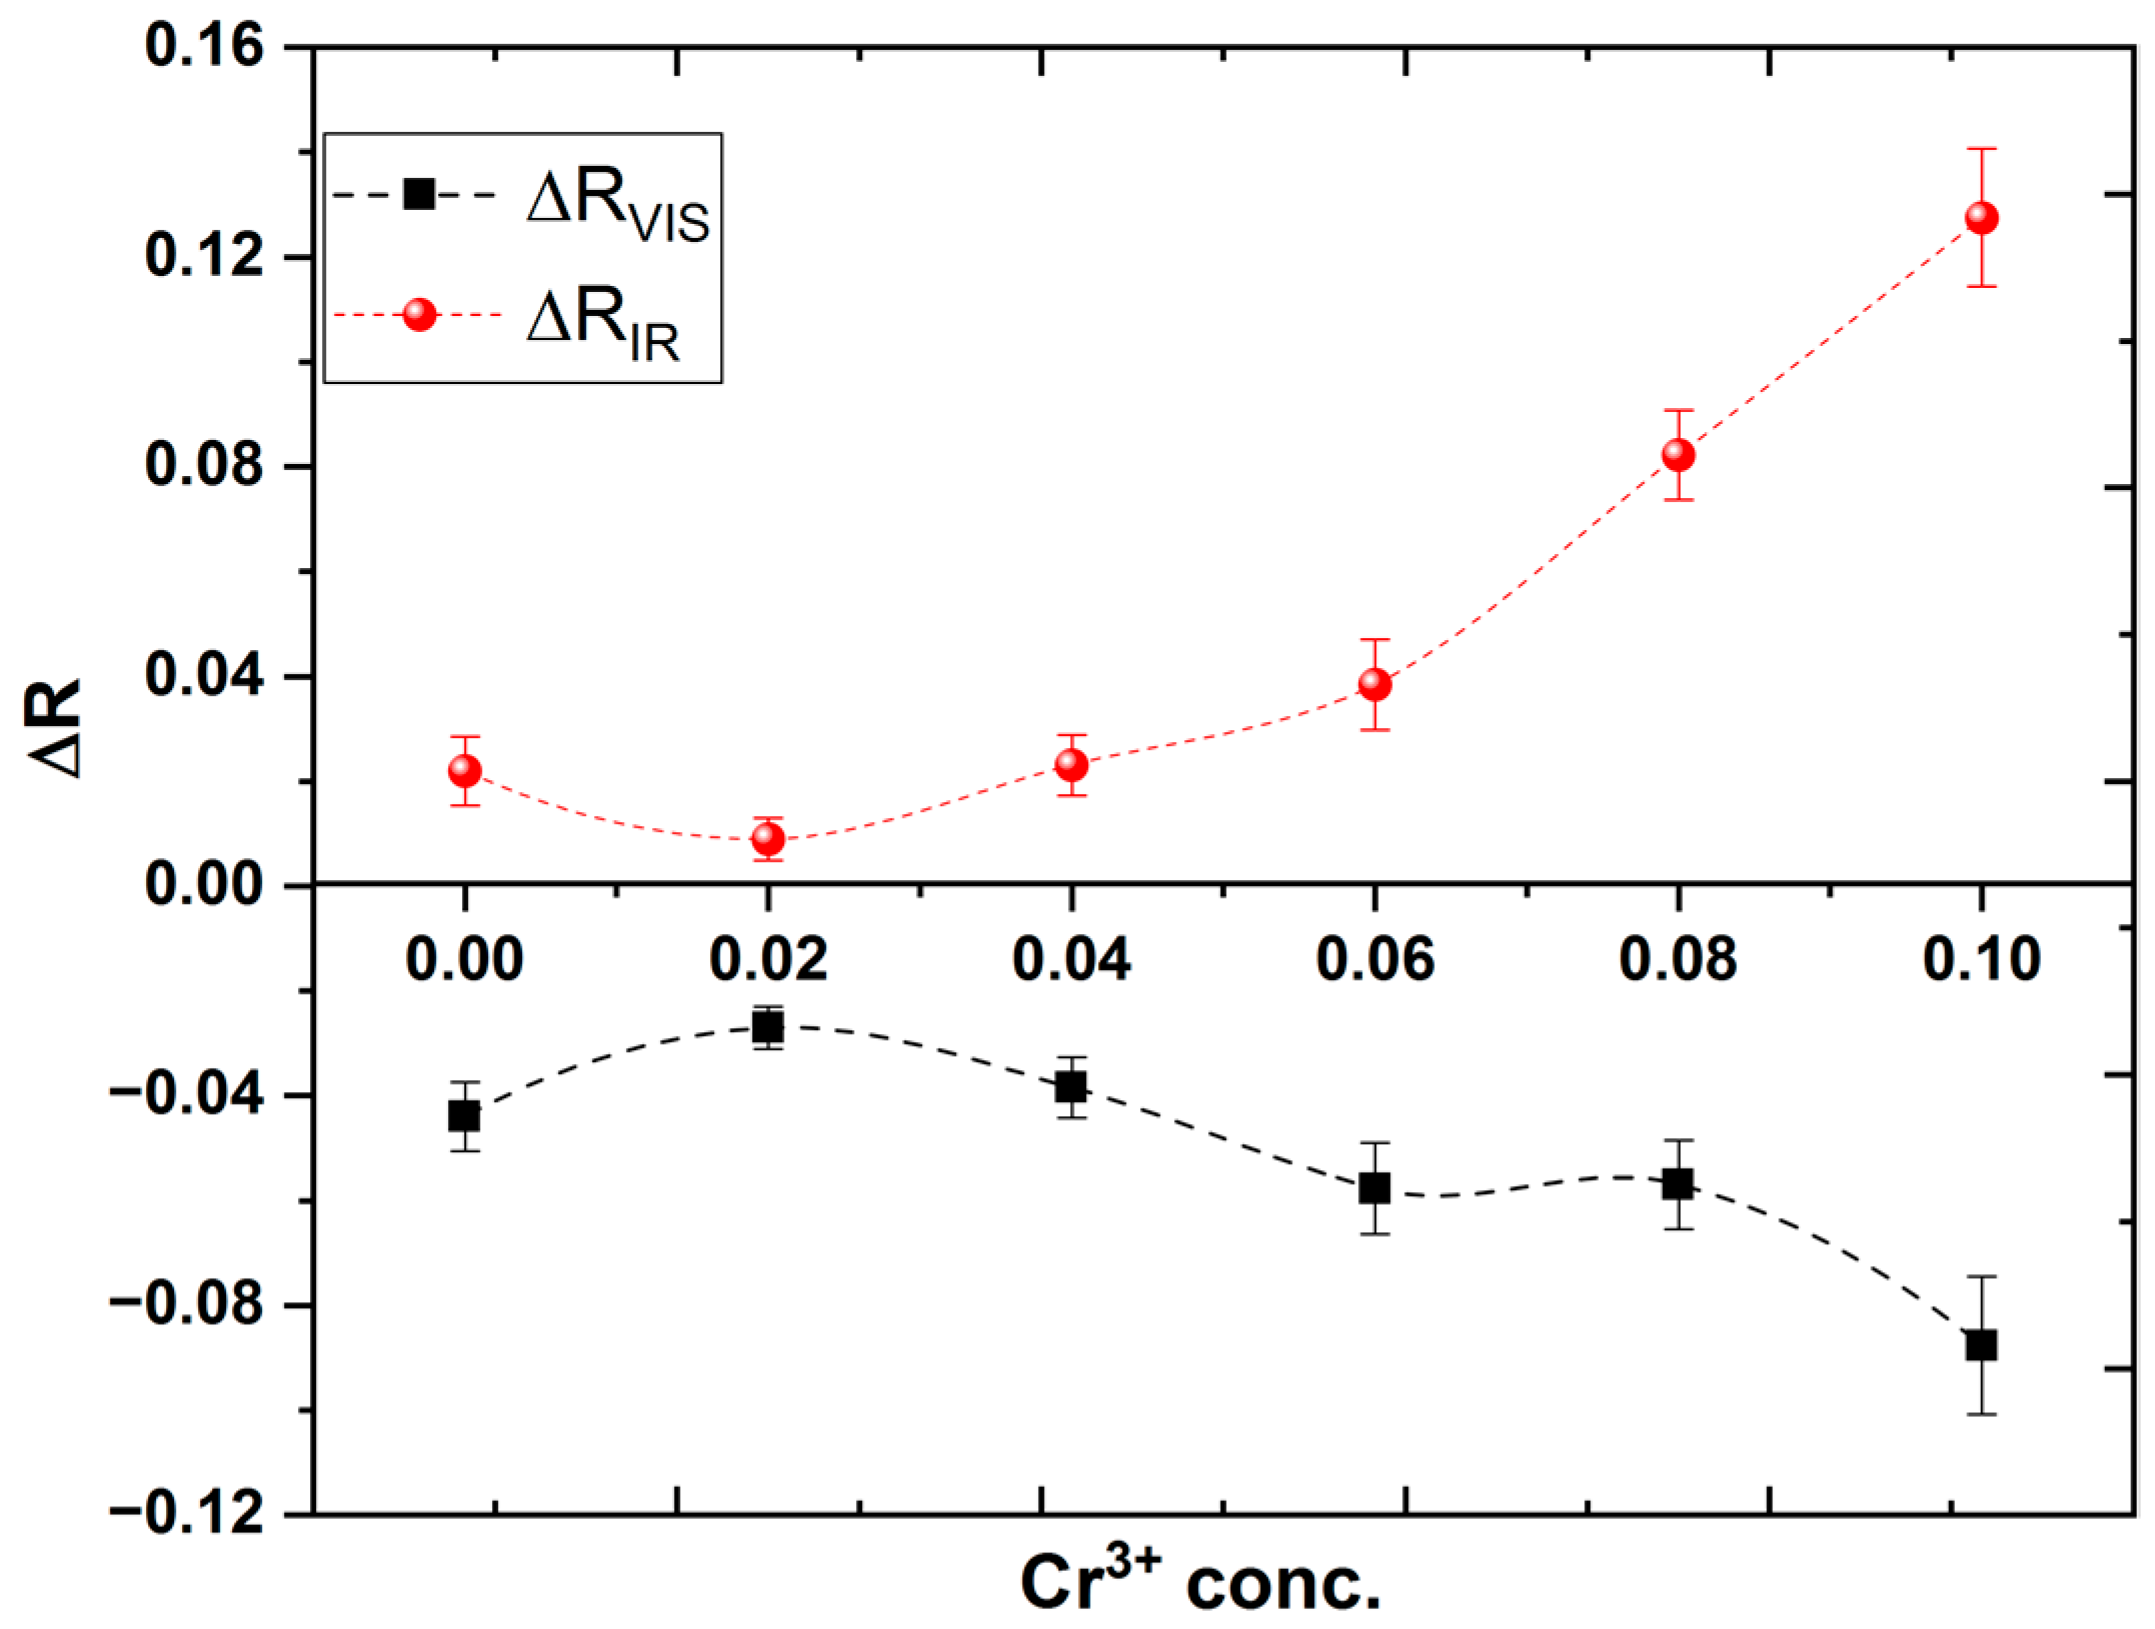
3.5. Photo-Resistance Measurements
- The conduction mechanism in Co3O4 is due to the formation of a small polaron hopping between Co3+ and Co2+. As the Co3+ in the octahedral site is substituted by Cr3+ then the amount of Co3+ decreases and so the hopping between Co3+ and Co2+ decreases and subsequently, the resistivity increases.
- As the ionic radius of Cr3+ is greater than the radius Co3+ then the rate of hopping will be lower because of the large distance between the ions and this in turn will increase the resistivity.
4. Conclusions
Author Contributions
Funding
Institutional Review Board Statement
Data Availability Statement
Acknowledgments
Conflicts of Interest
References
- Siegel, R.W. Cluster-Assembled Nanophase Materials. Annu. Rev. Mater. Sci. 1991, 21, 559–578. [Google Scholar] [CrossRef]
- Kodama, R.H. Magnetic Nanoparticles. J. Magn. Magn. Mater. 1999, 200, 359–372. [Google Scholar] [CrossRef]
- Gleiter, H.H. Gleiter (1989). Prog. Mater. Sci 1989, 33, 323. [Google Scholar]
- Cheng, C.-S.; Serizawa, M.; Sakata, H.; Hirayama, T. Electrical Conductivity of Co3O4 Films Prepared by Chemical Vapour Deposition. Mater. Chem. Phys. 1998, 53, 225–230. [Google Scholar] [CrossRef]
- Raveau, B. Transition Metal Oxides: Promising Functional Materials. J. Eur. Ceram. Soc. 2005, 25, 1965–1969. [Google Scholar] [CrossRef]
- Makhlouf, S.A.; Bakr, Z.H.; Al-Attar, H.; Moustafa, M.S. Structural, Morphological and Electrical Properties of Cr2O3 Nanoparticles. Mater. Sci. Eng. B 2013, 178, 337–343. [Google Scholar] [CrossRef]
- Fouad, O.A.; El-Shall, M.S. Microwave Irradiation Assisted Growth of Cu, Ni, Co Metals And/or Oxides Nanoclusters and Their Catalytic Performance. Nano Brief. Rep. Rev. 2012, 7, 1250034. [Google Scholar] [CrossRef]
- Yamaura, H.; Tamaki, J.; Moriya, K.; Miura, N.; Yamazoe, N. Highly Selective CO Sensor Using Indium Oxide Doubly Promoted by Cobalt Oxide and Gold. J. Electrochem. Soc. 1997, 144, L158. [Google Scholar] [CrossRef]
- Chidambaram, K.; Malhotra, L.K.; Chopra, K.L. Spray-Pyrolysed Cobalt Black as a High Temperature Selective Absorber. Thin Solid Films 1982, 87, 365–371. [Google Scholar] [CrossRef]
- Faramawy, A.M.; Mattei, G.; Scian, C.; Elsayed, H.; Ismail, M.I.M. Cr3+substituted Aluminum Cobalt Ferrite Nanoparticles: Influence of Cation Distribution on Structural and Magnetic Properties. Phys. Scr. 2021, 96, 125849. [Google Scholar] [CrossRef]
- Maruyama, T.; Arai, S. Electrochromic Properties of Cobalt Oxide Thin Films Prepared by Chemical Vapor Deposition. J. Electrochem. Soc. 1996, 143, 1383. [Google Scholar] [CrossRef]
- Granqvist, C.G. Handbook of Inorganic Electrochromic Materials; Elsevier: Amsterdam, The Netherlands, 1995; ISBN 008053290X. [Google Scholar]
- Makhlouf, S.A.; Bakr, Z.H.; Aly, K.I.; Moustafa, M.S. Structural, Electrical and Optical Properties of Co3O4 Nanoparticles. Superlattices Microstruct. 2013, 64, 107–117. [Google Scholar] [CrossRef]
- Zhang, Y.; Chen, Y.; Wang, T.; Zhou, J.; Zhao, Y. Synthesis and Magnetic Properties of Nanoporous Co3O4 Nanoflowers. Microporous Mesoporous Mater. 2008, 114, 257–261. [Google Scholar] [CrossRef]
- Reena, R.S.; Aslinjensipriya, A.; Jose, M.; Das, S.J. Investigation on Structural, Optical and Electrical Nature of Pure and Cr-Incorporated Cobalt Oxide Nanoparticles Prepared via Co-Precipitation Method for Photocatalytic Activity of Methylene Blue Dye. J. Mater. Sci. Mater. Electron. 2020, 31, 22057–22074. [Google Scholar] [CrossRef]
- Singh, R.N.; Koenig, J.; Poillerat, G.; Chartier, P. Electrochemical Studies on Protective Thin Co3O4 and NiCo2O4 Films Prepared on Titanium by Spray Pyrolysis for Oxygen Evolution. J. Electrochem. Soc. 1990, 137, 1408. [Google Scholar] [CrossRef]
- Matthies, S.; Lutterotti, L.; Wenk, H.R. Advances in Texture Analysis from Diffraction Spectra. J. Appl. Crystallogr. 1997, 30, 31–42. [Google Scholar] [CrossRef]
- Kalinic, B.; Girardi, L.; Ragonese, P.; Faramawy, A.; Mattei, G.; Frasconi, M.; Baretta, R.; Bogialli, S.; Roverso, M.; Rizzi, G.A.; et al. Diffusion-Driven Formation of Co3O4 Nanopetals Layers for Photoelectrochemical Degradation of Organophosphate Pesticides. Appl. Surf. Sci. 2022, 596, 153552. [Google Scholar] [CrossRef]
- Liao, W.M.; Zhao, P.P.; Cen, B.H.; Jia, A.P.; Lu, J.Q.; Luo, M.F. Co–Cr–O Mixed Oxides for Low–temperature Total Oxidation of Propane: Structural Effects, Kinetics, and Spectroscopic Investigation. Chin. J. Catal. 2020, 41, 442–453. [Google Scholar] [CrossRef]
- Roth, W.L. The Magnetic Structure of Co3O4. J. Phys. Chem. Solids 1964, 25, 1–10. [Google Scholar] [CrossRef]
- Lutterotti, L.; Gualtieri, A.; Aldrighetti, S. Rietveld Refinement Using Debye-Scherrer Film Techniques. Mater. Sci. Forum 1996, 228–231, 29–34. [Google Scholar] [CrossRef]
- Williamson, G.; Hall, W. X-ray Line Broadening from Filed Aluminium and Wolfram. Acta Metall. 1953, 1, 22–31. [Google Scholar] [CrossRef]
- Amer, M.A.; Meaz, T.M.; Attalah, S.S.; Ghoneim, A.I. Annealing Effect on Structural Phase Transition of as-Synthesized Mg0.1Sr0.1Mn0.8Fe2O4 Nanoparticles. J. Alloys Compd. 2016, 654, 45–55. [Google Scholar] [CrossRef]
- Kaviyarasu, K.; Raja, A.; Devarajan, P.A. Structural Elucidation and Spectral Characterizations of Co3O4 Nanoflakes. Spectrochim. Acta Part A Mol. Biomol. Spectrosc. 2013, 114, 586–591. [Google Scholar] [CrossRef]
- Tang, C.W.; Wang, C.B.; Chien, S.H. Characterization of Cobalt Oxides Studied by FT-IR, Raman, TPR and TG-MS. Thermochim. Acta 2008, 473, 68–73. [Google Scholar] [CrossRef]
- Roy, M.; Ghosh, S.; Naskar, M.K. Solvothermal Synthesis of Cr2O3 Nanocubes via Template-Free Route. Mater. Chem. Phys. 2015, 159, 101–106. [Google Scholar] [CrossRef]
- Hitkari, G.; Sandhya, S.; Gajanan, P.; Shrivash, M.K.; Deepak, K. Synthesis of Chromium Doped Cobalt Oxide (Cr: Co3O4) Nanoparticles by Co-Precipitation Method and Enhanced Photocatalytic Properties in the Visible Region. J. Mater. Sci. Eng 2018, 7, 2169–2222. [Google Scholar]
- Pal, J.; Chauhan, P. Study of Physical Properties of Cobalt Oxide (Co3O4) Nanocrystals. Mater. Charact. 2010, 61, 575–579. [Google Scholar] [CrossRef]
- Jacobs, J.-P.; Maltha, A.; Reintjes, J.G.H.; Drimal, J.; Ponec, V.; Brongersma, H.H. The Surface of Catalytically Active Spinels. J. Catal. 1994, 147, 294–300. [Google Scholar] [CrossRef]
- Shelef, M.; Wheeler, M.A.Z.; Yao, H.C. Ion Scattering Spectra from Spinel Surfaces. Surf. Sci. 1975, 47, 697–703. [Google Scholar] [CrossRef]
- Smart, T.; Pham, T.A.; Ping, Y.; Ogitsu, T. The Nature of Band Gap of Co3O4-a Revisit from First-Principles. APS March Meet. Abstr. 2019, 2019, C11.006. [Google Scholar]
- Tauc, J.; Grigorovici, R.; Vancu, A. Optical Properties and Electronic Structure of Amorphous Germanium. Phys. Status Solidi (b) 1966, 15, 627–637. [Google Scholar] [CrossRef]
- Mott, N.F.; Davis, E.A. Conduction in Non-Crystalline Systems V. Conductivity, Optical Absorption and Photoconductivity in Amorphous Semiconductors. Philos. Mag. 1970, 22, 903–922. [Google Scholar]
- Louardi, A.; Rmili, A.; Ouachtari, F.; Bouaoud, A.; Elidrissi, B.; Erguig, H. Characterization of Cobalt Oxide Thin Films Prepared by a Facile Spray Pyrolysis Technique Using Perfume Atomizer. J. Alloys Compd. 2011, 509, 9183–9189. [Google Scholar] [CrossRef]


| Cr Content (x) | 0 | 0.02 | 0.04 | 0.06 | 0.08 | 0.1 |
|---|---|---|---|---|---|---|
| a(Å) | 8.087 | 8.113 | 8.117 | 8.123 | 8.128 | 8.130 |
| V (Å3) | 528.97 | 533.9 | 534.8 | 536.11 | 536.97 | 537.38 |
| R (nm) | 8.2 | 4.5 | 6.9 | 4.5 | 5.7 | 5.3 |
| Dx-ray (g cm−3) | 6.047 | 5.987 | 5.974 | 5.953 | 5.943 | 5.935 |
| ε × 10−3 | 3.50 | 2.70 | 9.70 | 11.4 | 16.7 | 22.5 |
| δ× 10−3(nm−2) | 15.2 | 50.1 | 20.9 | 15.2 | 30.1 | 34.4 |
| Eg1 (eV) | Eg2 (eV) | Eg3 (eV) | ||||
|---|---|---|---|---|---|---|
| X | Derivative | Tauc | Derivative | Tauc | Derivative | Tauc |
| 0 | 0.79 | 0.80 | 1.55 | 1.46 | 2.42 | 2.22 |
| 0.02 | 0.79 | 0.82 | 1.54 | 1.46 | 2.42 | 2.22 |
| 0.04 | 0.79 | 0.82 | 1.55 | 1.47 | 2.42 | 2.211 |
| 0.06 | 0.78 | 0.80 | 1.54 | 1.44 | 2.42 | 2.19 |
| 0.08 | 0.78 | 0.81 | 1.53 | 1.45 | 2.40 | 2.18 |
| 0.1 | 0.78 | 0.82 | 1.55 | 1.47 | 2.41 | 2.21 |
Disclaimer/Publisher’s Note: The statements, opinions and data contained in all publications are solely those of the individual author(s) and contributor(s) and not of MDPI and/or the editor(s). MDPI and/or the editor(s) disclaim responsibility for any injury to people or property resulting from any ideas, methods, instructions or products referred to in the content. |
© 2023 by the authors. Licensee MDPI, Basel, Switzerland. This article is an open access article distributed under the terms and conditions of the Creative Commons Attribution (CC BY) license (https://creativecommons.org/licenses/by/4.0/).
Share and Cite
Faramawy, A.M.; Elsayed, H.; Sabry, M.; El-Sayed, H.M. The Effect of Opto-Electronic Transition Type on the Electric Resistivity of Cr-Doped Co3O4 Thin Films. Coatings 2023, 13, 328. https://doi.org/10.3390/coatings13020328
Faramawy AM, Elsayed H, Sabry M, El-Sayed HM. The Effect of Opto-Electronic Transition Type on the Electric Resistivity of Cr-Doped Co3O4 Thin Films. Coatings. 2023; 13(2):328. https://doi.org/10.3390/coatings13020328
Chicago/Turabian StyleFaramawy, A. M., Hamada Elsayed, Mohamed Sabry, and H. M. El-Sayed. 2023. "The Effect of Opto-Electronic Transition Type on the Electric Resistivity of Cr-Doped Co3O4 Thin Films" Coatings 13, no. 2: 328. https://doi.org/10.3390/coatings13020328
APA StyleFaramawy, A. M., Elsayed, H., Sabry, M., & El-Sayed, H. M. (2023). The Effect of Opto-Electronic Transition Type on the Electric Resistivity of Cr-Doped Co3O4 Thin Films. Coatings, 13(2), 328. https://doi.org/10.3390/coatings13020328