Article

Experimental Study on Cutting Force and Surface Integrity of TC4 Titanium Alloy with Longitudinal Ultrasonic-Assisted Milling

1
School of Mechanical and Power Engineering, Henan Polytechnic University, Jiaozuo 454000, China
2
Henan Province Engineering Research Center of Ultrasonic Technology Application, Pingdingshan University, Pingdingshan 467000, China
*
Authors to whom correspondence should be addressed.
Coatings 2023, 13(10), 1725; https://doi.org/10.3390/coatings13101725
Submission received: 17 August 2023 / Revised: 27 September 2023 / Accepted: 1 October 2023 / Published: 2 October 2023
(This article belongs to the Special Issue Recent Advances in the Machining of Metals and Composites)

Abstract

:
The ultrasonic vibration-assisted milling process was used to study the difficult-to-machine aerospace material titanium alloy TC4 and explore the milling parameters that fit the processing. Based on the orthogonal experimental method, the changes in cutting force, roughness, and surface morphology under conventional and ultrasonic-assisted milling conditions were studied, and the relationship between various processing parameters and their effects was obtained. The results showed that the cutting force was most affected by the feed per tooth and cutting depth. Adding ultrasonic vibration could change the surface texture and significantly impact roughness. By adding an appropriate amplitude of ultrasonic-assisted milling, the maximum average cutting force can be reduced by more than 20.66%, and the maximum surface roughness can be reduced by 44.23%, making the workpiece surface produce regular “sine/cosine” patterns and improving the surface quality of the workpiece. Compared with conventional milling, the deformation layer of the workpiece slightly increased under ultrasonic-assisted milling. The cutting force and surface roughness of titanium alloy TC4 under ultrasonic-assisted milling were reduced. A reasonable selection of processing parameters can further improve cutting force and other parameters, providing a reference basis for the processing of aerospace materials.

1. Introduction

Titanium alloys have excellent comprehensive properties, such as low density, high strength, high temperature resistance, and corrosion resistance, and their application in fields such as aviation, aerospace, navigation, and automobiles has received special attention. Titanium alloys have the characteristics of a low deformation coefficient, high temperature strength, and low elastic modulus; it is worth mentioning that the specific strength of the best titanium alloy is almost twice that of alloy steel, so during the cutting process the tool wear is severe, the cutting force is large, the cutting temperature is high, and the processing quality is uncontrollable. The relative cutting performance is poor. With the widespread use of titanium alloys, conventional cutting processes inevitably limit titanium alloy components’ precision, efficiency, and high-quality processing. Compared to conventional machining, ultrasonic-assisted machining with high frequency and small amplitude has exhibited good cutting performances for advanced materials. In recent years, advances in the ultrasonic generator, ultrasonic transducer, and horn structures have led to the rapid progress in the development of ultrasonic-assisted machining [1]. The application of an ultrasonic vibration system has evolved from one-dimensional to three-dimensional. The cutting characteristics and mechanism of periodic contact separation between tool and workpiece have also been deeply studied, and a variety of theoretical models have also been repeatedly verified and improved in a large number of practices [2,3]. Ultrasonic-assisted machining technology can effectively reduce cutting force [4,5], improve part of the surface characteristics [6], and refine subsurface microstructure, due to its pulse enhancement effect [7], cavitation effect, and other characteristics of intermittent cutting. It is an important development direction to apply ultrasonic-assisted machining technology to the cutting process of difficult-to-machine materials [8,9]. In addition, compared with conventional cutting processes, during the ultrasonic-assisted machining process, due to the dynamic stress state, high strain rate, and local thermal-mechanical coupling, the subsurface structure of the workpiece inevitably changes [10]. However, there is currently little research on the phase transformation of the surface and subsurface during ultrasonic-assisted machining, so it is important to study the microstructure evolution mechanism of the surface and subsurface of titanium alloys during ultrasonic-assisted machining [11]. Currently, research on titanium alloy materials mainly focuses on high-speed cutting [12,13], machining deformation [14], material modification [15], composite machining [16], and other machining methods. The main evaluation indicators for related research are cutting force [17,18], cutting heat [19,20], chip morphology [21,22], tool wear [23,24,25,26,27], and surface microstructure [28], and the main research objectives are to improve machining efficiency and surface quality.
The fatigue failure of parts originates from surface or subsurface defects, and all wear and corrosion of parts occurs on the surface [29,30]. The quality of the processed surface and the microstructure state of the subsurface area have a significant impact on preventing component failure and extending service life [31,32]. Therefore, the integrity of the machined surface of key components has become an important evaluation indicator of manufacturing quality. At present, there are many studies evaluating the surface and subsurface properties of cutting processing, which not only depend on the characteristics of the material itself, but also on the processing method used [33,34]. Tej Pratap et al. used the Johnson–Cook constitutive equation to establish a cutting force model during the milling process. Through simulation, the stress distribution, cutting force stress distribution, and mechanism of titanium alloy Ti6Al4V during the milling process were studied. Combined with experimental content, the cutting force was successfully simulated and the correctness of the model was verified [35]. Niu Ying et al. conducted longitudinal and torsional ultrasonic vibration-assisted milling on titanium alloy Ti6Al4V. They compared the differences in cutting force, residual stress, and cutting temperature under traditional milling, and combined orthogonal experiments and single-factor experiments to study the influence of residual stress and other parameters. Finally, it was concluded that longitudinal and torsional ultrasonic vibration-assisted milling can effectively reduce cutting force and cutting temperature and increase surface residual compressive stress [36]. Wang Xiaoming et al. studied the surface roughness of titanium alloy TC4 under high-speed milling, and used orthogonal experiments to analyze the influence of various milling parameters on surface roughness. By analyzing the range, the trend of the influence of milling parameters on surface roughness was described [37].
This article focuses on the study of TC4 titanium alloy. Under the condition of longitudinal ultrasonic-assisted milling, an orthogonal experimental design is proposed to investigate the effects of milling parameters on cutting force, roughness and surface morphology, and the section layer changes of the workpiece under ultrasonic-assisted machining conditions. The results provide a basis for precision and ultra-precision machining of TC4 titanium alloy.

2. Materials and Methods

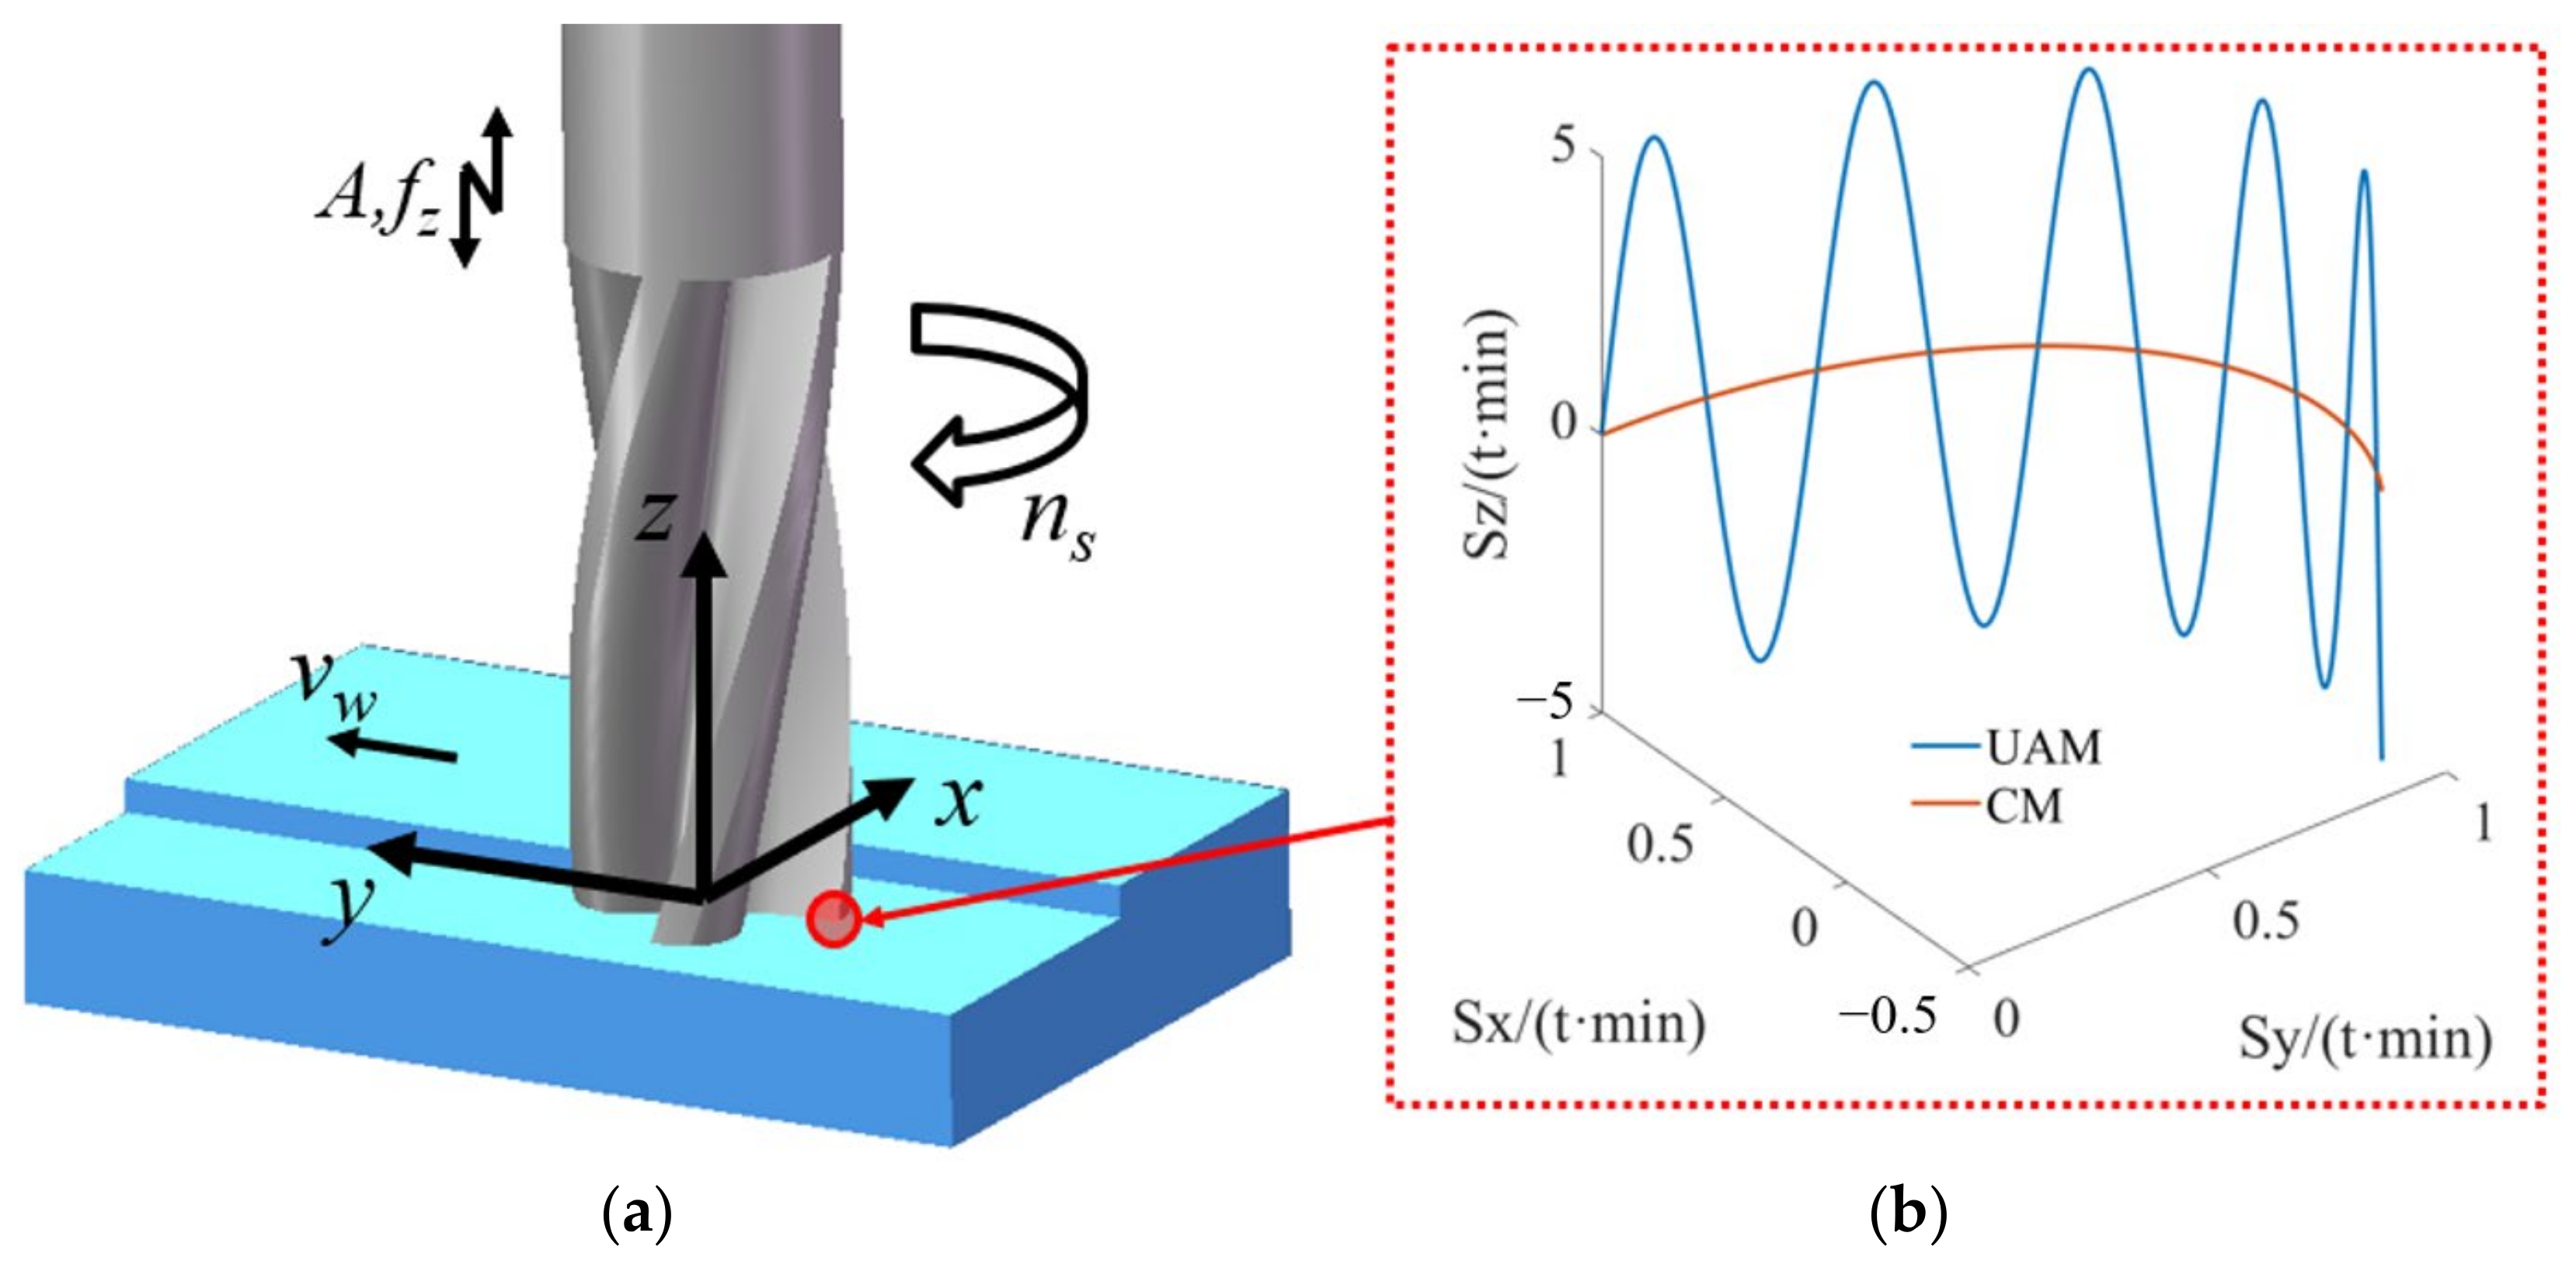
2.1. Longitudinal Ultrasonic Milling Characteristics

A Cartesian coordinate system was established in this study based on the milling process system, and ultrasonic-assisted milling was adopted. The tool had a high-frequency periodic displacement in the axial direction. During processing, the tool’s vibration was applied to the milling workpiece, thereby changing the cutting force and surface roughness during milling. The tool edge motion path in the LUAM system can be expressed by the following system of equations:
x ( t ) = R sin 2 π n s t 60 y ( t ) = v w t + R cos 2 π n s t 60 z ( t ) = A sin ( 2 π f z   t )
where R is the tool radius, ns is the tool rotation speed around the main axis, vw is the tool cutting speed along the y-axis, A is the longitudinal amplitude of the ultrasonic wave, and fZ is the longitudinal vibration frequency of the ultrasonic wave, while z(t) = 0 represents no ultrasonic assistance, i.e., conventional milling (CM).
The LUAM principle and tool edge motion path model are illustrated in Figure 1.

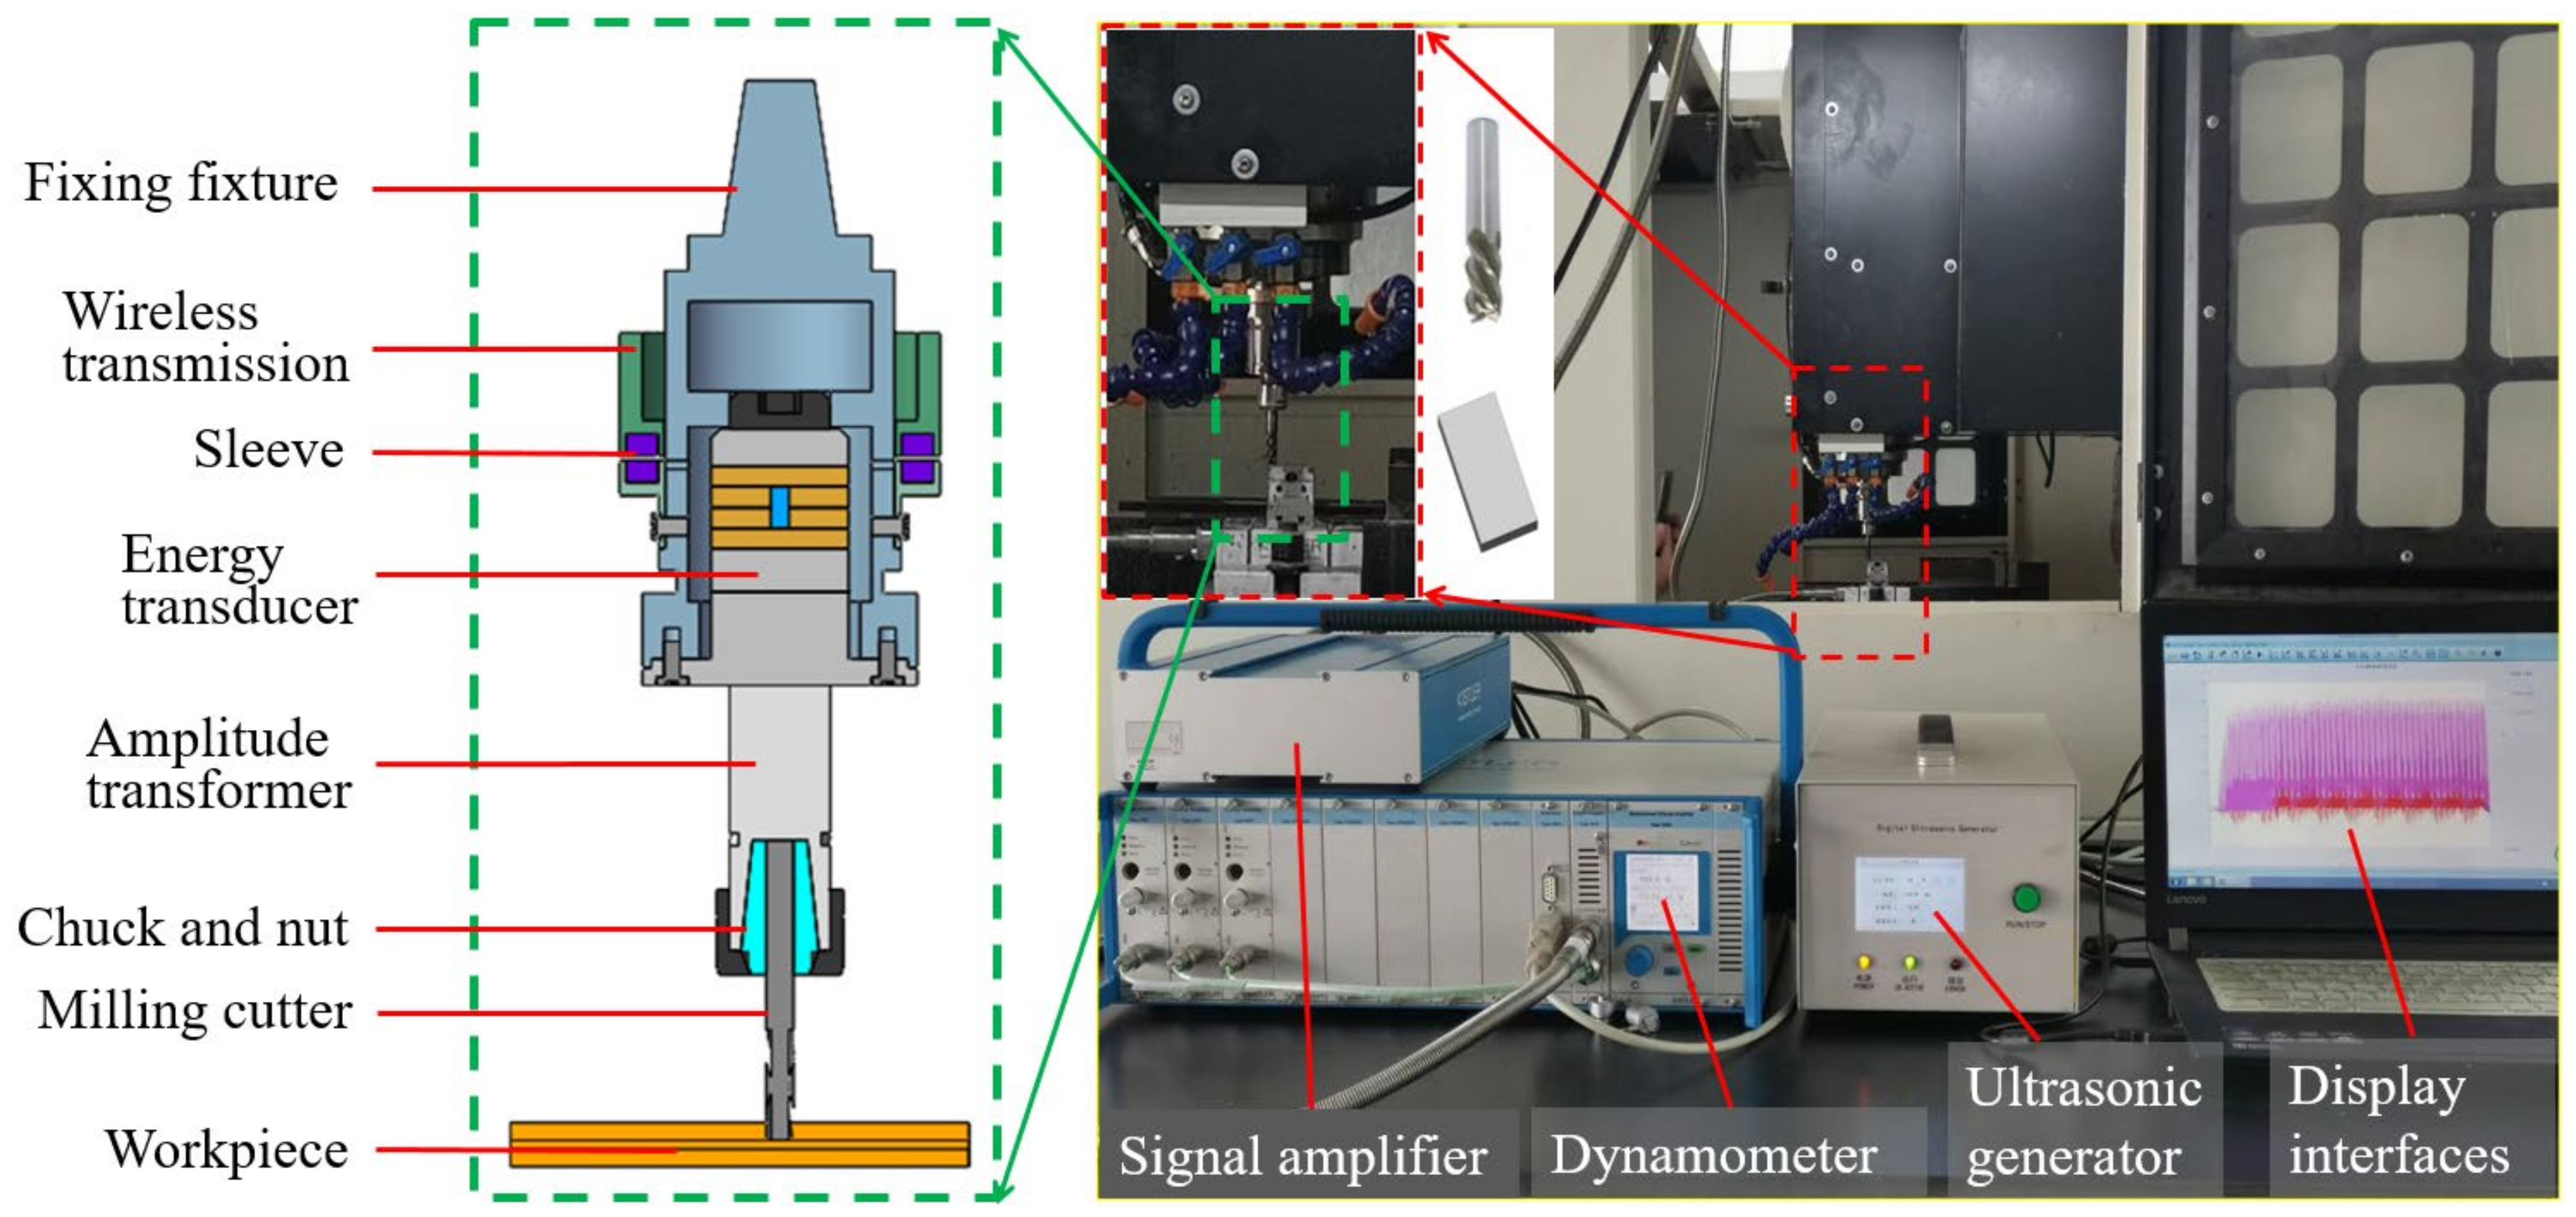
2.2. Experimental Setup

The milling test machine used in this study comprised a CNC machining center (Henfux-HFM 700 L) coupled with an ultrasonic processing system and a cutting force measurement acquisition system (Swiss Kistler Instruments Co., Ltd., Winterthur, Switzerland), milling force-acquisition system type 9119AA2, and with a signal amplifier (type 5080A) on the machine. The machine spindle included a piezoelectric transducer, an ultrasonic amplitude rod, and a tool holder. The experimental setup is shown in Figure 2.
During operation, the transmitting coil fixed on the machine spindle and the receiving coil rotating coaxially with the spindle generated induction to power the transducer. The piezoelectric transducer generated the ultrasonic vibration in the coaxial direction along the spindle axis, with a vibration frequency of 24.8 kHz. The appropriate processing amplitude was amplified by the amplitude rod and transferred to the tool cutting edge.
The TC4 titanium alloy cutting test piece (workpiece) had 15 mm × 6 mm × 8 mm dimensions. The TC4 grade alloy was an α + β dual-phase Ti-6Al-4V alloy, containing 5.5% α-phase Al and 3.5% β-phase V stabilizing elements. Al improved the alloy’s room-temperature and high-temperature strengths by solid-solution strengthening of the α-phase in the Ti-Al-V system. V was one of the few alloying elements in titanium alloys that could improve both strength and plasticity. The material composition [38] (mass fraction, %) was as follows: Al (5.5%–6.8%), V (3.5%–4.5%), Fe (0.30%), C (0.10%), N (0.05%), O (0.20%), H (0.015%), and Ti (balance). Its mechanical properties [39] are shown in Table 1.
In the ultrasonic milling process, to reduce the adverse effects of the tool on the ultrasonic milling effect, the milling cutter should have good thermal conductivity and chip removal performance, and low coating-material activity. This study used a four-blade integral universal hard alloy circular-arc end mill (Zhuzhou Cemented Carbide Cutting Tools Co., Ltd., model: TM-3R-D6.0 R0.5, Zhuzhou, China). The milling cutter specifications were as follows: diameter of 6 mm, blade length of 20 mm, total length of 60 mm, and an AlCrXN coating. The overhang of the tool after clamping was 36 mm.

2.3. Experimental Design

Many factors affect the milling of TC4 titanium alloy to obtain the optimal combination of cutting parameters and achieve high-quality processing of ultrasonic-assisted milling. Four parameters were selected for the experiment: cutting speed vw (marked as A), feed rate fz (marked as B), cutting depth ap (marked as C), and ultrasonic amplitude A (marked as D). The experiment is to study the precision and ultra-precision machining methods of titanium alloys, in order to obtain high-performance surface quality; therefore, the selection of experimental parameters such as feed rate and cutting depth should not be too large. Based on the theory of ultrasonic-assisted precision cutting and reference to peer research, the range of processing parameters [40,41,42] was selected as follows. The cutting speed vw ranged from 20 to 50 m/min, the range of each tooth feed rate fz was 0.01 to 0.04 mm/z, the range of cutting depth ap was 0.2 to 0.5 mm, and the range of ultrasonic amplitude A was 0 to 5 μm. The relationship between cutting speed and machine tool spindle speed is vw = πDn/1000, where n represents spindle speed, r/min, and D represents the tool diameter, mm. This article uses cutting speed vw for experimental analysis. The level ranges of the factors are shown in Table 2.
To accurately collect the signal of cutting force variation, a piezoelectric crystal force sensor (model Kistler 5080) was set to a collection frequency of 1000 Hz and a collection range of 100 N. The cutting force signals of ultrasonic milling were collected online in real-time scale, and then the steady cutting forces Fx, Fy and Fz in the x, y and z directions were obtained through a signal amplifier.
Referring to the orthogonal table of five factors and four levels based on standards, this experiment was designed as a four-factor and four-level orthogonal experiment (assuming the fifth factor is a null factor), namely, L16(44), with a total of 16 experimental groups. The experimental plan and results are presented in Table 3.

3. Results

3.1. Analysis of Variance of Average Cutting Force

By conducting a variance analysis (ANOVA) on the average cutting force of each group and direction in Table 3 through an orthogonal experiment, the respective results were obtained and are summarized in Table 4, Table 5 and Table 6. The Fisher distribution test was used to test the significance of variance. The F-distribution was proposed by British statistician Sir Ronald A. Fisher in 1924, it has a wide range of applications in statistics and is the foundation of analysis of variance [43]. Given a degree of freedom of three (i.e., DoF = 3) for the four-factor and four-level orthogonal experiment and a 95% correlation as the standard for strength testing, according to the F distribution critical value F0.05(3, 3) = 9.28, the feed rate fz and cutting depth ap had a significant impact on the cutting force in the x-axis direction, as shown in Table 4. Moreover, it can be seen from Table 5 that the feed rate fz had a significant impact on the cutting force in the y-axis direction. Finally, Table 6 shows that the feed rate fz, cutting depth ap, and ultrasonic amplitude A had a significant impact on the cutting force in the z-axis direction. Based on the analysis results of Table 4, Table 5 and Table 6, the feed rate fz and cutting depth ap significantly impacted the cutting force. In contrast, the impact of ultrasonic amplitude A on the cutting force was concentrated in the z-axis direction, which was consistent with the ultrasonic vibration applied in the main spindle z-direction.

3.2. Effects of Different Factors on the Average Cutting Force

Under CM and LUAM conditions, the experimental Fz values were measured through force sensors, as shown in Figure 3. LUAM could significantly reduce the cutting force. Figure 3a compares the 7th group (CM) and the 10th group (LUAM) experiments. Increasing the milling speed and feed per tooth during CM will increase Fz. In contrast, during LUAM, the periodic contact and separation characteristics between the cutting edge and the workpiece during the rotation of the cutter teeth reduced the total contact time between the tool and the workpiece, thereby reducing the overall peak value of the cutting force. In Figure 3c, the 12th group (CM) and the 15th group (LUAM) experiments were compared, and the significant effect of reducing the milling force Fz was still evident. As seen in Figure 3a,c, LUAM reduced the milling peak force Fz by 13.40% and 11.15%, respectively, with an average of 12.28%.
Using the Taguchi method, the cutting forces Fx, Fy, and Fz results were analyzed, as shown in Table 7, Table 8 and Table 9, respectively. The most significant factors controlling the cutting force Fx were ranked as follows: C (cutting depth) > B (feed rate) > A (cutting speed) > D (ultrasonic amplitude). The optimal combination of cutting parameters in the x-direction was A4B1C1D2. The impacts of milling parameters on the cutting force Fy had the following decreasing order: B (feed rate) > C (cutting depth) > A (cutting speed) > D (ultrasonic amplitude). The optimal combination of cutting parameters in the y-direction was A4B1C1D4. The impacts of milling parameters on the cutting force Fz had the following decreasing order: B (feed rate) > C (cutting depth) > D (ultrasonic amplitude) > A (cutting speed). The optimal combination of cutting parameters in the z-direction was A2B1C1D4.
Figure 4 shows the effects of various cutting parameters on cutting forces Fx, Fy, and Fz. As seen in Figure 4a, with increasing cutting speed vw, Fx has a decreasing trend. Figure 4b,c show that with increasing feed per tooth fz and cutting depth ap, Fx has an increasing trend. According to Figure 4d, with the addition of ultrasonic vibration Fx exhibits a significant decrease, but with increasing amplitude A the change in Fx is insignificant. As shown in Figure 4e–g, within a certain range, the cutting force Fy drops significantly with increasing cutting speed vw and grows with increasing feed per tooth fz and cutting depth ap. As seen in Figure 4h, with the addition of ultrasonic vibration, Fy drops sharply, and with increasing amplitude A, it shows a significant decreasing trend. In Figure 4i, due to the longitudinal vibration of the tool edge, the effect of cutting speed vw on the cutting force Fz is insignificant. In Figure 4j,k, the cutting force Fz grows significantly with increasing feed per tooth fz and cutting depth ap. In Figure 4l, with increasing amplitude A, Fy shows a significant decreasing trend.

3.3. Surface Roughness Analysis of Orthogonal Test Results

3.3.1. Surface Roughness Analysis

The variance analysis (ANOVA) of the surface roughness Ra of the processed workpieces is shown in Table 10.
For DoF = 3, from a four-factor, four-level orthogonal experiment, the confidence level was 95%; according to the critical value of the F distribution F0.05 (3, 3) = 5.39, it can be seen from the variance analysis results on the roughness that the ultrasonic amplitude had a significant impact on the surface roughness of the workpiece, and the milling rotation rate had the weakest impact. To further explore the effect of different milling parameters on the surface roughness of the processed workpieces, range analysis was performed on the surface roughness Ra of the workpieces, as shown in Table 11. The effect of ultrasonic amplitude on surface roughness was dominant, and the surface roughness is greatly affected by changes in ultrasonic amplitude.
The analyses of the orthogonal level results on surface roughness in Table 10 and Table 11 revealed the primary and secondary effects of each milling parameter on the surface roughness of the workpiece, ranking them as follows: D (ultrasonic amplitude) > C (cutting depth) > B (feed rate) > A (cutting speed).

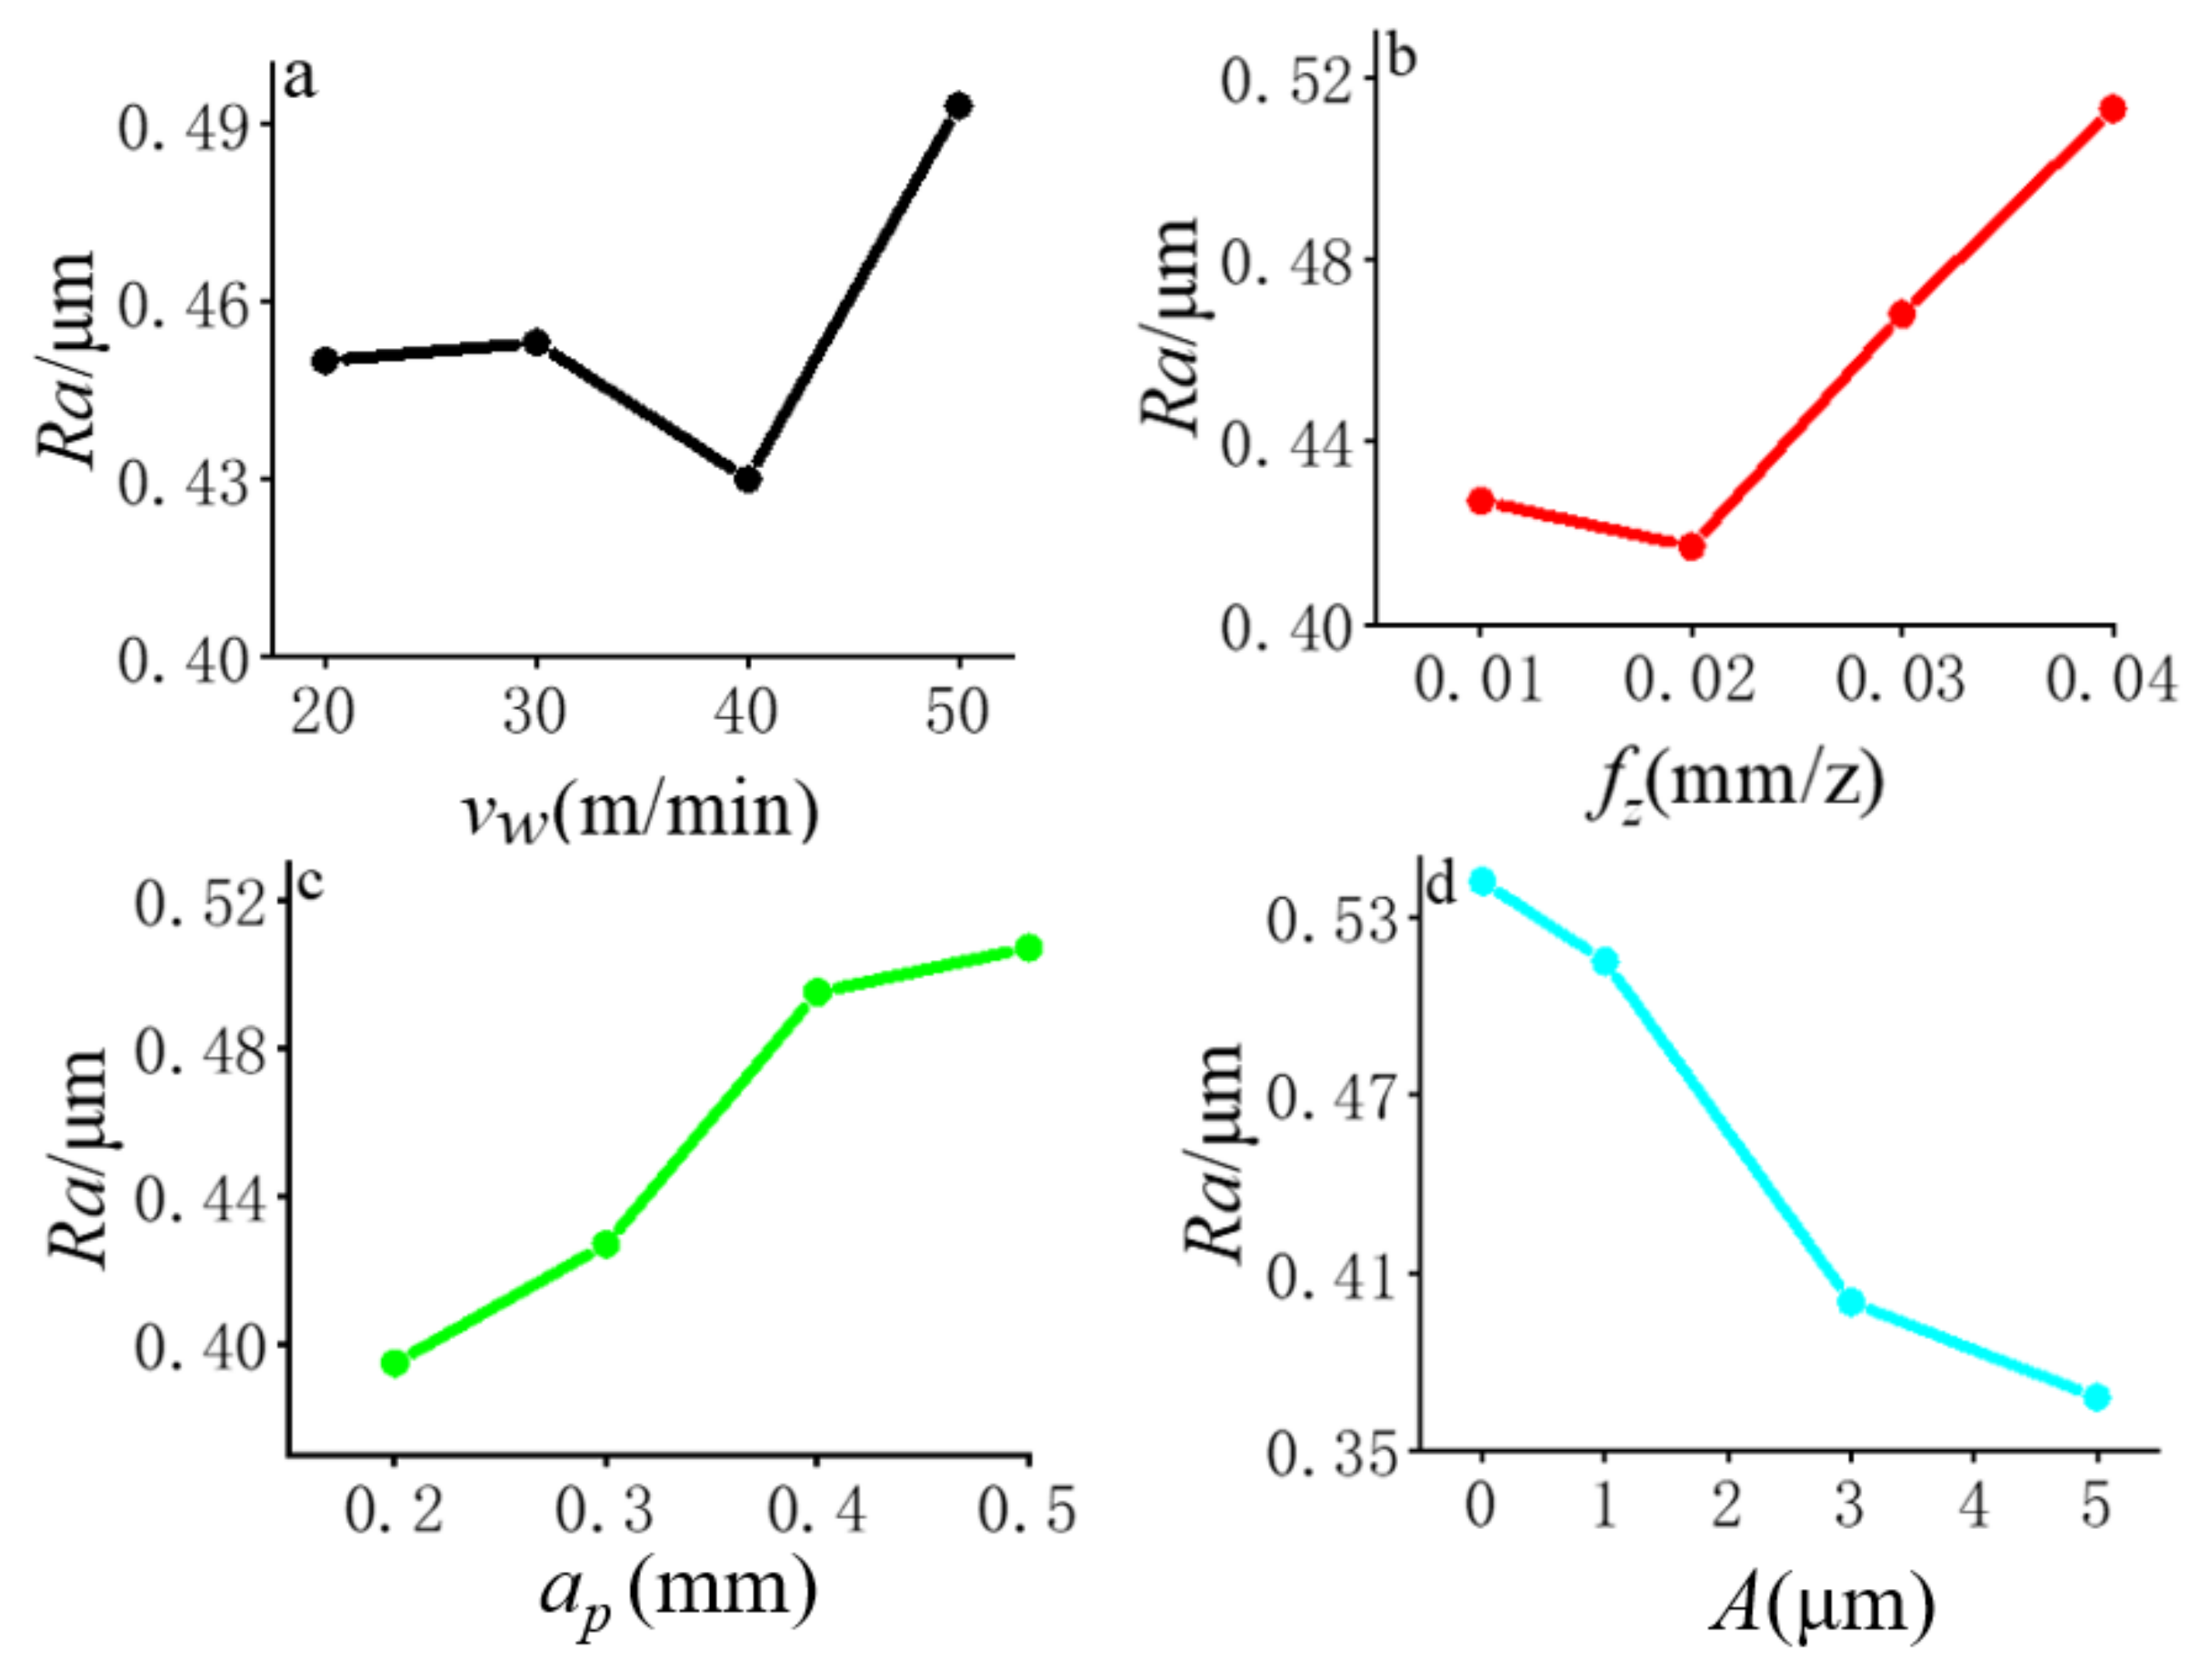
3.3.2. Effects of Various Milling Parameters on Surface Roughness

Patterns of various milling parameters’ effects on the average surface roughness of the processed workpieces are shown in Figure 5. In Figure 5a, as the cutting speed increased, the surface roughness of the workpiece was the lowest at a cutting speed of 40 m/min. When the cutting speed is higher than 40 m/min, the impact and friction between the rear face of the milling cutter and the machined surface become more severe under the action of high-frequency vibration, resulting in a rapid increase in surface roughness. In Figure 5b, as the feed rate fz increased, the roughness first gradually dropped, reaching its minimum at fz = 0.02 mm/z, and then grew sharply; the reason is also due to the intensified interaction between the tool and the machined surface. As seen in Figure 5c, as the milling depth increased, the surface roughness of the workpiece grew insignificantly (by only 0.12). In Figure 5d, during the amplitude range from 0 to 5 μm, compared with CM, the LUAM reduced surface roughness, but as the ultrasonic amplitude increased, the trend of reducing surface roughness was saturated.

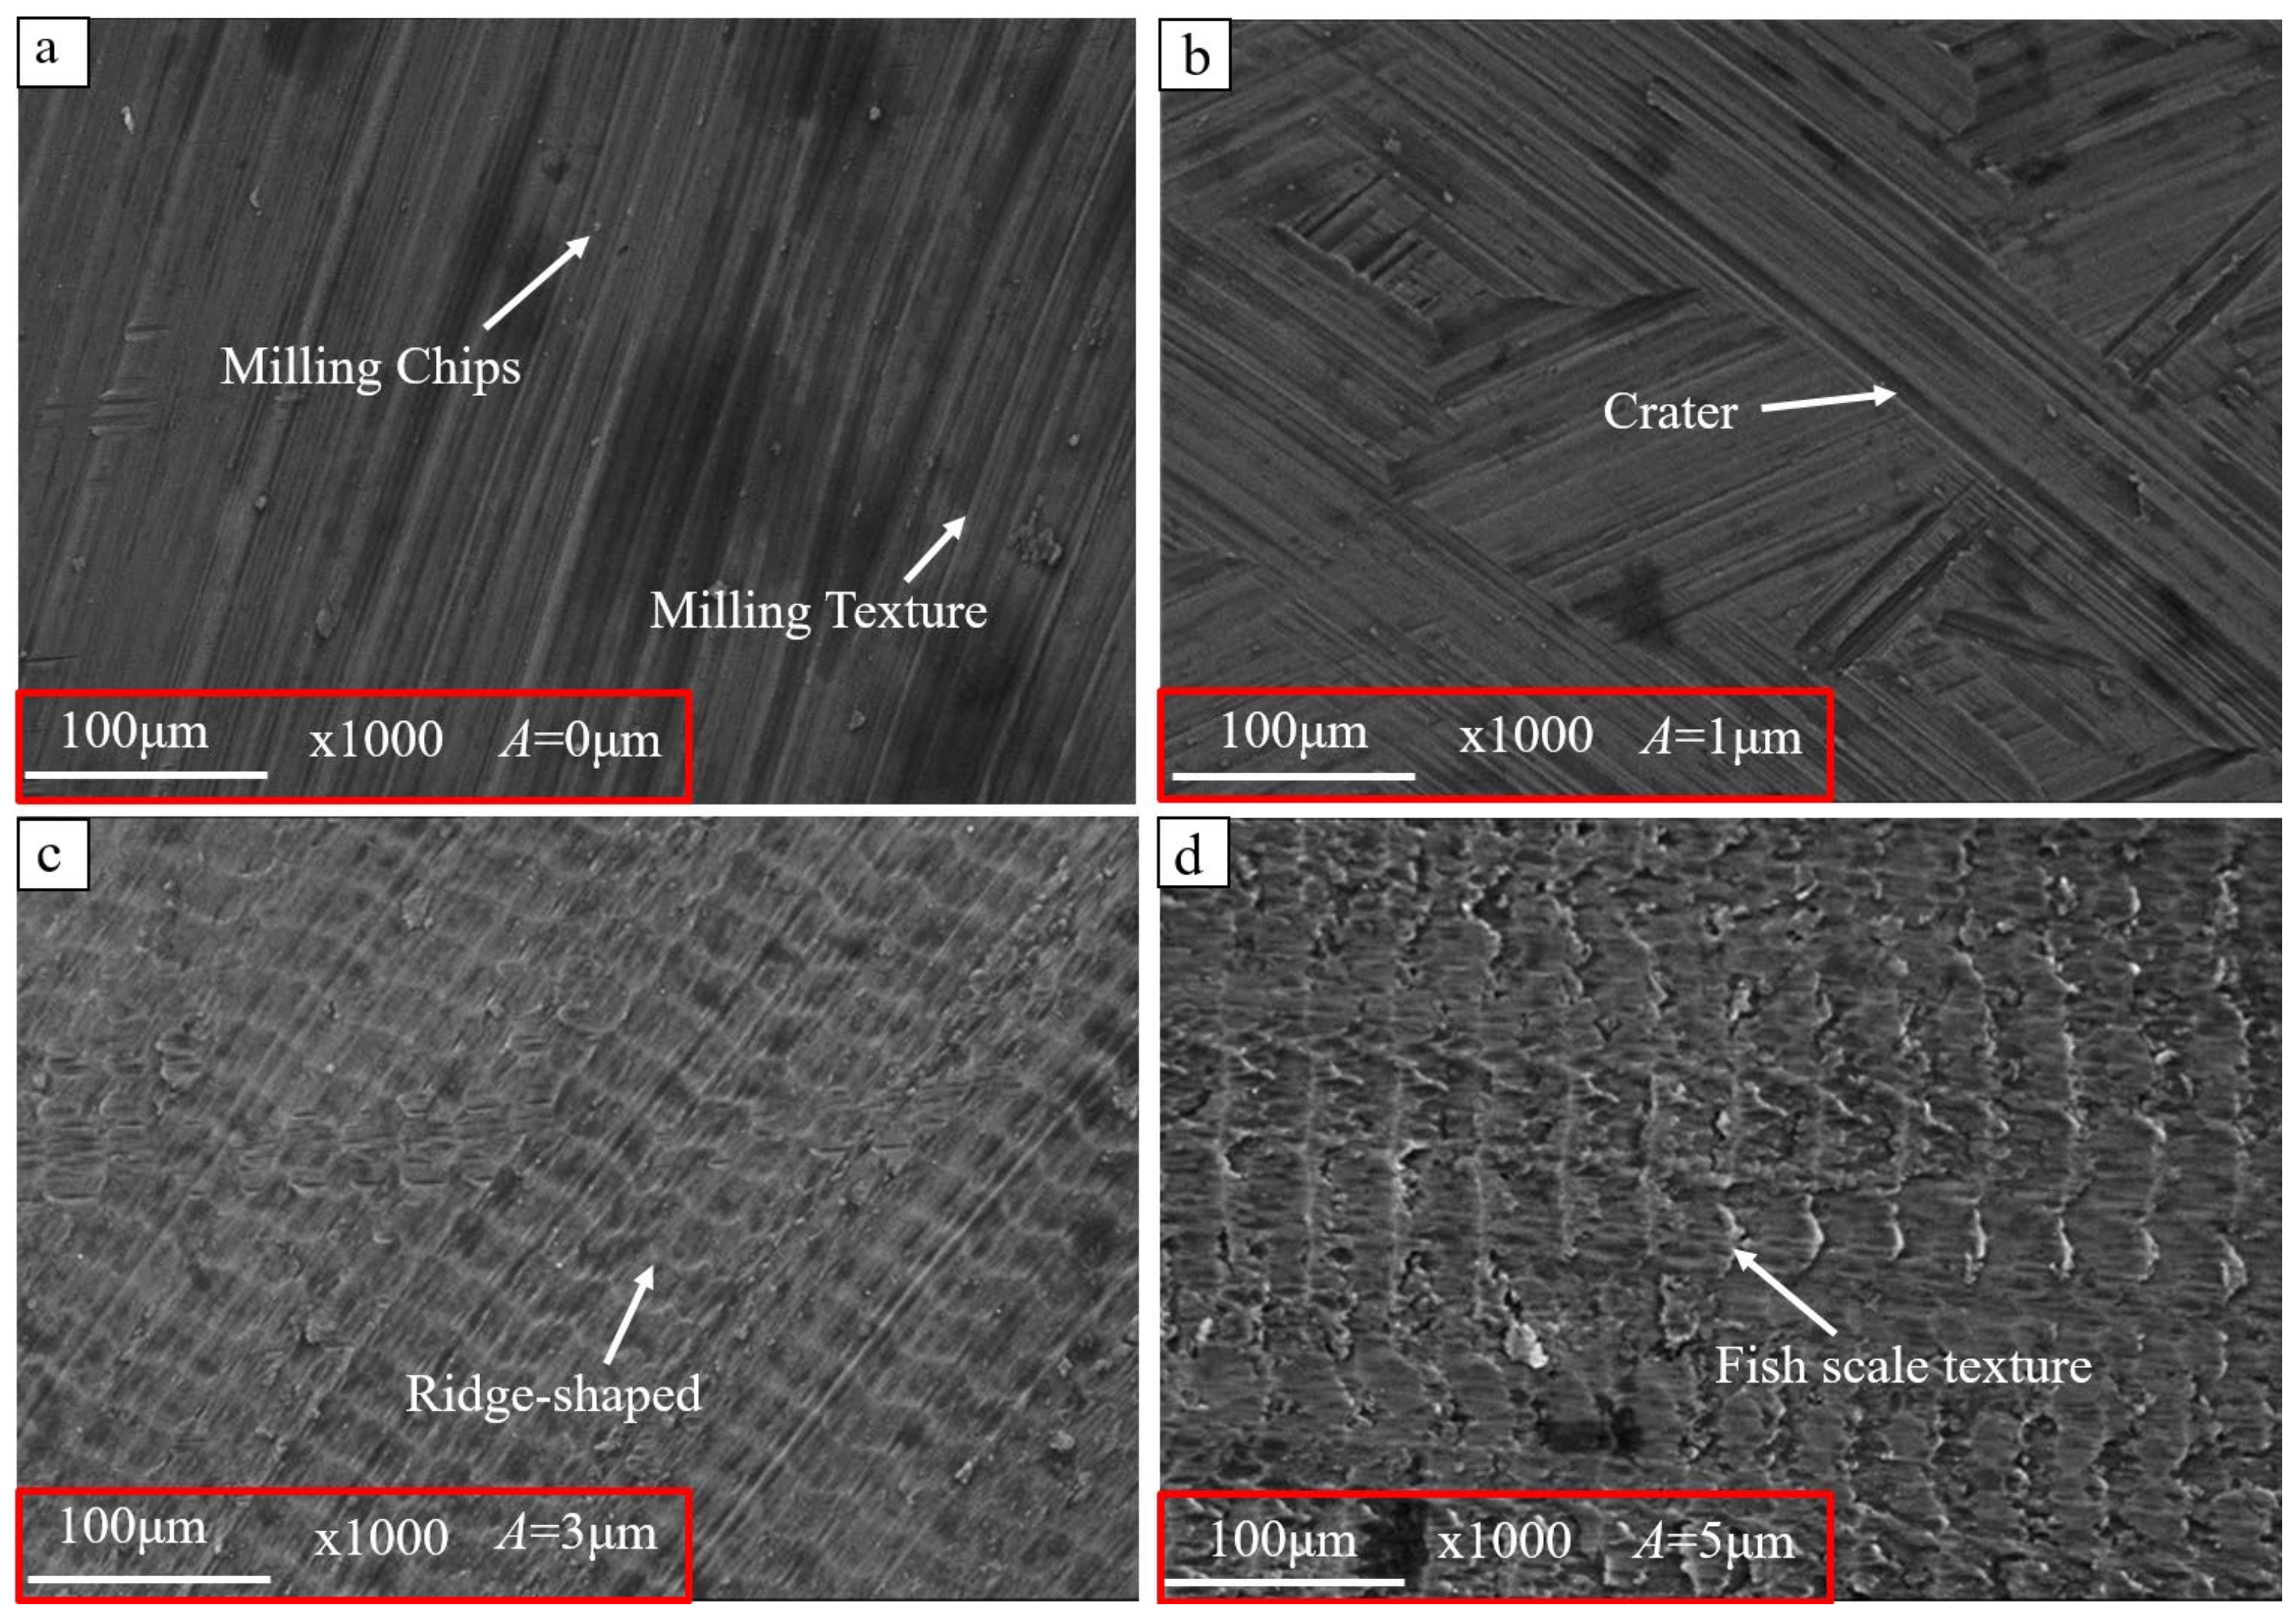
3.4. Surface Morphology

The surface morphology of LUAM was examined and analyzed using a desktop scanning electron microscope (model COXEM EM-30 PLUS, resolution of 5 nm@30 kV SE). The SEM surface morphologies obtained by increasing the amplitude A at a 1000× magnification are shown in Figure 6.
In Figure 6a, corresponding to test 14 in Table 3, the surface morphology of TC4 titanium alloy milled by CM shows a banded linear texture along the tool path, with a surface roughness of 0.62 μm. Figure 6b, corresponding to test 11 in Table 3, shows the result of LUAM with A = 1 μm; the surface microstructure of the workpiece is arranged in a certain regular alternating distribution along the tool feed direction, with a surface roughness of 0.48 μm. In Figure 6c, corresponding to test 3 in Table 3, LUAM with A = 3 μm, the surface texture has a tight “sine/cosine” structure, in contrast to CM. After increasing amplitude A, the texture is weakened, and the surface texture becomes ridge-shaped and arranged regularly along the tool path, with a surface roughness of 0.48 μm. In Figure 6d, corresponding to test 6 in Table 3, LUAM with A = 5 μm, surface roughness is 0.3 μm, the “sine/cosine” texture on the surface of the workpiece is denser, and the surface texture is also changed, showing a regular arrangement of a fish scale-like texture. The high-frequency vibration generated by LUAM repeatedly squeezes the cutting surface to produce a texture which is conducive to chip separation and avoids chip adhesion on the workpiece surface, improving the workpiece surface quality.

3.5. Microstructure of the Cutting Section

After hard cutting at high temperature, high pressure, and high strain, the surface microstructure and subsurface matrix structure of the sample have undergone significant changes, as shown in Figure 7.
The cutting surfaces of CM- and LUAM-processed workpieces had a significant white surface layer. At a lower cutting speed (vw = 20 m/min), there are slight differences in the microstructure of the surface layer and the substrate layer. At a higher cutting speed (vw = 40 m/min), there is a significant difference in the microstructure between the processed surface layer and the substrate layer. The surface layer forms a severe plastic deformation layer with a certain depth. The surface layer material of the workpiece undergoes severe grain deformation, with grains elongated and refined along the cutting direction, resulting in irregular microstructure. At vw = 40 m/min, the deformation layer depth of the LUAM-processed workpiece can reach 2.1 μm. However, there are no defects on the surface at lower cutting speed. Further analysis shows that as the cutting speed increases, the friction between the tool and the processed surface grows, and the deformation layer depths of both the CM- and LUAM-processed workpiece increase. At the same speed, the depth of the deformation layer on the surface of the LUAM-processed workpiece is slightly greater than the CM-processed workpiece, as shown in Figure 7d. The experiment shows that after the superposition of ultrasonic vibration, the high-frequency impact effect of the tool on the processed surface increases the depth of the deformation layer.

3.6. Experimental Verification

To verify the optimal combinations obtained from the orthogonal experimental analysis, including A4B1C1D2, A4B1C1D4, A2B1C1D4, and A3B2C1D4, four experiments were conducted with these combinations, as shown in Table 12. The cutting forces in the x, y, and z directions were obtained when the cutting was stable, and the surface roughness of the workpiece was measured. The optimal combinations in the x-, y-, and z-directions achieved average cutting forces of 7.35, 2.88, and 13.26 N, respectively. The optimal combination for surface roughness achieved a minimum value of 0.29 μm.
By comparing the minimum values of the CM test in Table 3 and the LUAM test in Table 12, the minimum value for Fx in Table 3 was found to be 8.67 N (Test 1), compared with the minimum value for Fx of 7.35 N (Test V1) in Table 12. The average cutting force in x-axis direction decreased by 15.22%; the Fy minimum in Table 3 was 3.63 N (Test 1), and the Fy minimum in Table 12 was 2.88 N (Test V2), with a 20.66% reduction in the y-axis mean cutting force. The Fz minimum in Table 3 was 15.62 N (Test 1), the Fz minimum in Table 12 was 13.26 n (Test V3), and the z-axis average cutting force decreased by 15.11%; the Ra minimum was 0.52 μm (Test 1) in Table 3, and the Ra minimum was 0.29 μm (Test V4) in Table 12. The average roughness was reduced by 44.23%.

4. Conclusions

This study experimentally investigated the cutting force and surface integrity of TC4 titanium alloy workpiece processed using LUAM. The effects of cutting speed vw, feed per tooth fz, cutting depth ap, and ultrasonic amplitude A on cutting force and surface integrity were comprehensively analyzed. The following conclusions were drawn:
(1)
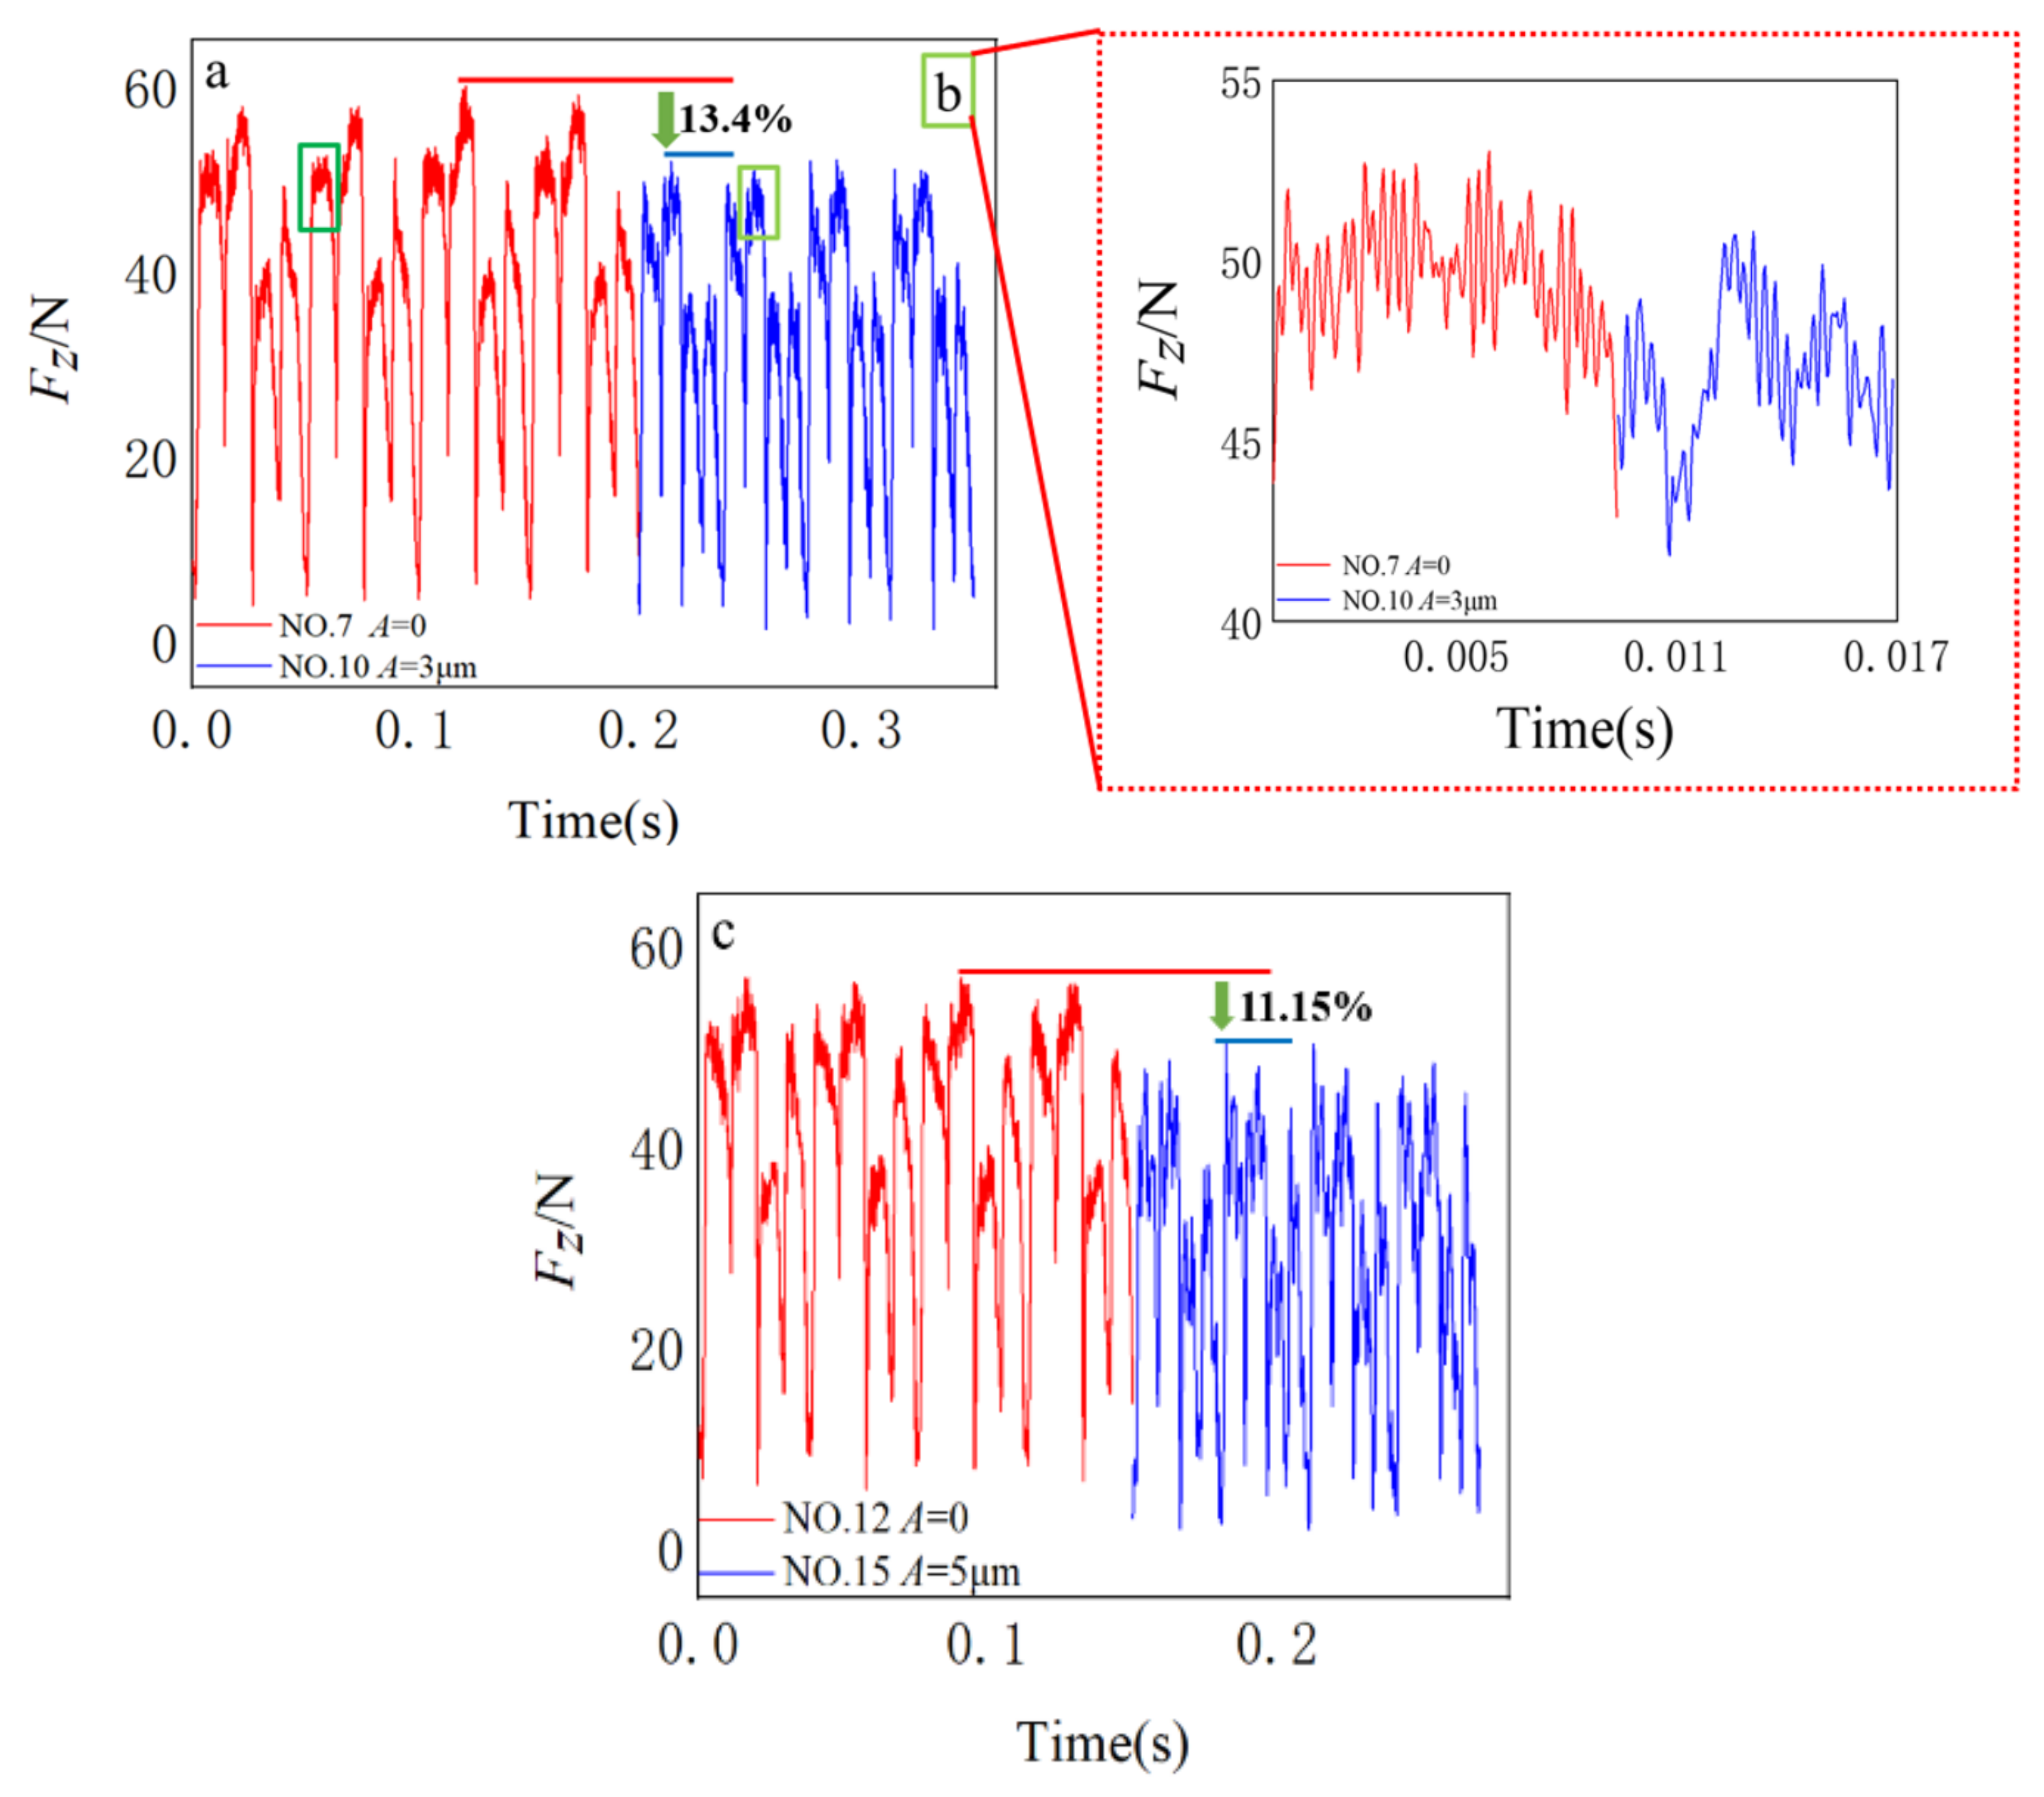
By comparing CM and LUAM, it was found that applying LUAM can reduce the peak cutting force, due to the periodic high-speed contact and separation between the tool and workpiece, which reduces the cutting force to a certain extent. The average peak cutting force was reduced by 12.28%, effectively improving cutting performance.
(2)
After applying LUAM, the cutting forces in the x, y, and z directions were reduced by 15.22, 20.66, and 15.11%, respectively; the average surface roughness of the workpiece was reduced by 44.23%.
(3)
The LUAM processing of the workpiece significantly improved its surface quality. With increasing ultrasonic amplitude, a regular “sine/cosine” texture appeared on the surface of the workpiece. When this amplitude was increased to a certain degree, a “fish scale-like” texture appeared on the workpiece surface. The increase in ultrasonic amplitude improved the chip separation effect.
(4)
At higher milling/cutting speeds, the crystal lattice of the subprocessed surface material was distorted under the high stress of milling friction, and the grains became elongated and refined along the cutting direction. The irregular microstructure formed a directional plastic deformation layer of a certain depth. Under the same rotation speed, the thickness of the deformation layer of the LUAM-processed workpieces exceeded those of the CM-processed ones.
(5)
Ultrasonic-assisted machining forms regularly distributed surface microstructures, which can effectively store lubricating oil and have great significance for reducing the wear and lubrication of components with mutually moving working surfaces, such as in the manufacturing of high-performance bearings. Precision microtextured surfaces with special functions can be achieved by adjusting parameters such as frequency and amplitude of ultrasonic processing, which is of great significance for constructing wear-resistant and high-strength superhydrophobic surfaces.

Author Contributions

Conceptualization, G.L. and D.X.; methodology, Q.L., L.Y. and D.X.; validation, Q.L., Y.C. and L.Y.; data curation, Q.L., Y.C. and X.L.; writing—original draft preparation, Q.L., Y.C. and L.Y.; writing—review and editing, Q.L. and L.Y.; supervision, G.L. and D.X.; project administration, X.L.; funding acquisition, G.L., L.Y. and D.X. All authors have read and agreed to the published version of the manuscript.

Funding

This research was funded by Key R & D and Promotion Special/Tackling Key Problems in Science and Technology in Henan province, China (grant No. 212102210349); Key Scientific Research Fund of Pingdingshan University (grant No. PXY-JXZDXK-202306).

Institutional Review Board Statement

Not applicable.

Informed Consent Statement

Not applicable.

Data Availability Statement

All relevant data can be obtained in this article.

Conflicts of Interest

The authors declare no conflict of interest.

References

  1. Yang, Z.C.; Zhu, L.D.; Zhang, G.X.; Ni, C.B.; Lin, B. Review of ultrasonic vibration-assisted machining in advanced materials. Int. J. Mach. Tools Manuf. 2020, 156, 103594. [Google Scholar] [CrossRef]
  2. Bai, W.; Gao, Y.; Sun, R.L. Vibration Assisted Machining: Fundamentals, Modelling and Applications; Springer: Singapore, 2023. [Google Scholar]
  3. Zheng, L.; Chen, W.Q.; Huo, D.H. Vibration Assisted Machining: Theory, Modelling and Applications; John Wiley & Sons Ltd.: Hoboken, NJ, USA; ASME Press: Hoboken, NJ, USA, 2021. [Google Scholar]
  4. Llanos, I.; Campa, Á.; Iturbe, A.; Iturbe, A.; Arrazola, P.J.; Zelaieta, O. Experimental analysis of cutting force reduction during ultrasonic assisted turning of Ti6Al4V. Procedia CIRP 2018, 77, 86–89. [Google Scholar] [CrossRef]
  5. Ali, M.H.; Khidhir, B.A.; Ansari, M.; Mohamed, B. FEM to predict the effect of feed rate on surface roughness with cutting force during face milling of titanium alloy. HBRC J. 2019, 9, 263–269. [Google Scholar] [CrossRef]
  6. Li, X.; Yang, S.L.; Lu, Z.H.; Zhang, D.Y.; Zhang, X.Y.; Jiang, X.G. Effect of ultrasonic peening cutting on surface integrity and fatigue behavior of Ti-6Al-4 V specimens. J. Mater. Process. Technol. 2019, 275, 116386. [Google Scholar] [CrossRef]
  7. Liang, X.L.; Liu, Z.Q.; Wang, B.; Cai, Y.K.; Ren, X.P. Progressive mapping surface integrity and multi-objective optimizing surface quality of machining Ti-6Al-4V based novel tool failure criterion. CIRP J. Manuf. Sci. Technol. 2023, 42, 81–94. [Google Scholar] [CrossRef]
  8. Zhu, L.D.; Ni, C.B.; Yang, Z.C.; Liu, C.F. Investigations of micro-textured surface generation mechanism and tribological properties in ultrasonic vibration-assisted milling of Ti-6Al-4V. Precis. Eng. 2019, 57, 229–243. [Google Scholar] [CrossRef]
  9. Liu, J.J.; Jiang, X.G.; Gao, Z.; Zhang, M.L.; Zhang, D.Y. Investigation of the effect of vibration amplitude on the surface integrity in high-speed rotary ultrasonic elliptical machining for side milling of Ti-6Al-4V. J. Mech. Eng. 2019, 55, 215–223. [Google Scholar] [CrossRef]
  10. Liu, J.J.; Jiang, X.G.; Han, X.; Gao, Z.; Zhang, D.Y. Effects of rotary ultrasonic elliptical machining for side milling on the surface integrity of Ti-6Al-4 V. Int. J. Adv. Manuf. Technol. 2019, 101, 1451–1465. [Google Scholar] [CrossRef]
  11. Kurpiel, S.; Zagórski, K.; Cieślik, J.; Skrzypkowski, K. Investigation of selected surface topography parameters and deformation during milling of vertical thin-walled structures from titanium alloy Ti6Al4V. Materials 2023, 16, 3182. [Google Scholar] [CrossRef]
  12. Peng, Z.L.; Zhang, X.Y.; Zhang, D.Y. Improvement of Ti-6Al-4V surface integrity through the use of high-speed ultrasonic vibration cutting. Tribol. Int. 2021, 160, 107025. [Google Scholar] [CrossRef]
  13. Zhao, X.F.; Jiang, X.T.; Shi, H.Y.; Zou, Z.C. Effect of cutting speed on chip shape and shear band of titanium alloy. Mach. Des. Manuf. 2020, 10, 171–175. [Google Scholar]
  14. Zhang, Z.M.; Tong, J.L.; Zhao, J.S.; Jiao, F.; Zai, P.H.; Liu, Z.Q. Experimental study on surface residual stress of titanium alloy curved thin-walled parts by ultrasonic longitudinal-torsional composite milling. Int. J. Adv. Manuf. Technol. 2021, 115, 1021–1035. [Google Scholar] [CrossRef]
  15. Wei, W.H. Fundamental Research on Machinability of Titanium Alloy by Thermo Hydrogen Treatment. Master Thesis, Nanjing University of Aeronautics and Astronautics, Nanjing, China, 2010. [Google Scholar]
  16. Li, F.Q.; Zhao, B.; Hao, W.S.; Wang, X.B. Surface morphology characteristics and effectiveness analysis of ultrasonic longitudinal torsion assisted milling of titanium alloys. China Mech. Eng. 2023, 34, 677–684. [Google Scholar]
  17. Lomaeva, T.V.; Kugultinov, S.D. Investigation of cutting modes effect on cutting force while machining titanium alloy BT6 (Russian State Standard GOST 19807-91). Mater. Today Proc. 2021, 38, 1307–1309. [Google Scholar] [CrossRef]
  18. He, Z.; Li, G.H.; Sun, Y. Development of experimental study on high-speed cutting of titanium alloys. Tool Eng. 2021, 55, 11–23. [Google Scholar]
  19. Shah, D.R.; Pancholi, N.; Gajera, H.; Patel, B. Investigation of cutting temperature, cutting force and surface roughness using multi-objective optimization for turning of Ti-6Al-4V(ELI). Mater. Today Proc. 2021, 50, 1379–1388. [Google Scholar] [CrossRef]
  20. Gao, H.H.; Ma, B.J.; Zhu, Y.P.; Yang, H. Enhancement of machinability and surface quality of Ti-6Al-4V by longitudinal ultrasonic vibration-assisted milling under dry conditions. Measurement 2022, 187, 110324. [Google Scholar] [CrossRef]
  21. Ni, C.B.; Zhu, L.D.; Ning, J.S.; Yang, Z.C.; Liu, C.F. Research on the characteristics of cutting force signal and chip in ultrasonic vibration-assisted milling of titanium alloys. J. Mech. Eng. 2019, 55, 207–216. [Google Scholar] [CrossRef]
  22. Hu, W.J.; Du, P.F.; Qiu, X.; Zhao, X.S.; Hu, Z.J.; Zhang, J.J.; Liu, Y.A. Enhanced dry machinability of TC4 titanium alloy by longitudinal-bending hybrid ultrasonic vibration-assisted milling. J. Clean. Prod. 2022, 379, 134866. [Google Scholar] [CrossRef]
  23. Sun, Y.J.; Li, J.; Li, J.F. Finite element analysis on prediction of tool wear in milling titanium. J. Mech. Eng. 2016, 52, 193–201. [Google Scholar] [CrossRef]
  24. Wang, Q.C.; Ming, W.W.; An, Q.L.; Chen, M. Wear mechanism of tool in milling high-strength titanium alloy TC18. J. Shanghai Jiaotong Univ. 2011, 45, 19–24. [Google Scholar]
  25. Tan, R.K.; Zhao, X.S.; Guo, S.S.; Zou, X.C.; He, Y.; Geng, Y.Q.; Hu, Z.J.; Sun, T. Sustainable production of dry-ultra-precision machining of Ti-6Al-4V alloy using PCD tool under ultrasonic elliptical vibration-assisted cutting. J. Clean. Prod. 2020, 248, 119254. [Google Scholar] [CrossRef]
  26. Gao, G.F.; Xia, Z.W.; Su, T.T.; Xiang, D.H.; Zhao, B. Cutting force model of longitudinal-torsional ultrasonic-assisted millingTi-6Al-4V based on tool flank wear. J. Mater. Process. Tech. 2021, 291, 117042. [Google Scholar] [CrossRef]
  27. Liu, Q.M.; Xu, J.K.; Yu, H.D. Experimental study of tool wear and its effects on cutting process of ultrasonic-assisted milling of Ti6Al4V. Int. J. Adv. Manuf. Technol. 2020, 108, 2917–2928. [Google Scholar] [CrossRef]
  28. Tian, Y.J.; Zou, P.; Kang, D.; Fan, F. Study on tool wear in longitudinal-torsional composite ultrasonic vibration–assisted drilling of Ti-6Al-4V alloy. Int. J. Adv. Manuf. Technol. 2021, 113, 1989–2002. [Google Scholar] [CrossRef]
  29. Zhang, M.L.; Zhang, D.Y.; Geng, D.X.; Liu, J.J.; Shao, Z.Y.; Jiang, X.G. Surface and sub-surface analysis of rotary ultrasonic elliptical end milling of Ti-6Al-4V. Mater. Des. 2020, 191, 108658. [Google Scholar] [CrossRef]
  30. Tao, C.H.; Liu, X.L. Evauation on Materials and Technics of Aviation Engine. Fail. Anal. Prev. 2007, 2, 14–20. [Google Scholar]
  31. la Monaca, A.; Murray, J.W.; Liao, Z.; Speidel, A.; Robles Linares, J.A.; Axinte, D.A.; Hardy, M.C.; Clare, A.T. Surface integrity in metal machining–Part II: Functional performance. Int. J. Mach. Tools Manuf. 2021, 164, 103718. [Google Scholar] [CrossRef]
  32. Bai, W.; Sun, R.L.; Leopold, J.; Silberschmidt Vadim, V. Microstructural evolution of Ti6Al4V in ultrasonically assisted cutting: Numerical modelling and experimental analysis. Ultrasonics 2017, 78, 70–82. [Google Scholar] [CrossRef]
  33. Velásquez, J.D.P.; Tidu, A.; Bolle, B.; Chevrier, P.; Fundenberger, J.J. Sub-surface and surface analysis of high speed machined Ti-6Al-4V alloy. Mater. Sci. Eng. A 2010, 527, 2572–2578. [Google Scholar] [CrossRef]
  34. Xu, J.; Feng, P.; Feng, F.; Zha, H.; Liang, G. Subsurface damage and burr improvements of aramid fiber reinforced plastics by using longitudinal-torsional ultrasonic vibration milling. J. Mater. Process. Technol. 2021, 297, 117265. [Google Scholar] [CrossRef]
  35. Tej, P.; Karali, P.; Dyakonov, A.A. Modeling Cutting Force in Micro-Milling of Ti-6Al-4V Titanium Alloy. Procedia Eng. 2015, 129, 134–139. [Google Scholar]
  36. Niu, Y.; Jiao, F.; Zhao, B.; Tong, J.L. Experiment of Machining Induced Residual Stress in Longitudinal Torsional Ultrasonic Assisted Milling of Ti-6Al-4V. Surf. Technol. 2019, 48, 41–51. [Google Scholar]
  37. Wang, X.M.; Han, J. Study on Surface Roughness of High Speed Milling of TC4 Titanium Alloy. Mach. Des. Manuf. 2019, 5, 232–240. [Google Scholar]
  38. Huang, B.Y. Chinese Materials Engineering Ceremony (Non-Ferrous Metal Materials Engineering); Chemical Industry Press: Beijing, China, 2006. [Google Scholar]
  39. Zhao, Y.Q.; Xin, S.W.; Chen, Y.N.; Mao, X.N. New Alloy Material-Titanium Alloy; China Railway Publishing House: Beijing, China, 2017. [Google Scholar]
  40. Grzesik, W. Advanced Machining Processes of Metallic Materials: Theory, Modelling, and Applications, 2nd ed.; Elsevier B.V. Press: Amsterdam, the Netherlands, 2017. [Google Scholar]
  41. Xie, W.B. Study on Cutting Force and Surface Integrity of TC18 Titanium Alloy by Longitudinal-Torsional Ultrasonic Vibration-Assisted Milling. Master Thesis, Chongqing University, Chongqing, China, 2022. [Google Scholar]
  42. Cheng, K.; Huo, D.H. Micro-Cutting Fundamentals and Applications; John Wiley & Sons Press: Hoboken, NJ, USA, 2013. [Google Scholar]
  43. Dong, R.H.; Xiao, B.H.; Fang, Y.S. The Theoretical Analysis of Orthogonal Test Designs. J. Anhui Institvte Archit. Ind. 2004, 12, 103–106. [Google Scholar]
Figure 1. LUAM principle. (a) Milling model; (b) Tool edge motion path.
Coatings 13 01725 g001
Figure 2. Experimental setup.
Coatings 13 01725 g002
Figure 3. Milling force signal acquisition diagram. (a) Comparison of Fz signals between CM (A = 0 μm) and LUAM (A = 3 μm) tests; (b) Comparison of local amplification of CM (A = 0 μm) and LUAM (A = 3 μm) Tests Fz in the same period; (c) Comparison of Fz signals between CM (A = 0 μm) and LUAM (A = 5 μm) tests.
Coatings 13 01725 g003
Figure 4. Effects of various milling parameters on cutting forces Fx, Fy and Fz. (a) Relationship curve between cutting speed vw and cutting force Fx; (b) Relationship curve between feed rate fz and cutting force Fx; (c) Relationship curve between cutting depth ap and cutting force Fx; (d) Relationship curve between ultrasonic amplitude A and cutting force Fx; (e) Relationship curve between cutting speed vw and cutting force Fy; (f) Relationship curve between feed rate fz and cutting force Fy; (g) Relationship curve between cutting depth ap and cutting force Fy; (h) Relationship curve between ultrasonic amplitude A and cutting force Fy; (i) Relationship curve between cutting speed vw and cutting force Fz; (j) Relationship curve between feed rate fz and cutting force Fz; (k) Relationship curve between cutting depth ap and cutting force Fz; (l) Relationship curve between ultrasonic amplitude A and cutting force Fz.
Coatings 13 01725 g004
Figure 5. Effects of various milling parameters on surface roughness. (a) Relationship curve between cutting speed vw and surface roughness Ra; (b) Relationship curve between feed rate fz and surface roughness Ra; (c) Relationship curve between cutting depth ap and surface roughness Ra; (d) Relationship curve between ultrasonic amplitude A and surface roughness Ra.
Coatings 13 01725 g005
Figure 6. LUAM microsurface topography. (a) Surface morphology at CM (A = 0 μm); (b) Surface morphology at ultrasonic amplitude A = 1 μm; (c) Surface morphology at ultrasonic amplitude A = 3 μm; (d) Surface morphology at ultrasonic amplitude A = 5 μm.
Coatings 13 01725 g006
Figure 7. Effects of high and low rotation speeds on the surface microstructure deformation layer under CM and LUAM conditions. (a) Deformation layer depth under CM-processed (vw = 20 m/min); (b) Deformation layer depth under LUAM-processed (vw = 20 m/min, A = 5 μm); (c) Deformation layer depth under CM-processed (vw = 40 m/min); (d) Deformation layer depth under LUAM-processed (vw = 40 m/min, A = 5 μm).
Coatings 13 01725 g007
Table 1. TC4 Alloy Mechanical Properties. (Test Conditions: 20 ℃, Annealing State, 20 mm Diameter Bar Material).
Tensile Strength (MPa)Yield Strength
(MPa)
Elongation
(%)
Section Shrinkage
(%)
96786016.244.1
Table 2. Test Factors and Levels.
LevelsA—Cutting Speed
vw (m/min)
B—Feed Rate
fz (mm/z)
C—Cutting Depth
ap (mm)
D—Ultrasonic Amplitude
A (μm)
1200.010.20
2300.020.31
3400.030.43
4500.040.55
Table 3. Orthogonal Test Results.
No.A—
vw (m/min)
B—
fz (mm/z)
C—
ap (mm)
D—
A (μm)
Fx (N)Fy (N)Fz (N)Ra (μm)
1200.010.208.673.6315.620.52
2200.020.3117.995.3824.590.4
3200.030.4329.337.8132.000.48
4200.040.5540.6912.2132.660.51
5300.010.3311.674.4417.720.38
6300.020.2510.683.2016.370.30
7300.030.5035.308.2834.470.56
8300.040.4134.339.6535.650.57
9400.010.4514.623.5518.300.31
10400.020.5327.785.2130.090.35
11400.030.2115.844.9625.340.48
12400.040.3027.747.9633.620.58
13500.010.5118.763.0324.090.61
14500.020.4023.214.3029.060.62
15500.030.3522.035.6126.380.35
16500.040.2318.315.4625.460.39
Table 4. Milling Force Fx Significance Analysis.
Variance SourceDoFSum of Squared DeviationsFSignificance
vw (m/min)330.4053.583
fz (mm/z)3635.68474.9011
ap (mm)3657.99277.5291
A (μm)310.9671.292
Error38.49
Table 5. Milling Force Fy Significance Analysis.
Variance SourceDoFSum of Squared DeviationsFSignificance
vw (m/min)315.9837.129
fz (mm/z)364.03828.5631
ap (mm)317.3877.755
A (μm)30.5190.231
Error32.24
Table 6. Milling Force Fz Significance Analysis.
Variance SourceDoFSum of Squared DeviationsFSignificance
vw (m/min)31.4120.434
fz (mm/z)3388.881119.4351
ap (mm)3216.59166.5211
A (μm)352.31716.0681
Error33.26
Table 7. Milling Force Fx Range Analysis Results.
Measured ValueA—vw (m/min)B—fz (mm/z)C—ap (mm)D—A (μm)
K124.17313.42913.37523.732
K222.99319.91619.85921.730
K321.49625.62825.37321.772
K420.57830.26730.63322.006
Range3.59516.83817.2582.002
Priorityof factorsap > fz > vw > A
Optimal combinationA4B1C1D2
Table 8. Milling Force Fy Range Analysis Results.
Measured ValueA—vw (m/min)B—fz (mm/z)C—ap (mm)D—A (μm)
K17.2553.6614.3126.043
K26.3914.5225.8465.752
K35.4206.6656.3295.728
K44.6018.8187.1805.143
Range2.6545.1572.8680.415
Priority of factorsfz > ap > vw > A
Optimal combinationA4B1C1D4
Table 9. Milling Force Fz Range Analysis Results.
Measured ValueA—vw (m/min)B—fz (mm/z)C—ap (mm)D—A (μm)
K126.21718.93120.69728.192
K226.05125.02825.57527.417
K326.83629.54528.75326.318
K426.24831.84830.42623.426
Range0.78512.9179.6314.766
Priority of factorsfz > ap > A > vw
Optimal combinationA2B1C1D4
Table 10. Surface Roughness Significance Analysis.
Variance SourceSum of Squares of DeviationsDoFF ValueSignificance
vw (m/min)0.00930.500
fz (mm/z)0.01831.000
ap (mm)0.02431.333
A (μm)0.10936.0561
Error0.023
Table 11. Surface roughness extreme analysis.
Measured ValueA—vw (m/min)B—fz (mm/z)C—ap (mm)D—A (μm)
K10.4500.4270.3950.542
K20.4530.4170.4270.515
K30.4300.4680.4950.400
K40.4930.5130.5070.368
Range0.0630.0960.1120.174
Priority of factorsA > ap > fz > vw
Optimal combinationA3B2C1D4
Table 12. Test Results for the Optimal Combinations A4B1C1D2, A4B1C1D4, A2B1C1D4, and A3B2C1D4.
NoA—
vw (m/min)
B—
fz (mm/z)
C—
ap (mm)
D—
A (μm)
Fx (N)Fy (N)Fz (N)Ra (μm)
V1500.010.217.353.2415.220.52
V2500.010.259.352.8816.710.33
V3300.010.259.733.5713.260.39
V4400.010.259.573.4017.140.29
Disclaimer/Publisher’s Note: The statements, opinions and data contained in all publications are solely those of the individual author(s) and contributor(s) and not of MDPI and/or the editor(s). MDPI and/or the editor(s) disclaim responsibility for any injury to people or property resulting from any ideas, methods, instructions or products referred to in the content.

