Article

Erosion Effect in the Degradation of Coated and Uncoated Glass Solar Mirrors Highlighted by Coupled Accelerated Erosion/Aging Tests

1
Moroccan Foundation for Advanced Science Innovation and Research (MAScIR), Rue Mohamed Al Jazouli, Rabat 10100, Morocco
2
Mohammadia School of Engineers (EMI), Mohammed V University, Avenue Ibn Sina B.P. 765 Agdal, Rabat 10090, Morocco
3
CEA-Liten, DTBH, Grenoble Alpes University, F-73375 Le Bourget du Lac, France
*
Author to whom correspondence should be addressed.
Coatings 2022, 12(8), 1087; https://doi.org/10.3390/coatings12081087
Submission received: 4 June 2022 / Revised: 25 July 2022 / Accepted: 25 July 2022 / Published: 31 July 2022
(This article belongs to the Section Corrosion, Wear and Erosion)

Abstract

:
Accelerated aging experiments on solar reflectors allow for a more accurate prediction of the materials’ lifespan in a shorter period of time comparing to a study on real-Concentrated solar power (CSP) sites. Accelerated aging tests help to identify which degradations are most likely to occur under the application conditions by assessing the component’s sensitivity to various stress factors. To meet the needs of manufacturers in terms of accelerated testing, accelerated aging standards must be developed in most applications. Therefore, research and experiments must be conducted to determine appropriate techniques and therefore contribute to the standardization process. CSP is a field that entails a lot of work. The solar mirrors aging standards are still subject of research in the CSP field. They’ve all been developed or altered for use in other fields like photovoltaics. However, the outcomes of these aging tests are not always accurate or representative. In addition, the development of new materials like antisoiling coatings make the standardization process more challenging. This work aims to highlight the interest of combining accelerated erosion with other stress factors in order to get more representative results that can contribute to the standardization protocols of accelerated aging tests in the CSP for coated and uncoated solar reflectors.

1. Introduction

Solar reflectors used in Concentrated Solar Power plants (CSP) consist of a silver reflective layer protected from the front by a transparent glass or coated glass and from the back by two or three paint layers systems [1]. The glass used for the frontal protection is a fragile material which can easily undergo a rupture under mechanical stress [2]. Thus, glass mirror substrates used for CSP or other applications like the space applications frequently need to be improved with optical coatings since they don’t always offer the desired optical performance. Coatings significantly affect the optical performance of the device [3].
The operational sites of CSP plants are usually arid [4], where the occurrence of sand storms is high and consequently the potential of erosion is important.
Surface erosion is a damage caused by the impact of sand particles on materials surface which causes plastic deformation or surface cutting depending on the chemical composition and the mechanical properties of the material surface. A classification made by the International Energy Agency (IEA) for glass solar mirrors estimated 50 as a value of risk of damage due to erosion [5]. In a Failure Modes and Effects Analysis (FMEA), the RPN (Risk Priority Number) is a numerical evaluation of the risk priority level of a failure mode. RPN assists the relevant teams, individuals or organizations in prioritizing risks and choosing the appropriate corrective measures. Thus, the arrangement (angle, height, orientation) of solar mirrors on the exposure site must be optimized in order to avoid, as much as possible, erosion damages [6]. For this reason and in order to understand the behavior of solar mirrors against erosion, several studies have been carried out by both accelerated erosion and natural erosion [6,7,8,9]. These studies have demonstrated the impact of different factors favoring erosion including weather conditions, the arrangement of solar mirrors on the exposure site and the chemical composition. The erosion is not only a risk factor which mechanically weakens solar mirrors leading to a decrease in their optical performances, but it could also activate the chemical reactivity of the surface; The mechanical impacts created on solar mirrors surfaces increase their surface roughness [10,11] and consequently constitute a retention area of water, gas, atmospheric pollutants and any particle present in the external environment [12,13]. Also, each material is characterized by intrinsic properties that define its behavior when subjected to mechanical stresses during which the atomic structure at the surface of the material can change which affects the mechanical properties of the material [14,15].
A previous study carried out by S. Boukheir [13] on glass solar mirrors exposed according to the four cardinal points (south, west, north, east) (Figure 1) in a rainy and snowy environment has demonstrated that the samples facing the west direction were more damaged by erosion as showed by the optical microscope images of Figure 2. A meteorological data analysis was performed (Figure 3) the wind and guest speeds was analyzed. The gust results in a brief and sudden increase in the instantaneous speed of the wind in comparison with the value then acquired by its average speed. The results highlighted that on this site wind, gusts are mostly coming from the west direction, and all the samples oriented according to this direction recorded a significant water sorption compared to the other orientations, which causes an important loss of reflectance.
In this optic, this manuscript aims to highlight the effect of erosion in activating the reactivity of two types of silvered glass solar reflectors and compare their resistance towards erosion and aging factors (thermal, humidity and UV):
-
Uncoated, the frontal protection is made by a soda-lime glass with a thickness of 4 mm. The back protection is ensured by two paint layers.
-
Coated, the frontal protection is ensured by the same soda-lime glass in addition to an anti-soiling SiO2 coating.
The dimensions of both Uncoated and coated samples are 10 × 10 cm2. Tested samples firstly undergo accelerated erosion by a horizontal erosion testing bench and then undergo two accelerated aging tests:
-
High temperature humidity and pressure aging stress test named HAST
-
Cyclic UV/water spray test named SUNTEST
To quantify the damage produced by each test, they are conducted on intact and eroded samples using a horizontal testing bench. Characterizations of the optical and mechanical performances are monitored with a regular follow-up.

2. Materials and Methods

In this work, two types of solar mirrors (anti-soiling coated and uncoated) were firstly exposed to a jet of standardized sand particles MIL-STD810G purchased from Powder Technology, Inc- Arden Hills-USA (composed from 90% of quartz) by an erosion test bench, and for each sample type, eroded and intact samples (Figure 4) undergo two accelerated aging tests.
Three samples were tested for each sample type (Coated—Uncoated—Eroded—Intact) and for each test (Test N°1 and Test N°2). The tested samples are soda-lime glass solar mirrors with the same paint systems and the same glass substrate thickness and composition. The coated samples contain an additional anti-soiling thin coating composed of SiO2 transparent coating and give to the mirror better self-cleaning performances. The chemical composition of tested samples were verified by an XPS analysis. Figure 5 shows the chemical composition of tested samples by XPS spectroscopy. The obtained results show a typical soda-lime glass chemical composition for the uncoated samples and a typical SiO2 coating chemical composition for the coated samples. Which confirm the chemical composition communicated by the manufacturer.

2.1. Aging Procedure

The main objective of this work is to study how the presence of erosion impacts on solar mirrors could initiate other types of degradations by combining the erosion to other risk factors (UV, water, temperature…). Thus, all tests are performed on eroded and intact solar mirrors to compare their behavior as a function of time and controlled conditions. The experimental work is planned in 3 steps:
-
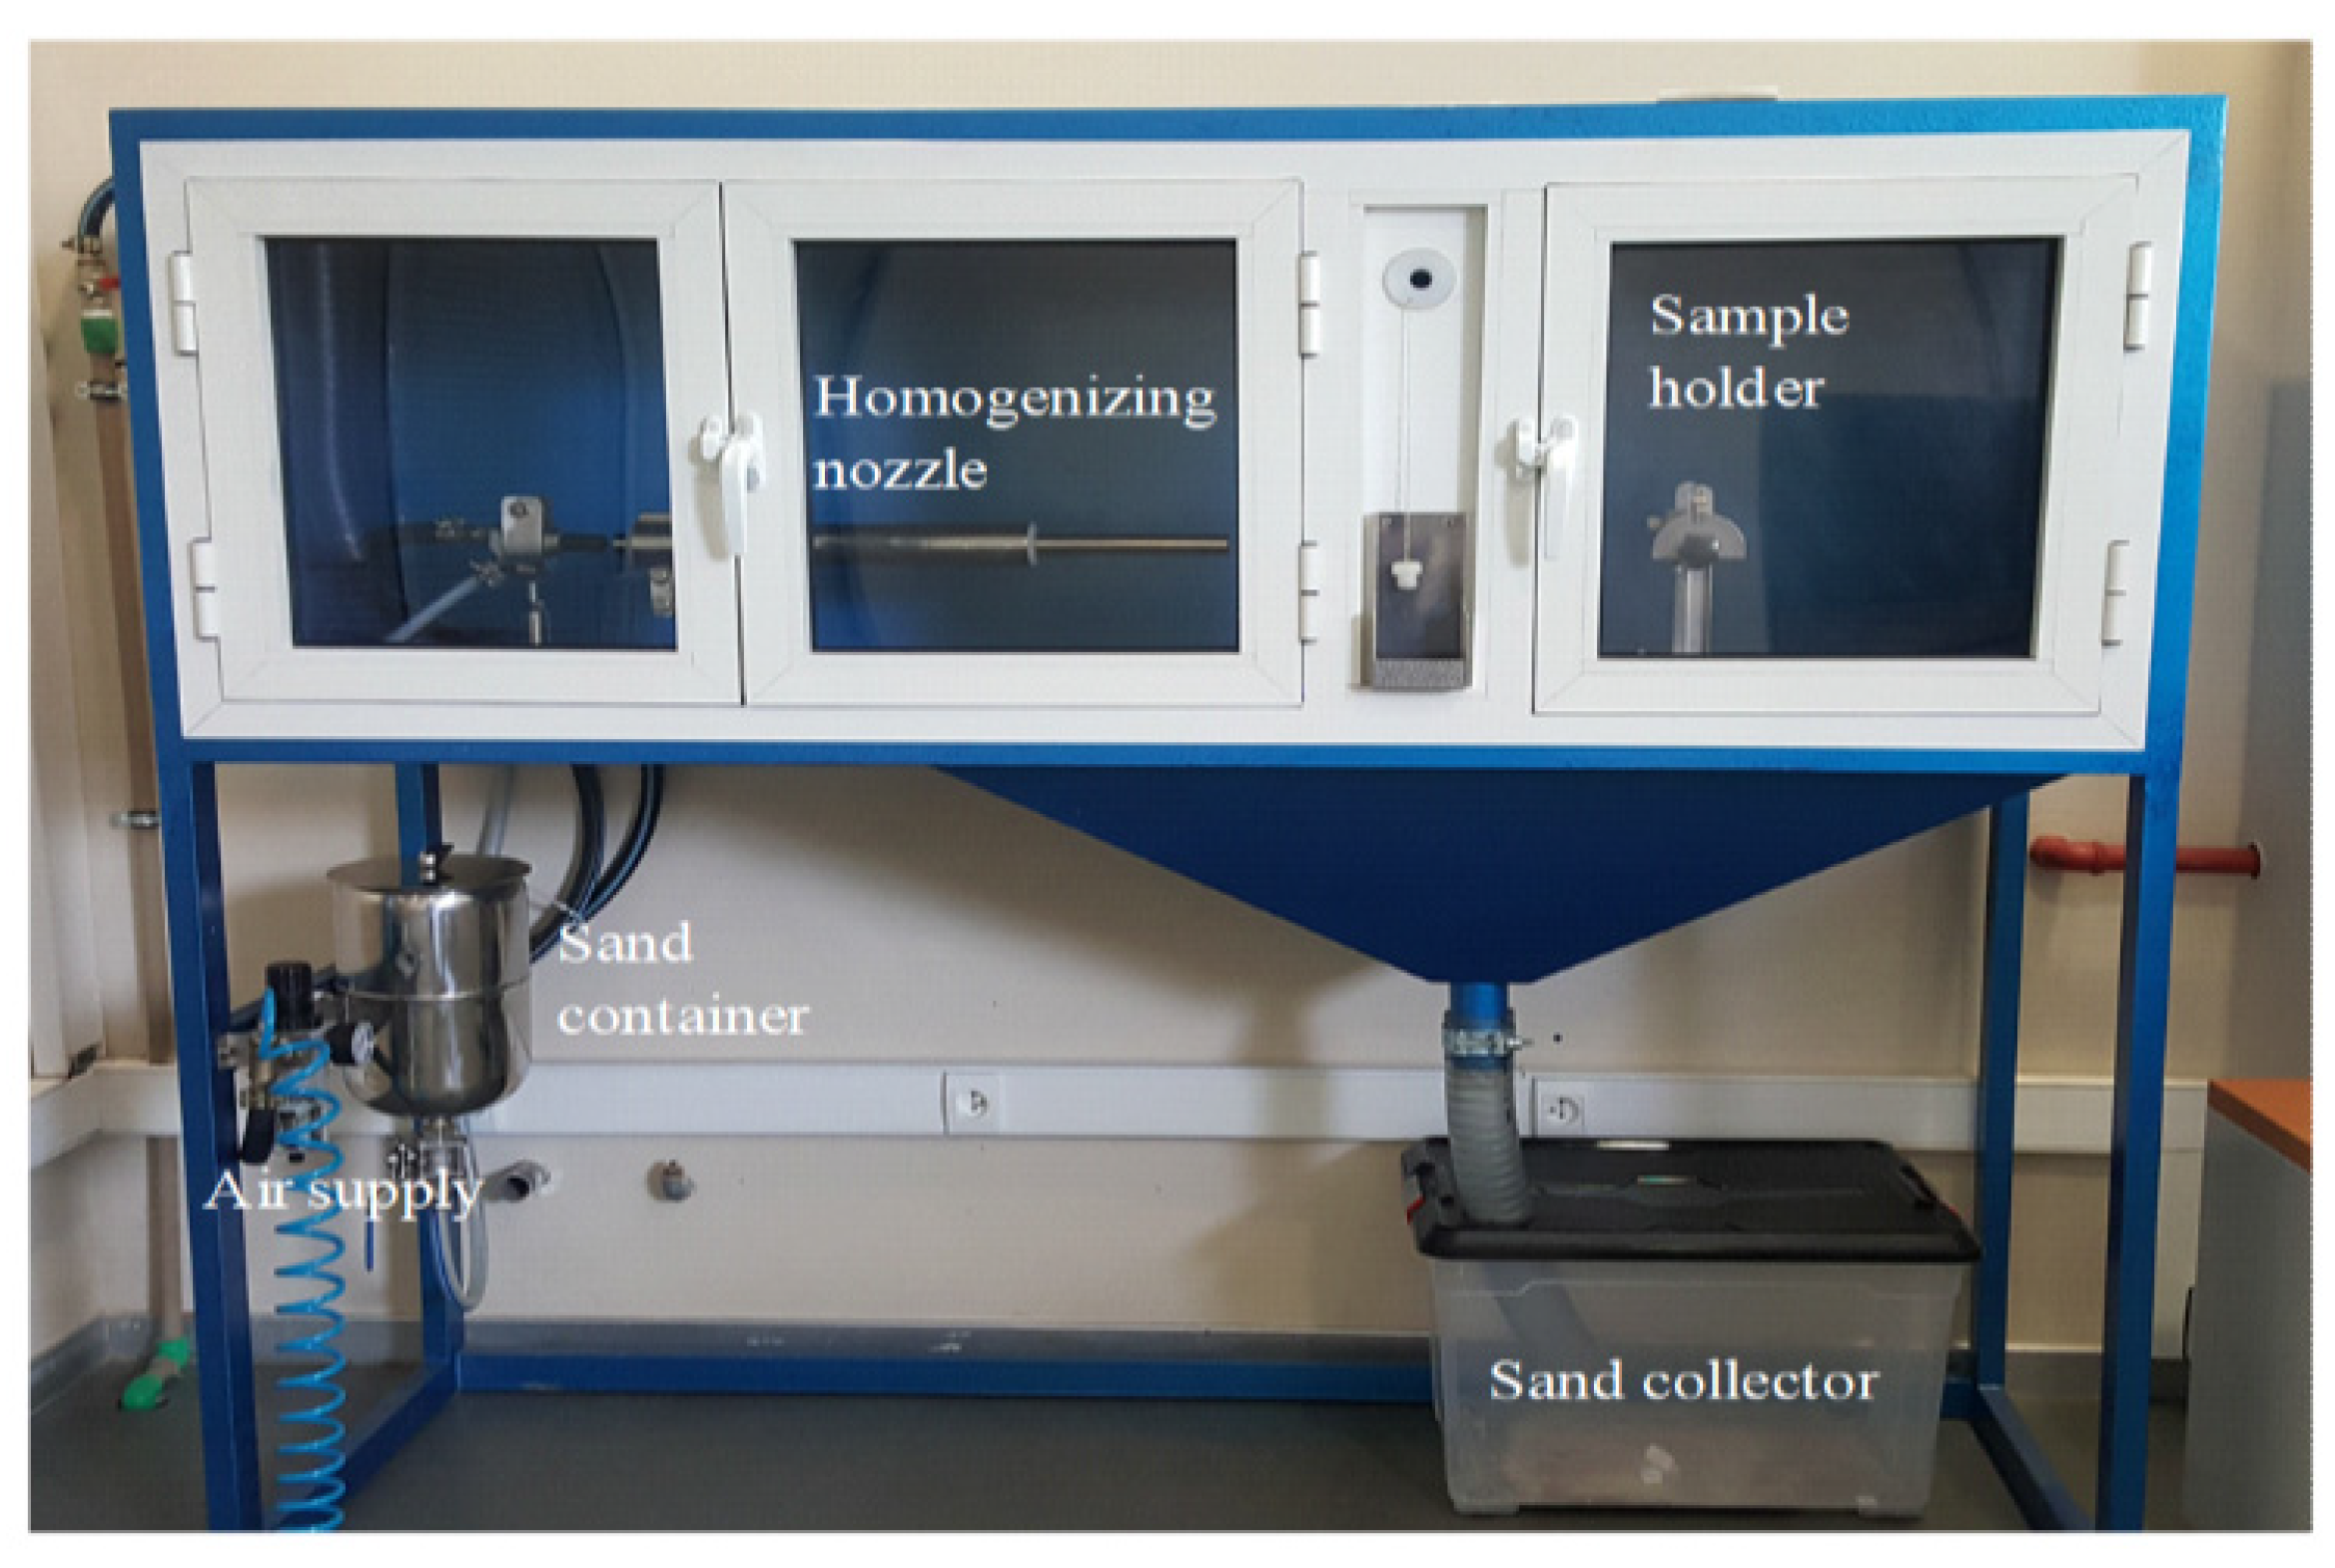
Step 1: the first step of this work is to expose tested samples to an accelerated erosion damage. The test bench used to simulate the erosion degradation caused by sand particles is a horizontal ejection system (Figure 6). The pressurized air and sand particles are homogenized and mixed through a horizontal tube. After the mixture, the particles are propelled and ejected towards the target surface with a fixed air speed and a controlled inclination angle.
As the test bench is an open circuit, tests are conducted under ambient humidity and temperature. To perform the experimental simulation of erosion, the inputs of the test bench are the flow speed, the impact angle, and the ejected sand mass. These parameters can be adjusted as needed. It should be mentioned that the tests are instantaneous (once the air valve is tripped, the sand particles are directly ejected on the surface samples), the ejection duration is controlled using a chronometer and unified to 20 s for all the test configurations. The results presented on this study are conducted using standardized sand MIL-STD-810G purchased from Powder Technology, Inc-Arden Hills-USA. The air velocity is recorded using an Kanomax Anemomaster 6036 Anemometer-USA.
For this work, the erosion parameters are fixed for all tested eroded samples and are summarized in Table 1.
-
Step 2: the second step of this work is to couple erosion and aging tests by exposing the eroded samples and intact samples in a climatic chamber. Two aging tests were chosen:
-
High accelerated aging stress test (HAST): this test aims to study the resistance of materials against humidity. The water pressure inside the chamber is increased until it exceeds the water vapor pressure inside the tested samples. As the water vapor moves from higher pressures to lower pressures, it favors the penetration of moisture into tested samples. This test was performed in an Espec EHS211M climatic chamber according to IEC60068-2-66 in exposing the samples to a constant climate of 2 bars, 110 ± 0.5 °C and 85 ± 3% relative humidity. Samples were positioned in the chamber with an inclination of around 25° to the vertical, front side up.
-
Cyclic UV/water spray test: Though this combined test, we want to study the effect of liquid water that evaporate under UV and to check if eroded samples will retain more water. The Xenon radiation with water spray test, according to ISO 16474-2 [16] consists of the following cycle: in the beginning, samples are exposed to a water spray during 3 min. Afterwards, samples are exposed during 27 min to a xenon radiation (irradiation xenon lamp with filter, 65 W/m2 between 300–400 nm). The total duration of one cycle is 30 min. Samples are tested with the coated/uncoated side facing the Xenon lamps. Tests were led in an ATLAS SUNTEST XXL+ climatic chamber.
Tests conditions are summarized in Table 2.
-
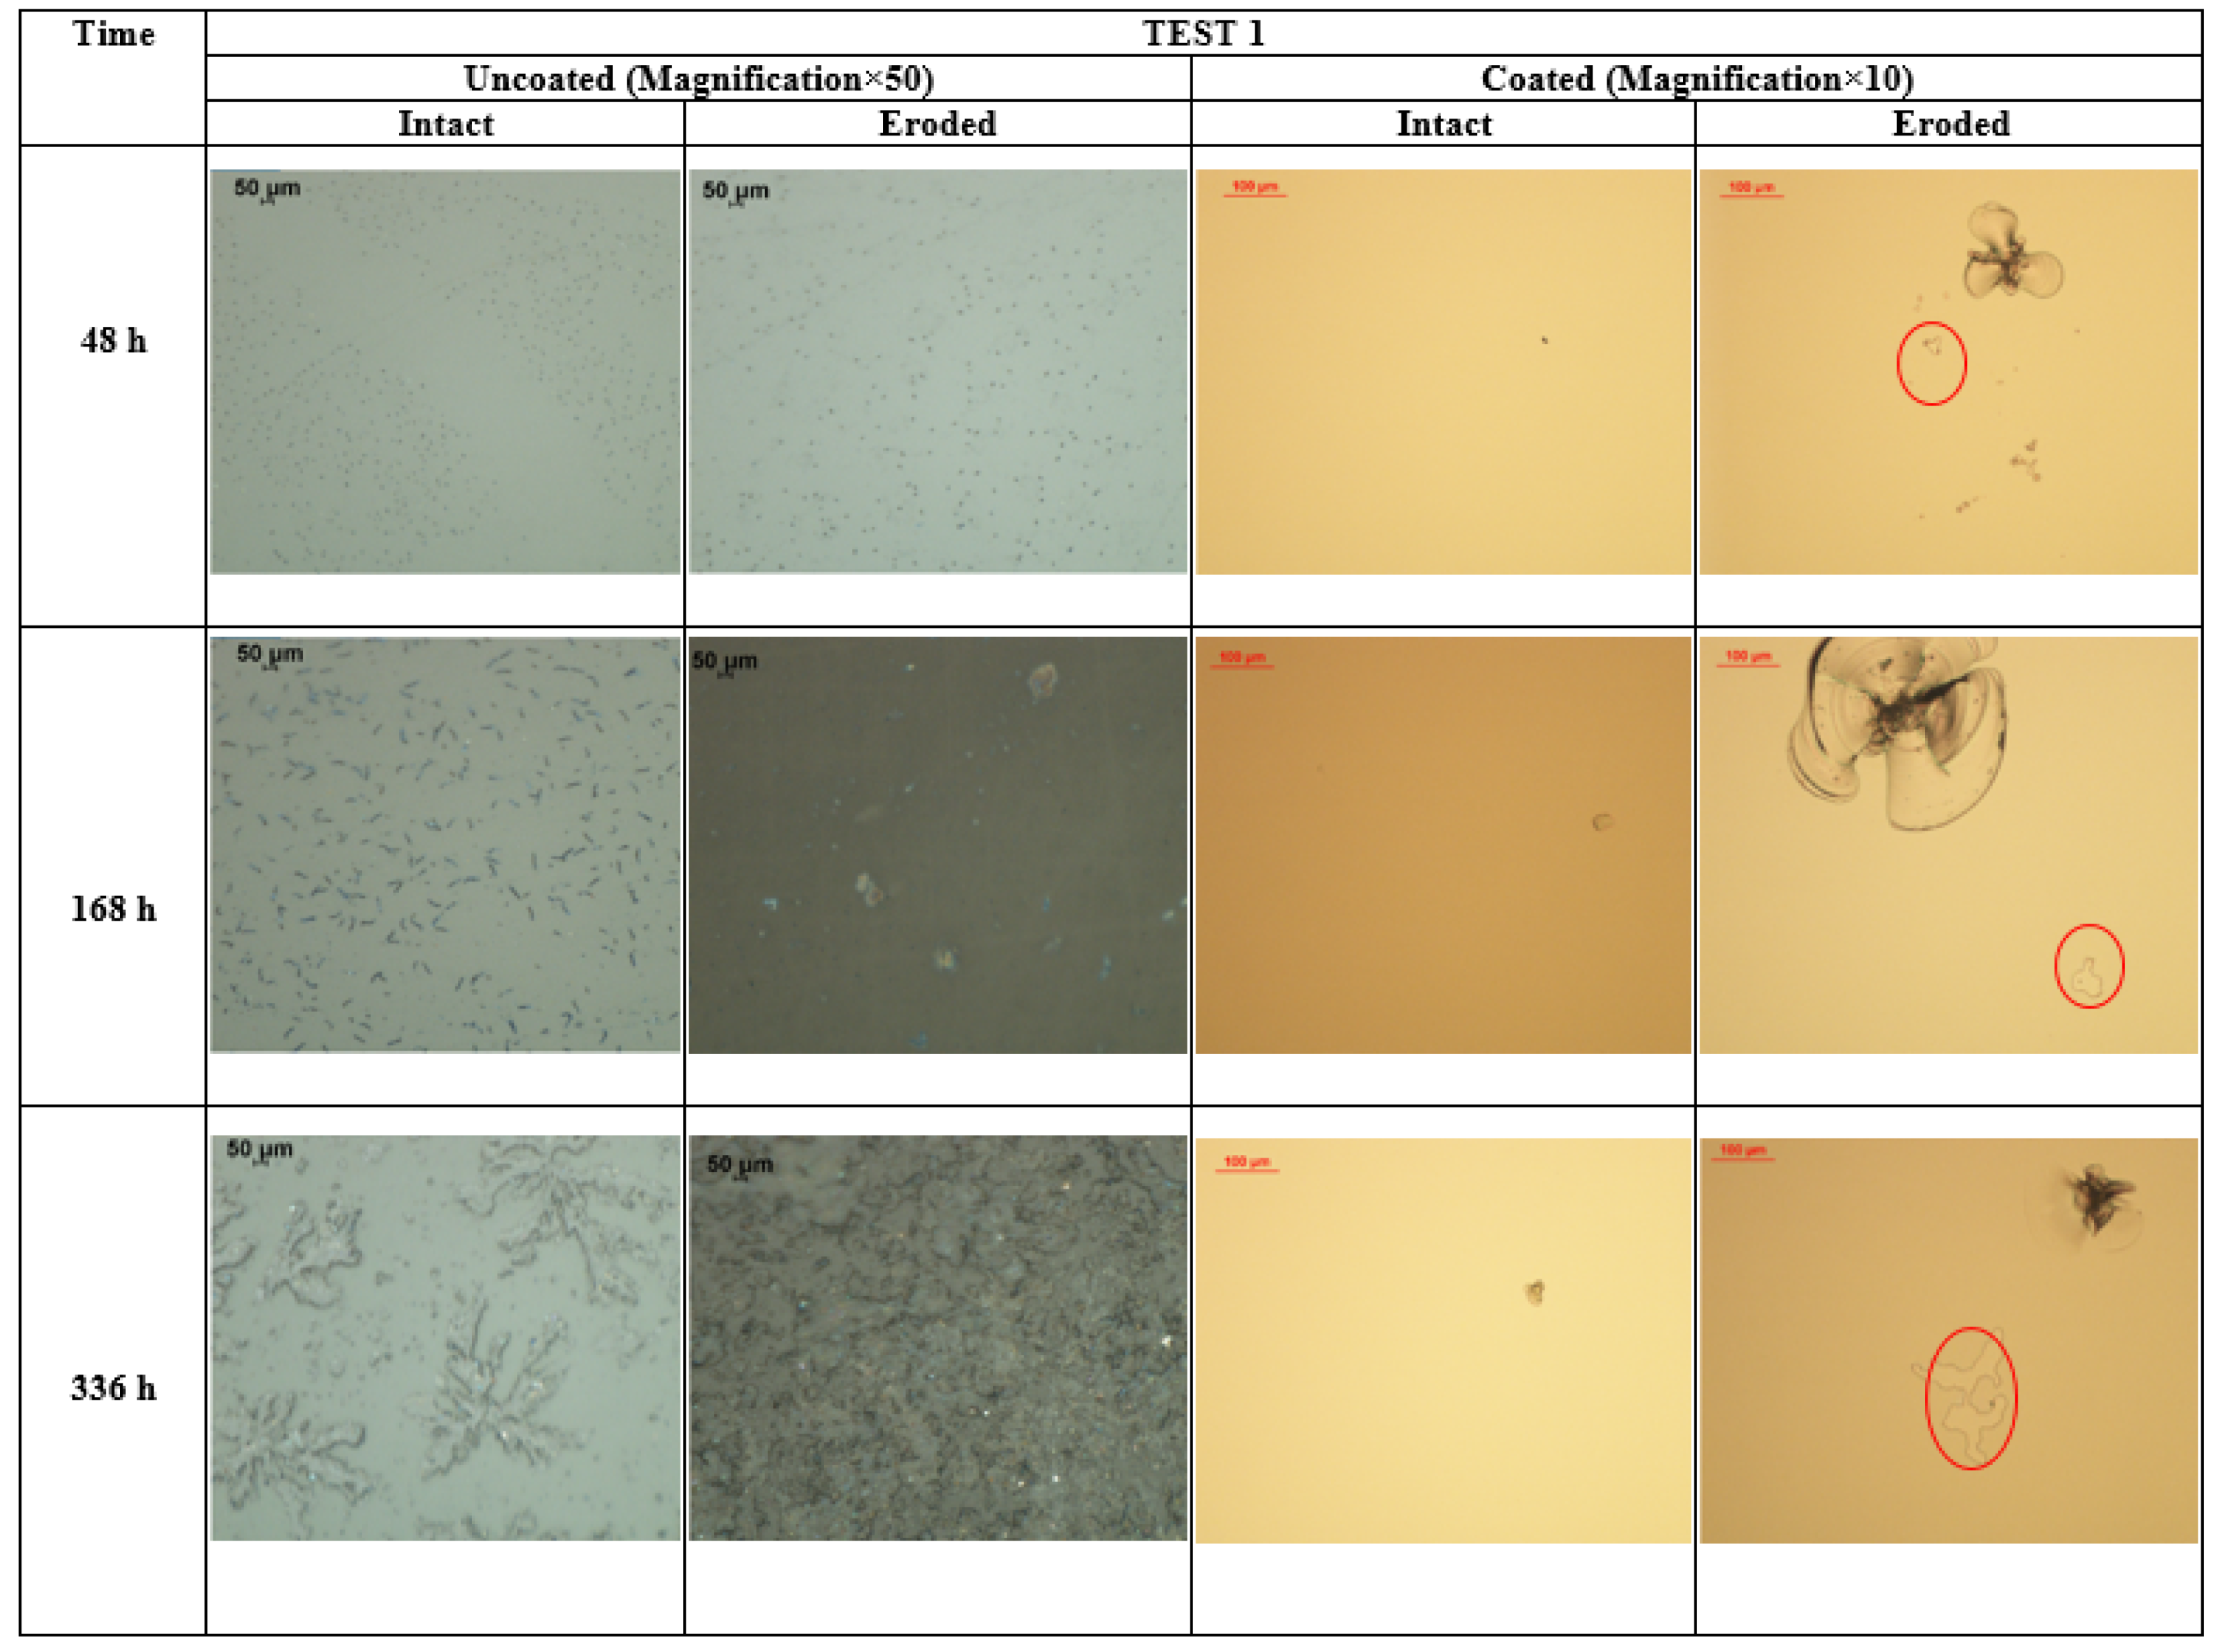
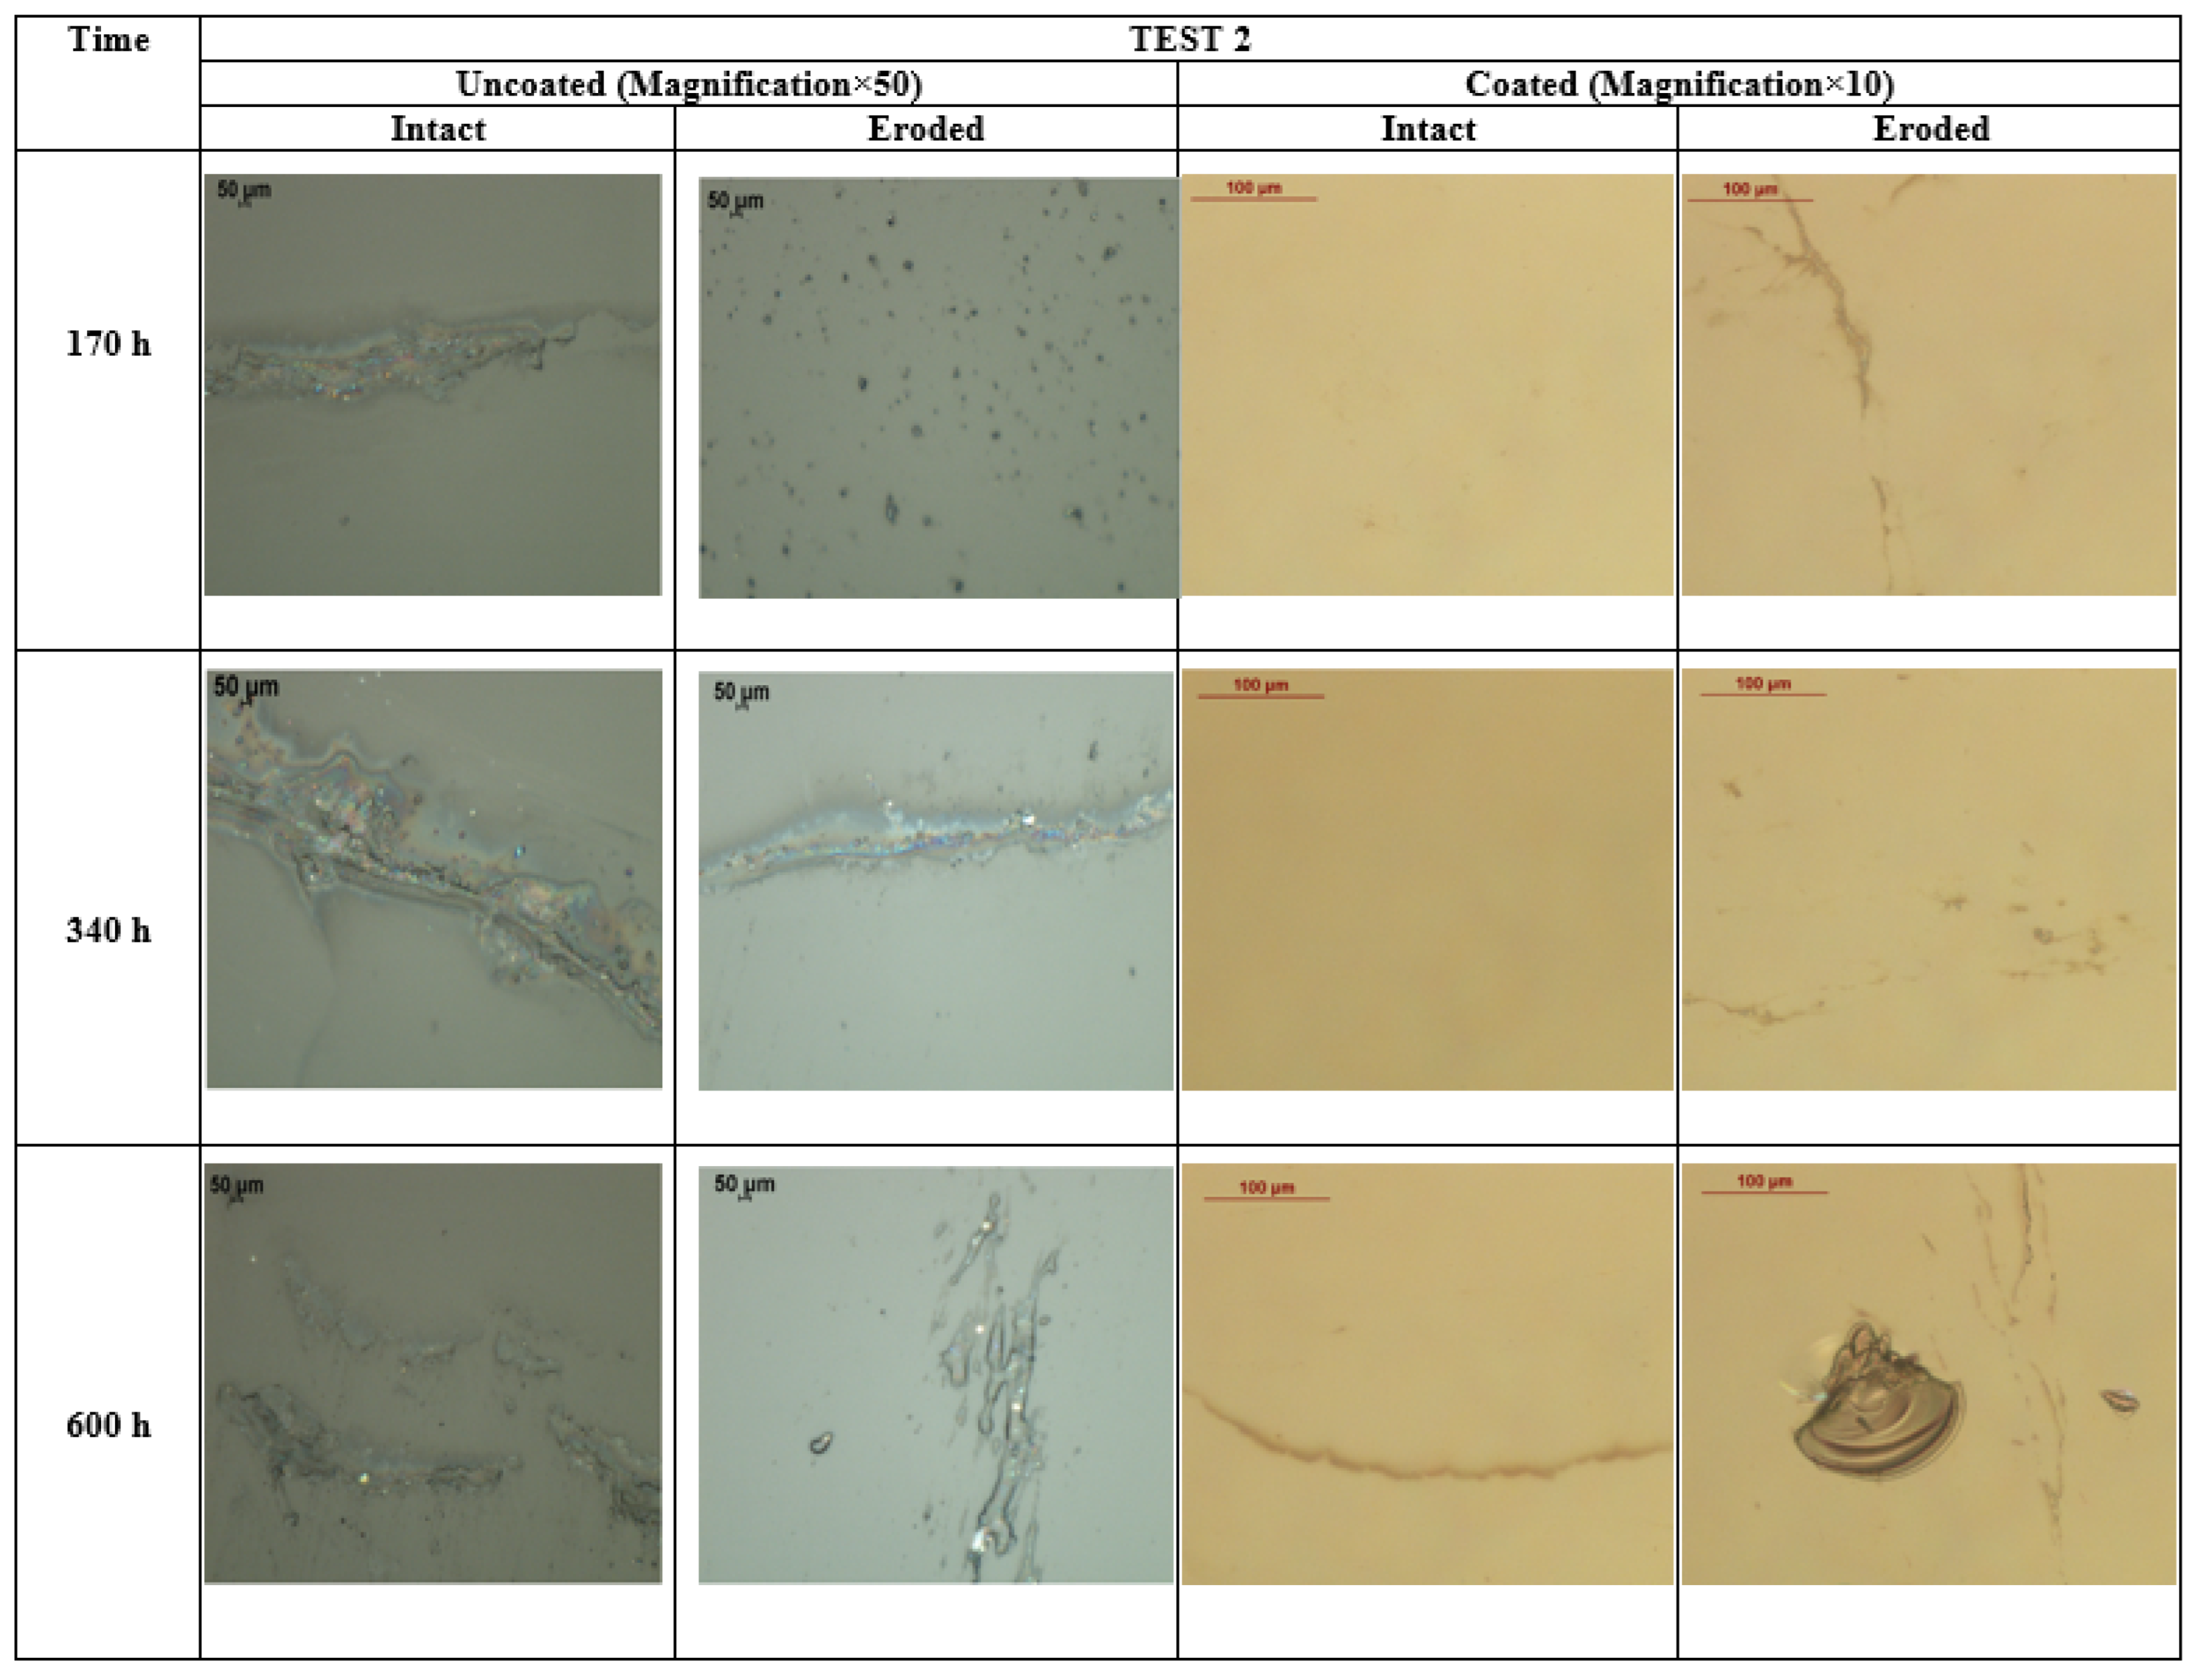
Step 3: after introducing tested samples into the climatic chambers, the weathering will be provided for the entire period (336 h for HAST test and 600 h for SUNTEST test). Three follow-ups are planned, and 4 samples were removed (uncoated intact—uncoated eroded—coated intact—coated eroded) from every follow-up for laboratory analysis. For HAST test N°1, the follow-ups are planned respectively after 48 h, 168 h and 336 h. For SUNTEST test N°2, the samples are analyzed after 170 h, 340 h and 600 h.

2.2. Measured Parameters

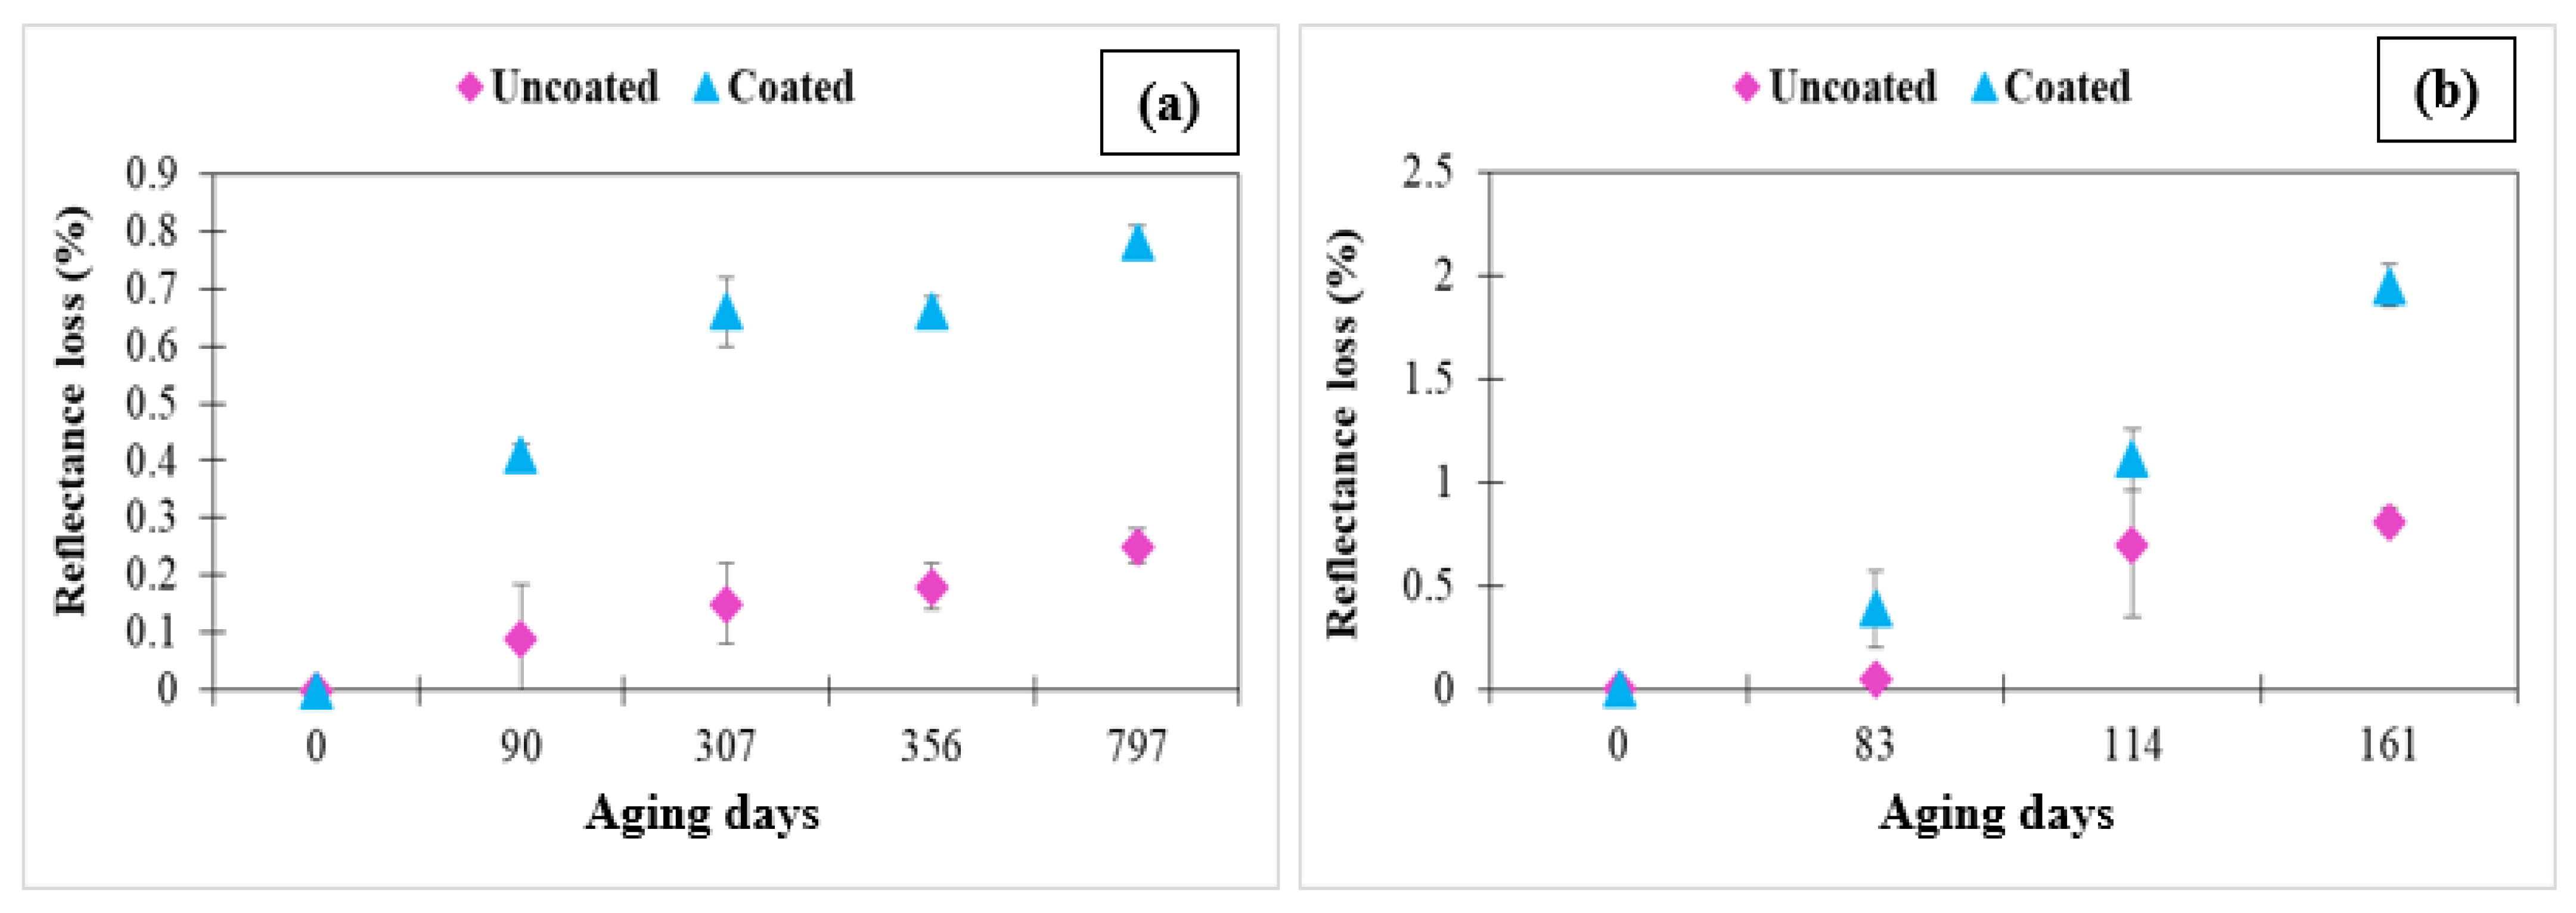
2.2.1. Reflectance Loss

The optical performances of solar mirrors constitute the most important parameter that should be well known, because any optical performances decrease is accompanied by the profitability decrease of the entire plant. The total reflectance of a mirror is rendered as the sum of the specular reflectance and the diffuse reflectance. Specular reflectance is an optical property that measures the ability of the mirror to reflect incident sunlight in a single direction. In the initial state, the diffuse reflectance of the CSP technology mirrors without erosion may be negligible compared to the specular one. However, after exposure under degrading conditions, the diffuse reflectance increases while decreasing the specular one. The measurement of two types of reflectance is important for our study. It is provided by a portable D&S 15R-USB reflectometer—devices and services company—Texas—USA allows the specular reflectance measurement at a single wavelength of 660 nm with an incident angle θi = 15° and a half acceptance angle φ = 12.5 mrad. Its advantage is a quick and accurate idea of the degradation effect on the optical properties of mirrors. The monochromatic specular reflectance loss is noted ρλ,φ is calculated according to Equation (1) for intact samples (samples at the initial state) and Equation (2) for eroded samples.
Δ ρ λ , φ ( % ) = ρ λ , φ ( i n i t i a l _ i n t a c t ) ρ λ , φ ( a f t e r   a g e i n g ) ρ λ , φ ( i n i t i a l _ i n t a c t )
Δ ρ λ , φ ( % ) = ρ λ , φ ( i n i t i a l _ e r o d e d ) ρ λ , φ ( a f t e r   a g e i n g ) ρ λ , φ ( i n i t i a l _ e r o d e d )

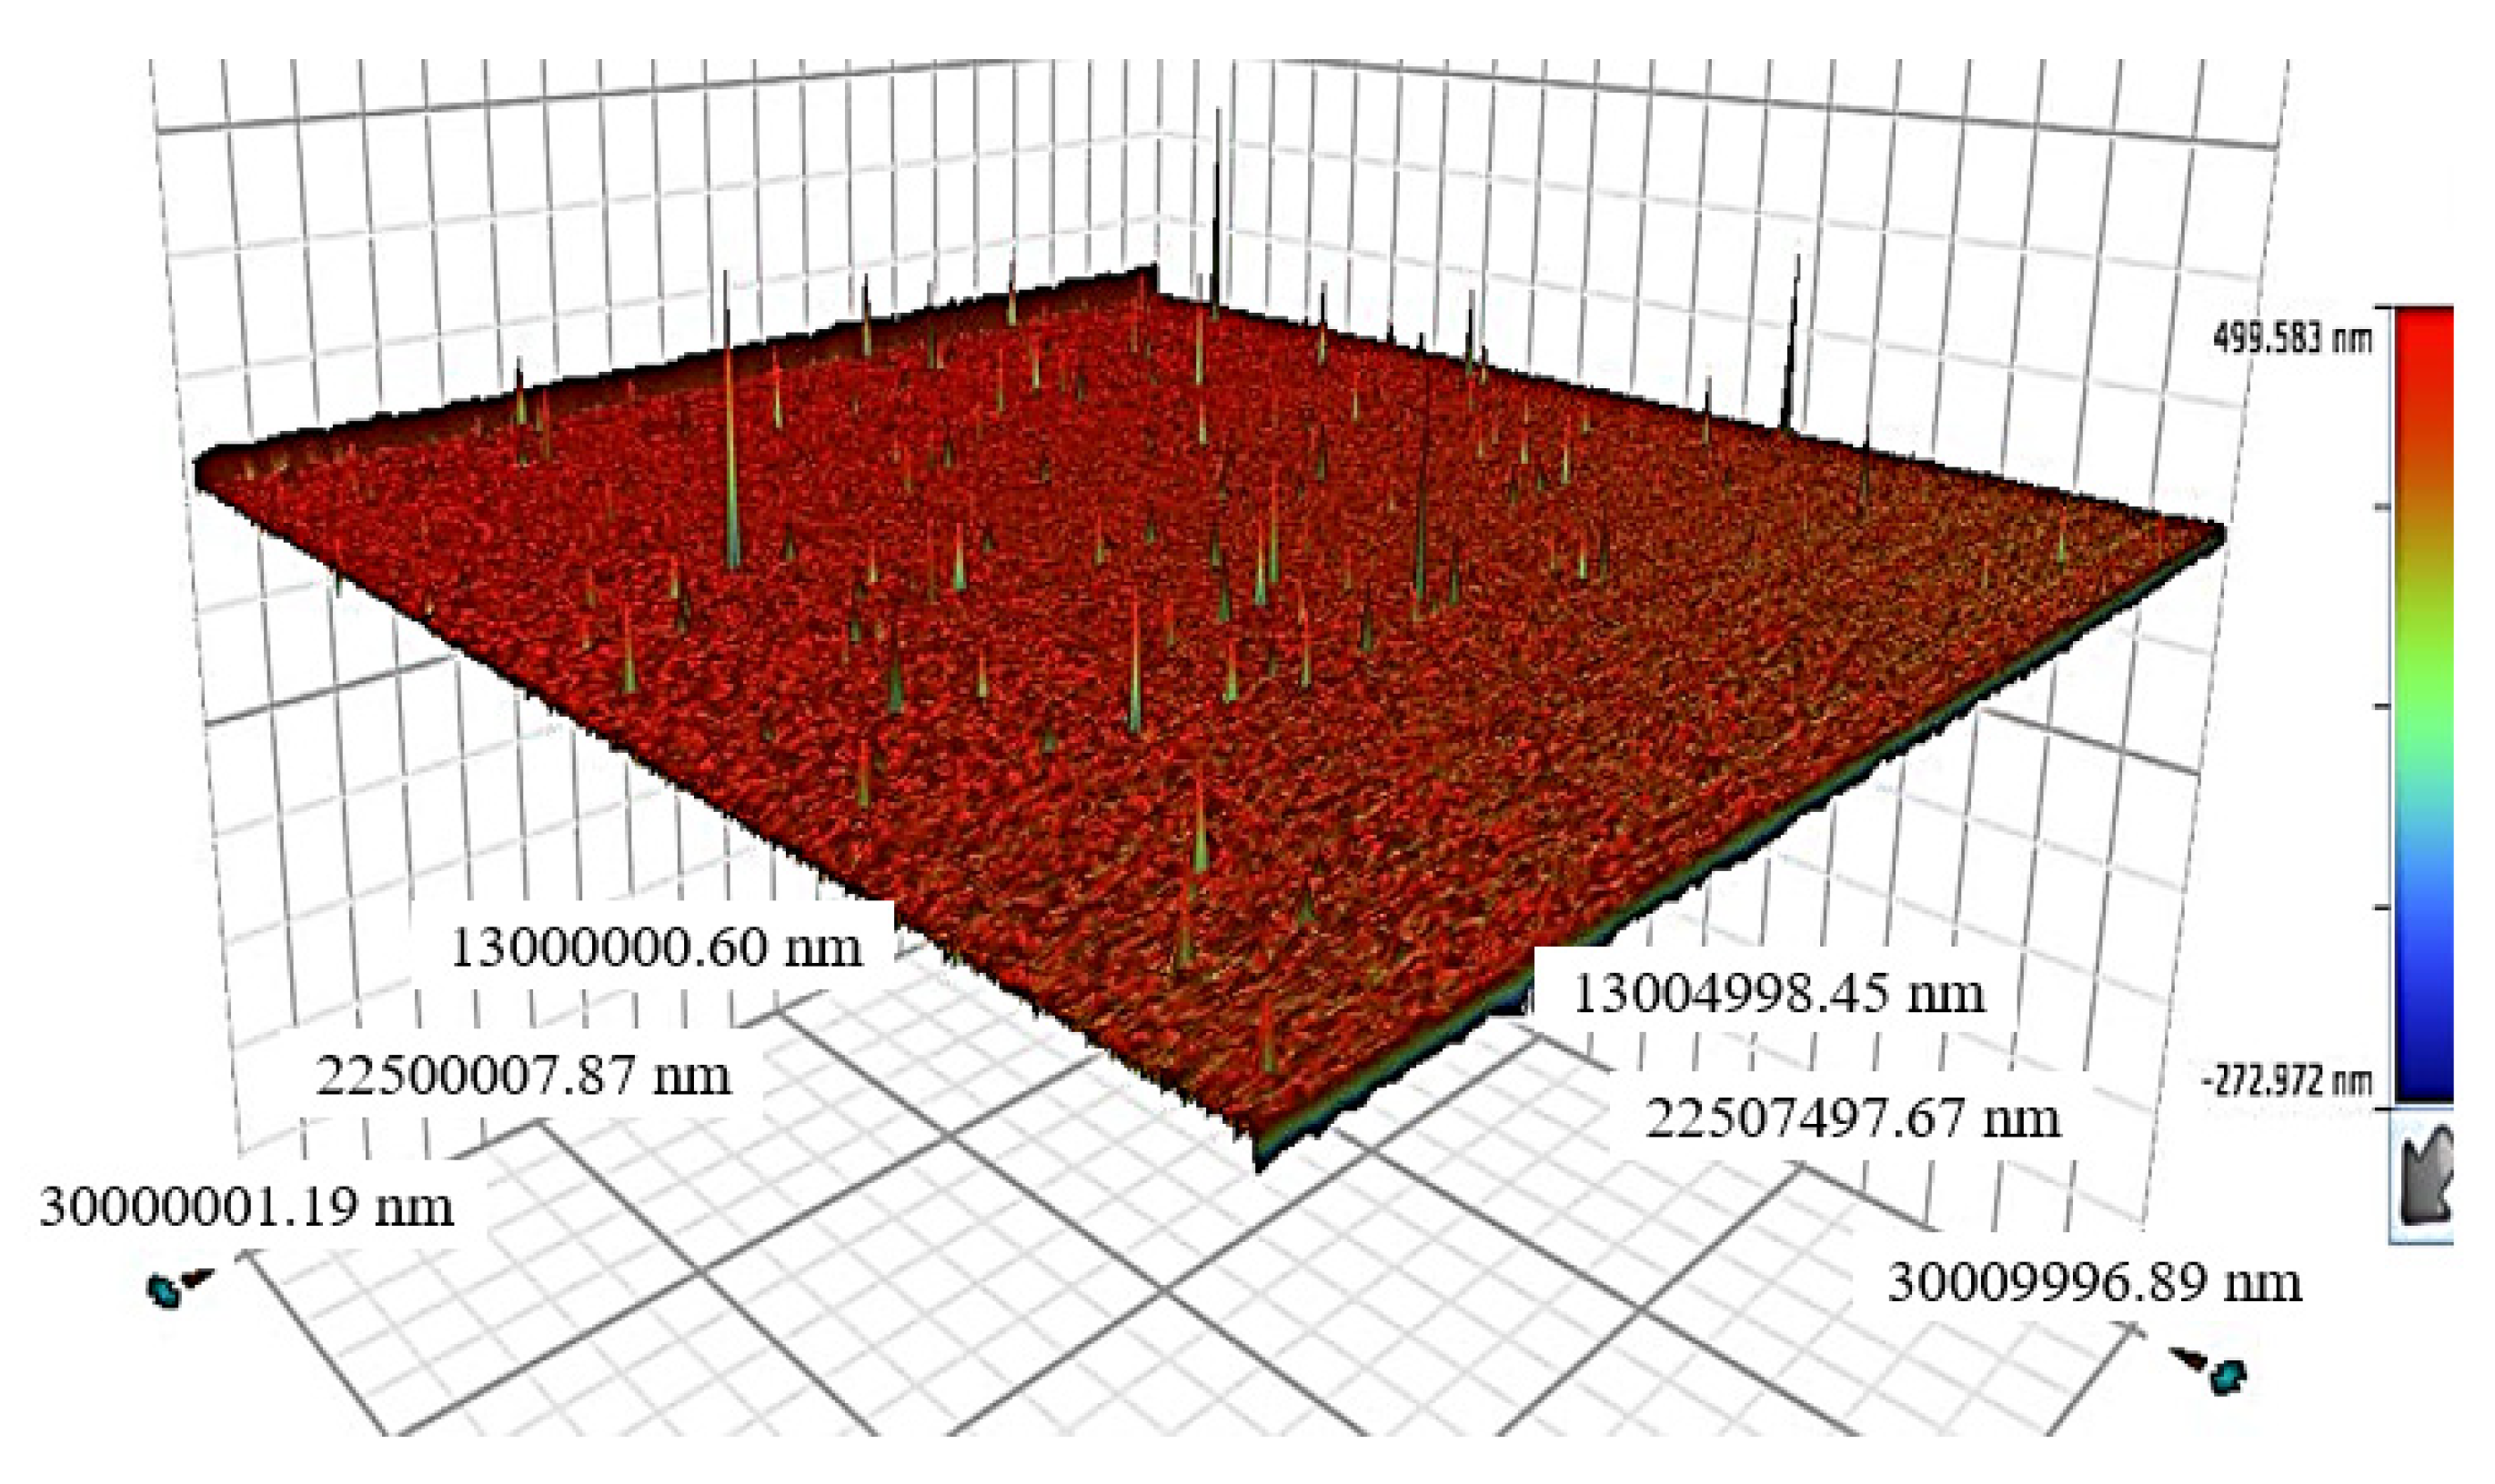
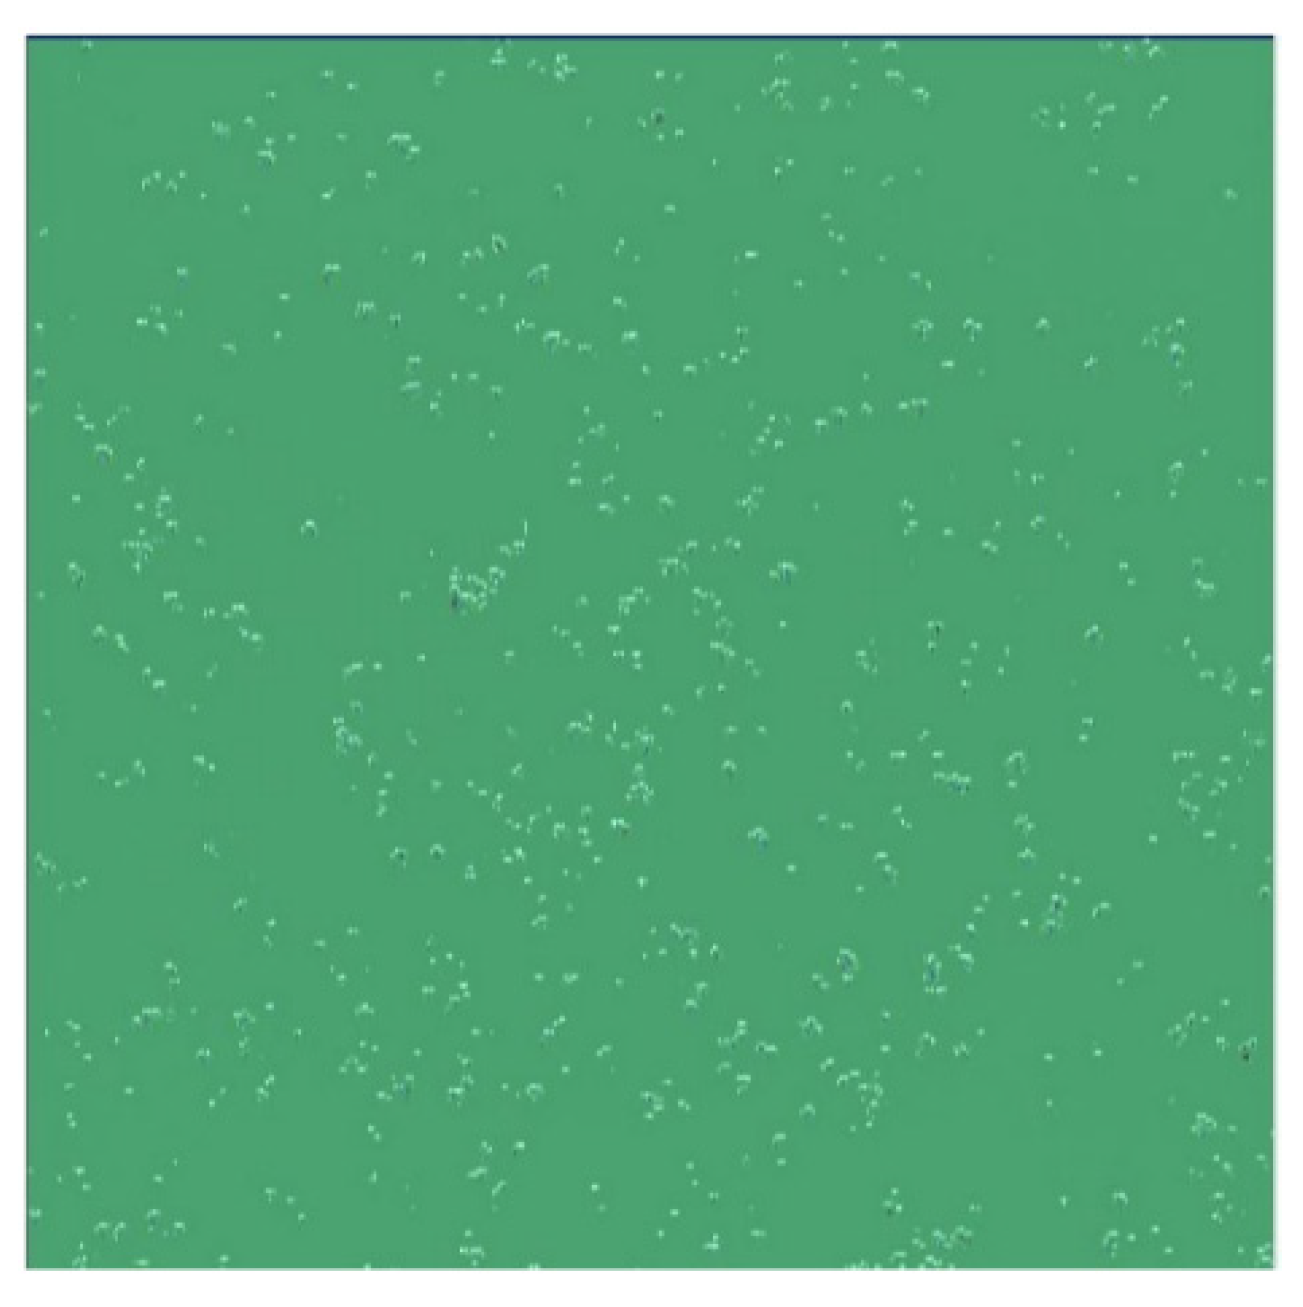
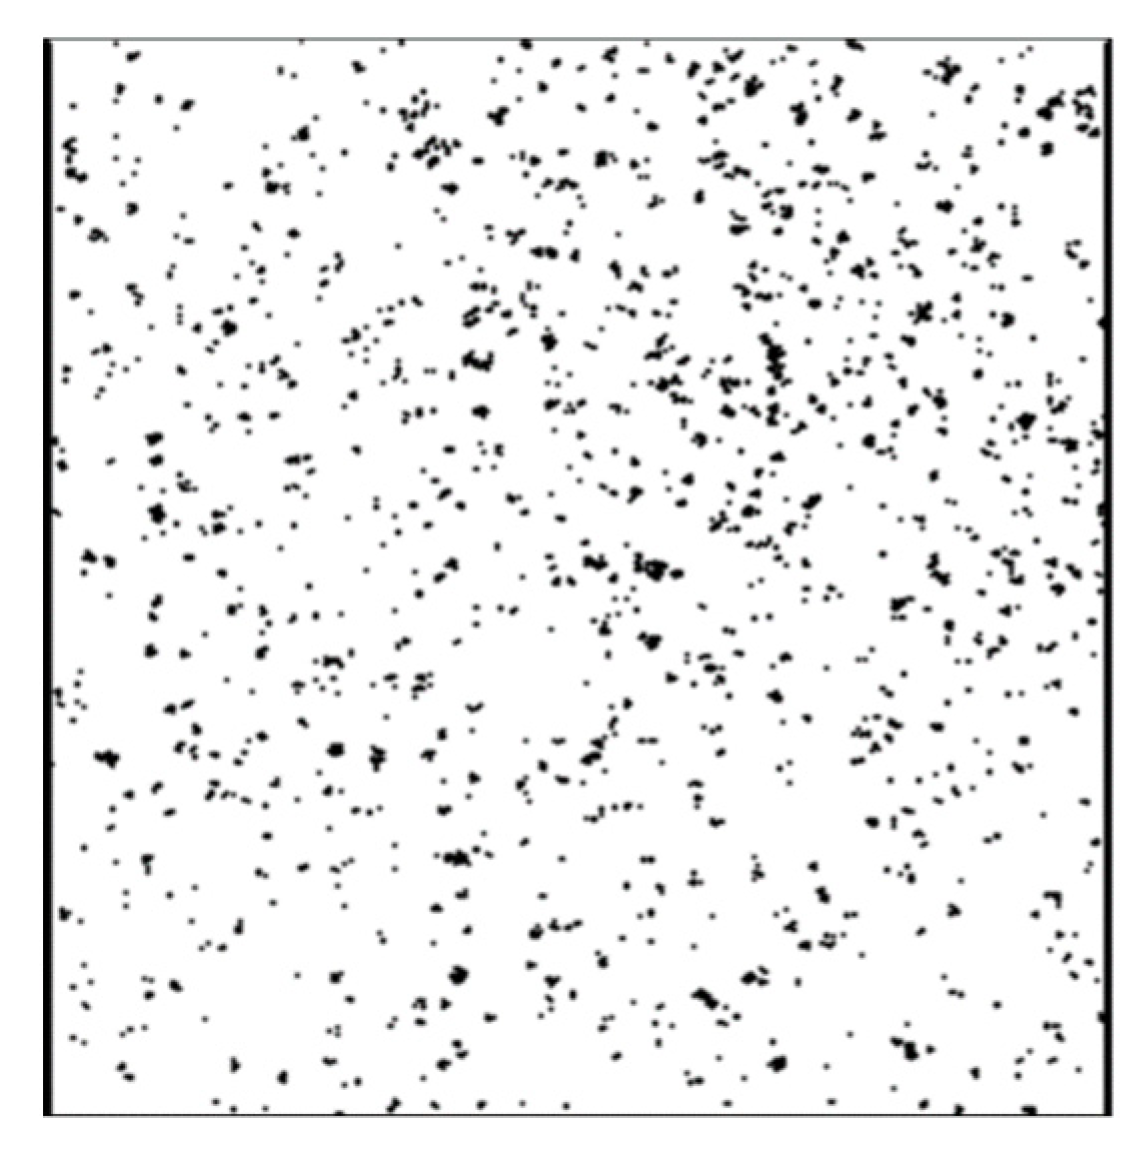
2.2.2. 3D Surface Profiling

To analyze the mechanical defects created on samples surface, a 3D scan was realized by a Bruker mechanical profilometer which allows determining the samples surface roughness and to generate a 3D surface map of tested samples (Figure 7). This map is established by moving the profilometer stylus on the samples surface along the X and Y axis. At each point, the stylus detects the surface depth along the Z, z (x, y). The resolution of the obtained maps is 100 µm and it depends on the displacement step of the scan along the X and Y axes as well as the curvature radius of the stylus which is 12.5 µm.
The obtained mapping is then smoothed by a Gaussian filter to eliminate background noises from the machine as well as vibrations in the handling room. Figure 8 shows the obtained map after the application of a Gaussian filter.
We perform an image analysis using image treatment software ‘ImageJ’-version 1.52. This image processing allows, by a threshold adjustment of the initial image, to highlight the impacts and defects recorded of the samples surface (Figure 9), and consequently to analyze information about the number and diameter of generated defects during the aging process.

3. Results

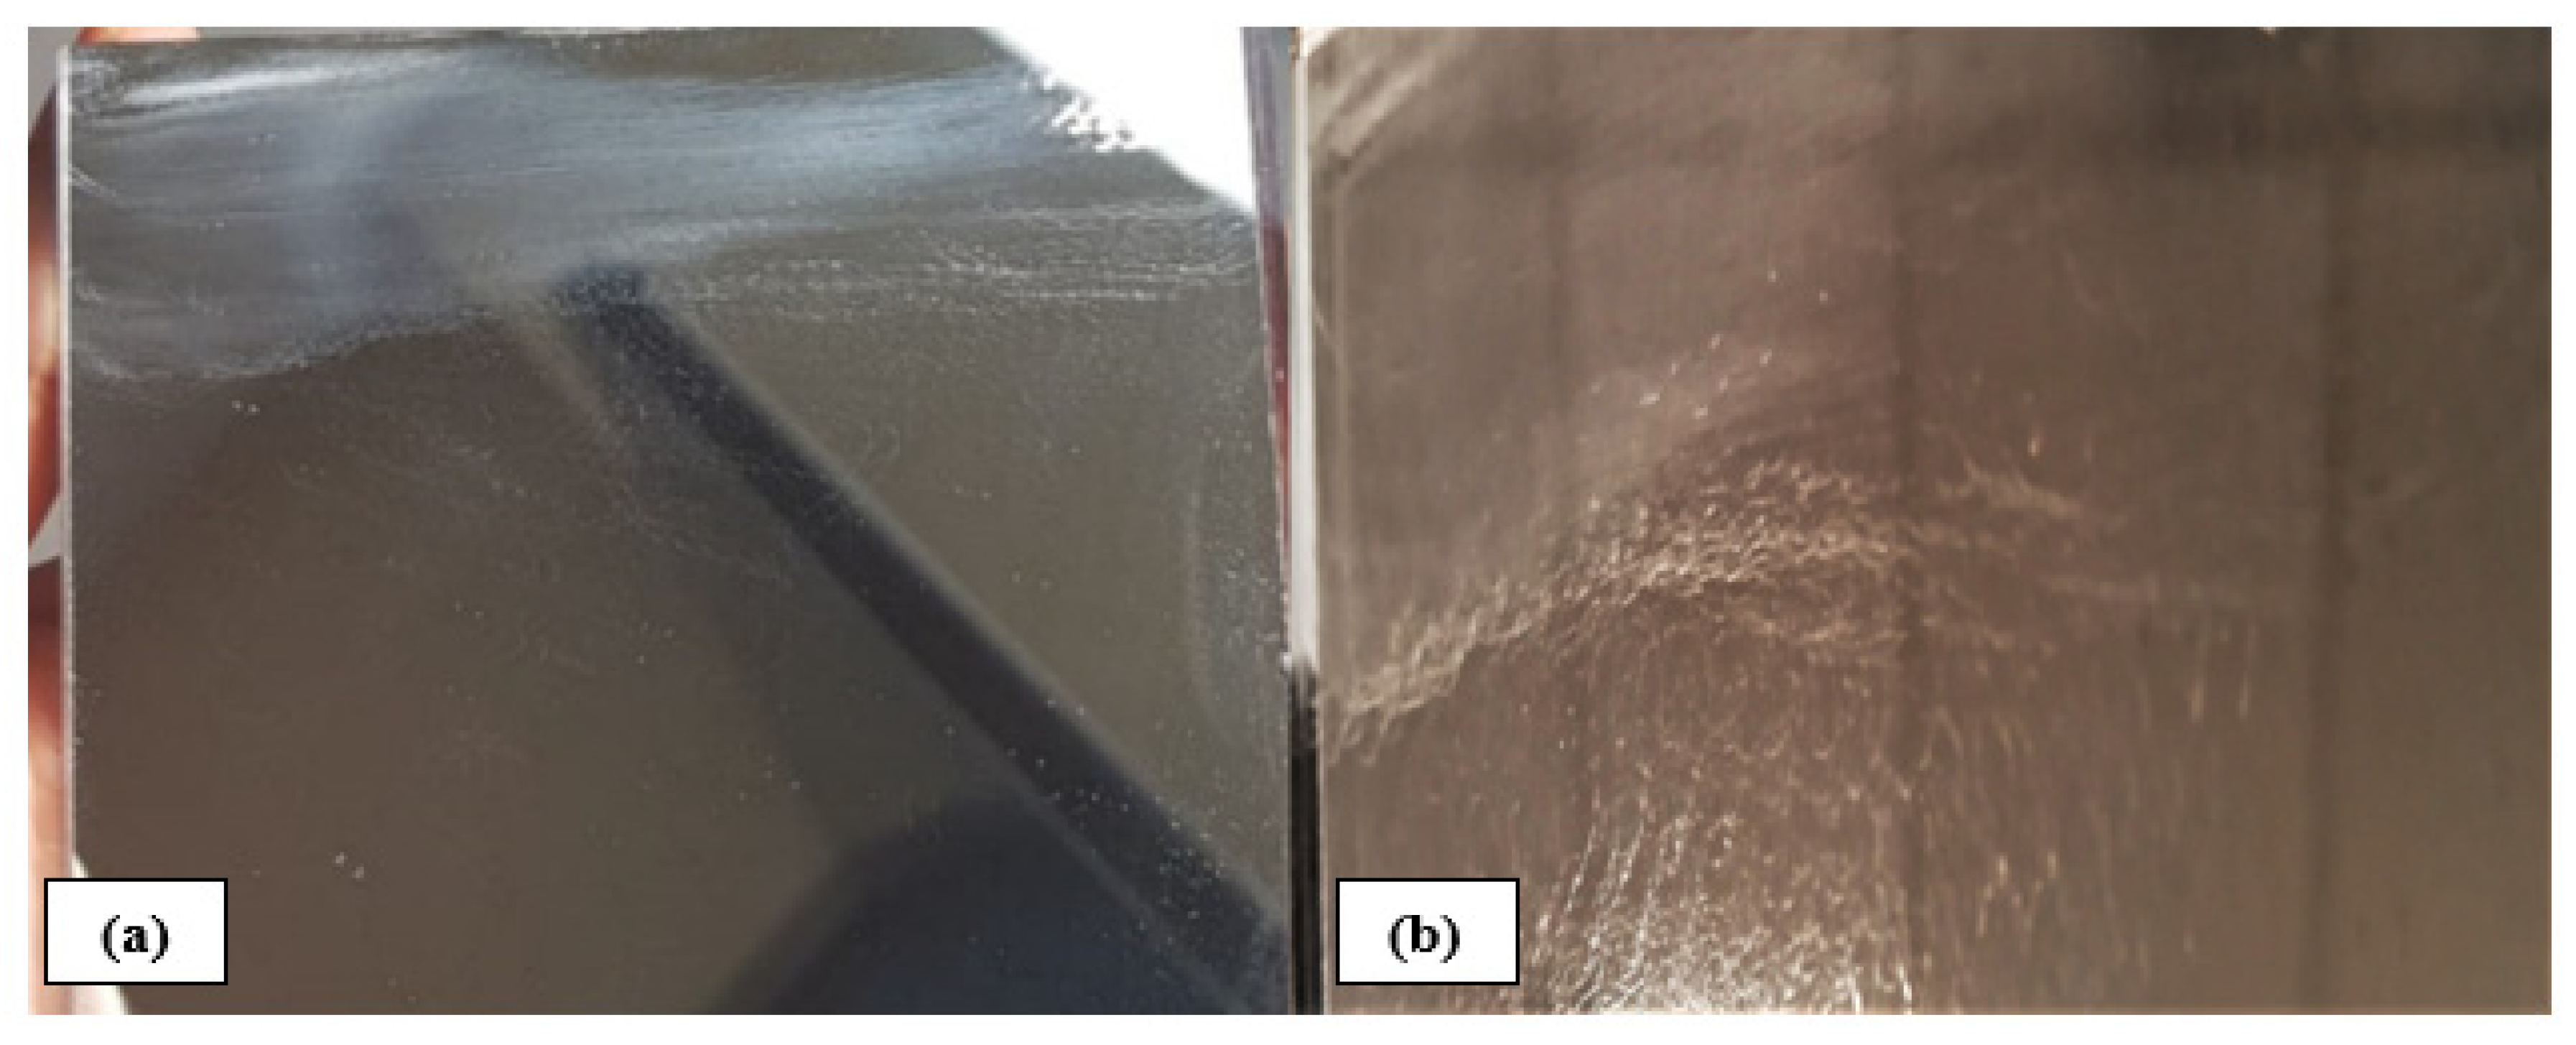
3.1. General Degradation Aspects

To detect the various defects created on the samples surfaces and compare their evolution in the four states; intact, eroded, coated and uncoated samples. Firstly, a microscopic study was conducted on aged samples. The results are summarized in Figure 10 for HAST (test N°1) and Figure 11 for SUNTEST (test N°2).
HAST test: for uncoated samples and for both intact and eroded states, the main detected defect recorded after 48 h of aging corresponds to the formation of pits on the glass surface. The density and shape of created pits change with time and appear bigger at 168 h for eroded samples. These detected defects are the result of the glass corrosion because the front protection of uncoated solar mirrors is ensured by a soda-lime glass which possesses groups that can easily react with water leading to a glass corrosion [17]. The high testing temperature favors this corrosion reaction according to Arrhenius equation [18]. Coated samples show more resistance, mostly for intact samples with just some small peeling of the coating after 168 h. For eroded samples, in addition to erosion impacts, a detachment of the antisoiling coating is observed and the dimensions of the detachment defects increase with time.
SUNTEST: for uncoated samples, the appearance of a significant glass degradation was detected after 170 h for both intact and eroded samples. The transparency loss of some parts of the glass was observed (Figure 12). The formed defects spread at significant distances unlike test N°1 where the formed defects are punctual. Like test N°1, coated samples were more resistant, and the main observed defect is the coating degradation which is more important for eroded samples.
These microscopic pictures demonstrate that the degradation on the uncoated samples is occurring only on the top side. If a degradation occurred in the silver layer by the backside or the edges, corrosion spots would also be seen on the coated samples as reported in previous studies with reflectors from other manufacturers [19].

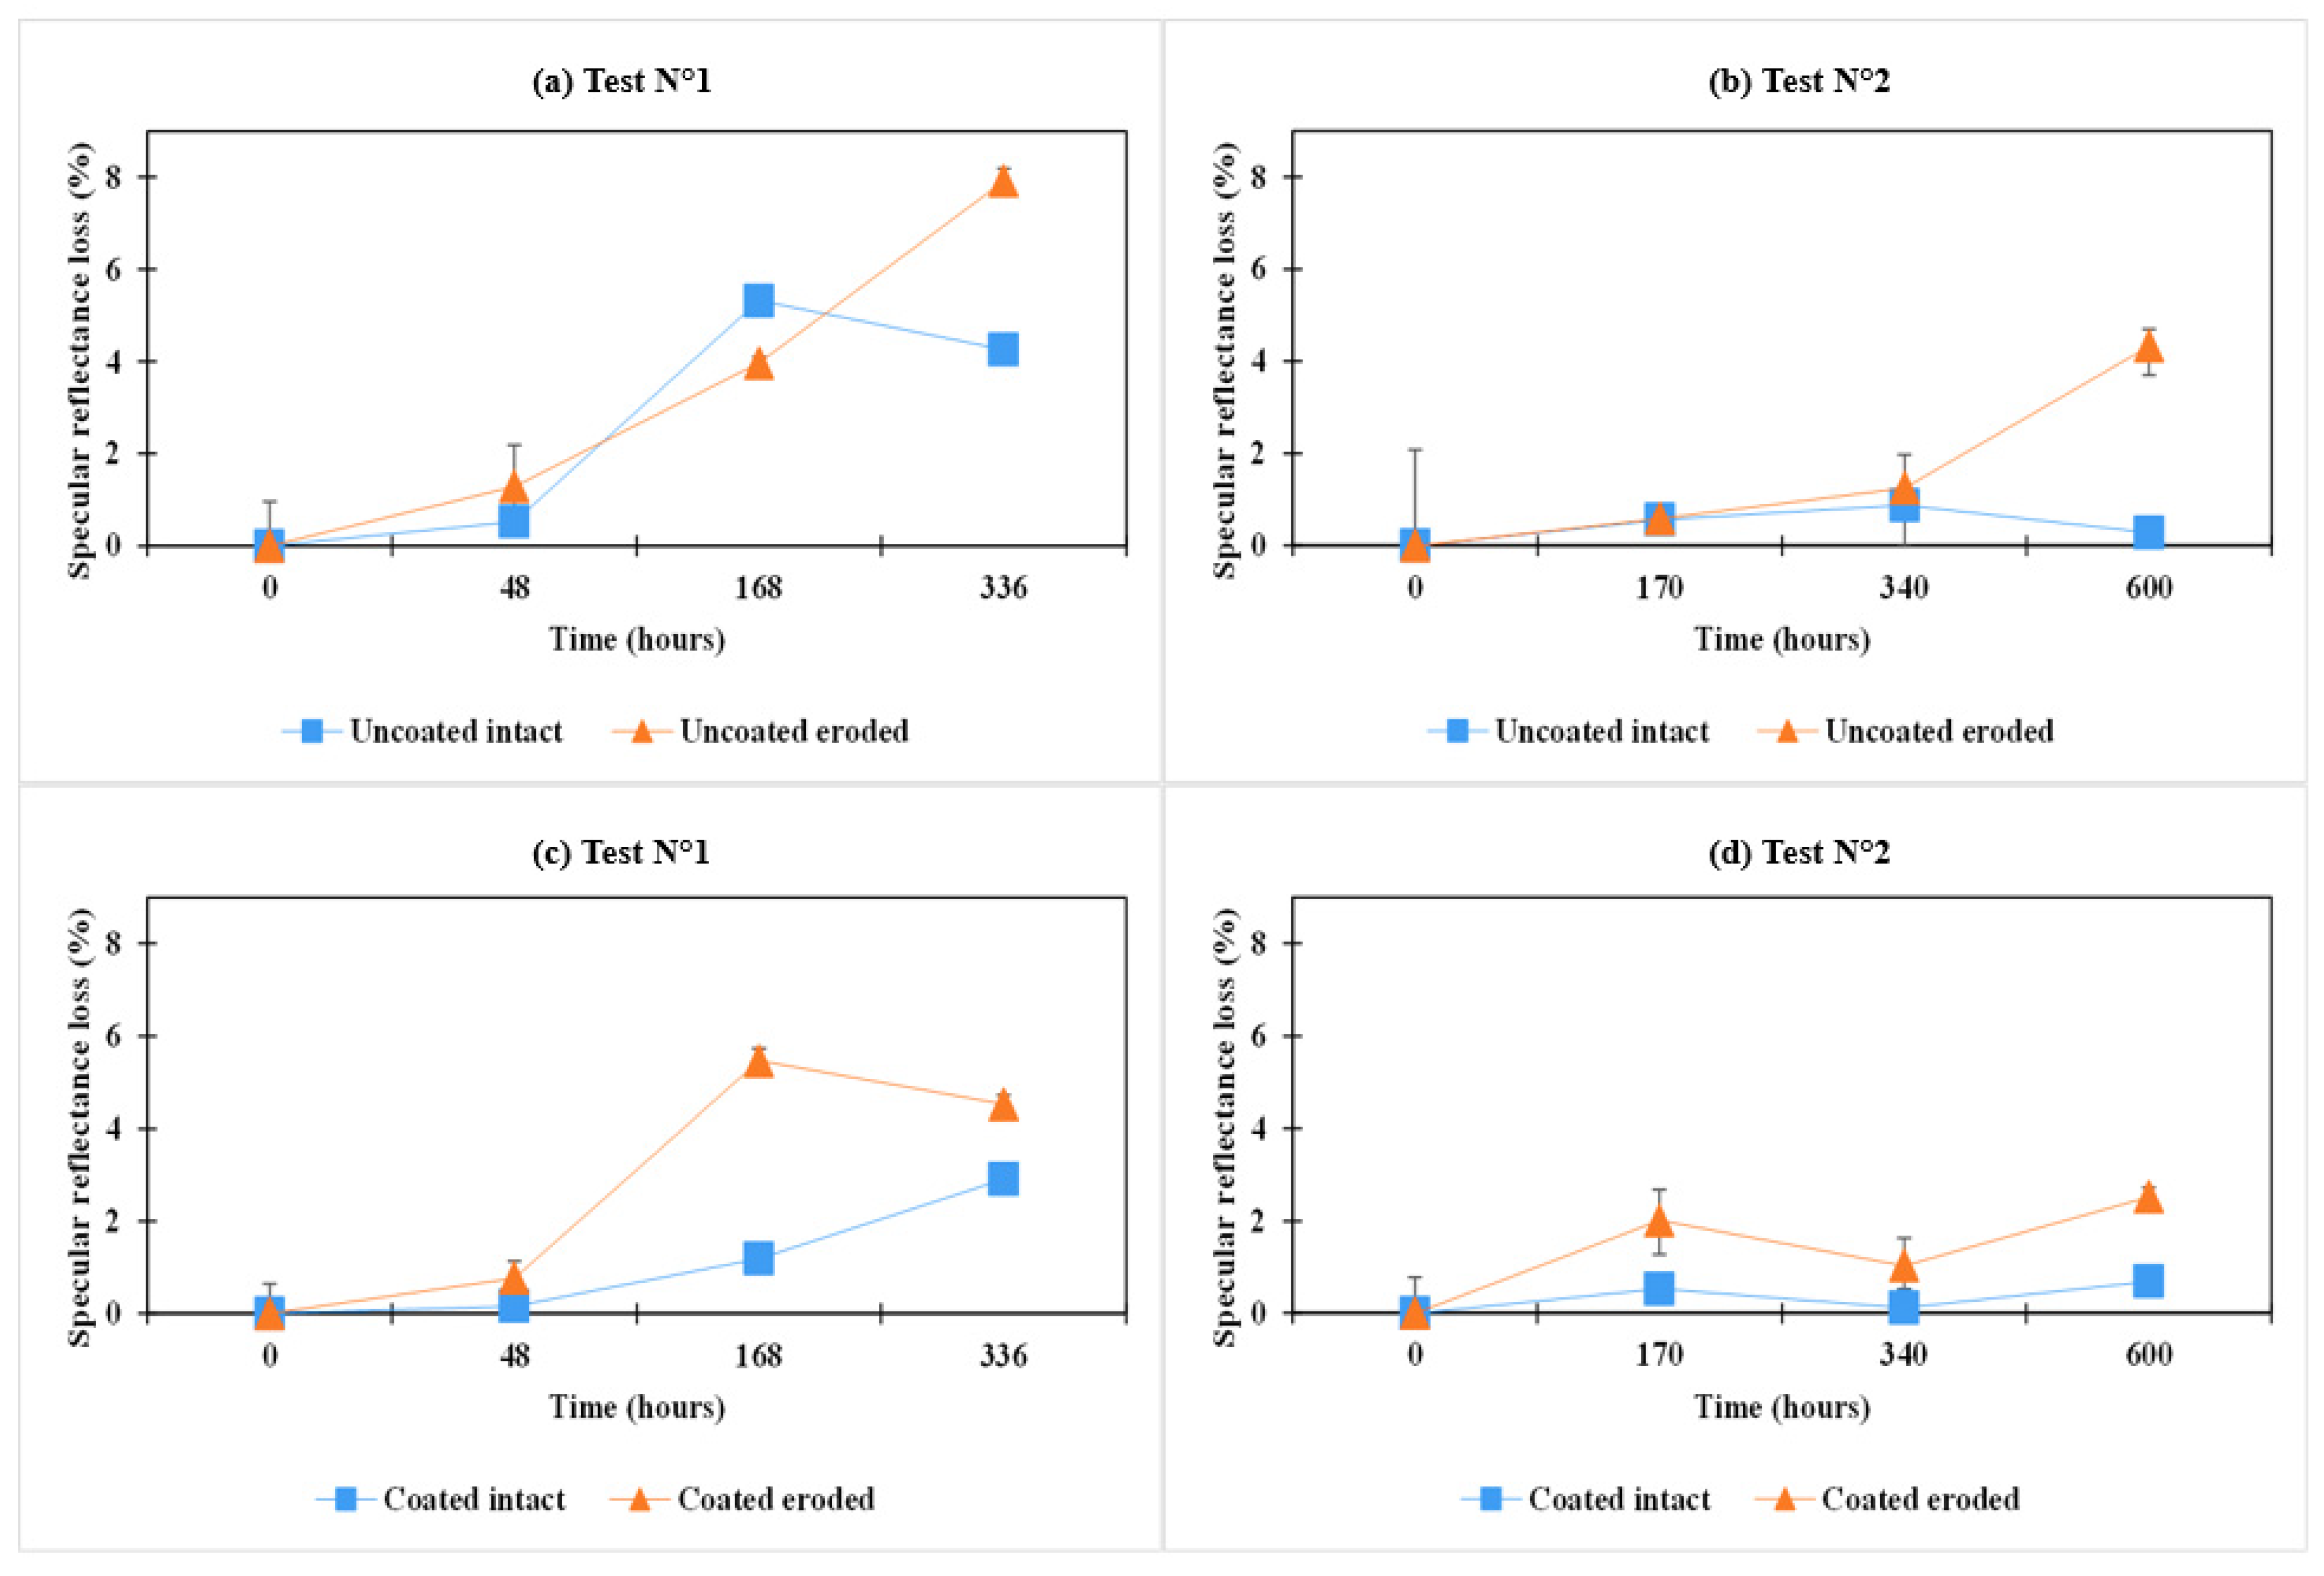
3.2. Optical Degradation
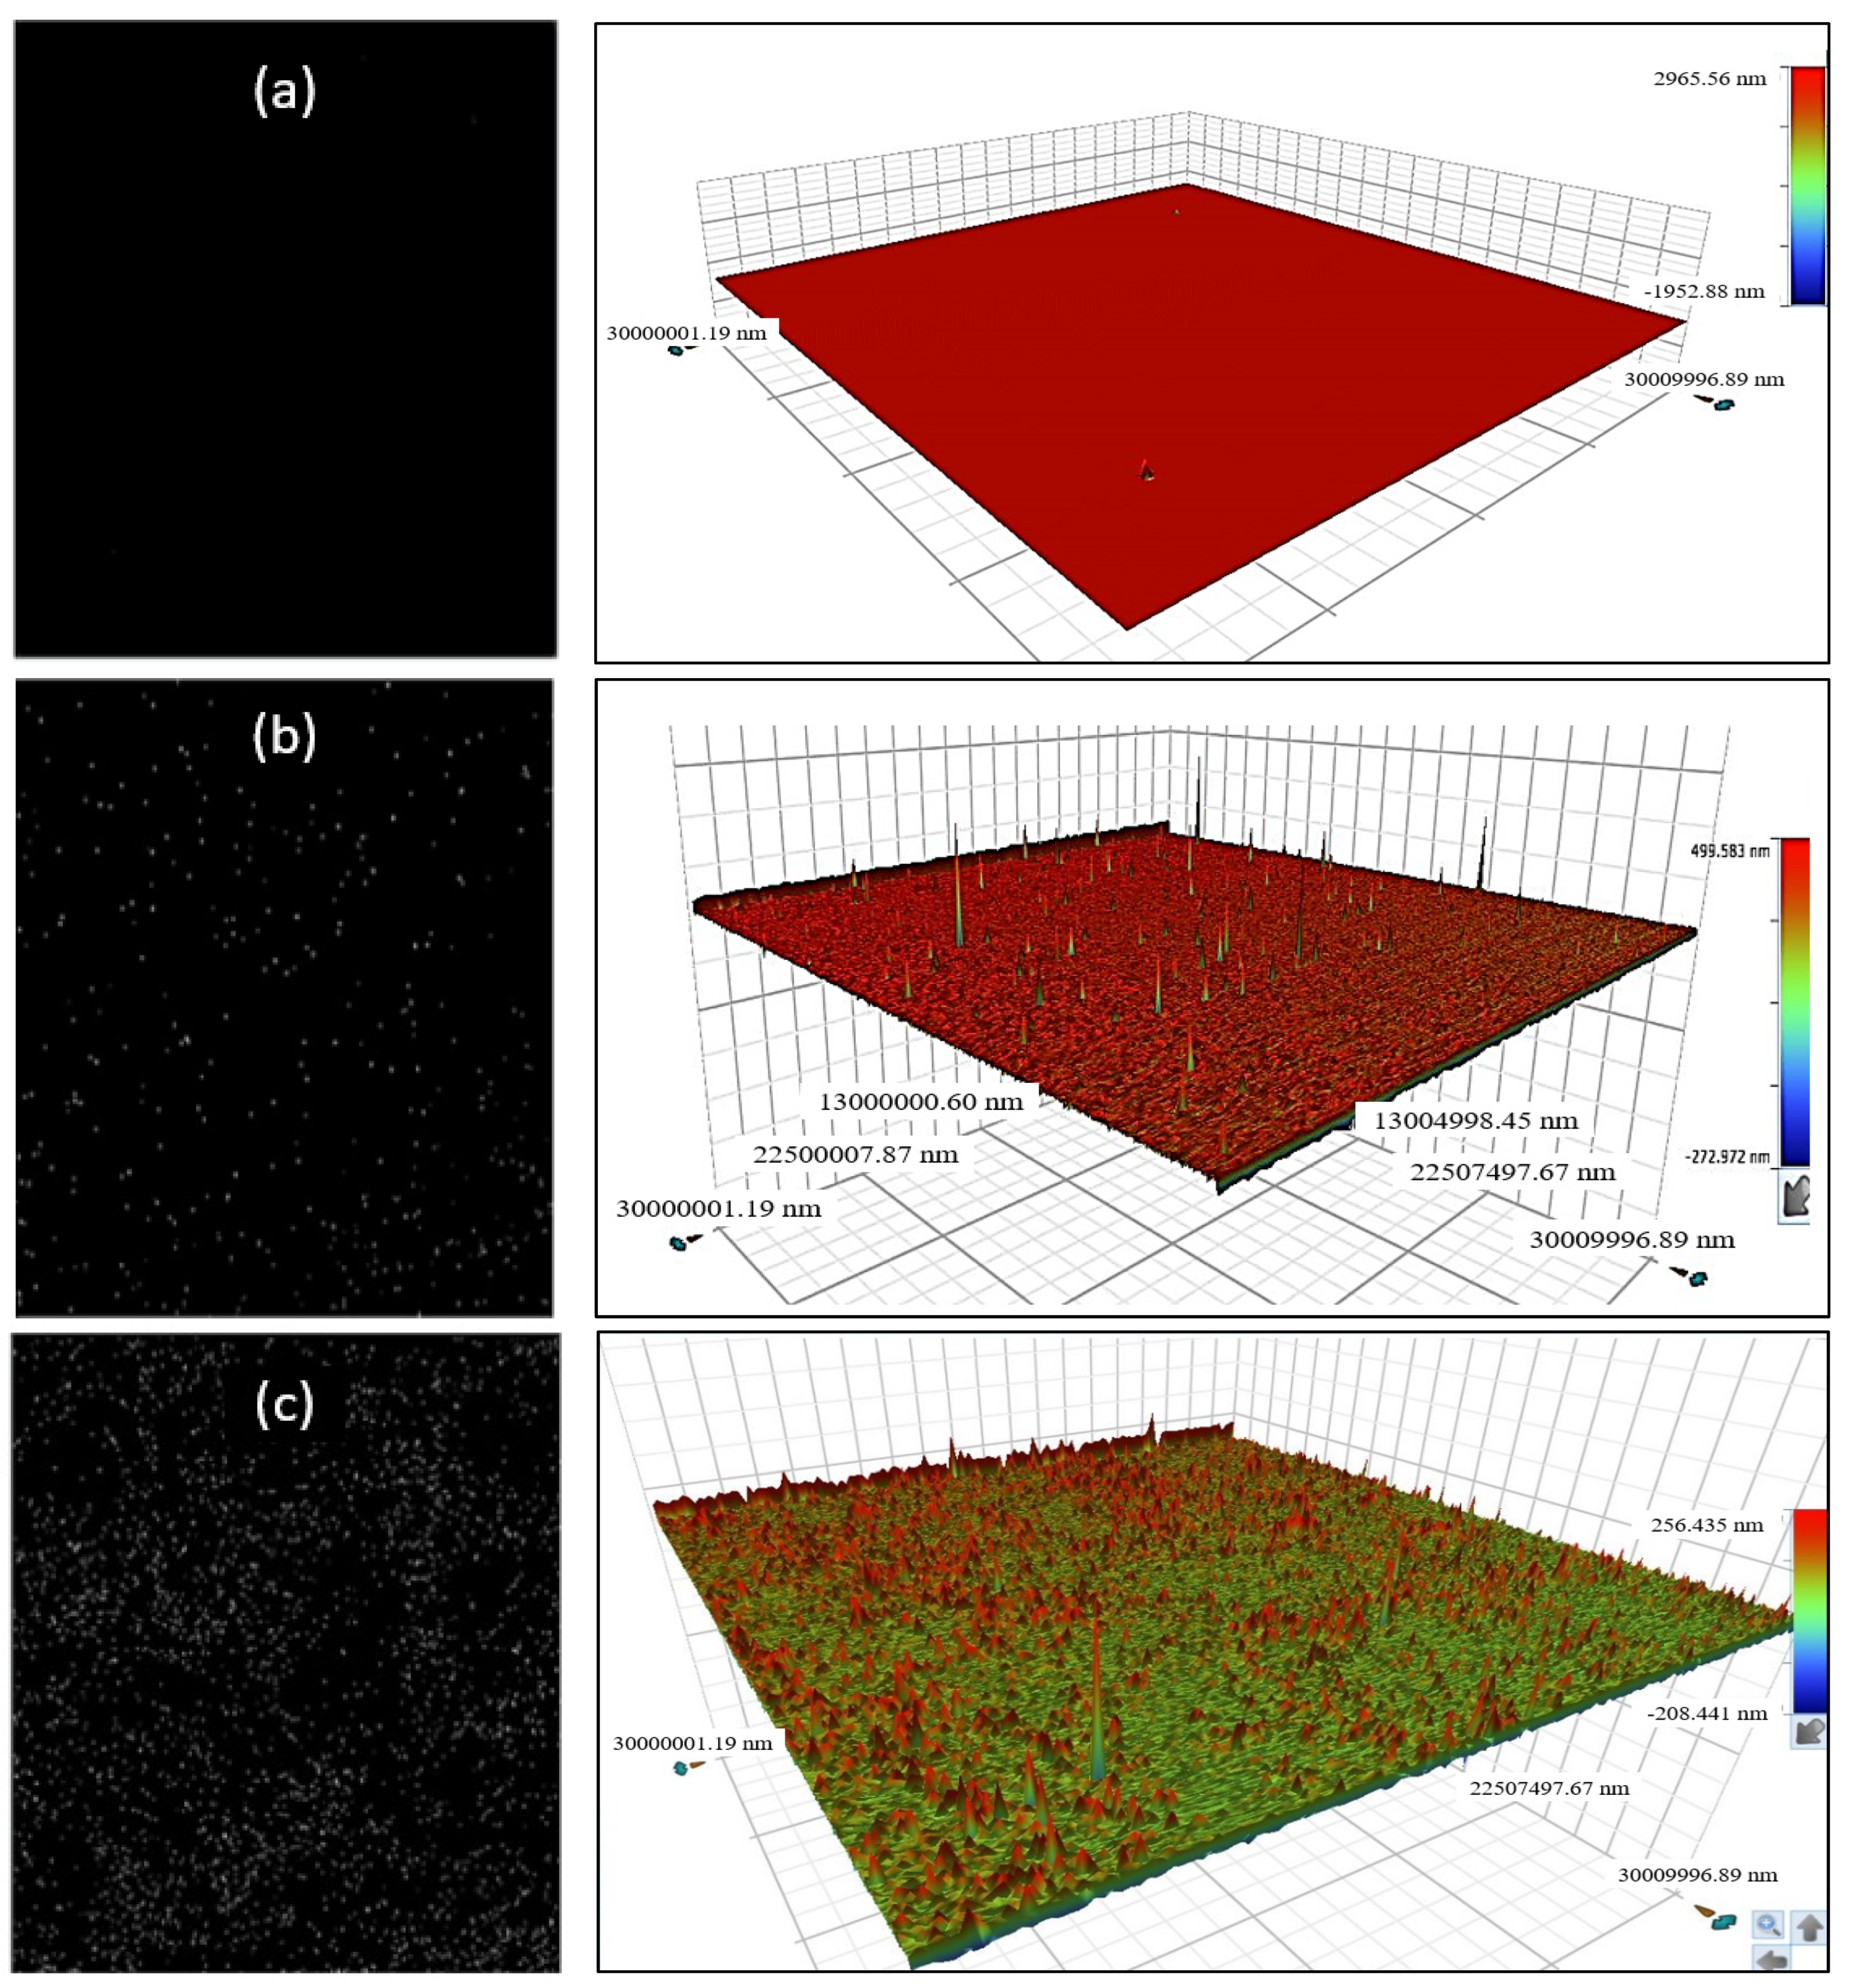
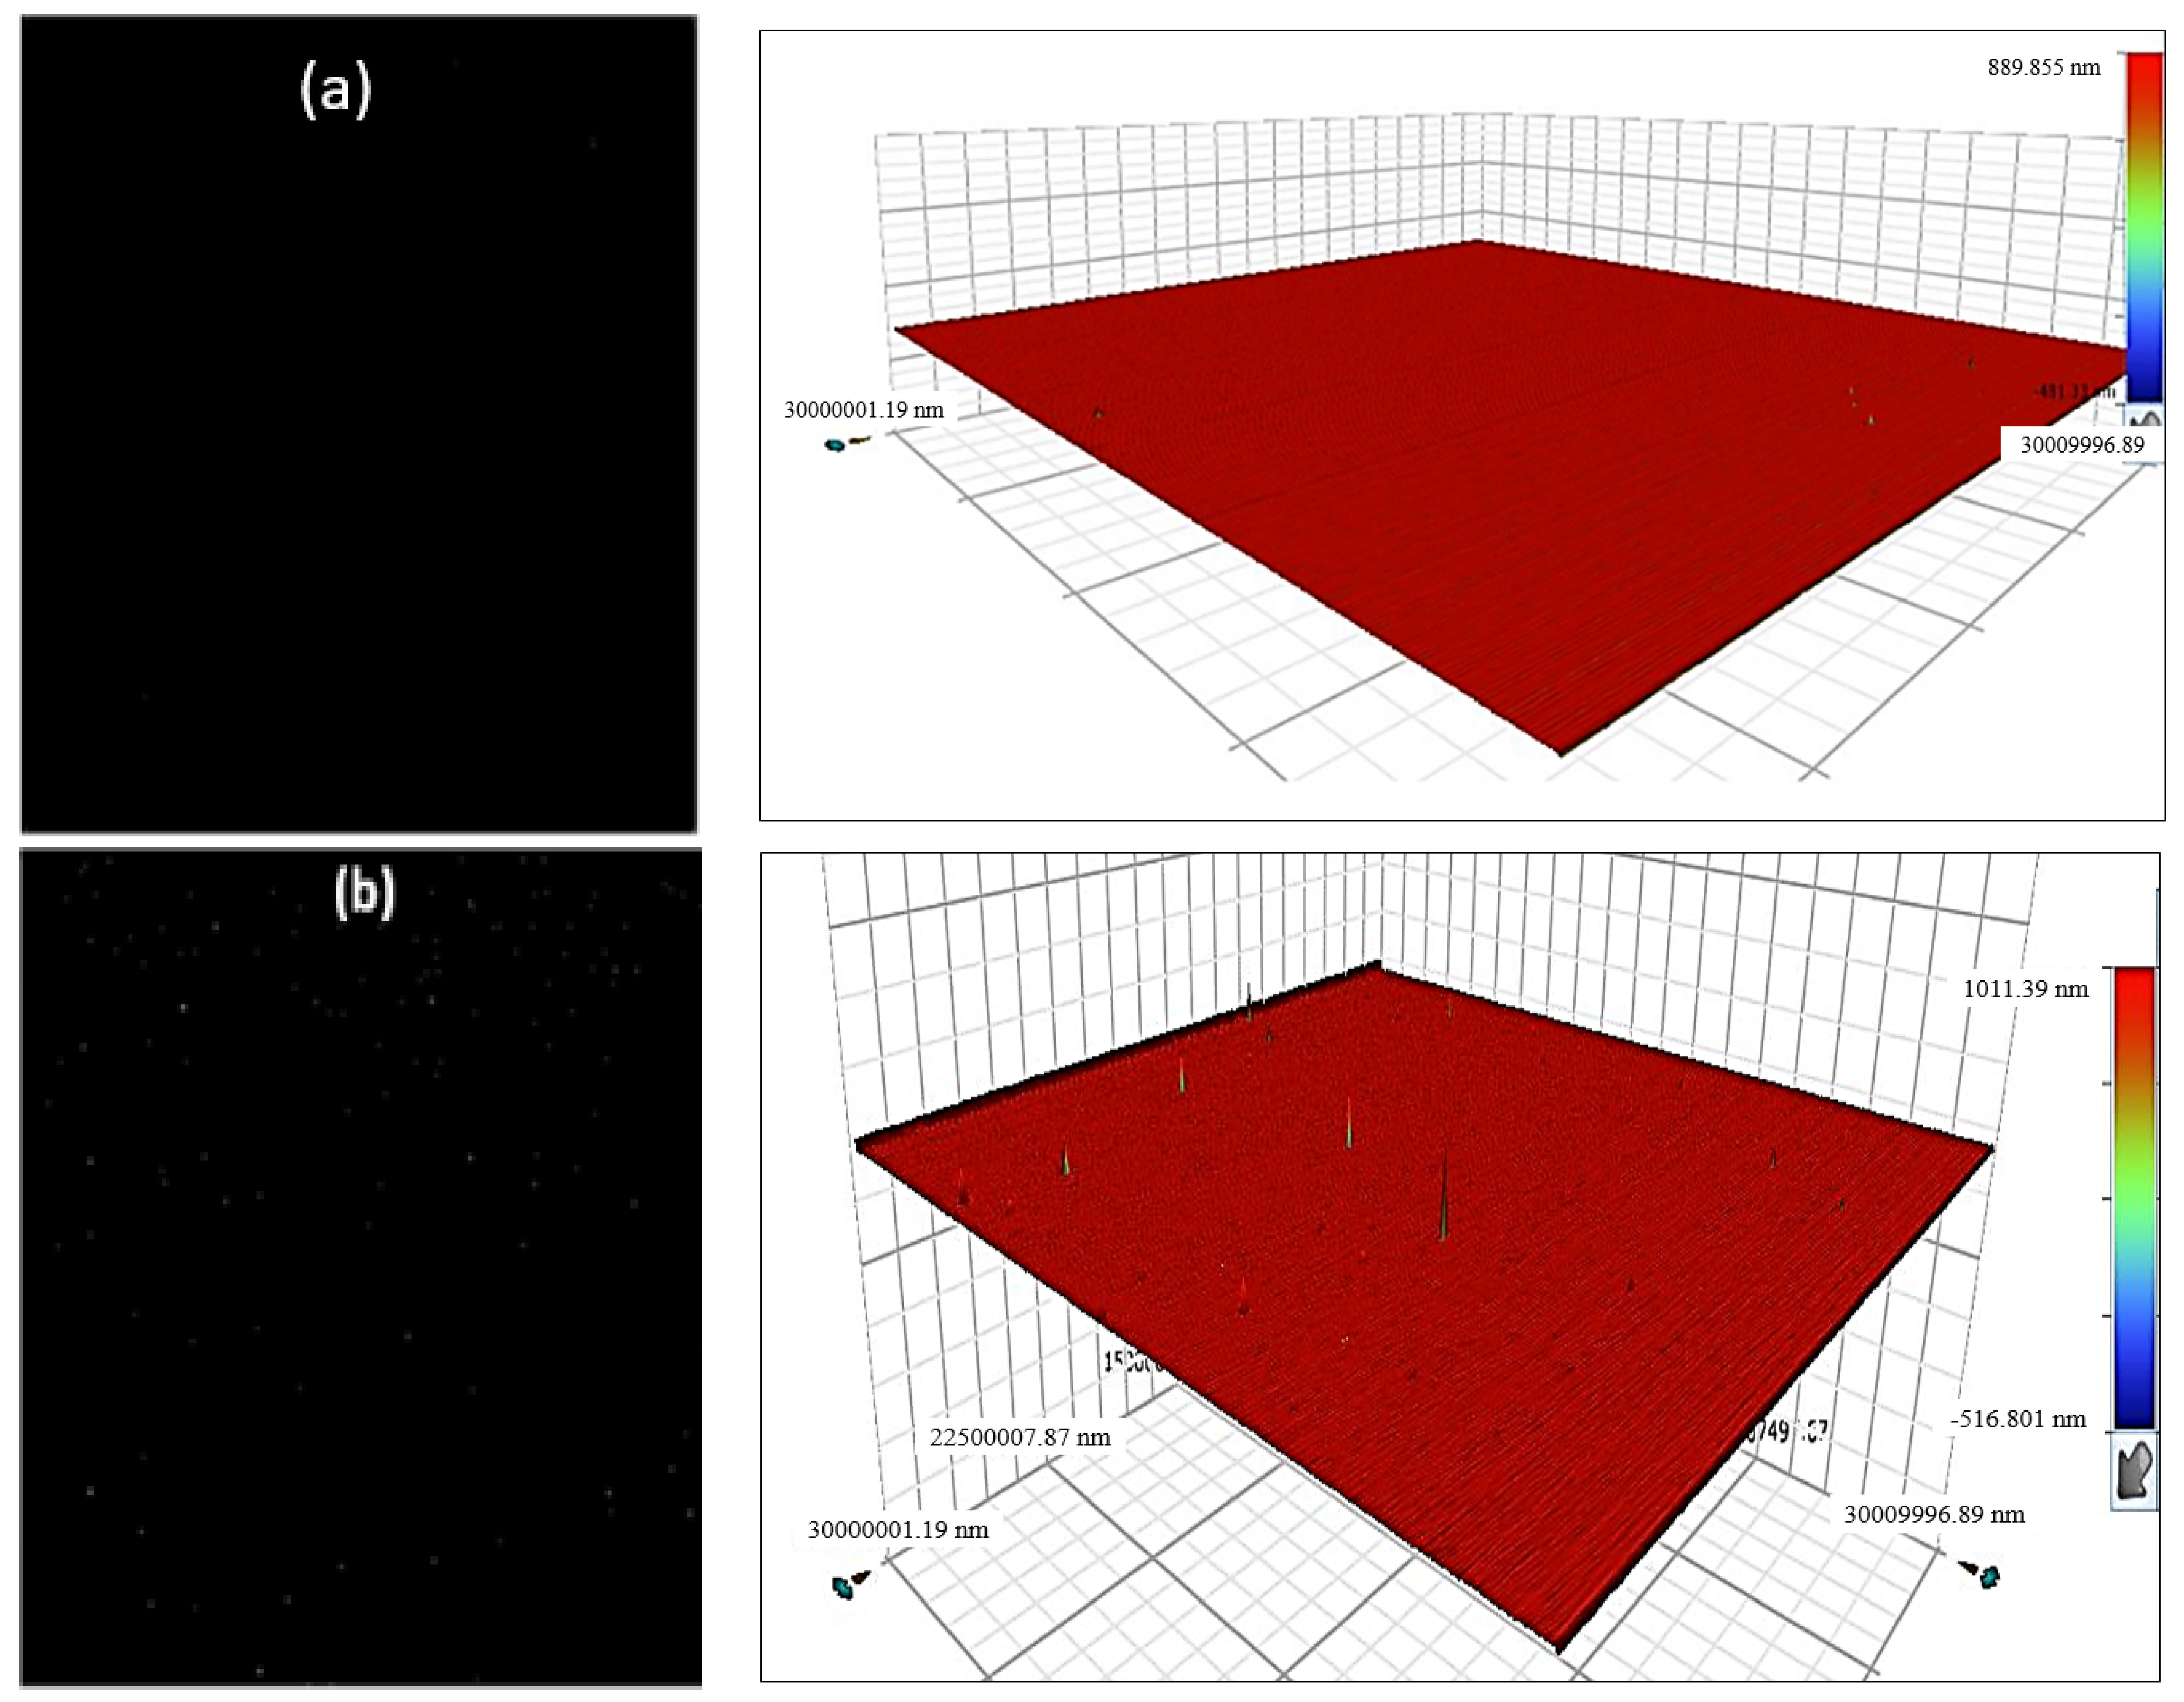
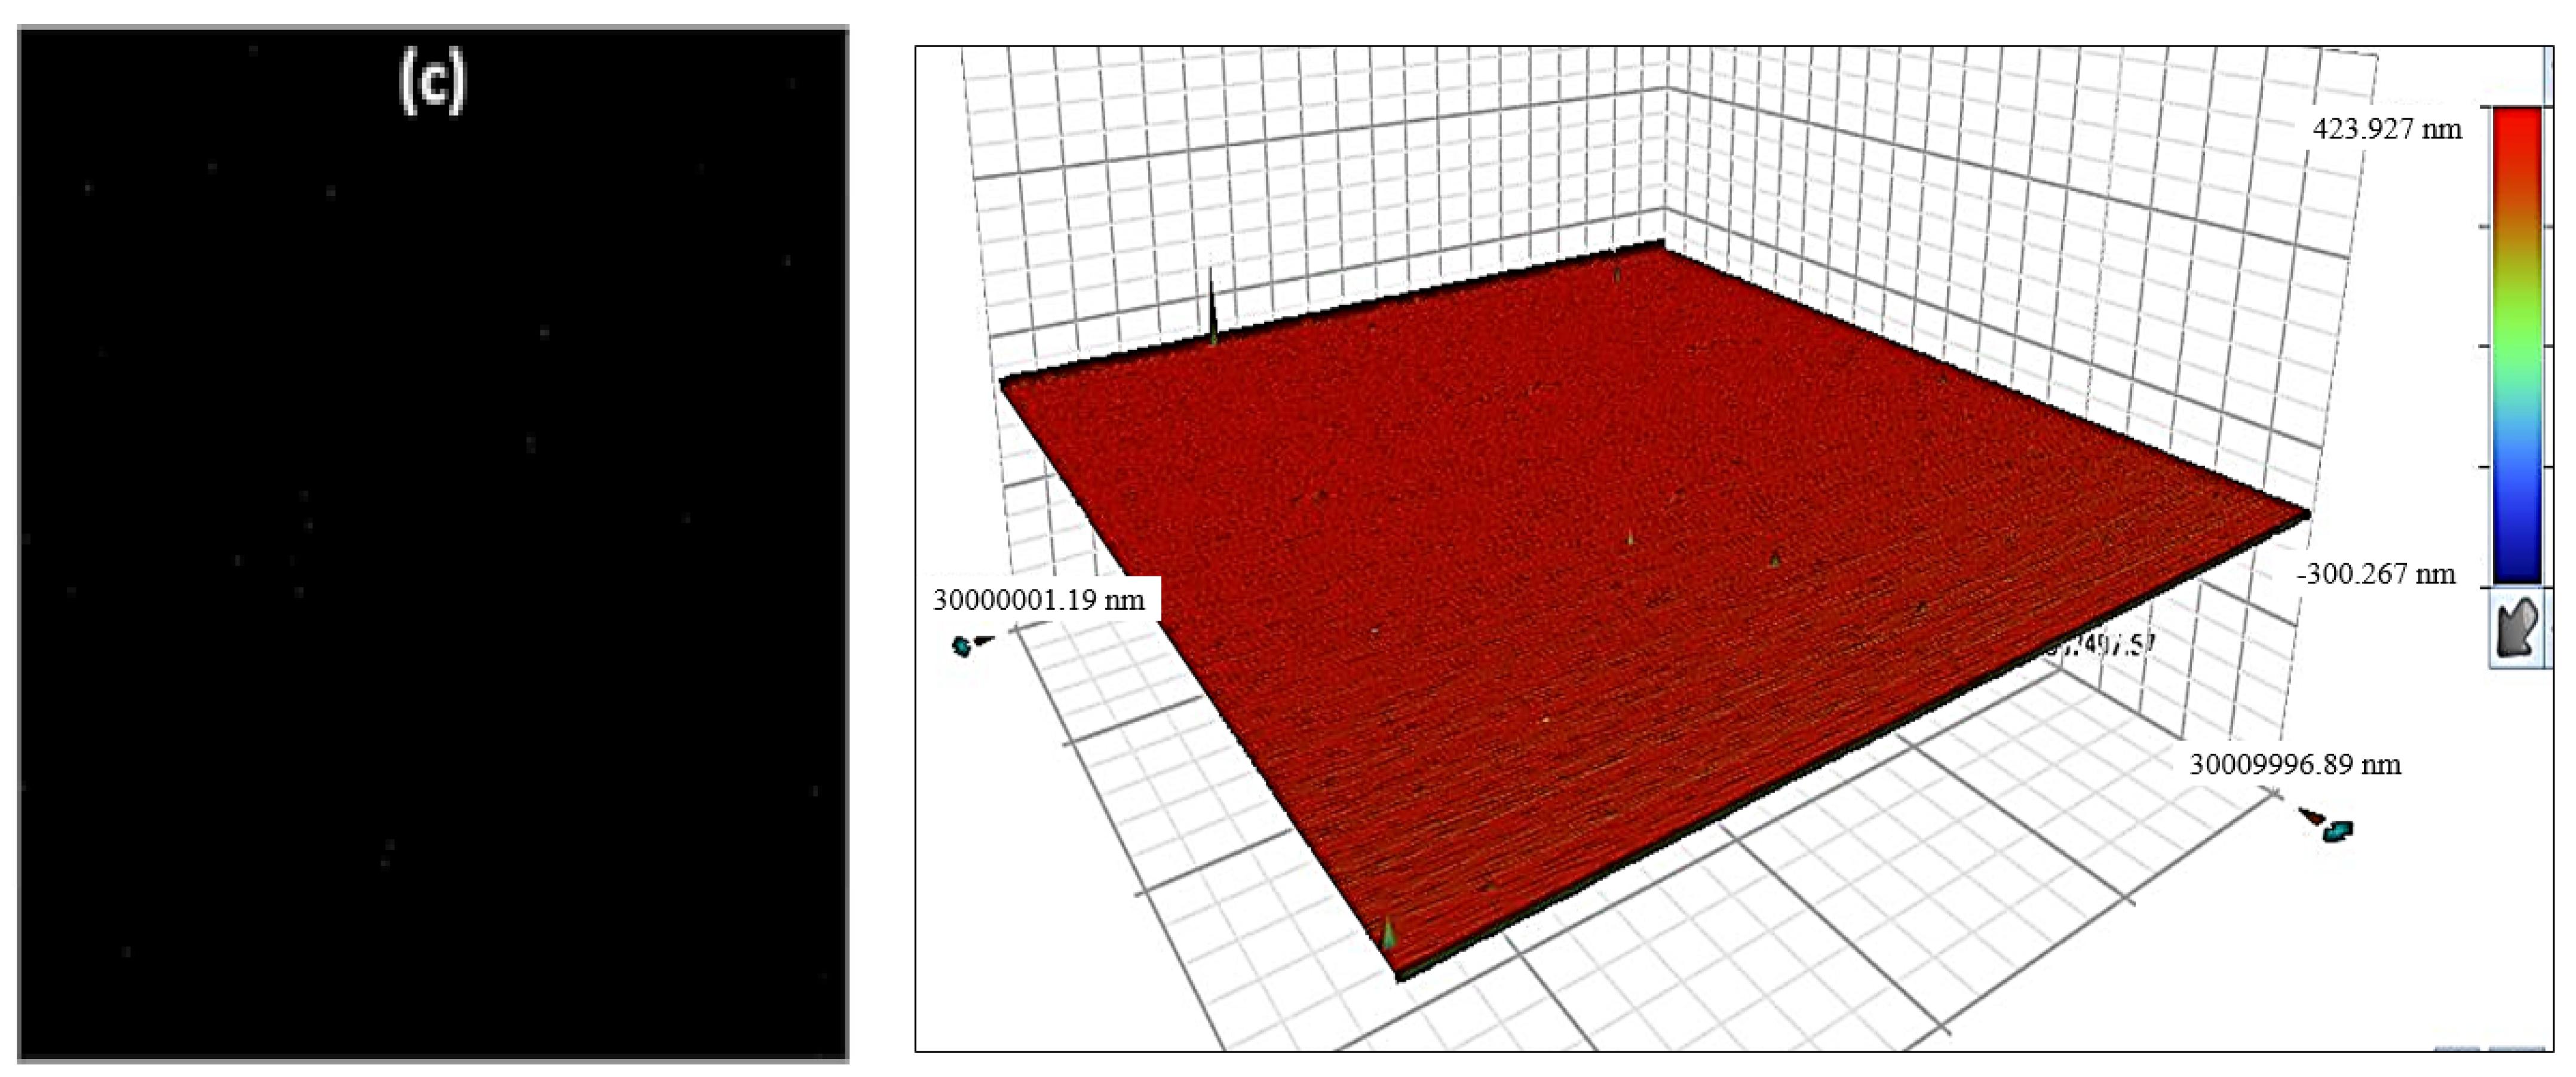
Accelerated aging must be correlated with outdoor tests to assess the representativeness of the tests. Tested samples (coated and uncoated) were previously exposed on two real outdoor sites: desertic site characterized by a strong sunshine and a coastal site characterized by a high humidity rate. Figure 13 shows the reflectance loss values over 797 days on the desertic site and 161 days on the coastal site. For both sites, coated samples are more damaged and show significant loss values mostly on the coastal site reaching 2% of loss just after 161 days of exposure. Uncoated samples show more stability compared to coated samples.
After determining the main defects formed on the samples surface and their optical performances behavior over real time exposure, the specular reflectance loss behavior over aging time was monitored. The results of test 1 (HAST) and test 2 (Suntest) are reported in Figure 14.
For uncoated samples and for both tests, the reflectance loss of eroded samples increases over time while the reflectance loss of intact samples increases until 168 h for HAST test and 340 h for SUNTEST test and re-decrease. The reflectance loss values are more important for eroded samples; at the end of tests, eroded samples register approximately four times more higher values than intact ones (HAST test: 4.3% for intact samples and 8% for eroded samples, SUNTEST test: 0.28% for intact samples and 4.3 for eroded samples). These significant losses are explained by the mirror glass degradation, thus, the diffuse reflectance increases due to the formed defects on the samples surface and consequently the specular reflectance decreases.
For coated samples in HAST test, the maximum reflectance loss value reached 5.5% after 168 h of aging. After 336 h, the maximum value recorded is 3% for intact samples and 4.5% for eroded samples. Under SUNTEST conditions, the reflectance losses variations are similar with the highest values for eroded samples (0.7% for intact samples and 2.5% for eroded samples). By the end of each test, the reflectance loss is approximately 2 times higher for eroded samples compared to intact samples.
For both tests and samples type, the eroded samples recorded significant optical reflectance losses compared to intact ones. In addition, the optical performance decrease is more important for uncoated samples under both tests than coated ones, this is linked to the protective effect of the coating against the UV and humidity stresses.
For both samples types, we can note that the loss values are much higher for test N°1 than test N°2, this is due to the test conditions and the degradation process involved in each test and generally UV/water tests (test N°2) are slow and take a longer time [20].
In addition, eroded samples allowed a degradation rate acceleration more than two times for the majority of samples, which highlight the importance to take into consideration the erosion impact in accelerated aging tests.
By comparing reflectance loss values on real outdoor exposure sites and accelerated aging tests, we can clearly see an opposite behavior: coated samples show more important reflectance loss values than uncoated samples on real outdoor site, while they achieved lower values than uncoated samples in accelerated tests mostly for intact samples. However, this difference is reduced for the eroded samples, which demonstrates that it seems to be more realistic to consider erosion in accelerated aging tests because it allows to have more reproducible results.

3D Surface Scan

The aim of this surface analysis is to confirm and determine the origin of defects that could be created during the aging process and explain the reflectance loss tendency. The surface roughness, impacts number, diameter and circularity were monitored. The results of uncoated and coated samples are respectively reported in Table 3 and Table 4.
For uncoated intact samples, the surface mapping shows the appearance of many pits on the glass surface after 48 h for test N°1 and after 170 h for test N°2 (Figure 15). This is confirmed by the impacts numbers which increase from zero before aging to 308 impacts after only 48 h for test N°1 and 5108 impacts after 170 h for test N°2 with respectively average impact diameters of 10 µm and 5 µm. After the first follow-up of both tests, the impacts number decreases, while impacts diameters continually grow. This result indicates that the front glass protection of uncoated solar mirrors has undergone chemical degradation due to a soda lime composition which reacts quickly with water leading to a glass corrosion. This degradation begun by the formation of pits corresponding to a chemical modification of the glass surface. After that, the formed pits connect to each other that explain the impacts number decrease and the impacts diameters increase. The defects parameters variations have an important impact on the surface roughness values. Pits initially formed are circular but during the connection step their circularity decreases.
For uncoated eroded samples, the appearance of corrosion pits is noticeable and confirmed by the impacts numbers that increase from 1453 to 2810 at the end of test N°1 and from 1409 to 2169 at the end of test N°2. Impacts diameter and surface roughness increase also over aging time indicating the continuous formation of new impacts.
The evolution of surface roughness and impacts numbers is relevant with the specular reflectance losses. The impacts number of eroded samples increases quickly with aging time compared to intact samples which explain the significant reflectance loss values of eroded samples.
The same remarks are observed for coated samples. The appearance of a coating degradation is recorded after only 48 h of HAST test and 170 h of SUNTEST test (Figure 16). The number of created impacts is less important for coated samples compared to uncoated samples and this is explained by the coating protection.

4. Conclusions

This work investigates a study of the impact of erosion in priming the reactivity of two types of glass mirrors: coated and uncoated, by accelerated aging tests. The novelty of this work is coupling accelerated erosion with accelerated aging tests.
One of the most challenges of solar reflectors aging tests is to be able to reproduce the same degradations that solar reflectors undergo on real outdoor sites. Thus, the use of combined aging factors is recommended.
Erosion is among the most detected defects on solar mirrors surfaces. It is important to combine it with other factors to have significant degradations. Effectively, the results showed an important decrease of the optical performances of eroded samples after just a few hours from the test beginning.
The 3D scan of tested samples surface demonstrated how much samples were degraded and weakened due to the chemical degradation of the front side samples surface.
This work highlighted the importance of the chemical composition of the glass front protection on the durability of solar reflectors. Uncoated samples are soda lime glasses are not very stable in the contact with moisture. The coated samples are protected by an additional SiO2 coating which resists well to moisture impact thanks to the chemical structure of the coating meaning that the specularity decreases slightly due to anti-soiling coating.
According to the previous results, the intact coated samples seem to be the strongest ones in terms of durability and hydrophobicity. They recorded the smallest losses of optical performances despite the aggressiveness of the two accelerated aging tests. Although the initial performances are worse than the uncoated ones (−14%). The erosion impacts are also protected by the antisoiling coating, a detachment of it is observed and the dimensions of the detachment defects increase with time with a slight shift of the absorption band to 1620 nm due to the coating degradation.

Author Contributions

Conceptualization, S.L. and S.B.; Data curation, E.L.B. and A.D.; Formal analysis, E.L.B. and A.D.; Investigation, E.L.B. and A.D.; Methodology, V.V. and S.N.; Project administration, V.V. and S.N.; Supervision, H.B. and S.N.; Writing—original draft, S.L.; Writing—review & editing, S.B. All authors have read and agreed to the published version of the manuscript.

Funding

This work was founded by the SFERA-III project from the European Union’s Horizon 2020 research and innovation program under grant agreement No 823802.

Institutional Review Board Statement

Not applicable.

Informed Consent Statement

Not applicable.

Data Availability Statement

Not applicable.

Acknowledgments

We thank the CEA for providing access to its installations, the support of its scientific and technical staff, and the financial support of the SFERA-III project (Grant Agreement No. 823802).

Conflicts of Interest

The authors declare that they have no known competing financial interest or personal relationship that could have appeared to influence the work reported in this paper.

References

  1. Paraillous, M. Traitement de Surface et Revêtement Transparent sur Verre Sodo-Calcique. Matériaux. Ph.D. Thesis, Université de Bordeaux, Bordeaux, France, 2016. [Google Scholar]
  2. Leboeuf, V. Caractérisation Cinétique et Structurale de Verres Sodo-Silicatés Soumis à un Echange Ionique au Potassium. Science des matériaux. Ph.D. Thesis, Université d’Orléans, Orléans, France, 2015. [Google Scholar]
  3. Garoli, D.; Rodriguez De Marcos, L.V.; Larruquert, J.I.; Corso, A.J.; Proietti Zaccaria, R.; Pelizzo, M.G. Mirrors for Space Telescopes: Degradation Issues. Appl. Sci. 2020, 10, 7538. [Google Scholar] [CrossRef]
  4. Kottek, M.; Grieser, J.; Beck, C.; Rudolf, B.; Rubel, F. World map of the Köppen-Geiger climate classification updated. Meteorol. Zeitschrift 2006, 15, 259–263. [Google Scholar] [CrossRef]
  5. ISE. Task 27 Solar Building Facade Components Subtask B: Durability Performance, Durability and Sustainability of Advanced Windows and Solar Components for Building Envelopes Final Report Subtask B: Durability PROJECT B3: Durability and Reliability Assessment; ISE: Freiburg, Germany, 2007. [Google Scholar]
  6. Karim, M. Etude de L’endommagement par Erosion et Par Encrassement des Surfaces de Miroirs Réflecteurs Utilisés dans les Centrales Solaires Thermodynamiques. Ph.D. Thesis, Université Cadi Ayyad, Marrakesh, Morocco, 2016. [Google Scholar]
  7. Wiesinger, F.; Sutter, F.; Fernández-García, A.; Wette, J.; Hanrieder, N. Sandstorm erosion on solar reflectors: A field study on height and orientation dependence. Energy 2021, 217, 119351. [Google Scholar] [CrossRef]
  8. Matal, A.; Naamane, S. Accelerated erosion of coated solar glass reflectors. AIP Conf. Proc. 2020, 2303, 150012. [Google Scholar] [CrossRef]
  9. Wiesinger, F.; Sutter, F.; Fernandez-García, A.; Wette, J.; Wolfertstetter, F.; Hanrieder, N.; Martin, S.; Pitz-Paald, R. Sandstorm erosion on solar reflectors: Highly realistic modeling of artificial aging tests based on advanced site assessment. Appl. Energy 2020, 268, 114925. [Google Scholar] [CrossRef]
  10. Finnie, I. Erosion of surfaces by solid particles. Wear 1960, 3, 87–103. [Google Scholar] [CrossRef]
  11. Pescheux, A.-C.; Le Baron, E.; Raccurt, O. Characterization of different Moroccan sands to explain their potential negative impacts on CSP solar mirrors. Sol. Energy 2019, 194, 959–968. [Google Scholar] [CrossRef]
  12. Avenel, C. Durabilité des Miroirs Pour L’énergie Solaire à Concentration: Étude des Modes de Vieillissement. Ph.D. Thesis, Clermont Auvergne University, Clermont-Ferrand, France, 2018. [Google Scholar]
  13. Boukheir, S.; Abdelouahed, C.; Amal, M.; Sara, L.; Naamane, S.; Mustapha, M.; Moulay, H.B. Physical and chemical reactivity of mechanically primed glass surfaces of CSP reflectors. AIP Conf. Proc. 2020, 2303, 150005. [Google Scholar] [CrossRef]
  14. Fuseini, M.; Zaghloul, M.M.Y.; Elkady, M.F.; El-Shazly, A.H. Evaluation of synthesized polyaniline nanofibres as corrosion protection film coating on copper substrate by electrophoretic deposition. J. Mater. Sci. 2022, 57, 6085–6101. [Google Scholar] [CrossRef]
  15. Zaghloul, M.M.Y.; Steel, K.; Veidt, M.; Heitzmann, M.T. Wear behaviour of polymeric materials reinforced with man-made fibres: A comprehensive review about fibre volume fraction influence on wear performance. J. Reinf. Plast. Compos. 2022, 41, 215–241. [Google Scholar] [CrossRef]
  16. ISO 16474-2 Paints and Varnishes—Methods of Exposure to Laboratory Light Sources—Part 2: Xenon-Arc Lamps International Organization for Standardization. 2013. Available online: https://www.iso.org/standard/56830.html (accessed on 12 January 2022).
  17. Portal, S. Corrosion de Verres de Silicate Analyse Texturale de La Couche D’alteration. 2001. Available online: https://tel.archives-ouvertes.fr/tel-00449855 (accessed on 12 January 2022).
  18. Vienna, J.D.; Neeway, J.J.; Ryan, J.V.; Kerisit, S.N. Impacts of glass composition, pH, and temperature on glass forward dissolution rate. npj Mater. Degrad. 2018, 2, 22. [Google Scholar] [CrossRef]
  19. Martínez-Arcos, L.; Fernández-García, A.; Sutter, F.; Reche-Navarro, T.; Wette, J.; Carvalho, M.J.; Diamantino, T.; Sallaberry, F.; Erice, R.; Imbuluzqueta, G.; et al. Round Robin Test for Solar Reflectors Durability. 2018. STAGE-STE Project. Project Deliverable R 8.1.3-2. Available online: https://aip.scitation.org/doi/abs/10.1063/1.5067231 (accessed on 12 January 2022).
  20. Sutter, F.; Fernandez-García, A.; Wette, J.; Heller, P. Comparison and evaluation of accelerated aging tests for reflectors. Energy Procedia 2014, 49, 1718–1727. [Google Scholar] [CrossRef]
Figure 1. Exposure rack showing samples exposed in the four cardinal directions [13].
Coatings 12 01087 g001
Figure 2. Optical microscope images of samples facing the west (a) and north (b) directions [13].
Coatings 12 01087 g002
Figure 3. (a) Gust velocity; (b) wind speed as a function of wind direction of the studied period [13].
Coatings 12 01087 g003
Figure 4. Tested samples; (a) Uncoated intact, (b) Uncoated eroded.
Coatings 12 01087 g004
Figure 5. Chemical composition of (a) uncoated, and (b) coated samples.
Coatings 12 01087 g005
Figure 6. Erosion test bench developed at MAScIR’s laboratory.
Coatings 12 01087 g006
Figure 7. 3D map obtained by the profilometer of the Uncoated-intact samples before the application of the filter.
Coatings 12 01087 g007
Figure 8. Surface profile after the application of Gaussian filter of the uncoated-intact samples.
Coatings 12 01087 g008
Figure 9. The surface profile after the threshold adjustment.
Coatings 12 01087 g009
Figure 10. Optical microscope images of tested samples during HAST test N°1 after 48, 168 and 336 h of aging.
Coatings 12 01087 g010
Figure 11. Optical microscope images of tested samples during SUNTEST test N°2 after 170, 340 and 600 h of aging.
Coatings 12 01087 g011
Figure 12. Pictures of detected defects on; (a) uncoated and (b) coated samples after 170 h of SUNTEST test N°2.
Coatings 12 01087 g012
Figure 13. Specular reflectance loss of coated and uncoated samples exposed on (a) desertic and (b) coastal sites.
Coatings 12 01087 g013
Figure 14. Specular reflectance loss of tested samples.
Coatings 12 01087 g014
Figure 15. 1D and 3D surface profile of uncoated intact samples; (a) initial; (b) after 48 h of HAST test; (c) after 170 h of SUN test.
Coatings 12 01087 g015
Figure 16. 1D and 3D surface profile of coated intact samples; (a) initial; (b) after 48 h of HAST test; (c) after 170 h of SUN test.
Coatings 12 01087 g016aCoatings 12 01087 g016b
Table 1. Erosion parameters.
Erosion Parameters
Ejection Speed 25 m/s
Impact Angle 90°
Ejected Particles Standardized sand MIL-STD810G
Ejected Particles Size 180 < Φ < 250
Particles Composition90% of quartz
Particles Hardness (Mohs Scale) 7
Particles Shape Sharp
Table 2. Accelerated aging tests conditions.
TestConditionsDuration
Test N°1: HASTP: 2 bars
T: 110 °C
RH: 85%
336 h
Test N°2: SUNTEST1 Cycle = 30 min
Water spray = 3 min
Irradiation xenon lamp (65 W/m2 between 300–400 nm) = 27 min
T Air = 70 °C
T sample = 85 °C
600 h
Table 3. Impacts properties and surface roughness of uncoated samples.
Time (h)Surface Roughness (nm)Impacts NumberImpacts Diameter (µm)Circularity
Uncoated intact (N°1 HAST)0 1.210.000.00-
48 1.597308.0010.02 ± 0.010.83 ± 0.2
168 1.74297.0010.95 ± 0.010.78 ± 0.2
336 1.541173.0011.59 ± 0.010.84 ± 0.2
Uncoated eroded (N°1 HAST)0 21.3314539.32 ± 0.010.91 ± 0.1
48 22.053160212.57 ± 0.020.83 ± 0.2
168 23.326164211.56 ± 0.030.89 ± 0.2
336 24.479281013.37 ± 0.040.87 ± 0.2
Uncoated intact (N°2 SUNTEST)0 1.20.000.00-
170 2.68451085.02 ± 0.10.97 ± 0.09
340 2.045476712.06 ± 0.040.89 ± 0.2
600 1.395242.40 ± 0.70.92 ± 0.2
Uncoated eroded (N°2 SUNTEST)0 21.1114098.72 ± 0.010.93 ± 0.1
170 22.11528.0012.08 ± 0.030.84 ± 0.2
340 23.521699.0012.16 ± 0.020.77 ± 0.2
600 27.532169.0014.7 ± 0.040.84 ± 0.2
Table 4. Impacts properties and surface roughness of coated samples.
Time (h)Surface Roughness (nm)Impacts NumberImpacts Diameter (µm)Circularity
Coated intact (N°1 HAST)0 1.220.000.00-
48 1.16122.007.15 ± 0.011 ± 0.01
168 1.2192.008.25 ± 0.010.99 ± 0.06
336 1.2163.0013 ± 0.010.79 ± 0.2
Coated eroded (N°1 HAST)0 21.04152610.63 ± 0.020.88 ± 0.2
48 21.28161415.01 ± 0.030.83 ± 0.3
168 22.70167811.58 ± 0.030.88 ± 0.2
336 24.3520279.36 ± 0.030.91 ± 0.2
Coated intact (N°2 SUNTEST)0 1.210.000.00-
170 1.1931.008.96 ± 0.010.86 ± 0.1
340 1.2912447.11 ± 0.010.92 ± 0.1
600 1.159328.33 ± 0.010.95 ± 0.1
Coated eroded (N°2 SUNTEST)0 21.10149810.61 ± 0.020.88 ± 0.2
170 23.371510.0013.03 ± 0.030.85 ± 0.2
340 22.481630.0018.52 ± 0.060.79 ± 0.2
600 23.161636.0020.13 ± 0.060.76 ± 0.2
Publisher’s Note: MDPI stays neutral with regard to jurisdictional claims in published maps and institutional affiliations.

