Article

Low Fluorinated Oligoamides for Use as Wood Protective Coating

by
Yuqing Zhang
1,2,3,
Laura Vespignani
1,
Maria Grazia Balzano
1,
Leonardo Bellandi
1,
Mara Camaiti
4,*,
Nadège Lubin-Germain
2,3 and
Antonella Salvini
1,*
1
Department of Chemistry, University of Florence, 50019 Sesto Fiorentino, Italy
2
CY Cergy Paris Université, CNRS, BioCIS, 95000 Cergy Pontoise, France
3
Université Paris-Saclay, CNRS, BioCIS, 92290 Châtenay-Malabry, France
4
CNR-Institute of Geosciences and Earth Resources, 50121 Florence, Italy
*
Authors to whom correspondence should be addressed.
Coatings 2022, 12(7), 927; https://doi.org/10.3390/coatings12070927
Submission received: 27 May 2022 / Revised: 26 June 2022 / Accepted: 28 June 2022 / Published: 30 June 2022

Abstract

:
New highly hydrophobic fluorinated oligoamides were synthesized and studied as materials for the protection of non-varnishable wooden artifacts. The new oligoamides were designed to achieve the best performance (including high chemical affinity to the wood material) and the lowest environmental impact. In order to minimize the risk of bioaccumulation, short perfluoroalkyl side chains were reacted with oligoethylene L-tartaramide (ET), oligoethylene adipamide-L-tartaramide (ETA), oligoethylene succinamide-L-tartaramide (EST), oligoethylene succinamide (ES), and oligodiethylenetriamino-L-tartaramide (DT). Favorable reaction conditions were also adopted to obtain low molecular weight compounds characterized by non-film-forming properties and solubility or dispersibility in environmentally friendly organic solvents. Their behavior in terms of modification of the wood surface characteristics, such as wettability, moisture absorption, and color, was analyzed using a specific diagnostic protocol to rapidly obtain preliminary, but reliable, results for optimizing a future synthesis of new and tailored protectives. The influence of different monomer units on the reactivity, solubility, and hydrophobic properties of different oligoamides was compared showing ESF (contact angle 138.2°) and DF (132.2°) as the most effective products. The study of stability to photochemical degradation confirms ESF as promising protective agents for artefacts of historical and artistic interest in place of long-chain perfluoroalkyl substances (PFAS), products currently subject to restrictions on use.

Graphical Abstract

1. Introduction

The degradation of wooden objects is an important topic in the conservation field [1] and is influenced by various factors related to the characteristics of the material itself, such as the wood species, the site of origin, the section of the piece of wood, the defects, and the treatments applied, as well as the environmental conditions to which the wooden artefact was subjected in its history, i.e., temperature, pH, oxygen concentration, and relative humidity [2]. Water is one of the main causes of deterioration of wood. Water vapor can condense on exposed surfaces, carrying many impurities and making possible the action of liquid water even on surfaces protected from rain. Water promotes the acid hydrolysis of polysaccharides and solubilizes both the fragments thus formed and some the extractive components of the wood, causing the loss of material as well as a radical change in the mechanical properties of wood [3]. In addition, the presence of water allows the development of algae, fungi, lichens, and bacteria, giving rise to biological degradation [4]. A specific problem of wood is also due to the rapid equilibrium that it establishes with the external humidity. Excursions of temperature and relative humidity induce changes in the wood moisture content. As a consequence, moisture exchanges induce dimensional variations, i.e., any loss in moisture content leads to a decrease in volume (shrinkage), while any increase induces a volume increase (swelling). Moisture exchanges can cause cracks, reaching even permanent deformations and collapses [5]. Furthermore, the impact of environmental factors such as atmospheric pollutants and microorganism colonization, responsible for decohesion phenomena, requires hydrophobic surface treatment to halt or slow down degradation, in particular under outdoor conditions, but also for storage indoors in certain stressful conditions. Fundamental action in contrasting the degradation of wood is carried out by protectives and varnishes. Since ancient times, hydrophobic compounds (e.g., natural oils, waxes, creosote oil, acrylic polymers, silicon compounds) have been used for the protection of wood, to both limit moisture content exchanges and creating a physical barrier for insects and fungi [4,6,7]. More recently, with the increased interest in the fabrication of superhydrophobic and self-cleaning surfaces, superhydrophobic and superparamagnetic composite films have recently been obtained on wood by a soft lithography technique, using Fe3O4 nanoparticles and polydimethylsiloxane treated with fluorine silane [8], or using nanoscale copper compound particles [9] or with a layer-by-layer deposition of TiO2 nanoparticles modified with 1H, 1H, 2H, 2H-perfluoroalkyltriethoxysilane [10]. In general, the use of nanotechnologies in the treatment of wood promotes deep penetration by significantly modifying the properties of the wood [11]. Furthermore, superhydrophobic surfaces with flame retardancy has been obtained with polydimethylsiloxane (PDMS) and stearic acid (STA)-modified kaolin (KL) particles [12].
However, when the application field concerns wooden artefacts of historic and artistic interest, two further considerations need to be evaluated. First, the long-term efficacy and durability of these compounds is unsatisfactory. Natural oils, waxes, other natural compounds, and acrylic polymers are known to have moderate hydrophobic effects and undergo photo-oxidative and/or hydrolytic reactions [13,14,15,16]. Silicon compounds, after an in situ sol-gel process [17], can react with the substrate [7,18] and (like other polymeric materials do) form a rigid structure, susceptible to cracking with inevitable loss of both protective efficacy and the aesthetic features of the surface. Secondly, the complexity of application, the aesthetic characteristics of the products, or their high ability to form irreversible, non-vapor-permeable and chromatically visible films make some of these treatments very often not applicable in the field of Cultural Heritage [19,20]. Indeed, as in the conservation of stone artworks, in some specific wooden artefacts, the original aesthetic appearance of the surface after protection must be unaltered.
Recently, partially fluorinated oligoamides, containing short-pendant perfluoropolyether (PFPE) chains, have been successfully synthesized and tested as protective agents for stone [21,22,23]. The simultaneous presence on the molecule of hydrophilic (-C=O-NH- units) and hydrophobic (perfluoropolyether chain) groups, their waxy consistency and solubility in hydro-alcoholic solvents (environmentally friendly solvents), their good photo-oxidative and chemical stability, as well as their ability to fabricate superhydrophobic surfaces, make these compounds good candidates as protective agents for wooden artifacts [21,22,23].
At the same time, hydroxylated and non-hydroxylated water-soluble oligoamides with a high affinity for polar materials have been synthesized by a polycondensation reaction between ethylene diamine or amino acids and diesters of dicarboxylic natural acids (e.g., L-tartaric acid, D(+)-glucaric acid and α,α-trehaluronic acid), and successfully tested as consolidation agents for waterlogged archaeological wood [24,25,26].
In this study, the high affinity of hydroxylated oligoamides for wooden materials and the high hydrophobic effect of short perfluorinated chains have been exploited to obtain new compatible and hydrophobic oligoamides for the protection of wooden artefacts.
Due to the unavailability of mono-functional low molecular weight PFPEs and their derivatives on the European market, the identification of new perfluorinated compounds has been necessary. An epoxy with a C6 perfluorinated chain (EC6F), soluble in 2-propanol and easily reactive with amino groups, was used for the functionalization of (hydroxylated) oligoamides containing terminal amino groups. Moreover, compared to PFPEs, the short perfluorinated chain of EC6F is considered to have a low risk of bioaccumulation [27] and therefore a lower environmental impact.
To obtain and study products with different structural characteristics, several partially fluorinated (hydroxylated) oligoamides have been synthesized by reaction of EC6F with the terminal amino groups of oligoamides obtained from different combinations of polyamines (i.e., ethylene diamine and diethylenetriamine) and esters of (hydroxylated) dicarboxylic acids (i.e., L-tartaric, succinic, adipic acid). Namely, fluorinated oligoethylene L-tartaramide (ETF), fluorinated oligoethylene adipamide-L-tartaramide (ETAF), fluorinated oligoethylene succinamide-L-tartaramide (ESTF), fluorinated oligoethylene succinamide (ESF), and fluorinated oligodiethylenetriamino-L-tartaramide (DTF) have been synthesized. The fluorinated diethylenetriamine (by reaction of EC6F with diethylenetriamine) (DF) has been also synthesized as a reference product.
To evaluate the performance of the new compounds, a specific diagnostic protocol was set up to quickly obtain preliminary, but reliable results. The diagnostic protocol includes contact angles, moisture absorption, and color measurements on treated wood samples, and photo-oxidative test on the neat synthesized compounds. The photo-oxidative stability is followed by FT-IR and NMR analysis, color measurements, and mass variations.

2. Materials and Methods

2.1. Materials

Ethylenediamine (99.5%), diethylenetriamine (99.9%), dimethyl L-tartrate (99%), diethyl succinate (99%), methanol (99.8%), anhydrous ethyl alcohol (99.5%), anhydrous ethyl ether (99.8%), and acetone (99.9%) were purchased from Sigma-Aldrich (St. Louis, MO, USA). Dimethyl adipate was kindly supplied by Radici Chimica S.p.A. (Bergamo, Italy). Triethylamine (97%) and 2-propanol (99.9%) was purchased from Carlo Erba, and 3-perfluorohexyl-1,2-epoxypropane (95%) (Hexafor IM-P6, EC6F) was kindly supplied by Maflon S.p.A. (Bergamo, Italy). All chemicals were used without further purification. The new products were characterized by Fourier-transform infrared spectroscopy (FT-IR) and nuclear magnetic resonance spectroscopy (1H NMR, 13C NMR, gCOSY and gHSQC NMR). Wooden samples (beech or oak prismatic specimens with a square base with dimensions of 5 × 5 × 2 cm3 for colorimetric and contact angle measurements or 2.5 × 2.5 × 1 cm3 for water vapor absorption test and contact angle measurement) were used to test the performance of the surface-wetting modification agents.
A 70:30 poly(ethylmethacrylate-co-methylacrylate) (Paraloid B72) was used as coating reference material.

2.2. Instruments

1H NMR, 13C NMR, gCOSY, and gHSQC spectra were recorded with a Varian Mercury Plus 400 (Palo Alto, CA, USA) spectrometer and a Varian INOVA (Palo Alto, CA, USA) spectrometer, both working at 399.921 MHz, on D2O or CD3OD solutions. All spectra are reported in ppm and referred to TMS as internal standard. 19F NMR spectra were recorded with a Varian INOVA spectrometer operated at 376.5 MHz and shifts are reported in ppm respect to CFCl3 at 0 ppm. Spectra elaboration was performed with the software Mestre-C (1996, Mestrelab Research S.L., Santiago de Compostela, Spain) 4.3.2.0. FT IR spectra were recorded with a Shimadzu FT-IR IR Affinity-1S model (Kyoto, Japan) and elaborated with the Lab Solution IR v. 2.16 (2017, Shimadzu, Kyoto, Japan) program. The spectra of solid samples were recorded as KBr pellets or as such without further manipulation in transmission mode using a diamond anvil cell (Specac, Slough, UK). The spectra were collected from 400 to 4000 cm−1 with a resolution of 2 cm−1 and 64 scans.

2.3. Synthesis

The syntheses of oligoethylene-L-tartaramide (ET) and its fluorinated derivative (ETF), oligodiethylenetriamino-L-tartaramide (DT) and its fluorinated derivative (DTF), and oligoethylene-adipamide-L-tartaramide (ETA) and its fluorinated derivative (ETAF) were performed according to the reported methods for the other oligoamides as described in the following paragraphs. Details of all of these syntheses, as well as the FT-IR and NMR (1H, 13C, 19F) characterization of all synthesized compounds are given in the supplementary materials.

2.3.1. Fluorinated Diethylenetriamine (DF)

In a Sovirel® tube (SciLabware Limited, Stoke on Trent, UK), diethylenetriamine (D) (20.1 mg, 0.194 mmol), 3-perfluorohexyl-1,2-epoxypropane (EC6F) (291.8 mg, 0.776 mmol) and 4 mL of solvent (2-propanol) were added under nitrogen atmosphere. The reaction mixture was allowed to react at 70 °C for 48 h. A yellow solution was observed at the end of the reaction. After evaporating the reaction mixture, the residue was washed with water. A light orange oil (310 mg, 99% yield) was obtained.
1H NMR (CD3OD) δ: 2.07–2.83 (m, 2H, CH2CH(OH)CH2(CF2)5CF3), (m, 8H, NHCH2CH2NHCH2CH2NH) and (m, 2H, NHCH2CH(OH)), 4.11 and 4.19 (m, 1H, CH2CH(OH)CH2(CF2)5CF3) ppm.
13C NMR (CD3OD) δ: 35.4 (CH2CH(OH)CH2(CF2)5CF3), 55.0 (CH2NH), 61.0 (CH2CH(OH)CH2(CF2)5CF3), 63.1 (CH2CH(OH)CH2(CF2)5CF3), 108.8, 111.7, 113.5, 115.9, 118.6, 121.0 (CF3(CF2)5) ppm.
19F NMR (CD3OD) δ: −82.6 (CF3), −123.0, −124.1, −124.8 (CF2), −127.5 (CF2CF3) ppm.
Using the same synthetic procedure, different molar ratios of D/EC6F were employed to obtain mono- or di-substituted fluorinated primary amino groups (Table 1).

2.3.2. Oligoethylene-Succinamide-L-Tartaramide (EST) and Its Fluorinated Derivative (ESTF)

(a) EST—Diethyl succinate (S) (348.4 mg, 2 mmol), ethylenediamine (E) (240.4 mg, 4 mmol) and 1.5 mL of solvent (methanol) were added under nitrogen atmosphere to dimethyl L-tartrate (T) (356.3 mg, 2 mmol) in a Sovirel® tube. After stirring at 80 °C for 72 h, the formation of a light yellow solid was observed. In the work-up process, the reaction mixture was filtered on a Büchner Funnel, washed with ethyl ether, and then dried at a reduced pressure, giving 584.6 mg of product. A light yellow and water-soluble solid was recovered, with an average molecular weight of 887.92 g/mol, 100% yield, and a succinic/tartrate unit ratio of 1:1.
With the same procedure, but stirring at 80 °C for only 24 h instead of 72 h, a light yellow and water-soluble solid (EST2) was obtained, with an average molecular weight of 633.86 g/mol, 72% yield, and a succinic/tartrate unit ratio of 1:2.
1H NMR (D2O) δ: 2.52 and 2.54 (m, 4H, COCH2CH2CO), 2.97 (m, 2H, CH2NH2), 3.2–3.5 (m, 2H, CH2NHCO), 4.56 (m, 1H, CHOH) ppm.
13C NMR (D2O) δ: 31.0 (CH2CONH), 38.5 (CH2NHCO), 39.3 (m, 2H, CH2NH2), 72.3 (CH-OH), 174.0 and 175.0 (CONH) ppm.
(b) ESTF—In a Sovirel® tube, oligoamide EST2 (120 mg, 0.189 mmol), EC6F (284.3 mg, 0.756 mmol), and 4 mL of solvent (a mixture of 2-propanol/MilliQ water 3/1) were added under nitrogen atmosphere. After 48 h at 70 °C, the reaction mixture was evaporated to dryness under reduced pressure, and the solid residue was washed first with water and then with cold acetone (−20 °C) obtaining a yellow solid (281.8 mg, yield 70%).
1H NMR (CD3OD) δ: 2.46 (m, 4H, COCH2CH2CO), 2.10–2.80 (m, 4H, CH2CH(OH)CH2(CF2)5CF3), 2.8 (m, 2H, CH2NHCH2CH(OH)CH2(CF2)5CF3), 3.0–3.5 (m, 2H, CH2NHCO), 4.10 (m, 1H, CH2CH(OH)CH2(CF2)5CF3), 4.47 (m,2H, CH(OH)CH(OH)) ppm.
13C NMR (CD3OD) δ: 30.7 (COCH2), 35.5 (CH2CH(OH)CH2(CF2)5CF3), 38.5 (CH2NHCO), 54.7 (CH2NH), 60.9 and 65.4 (CH2CH(OH)CH2(CF2)5CF3), 61.9, 63.5, 63.5 (CH2CH(OH)CH2(CF2)5CF3), 72.7 (COCH(OH)CH(OH)CO), 108.3, 111.5, 113.5, 115.7, 118.4, 121.0 (CF3(CF2)5), 173.8 (CONH) ppm.
19F NMR (CD3OD) δ: −82.5 (CF3), −122.9, −124.0, −124.6 (CF2), −127.5 (CF2CF3) ppm.

2.3.3. Oligoethylenesuccinamide ES and Its Fluorinated Derivative ESF

(a) ES—In a Sovirel® tube, S (348.4 mg, 2 mmol), E (240.4 g, 4 mmol), and 1.5 mL of solvent (methanol) were added under nitrogen atmosphere. After stirring at 80 °C for 24 h and carrying out the same work-up used for EST, a white solid was obtained with an average molecular weight of 486 g/mol and a yield of 73%.
1H NMR (D2O) δ: 2.38, 2.51 (m, 4H, COCH2CH2CO), 2.71 (m, 2H, CH2NH2), 3.14, 3.31(m, 2H, CH2NHCO) ppm.
13C NMR (D2O) δ: 31.1 (CH2CONH), 38.6 and 41.3 (CH2NHCO), 39.7 (m, 2H, CH2NH2), 175.0 (CONH) ppm.
(b) ESF—In a Sovirel® tube, oligoamide ES (120 mg, 0.247 mmol), EC6F (371.6 mg, 0.988 mmol) and 2 mL of solvent (2-propanol) were added under nitrogen atmosphere. After 48 h at 70 °C, a white dispersion was observed. The reaction mixture was evaporated at reduced pressure and the residue was washed with water to remove the unreacted oligoamide ES. A light yellow solid (438 mg) was obtained with a 89% yield.
1H NMR (CD3OD) δ: 2.46 (COCH2CH2CO), 2.05–2.77 (m, 4H, CH2CH(OH)CH2(CF2)5CF3), 2.6–2.7 (m, 2H, CH2NHCH2CH(OH)CH2(CF2)5CF3), 3.26 (m, 2H, CH2NHCO), 4.11 (m, 1H, CH2CH(OH)CH2(CF2)5CF3) ppm.
13C NMR (CD3OD) δ: 30.7 (COCH2), 34.6 (CH2CH(OH)CH2(CF2)5CF3), 38.2 (CH2NHCO), 52.6 and 54.1 (CH2NH),61.1 and 61.2 (CH2NHCH2CH(OH)CH2(CF2)5CF3), 62.3 and 63.2 (CH2CH(OH)CH2(CF2)5CF3), 108.4, 110.8, 112.9, 114.7, 118.9, 121.3 (CF3(CF2)5), 173.6 (CONH) ppm.
19F NMR (CD3OD) δ: −82.5 (CF3), −122.9, −124.1, −124.6, −124.9(CF2), −127.6 (CF2CF3) ppm.

2.4. Diagnostic Protocol

The diagnostic protocol was designed to investigate the relationship between the chemical structure of the coating agents and their performance on wood samples. Various tests were selected to compare the changes in some wood properties obtained as a consequence of different treatments.
Beech and oak clear samples, oriented according to the anatomical directions, were prepared in the shape of parallelepipeds with a square base of 5 × 5 × 2 cm3 or 2.5 × 2.5 × 1 cm3. To evaluate the effect of wood extractives on the behavior of the tested products, samples as such and pre-extracted with ethanol (two extractions of 24 h at room temperature) were compared. In accordance with the known peculiarity of the wooden material, the samples presented an appreciable heterogeneity of appearance between the different faces of the same specimen, visible to the naked eye, and sometimes even between different portions of the same face. To reduce the error in the data evaluation, it was necessary to carry out the measurements by monitoring the behavior of the selected samples before and after treatment, identifying, when necessary, the precise positions on the samples and repeating more measurements even in different positions of the same sample.
Static water contact angle (CA), water vapor absorption, and chromatic changes were the measurements selected for evaluating the performance of the protective treatments.
The static CA of the neat and treated wood samples was measured using 5 µL of distilled water. Preliminary measurements were recorded through a video using an Osmo pocket (DJI, Shenzhen, China) camera, while definitive data were collected by a Ramé-Hart Model 190 CA (Succasunna, NJ, USA) Goniometer. To calculate the average value of five different drops on a same position of each sample, a specific position was selected and fixed through a mask, and the measurement was repeated after complete evaporation of the previous drop of water (approximately after 48 h).
The water vapor absorption test was performed introducing the dried samples in a climate-controlled room (temperature set at 20 °C) inside a closed container, where the relative humidity (RH%) was controlled by means of saturated salt solutions (UNI EN ISO 483—2006 [28]). The relative humidity was gradually increased, applying the following RH% values:
  • Saturated solution of NH4NO3(RH 65%);
  • Saturated solution of KCl (RH 86%);
  • Distilled water (RH 100%).
The samples were regularly weighed at time intervals ranging from 2 to 24 h. Only when the difference between two subsequent measurements was less than 0.5% were they moved on to the next humidity step. As a starting point for the absorption tests, according to standard methods [29,30], it would have been correct to use the wood in an anhydrous state after drying the specimens in an oven at 103 °C for 24 h. However, in this case, the high temperature would have modified the interaction between the oligoamides and the wood, inducing a migration of the product and altering the treatment. It was therefore decided to use the weight of the samples kept for 72 h in the desiccator at room temperature as an initial dry value. In this way, the weight obtained is not the anhydrous weight of the sample, but the weight in equilibrium with the moisture not retained by the calcium chloride present inside the desiccator.
The chromatic changes induced by the coatings were examined by colorimetric analysis performed before and after the application of the coating, following the standard method UNI-EN 15886–2010 [31]. Only one sample for each type of treatment was tested to select samples as similar as possible in initial chromatic behavior. In fact, the chromatic variation in the wood is also affected by the different shade of color present in different areas, even in the same initial piece of wood. Five measurements for each sample (before and after coating) were collected on the same spot, previously located by using a mask, exploiting a portable X-Rite SP60 (Grand Rapids, MIichigan, USA) spectrophotometer in specular component excluded mode. The results were analyzed and reported in the CIE-L*a*b* standard color system, and the color alterations (ΔE*) were expressed as: Δ E * = Δ L * 2 + Δ a * 2 + Δ b * 2 , where L* indicates lightness, and a* and b* are the color axes. ΔL*, Δa*, and Δb* were calculated as Δ X = X a X b , where X a and X b are the L*, a*, or b* values after and before the application of the coating, respectively.

2.5. Treatment of Wood Samples

Based on the solubility test in ethanol or 2-propanol (see results and discussion), the products with the best solubility were selected for the coating treatments (i.e., ETAF, ESTF, ESF, DTF, DF), and 2-Propanol was selected as the solvent. Paraloid B72 was dissolved in acetone at the same concentration of the synthesized compounds.
Each product was tested on three wood samples (one 5 × 5 × 2 cm3 and two 2.5 × 2.5 × 1 cm3). Propanol solution (ETAF, ESTF, DTF, DF) or dispersion (ESF), 8 mg/mL, was freshly prepared and the volume of each formulation, as needed for each treatment, was measured using a graduated pipette (accuracy 0.01 mL). The treatment was performed by a Pasteur pipette using the classical method “wet on wet”. A surface concentration of 30 g/m2 was applied on one 5 × 5 cm2 surface for the wettability tests and the colorimetric measurements, while all the surfaces of the sample were treated with an excess of product (40 g/m2) for the water vapor absorption tests. After solvent evaporation in lab conditions for 3 days under a fume hood, all samples were put in a desiccator until constant weights were reached.

2.6. Photo-Oxidative Test

The stability of the synthetic partially fluorinated oligoamides and amine was estimated by means of accelerated aging tests exploiting UV radiations. Their behavior was followed via 1H NMR, FT-IR spectroscopies and colorimetric measurements. The weight change was also recorded in order to track the change of the compounds after the UV exposure test.
Exposure to UV radiation was carried out using a Spectroline (Melville, NY, USA) lamp, Model ENF-260C/FE, with an emission in UV-A range at wavelength of 365 nm (tube of 6 W).

3. Results and Discussion

3.1. Non-Fluorinated Oligoamides Synthesis

In the first step, the synthesis of non-fluorinated oligoamides was performed by condensation of an ester and an amine group through step-growth polymerization. The monomers were selected to obtain products with the structural characteristics required for their use as wood protective agents. When it was possible, the monomers recoverable from biomass were also chosen.
Dimethyl L-tartrate was chosen as one of the monomers for the production of oligoamides because it has two hydroxyl groups in the molecule, which can make the final product affine to a polar material as wood. The dextrorotatory enantiomer of (R,R)-L-(+)-tartaric acid is a renewable resource widely distributed in nature (in many plants, particularly grapes, bananas, and tamarinds as well as in other fruits).
Diethyl succinate or diethyl adipate were selected to improve the solubility in alcohol and the hydrophobicity of the final fluorinated derivatives. Diethyl succinate derives from succinic acid, which is a naturally occurring four-carbon dicarboxylic acid, naturally formed by most living cells as an outcome of anaerobic digestion, and it is a coproduct of particular interest in biorefineries production. Adipic acid can be obtained in biorefinery processes by the fermentation of sugars to muconic acid followed by hydrogenation, direct fermentation, or by the anaerobic oxidation of sugar to glucaric acid and subsequent hydrodeoxygenation of glucaric acid.
Ethylenediamine and diethylenetriamine were selected as the amine blocks for the synthesis to compare the role of two different amines in the performance of the final products.
The selected amines can react with esters of dicarboxylic acid to form the –CONH– functional group, which make the final product affine to polar materials by interacting with their components through dipolar interaction or hydrogen bonding. Moreover, the amide group is more stable than other polar groups such as the ester ones.
By combining different amine blocks with different esters of diacids, it is possible to modulate the molecular weights and the physical characteristics of the products, such as hydrophilic or hydrophobic properties and solubility.
In the diethylenetriamine, the secondary –NH– group, generally not involved in the amidation reaction, can interact with polar material with additional hydrogen bonding, providing different physical characteristics and properties.
In summary, the choice of monomers was made in order to balance the presence of polar groups, to favor interactions with polar substrates and hydrophobic parts.
Synthetic procedures for the synthesis of oligoamides were designed to obtain products with low molecular weight and/or unwanted degradation products. In fact, in previous preliminary syntheses carried out in accordance with the industrial synthesis of common nylons (i.e., salts of hydroxylated monomers heated at high temperature), we obtained polymers with too-high molecular weights or a high percentage of byproducts. Therefore, esters of dicarboxylic acids were used for amides production in mild reaction conditions, avoiding salt formation between diacid and diamine, which requires higher temperatures for the condensation reaction. Starting from diesters, the low temperature (80 °C) avoids the alteration of the hydroxylated portions. In order to obtain oligoamides with terminal amine groups for successive reactions, the molar amount of amine was kept in slight excess with respect to the selected stoichiometric ratio diamine/diester (1:1 or 2:1). The syntheses of oligoamides were typically carried out in methanol as polar solvent, suitable for solubilizing all of the reagents.
The different reactivity of each monomer affects chain growth, resulting in different molecular weights, different monomer unit ratios, and different conversions for different oligoamide syntheses. Solid products were generally obtained for all of the oligoamides.
The reaction conditions used in the various syntheses are reported in 
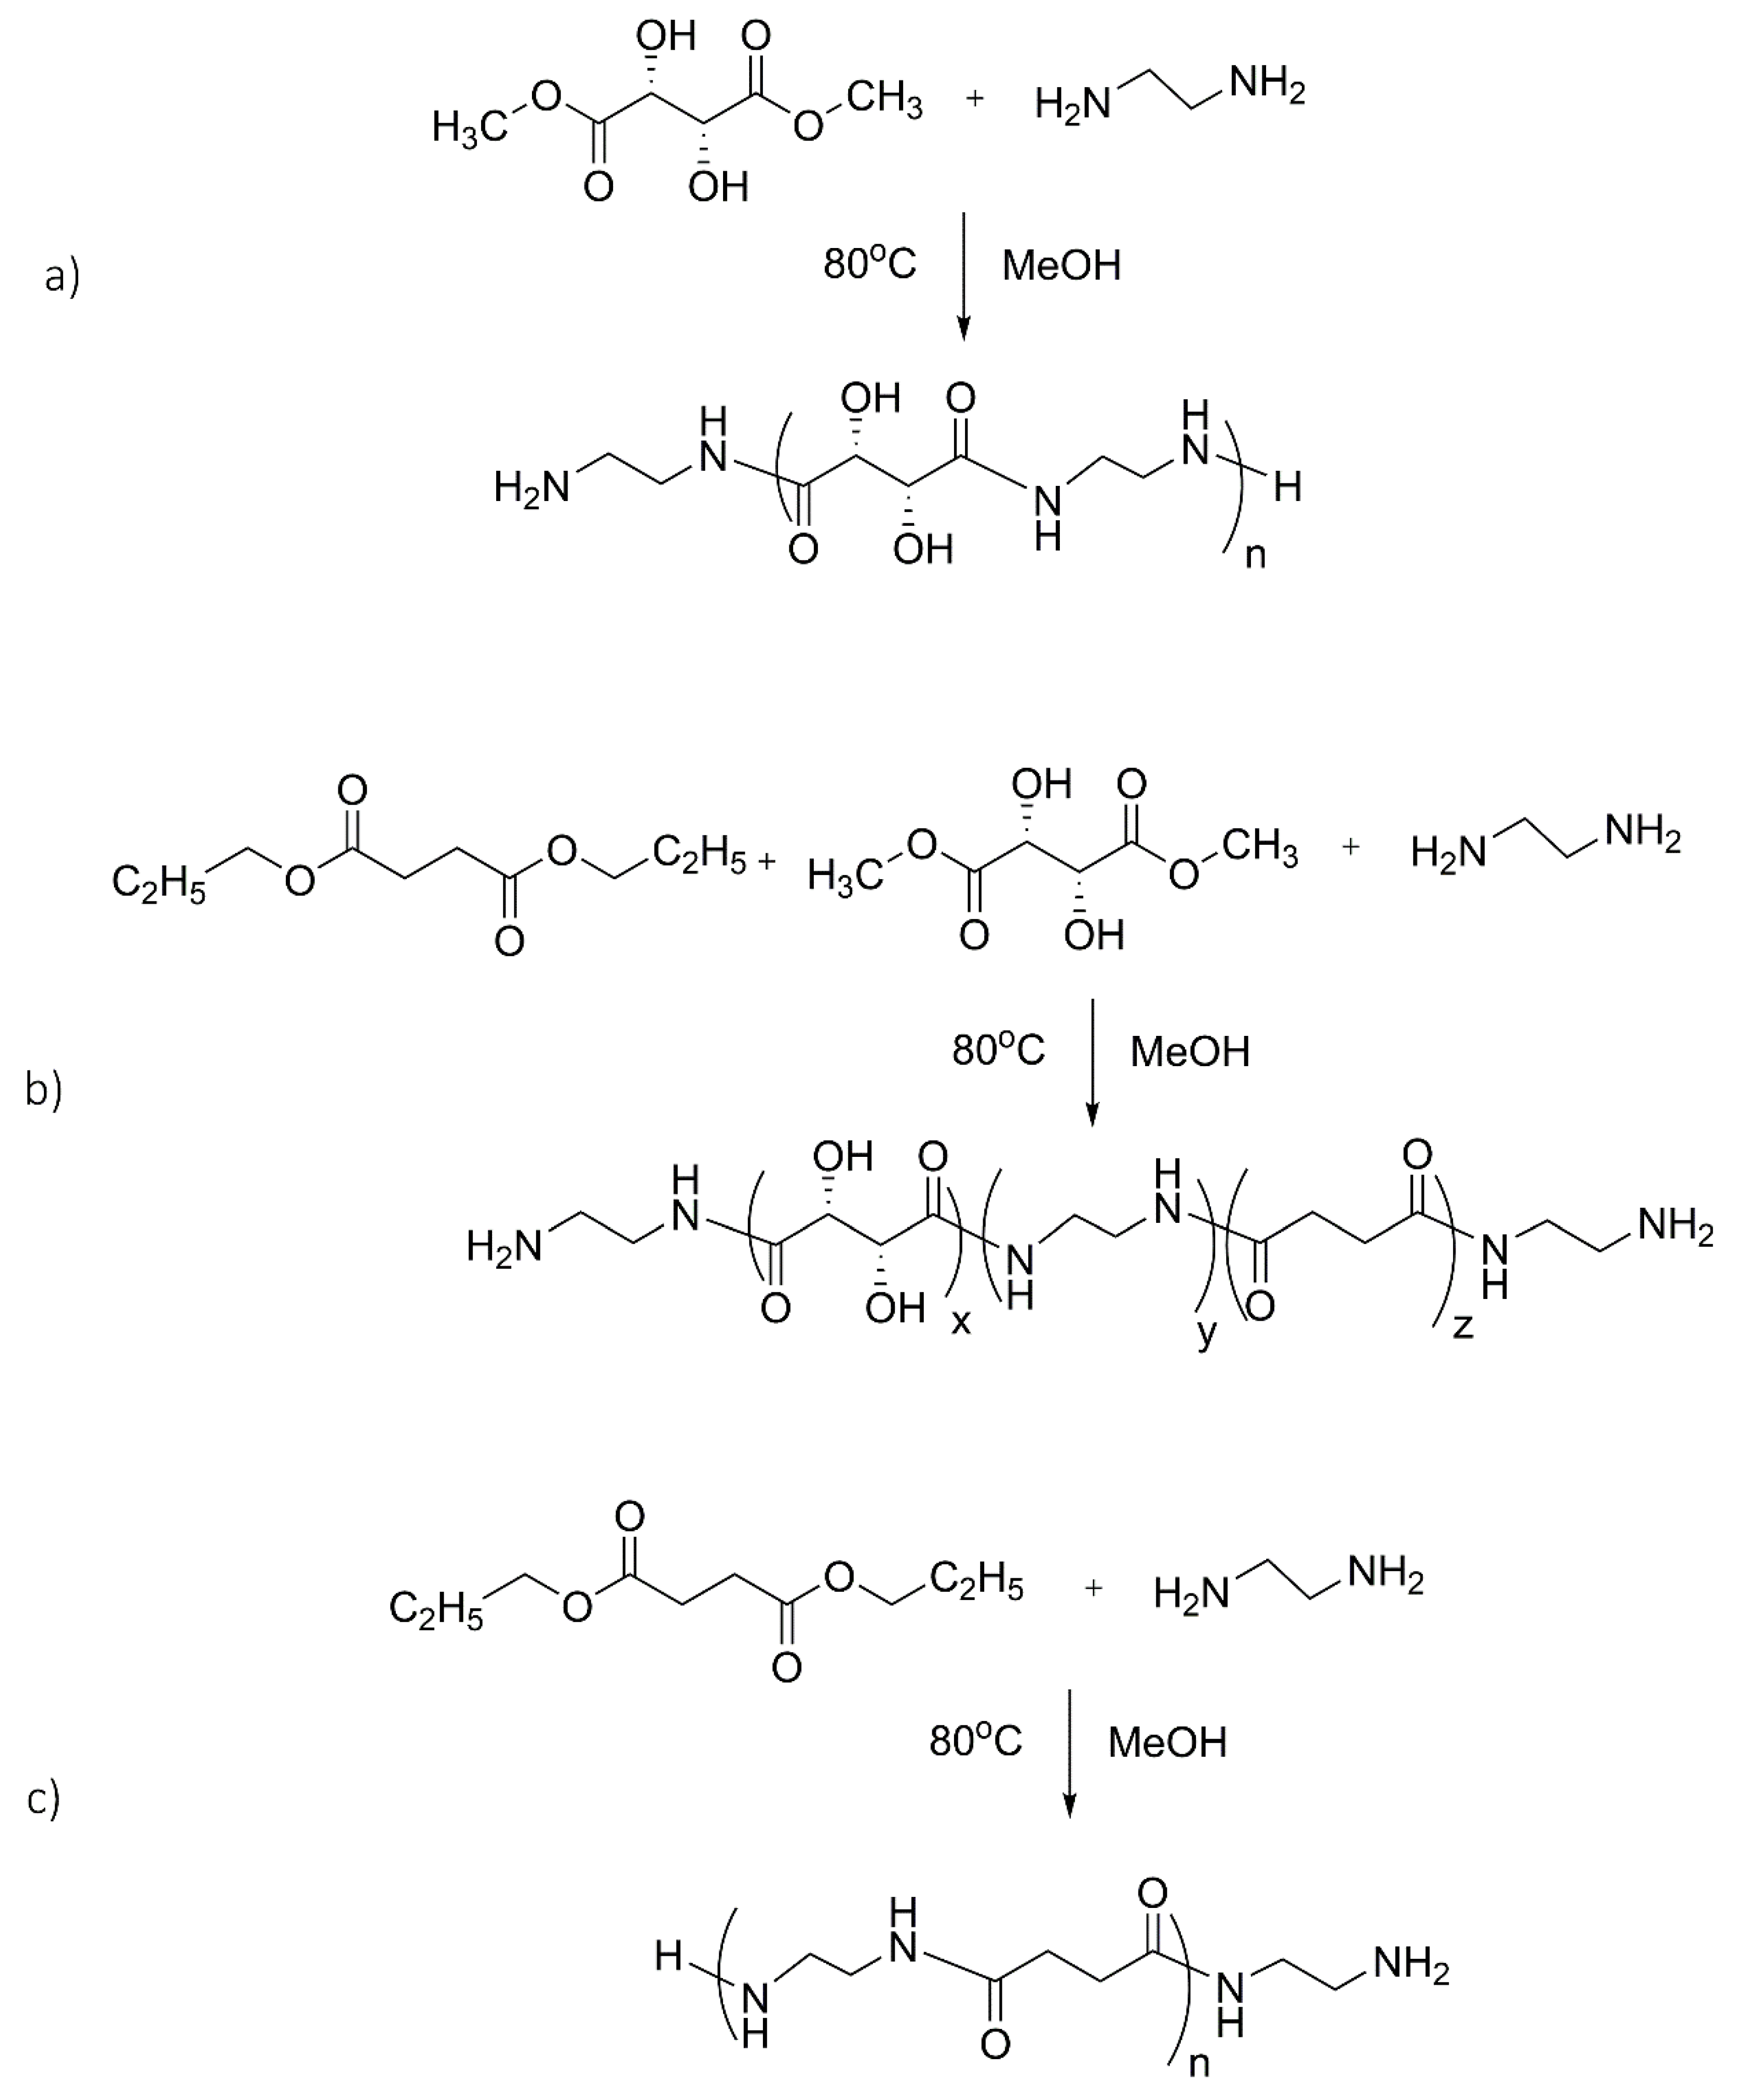
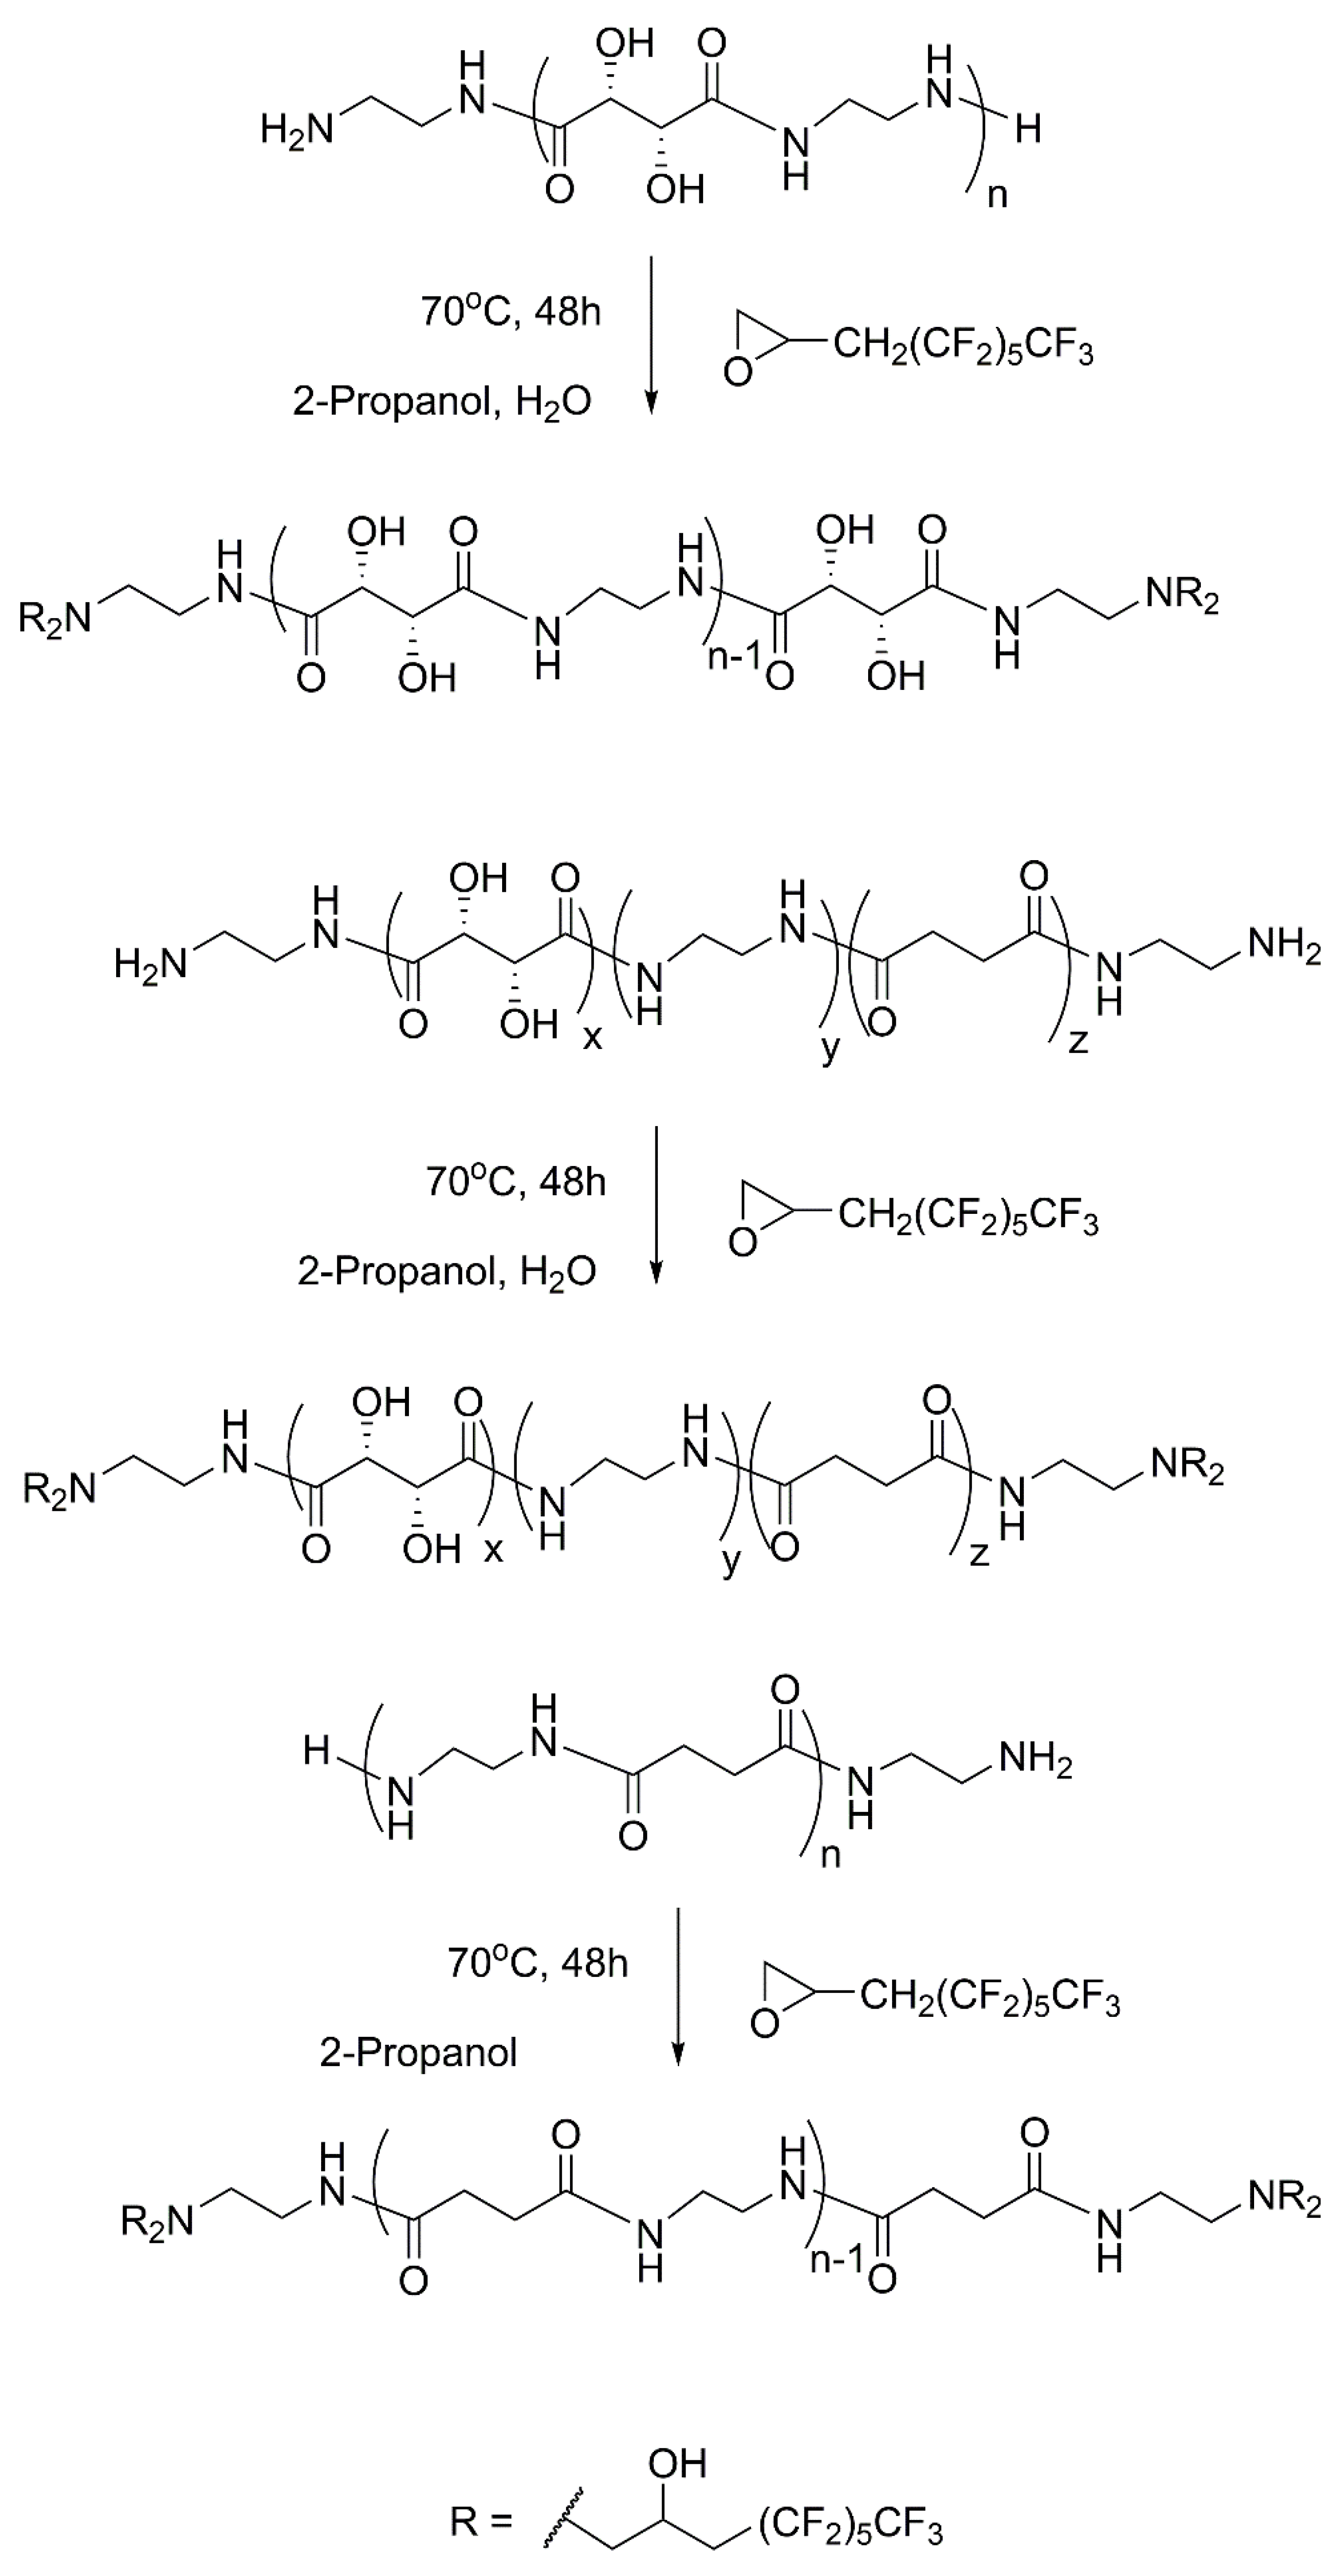
Table 2 together with the yields, molecular weights, and the ratios between the monomer units. The reaction schemes for the synthesis of ES, EST, and ES are shown in Figure 1. As expected, different monomers influence the reactivity and, consequently, the yield. The co-products present in the reaction mixture are typically unreacted products, rather than byproducts. In fact, by prolonging the reaction time, the yield increases, as observed for EST where the yield respectively passes from 72% to 100% after 24 and 72 h (Table 2). In 
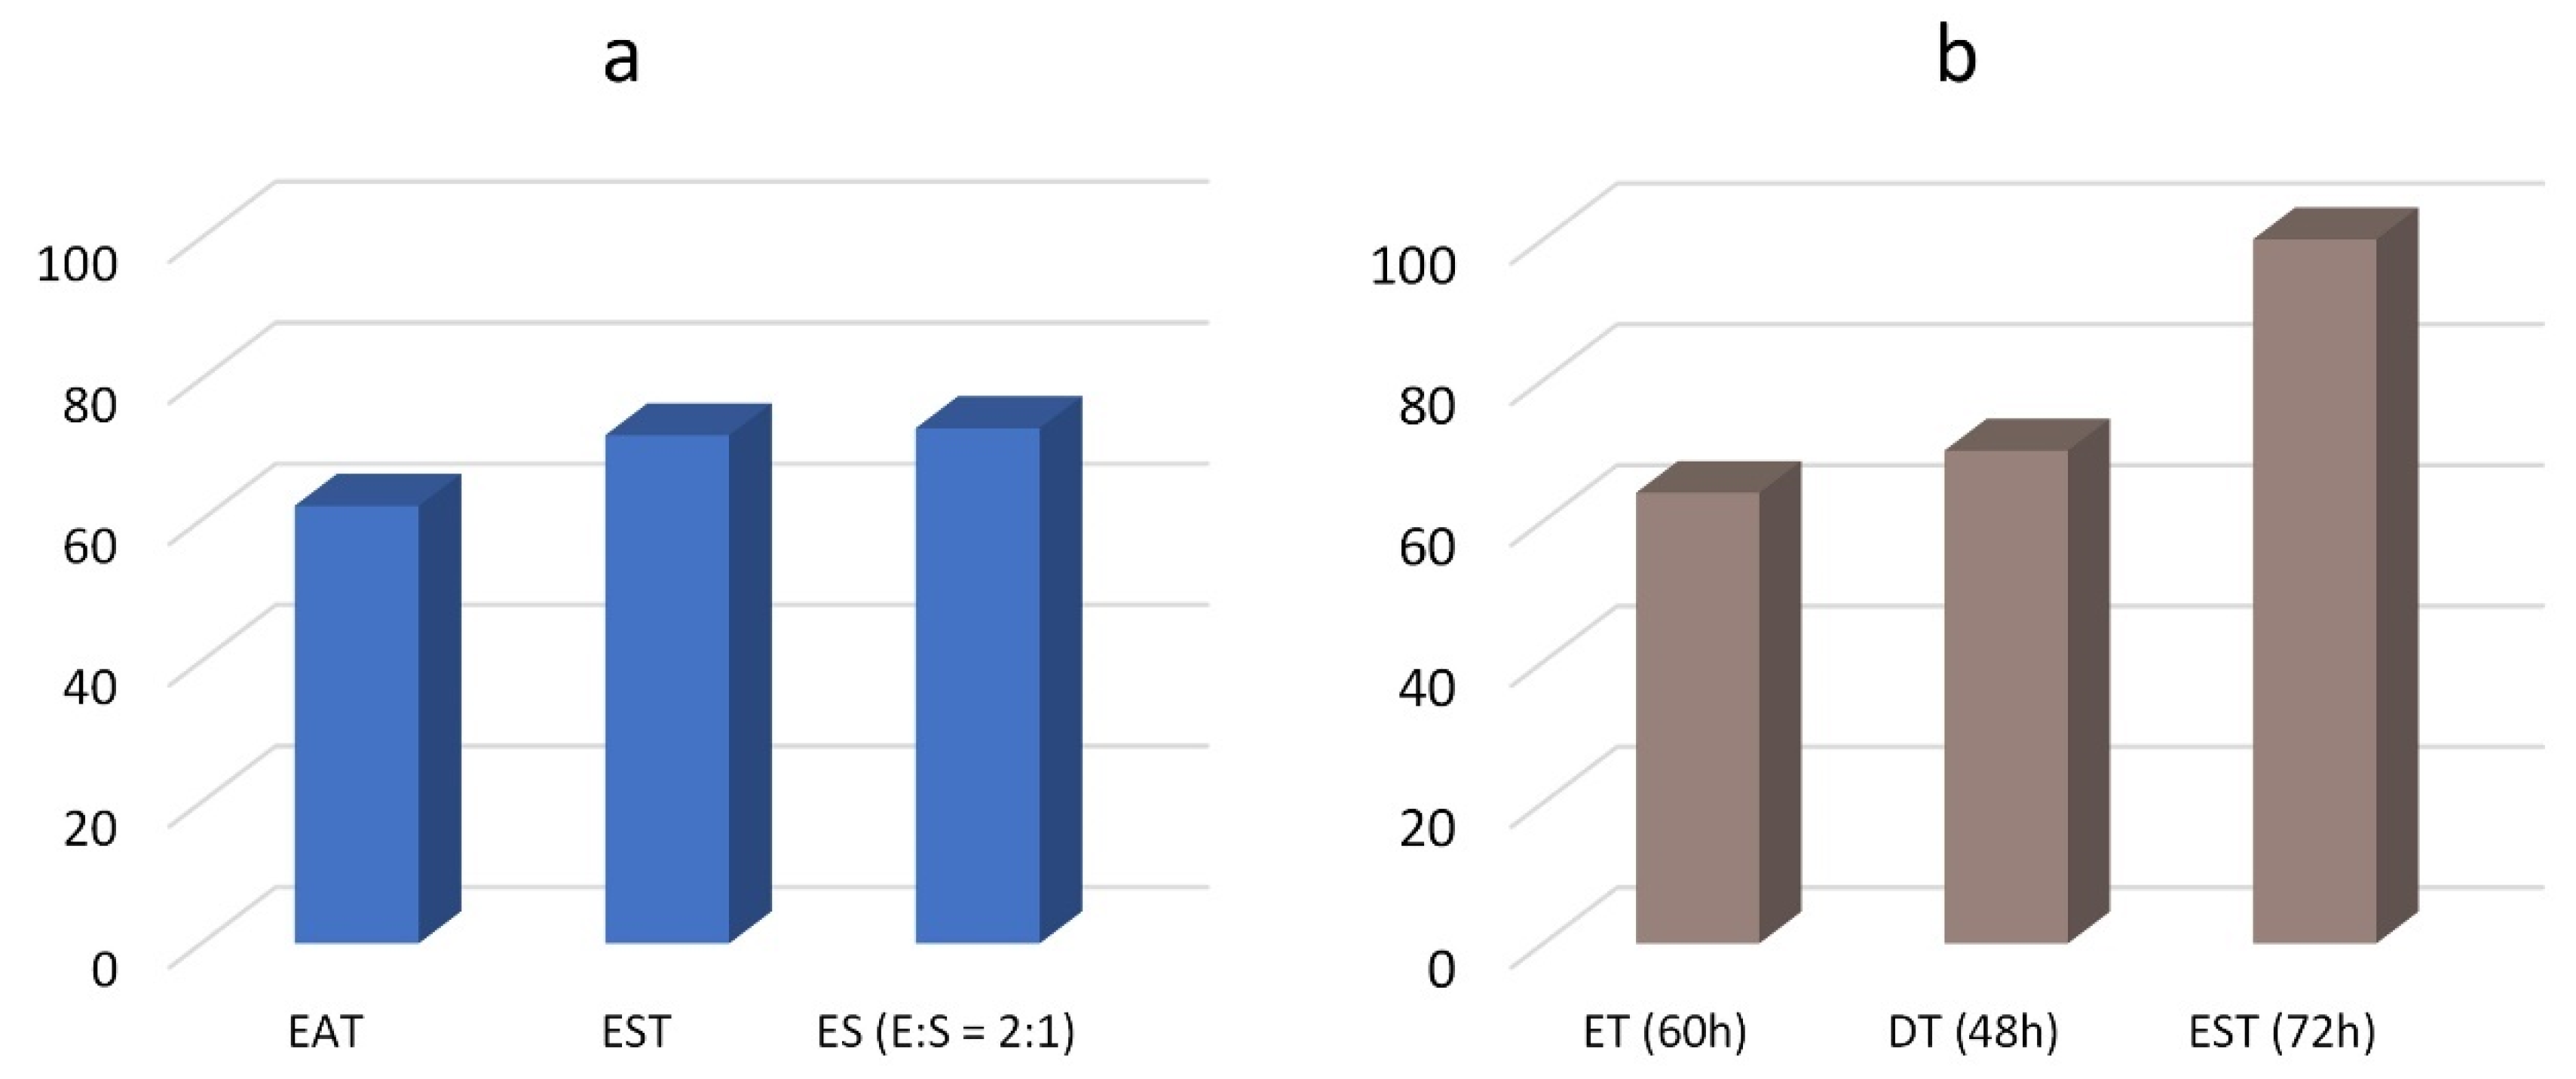
Figure 2, the oligoamide yield for different monomers is compared after 24 h and after long reaction times.
The results show that diethylenetriamine is more reactive than ethylenediamine, while the reactivity of the aliphatic diesters is in the order succinate > adipate. As the literature reports that diesters with hetero atom groups (including hydroxylated diesters) show enhanced reactivity in mild conditions compared with aliphatic diesters [32,33], the higher reactivity of ES (yield 73% after 24 h) in respect to ET (64% after 60 h) may be explained with the different diamine:diester ratio (2.1 instead of 1:1). However, when aliphatic and hydroxylated esters (i.e., tartrate) are contemporarily present in the reaction mixture, the tartrate shows a greater reactivity. This behavior is evidenced by comparing the higher yield of EST (73%) after 24 h (Figure 2a) with the lower yield of ET (64%) after 60 h. (Figure 2b). Moreover, in agreement with the reported higher reactivity of diesters with hetero atom groups, a higher tartaric:succinic ratio is observed at low reaction times (Table 2).
During the step-growth polymerization, the monomers initially form oligomers with low molecular weight, which grow gradually, but molecules of different lengths are synthesized and the final product, although at low average molecular weight, is composed of macromolecules with a different degree of polymerization. The 1H NMR spectral integration method was previously applied to estimate the number of average molecular weights (Mn) [26,34]. Similarly, in this study, specific equations were applied for each oligoamide in agreement with its structure, selecting suitable signals. First of all, the characterization of new compounds with the attribution of all of the signals present in the 1H and 13C NMR spectra was also performed using, when necessary, 2D NMR spectroscopy (gCOSY, gHSQC). In particular, using 1H and 13C NMR spectroscopy, the presence of amino groups at the end of the polymeric chain was determined (signals respectively at 2.70–3.00 ppm and near 40 ppm). The absence in the 1H NMR of a singlet signal in the 3.60–3.80 ppm range and a signal at 52 ppm in the 13C NMR, both attributable to the –OCH3 in the terminal ester group, is in agreement for all products with the presence of two terminal amino groups. As the CH2-NH2 signal is present in a quite clean region of the 1H NMR spectrum, the corresponding integral was used as the reference value and set as 2 when one amino group was present at the end of chain, or 4 when both end groups were amino groups. Then, the integrals of the other signals were evaluated with respect to this value. Since the integral of the signal area is proportional to the number of protons, it is possible to calculate the number “x”, “y”, “z” of the repeating units of the oligoamide using the equations reported in 
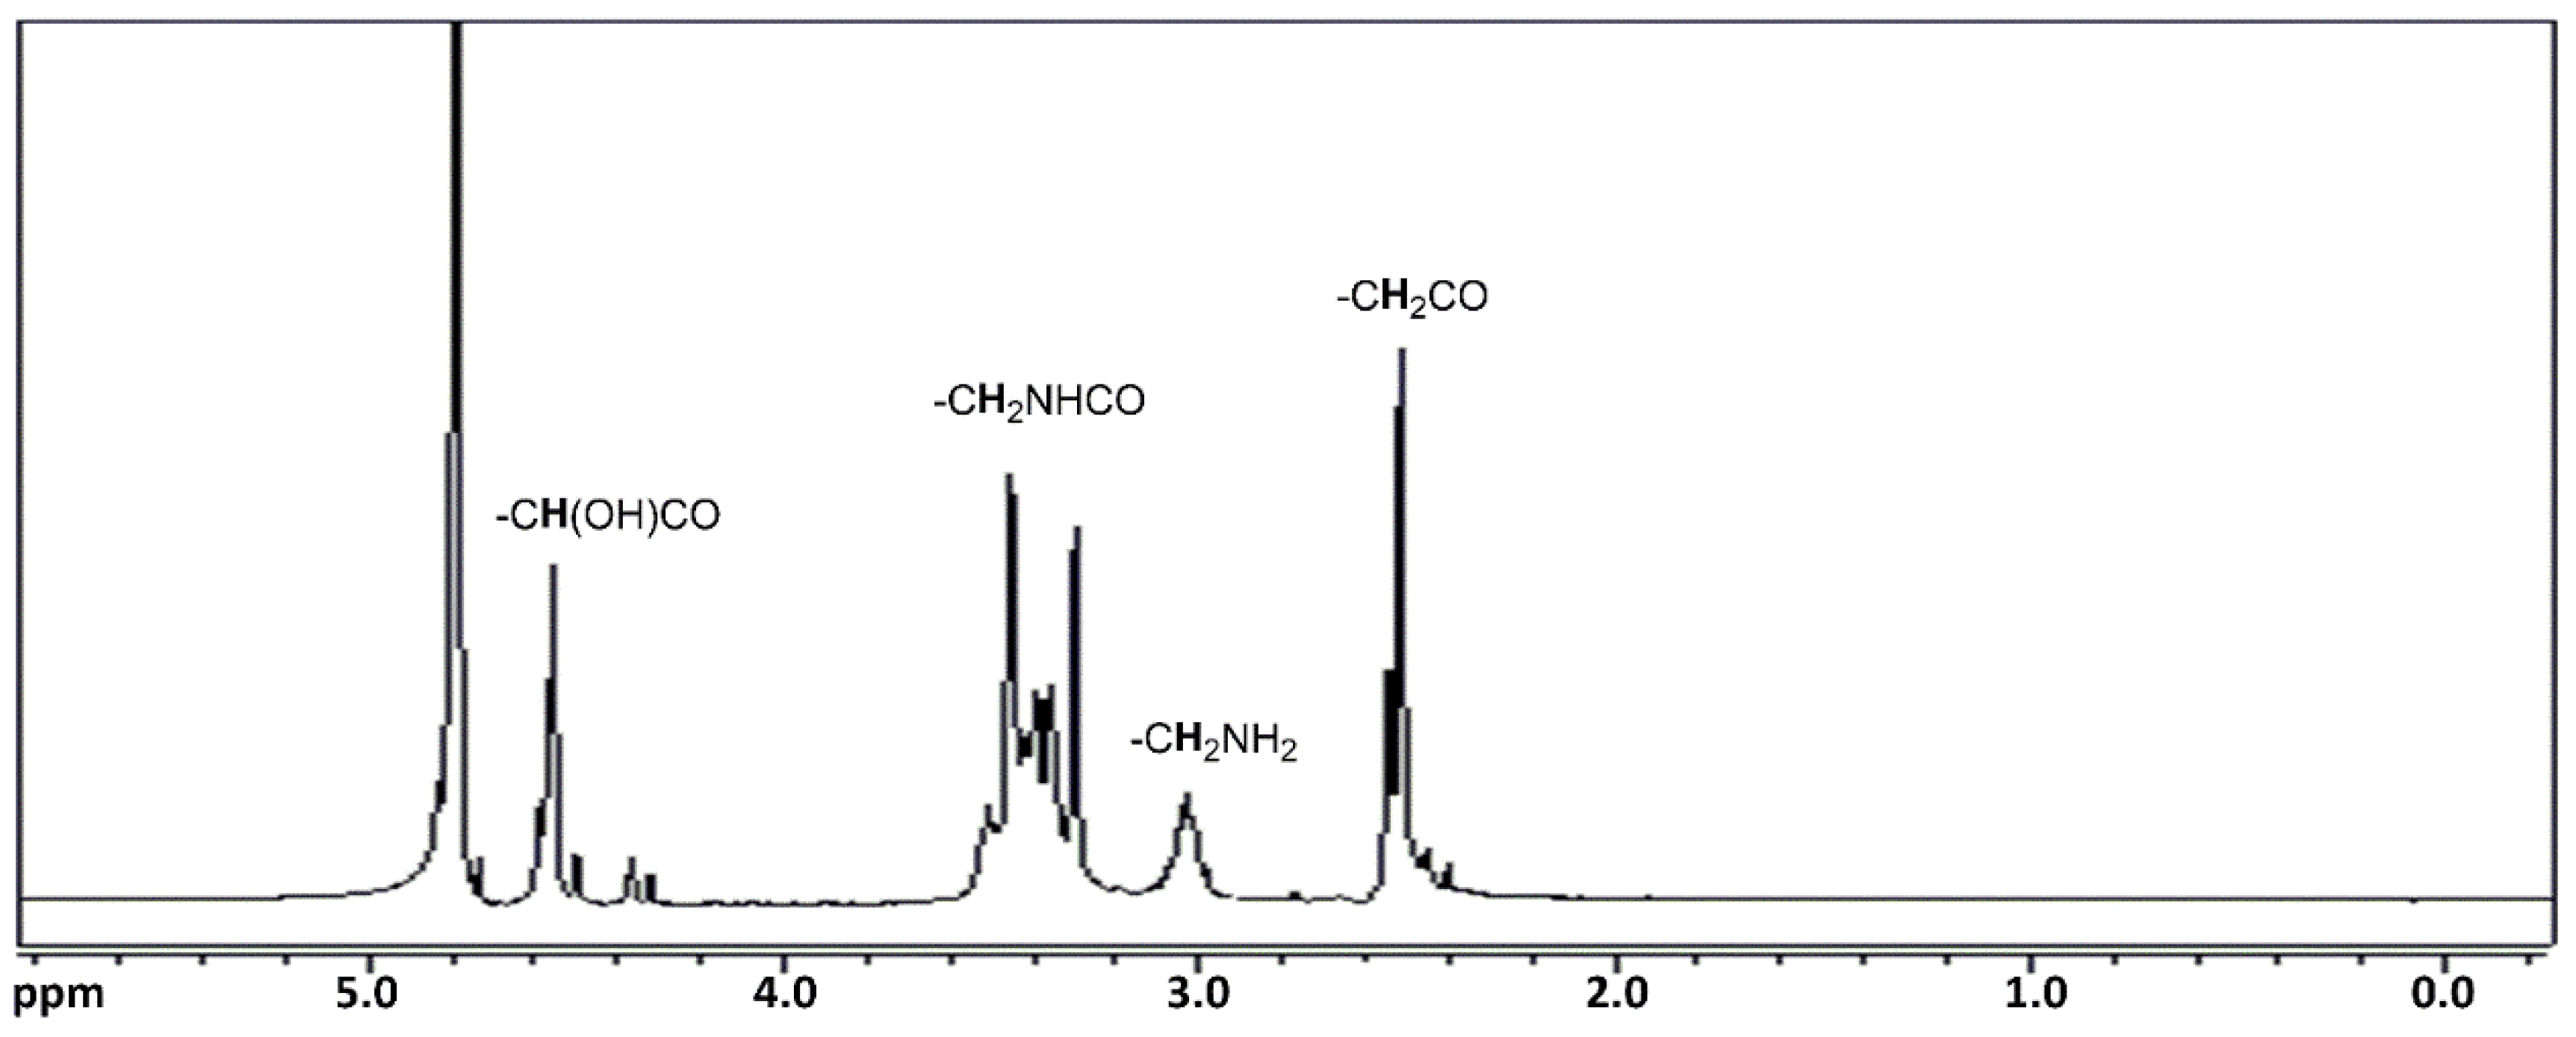
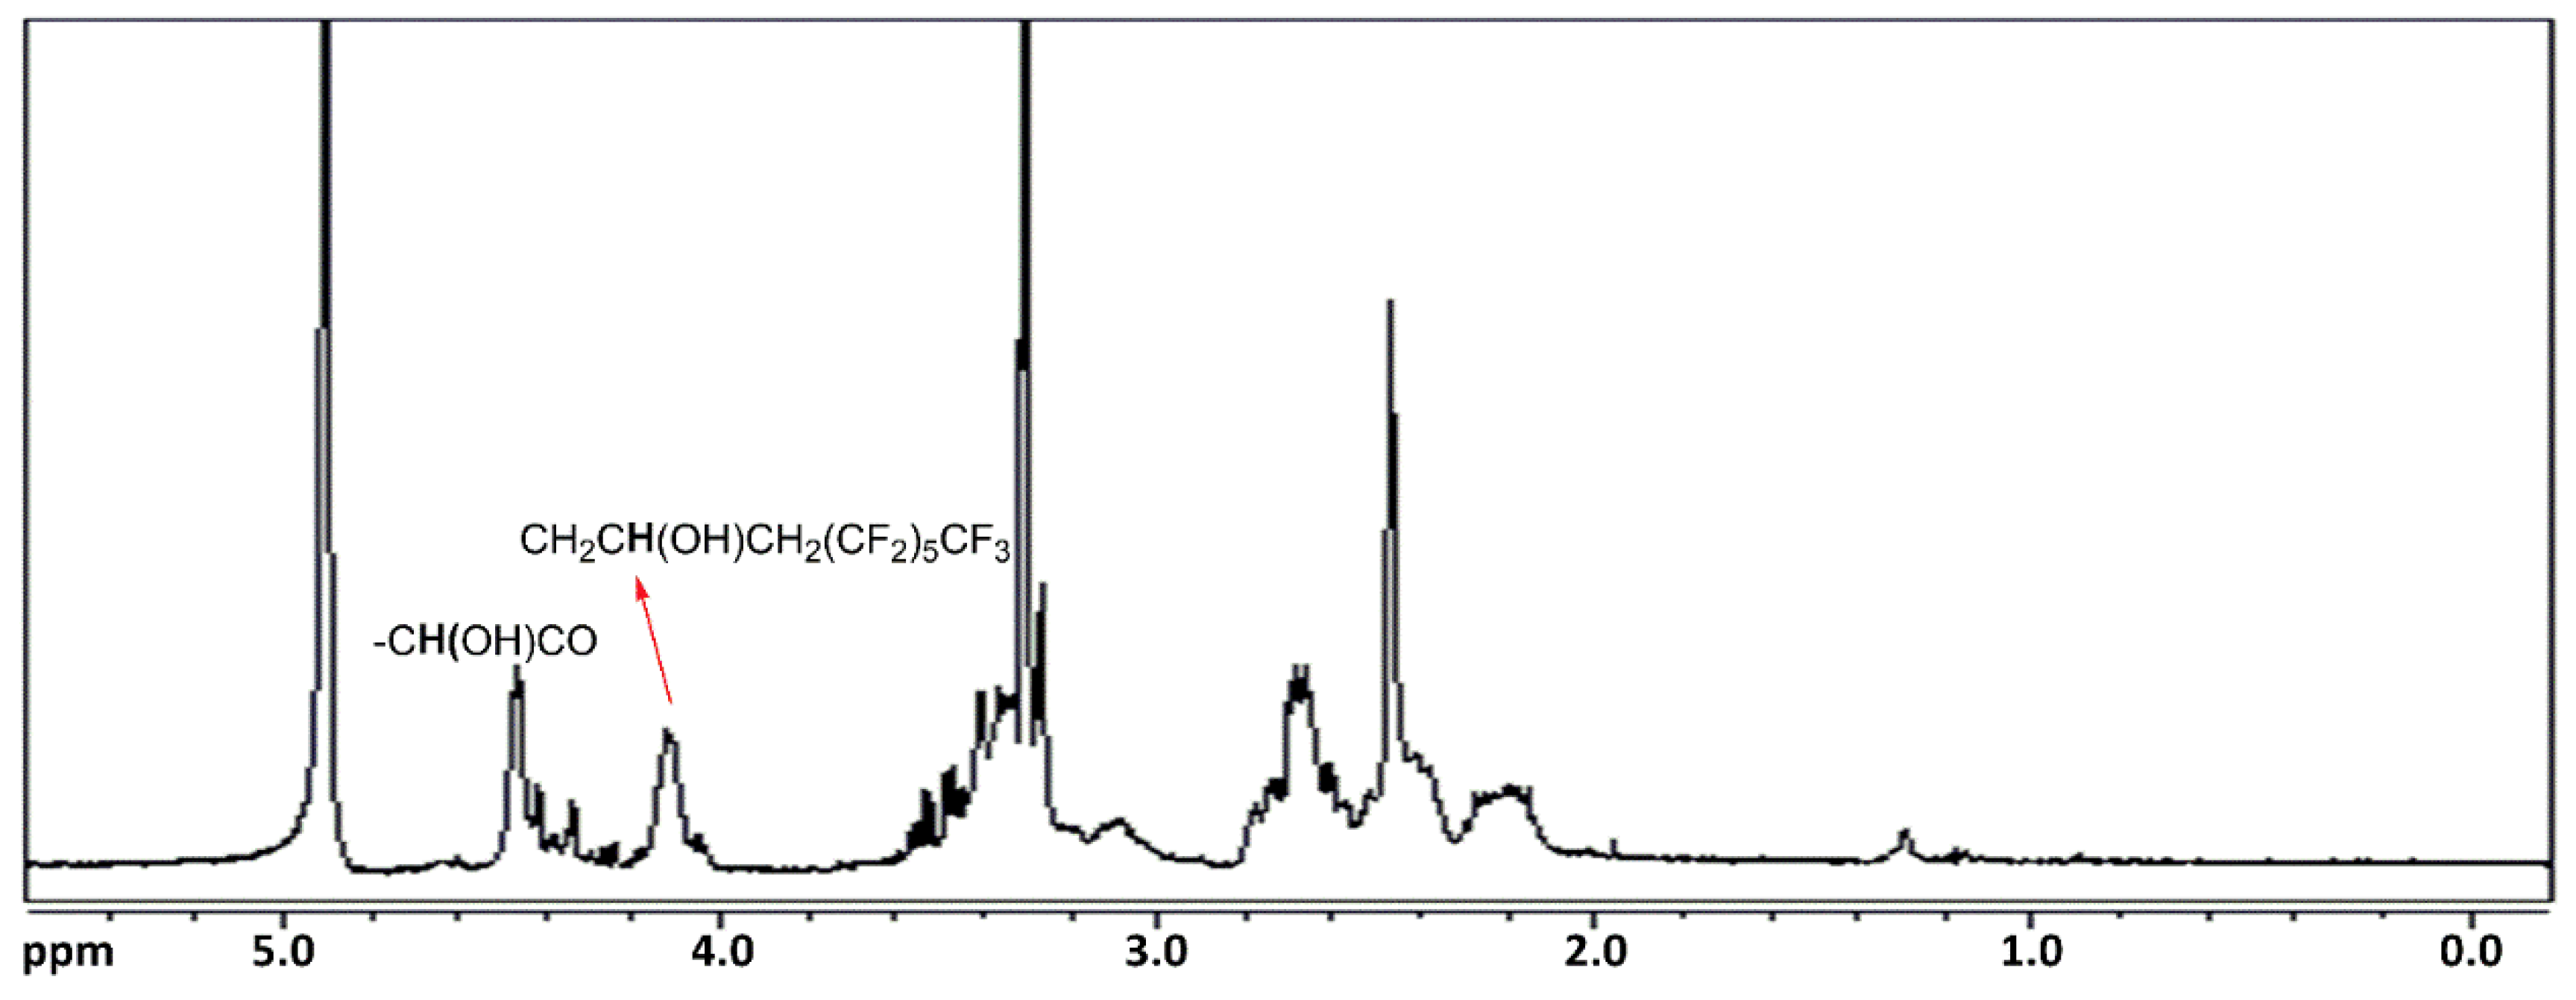
Table 3 for each compound. As an example, the 1H NMR spectrum of EST is shown in Figure 3, while the other NMR and FT-IR spectra of all synthesized products are shown in the Supplementary Materials (Figures S1–S36).
Based on the 1H NMR characterization, the formation of the amide group is confirmed by the presence of signals between 3.2 and 3.5 ppm attributable to the CH2 group in α position to this group: CH2NHCO (2 methylene groups in the middle of the chain and the CH2 in the terminal amino groups CONHCH2CH2NH2). Similarly, in the 13C NMR spectrum, the amide group formation is confirmed by the presence of signals at 174.0 and 175.0 ppm (CONH) and 38.5 ppm (CH2NHCO).
The presence of different monomeric units is confirmed by the presence of characteristic signals. In particular, the signal at 4.56 ppm in the 1H NMR spectrum is attributable to protons of tartrate units COCH(OH)CH(OH)CO, while a signal at 72.3 ppm is present in the 13C NMR spectrum related to the CHOH. Signals between 2.30 and 2.55 ppm in the 1H NMR spectrum are attributable to protons of 2 methylene groups in the α position of each of the 2 carbonyl groups CH2CONH of the succinic or adipic units, while in the 13C NMR spectrum a signal is present at 31.0–35.5 ppm (CH2CONH). In the 1H NMR, a signal between 2.73 and 2.77 attributable to protons of CH2NHCH2 is present when diethylenetriamine has been used as monomer, while in the 13C NMR, the signals at 47.0 and 45.7 are attributable to CH2NHCH2. Finally, a signal at 1.61 ppm (24.7 ppm in the 13C NMR) is attributable to the presence of adipic units (CH2CH2CONH).

3.2. Partially Fluorinated Oligoamides Synthesis

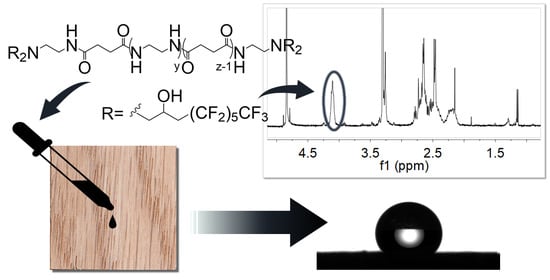
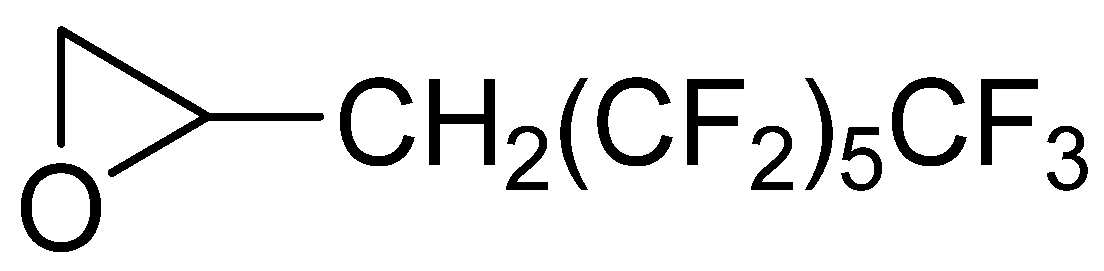
The synthesis of fluorinated derivatives was carried out by the nucleophilic ring-opening reaction between the terminal amino groups of oligoamides and a perfluorinated epoxy derivative (3-perfluorohexyl-1,2-epoxypropane, EC6F, Figure 4). This fluorinated compound was selected in order to use a reagent with good solubility in alcoholic and hydro-alcoholic solvents and with a low environmental impact.
Preliminarily, the reactivity of the fluorinated epoxide was studied with hydroxyl nucleophiles such as the OH groups of sodium tartrate, selected as a reference for the reactivity of the tartaric unit. The reactivity with water was also studied for possible use of alcohol/water mixtures as solvent, if necessary, for the dissolution of oligoamides containing tartrate units. Regarding the evaluation of reactivity with the hydroxyl groups of the tartrate, no reaction was observed in the presence of EC6F with a molar ratio tartrate/EC6F = 2:1 after heating 48 h at 70 °C with 2-propanol. On the contrary, in the presence of water as a co-solvent, the formation of the diol by opening the epoxy ring prevailed. As confirmation, the formation of diol was also obtained by reacting EC6F with water. In the 1H NMR spectrum (Figure S1), new signals are present at 4.06 ppm (CHOH) and between 3.65 and 3.45 ppm attributable to CH2OH. Therefore, the presence of water as a co-solvent requires an excess of reagents for the competitive reaction of the epoxy group, which produces the corresponding diol and the subsequent purification of the product from the diol.
On the other hand, no conversion of the epoxide is observed after heating for 48 h at 70 °C in 2-propanol, as confirmed by the presence of the characteristic signals of EC6F at 3.30, 2.85, and 2.60 ppm (Figure S2) in the 1H NMR spectrum of the solid residue recovered at the end of the reaction.
Similarly, to evaluate the reactivity of the epoxide with the amines, preliminary tests were carried out in 2-propanol using diethylenetriamine as a reagent with different molar ratios with respect to the epoxide (1:1, 1:2, 1:4, 1:6). In this way, it was possible to observe the formation of products (DF) with mono and di-substituted amino groups and to compare their behavior with respect to oligoamides.
In the 1H NMR spectrum (Figure 5), the signals at 4.11 and 4.19 ppm are attributable to CH in the CH2CH(OH)CH2(CF2)5CF3 respectively for the amino group with two fluorinated chains and for the mono-substituted one. In fact, the presence of different integral ratios between the two signals attributable to CH2CH(OH)CH2(CF2)5CF3 agrees with the different molar ratio used between the two reagents (Table 1). This integral ratio, along with the molar ratio of the reagents, allowed the identification of the signals at 4.11 ppm for the presence of amino groups with two fluorinated chains, while the signal at 4.19 ppm can be assigned to the presence of amino groups with only one substituent. Finally, the low signal at 4.25 pm can be attributed to the reaction of the secondary amino group with the epoxide. The gCOSY spectrum (Figure S4) confirms the coupling between both signals at 4.11 or 4.19 ppm and signals between 2.07 and 2.83 ppm, which are attributable to NHCH2CH(OH)CH2(CF2)5CF3 overlapped with the signals ascribable to CH2NH.
On the basis of the preliminary results, the conditions for the reactions between oligoamides and epoxide were selected considering that the starting oligoamides show different solubility in pure alcoholic solvent depending on the monomers present and on the molecular weight. The reaction schemes for the synthesis of ES, EST, and ES are shown in Figure 6. In particular, for oligoamides without tartaric units, 2-propanol was selected as the solvent, while oligoamides containing tartrate units are partially soluble in 2-propanol and soluble in water or a mixture of 2-propanol/water. Consequently, for the products containing tartrate units, the presence of undissolved oligoamide in the synthesis with 2-propanol can cause low conversion. On the contrary, the dissolution of both reactants can be achieved by working with a mixture of 2-propanol/water favoring the conversion. Then mixtures of water and 2-propanol in different ratios (1:1 or 1:3) were tested as a solvent to optimize the conversion, while different oligoamide/epoxide (OA/EC6F) molecular ratios between 1/1 and 1/12 were also studied to obtain different functionalization degrees. The most relevant results are shown in Table 4.
The best reaction conditions resulted in a molar ratio OA/EC6F of 1:4 and heating at 70 °C for 48 h. Using a 2-propanol/water mixture as a solvent in the ratio 3:1, higher conversion and degree of substitution values were obtained compared to the 1:1 ratio. Furthermore, a lower quantity of diol was obtained in the presence of a smaller quantity of water, allowing for better purification. As observed for the synthesis of non-fluorinated oligoamides, the co-products were typically unreacted reagents, except for the reaction performed with 2-propanol/water mixture as a solvent in which the fluorinated diol was also formed.
In the general work-up procedure, the solvent and the excess epoxide were removed by evaporation, and then water was used to wash the residue from the unreacted oligoamide. Finally, cold acetone (−20 °C) was used to wash the residue again in order to remove the diol formed as a byproduct of the reaction between the epoxy and water.
Oligoethylene-L-tartaramide was used as the first oligoamide in order to highlight the influence of the -OH groups of the hydroxylated diacid on the reactivity with EC6F and on the properties of the final product (i.e., solubility, color, physical state). Using 2-propanol as a solvent and an OA:EC6F molar ratio of 1:2, no reaction was observed due the low solubility of the starting oligoamide. Low conversion was also obtained using 2-propanol:water 1:1 as solvent and the same OA/EC6F molar ratio, while a yield of 48% with a degree of substitution of 2.5 was achieved by increasing the concentration of EC6F up to a OA/EC6F molar ratio of 1:4 (Table 4). Unfortunately, the fluorinated product shows a reduced solubility in all common solvents, and ethanol or methanol only dissolves 57% of the reaction solid residue. This behavior makes the product difficult to use for subsequent applications, and for this reason, ethylenediamine was replaced with diethylenetriamine to increase the polarity of the final product. As a result, a slightly higher conversion (56%) was observed compared with a better solubility in alcohol of the fluorinated product (68% instead of 57% of ETF) (Table 4), confirming that the reactivity with the epoxide is mainly controlled by the reduced solubility of the oligotartaramide. The partial solubility of the fluorinated products is attributable to the presence of oligomers with different molecular weight and also with different degrees of functionalization, which give rise to fractions of product with different solubility.
To increase the solubility of the starting oligoamide and fluorinated products in alcoholic solvents, products containing units of succinic or adipic acid together with tartaric acid were synthesized. The reactivity of the ETA or EST oligoamides was subsequently tested with the EC6F epoxide.
Due to the few secondary interactions between the aliphatic chains and the consequent better affinity for the solvent, greater solubility in alcohol is expected for the fluorinated products when using adipic or succinic units.
As reported in Table 4, the best results as conversion were obtained for ESTF. In this synthesis, the reaction was performed in the mixture 2-propanol:H2O with a volume ratio of 1:1 or 1:3 for 48 at 70 °C and with a molar ratio OA:EC6F of 1:4. After the work-up procedure, the final product was obtained as a yellow solid with yields of 61% (in 2-propanol:water 1:1) or 70% (in 2-propanol:water 3:1) and was found to be soluble in 2-propanol or ethanol (8 mg/mL, 1%). However, the milky solution maintained for a long time (typically 1 day) at room temperature easily forms a fine solid. The spectroscopic characterization (1H, gCOSY, 13C, 19F NMR) confirms the presence of fluorinated groups attached to the oligoamide with a degree of functionalization (DS) > 3.5. For this compound, DS was evaluated as the integral ratio between the signal at 4.10 (ascribing to 1H) and 4.47 ppm (ascribing to 2H for an average of 2.18 tartaric units on each oligoamide chain, value obtained by processing NMR data according to the equations reported in Table 3). In the 1H NMR spectrum recorded in CD3OD (Figure 7), the presence of the fluorine chain is confirmed by the signals between 2.10 ppm and 2.80 ppm attributable to CH2 in CH2NHCH2CH(OH)CH2(CF2)5CF3, while the signal at 4.10 ppm is attributable to CH in the fragment CH2CH(OH)CH2(CF2)5CF3, which is formed by the opening of the epoxy group during the reaction with the amino group. The signals ascribable to the hydroxylated oligoamide fragment are also present. The signals present in the 19F NMR spectrum confirm the presence of fluorinated chains (−82.5 (CF3), −122.9, −124.0, −124.6 (CH2(CF2)4CF2CF3) and −127.5 (CH2(CF2)4CF2CF3) ppm).
The presence of succinic units improved the solubility of the final product and it therefore seemed interesting to synthesize the fluorinated derivative of oligoethylenesuccinamide to evaluate the effect of structural variations from an applicative point of view.
The molar ratio between the reagents and the reaction conditions were the same as those used for the ESTF synthesis, but pure 2-propanol was used as a solvent. In fact, the solubility of the starting oligoamides in alcohol increases when the ratio of alkyl groups increases in its structures and when tartaric units are not present. The fluoro-oligoamide ESF was obtained as a white solid with an 89% yield.
The signals in the 1H, 13C, 19F NMR, and gCOSY spectra confirm the presence of fluorinated groups bonded to oligoamide. However, the overlap between numerous signals does not allow an evaluation of the degree of functionalization for this compound, although also in this case, the presence of the signal at 4.11 ppm and the considerations reported on the characterization of the previous fluorinated products (ESTF and DF) allows one to hypothesize the presence of amino groups with two substituent groups and therefore a high degree of functionalization.

3.3. Treatments Evaluation

In this study, a specific protocol was developed to evaluate the efficacy of the synthesized products as hydrophobic agents and to evaluate the usefulness of their use on a highly hydrophilic and inhomogeneous material such as wood. To define the tests for the protocol, the need to obtain preliminary information to optimize the design of a suitable protective was also taken into consideration. However, based on the results obtained in this preliminary phase of the research, it will have to be optimized.
Diagnostic protocols for the evaluation of wood treatment generally concern the field of painted artefacts or preservative products, and are only partially regulated. However, this study aims to evaluate the behavior of materials capable of minimally altering the aesthetic appearance of the wood, but modifying its wettability and moisture content (mainly vapor absorbed to reach equilibrium with environmental humidity). Therefore, this specific diagnostic protocol is intended to be applied to those products that assume high importance in the conservation of materials of historical and artistic interest, such as the compounds developed in this work.
To the best of our knowledge, research in this area has not provided a very extensive previous background and few studies or patents cover this field of interest [8,9,10,11,12,35].
For sake of clarity, we remember that wood is a highly inhomogeneous material whose physical properties change anisotropically and its aesthetic appearance, even for the same wood species, is also affected by its different origin. The properties of wood are also influenced by manufacturing processes and environmental conditions. Consequently, the choice of the wood species, the type of cut and surface processing, and the presence or absence of concentrated extractives on the surface are the parameters that must firstly be taken into consideration for the selection criteria of the samples for the tests. The weight (moisture content variation) and other chemical–physical characteristics are finally influenced by the ambient humidity with which the wood is quickly balanced and a monitor of the behavior as a function of different RH values is also required.
Therefore, to reduce errors in the different measurement tests, and to understand the influence of some of the peculiarities of the wood, we decided to test two types of wood, beech and oak, with the same type of cut, two types of processing (planed and polished), and virgin and pre-extracted samples (i.e., wood extracted in ethanol for the removal of extractives).
On the basis of the data on the solubility in 2-propanol, the oligoamides ETAF, ESTF, ESF, and DF were selected for wood treatments.
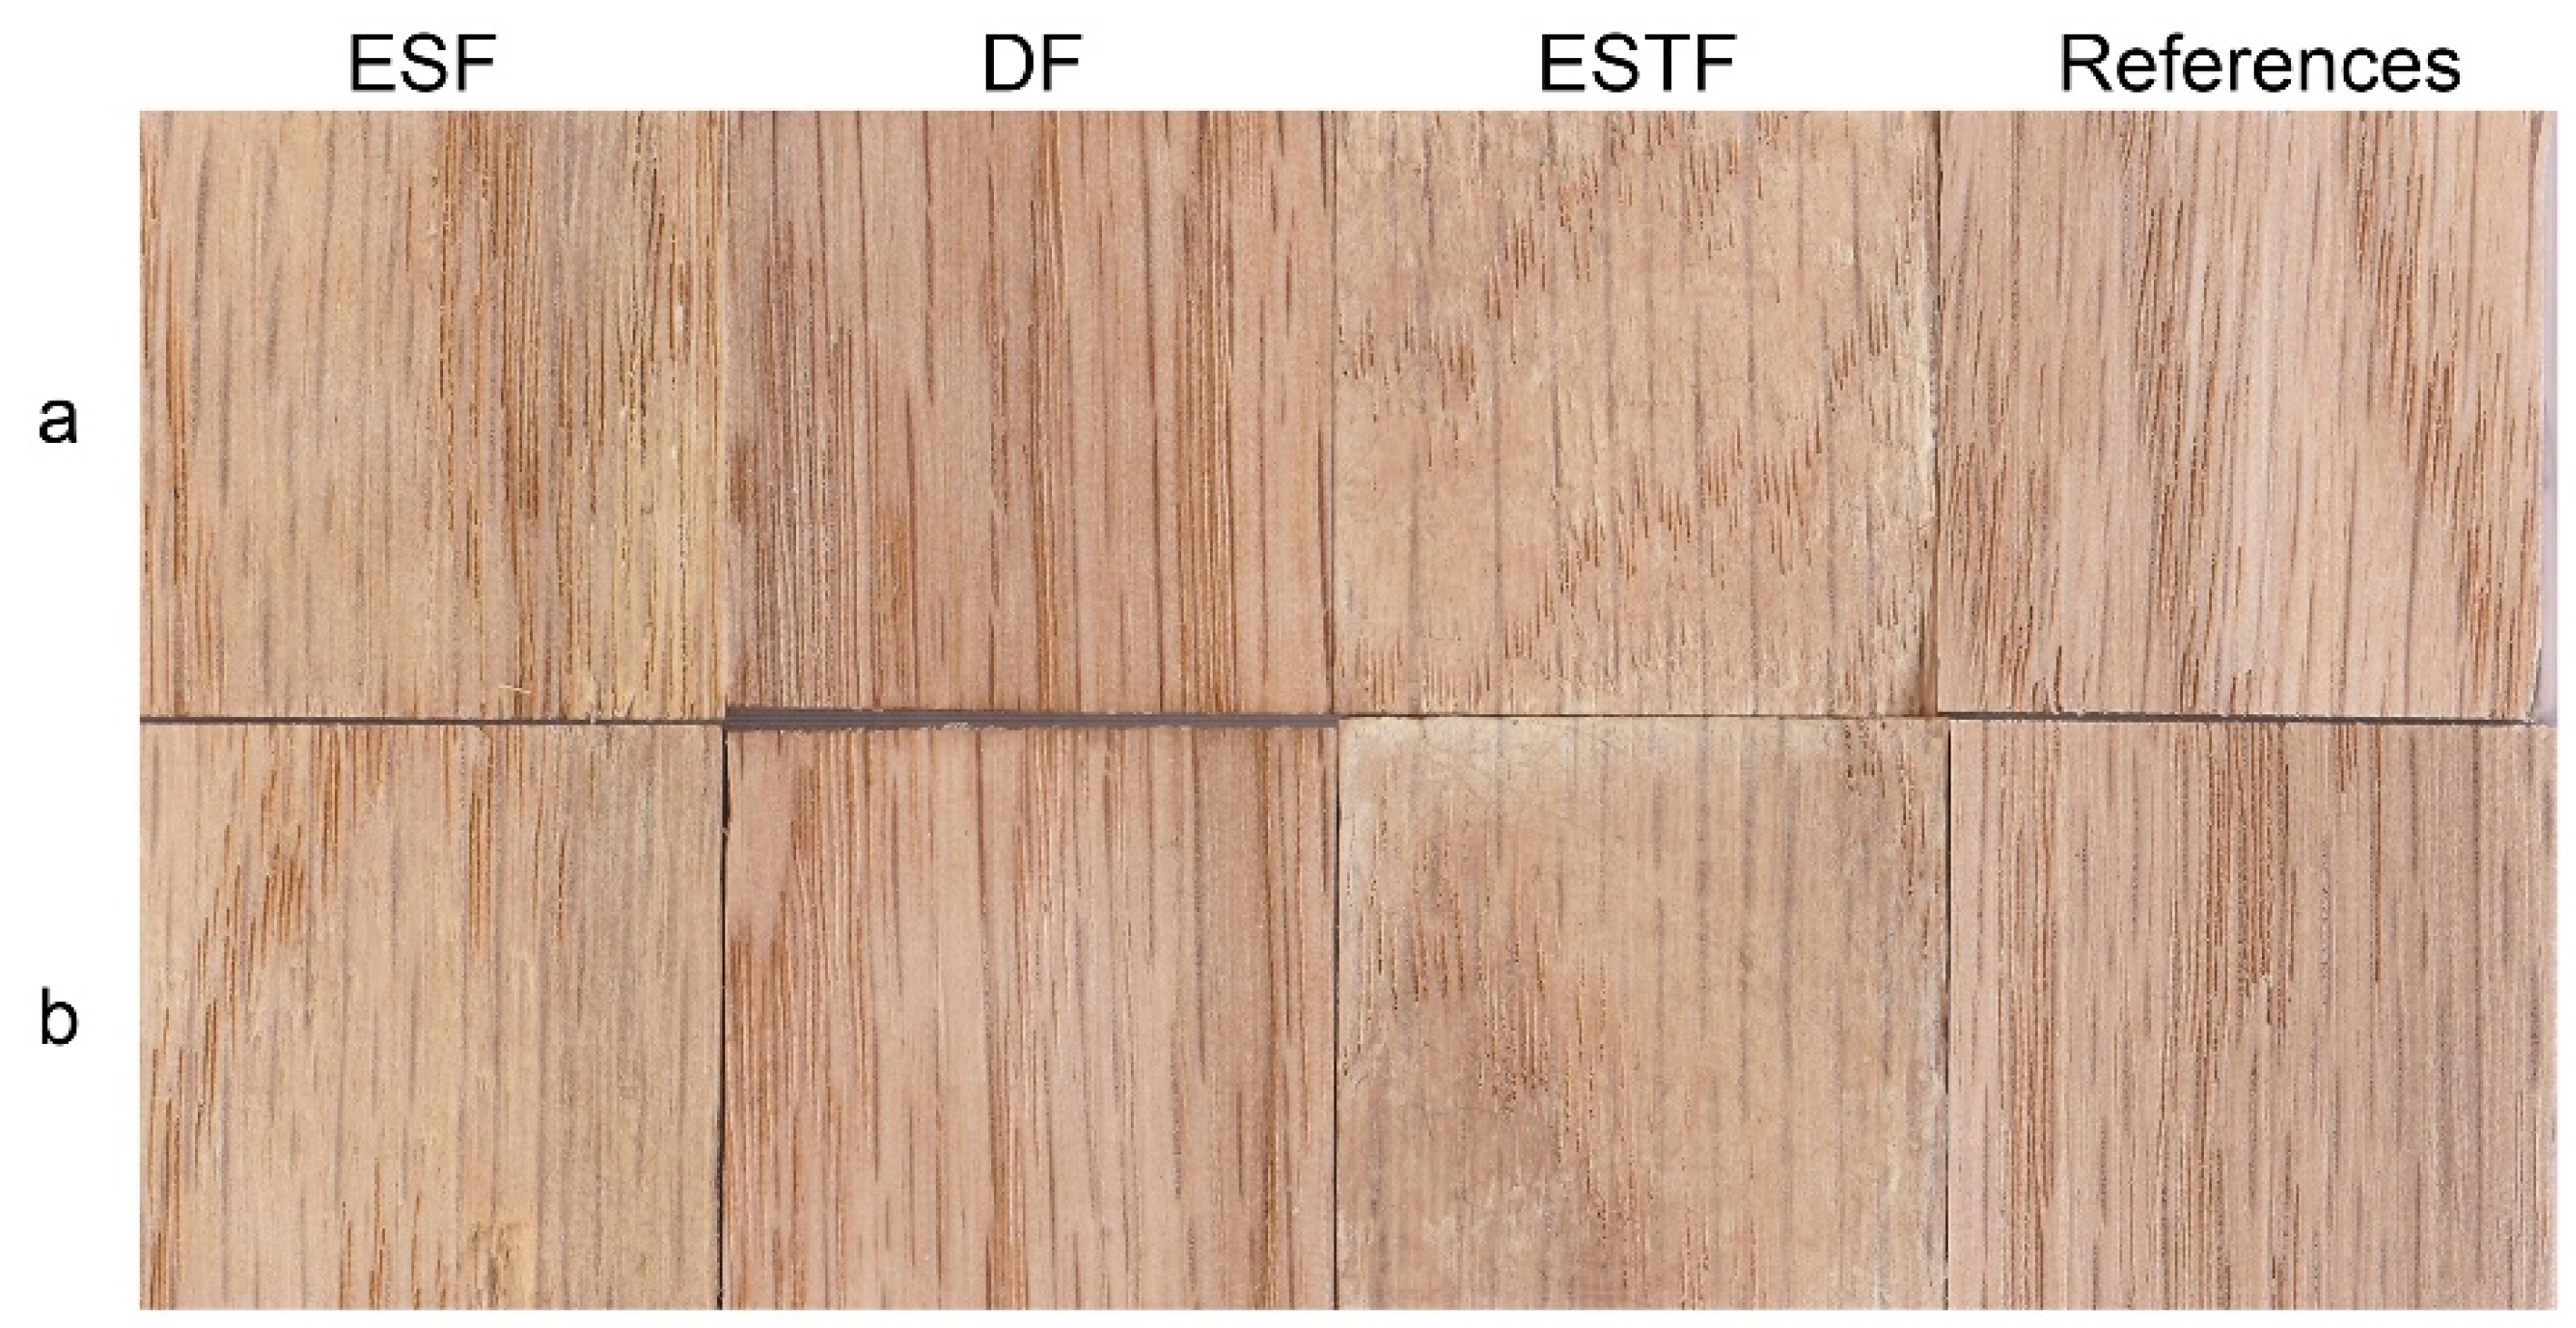
The tested products, as expected and desired, did not show film-forming behavior, but they could vary the aesthetic appearance of the wood from a colorimetric point of view. The surface color variations, performed on the same position of each specimen before and after the treatment and expressed as ∆L*, ∆a*, ∆b*, and ∆E, are reported in Table 5. Only for the samples treated with ESF was the chromatic variation below the detection limit of the human eye (∆E = 3). For the other samples, appreciable chromatic variations mainly influenced by the L* parameter were observed (Table 5). However, it should be noted that the aesthetic appearance of the wood is not significantly altered compared to the typical and variable color of each species for all tested products, as can be seen in Figure 8, where the samples treated with ESF, DF, or ESTF are compared with the wood without a coating as a reference.
The hydrophobic properties of the synthesized compounds were evaluated by detecting the wettability change of the coated wood surface through contact angle (CA) measurements. However, due to the inhomogeneity of wood, as previously mentioned, a great variability of the CA values is expected, even on different areas of the same surface. For this reason, to estimate the degree of variability, preliminary measurements of CA were carried out on both untreated (virgin) and ethanol-extracted (for the removal of extractives) wood samples. As expected, the preliminary measurements obtained on different positions of the same surface of each sample showed a great variability. In fact, the contact angle of the uncoated wood, evaluated after one second from the deposition of the water drop, varied between 50° and 105°, whether the measurement was performed in different positions of the same sample or on different samples of the same wood species. After 5 s from the deposition of the water drop, the CA becomes generally non-evaluable. These results confirm the need to adopt the strategy of always measuring the contact angle in the same area (before and after the coating) to obtain reliable data on the hydrophobic effect of the protective agent. Moreover, to provide statistical data, at each step of the test (i.e., before coating, after coating, or after aging), it is necessary to repeat the CA measurement several times, in different moments and after the complete evaporation of the previous drop.
Furthermore, the wood extractives could influence the CA values. In fact, the extraction treatment with ethyl alcohol decreased the natural hydrophobicity of wood attributable to the presence of extractives on the surface. For a reference oak sample, the contact angle changed from 105.9° ± 1.2° to 84.5° ± 0.9°, after extraction in ethanol. As these compounds are soluble in alcohols, their dissolution and migration during the application of the alcoholic solution of the coating is expected. For this reason, some coatings were also applied to oak wood after extraction with alcohol. Similar to the extraction treatment, a decrease in the contact angle can be observed after abrasion of the surface (59.2° ± 0.1°), while the simultaneous abrasion and extraction with alcohol determines a contrasting effect of the two actions on wettability (69.3° ± 1.1°). In fact, the abrasion of the wood surface likely removes the extractives concentrated on the surface, while it can expose a new surface where the extractives were not completely removed during the extraction process. Furthermore, abrasion with varying roughness can influence the hydrophobic behavior of the surfaces. Finally, it is necessary to consider the natural variability of the wood when different samples are used as a reference. In all cases, after extraction with alcohol and/or abrasion, the values of the contact angles are considerably lower than those of raw wood and always less than 90°.
Based on these observations, the comparison of the performance between different products was carried out in the following conditions: (a) by using wood samples with or without the preliminary extraction with ethanol; (b) by evaluating the CA several times, over time, in a well-defined position of each sample after 1 and 5 s. In the end, a final evaluation of the CA was carried out after 8 min, although this measurement could be affected by the minimal evaporation of water. The results are reported in Table 6.
Treatment with fluorinated oligoamides containing tartaric unit show low CA values, always lower than 90° and generally lower than the initial value of the wood sample before treatment. This result highlights a negative effect of the presence of hydroxyl groups on the oligoamide chain, which can be attributed to a concomitant hydrophilic effect or to a greater ability to penetrate into the surface layers of the wood. In the latter case, the greater affinity with the polysaccharides constituting the wood instead of favoring the anchoring on the surface would favor its penetration and/or do not favor the distribution of fluorinated fragment towards the outside. The use of 2-propanol as a solvent for the deposition can also act on the surface of the wood favoring the migration of the extractives if not previously removed.
On the contrary, after treatment with ESF and DF, the wood samples show higher contact angle values, with a greater increase in the contact angle for the samples pre-treated with ethanol. The best hydrophobicity was founded in the sample without pre-treatment with ethanol and treated with ESF (138.2°). The presence of a non-functionalized NH group in the DF compound can favor anchoring to the support, but could reduce the hydrophobicity deriving from the presence of the fluorinated chain. However, the values obtained without pre-extraction in ethanol are around 132°. It is interesting to observe the comparison of these data with the contact angle observed in the presence of a commercial product such as Paraloid B72, a product widely used in the Cultural Heritage field. The application of equal amounts of product under the same conditions used for the fluorinated products shows a contact angle of (66 ± 4)° on wood as it is, and (63 ± 4)° on wood pre-extracted with ethanol. With this acrylic product, the color variation is relatively low (ΔE respectively 2.3 and 4.3), but the poor stability of the product reduces the interest in acrylic products.
After 5 s from the deposition of the water drop, a significant change in the contact angle is observed for samples with hydrophilic behavior (ϑc < 90°) compared to those with initial ϑc > 90°, in agreement with the hydrophobic properties and a reduced ease of water absorption of the wood specimens coated with ESF and DF. Finally, the contact angle was assessed after 8 min, but it was only possible for the treatments with ESF and DF.
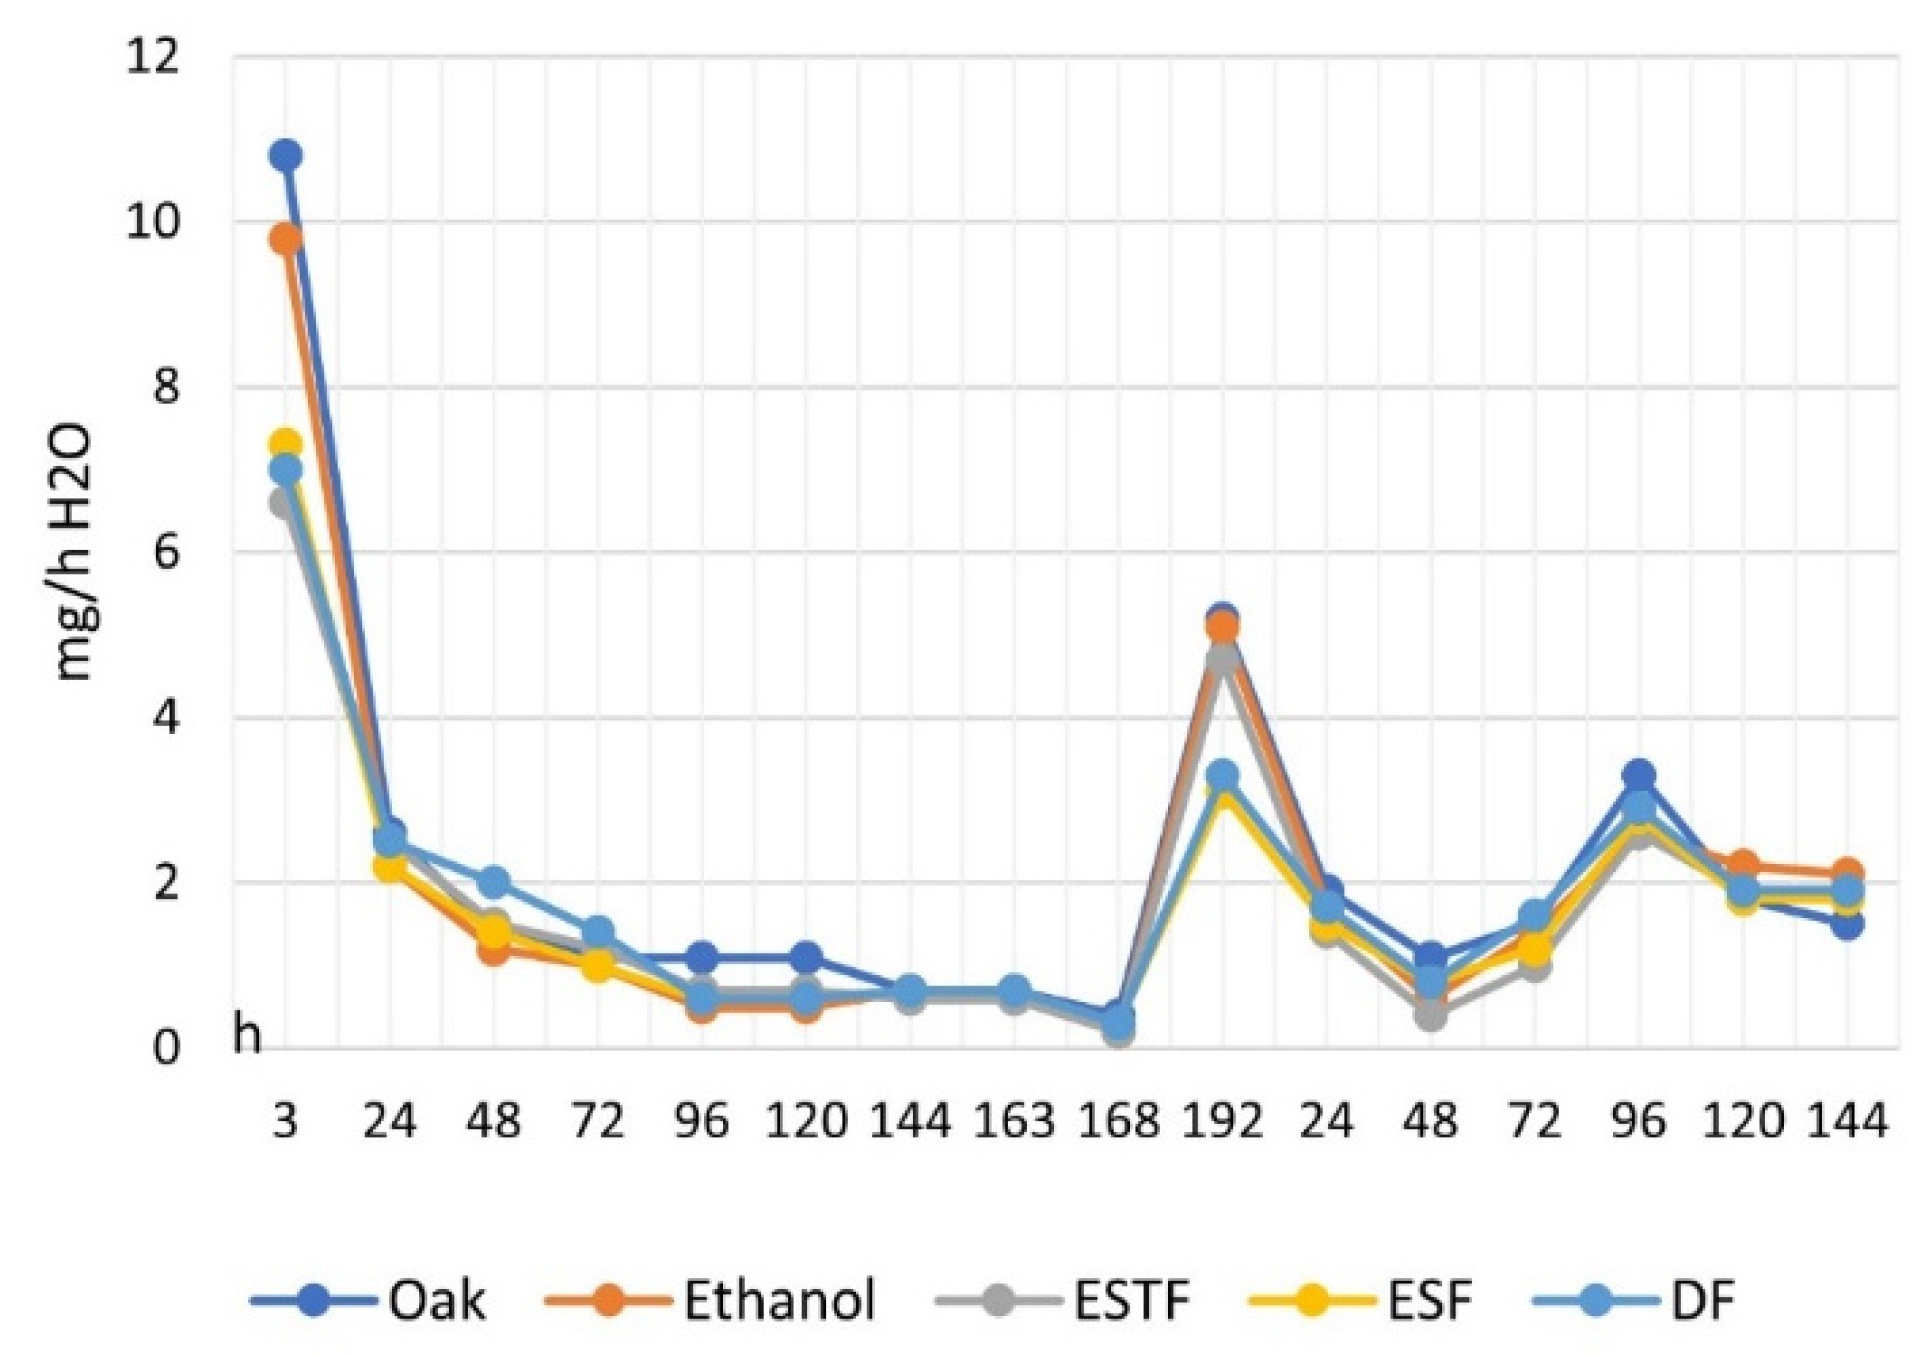
The water vapor absorption test was performed using oak wood samples treated with ESTF, ESF, and DF on all surfaces with a suitable quantity of product to completely cover them (40 g/m2). All of the samples were preliminarily extracted in ethanol, and after coating, they were kept in a desiccator for 72 h until a constant weight was reached. The weight variations observed by keeping the coated samples in the presence of progressively increasing humidity values (RH 65%, 86%, and 100%) were compared with those obtained in similar uncoated samples (one raw and one pre-extracted). For all humidity values, high water absorption is observed in the initial phase, which progressively decreases to zero in correspondence with the reached equilibrium, with a higher absorption rate on anhydrous samples (uncoated samples) (
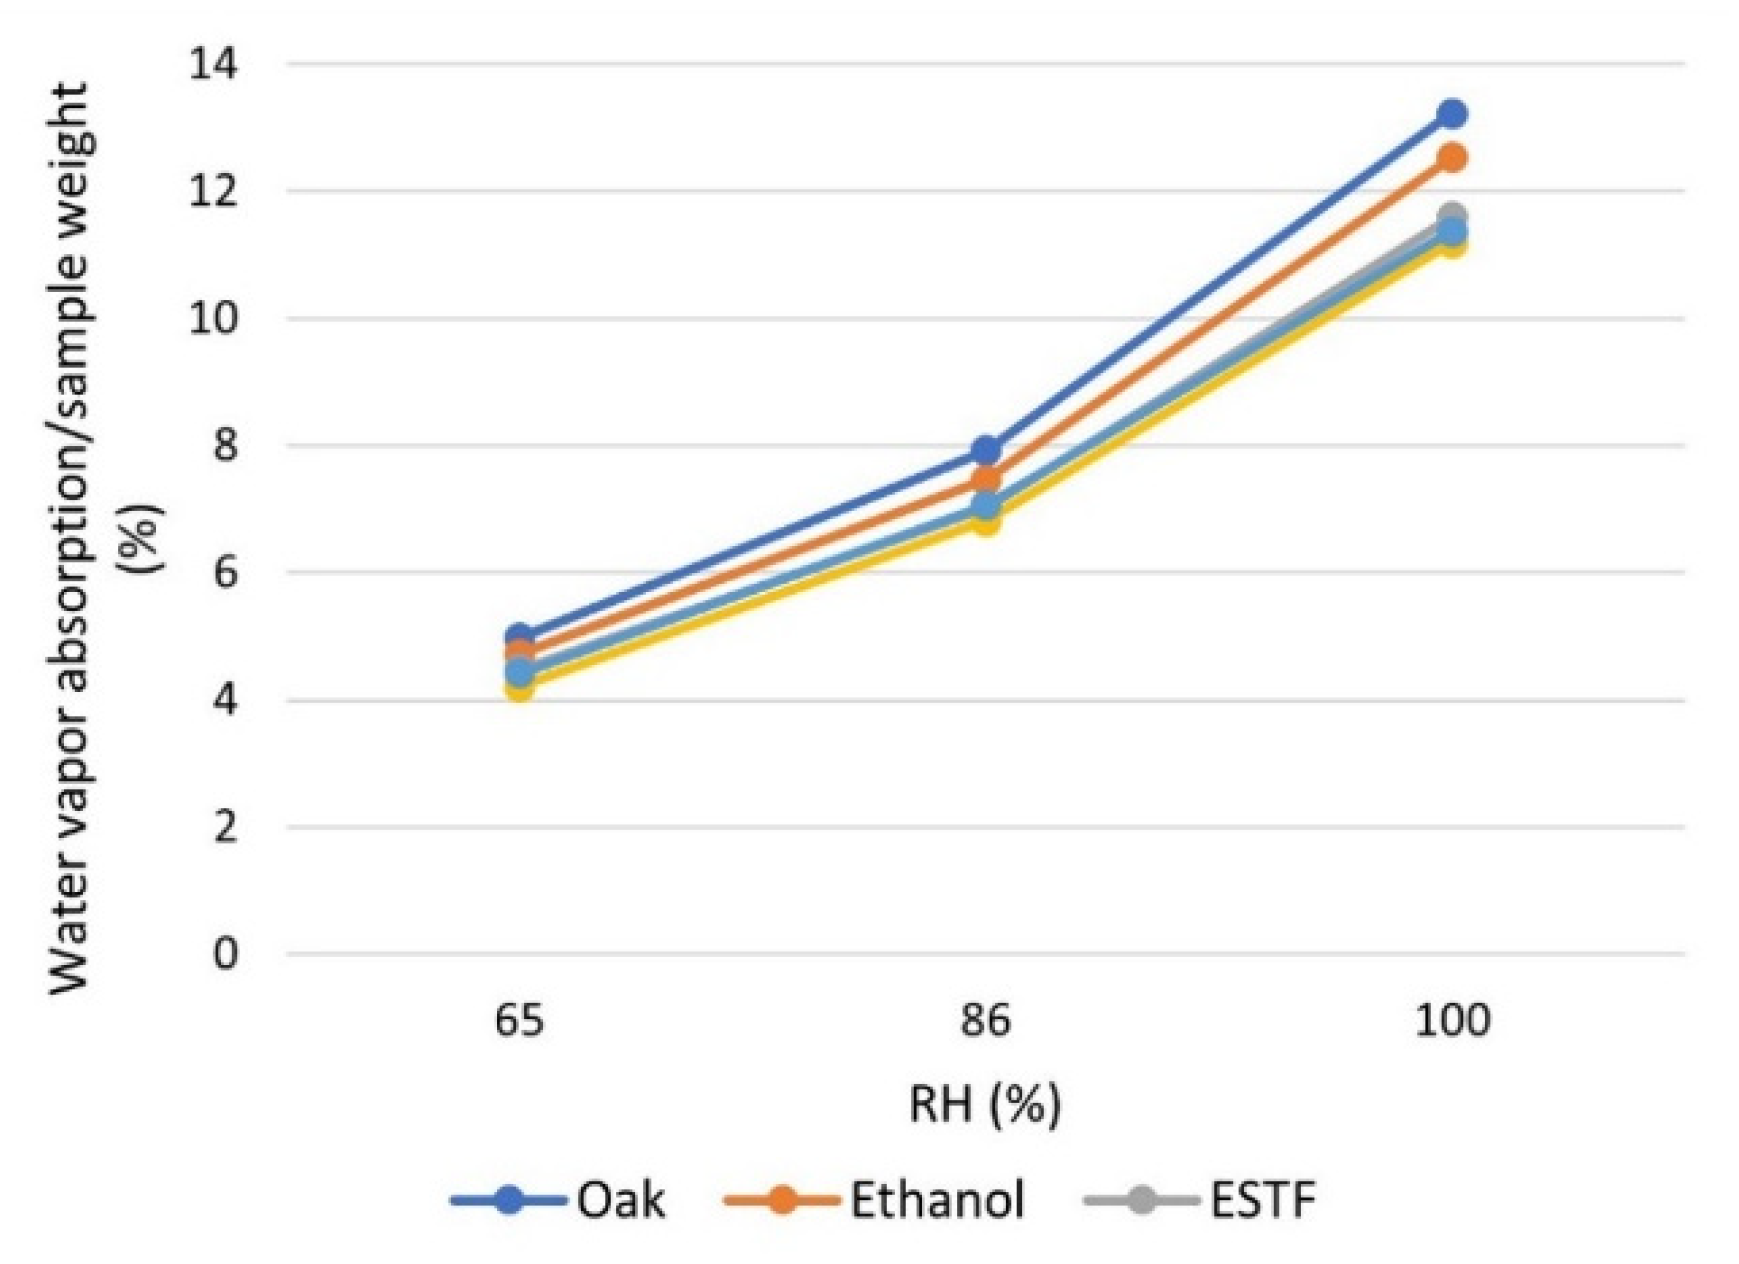
Figure 9). The mass of water absorbed per unit mass of the specimen is lower for the samples coated with the fluorinated products, in the order ESF < DF < ESTF, compared to the one observed in the uncoated wood, with or without pre-extraction in ethanol (Table 7 and Figure 10).
The increase in the surface wettability of wood (i.e., lower CA, Table 6) and the reduction in vapor absorption (i.e., lower mass of vapor absorbed, Table 7) for the specimens extracted in ethanol, compared to the raw wood, can be explained with the removal of saccharide components and other compounds. The extraction in ethanol of saccharide components of different complexity is confirmed both by 1H-NMR (Figure S37), for the presence of the signals attributable to the saccharide skeleton at 3.40–4.00 ppm, and by FT-IR (Figure S38), for the signals at 3390 (O–H stretching), 1113, 1076, 1049 cm−1 (C–O stretching). Low-intensity signals at 2927 (C–H stretching) and 1732 cm−1 (C=O stretching), attributable to the presence of triglycerides and/or free fatty acids, were also present in the FT-IR spectrum. A different mobility of the various extractive components can be speculated, which can determine a lower concentration of hydrophobic components (e.g., triglycerides, free fatty acids) on the surface after extraction with ethanol, while the saccharide components are probably removed mainly from the wood mass, thus reducing its affinity towards water.
Finally, the stability of the synthetic partially fluorinated oligoamides and amine, deposed on glass slides, was estimated by means of accelerated aging tests exploiting UV radiations (wavelength of 365 nm). Their behavior was followed via 1H NMR, FT-IR spectroscopy and colorimetric measurements. The weight change was also recorded, in order to monitor the decomposition or oxidation (mainly absorption of oxygen) reactions.
The colorimetric measurements were made before and after irradiation to evaluate the color variations due to the interaction between the partially perfluorinated compounds and the UV radiation. No appreciable weight changes were noted for any product. The results of the colorimetric measurements on UV irradiated glass slices are shown in the Table 8.
DF, which contains diethylenetriamine units, shows the highest ΔE* (9.14) after 254 h of irradiation among the three irradiation products tested, and is much higher than the threshold limit imperceptible to the human eye (ΔE* = 3). In particular, DF has a significant increase in Δb*, which means the samples turned yellow under UV radiations. On the contrary, both ESF and ESTF, which contain ethylenediamine units, show ΔE* and Δb* values around 1.
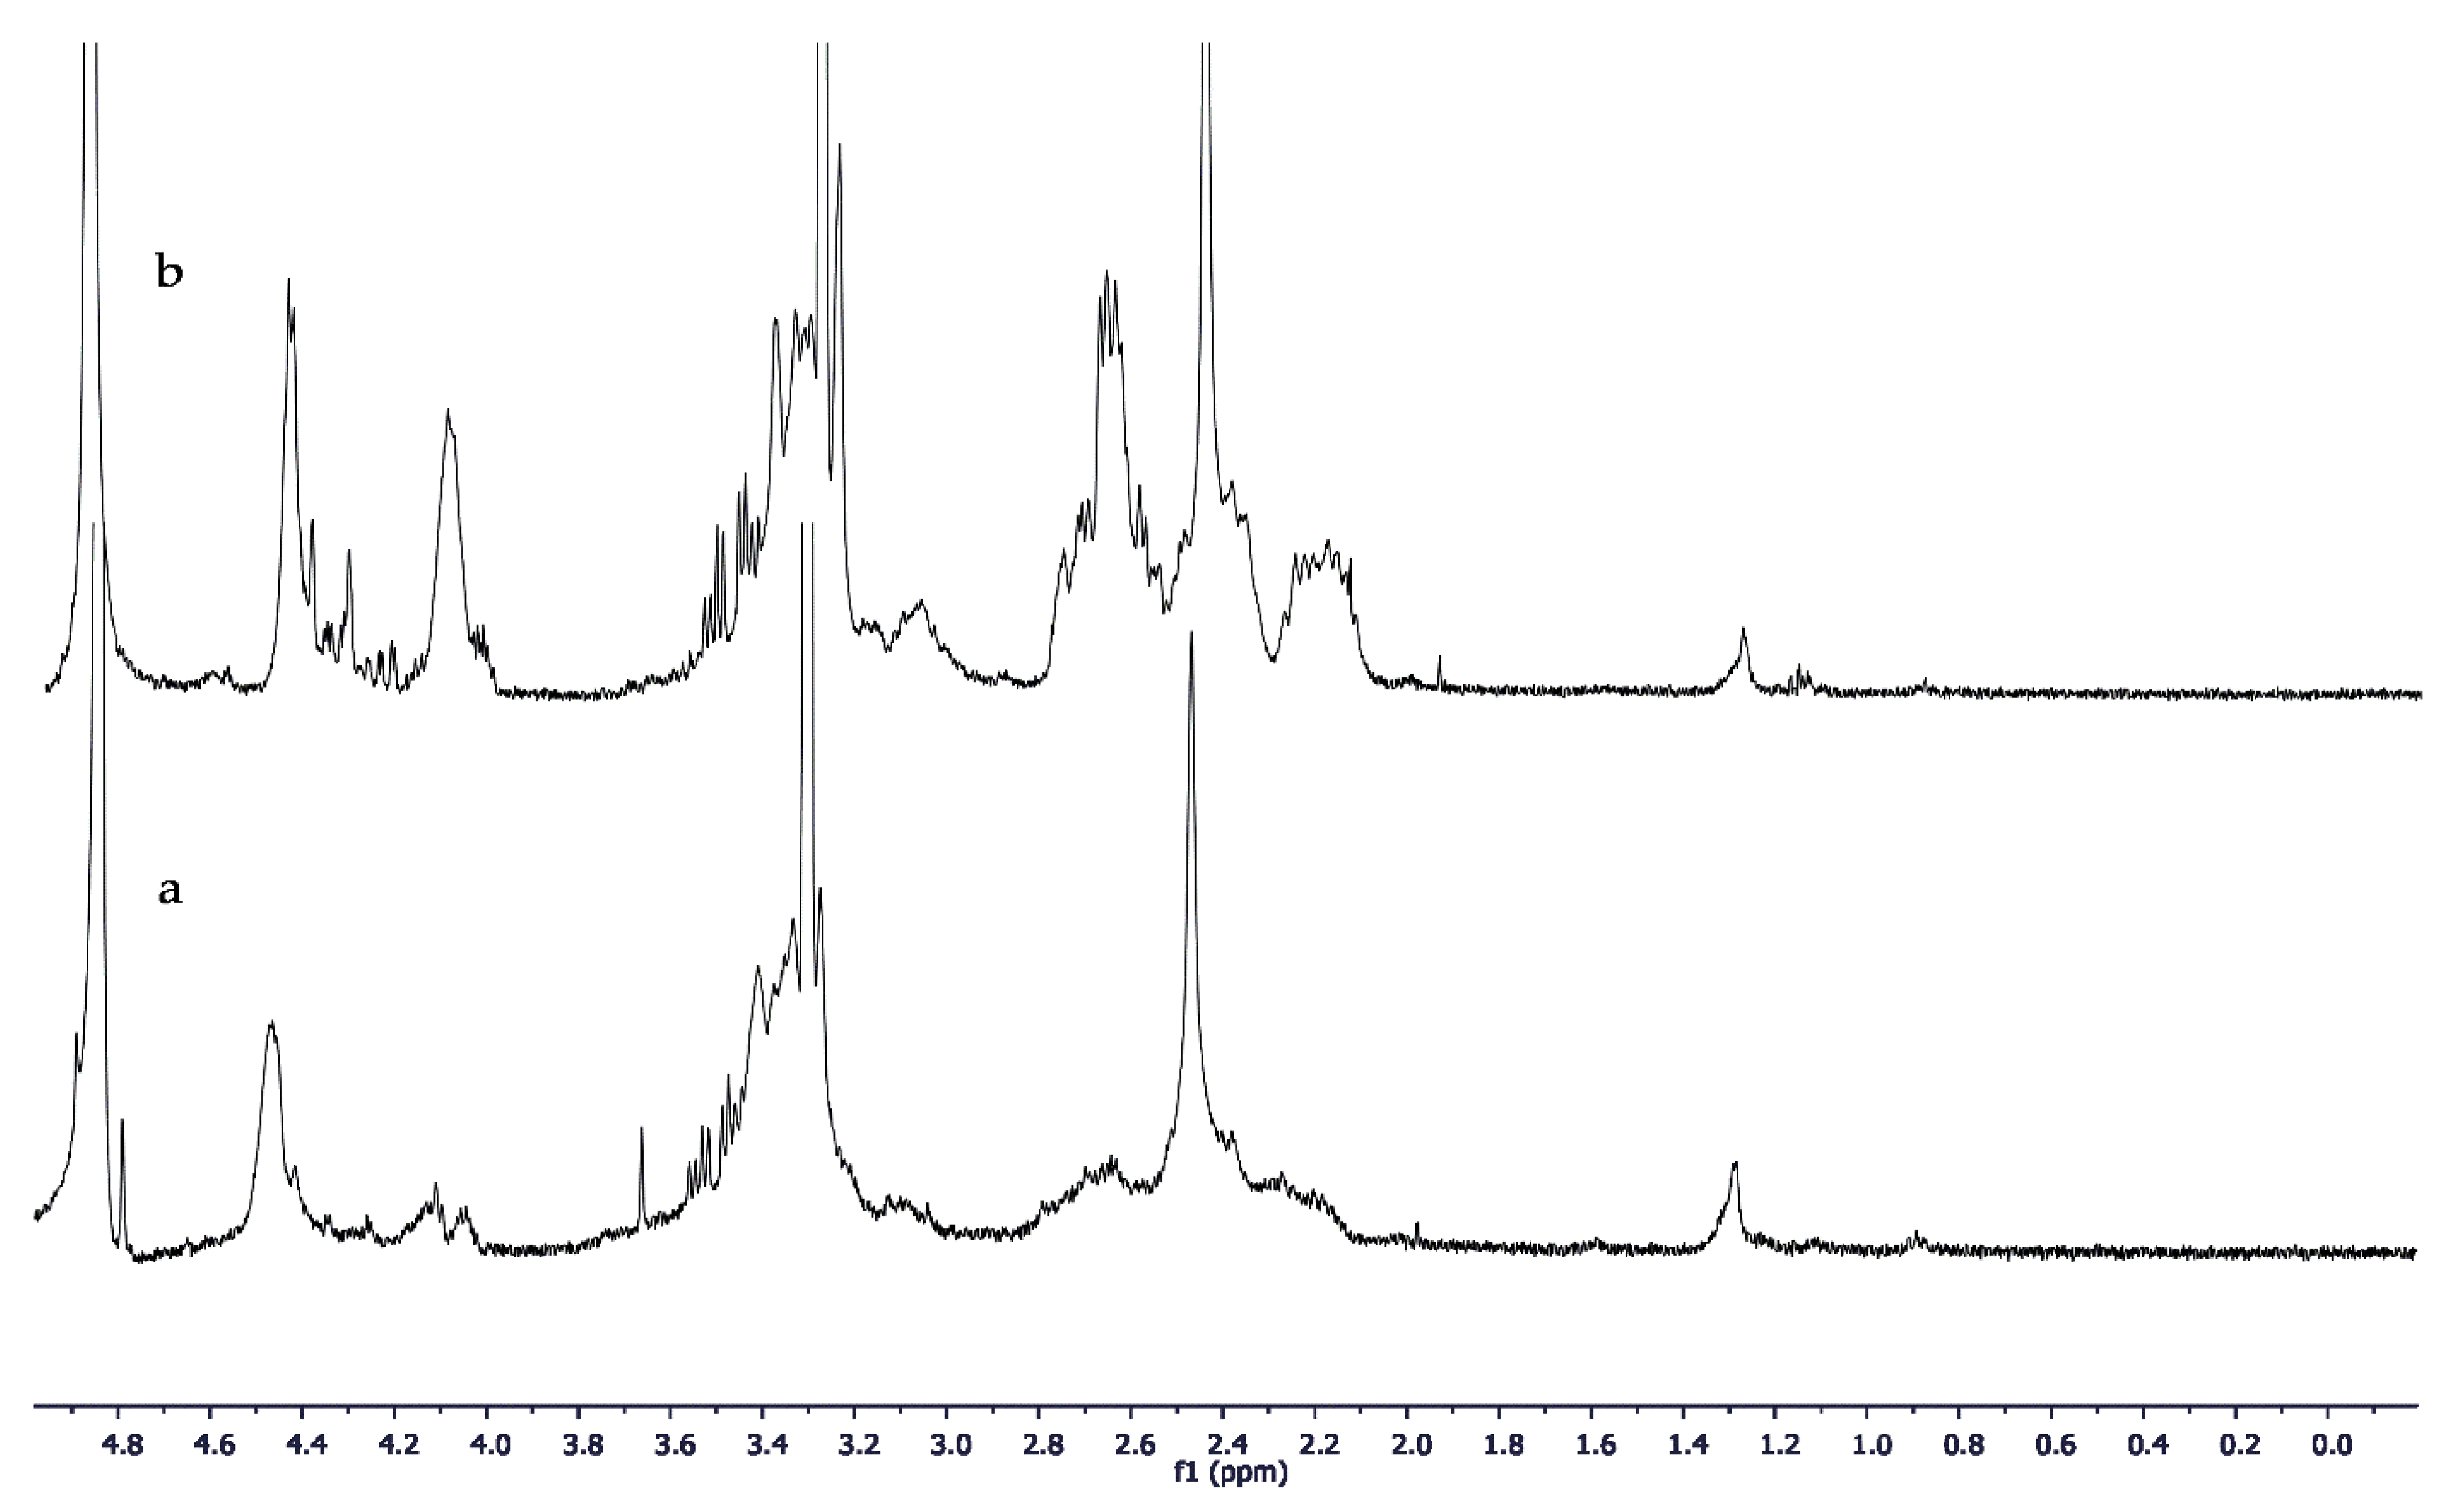
The FT-IR and the 1H NMR spectra of ESF after irradiation do not show changes, while the FT-IR of the irradiated ESTF displays slight shifts of the signals at about 3300 cm−1 (–OH and –NH stretching) and 1550 cm−1 (–NH bending, Amide II) compared to the non-irradiated ESTF. This modification may be justified with hydrogen bonding involving mainly –OH and –NH groups. ESTF did not show a significant yellowing after irradiation; however, in the 1H NMR spectrum, the reduction of signal intensity to 4.11 ppm and of signals between 2.6 and 3.0 ppm were observed (Figure 11). These variations, as for the FT-IR results, are in agreement with a reduction in solubility due to hydrogen bonds between the OH and NH groups present in the compound.
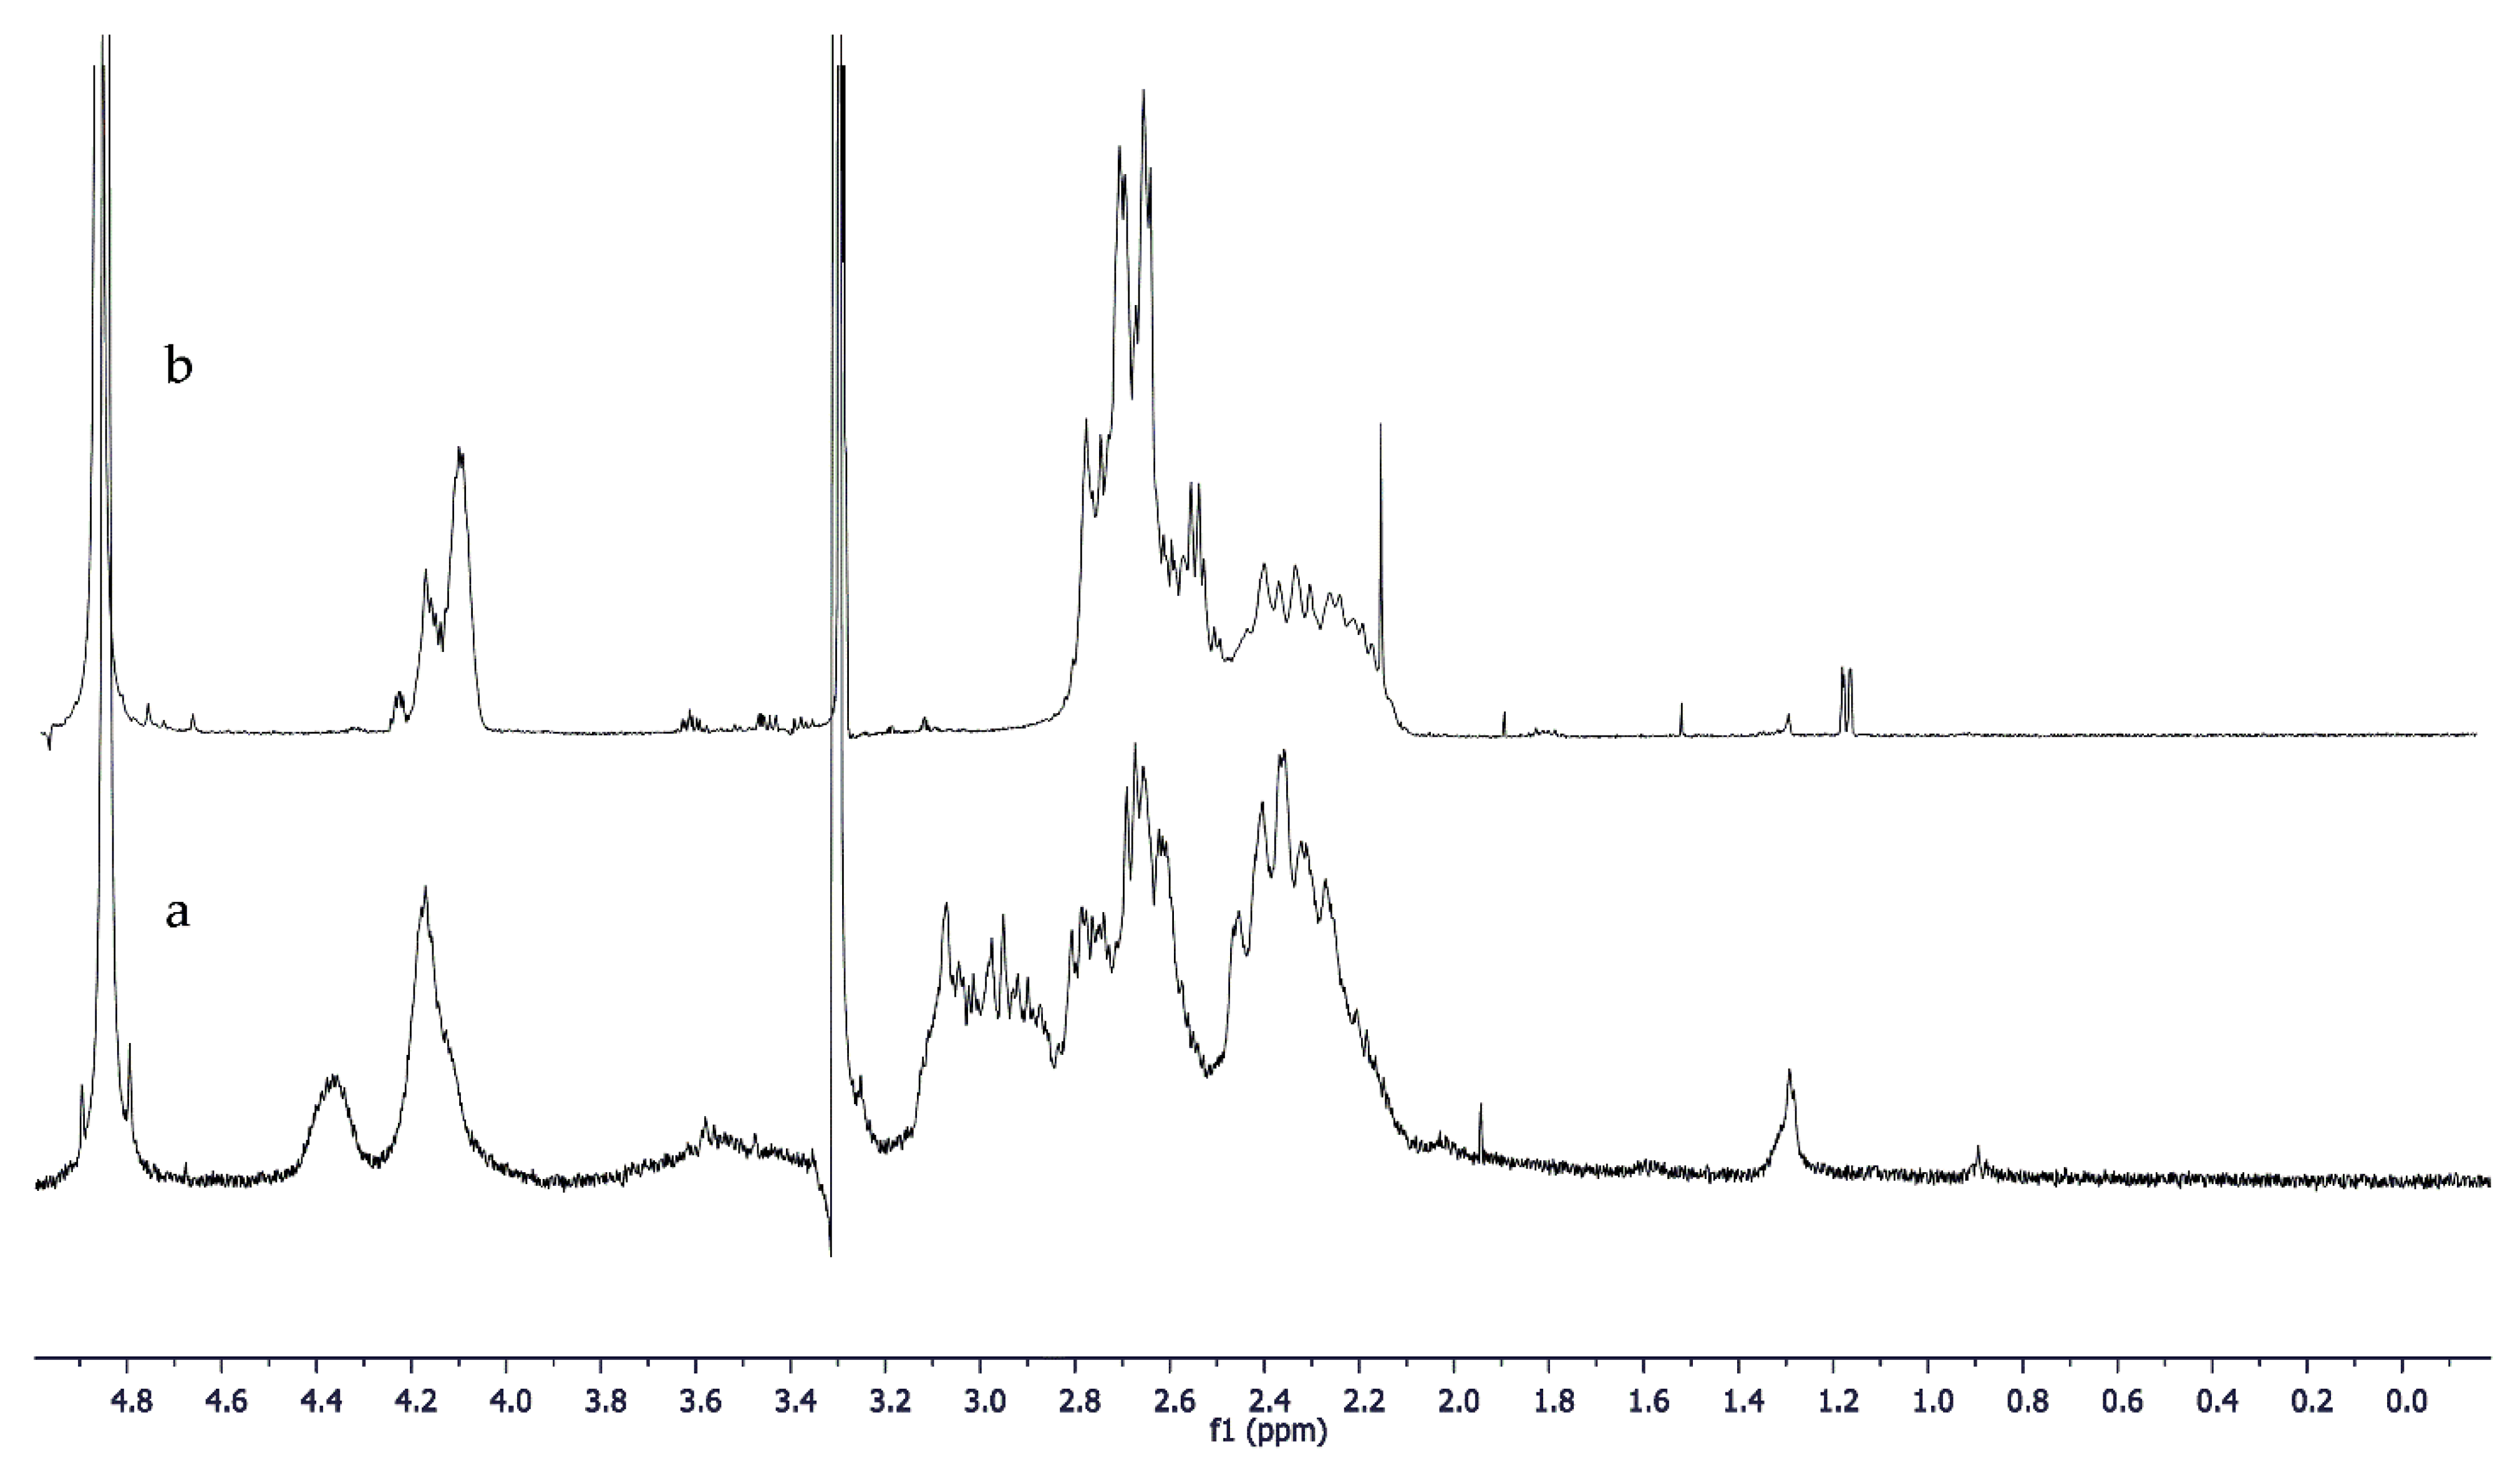
The FT-IR spectrum of irradiated DF (Figure S39) shows changes mainly in the region 1600–1700 cm−1, probably attributable to a partial oxidation on the triamine units. In the 1H NMR spectrum (Figure 12), the variation of the shape and relative intensity of the signals of CHNH in the 2–3 ppm zone can be observed. In particular, a new signal at 3.0 ppm appeared and the shape of the original CHNH area also changed.

4. Conclusions

New fluorinated oligoamides and a diethylenetriamine derivative were successfully synthesized using 3-perfluorohexyl-1,2-epoxypropane. A shorter length of the fluorinated segment, compared to similar compounds previously studied as protective agents for stone, was used to minimize the risk of bioaccumulation with a consequent reduced impact on the environment. The influence of different monomer units, deriving from diacids and polyamines of different complexity, on reactivity, solubility, and hydrophobic properties was studied by comparing different oligoamides. The effectiveness of the new products as protective agents for wood was studied by developing a diagnostic protocol capable of rapidly providing information on some specific properties given to wood surfaces (i.e., hydrophobicity, water vapor uptake, color) in order to refine the design of new tailored materials.
All new synthesized compounds, soluble in 2-propanol, were tested as wood protective coatings, analyzing the variations in color and contact angle of the water drop. The best results were obtained with ESF, while DF, which also shows good hydrophobicity, provides a visible colorimetric variation, even if aesthetically acceptable for a wooden component.
On the contrary, the oligoamides containing the tartaric units show low contact angles. However, if the water drop is monitored on time, the value of the CAs decreased more slowly than that calculated on wood without treatment, which is in agreement with a reduced absorption capacity.
The absorption of water vapor in controlled humidity conditions in the presence of the protective coatings shows a reduction both in the speed of reaching equilibrium and in the mass of water absorbed with an efficiency that improves in the order ESTF < DF < ESF.
The comparison of the behavior of the wood with and without pre-extraction in ethanol highlighted the difficulty of applying a diagnostic protocol due to the heterogeneity of the samples. Reliable results were obtained by introducing some targeted changes to the protocol to favor the optimization of the measurements. The different type of wood (oak or beech) does not seem to influence the protective efficacy, which is, instead, influenced by the presence of extractives on the surface. However, the color variations are influenced not only by the chosen wood, but also by the area from which the samples were obtained from the same piece of wood. Aging by UV irradiation allowed the highlighting of greater stability for the ESF compound, which is confirmed as the best protective agent for wood. ESTF and DF showed lower photostability: indeed, ESTF reduced the solubility, while DF turned yellow.

Supplementary Materials

The following supporting information can be downloaded at: https://www.mdpi.com/article/10.3390/coatings12070927/s1, Synthesis of oligoethylene-L-tartaramide (ET) and its fluorinated derivative (ETF); Synthesis of oligodiethylenetriamino-L-tartaramide (DT) and its fluorinated derivative (DTF); Synthesis of oligoethylene-adipamide-L-tartaramide (ETA) and its fluorinated derivative (ETAF); Figure S1: 1H NMR spectrum in CD3OD of diol obtained from the reaction of EC6F with water; Figure S2: 1H NMR spectrum in CD3OD of EC6F; Figure S3: 1H NMR spectrum in CD3OD of DF; Figure S4: gCOSY NMR spectrum in CD3OD of DF; Figure S5: 19F NMR spectrum in CD3OD of DF; Figure S6: 13C NMR spectrum in CD3OD of DF; Figure S7: FT IR spectrum of ET; Figure S8: 1H NMR spectrum in D2O of ET; Figure S9: 13C NMR spectrum in D2O of ET; Figure S10. 1H NMR spectrum in CD3OD of ETF (methanol-soluble fraction); Figure S11: 19F NMR spectrum in CD3OD of ETF; Figure S12: FT IR spectrum of DT; Figure S13: 1H NMR spectrum in D2O of DT; Figure S14: 13C NMR spectrum in D2O of DT; Figure S15: 1H NMR spectrum in CD3OD D of DTF; Figure S16: gCOSY NMR spectrum in CD3OD of DTF; Figure S17: 19F NMR spectrum in CD3OD of DTF; Figure S18: FT IR spectrum of ETA; Figure S19: 1H NMR spectrum in D2O of ETA; Figure S20: 13C NMR spectrum in D2O of ETA; Figure S21: 1H NMR spectrum in CD3OD of ETAF (ethanol-soluble fraction); Figure S22: gCOSY NMR spectrum in CD3OD of ETAF (ethanol-soluble fraction); Figure S23: 19F NMR spectrum in CD3OD of ETAF; Figure S24: 1H NMR spectrum in D2O of EST; Figure S25: 13C NMR spectrum in D2O of EST; Figure S26: 1H NMR spectrum in CD3OD of ESTF; Figure S27: gcosy NMR spectrum in CD3OD of ESTF; Figure S28: 19F NMR spectrum in CD3OD of ESTF; Figure S29: 13C NMR spectrum in CD3OD of ESTF; Figure S30: 1H NMR spectrum in D2O of ES; Figure S31: 13C NMR spectrum in D2O of ES; Figure S32: 1H NMR spectrum in CD3OD of ESF; Figure S33: gCOSY NMR spectrum in CD3OD of ESF; Figure S34: 19F NMR spectrum in CD3OD of ESF; Figure S35: 13C NMR spectrum in CD3OD of ESF; Figure S36: gHSQC NMR spectrum in CD3OD of ESF; Figure S37: 1H NMR spectrum in CD3OD of the products extracted in ethanol from oak samples; Figure S38: FT-IR spectrum in CD3OD of the products extracted in ethanol from oak samples; Figure S39: FT-IR spectra of DF before (black) and after (red) UV aging; Figure S40: 1H NMR spectra of DF before (up) and after (down) aging; Figure S41: FT-IR spectra of ESTF before (black) and after (red) UV aging; Figure S42: 1H NMR spectra of ESTF before (down) and after (up) aging; Figure S43: FT-IR spectra of ESF before (black) and after (red) UV aging; Figure S44: 1H NMR spectra of ESF before (down) and after (up) aging.

Author Contributions

Conceptualization, A.S. and M.C.; methodology, A.S. and M.C.; formal analysis, Y.Z., L.B. and L.V.; investigation, Y.Z., L.B., L.V. and M.G.B.; resources, A.S., N.L.-G. and M.C.; data curation, A.S., M.C., Y.Z. and L.V.; writing—original draft preparation, A.S. and M.C.; writing—review and editing, A.S., L.V., Y.Z., N.L.-G. and M.C.; supervision, A.S., M.C. and N.L.-G.; project administration, A.S., M.C. and N.L.-G.; funding acquisition, A.S., M.C. and N.L.-G. All authors have read and agreed to the published version of the manuscript.

Funding

This research received no external funding.

Institutional Review Board Statement

Not applicable.

Informed Consent Statement

Not applicable.

Data Availability Statement

Not applicable.

Acknowledgments

We thank MIUR-Italy (“Progetto Dipartimenti di Eccellenza 2018–2022” for the funds allocated to the Department of Chemistry “Ugo Schiff”) and Laboratorio Congiunto VALORE and REGIONE TOSCANA (PAR FAS 2007–2013 projects).The authors thank Benedetto Pizzo for supplying wood samples.

Conflicts of Interest

The authors declare no conflict of interest.

References

  1. Unger, A.; Schniewind, A.P.; Unger, W. Conservation of Wood Artefacts; Springer: Berlin/Heidelberg, Germany, 2001. [Google Scholar]
  2. Hunt, D. Properties of wood in the conservation of historical wooden artifacts. J. Cult. Herit. 2012, 13S, S10–S15. [Google Scholar] [CrossRef]
  3. Evans, P.D.; Banks, W.B. Degradation of wood surfaces by water: Weight losses and changes in ultrastructural and chemical composition. Holz Roh- Werkstoff 1990, 48, 159–163. [Google Scholar] [CrossRef]
  4. Reinprecht, L. Biological Degradation of Wood. In Wood Deterioration, Protection and Maintenance; John Wiley & Sons: Hoboken, NJ, USA, 2016. [Google Scholar]
  5. Kalita, K.; Boruah, P.K.; Sarma, U. Studies on change of strain developed in different wood samples due to change in relative humidity. Sens. Bio-Sens. Res. 2019, 22, 100264. [Google Scholar] [CrossRef]
  6. Freeman, M.H.; Shupe, T.F.; Vlosky, R.P.; Barnes, H.M. Past, present and future of the wood preservation industry. For. Prod. J. 2003, 53, 8–15. [Google Scholar]
  7. Mai, C.; Militz, H. Modification of wood with silicon compounds. Treatment systems based on organic silicon compounds—A review. Wood Sci. Technol. 2004, 37, 453–461. [Google Scholar] [CrossRef]
  8. Chen, Y.; Wang, H.; Yao, Q.; Fan, B.; Wang, C.; Xiong, Y.; Jin, C.; Sun, Q. Biomimetic taro leaf-like films decorated on wood surfaces using soft lithography for superparamagnetic and superhydrophobic performance. J. Mater. Sci. 2017, 52, 7428–7438. [Google Scholar] [CrossRef]
  9. CN1883897B; Wood Protective Agent. Jingjiang Guolin Wood Co., Ltd.: Jingjiang, China, 2010.
  10. Lu, X.; Hu, Y. Layer-by-layer deposition of TiO2 nanoparticles in the wood surface and its superhydrophobic performance. Bioresources 2016, 11, 4605–4620. [Google Scholar] [CrossRef]
  11. Papadopoulos, A.N.; Taghiyari, H.R. Innovative Wood Surface Treatments Based on Nanotechnology. Coatings 2019, 9, 866. [Google Scholar] [CrossRef] [Green Version]
  12. Wang, Z.; Shen, X.; Qian, T.; Wang, J.; Sun, Q.; Jin, C. Facile Fabrication of a PDMS@Stearic Acid-Kaolin Coating on Lignocellulose Composites with Superhydrophobicity and Flame Retardancy. Materials 2018, 11, 727. [Google Scholar] [CrossRef] [Green Version]
  13. Charola, A.E. Water Repellents Treatments for building stones: A practical overview. Apt. Bull. 1995, 26, 10–17. [Google Scholar] [CrossRef]
  14. Tabasso, L.M. Acrylic polymers for the conservation of stone: Advantages and drawbacks. APT Bull. 1995, 26, 17–21. [Google Scholar] [CrossRef]
  15. Chiantore, O.; Lazzari, M. Photo-oxidative stability of paraloid acrylic protective polymers. Polymer 2001, 42, 17–27. [Google Scholar] [CrossRef]
  16. Melo, M.J.; Bracci, S.; Camaiti, M.; Chiantore, O.; Piacenti, F. Photodegradation of acrylic resins used in the conservation of stone. Polym. Degrad. Stab. 1999, 66, 23–30. [Google Scholar] [CrossRef]
  17. Charola, A.E.; Tucci, A.; Koestler, R.J. On the Reversibility of treatments with acrylic/silicone resin mixtures. JAIC 1986, 25, 83–92. [Google Scholar] [CrossRef]
  18. Sèbe, G.; Brook, M.A. Hydrophobization of wood surfaces: Covalent grafting of silicone polymers. Wood Sci. Technol. 2001, 35, 269–282. [Google Scholar] [CrossRef]
  19. Charola, E. Water Repellents and Other “Protective” Treatments: A Critical Review. In Proceedings of the 3rd International Conference on Surface Technology with Water Repellent Agents, Hannover, Germany, 25–26 September 2001; Aedificatio Publishers: Freiburg, Germany, 2001; pp. 3–20. [Google Scholar]
  20. Evans, P.D.; Michell, A.J.; Schmalzl, K.J. Studies of the degradation and protection of wood surfaces. Wood Sci. Technol. 1992, 26, 151–163. [Google Scholar] [CrossRef]
  21. Camaiti, M.; Brizi, L.; Bortolotti, V.; Papacchini, A.; Salvini, A.; Fantazzini, P. An environmental friendly fluorinated oligoamide for producing nonwetting coatings with high performance on porous surfaces. ACS Appl. Mater. Interfaces 2017, 9, 37279–37288. [Google Scholar] [CrossRef]
  22. Cao, Y.; Salvini, A.; Camaiti, M. Facile design of “sticky” near superamphiphobic surfaces on highly porous substrate. Mater. Des. 2018, 153, 139–152. [Google Scholar] [CrossRef]
  23. Camaiti, M.; Bortolotti, V.; Cao, Y.; Papacchini, A.; Salvini, A.; Brizi, L. High Efficiency Fluorinated Oligo(ethylenesuccinamide) Coating for Stone. Coatings 2021, 11, 452. [Google Scholar] [CrossRef]
  24. Cipriani, G.; Salvini, A.; Fioravanti, M.; Di Giulio, G.; Malavolti, M. Synthesis of hydroxylated oligoamides for their use in wood conservation. J. Appl. Polym. Sci. 2013, 127, 420–431. [Google Scholar] [CrossRef]
  25. Oliva, R.; Ortenzi, M.A.; Salvini, A.; Papacchini, A.; Giomi, D. One-pot oligoamides syntheses from L-lysine and L-tartaric acid. RSC Adv. 2017, 7, 12054–12062. [Google Scholar] [CrossRef] [Green Version]
  26. Oliva, R.; Albanese, F.; Cipriani, G.; Ridi, F.; Giomi, D.; Malavolti, M.; Bernini, L.; Salvini, A. Water soluble trehalose-derived oligoamides. J. Polym. Res. 2014, 21, 496. [Google Scholar] [CrossRef]
  27. Conder, J.M.; Hoke, R.A.; De Wolf, W.; Russell, M.H.; Buck, R.C. Are PFCAs bioaccumulative? A critical review and comparison with regulatory criteria and persistent lipophilic compounds. Environ. Sci. Technol. 2008, 42, 995–1003. [Google Scholar] [CrossRef]
  28. EN ISO 483-2005; Plastics—Small Enclosures for Conditioning and Testing Using Aqueous Solutions to Maintain the Humidity at a Constant Value. ISO: Geneva, Switzerland, 2005.
  29. EN 13183-1:2002; Moisture Content of a Piece of Sawn Timber—Part 1: Determination by oven dry method. European Committee for Standardization. CEN: Brussels, Belgium, 2002.
  30. ASTM D4442-20; Standard Test Methods for Direct Moisture Content Measurement of Wood and Wood-Based Materials. ASTM International: West Conshohocken, PA, USA, 2020.
  31. UNI-EN 15886-2010; Conservation of Cultural Heritage-Test Methods-Measurement of the Color of the Surface. UNI: Milan, Italy, 2010.
  32. Ogata, N.; Sanui, K.; Ohtake, T.; Nakamura, H. Solution polycondansation of diesters and diamines having hetero atom groups in polar solvents. Polym. J. 1979, 11, 827–833. [Google Scholar] [CrossRef] [Green Version]
  33. Hoagland, P.D. The formation of intermediate lactones during aminolysis of diethyl galactarate. Carbohydr. Res. 1981, 98, 203–208. [Google Scholar] [CrossRef]
  34. Kiely, D.E.; Chen, L.; Lin, T.H. Hydroxylated nylons based on unprotected esterified D-glucaric acid by simple condensation reactions. J. Am. Chem. Soc. 1994, 116, 571–578. [Google Scholar] [CrossRef]
  35. Szubert, K.; Dutkiewicz, A.; Dutkiewicz, M.; Maciejewski, H. Wood protective coatings based on fluorocarbosilane. Cellulose 2019, 26, 9853–9861. [Google Scholar] [CrossRef] [Green Version]
Figure 1. Schemes of the synthesis of oligoamides ET (a), EST (b) and ES (c). Scheme of synthesis for DT is the same as scheme (a) with diethylenetriamine (D) instead of ethylenediamine (E). Scheme of synthesis for ETA is the same as scheme b with diethyl adipate (A) instead of diethyl succinate (S).
Coatings 12 00927 g001
Figure 2. Oligoamide yield (%) for different monomers after different reaction times (a) 24 h; (b) ≥48 h at 80 °C.
Coatings 12 00927 g002
Figure 3. 1H NMR spectrum in D2O of oligoamide EST.
Coatings 12 00927 g003
Figure 4. 3-perfluorohexyl-1,2-epoxypropane.
Coatings 12 00927 g004
Figure 5. 1H NMR spectrum in CD3OD of oligoamide DF.
Coatings 12 00927 g005
Figure 6. Scheme of the synthesis of fluorinated oligoamides (ETF, ESTF, ESF).
Coatings 12 00927 g006
Figure 7. 1H NMR spectrum in CD3OD of oligoamide ESTF.
Coatings 12 00927 g007
Figure 8. Oak samples after treatment with ESF, DF, or ESTF compared with the wood without coating as reference samples. (a) Virgin samples. (b) Samples pre-extracted in ethanol.
Coatings 12 00927 g008
Figure 9. Variation of water vapor absorption over time at different RH values for oak sample, oak sample after ethanol extraction, and oak samples after coating with ESTF, ESF, or DF.
Coatings 12 00927 g009
Figure 10. Water vapor absorption per unit of weight (%) over time at different RH values for oak sample, oak sample after ethanol extraction, and oak samples after coating with ESTF, ESF, or DF.
Coatings 12 00927 g010
Figure 11. 1H NMR spectra of ESTF after (a) and before (b) aging.
Coatings 12 00927 g011
Figure 12. 1H NMR spectra of DF after (a) and before (b) aging.
Coatings 12 00927 g012
Table 1. Synthesis of fluorinated diethylenetriamine (DF).
Molar Ratio
(D/EC6F) 2
RNHF 1
(%)
RNF2 1
(%)
R2NF 1
(%)
Yield
(%)
Solubility (%)
(Ethanol, 1%) 3
1:11000076100
1:27228097100
1:42871199100
1:610882100100
1 Percentage ratio between different amino groups: RNHF = mono-substituted fluorinated primary amino group; RNF2 = di-substituted fluorinated primary amino group; R2NF = fluorinated secondary group. 2 D = diethylenetriamine, EC6F = 3-perfluorohexyl-1,2-epoxypropane. 3 The solubility was determined as percentage of product dissolved for 1% concentration (w/w solute/solvent). Similar solubility was found in 2-propanol.
Table 2. Synthesis of non-fluorinated oligoamides performed at 80 °C with methanol as solvent.
OligoamideReaction Time
(h)
Initial Molar Ratio
(Diacids/Diamine)
Units Ratio
x:y:z 1
Yield (%)MW 2
(g/mol)
ET601:11:1:064700
ETA241:13:4:162750
DT481:11:1:0701734
EST241:12:3:172633.9
721:11:2:1100887.9
ES241:20:1:173486
1 x = tartaric unit, y = amine unit, z = succinic or adipic unit. 2 Molecular weight evaluated through the 1H-NMR spectra as described below.
Table 3. Synthesis of oligoamides: equations to calculate the number of repeating units of the oligoamide using the 1H NMR integral values 1.
OA 2Tartaric Units
(x)
Diamine Units
(y + 1)
Diamine Units
(y + 1)
Succinic Units
(z′)
Adipic Units
(z″)
ETICHOH = 2xI-CH2NHCO = 4y + 4---
ETAICHOH = 2xI-CH2NHCO = 4y + 4--ICH2CONH = 4z
ICH2CH2CONH = 4z
DTICHOH = 2xI-CH2NHCO = 4y + 4I--CH2NHCH2 = 4y + 8--
ESTICHOH = 2xI-CH2NHCO = 4y + 4-ICH2CONH = 4z-
ES I-CH2NHCO = 4y + 4-ICH2CONH = 4z-
1I = integral value of signal attributable to the labeled group, calculated with respect to the integral of the CH2NH2 signal set equal to 4 (two terminal amino groups). The x, y, and z values refer to the units within the chain in the presence of two terminal amino groups. The value y + 1 refers to the total number including two terminal amino groups. 2 OA = oligoamide.
Table 4. Synthesis of fluorinated oligoamides 1.
OAF 2SolventMolar Ratio
(OA:EC6F)
Yield (%)DSF 3Solubility (%)
(Ethanol, 1%) 4
ETF2-propanol1:2traceNot evaluable-
2-propanol/water (1:1) 1:2300.6-
2-propanol/water (1:1)1:4482.557
DTF2-propanol/water (1:1) 1:4563.068
ETAF2-propanol/water (1:1)1:4483.783
ESTF2-propanol1:4trace>3-
2-propanol/water (1:1) 1:4613.665
2-propanol/water (3:1)1:4703.965
ESF2-propanol1:489~4.085
1 Reaction conditions: T = 70 °C, 48 h. 2 OAF = fluorinated oligoamide. 3 DSF: substitution degree with fluorinated group. 4 The solubility was determined as percentage of product dissolved for 1% concentration (w/w solute/solvent). Similar solubility was found in 2-propanol.
Table 5. Color variations of wood surfaces after coating.
Fluorinated Products∆L*∆a*∆b*∆E
ETF 1−5.26 ± 0.021.94 ± 0.024.23 ± 0.037.02
DTF 1−1.74 ± 0.621.83 ± 0.103.67 ± 0.154.46
ESTF 27.88 ± 0.142.88 ± 0.043.77 ± 0.059.20
ESF 22.28 ± 0.210.63 ± 0.131.67 ± 0.042.90
DF 29.57 ± 0.634.25 ± 0.254.6 ± 0.111.46
DF 1−2.81 ± 0.541.29 ± 0.085.69 ± 0.146.48
1 beech sample; 2 oak sample.
Table 6. Water contact angle (ϑc, °).
Fluorinated ProductsPretreatmentAfter 1 sAfter 5 sAfter 8 min
Beech
(reference sample)
None66.3 ± 1.2n.e. 3n.e. 3
Ethanol extraction59.9 ± 4.3n.e. 3n.e. 3
Oak
(reference sample)
None105.9 ± 1.275.4 ± 0.2n.e. 3
Ethanol extraction84.5 ± 0.9n.e. 3n.e. 3
ETF 1None89.8 ± 2.664.1 ± 1.5n.e. 3
DTF 1None78.2 ± 0.353.1 ± 1.8n.e. 3
ESTF 2None82.4 ± 0.554.2 ± 0.2n.e. 3
Ethanol extraction76.4 ± 0.463.7 ± 0.6n.e. 3
ESF 2None138.2 ± 1.6132.6 ± 1.287.8 ± 0.5
Ethanol extraction132.4 ± 1.5126.1 ± 1.490.0 ± 0.8
DF 1None130.4 ± 1.8114.9 ± 0.899.6 ± 1.5
DF 2None132.2 ± 1.4119.3 ± 0.2104.7 ± 1.1
Ethanol extraction121.2 ± 0.4112.4 ± 0.387.8 ± 0.3
1 beech sample; 2 oak sample. 3 n.e.: not evaluable.
Table 7. Total mass of water absorbed at different RH values and mass per unit of weight of the sample (%).
Oak Samples RH 65%RH 86%RH 100%
mH2O (mg)Δm/m(%) 1mH2O (mg)Δm/m(%) 1mH2O (mg)Δm/m(%) 1
Without coating2904.74617.376911.7
After extraction
in ethanol
2774.54386.973611.1
ESTF coating 22624.34116.567810.4
ESF coating 22574.14106.468010.2
DF coating 22614.24176.667110.2
1 Mass of water absorbed per unit mass of the specimen (%). 2 Oak pre-treated with ethanol.
Table 8. Color changes after UV aging on glass slide after 254 h of irradiation.
Fluorinated Products∆L*∆a*∆b*∆E
ESTF −0.62 ± 0.23−0.23 ± 0.020.85 ± 0.061.07
ESF 0.06 ± 0.19−0.20 ± 0.02−0.95 ± 0.080.97
DF −1.27 ± 0.23−2.27 ± 0.048.76 ± 0.149.14
Publisher’s Note: MDPI stays neutral with regard to jurisdictional claims in published maps and institutional affiliations.

