Article

Preparation and Electrochemical Behavior of an Amorphous Co–Mo Coating with a High Content of Mo

1
Collaborative Innovation Center of Capital Resource-Recycling Material Technology, Beijing University of Technology, Beijing 100124, China
2
National Engineering Laboratory for Industrial Big-Data Application Technology, Beijing University of Technology, Beijing 100124, China
3
Key Laboratory of Advanced Functional Materials, Ministry of Education, Faculty of Materials and Manufacturing, Beijing University of Technology, Beijing 100124, China
*
Authors to whom correspondence should be addressed.
Coatings 2022, 12(6), 739; https://doi.org/10.3390/coatings12060739
Submission received: 21 April 2022 / Revised: 24 May 2022 / Accepted: 24 May 2022 / Published: 27 May 2022
(This article belongs to the Section Surface Characterization, Deposition and Modification)

Abstract

:
At present, alloy materials are being widely used as wear-resistant coatings due to good mechanical properties. In this paper, electrodeposition was used to prepare a Co–Mo coating. The influence of parameters on the phase, morphology, composition, and property of the coating has been studied, and the electrochemical mechanism has been deeply studied. The study of process parameters found that when the concentration of Na2Mo4 is 0.05 mol/L, the concentration of C6H5Na3O7 is 0.15 mol/L, the pH of the solution is 7, and the temperature is 50 °C, the content of Mo in a Co–Mo coating is 39.56%, and the microhardness reaches the maximum value of 503 HV. The study of electrochemical behavior found that the optimization of process parameters bringsa positive shift in the reduction potential, an increase in the exchange current density, and a decrease in charge transfer impedance. The microhardness of a Co–Mo coating prepared with the leaching solution of Mo-containing waste after component control of the plating solution is 483.6 HV, which is valuable to the high-value recycling of Mo secondary resources.

1. Introduction

Alloy materials have been widely used due to their good mechanical properties. The traditional method of preparing alloy materials is mainly powder metallurgy, but electrodeposition can be used to prepare alloy coatings on a substrate in a salt solution to improve the property of the substrate materials.
Currently, the more widely used alloy coatings mainly include Ni–Co alloy, Ni–W alloy [1,2], Co–W alloy [3,4,5], Ni–Mo alloy [6,7,8,9], Co–Mo alloy [10,11,12], Ni–Co–Mo alloy [13], and other iron group element alloys [14,15,16,17]. Among them, the content of W [18,19] and Mo [20,21] is critical to the performance of the coating. Due to its good mechanical properties and catalytic hydrogen evolution performance, the molybdenum-containing coating has been used as a wear-resistant coating and a catalytic hydrogen evolution material in the field of metal protection and water electrolysis. Wasekar et al. [8] prepared a Ni–Mo alloy coating and found that the increase in molybdenum content improved the microhardness, wear resistance, and corrosion resistance of the coating. Lee et al. [21] studied the corrosion behavior of a Ni–Mo coating in NaCl solution and found that the corrosion film was not passivated under high overpotential and the synergistic effect of wear and corrosion on the weight loss of this Ni–Mo alloy coating was less obvious than that of other Ni alloy coatings. Some researchers have studied the principle of electrodeposition and electrochemical behavior of molybdenum-containing alloys. Gómez et al. [11] used voltammetry to study the influence of process parameters on the co-deposition of cobalt and molybdenum. Although the electrodeposition process of a Co–Mo coating is relatively mature, the composition of the electroplating solution, the metal ion concentration, and the pH value will lead to a difference in the alloy properties in the electrodeposition process. The relationship between the preparation process and the electrochemical behavior of the Co–Mo coating needs to be further studied, so as to improve the performance of the coating, which is valuable for the preparation of high-performance molybdenum-containing coatings from molybdenum-containing waste leaching solution and is conducive to the high-value reuse of molybdenum secondary resources. Therefore, in this paper, a binary Co–Mo coating is prepared by the electrochemical deposition method. By adjusting multiple process parameters, the structure, morphology, composition, and microhardness of the coating are continuously improved and its electrochemical mechanism is studied, so as to build the relationship between process, performance, and mechanism.

2. Materials and Methods

2.1. Coating Preparation

Electrodeposition experiments were carried out with CoSO4 and Na2MoO4 as the main salts, Na3C6H5O7 as the coordination agent, and C12H25SO4Na as the activator. All reagents were analytically pure (>97%). The 70 mm × 25 mm double graphite electrodes were used as the anode, and the distance between the two graphite electrodes was 40 mm; a 30 mm × 20 mm copper sheet with a hole with a diameter of about 3 mm on the upper part of the substrate was used as the cathode. The anode and the cathode were placed in a 250 mL electrolytic cell with a salt solution. Before electrodeposition, the cathode copper sheet was polished using #80 and #2000 sandpapers and polishing solutions of 6 μm, 3 μm, and 1 μm in turn, then cleaned using alcohol ultrasonic for 5 min, soaked in 3 mol/L NaOH solution for 10 min and then in 5% H2SO4 solution for 10 min, cleaned using alcohol ultrasonic for 5 min, and finally weighed after drying. The composition of the bath and the process parameters are shown in Table 1.

2.2. Coating Characterization

The phase was analyzed by the X-ray diffraction method (D8 Advance, BRUKER AXS, Karlsruhe, Germany) under CuKα1 radiation, and the measurement was carried out in the range of 2θ from 10° to 90°. The surface morphology of the coating was characterized by a scanning electron microscope (GeminiSEM 300, Carl Zeiss AG, Oberkochen, Germany), and the composition of the coating was studied using an energy dispersive X-ray spectrometer (EDS, Carl Zeiss AG, Oberkochen, Germany) coupled with an SEM. The composition and chemical valence state of the Co–Mo coating was tested by X-ray photoelectron spectroscopy (ESCALAB 250Xi, thermo Fisher, Waltham, MA, USA).

2.3. Coating Property Testing

The microhardness of the coating was examined by an HXD-1000TMC/LCD micro-hardness tester (Shang Guang Optical Microscopes, Shanghai, China). The application speed of the applied force was 0.05 mm/s, the applied load force was 100 g, and the holding time was 10 s. Each sample was tested for the hardness value of 10 points and the average found.

2.4. Electrochemical Behavior Test

A three-electrode system was used for electrochemical testing with an electrochemical workstation (PARSTAT4000, GAMRY, Princeton, NJ, USA). A glassy carbon electrode (φ = 3 mm) and a copper electrode (φ = 3 mm) were used as the working electrodes, aplatinum electrode (2 mm × 10 mm × 0.1 mm) was used as the auxiliary electrode, and asaturated calomel electrode (φ = 2 mm) was used as the reference electrode. The cyclic voltammetry (CV) was performed at a scan rate of 50 mV/s within the potential range of −1.2 V~−0.5 V, the linear scan voltammetry (LSV) was performed at a scan rate of 50 mV/s within the potential range of −1.2 V~0 V, and the electrochemical impedance spectroscopy (EIS) was performed in the range of 0.1 Hz–10 k Hz with the potential of −1.2 V.

3. Results

3.1. The Structure, Composition, Morphology, and Property of a Co–Mo Coating

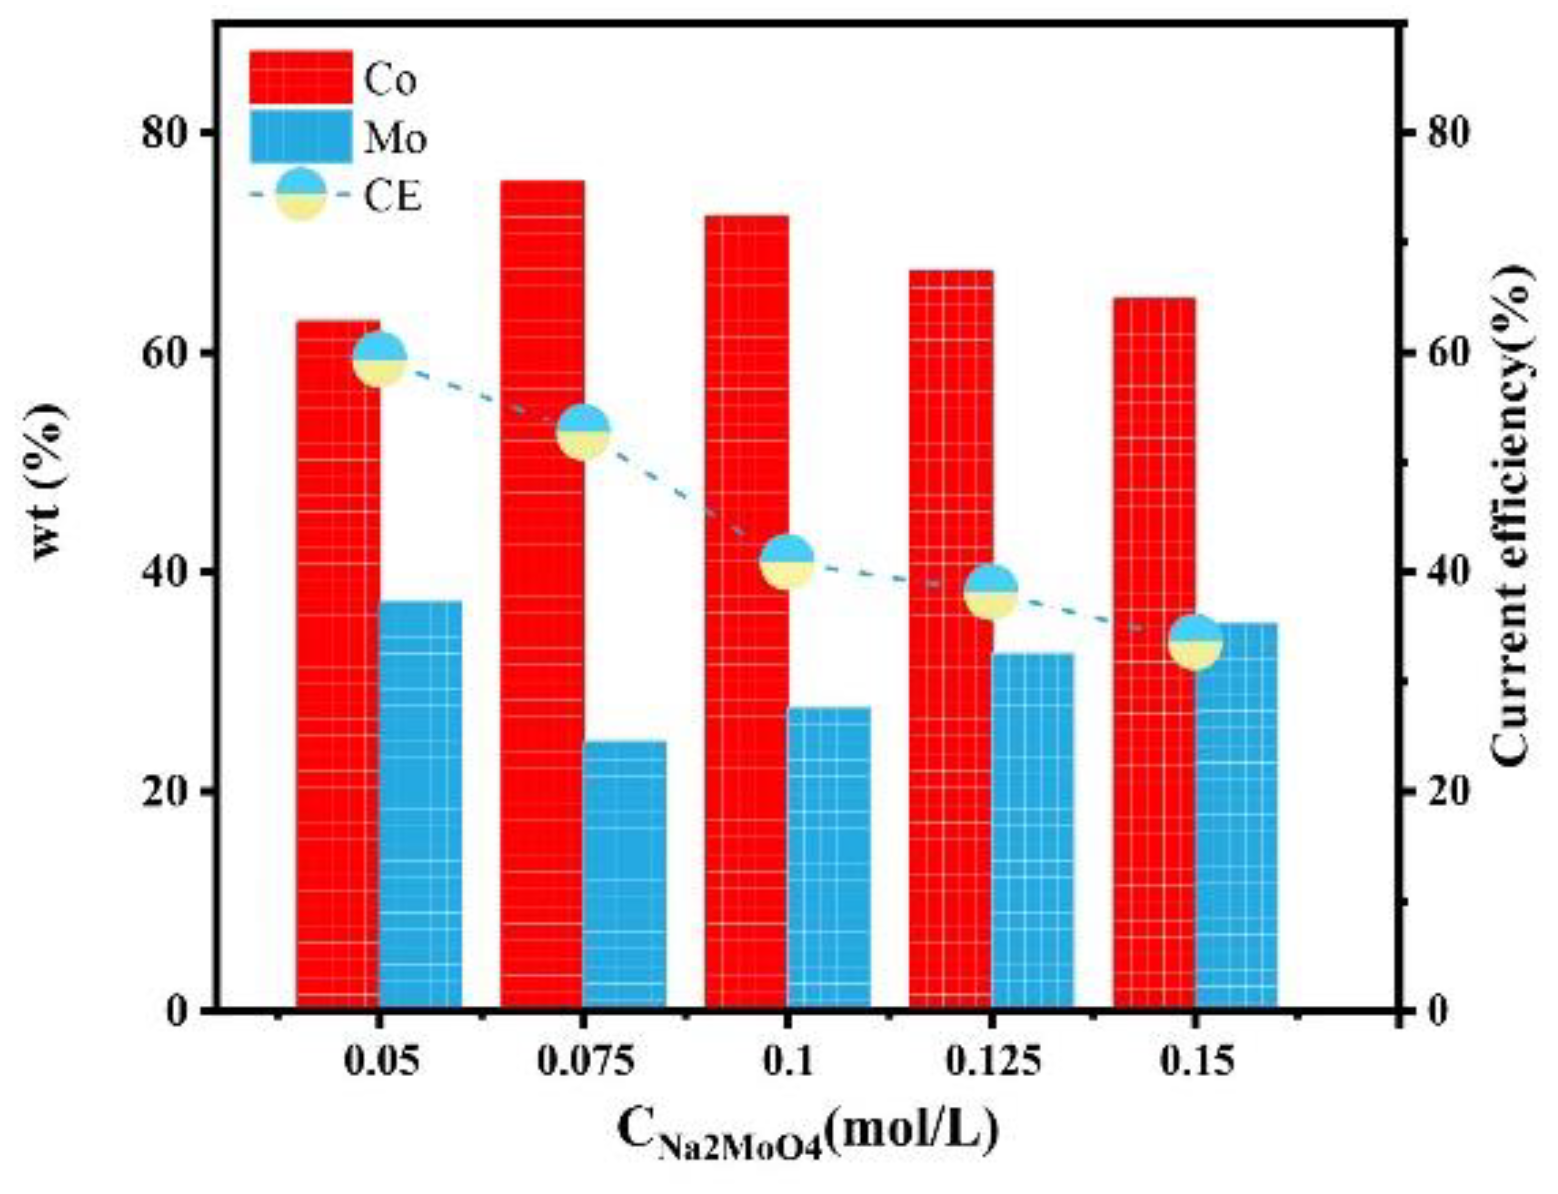
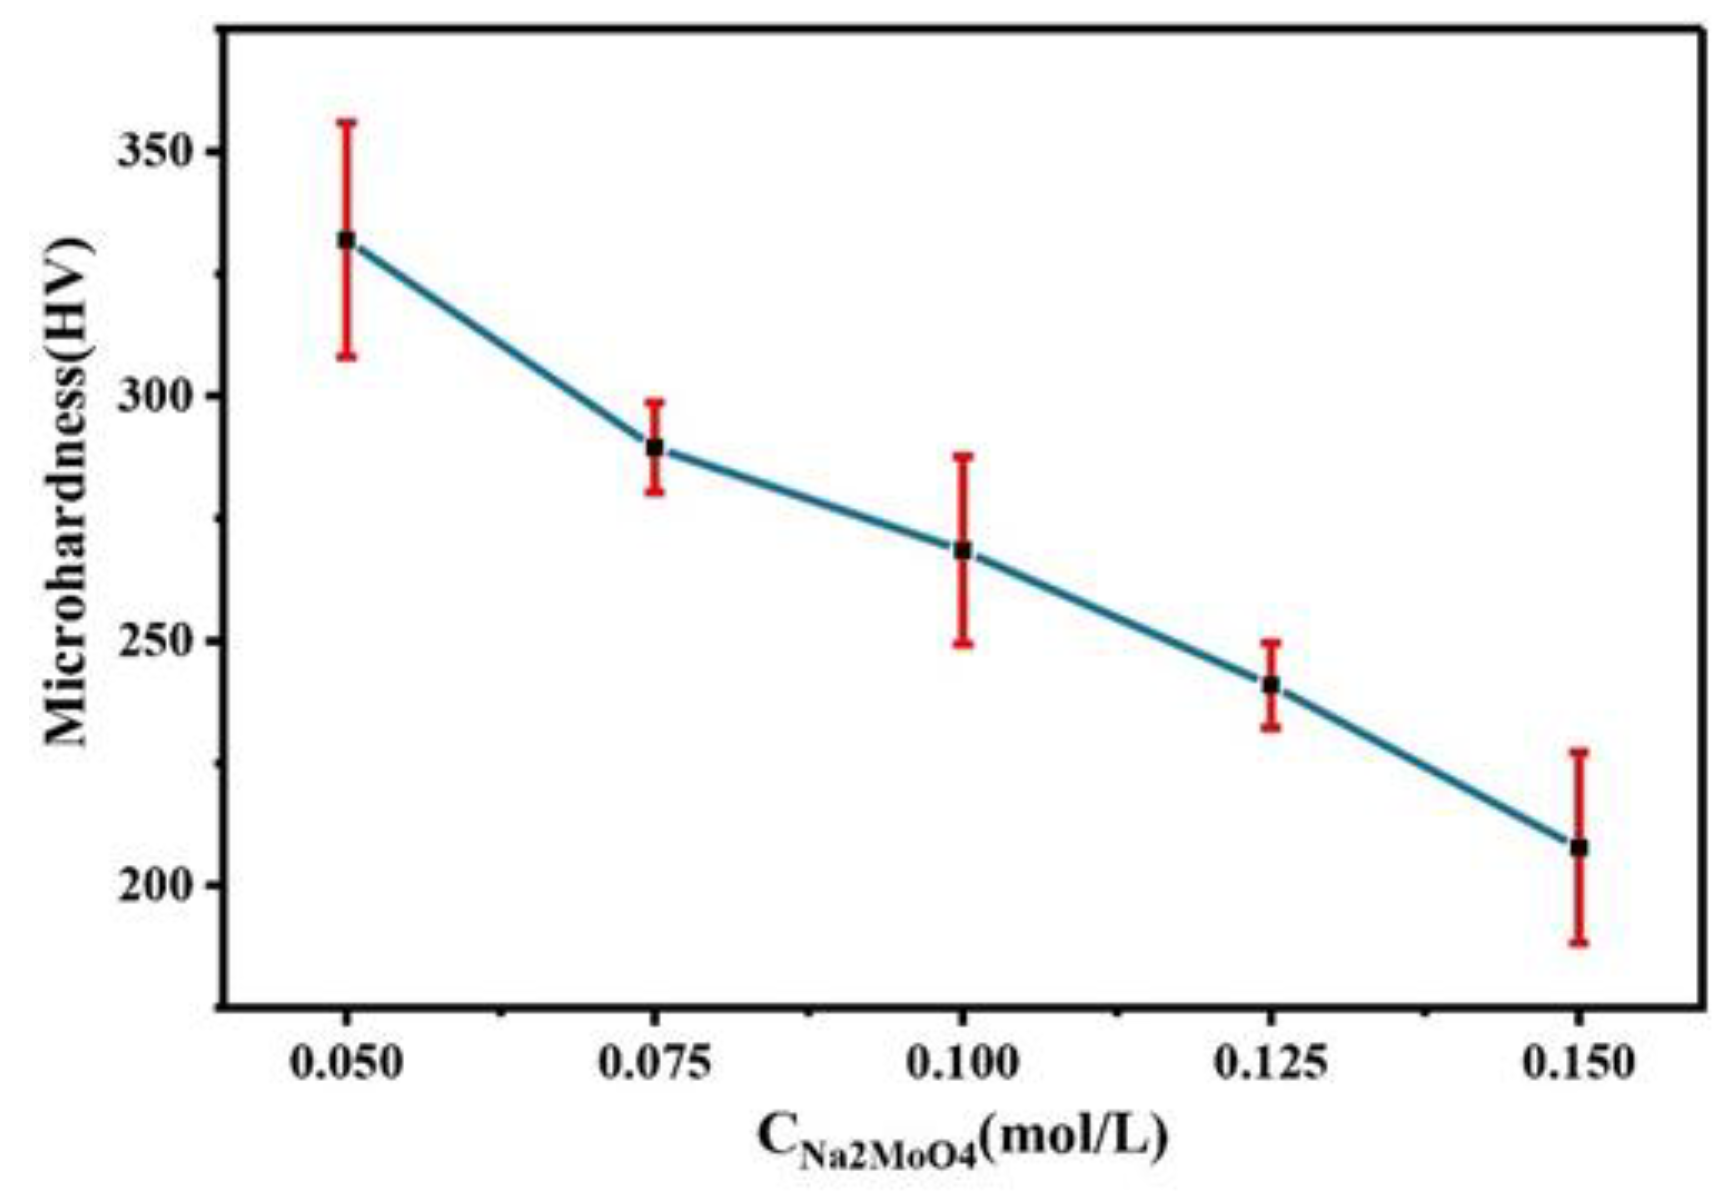
3.1.1. Effect of the Concentration of Na2MoO4

The main salt concentration is an important factor in the electrodeposition process. It can affect the microhardness of the alloy coating by affecting the phase, morphology, and composition of the alloy coating. Therefore, it is necessary to study the concentration of Na2MoO4. Always keep the concentration of C6H5Na3O7 in the plating solution at 0.15 mol/L, the pH at 7, and the temperature at 45 °C. As shown in Figure 1, the XRD patterns of the coating prepared under different Na2MoO4 concentrations show a wide diffraction peak near 2θ = 43°, indicating that the coating is a Co–Mo alloy with an amorphous structure. When the concentration of Na2MoO4 exceeds 0.05 mol/L, the XRD patterns of the prepared coating show the diffraction peaks of copper at 2θ = 50° and 2θ = 74°. Because with the increase in Na2MoO4 concentration, the amount of HrMoO4Cit[5−r] in the plating solution is relatively small, which leads to a negative shift in the deposition potential of the alloy, it is difficult to deposit, the coating becomes thinner, and the copper matrix is detected.
The surface morphology of the Co–Mo coating under different concentrations of Na2MoO4 is shown in Figure 2. When the concentration of Na2MoO4 is 0.05 mol/L, the surface of the Co–Mo coating is nodular, flat, and smooth and the crystal grains are small and uniform. When the concentration of Na2MoO4 increases, the surface quality of the coating is reduced, the surface becomes non-uniform, and the crystal grains become coarse.
Figure 3 shows the influence of the concentration of Na2MoO4 in the plating solution on the composition and current efficiency of the Co–Mo coatings. As the concentration of Na2MoO4 increases, the mass fraction of Mo in the coating shows a trend of first decreasing and then increasing. It is reported that within a certain range, the lower the concentration of Na2MoO4 in the plating solution, the higher the content of Mo in the coating; However, with a high concentration of Na2MoO4, the relative deficiency of Co2+ and Cit3− hinders the co-deposition. When the concentration of Na2MoO4 in the plating solution is 0.05 mol/L, the content of Mo reaches the maximum value, of 37.25%. According to the mass percentage of elements in the alloy, calculate the current efficiency of the coating according to Equations (1)–(3). With the increase in Na2MoO4 concentration, the current efficiency decreases. When the concentration of Na2MoO4 is 0.05 mol/L, the current efficiency reaches the maximum value, of 59.32%.
The electrochemical equivalent of divalent Co is calculated as per Equation (1),
CCo = MCo/nF = 1.1 g·A−1·h−1
where F is the Faraday constant, 96,500 C/mol = 96,500 A∙s/mol = 26.8 A∙h/mol; M is the molar mass of the substance; and n is the number of reaction electrons.
The electrochemical equivalent of hexavalent Mo is calculated as per Equation (2),
CMo = MMo/nF = 0.59 g·A−1·h−1
The current efficiency P is calculated according to Equation (3):
P = ((m × fCo)/(CCo × I × t) + (m × fMo)/(CMo × I × t)) × 100%
where m is the quality of the obtained alloy coating, f is the mass fraction of each metal in the coating, C is the electrochemical equivalent of each metal in the coating, I is the current intensity, and t is the electrodeposition time.
Figure 4 shows the microhardness of Co–Mo alloys prepared at different Na2MoO4 concentrations. With the increase in Na2MoO4 concentration in the plating solution, the microhardness of the Co–Mo coating decreases. As molybdenum enters the cobalt lattice, it causes lattice distortion, hinders dislocation movement, and improves the microhardness of the alloy. However, with the increase in the Na2MoO4 concentration, the thickness of the alloy decreases, the copper matrix is detected, and the microhardness is low. When the concentration of Na2MoO4 is 0.05 mol/L, the microhardness of the Co–Mo coating reaches the maximum value, of 331 HV.

3.1.2. Effect of the Concentration of C6H5Na3O7

The coordination agent can be complexed with metal ions and molybdate ions in the plating solution to realize co-deposition. Therefore, the concentration of the coordination agent can affect the number of complex ions in the plating solution, further affecting the phase, morphology, and composition of the coating and ultimately impacting the microhardness of the coating. Always keep the concentration of Na2MoO4 in the plating solution at 0.05 mol/L, the pH at 7, and the temperature at 45 °C. As shown in Figure 5, the XRD patterns of Co–Mo coatings prepared under different concentrations of the coordination agent C6H5Na3O7 show a wide diffraction peak at 2θ = 43°. The XRD patterns of the coating prepared when the concentration of C6H5Na3O7 exceeds 0.2 mol/L show the diffraction peaks of copper at 2θ = 50° and 2θ = 74°.This is because when the concentration of C6H5Na3O7 is too high, the coating becomes thin and the copper matrix is detected.
The surface morphology of the Co–Mo coating under different concentrations of C6H5Na3O7 is shown in Figure 6. When the concentration of C6H5Na3O7 is 0.1 mol/L, the Co–Mo coating has the characteristics of the surface morphology of irregular polygonal flakes. When the concentration of C6H5Na3O7 is 0.15 mol/L, the surface is flat and smooth and the crystal grains are small and uniform. When the concentration of C6H5Na3O7 continues to increase, the surface becomes non-uniform and the crystal grains become coarse.
Figure 7 shows the effect of C6H5Na3O7 concentration on the composition of a Co–Mo coating. With the increase in the C6H5Na3O7 concentration, the Mo content of the coating first increased and then decreased. This is because the deposition of Mo mainly depends on the formation of cobalt citrate complex ions. There is an ionization equilibrium of C6H5O73− (replaced with Cit3− below) in the solution, as shown in Equations (4)–(6),
Cit3− + H+ ⇌ HCit2−
HCit2− + H+ ⇌ H2Cit
H2 Cit + H+ ⇌ H3Cit
When the concentration of C6H5Na3O7 in the solution is too low, it cannot fully complex with Co(II) and MoO42−; there are a few HrMoO4Cit[5−r] to be deposited. The concentration of C6H5Na3O7 further increases, which destroys the ionization equilibrium [22] and moves the reaction of Equations (4)–(6) forward, resulting in an increase in the pH of the solution. When the pH value is low, Co(II) exists in the form of HCoCit, Mo exists in the form of HrMoO4Cit[5−r], and HrMoO4Cit is easy to co-deposit. When the pH value is high, Co(II) exists in the form of CoCit, Mo exists in the form of MoO42−, and MoO42− is not easy to co-deposit [23]. Therefore, the pH value is too high, alloy deposition is difficult, and the Mo content in the coating is reduced. When the concentration of C6H5Na3O7 is 0.15 mol/L, the content of Mo reaches the maximum value, of 37.25%. With the increase in the C6H5Na3O7 concentration, the current efficiency first increases and then decreases. When the concentration of C6H5Na3O7 is 0.15 mol/L, the current efficiency reaches the maximum value, of 59.32%.
Figure 8 shows the comparison of the microhardness of the Co–Mo coating with different concentrations of C6H5Na3O7. With the increase in the C6H5Na3O7 concentration, the microhardness of the Co–Mo coating first increases and then decreases. The reason for this trend is that the content of Mo in the coating first increases and then decreases with the increase in the C6H5Na3O7 concentration and the degree of lattice distortion first increases and then decreases. When the concentration of C6H5Na3O7 is 0.15 mol/L, the microhardness of the Co–Mo coating reaches the maximum value, of 331 HV.

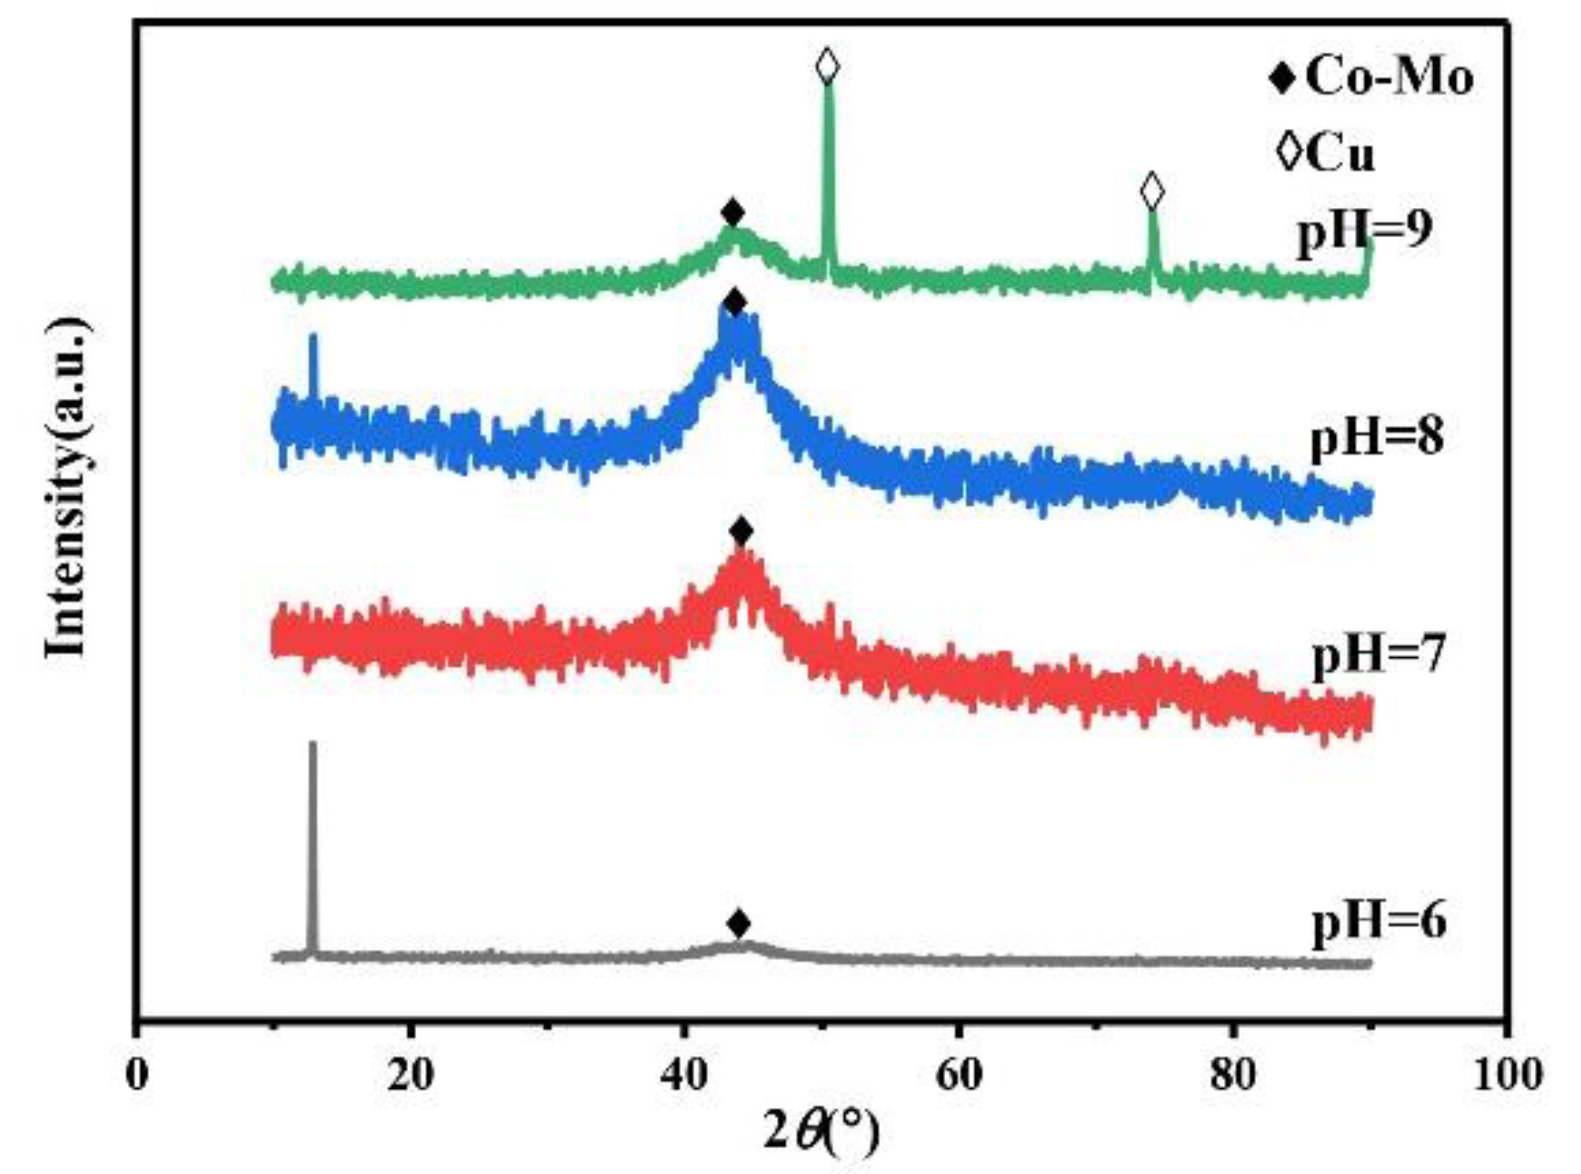
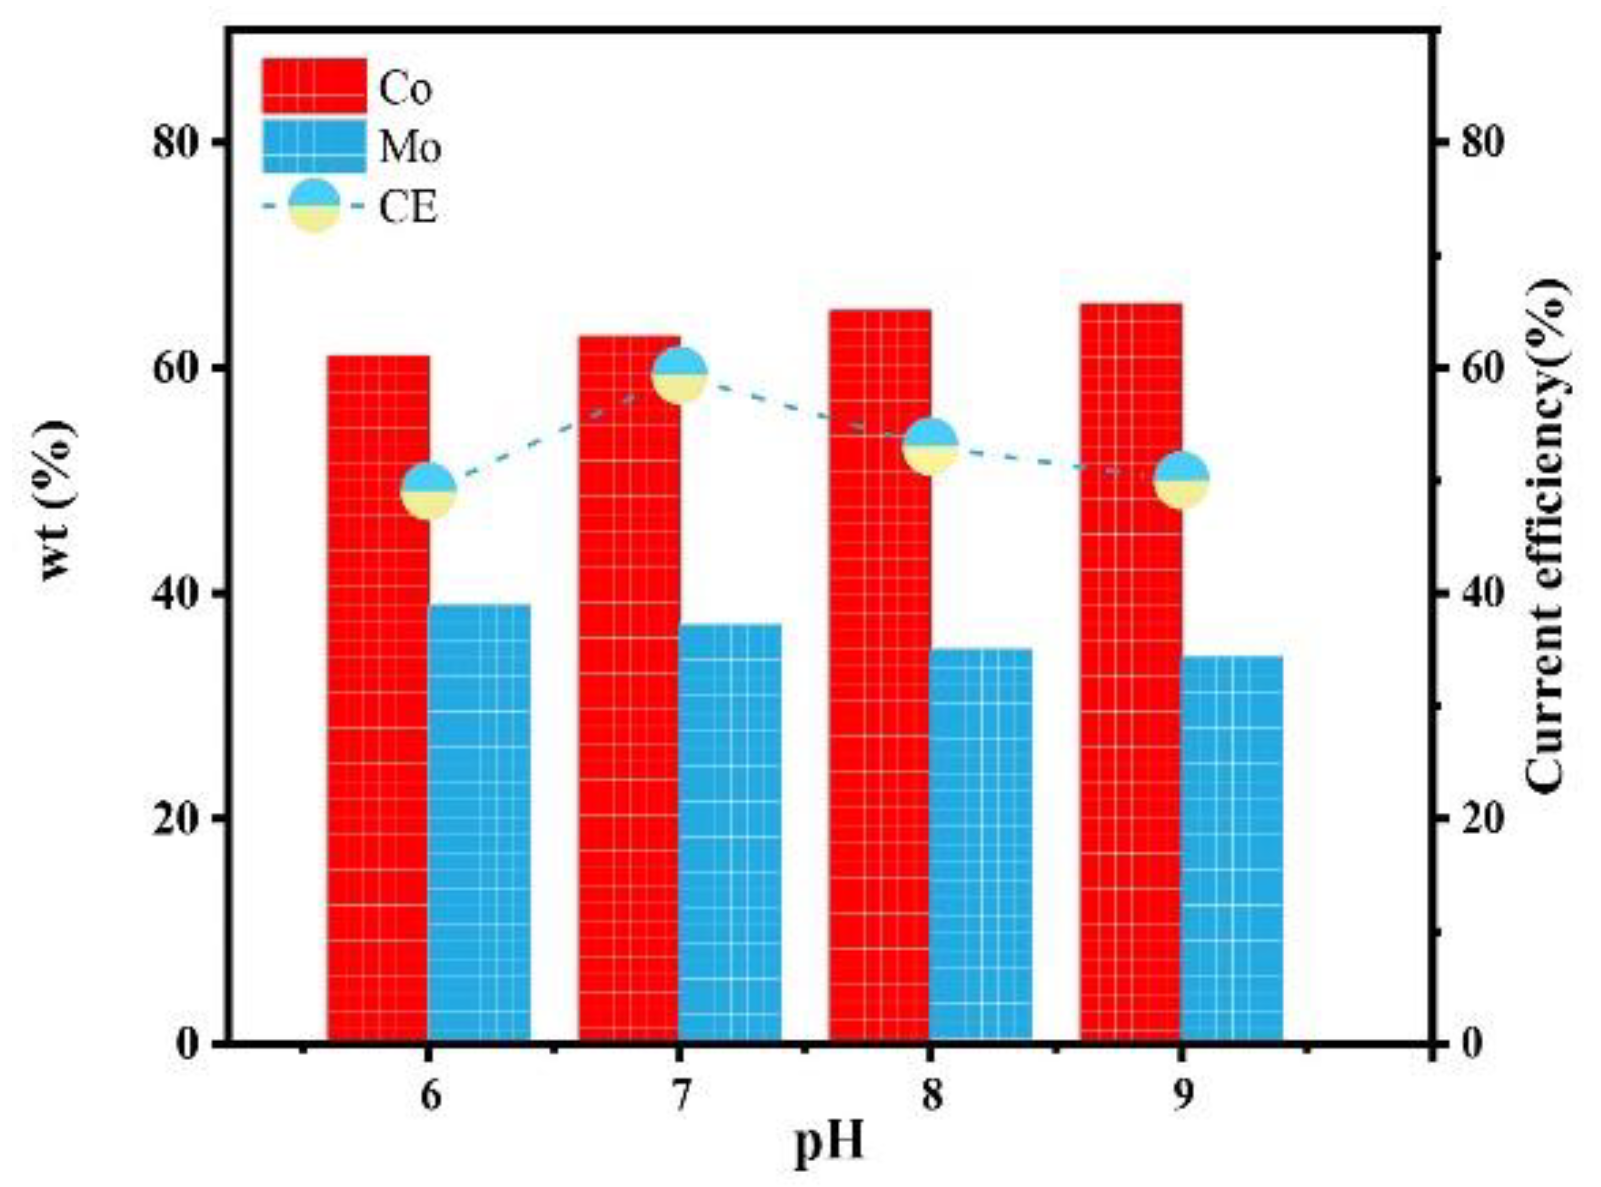
3.1.3. Effect of the pH Value

The pH of the plating solution is an important factor in the electrodeposition preparation process. Under different pH values of the plating solution, the types of complex ions in the plating solution will change, so it will affect the phase, morphology, and composition of the alloy coating, so as to affect the microhardness of the alloy coating. Always keep the concentration of Na2MoO4 in the plating solution at 0.05 mol/L, the concentration of C6H5Na3O7 at 0.15 mol/L, and the temperature at 45 °C. The XRD spectra of the Co–Mo coatings under different pH values are shown in Figure 9. The XRD patterns of coatings at different pH values show a wide diffraction peak near 2θ = 43°. The XRD patterns of the coating prepared at pH = 9 show the diffraction peaks of copper at 2θ = 50° and 2θ = 74°. The reason for this phenomenon is that the pH value increases, the alloy deposition is difficult, the coating becomes thinner, and the copper matrix is detected.
The surface morphology of the Co–Mo coating under different pH values is shown in Figure 10. When pH is 7, the surface of the coating is smooth and the grains are fine. When pH is 8 and 9, the Co–Mo coating has the surface morphology characteristics of irregular polygonal flakes.
Figure 11 shows the influence of the pH on the composition and current efficiency of the Co–Mo coatings. With the increase in the pH value, the mass fraction of Mo in the alloy coating decreases because the reduction in pH in the previous analysis is conducive to the formation of HCoCit and HrMoO4Cit[5−r] and promotes co-deposition [23]. When pH is 6, the content of Mo reaches the maximum value, of 38.98%. With the increase in the pH value, the current efficiency first increases and then decreases. Low pH (pH < 7) leads to high H+ content, which is prone to a hydrogen evolution reaction [24], reducing current efficiency. When the pH value is too high, the current efficiency decreases due to a decline in the deposition quality. When pH is 7, the current efficiency reaches the maximum value, of 59.32%.
Figure 12 shows a comparison of the microhardness of the Co–Mo coating under different pH values. With the increase in the pH value, the microhardness of the Co–Mo coating first increases and then decreases. When pH is 7, the microhardness of the Co–Mo coating reaches the maximum value, of 331 HV. When the pH is 6 or 9, the coating surface falls off or is too thin, so the microhardness is low as a result of testing the substrate copper.

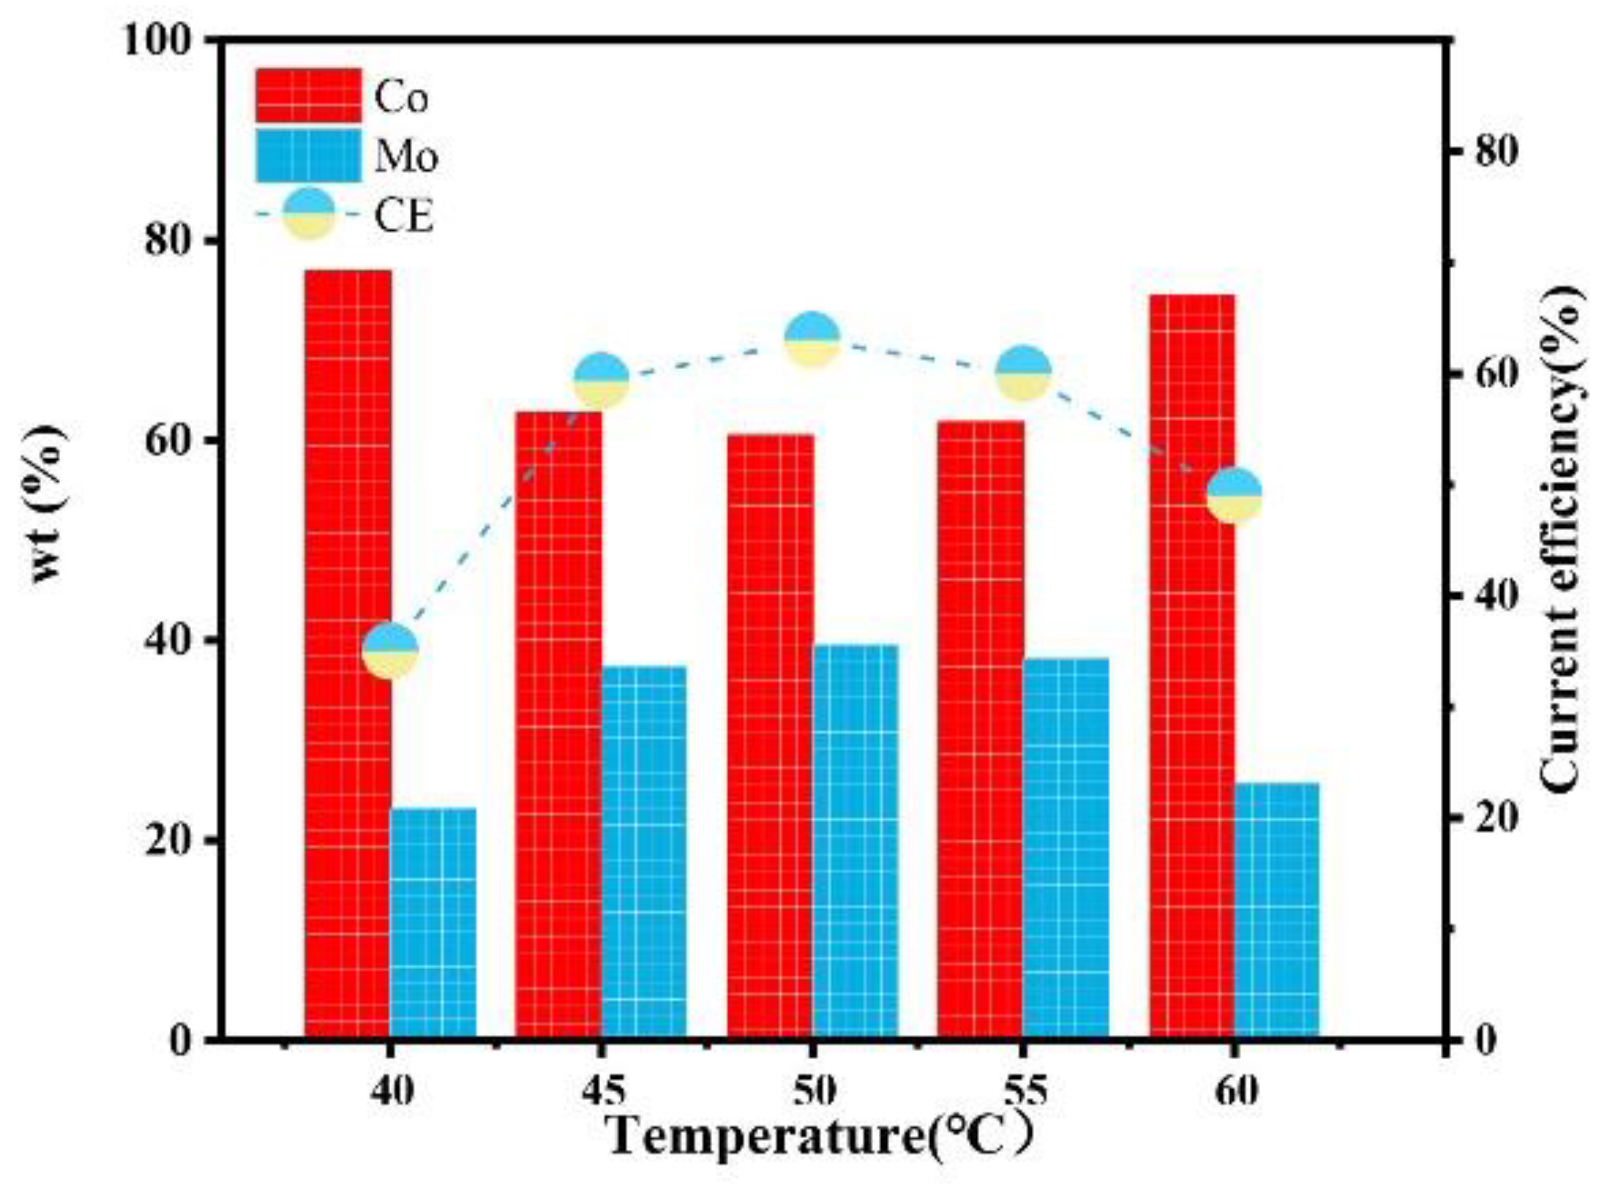
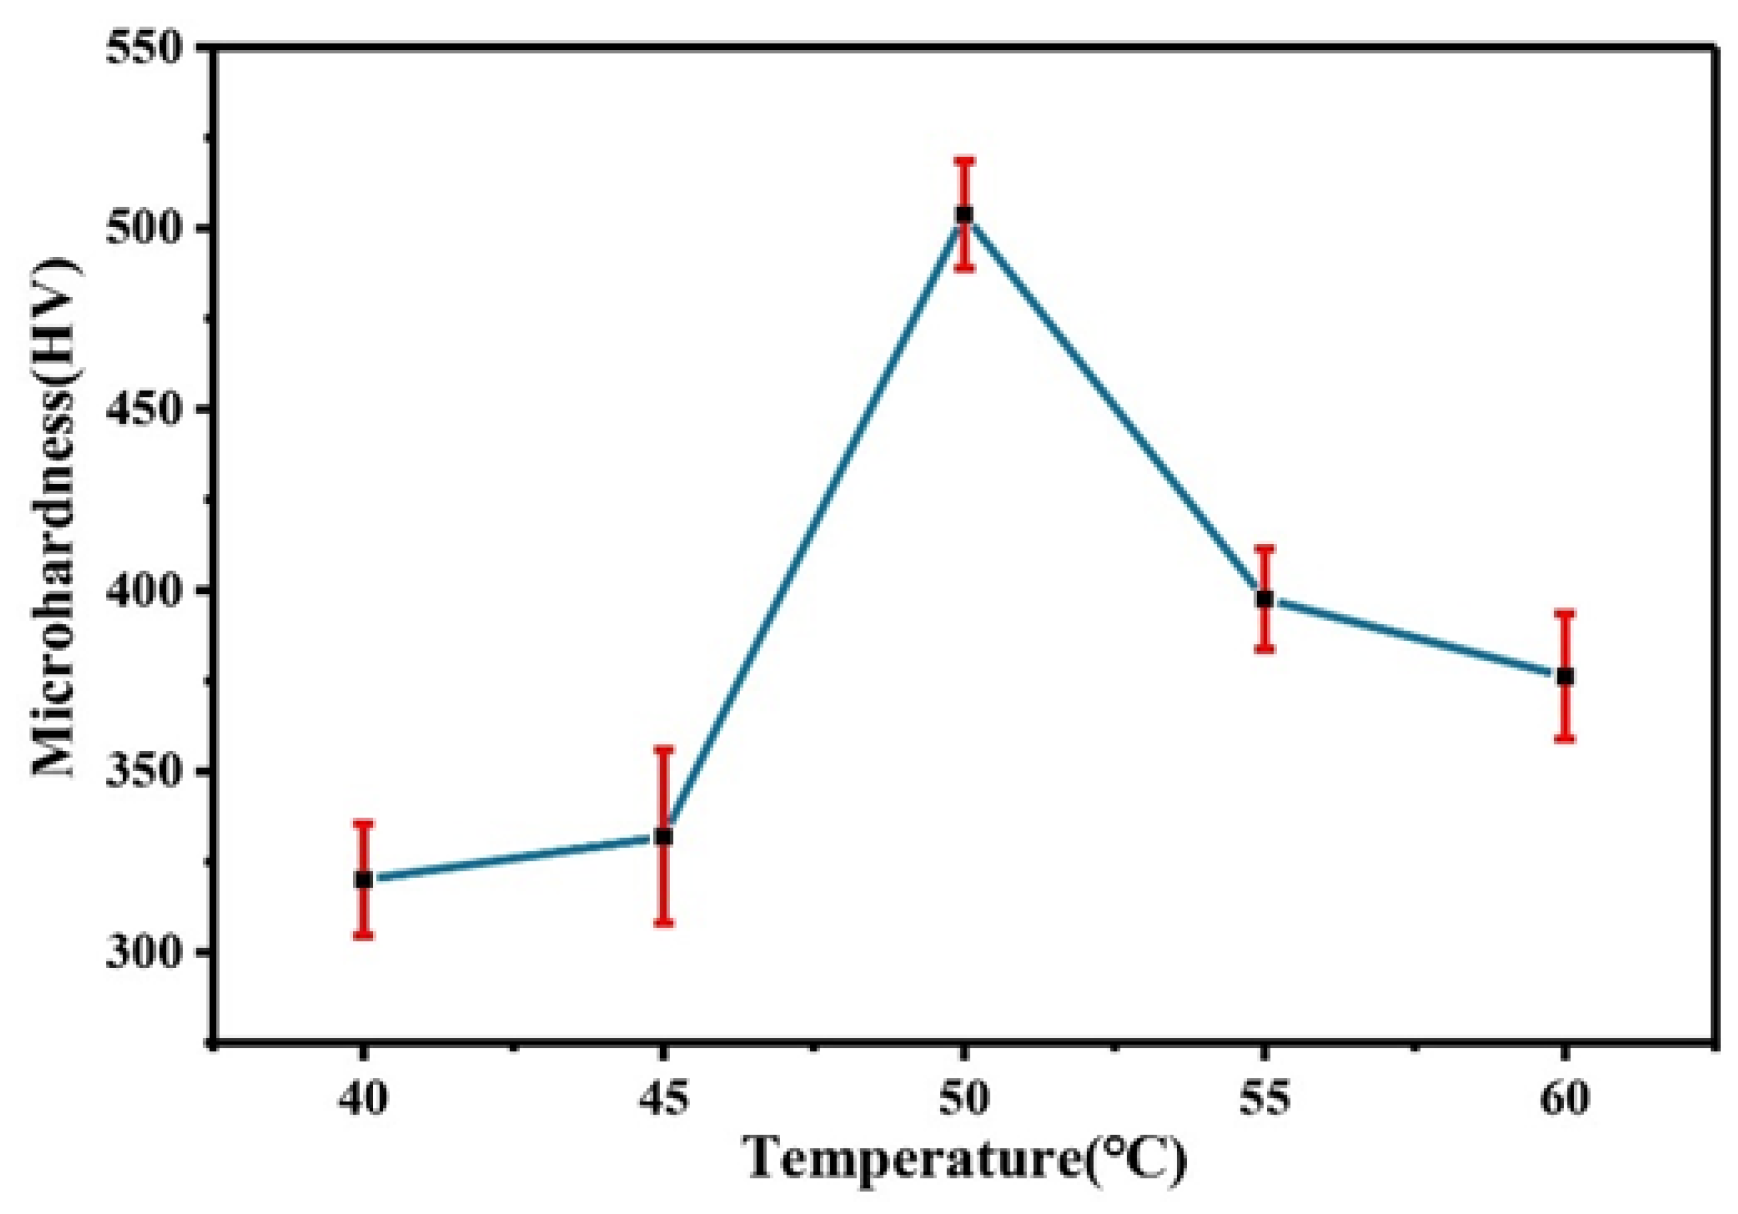
3.1.4. Effect of Temperature

Temperature will influence the migration rate of complex ions in the plating solution and the stability of complex ions, which will affect the phase, morphology, and composition of the alloy coating and further affect the microhardness of the alloy coating. Always keep the concentration of Na2MoO4 in the plating solution at 0.05 mol/L, the concentration of C6H5Na3O7 at 0.15 mol/L, and pH at 7. The XRD patterns of the Co–Mo coatings under different temperatures are shown in Figure 13. The XRD patterns of Co–Mo coatings prepared at different temperatures show a wide diffraction peak near 2θ = 43°, indicating the formation of amorphous alloy. When the temperature is too high or too low, the XRD patterns of the coating show diffraction peaks of copper at 2θ = 50° and 2θ = 74°. When the temperature is low, the alloy deposition speed is slow and the coating is thin; however, the high temperature makes the deposition speed too fast, resulting in the peeling and thinning of the alloy coating surface, and the copper matrix is detected.
The surface morphology of the Co–Mo coating under different temperatures is shown in Figure 14. When the temperature is 40 °C, the Co–Mo coating has the characteristics of the surface morphology of irregular polygonal flakes. As the temperature rises, the surface of the coating becomes smoother and the crystal grains are smaller. When the temperature is too high, the surface becomes non-uniform and the crystal grains become coarse.
Figure 15 shows the influence of the temperature on the composition and current efficiency of the Co–Mo coatings. With the increase in temperature, the content of Mo in the coating first increases and then decreases, which is because the appropriate increase in temperature promotes the migration of complex ions to the cathode, the alloy is easy to deposit, and the content of Mo increases. A too-high temperature will affect the stability of complex ions and reduce the number of complex ions effectively electrodeposited, which is not conducive to the deposition of Mo [25]. When the temperature is 50 °C, the Mo content reaches the maximum value, of 39.56%. With the increase in temperature, the current efficiency first increases and then decreases. Which is because more ions are discharged at the cathode with the increase in temperature and so the current efficiency of the cathode increases. However, when the temperature is too high, the complex ions are unstable, the amount of electrodeposited metals decreases, and the current efficiency decreases. When the temperature is 50 °C, the current efficiency reaches the maximum value, of 63%.
Figure 16 shows a comparison of the microhardness of the Co–Mo coating under different temperatures. With the increase in temperature, the microhardness first increases and then decreases. The reason for this trend is that the appropriate increase in temperature can make the thickness of the coating larger, the morphology denser, and the Mo content higher and so the microhardness higher. When the temperature is 50 °C, the microhardness of the Co–Mo coating reaches the maximum value, of 503 HV.

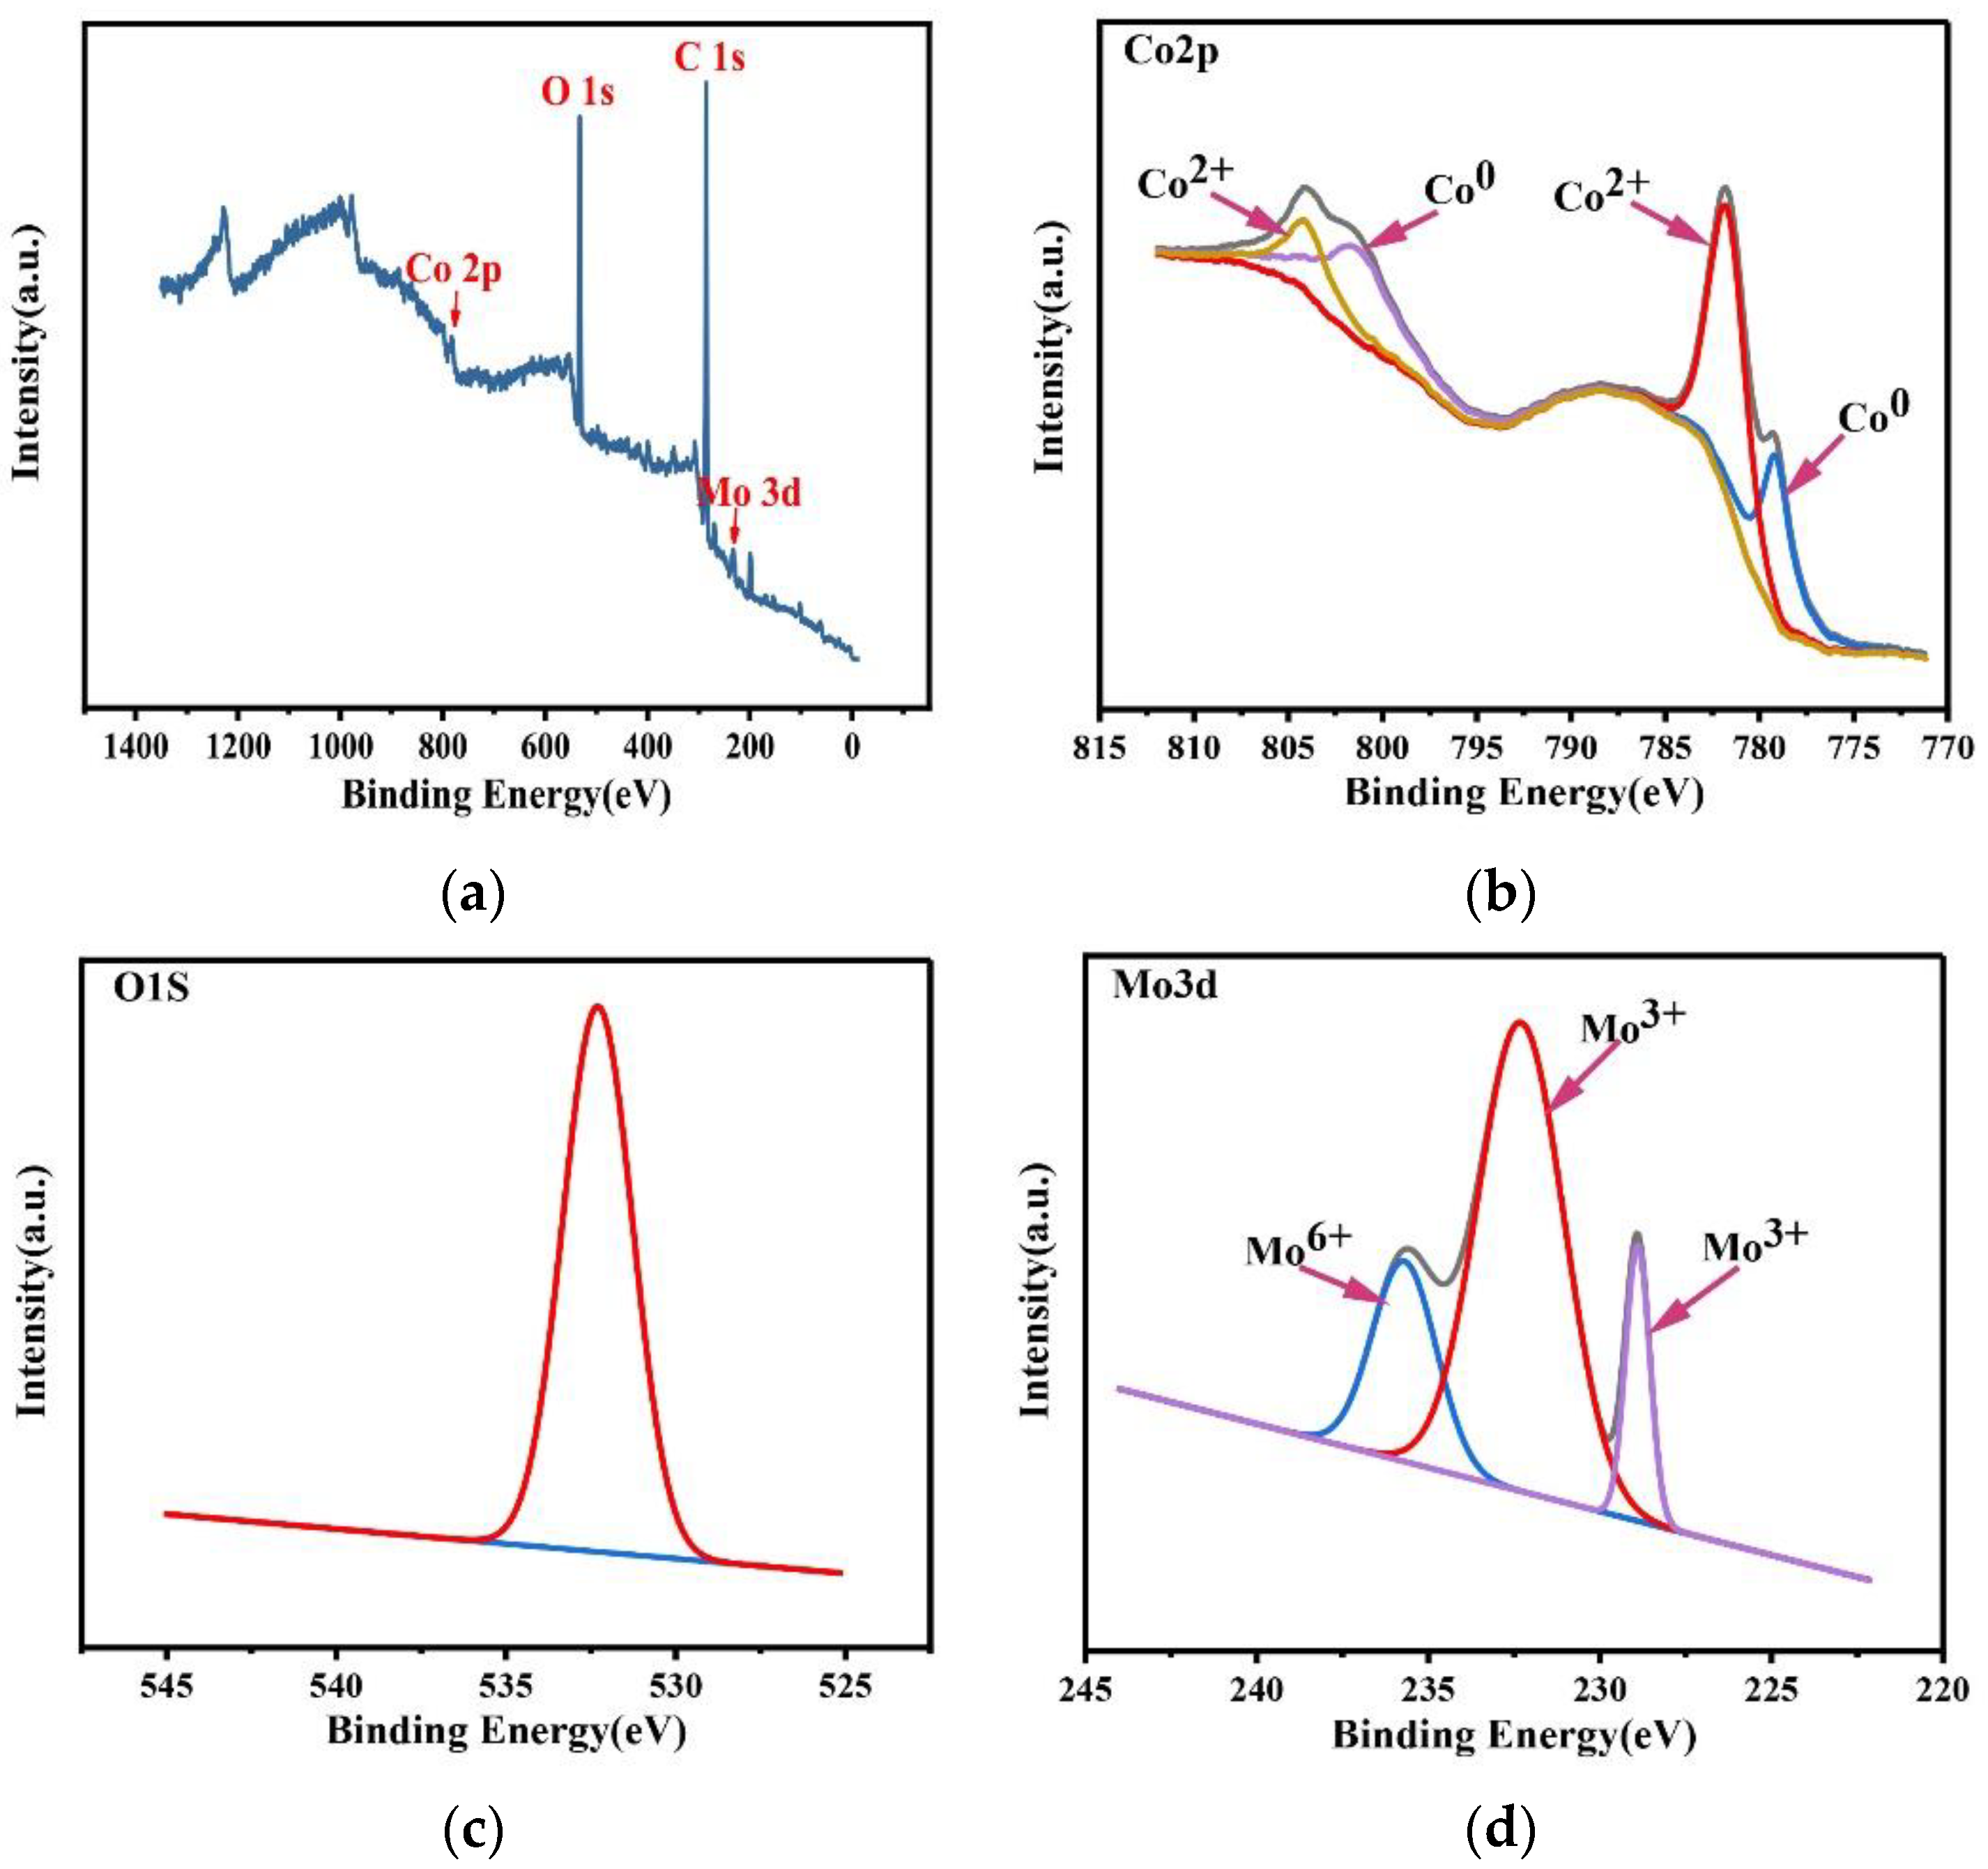
3.1.5. Characterization of Coating Surface Elements

XPS was used to test the composition and the chemical valence state of the Co–Mo coating. The XPS patterns of (a) a full spectrum of elements, (b) Co2p, (c) O1s, and (d) Mo3d of a Co–Mo coating are shown in Figure 17. As shown in Figure 17a, the peaks of O, Co, and Mo appear in the spectrum. As shown in Figure 17b, the Co2p1/2 XPS has two split peaks, belonging to Co (799.3 eV) and cobalt oxides (804.1 eV). The Co2p3/2 XPS has two split peaks, belonging to Co (779.1 eV) and cobalt oxides (781.7 eV). The coating surface forms an oxide film when exposed to air. As shown in Figure 17c, the O1s XPS has one split peak at 532.3 eV, which is related to the metal oxide. As shown in Figure 17d, the Mo3d XPS has three split peaks, belonging to Mo6+ (235.5 eV) and Mo3+ (228.9 eV and 232.3 eV). The existence of Mo6+ is due to the oxidation of Mo to MoO3, and the existence of Mo3+ is due to the oxidation of Mo to Mo2O3.
In Figure 18, it can be seen that the distribution of Co and Mo elements is uniform. Figure 18c shows the EDS pattern of the Co–Mo coating; the peaks of Co and Mo appear on the EDS pattern.

3.2. The Electrochemical Behavior of the Deposition of a Co–Mo Alloy

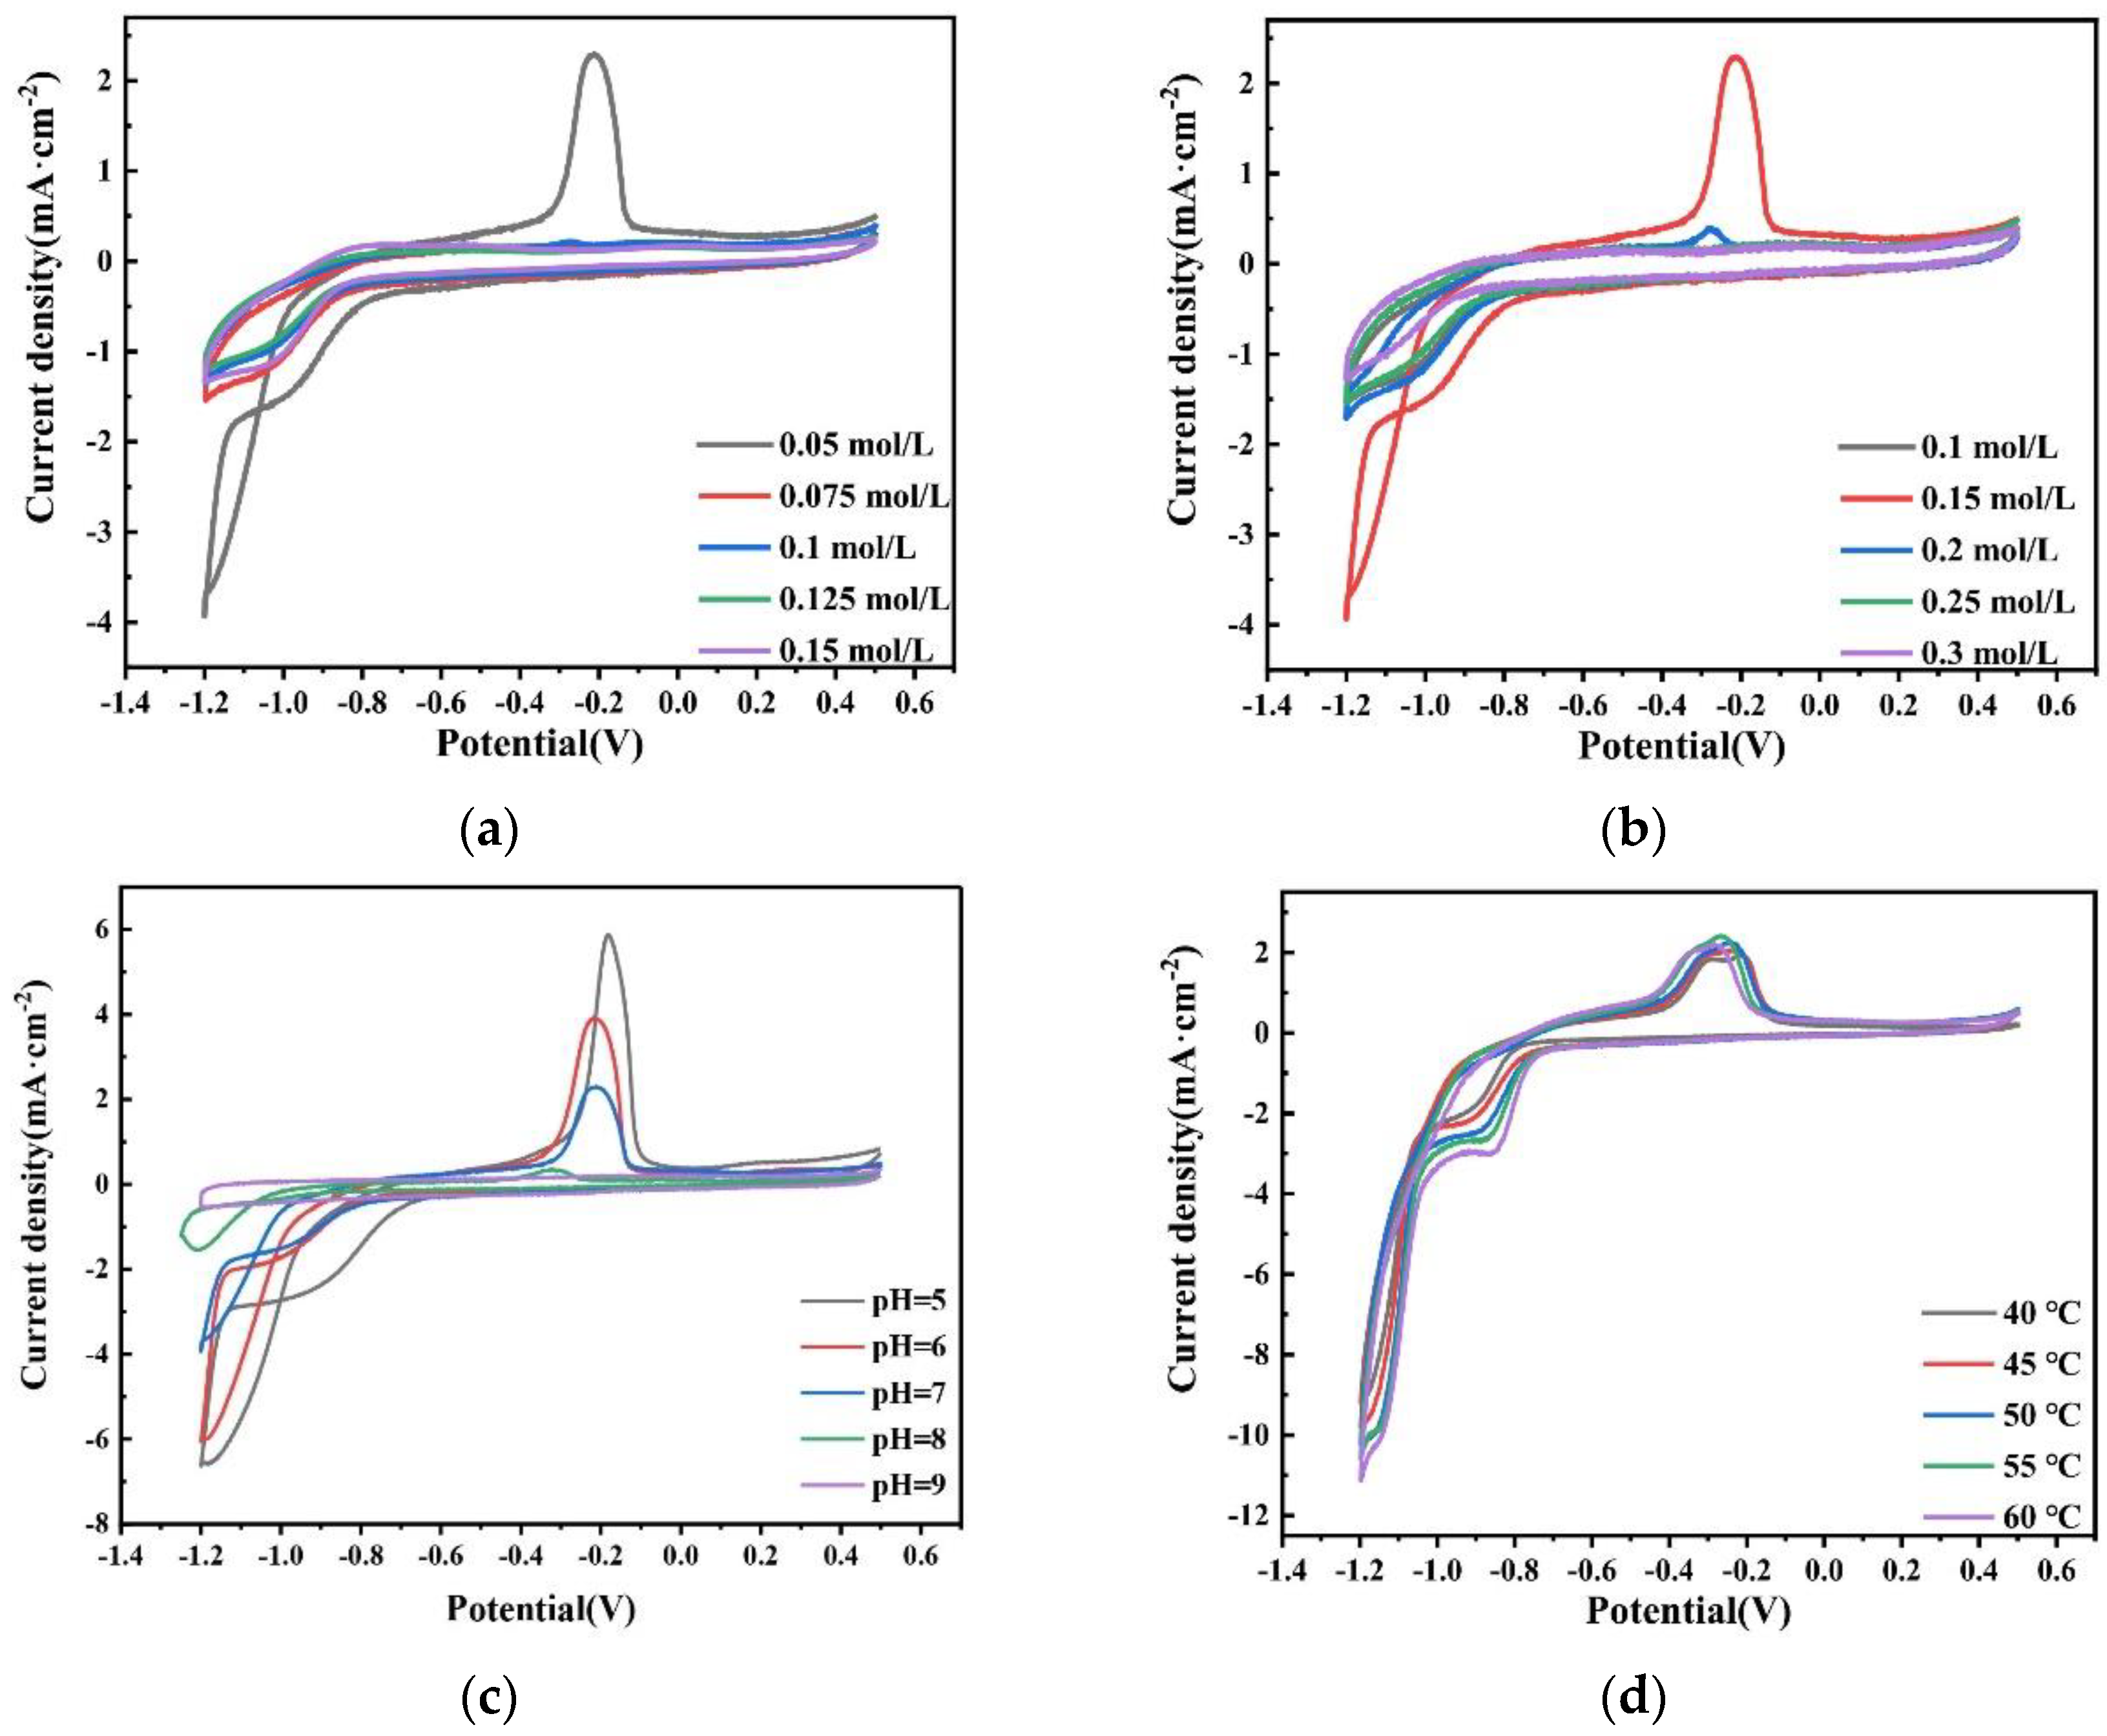
3.2.1. Deposition Potential

The more positive potential of the cathodic deposition indicates that it is easier to deposit. Figure 19a shows the CV curves of plating solutions with different Na2MoO4 concentrations on the glassy carbon electrode. With the increase in the Na2MoO4 concentration, the deposition potential of the Co–Mo alloy moves in the negative direction. The reason may be that when the concentration of Na2MoO4 increases, the concentration of the effective electrodeposited complex molybdate ion HrMoO4Cit[5−r] decreases. According to Nernst equation, the equilibrium electrode potential moves negatively and the precipitation potential moves negatively. When the concentration of Na2MoO4 is 0.05 mol/L, the reduction potential is −0.85 V. Figure 19b shows the CV curves of plating solutions with different C6H5Na3O7 concentrations on the glassy carbon electrode. With the increase in the C6H5Na3O7 concentration, the deposition potential of the Co–Mo alloy moves first in the positive direction and then in the negative direction. When the concentration of C6H5Na3O7 is 0.15 mol/L, the most positive reduction potential is −0.85 V. When the concentration of C6H5Na3O7 is appropriate, the maximum number of complex ions will be formed and the pH will not be too high, which is conducive to the deposition of complex ions. Figure 19c shows the CV curves of plating solutions with different pH values on the glassy carbon electrode. With the increase in the pH value, the deposition potential of the Co–Mo alloy moves in the negative direction; when pH is 5, the most positive reduction potential is −0.75 V. Figure 19d shows the CV curve of the plating solution on the glassy carbon electrode at different temperatures. With the increase in the temperature, the deposition potential of the Co–Mo alloy moves in a positive direction. When the temperature is 60 °C, the most positive deposition potential is −0.75 V. The CV curve shows that the Co–Mo co-deposition potential moves forward under the optimal process conditions.

3.2.2. Exchange Current Density

The exchange current density is an important kinetic parameter to evaluate the electrode reaction: The higher the exchange current density, the easier the electrode reaction. Therefore, the exchange current density i0 on the glassy carbon electrode in the bath was studied by LSV. The Butler–Volmer [26,27] equation was applied at a low cathode overpotential, which can be simplified to Equation (7). Take the logarithm of both sides of Equation (7) to obtain Equation (8).
i = i0 {−exp[(−αnF)/RT η]}
log|i| = log|i0| − αnF/RT η
where i is the current density (mA·cm−2), i0 is the exchange current density (mA·cm−2), α is the charge transfer coefficient in the cathode direction, andƞ is the overpotential.
Based on Equation (8), it can be found that under a small overpotential, i and ƞ are linearly related. When the overpotential exceeds −0.1 V, the current contribution of anode polarization is negligible. Therefore, the value of i0 can be measured by the slope of the i-η curve in a narrow potential range close to the equilibrium potential. Figure 20 shows the LSV curve of the plating solution with different factors on the copper electrode, where η is between −0.15 and −0.1 V and the polarization curve is a straight line. Log|i0| can be obtained by Tafel linear fitting.
Table 2 shows the value of the exchange current density i0 on the copper electrode in the bath. It can be seen that as the concentration of Na2MoO4 increases, the exchange current density i0 decreases; as the concentration of C6H5Na3O7 increases, the exchange current density i0 increases first and then decreases. When the concentration of C6H5Na3O7 is 0.05 mol/L, i0 reaches a maximum; as the pH increases, the exchange current density i0 decreases; as the temperature increases, the exchange current density i0 increases. The LSV curve shows that the exchange current density of Co–Mo co-deposition increases under the optimal process conditions.

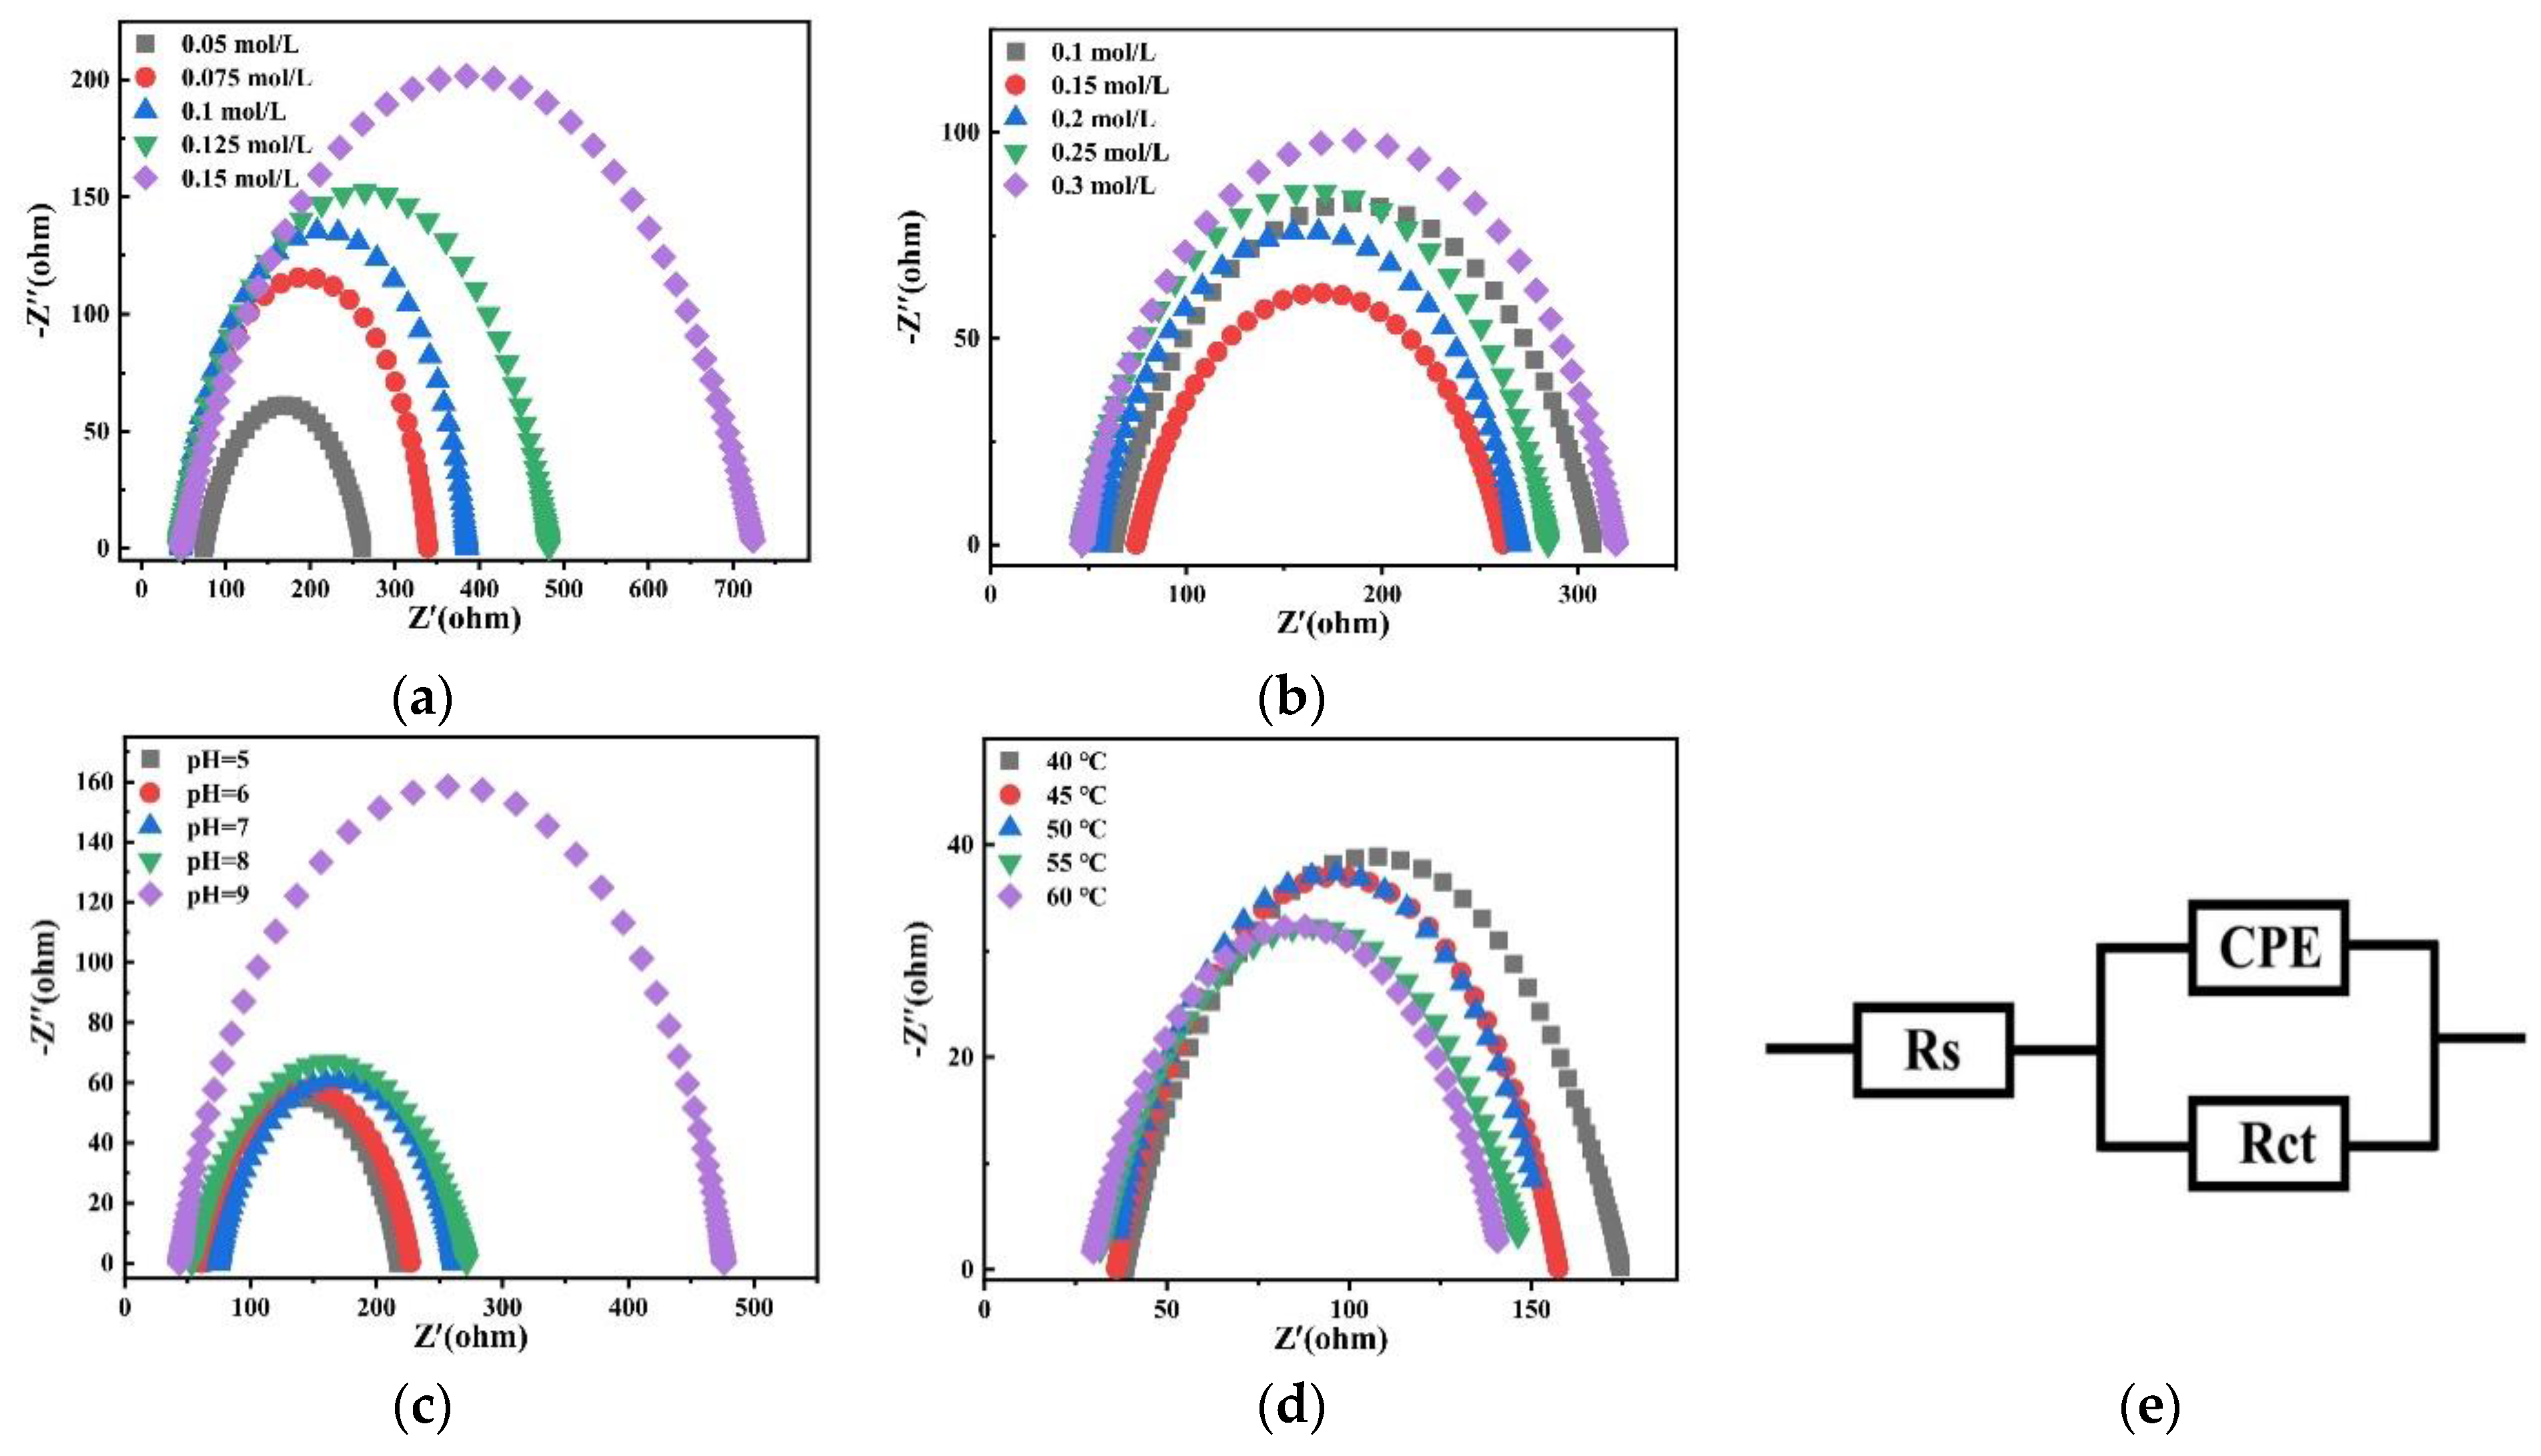
3.2.3. Charge Transfer Impedance

Charge transfer impedance is an important kinetic parameter to study alloy deposition. The smaller its value, the faster the reaction speed. Therefore, the effects of different factors on alloy deposition were studied by electrochemical impedance spectroscopy. Figure 21 shows Nyquist plots of experimental data at −1.2 V potential in the bath. It is observed that there is only one EIS spectrum composed of a semicircular arc, which indicates that the deposition of alloy is only controlled by charge transfer [28].
Figure 22 shows Nyquist plots of fitting results at −1.2 V potential in the bath. According to the impedance results, Zview software (version Zview 3.1) was used to fit the equivalent circuit and the result is shown as Figure 22e. In the circuit, Rs is the resistance of the solution, Rct is the charge transfer resistance, and constant phase angle element (CPE)is a constant phase element used to establish a more accurate fit.
Table 3 shows the charge transfer resistance Rct of the plating solution on the copper electrode with different factors. With the increase in the Na2MoO4 concentration, the charge transfer resistance Rct increases. With the increase in the C6H5Na3O7 concentration, Rct first decreases and then increases. When the concentration of C6H5Na3O7 is 0.15 mol/L, Rct reaches the minimum value. With the increase in the pH value, the charge transfer resistance Rct increases. With the increase in temperature, the charge transfer resistance Rct decreases. Electrochemical impedance spectroscopy shows that the charge transfer impedance of Co–Mo co-deposition decreases under the optimal process conditions. Therefore, the optimal process conditions are conducive to obtaining alloy coatings with a compact structure, good morphology, a high Mo content, and excellent properties.

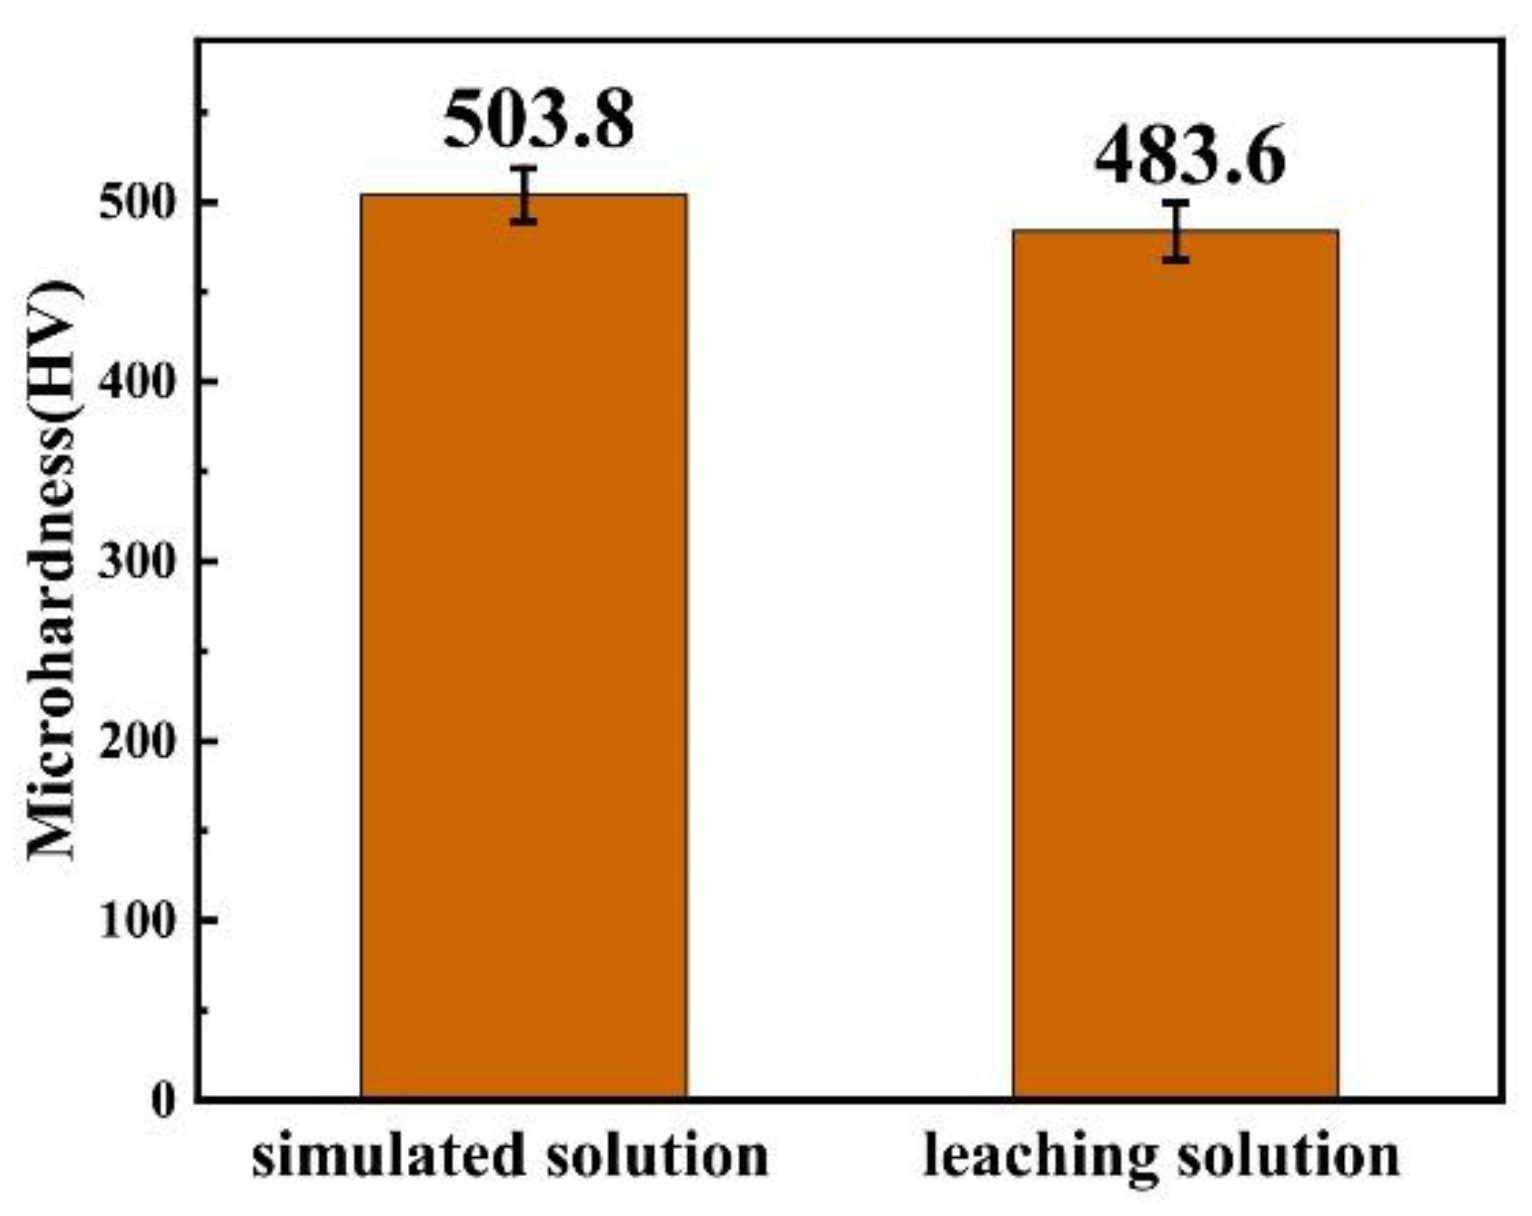
3.3. Electrodeposition of a Co–Mo Coating with a Leaching Solution of Mo-Containing Waste

In the first section, the optimal process conditions were determined by taking the simulated solution as the plating solution. In this section, CoSO4 and C6H5Na3O7 are added to the leaching solution of Mo-containing waste (only containing Mo element and a miniscule amount of impurities) to adjust the composition of the plating solution. The Co–Mo coating is prepared by electrodeposition under the optimum process conditions. The microhardness of the coating prepared under the simulated solution and the leaching solution is compared, as shown in Figure 23. It can be seen that the microhardness of the coating prepared by the leaching solution can reach a high value, of 483 HV. This shows that it is feasible to prepare high-value recycled products of Mo-containing waste by electrodeposition.

4. Conclusions

A Co–Mo coating was prepared by coordination electrodeposition in a sodium citrate system. The effects of different factors on the phase, composition, morphology, properties, and current efficiency of the coating were studied. The electrochemical mechanism of alloy deposition was deeply studied by electrochemical testing technology, and the following conclusions were drawn:
The optimum process parameters were determined as follows: the concentration of Na2MoO4 is 0.05 mol/L, the concentration of C6H5Na3O7 is 0.15 mol/L, the pH of the plating solution is 7, and the temperature is 50°C. The obtained coating had an amorphous structure with a dense nodule shape, the Mo content was 39.56%, the microhardness was 503 HV, and the current efficiency of electrodeposition was 63%.
The electrochemical mechanism of Co–Mo co-deposition was studied by means of electrochemical measurements.It was found that the optimization of process parameters is conducive to a positive shift of the reduction potential, an increase in the exchange current density, and a decrease in charge transfer impedance.
The microhardness of a Co–Mo coating prepared with aleaching solution of Mo-containing waste after component control of the plating solution is 483.6 HV, which is valuable for the high-value recycling of Mo secondary resources.

Author Contributions

Conceptualization, L.M. and X.X.; methodology, L.M.; software, Y.T.; validation, Y.T., L.M. and X.X.; formal analysis, Y.T.; investigation, Y.T.; resources, Z.N., X.X. and L.M.; data curation, Y.T.; writing—original draft preparation, Y.T.; writing—review and editing, L.M.; visualization, Y.T.; supervision, X.X.; project administration, X.X.; funding acquisition, X.X.; L.M. and Z.N. All authors have read and agreed to the published version of the manuscript.

Funding

This research was funded by the National Key Research and Development Program of China (Grant No.2018YFC1901700), Beijing Natural Science Foundation (2222049), the National Natural Science Foundation of China for Distinguished Young Scholar (Grant No.52025042), and the National Natural Science Foundation of China for Innovative Research Groups (Grant No.51621003).

Institutional Review Board Statement

Not applicable.

Informed Consent Statement

Not applicable.

Data Availability Statement

Not applicable.

Acknowledgments

The authors would like to thank the Department of Materials and Manufacturing of Beijing University of Technology for providing access to the laboratory platform, software, and hardware facilities.

Conflicts of Interest

The authors declare no conflict of interest. The funders had no role in the design of the study; in the collection, analyses, or interpretation of data; in the writing of the manuscript; or in the decision to publish the results.

References

  1. Elias, L.; Chitharanjan, A.H. A comparative study on the electrocatalytic activity of electrodeposited Ni-W and Ni-P alloy coatings. Mater. Today Proc. 2018, 5, 21156–21161. [Google Scholar] [CrossRef]
  2. Argañaraz, M.Q.; Ribotta, S.; Folquer, M.; Zelaya, E.; Llorente, C.; Ramallo-López, J.M.; Benitez, G.; Rubert, A.A.; Gassa, L.; Vela, M.; et al. The chemistry and structure of nickel–tungsten coatings obtained by pulse galvanostatic electrodeposition. Electrochim. Acta 2012, 72, 87–93. [Google Scholar] [CrossRef]
  3. Vernickaite, E.; Tsyntsaru, N.; Cesiulis, H. Electrodeposited Co-W alloys and their prospects as effective anode for methanol oxidation in acidic media. Surf. Coat. Technol. 2016, 307, 1322–1328. [Google Scholar] [CrossRef]
  4. Vernickaite, E.; Tsyntsaru, N.; Sobczak, K.; Cesiulis, H. Electrodeposited tungsten-rich Ni-W, Co-W and Fe-W cathodes for efficient hydrogen evolution in alkaline medium. Electrochim. Acta 2019, 318, 597–606. [Google Scholar] [CrossRef]
  5. Tsyntsaru, N.; Silkin, S.; Cesiulis, H.; Guerrero, M.; Pellicer, E.; Sort, J. Toward uniform electrodeposition of magnetic Co-W mesowiresarrays: Direct versus pulse current deposition. Electrochim. Acta 2016, 188, 589–601. [Google Scholar] [CrossRef] [Green Version]
  6. Stepanova, L.; Purovskaya, O. Electrodeposition of Nickel-Based alloys with tungsten and molybdenum. Met. Finish. 1998, 96, 50–53. [Google Scholar] [CrossRef]
  7. Ashraf, M.A.; Liu, Z.; Pham, B.T.; Zhang, D. Electrodeposition of superhy drophilic and binder-free Mo-doped Ni-Fe nanosheets as cost-effective and efficient bifunctional electrocatalyst for overall water splitting. J. Electroanal. Chem. 2020, 873, 114351. [Google Scholar] [CrossRef]
  8. Wasekar, N.P.; Verulkar, S.; Vamsi, M.; Sundararajan, G. Influence of molybdenum on the mechanical properties, electrochemical corrosion and wear behavior of electrodeposited Ni-Mo alloy. Surf. Coat. Technol. 2019, 370, 298–310. [Google Scholar] [CrossRef]
  9. Evaristeabc, U.; Jiangabc, G.; Yuabc, B.; Liuabc, Y.; Maabc, P. One-step electrodeposition of molybdenum nickel cobalt sulfides on ni foam for high-performance asymmetric supercapacitors. J. Energy Storage 2020, 29, 101419. [Google Scholar] [CrossRef]
  10. Yar-Mukhamedova, G.; Ved, M.; Sakhnenko, N.; Nenastina, T. Electrodeposition and properties of binary and ternary cobalt alloys with molybdenum and tungsten. Appl. Surf. Sci. 2018, 445, 298–307. [Google Scholar] [CrossRef]
  11. Gómez, E.; Pellicer, E.; Vallés, E. Influence of the bath composition and the pH on the induced cobalt-molybdenum electrodeposition. J. Electroanal. Chem. 2003, 556, 137–145. [Google Scholar] [CrossRef]
  12. Gómez, E.; Pellicer, E.; Vallés, E. Microstructures of soft-magnetic cobalt-molybdenum alloy obtained by electrodeposition on seed layer/silicon substrates. Electrochem. Commun. 2004, 6, 853–859. [Google Scholar] [CrossRef]
  13. Aaboubi, O.; Msellak, K. Magnetic field effects on the electrodeposition of CoNiMo alloys. Appl. Surf. Sci. 2017, 396, 375–383. [Google Scholar] [CrossRef]
  14. Costa, J.M.; Hori, M.S.; Neto, A.F.D.A. Effects of the forced convection and current density on the electrodeposition of Zn-Fe-Mo alloys. Chem. Phys. 2019, 527, 110502. [Google Scholar] [CrossRef]
  15. Winiarski, J.; Tylus, W.; Krawczyk, M.; Szczygieł, B. The influence of molybdenum on the electrodeposition and properties of ternary Zn-Fe-Mo alloy coatings. Electrochim. Acta 2016, 196, 708–726. [Google Scholar] [CrossRef]
  16. Hara, A.; Świątek, Z.; Ozga, P. The role of surfactants in induced electrodeposition of Zn–Mo layer from citrate solutions. J. Alloys Compd. 2020, 827, 154195. [Google Scholar] [CrossRef]
  17. Lian, Z.; Fang, X.; Han, W.; Yu, J.; Wang, Z.; Zhang, Y.; Zhu, K. Electrodeposition of tungsten coatings on molybdenum substrates and deuterium irradiation effect. Fusion Eng. Des. 2016, 112, 136–142. [Google Scholar] [CrossRef]
  18. Li, C.; Bo, X.; Li, M.; Guo, L. Facile electrodeposition fabrication of molybdenum-tungsten sulfide on carbon cloth for electrocatalytic hydrogen evolution. Int. J. Hydrogen Energy 2017, 42, 15479–15488. [Google Scholar] [CrossRef]
  19. Jiang, F.; Xue, J.; Chen, Y.; Zhang, Y. Effect of heat treatment on physical properties of tungsten coating obtained by pulse electrodeposition. Fusion Eng. Des. 2020, 150, 111332. [Google Scholar] [CrossRef]
  20. Zhu, T.; Chong, M.N.; Phuan, Y.W.; Ocon, J.D.; Chan, E.S. Effects of electrodeposition synthesis parameters on the photoactivity of nanostructured tungsten trioxide thin films: Optimisation study using response surface methodology. J. Taiwan Inst. Chem. Eng. 2016, 61, 196–204. [Google Scholar] [CrossRef]
  21. Lee, C.Y.; Mao, W.T.; Ger, M.D.; Lee, H.B. A study on the corrosion and wear behavior of nanocrystalline Ni-Mo electrodeposited coatings. Surf. Coat. Technol. 2019, 366, 286–295. [Google Scholar] [CrossRef]
  22. Valdés, M.; Sánchez, Y.; Perelstein, G.; Oliva, F.; Izquierdo-Roca, V.; Rodriguez, A.P.; Saucedo, E. Influence of Co-Electrodeposition Parameters in the Synthesis of Kesterite Thin Films for Photovoltaic. J. Alloys Compd. 2020, 839, 155679. [Google Scholar] [CrossRef]
  23. Oliveira, J.A.M.; de Almeida, A.F.; Campos, A.R.N.; Prasad, S.; Alves, J.J.N.; De Santana, R.A.C. Effect of Current Density, Temperature and Bath PH on Properties of Ni-W-Co Alloys Obtained by Electrodeposition. J. Alloys Compd. 2021, 853, 157104. [Google Scholar] [CrossRef]
  24. de Almeida, A.F.; de Souto, J.I.V.; dos Santos, M.L.; de Santana, R.A.C.; Alves, J.J.N.; Campos, A.R.N.; Prasad, S. Establishing Relationships between Bath Composition and the Properties of Amorphous Ni-Mo Alloys Obtained by Electrodeposition. J. Alloys Compd. 2021, 888, 161595. [Google Scholar] [CrossRef]
  25. Xia, F.; Li, C.; Ma, C.; Li, Q.; Xing, H. Effect of Pulse Current Density on Microstructure and Wear Property of Ni-TiN Nanocoatings Deposited Via Pulse Electrodeposition. Appl. Surf. Sci. 2021, 538, 148139. [Google Scholar] [CrossRef]
  26. Guo, S.; Wu, E.; Zhang, J. Exchange current density of Gd(III)/Gd reaction in LiCl-KCl eutectic and analysis of errors caused by various methods. Electrochim. Acta 2018, 259, 253–261. [Google Scholar] [CrossRef]
  27. Lim, K.H.; Yun, J. Study on the exchange current density of lanthanide chlorides in LiCl-KCl molten salt. Electrochim. Acta 2019, 295, 577–583. [Google Scholar] [CrossRef]
  28. Yoon, D.; Phongikaroon, S. Measurement and Analysis of Exchange Current Density for U/U3+ Reaction in LiCl-KCl Eutectic Salt via Various Electrochemical Techniques. Electrochim. Acta 2017, 227, 170–179. [Google Scholar] [CrossRef] [Green Version]
Figure 1. The XRD patterns of Co–Mo coatings with different concentrations of Na2MoO4.
Coatings 12 00739 g001
Figure 2. SEM of Co–Mo coatings under different concentrations of Na2MoO4: (a) 0.05 mol/L; (b) 0.075 mol/L; (c) 0.1 mol/L; and (d) 0.125 mol/L.
Coatings 12 00739 g002
Figure 3. The effect of the concentration of Na2MoO4 on the composition and current efficiency of the Co–Mo coatings.
Coatings 12 00739 g003
Figure 4. The microhardness of Co–Mo coatings with different concentrations of Na2MoO4.
Coatings 12 00739 g004
Figure 5. The XRD patterns of Co–Mo coatings with different concentrations of C6H5Na3O7.
Coatings 12 00739 g005
Figure 6. SEM of Co–Mo coatings under different concentrations of C6H5Na3O7: (a) 0.1 mol/L; (b) 0.15 mol/L; (c) 0.2 mol/L; and (d) 0.25 mol/L.
Coatings 12 00739 g006
Figure 7. The effect of the concentration of C6H5Na3O7 on the composition and current efficiency of the Co–Mo coatings.
Coatings 12 00739 g007
Figure 8. The microhardness of Co–Mo coatings with different concentrations of C6H5Na3O7.
Coatings 12 00739 g008
Figure 9. The XRD patterns of Co–Mo coatings under different pH values.
Coatings 12 00739 g009
Figure 10. SEM of Co–Mo coatings under different pH values: (a) pH = 6; (b) pH = 7; (c) pH = 8; and (d) pH = 9.
Coatings 12 00739 g010
Figure 11. The effect of pH on the composition and current efficiency of the Co–Mo coatings.
Coatings 12 00739 g011
Figure 12. The microhardness of Co–Mo coatings under different pH values.
Coatings 12 00739 g012
Figure 13. The XRD patterns of Co–Mo coatings under different temperatures.
Coatings 12 00739 g013
Figure 14. SEM of Co–Mo coatings under different temperatures: (a) 40 °C; (b) 45 °C; (c) 50 °C; and (d) 55 °C.
Coatings 12 00739 g014
Figure 15. The effect of temperature on the composition and current efficiency of the Co–Mo coatings.
Coatings 12 00739 g015
Figure 16. The microhardness of Co–Mo coatings under different temperatures.
Coatings 12 00739 g016
Figure 17. XPS spectra of a Co–Mo coating: (a) full spectrum of elements, (b) Co2p, (c) O1s, and (d) Mo3d.
Coatings 12 00739 g017
Figure 18. Co Kα1 (a), Mo Lα1 (b) element mapping, and EDS pattern (c) of a Co–Mo coating.
Coatings 12 00739 g018
Figure 19. CV curves obtained on the glassy carbon electrode in the bath with different (a) concentration of Na2MoO4; (b) concentrations of C6H5Na3O7; (c) pH; and (d) temperatures.
Coatings 12 00739 g019
Figure 20. LSV curves obtained on the copper electrode in the bath with different (a) concentrations of Na2MoO4; (b) concentrations of C6H5Na3O7; (c) pH; and (d) temperatures.
Coatings 12 00739 g020
Figure 21. Nyquist plots of experimental data at −1.2 V obtained on the copper electrode in the bath with different (a) concentrations of Na2MoO4; (b) concentrations of C6H5Na3O7; (c) pH; and (d) temperatures.
Coatings 12 00739 g021aCoatings 12 00739 g021b
Figure 22. Nyquist plots of fitting results at −1.2 V obtained on the copper electrode in the bath with different (a) concentrations of Na2MoO4; (b) concentrations of C6H5Na3O7; (c) pH; and (d) temperatures and (e) an equivalent circuit.
Coatings 12 00739 g022
Figure 23. The microhardness of the coating prepared under the simulated solution and the leaching solution.
Coatings 12 00739 g023
Table 1. Bath composition and electroplating parameters for the deposition of coatings.
Bath CompositionElectrodeposition Conditions
CoSO40.1 mol/LpH6~9
Na2MoO40.05~0.15 mol/LTemperature40~60 °C
C6H5Na3O70.1~0.3 mol/LCurrent density1 A·dm−2
C12H25SO4Na1 g/LDeposition time2 h
Table 2. The value of the exchange current density i0 on the copper electrode in the bath.
FactorParameteri0
CNa2MoO4 (mol/L)0.050.0703
0.0750.0702
0.10.0687
0.1250.0534
0.150.0385
CC6H5Na3O7 (mol/L)0.10.0661
0.150.0703
0.20.0523
0.250.0313
0.30.0150
pH50.1296
60.0912
70.0703
80.0314
90.0158
Temperature (°C)400.1975
450.2306
500.2413
550.2452
600.2458
Table 3. The value of Rs and Rct on the copper electrode in the bath.
FactorParameterRsRct
CNa2MoO4 (mol/L)0.054.458713.9000
0.0753.391920.5874
0.13.321223.9291
0.1253.136130.9588
0.153.335347.9219
CC6H5Na3O7 (mol/L)0.14.239815.4158
0.154.458713.9000
0.24.592216.7228
0.254.733516.8429
0.35.016119.2591
pH53.882911.0002
64.167212.1587
74.458713.9000
83.754315.4511
93.579130.5490
Temperature (°C)402.71299.6225
452.55398.5698
502.44238.4991
552.15198.3437
602.03188.0187
Publisher’s Note: MDPI stays neutral with regard to jurisdictional claims in published maps and institutional affiliations.

