
An Experimental Study on Dynamic Characteristics of Coarse-Grained Soil under Step Cyclic Loading

 , and
, and
Abstract
:1. Introduction
2. Test Preparation
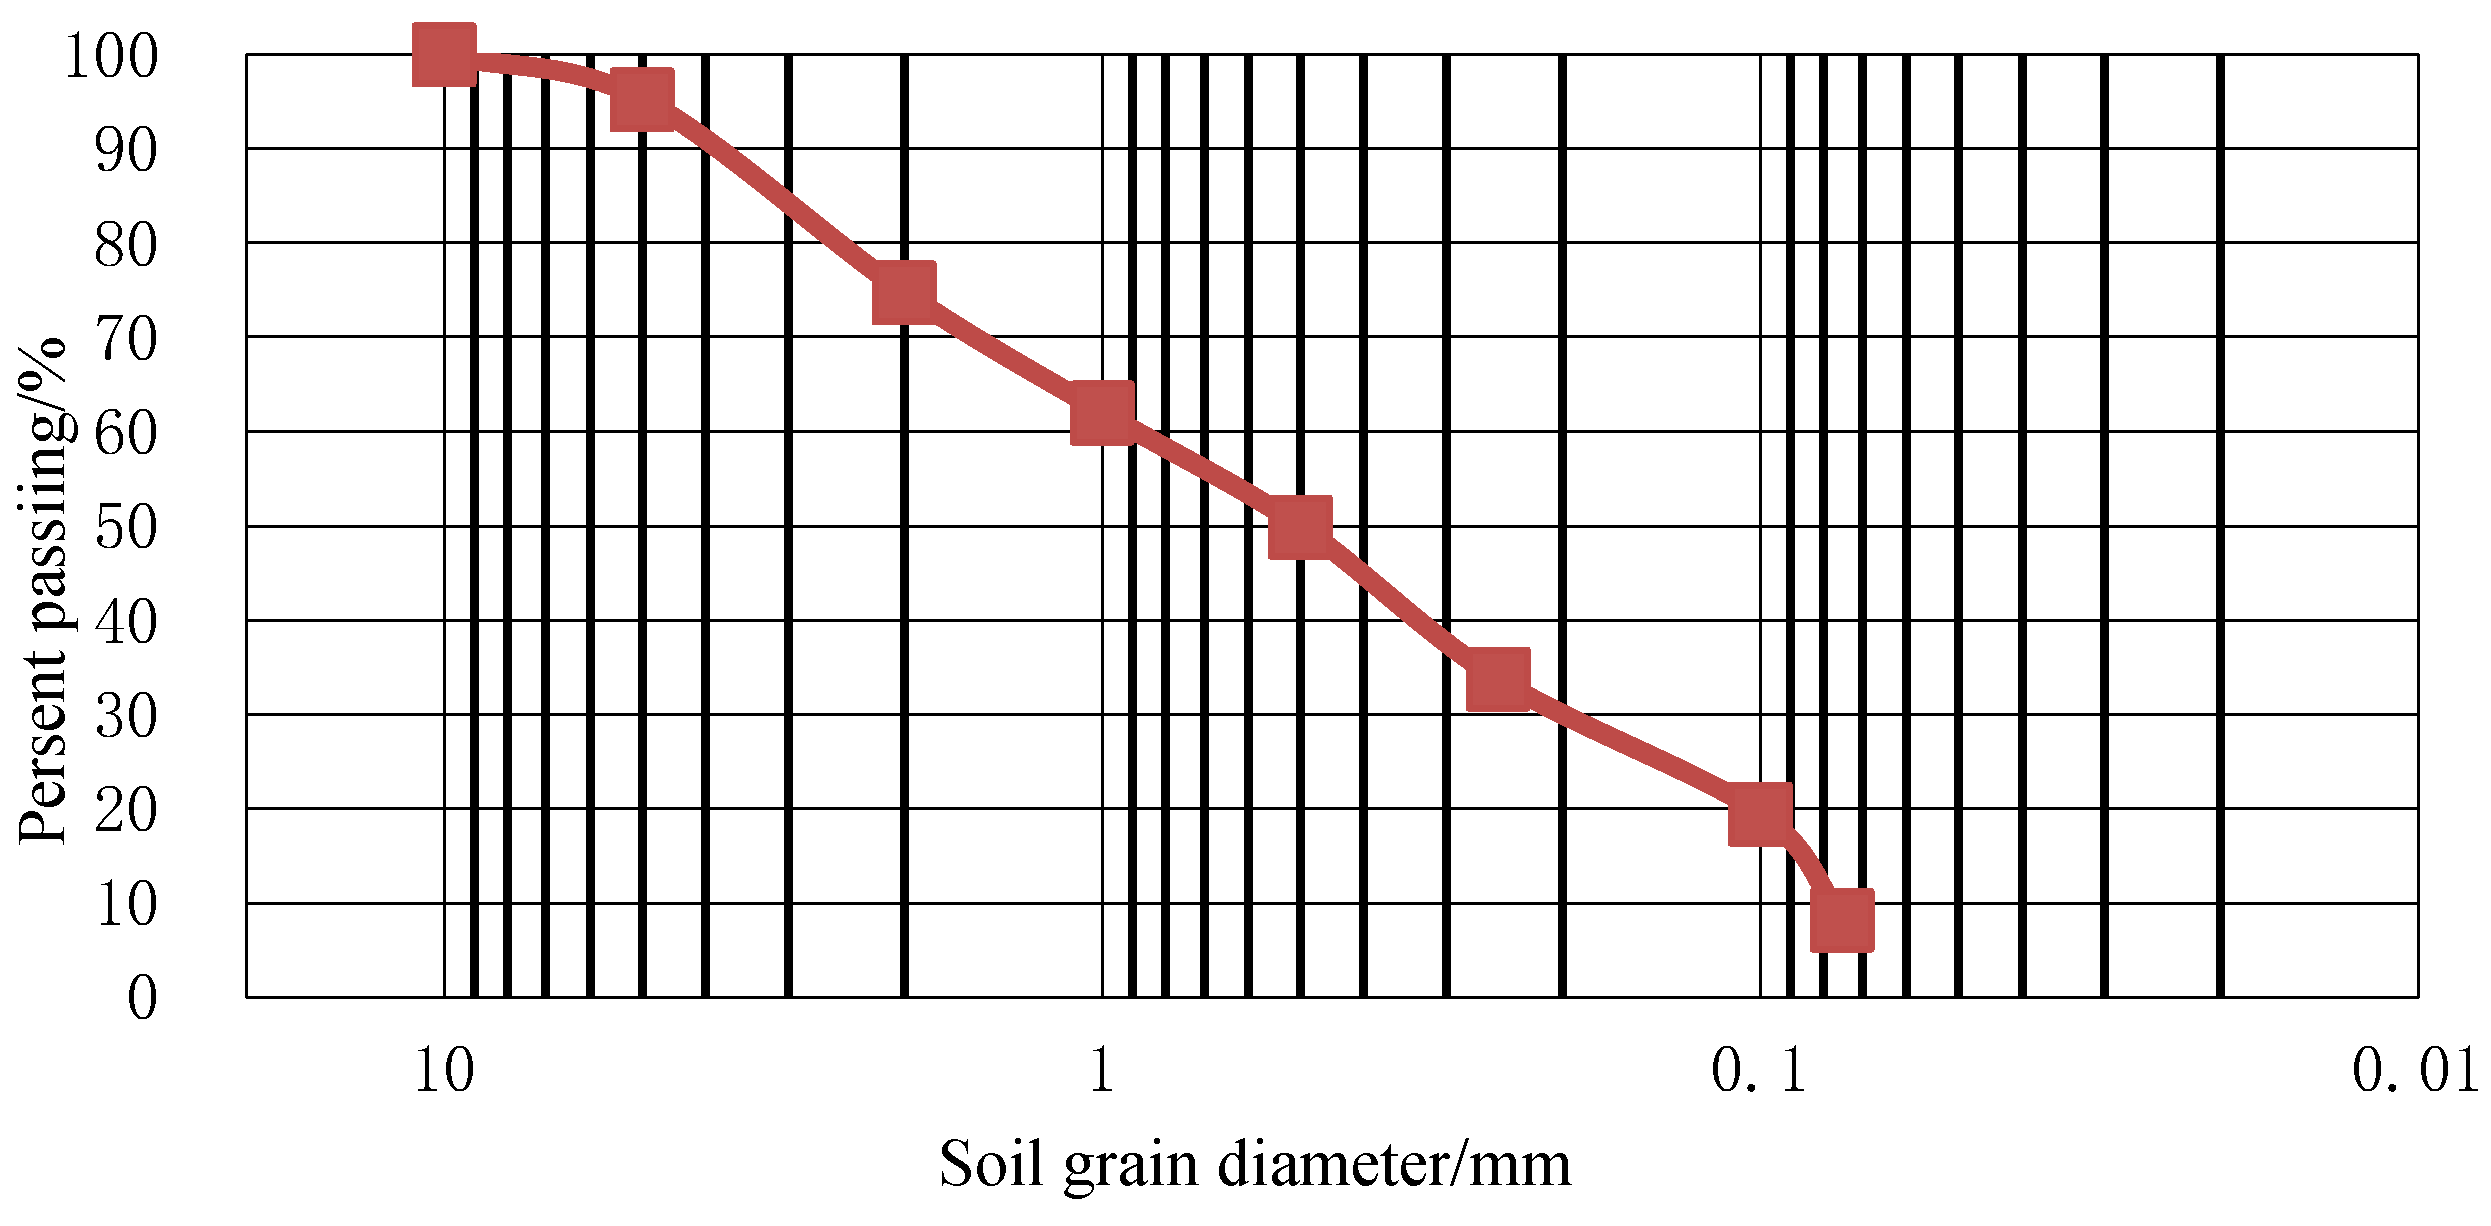
2.1. Raw Materials
2.2. Test Principle
2.3. Test Program
- (1)
- Specimen specification: φ 50 mm × h 100 mm.
- (2)
- Moisture content of the specimen: We adopted the optimum moisture content, and the standard compaction test result was 8%.
- (3)
- Specimen compaction: We adopted compaction of 100%, divided into three layers and tamped manually.
- (4)
- Loading method: We adopted the loading method step-by-step. The dynamic stress amplitude started from 20 kPa, and then increased by 20 kPa at each stage of loading. Loading was stopped when the dynamic stress amplitude reached 200 kPa or the cumulative deformation reached 5% of the initial height. The number of cycles during each stage of loading was 20.
- (5)
- Drainage conditions: without drainage.
2.4. Test Steps
- (1)
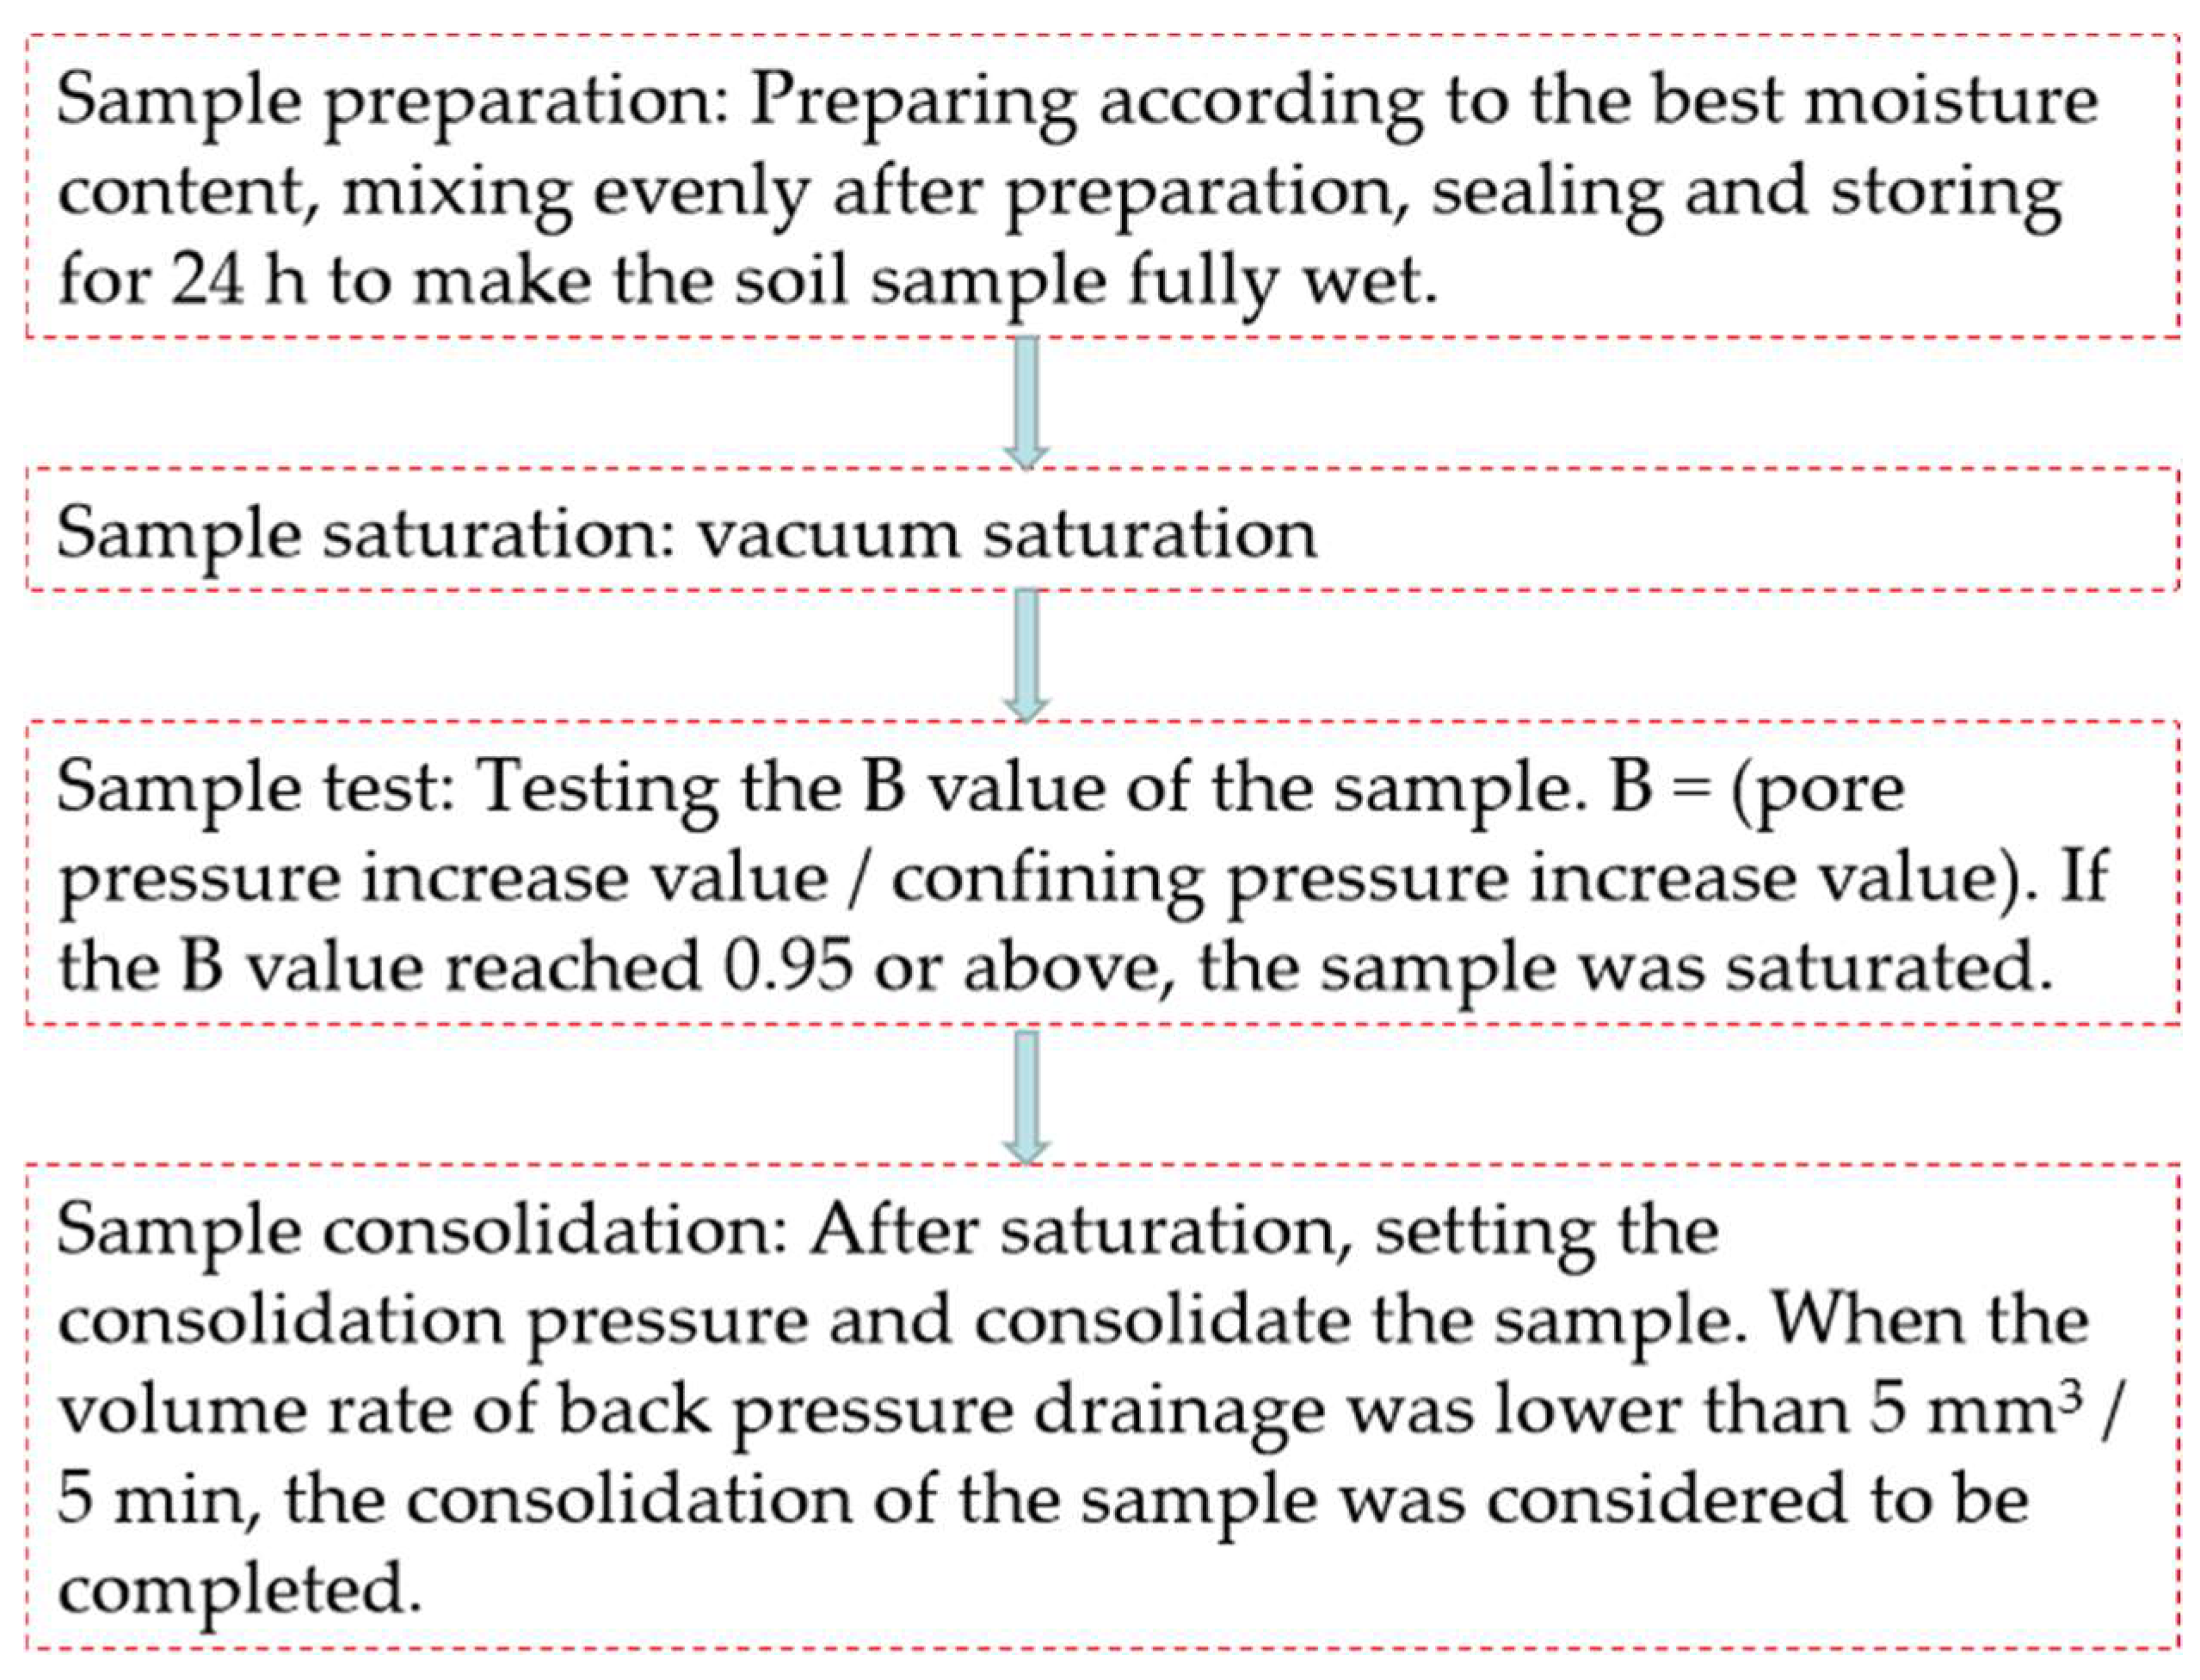
- Triaxial sample preparation: We prepared the crushed coarse-grained soil sample after drying at the optimum moisture content, mixed them evenly after preparation, and sealed and stored them for 24 h, to make the soil sample fully wet.
- (2)
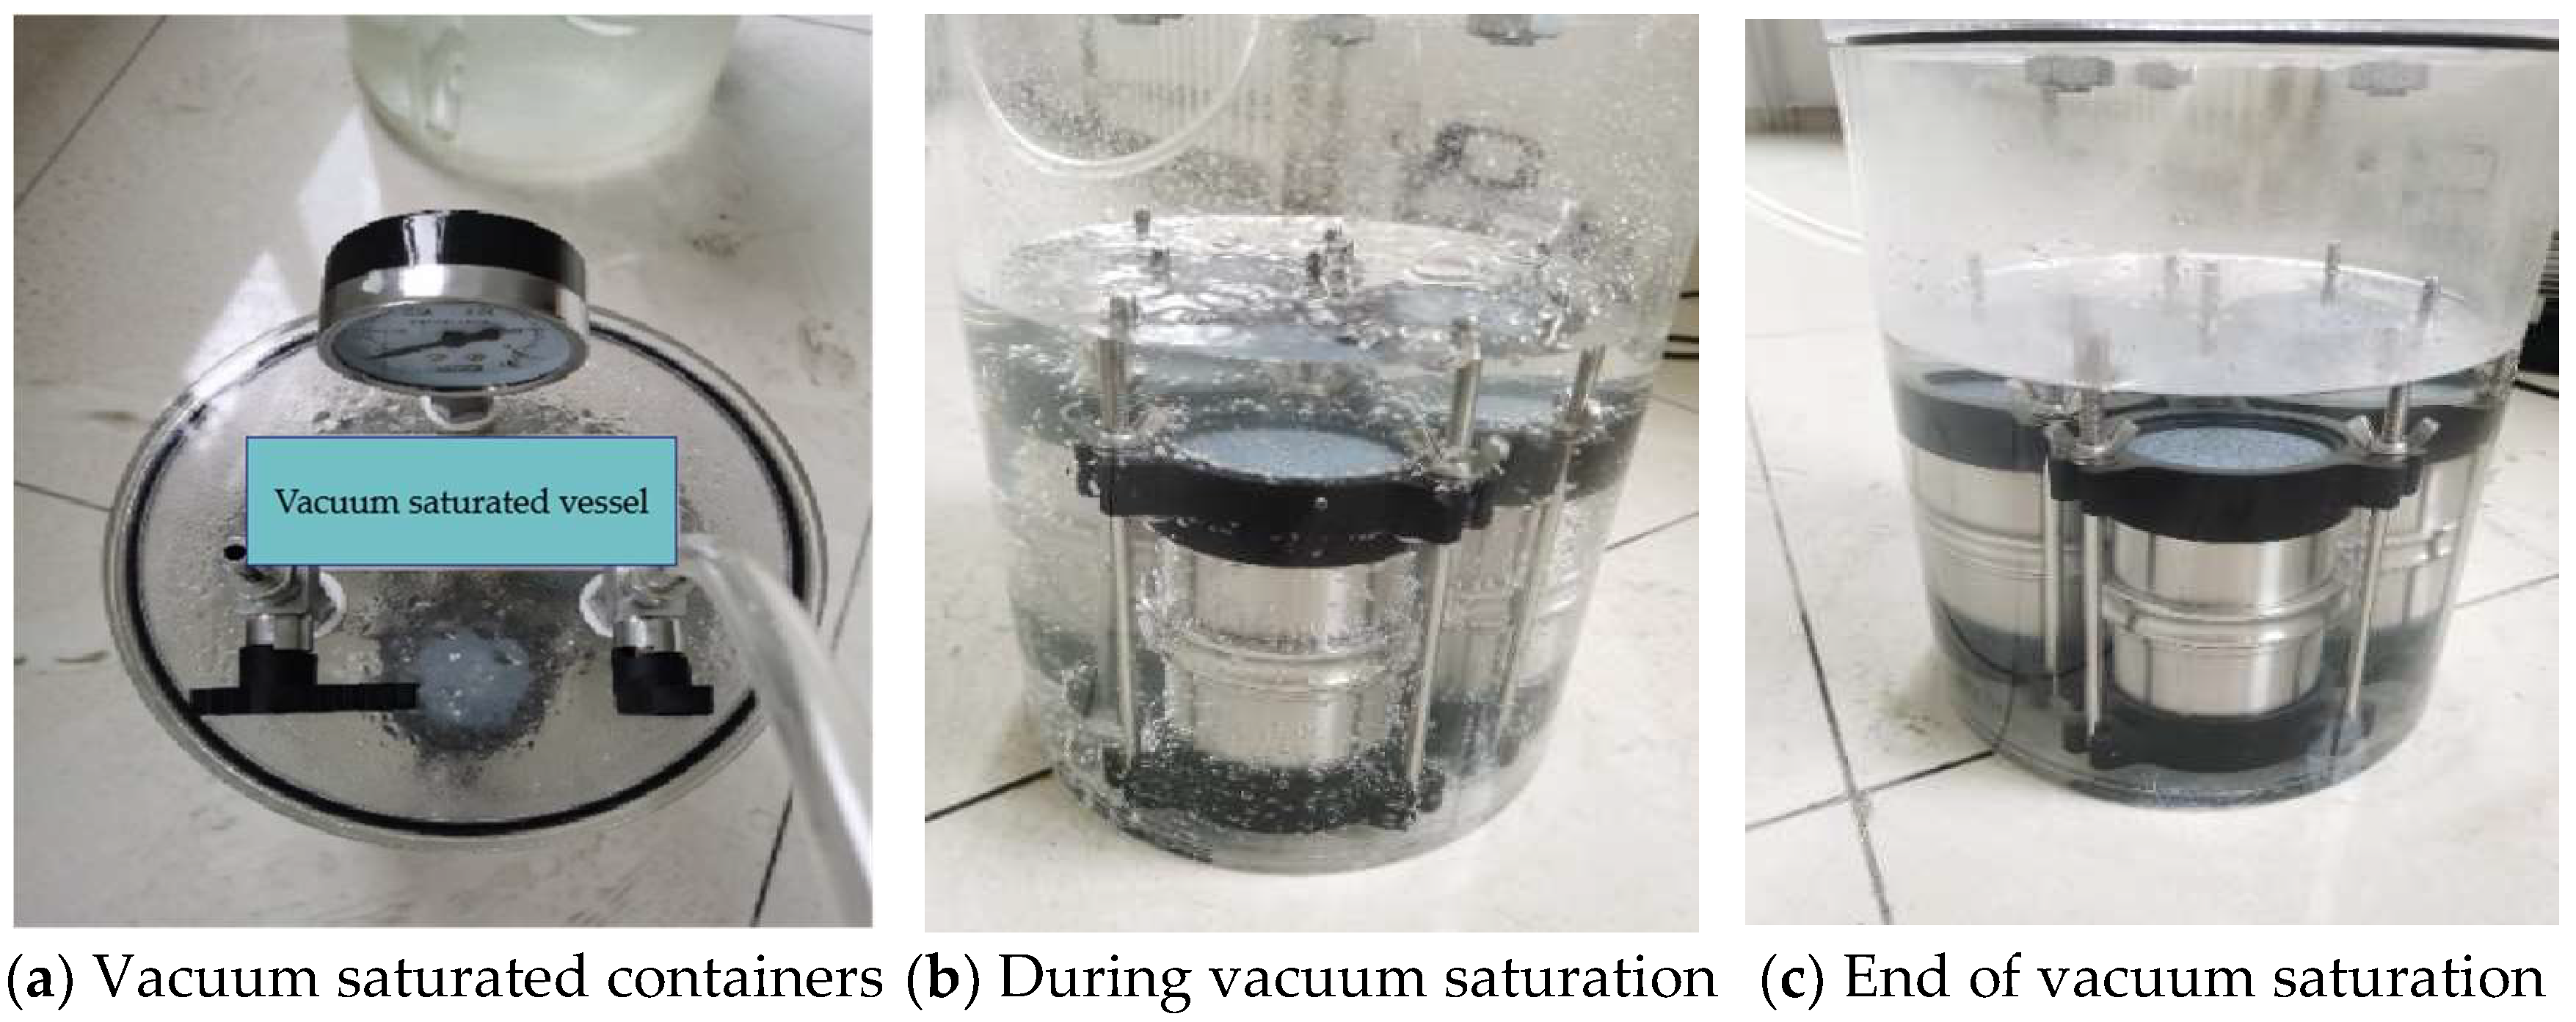
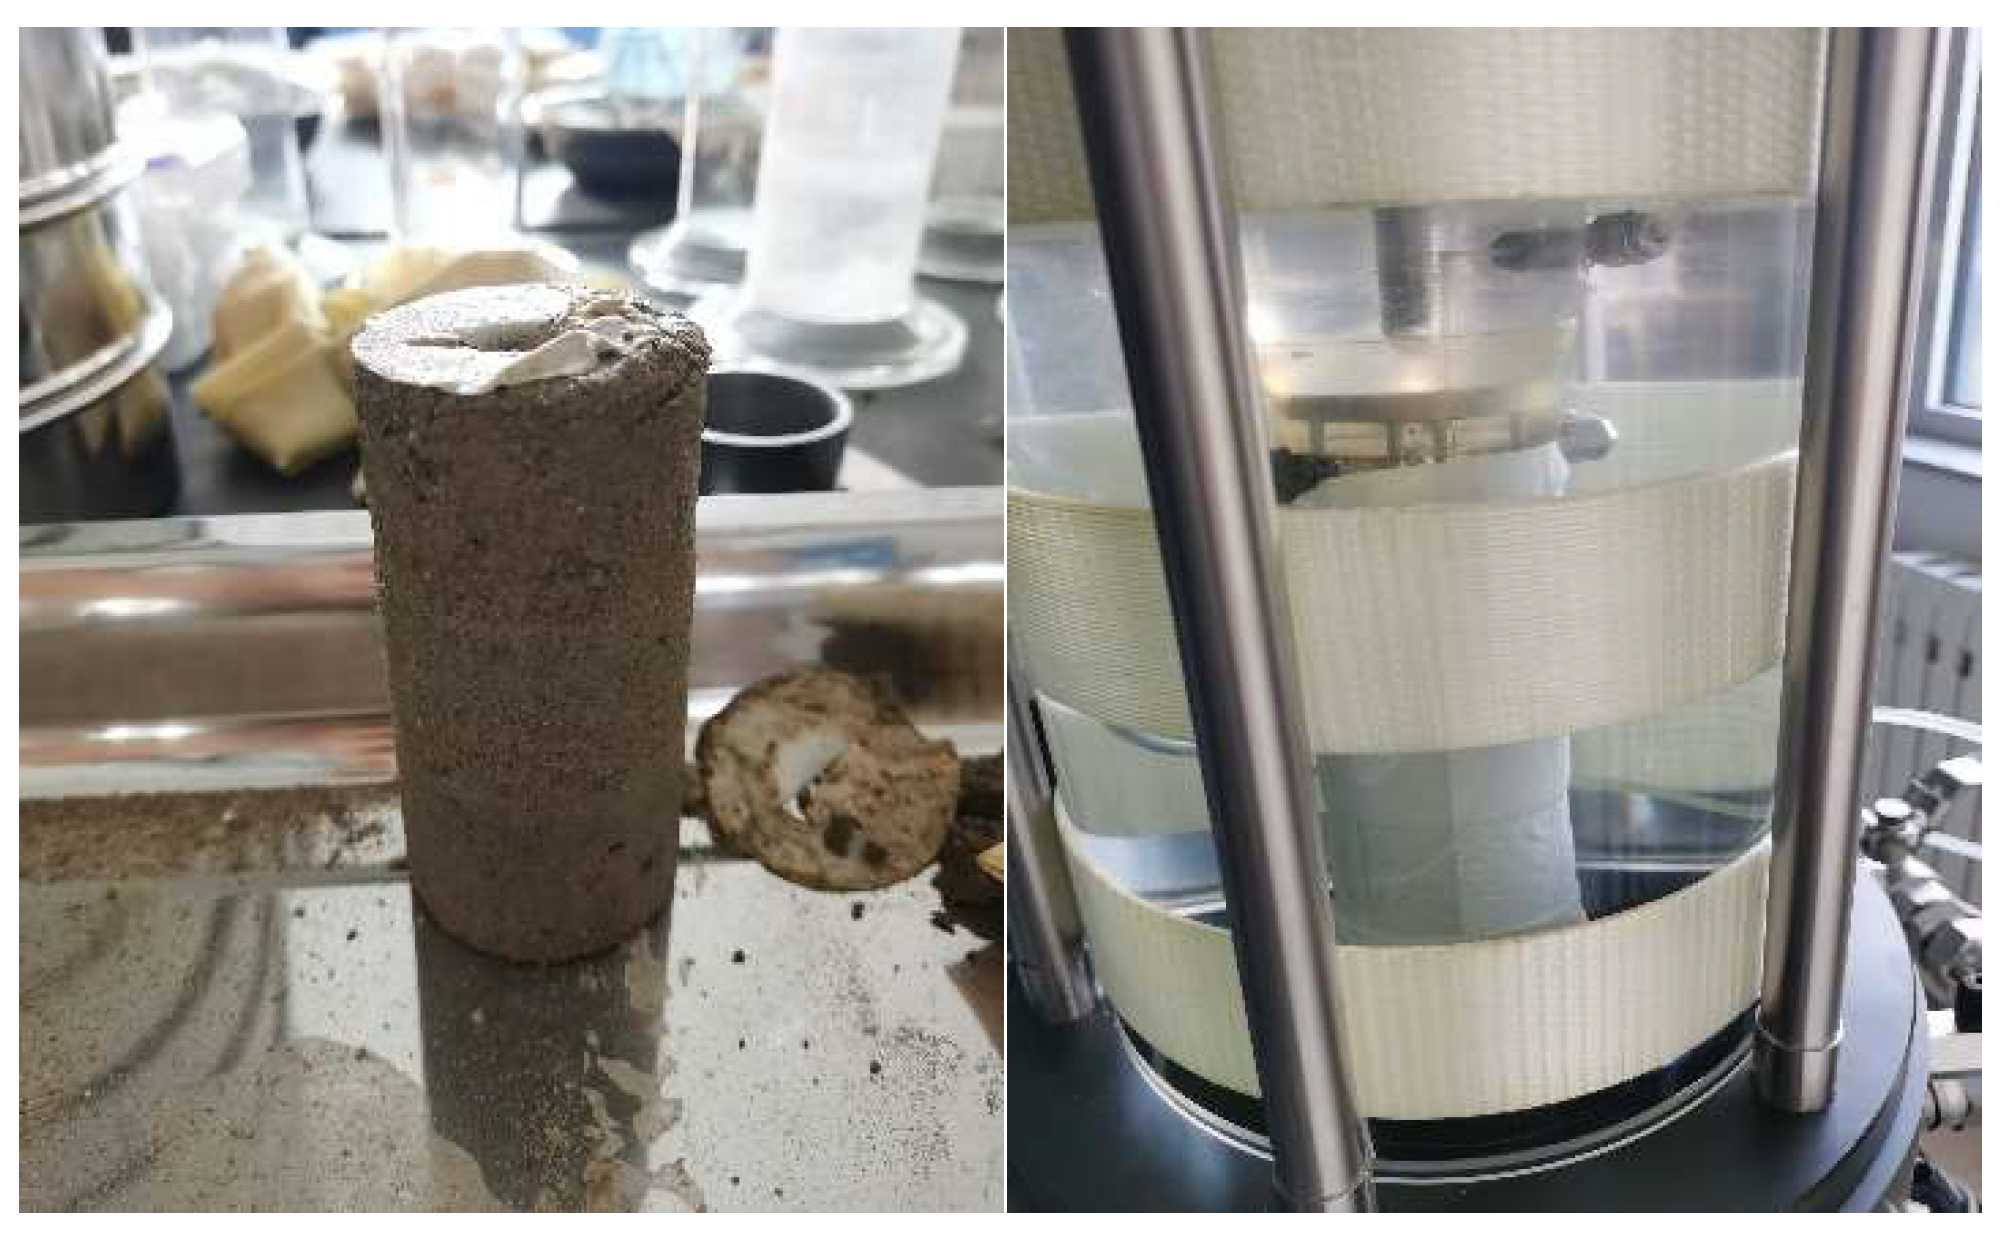
- Sample saturation: We adopted vacuum saturation, as shown in Figure 4. After completing vacuum saturation, we tested the B value of the sample. After the B value reached 0.95 or above, the sample was saturated.
- (3)
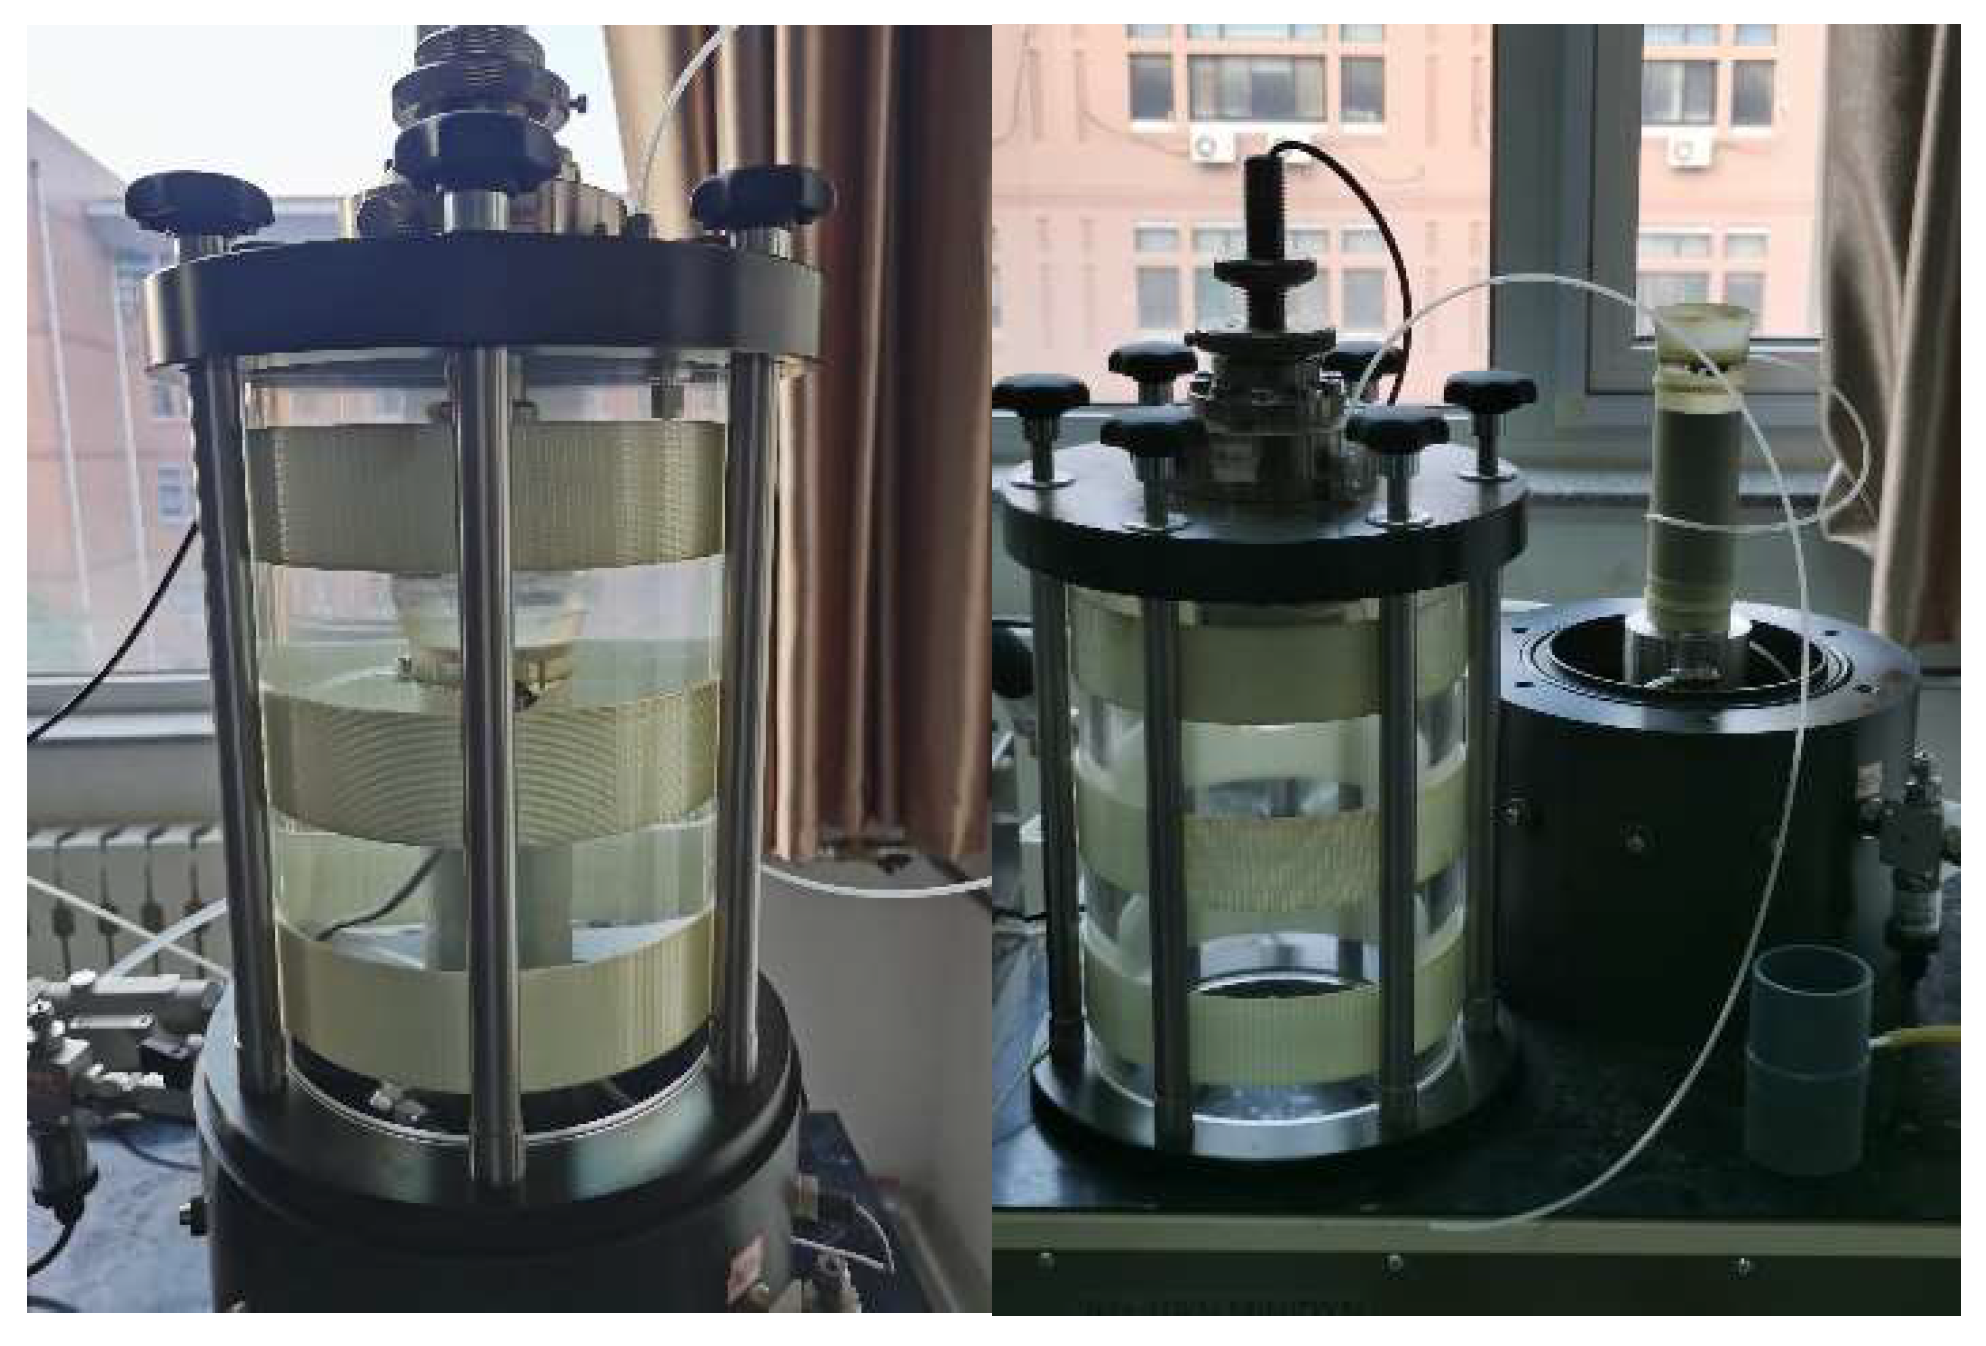
- Sample installation: We adjusted the base to proper position, by exhausting the base to ensure that the center axis of the sample coincides with the center of the upper fixed axis. Then, we installed the pressure chamber and, finally, filled the pressure chamber with water.
- (4)
- Sample consolidation: After saturation, we set the consolidation pressure and consolidated the sample. When the volume rate of the back-pressure drainage was lower than 5 mm3/5 min, the consolidation of the sample was considered completed.
- (5)
- Applying dynamic load: According to the requirements of the test scheme, we gradually applied the load to the sample.
- (6)
- Unloading and removing sample: After completing loading, we reduced the confining pressure and back pressure to 0, drained the water, removed the samples and cleaned the instrument.
- (1)
- When the sample was subjected to a cyclic dynamic load, the increase in pore water pressure reached the initial consolidation confining pressure for the first time. At this time, the effective stress was zero or minimum, and the test was terminated.
- (2)
- When the specimen was subjected to a cyclic dynamic load and the double amplitude axial strain reached 5%, the test was terminated.
3. Analysis of Test Results for Hysteretic Curve of Coarse-Grained Soil
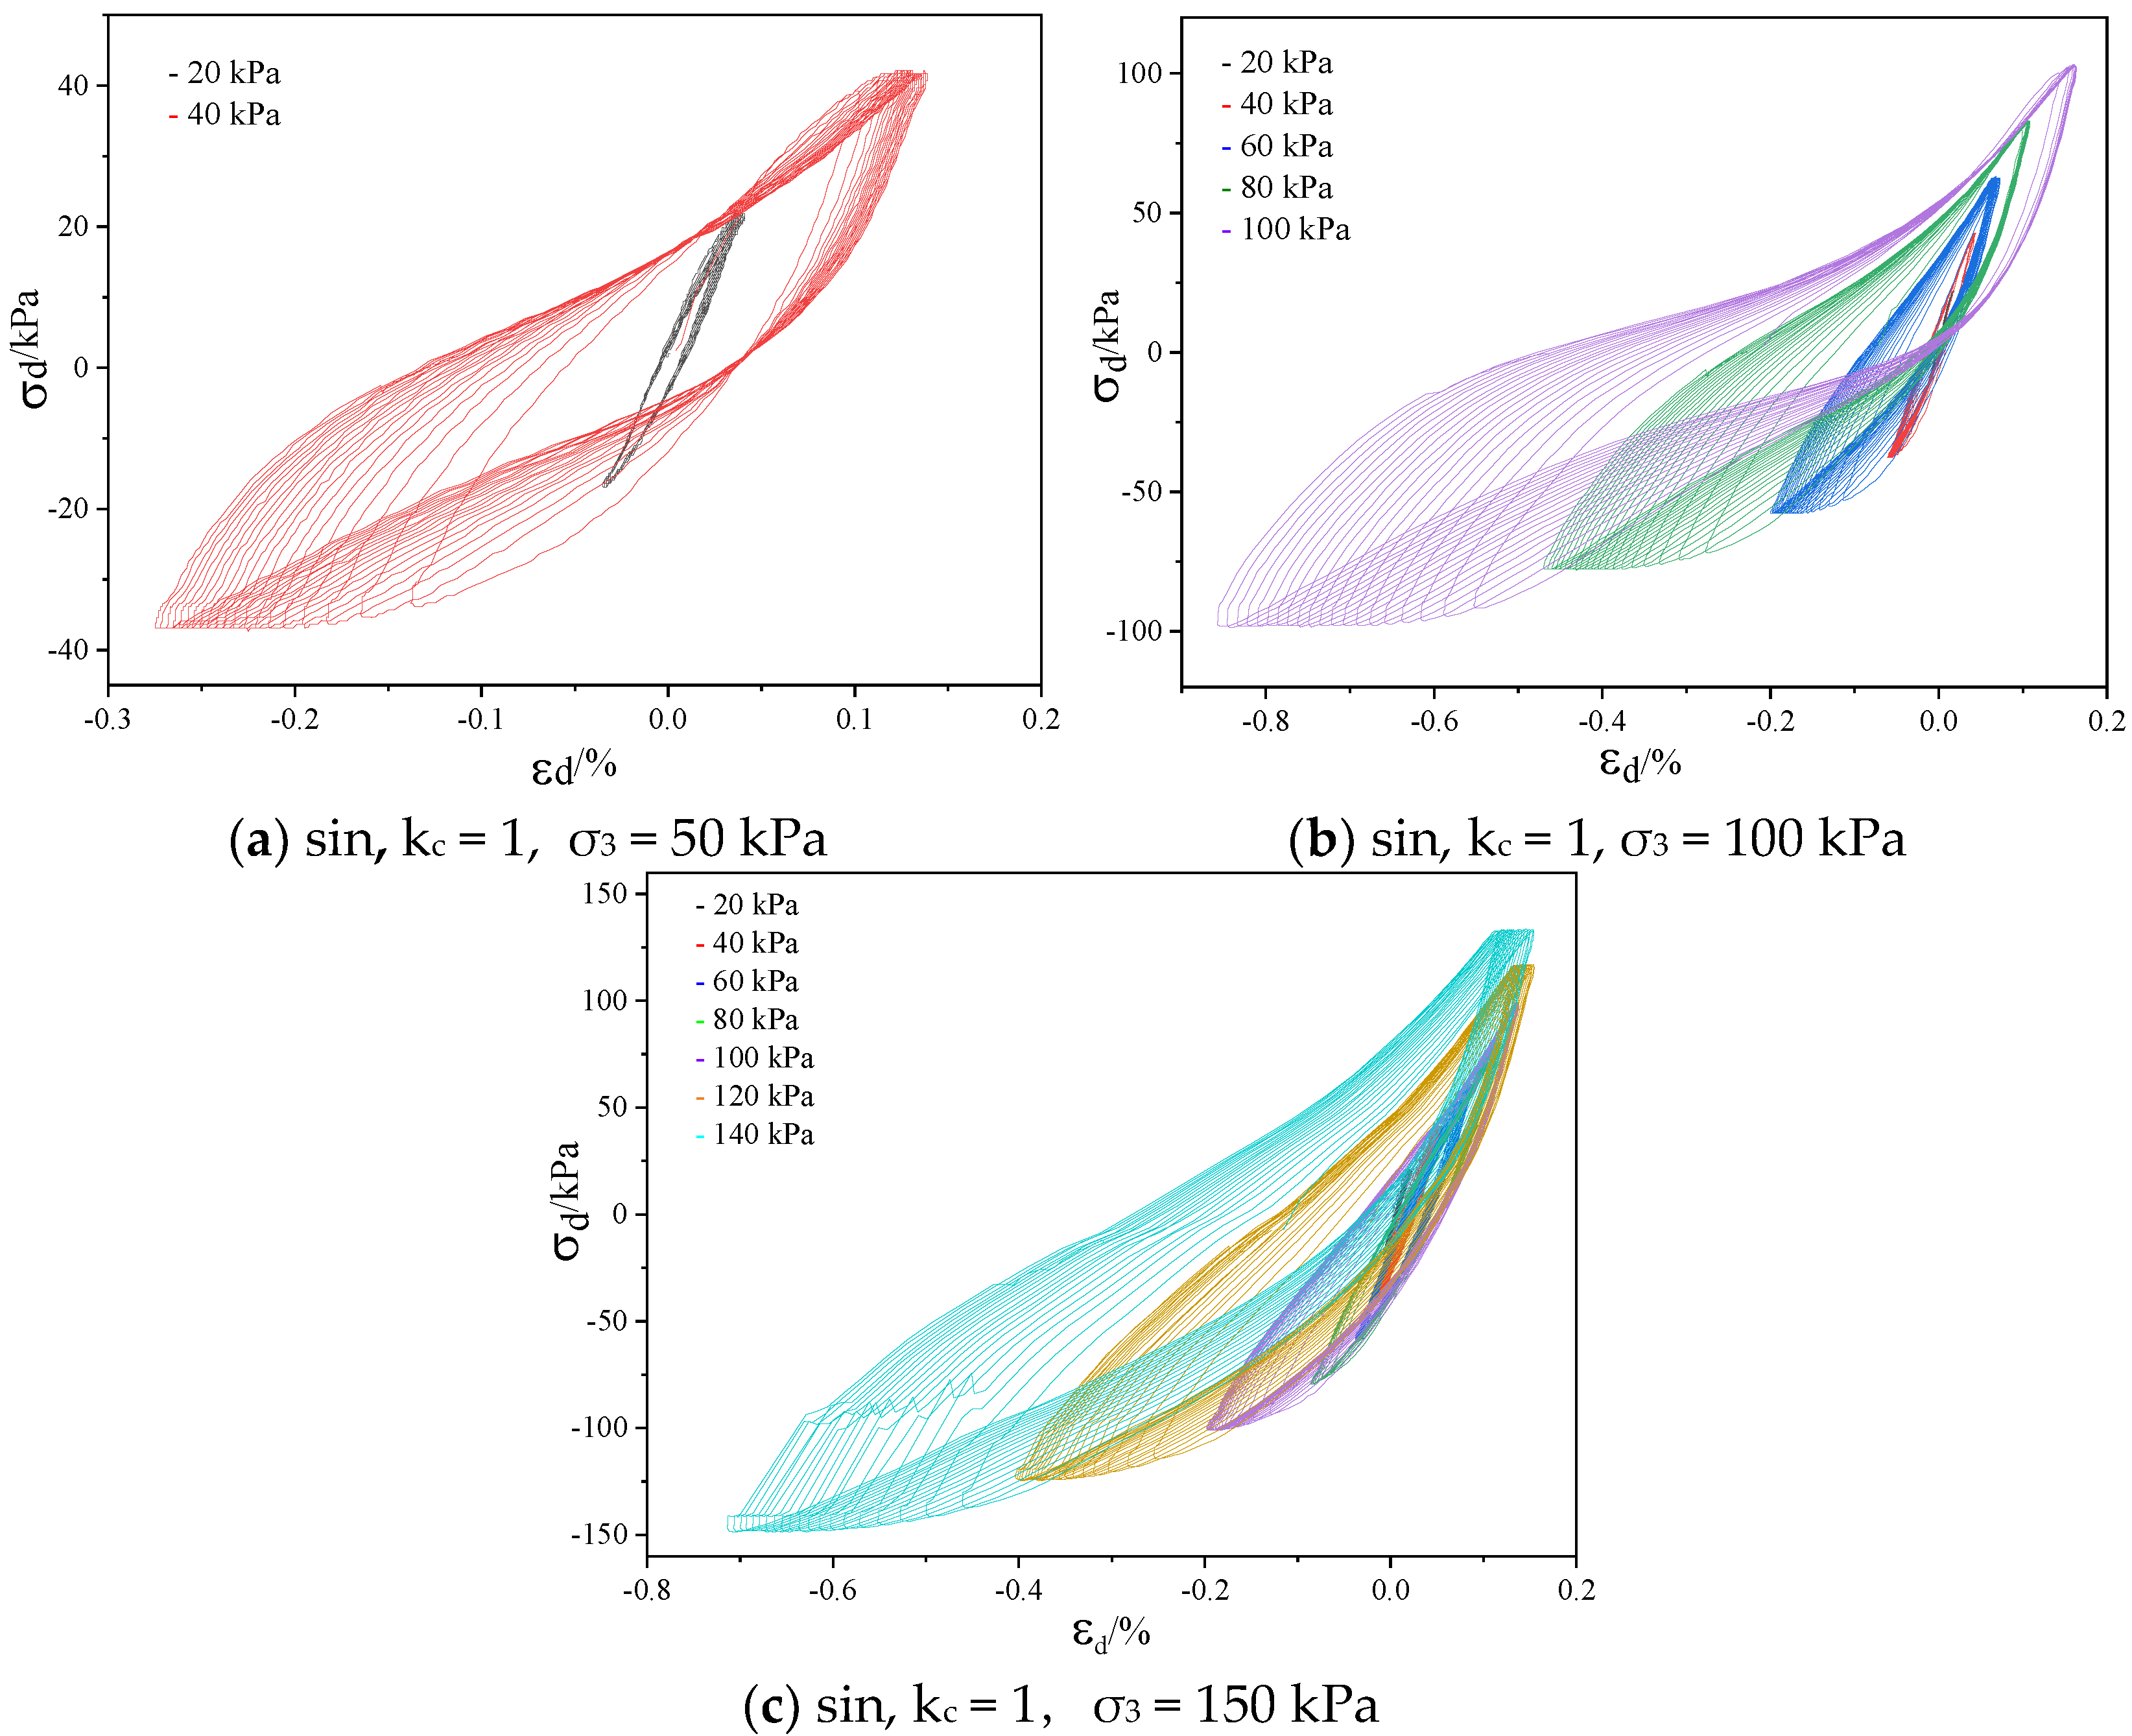
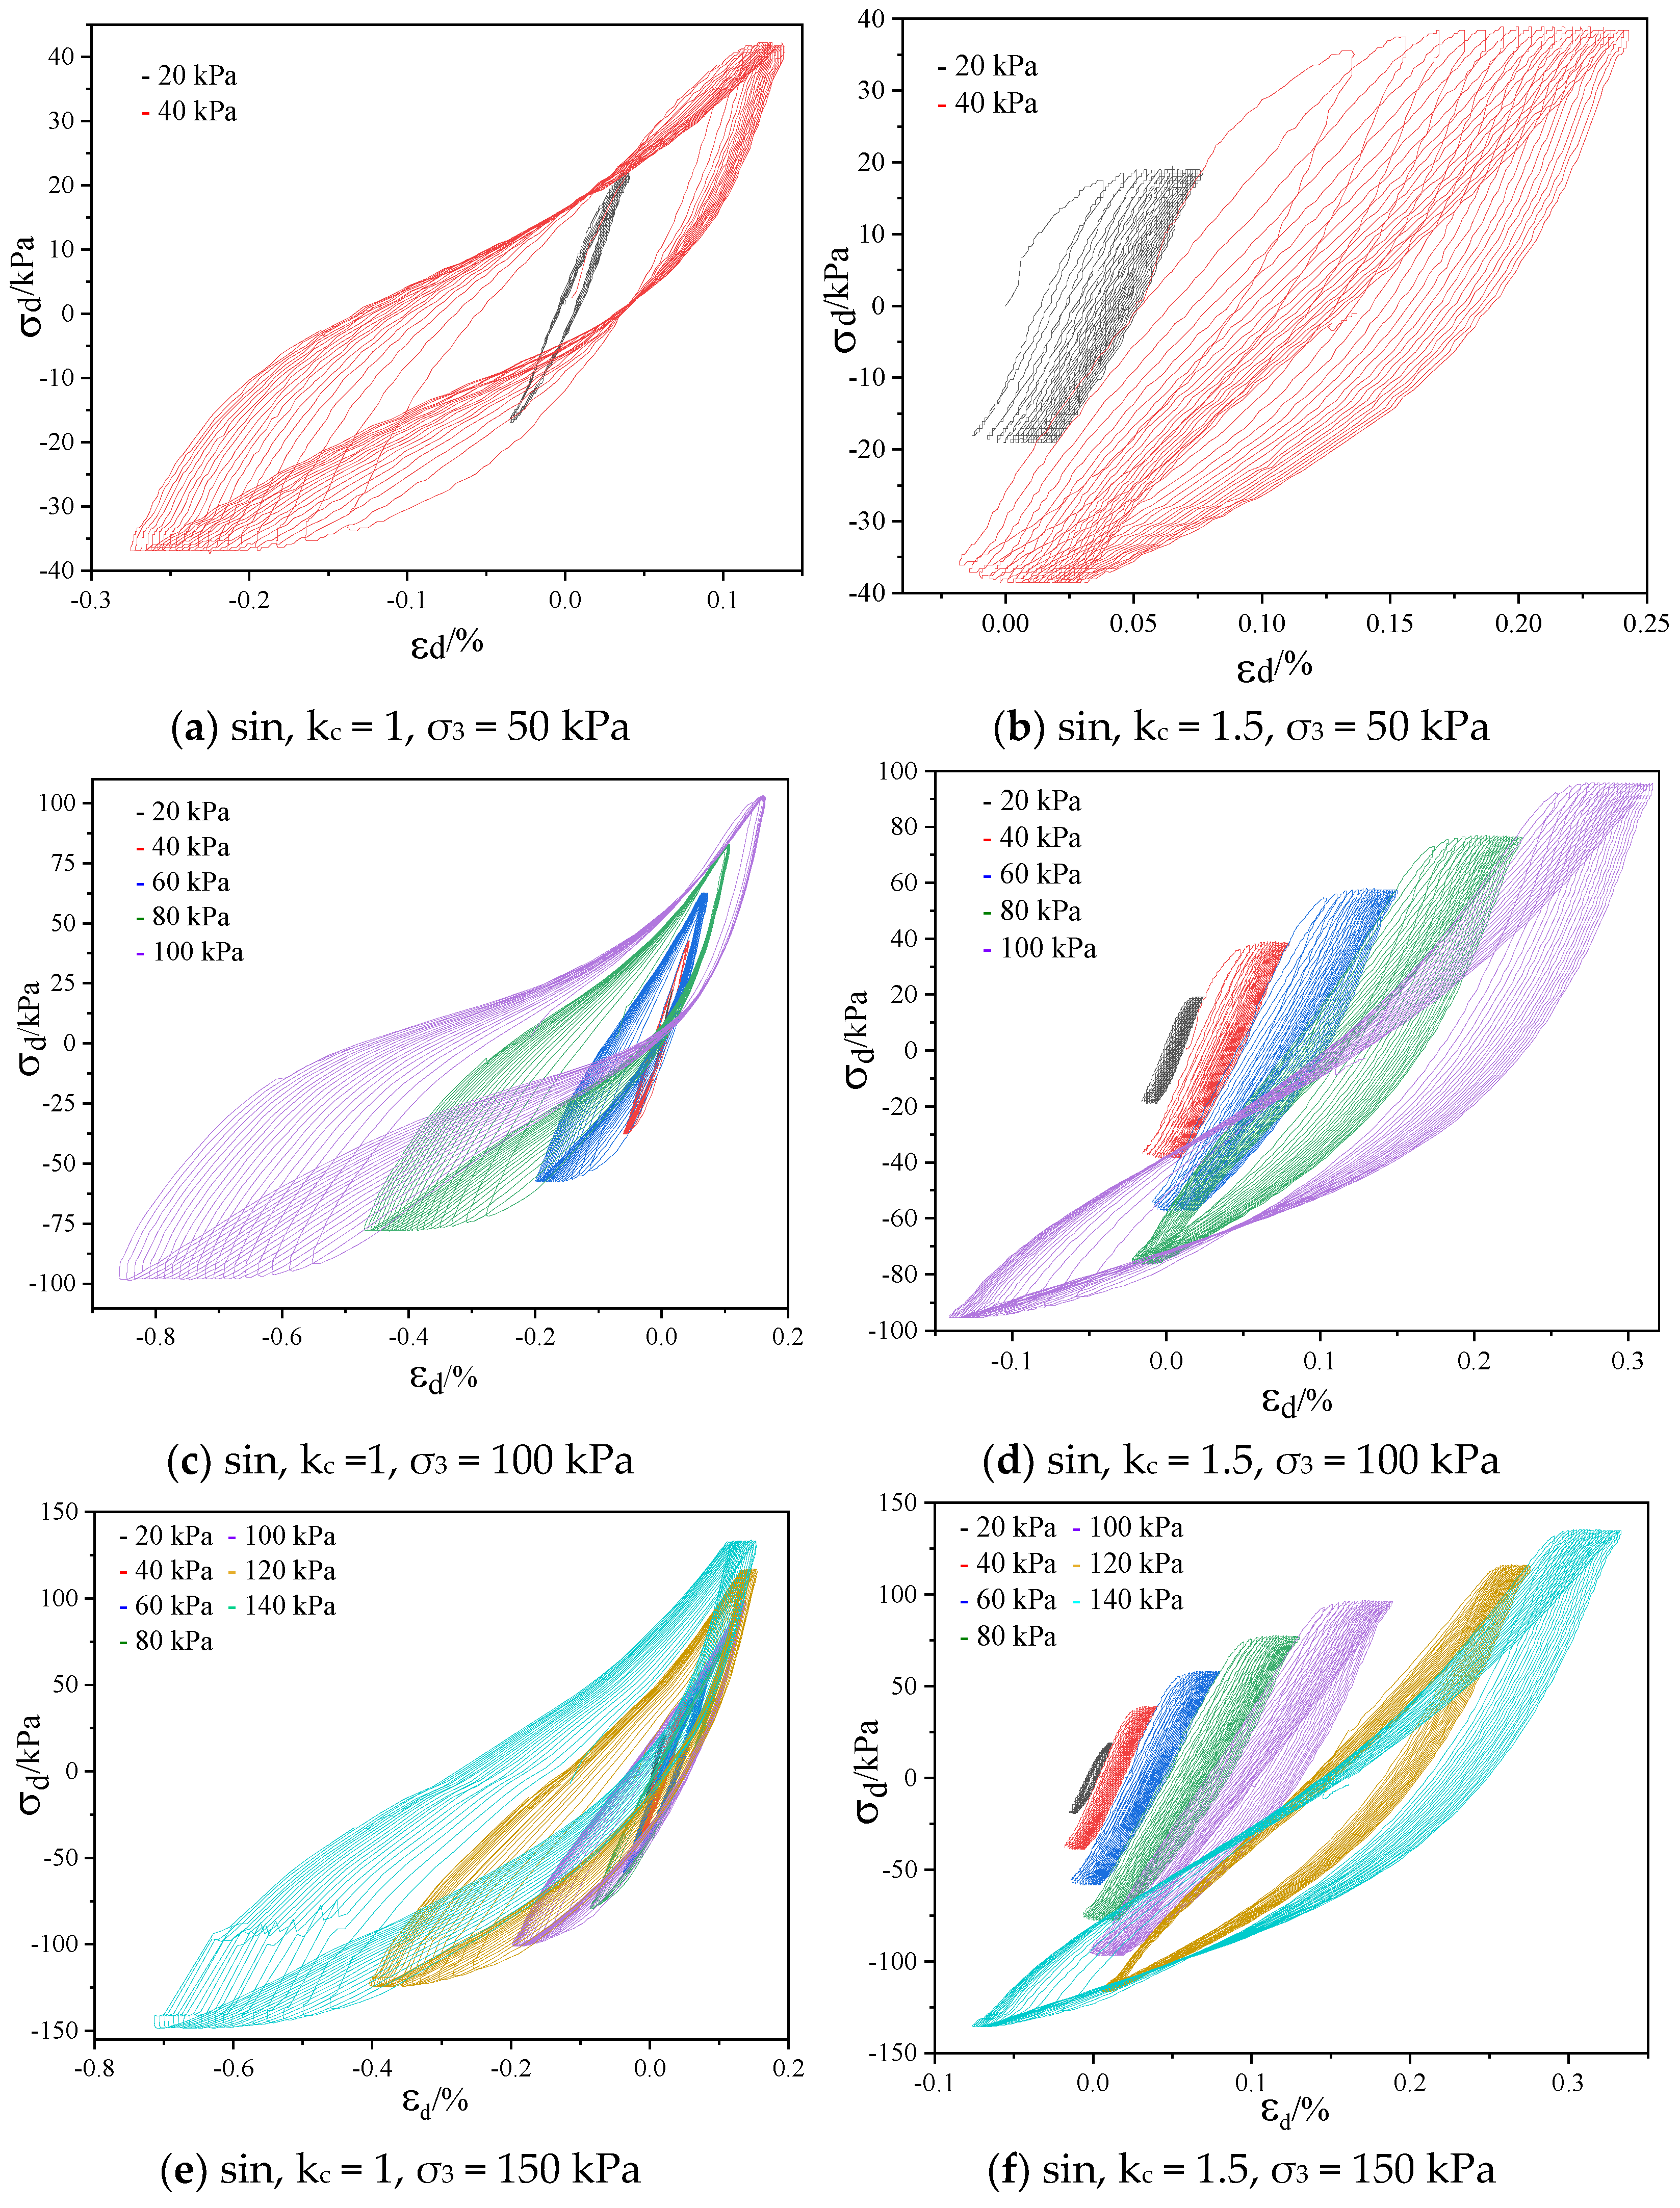
3.1. Analysis of Hysteretic Curve Characteristics under Different Confining Pressures
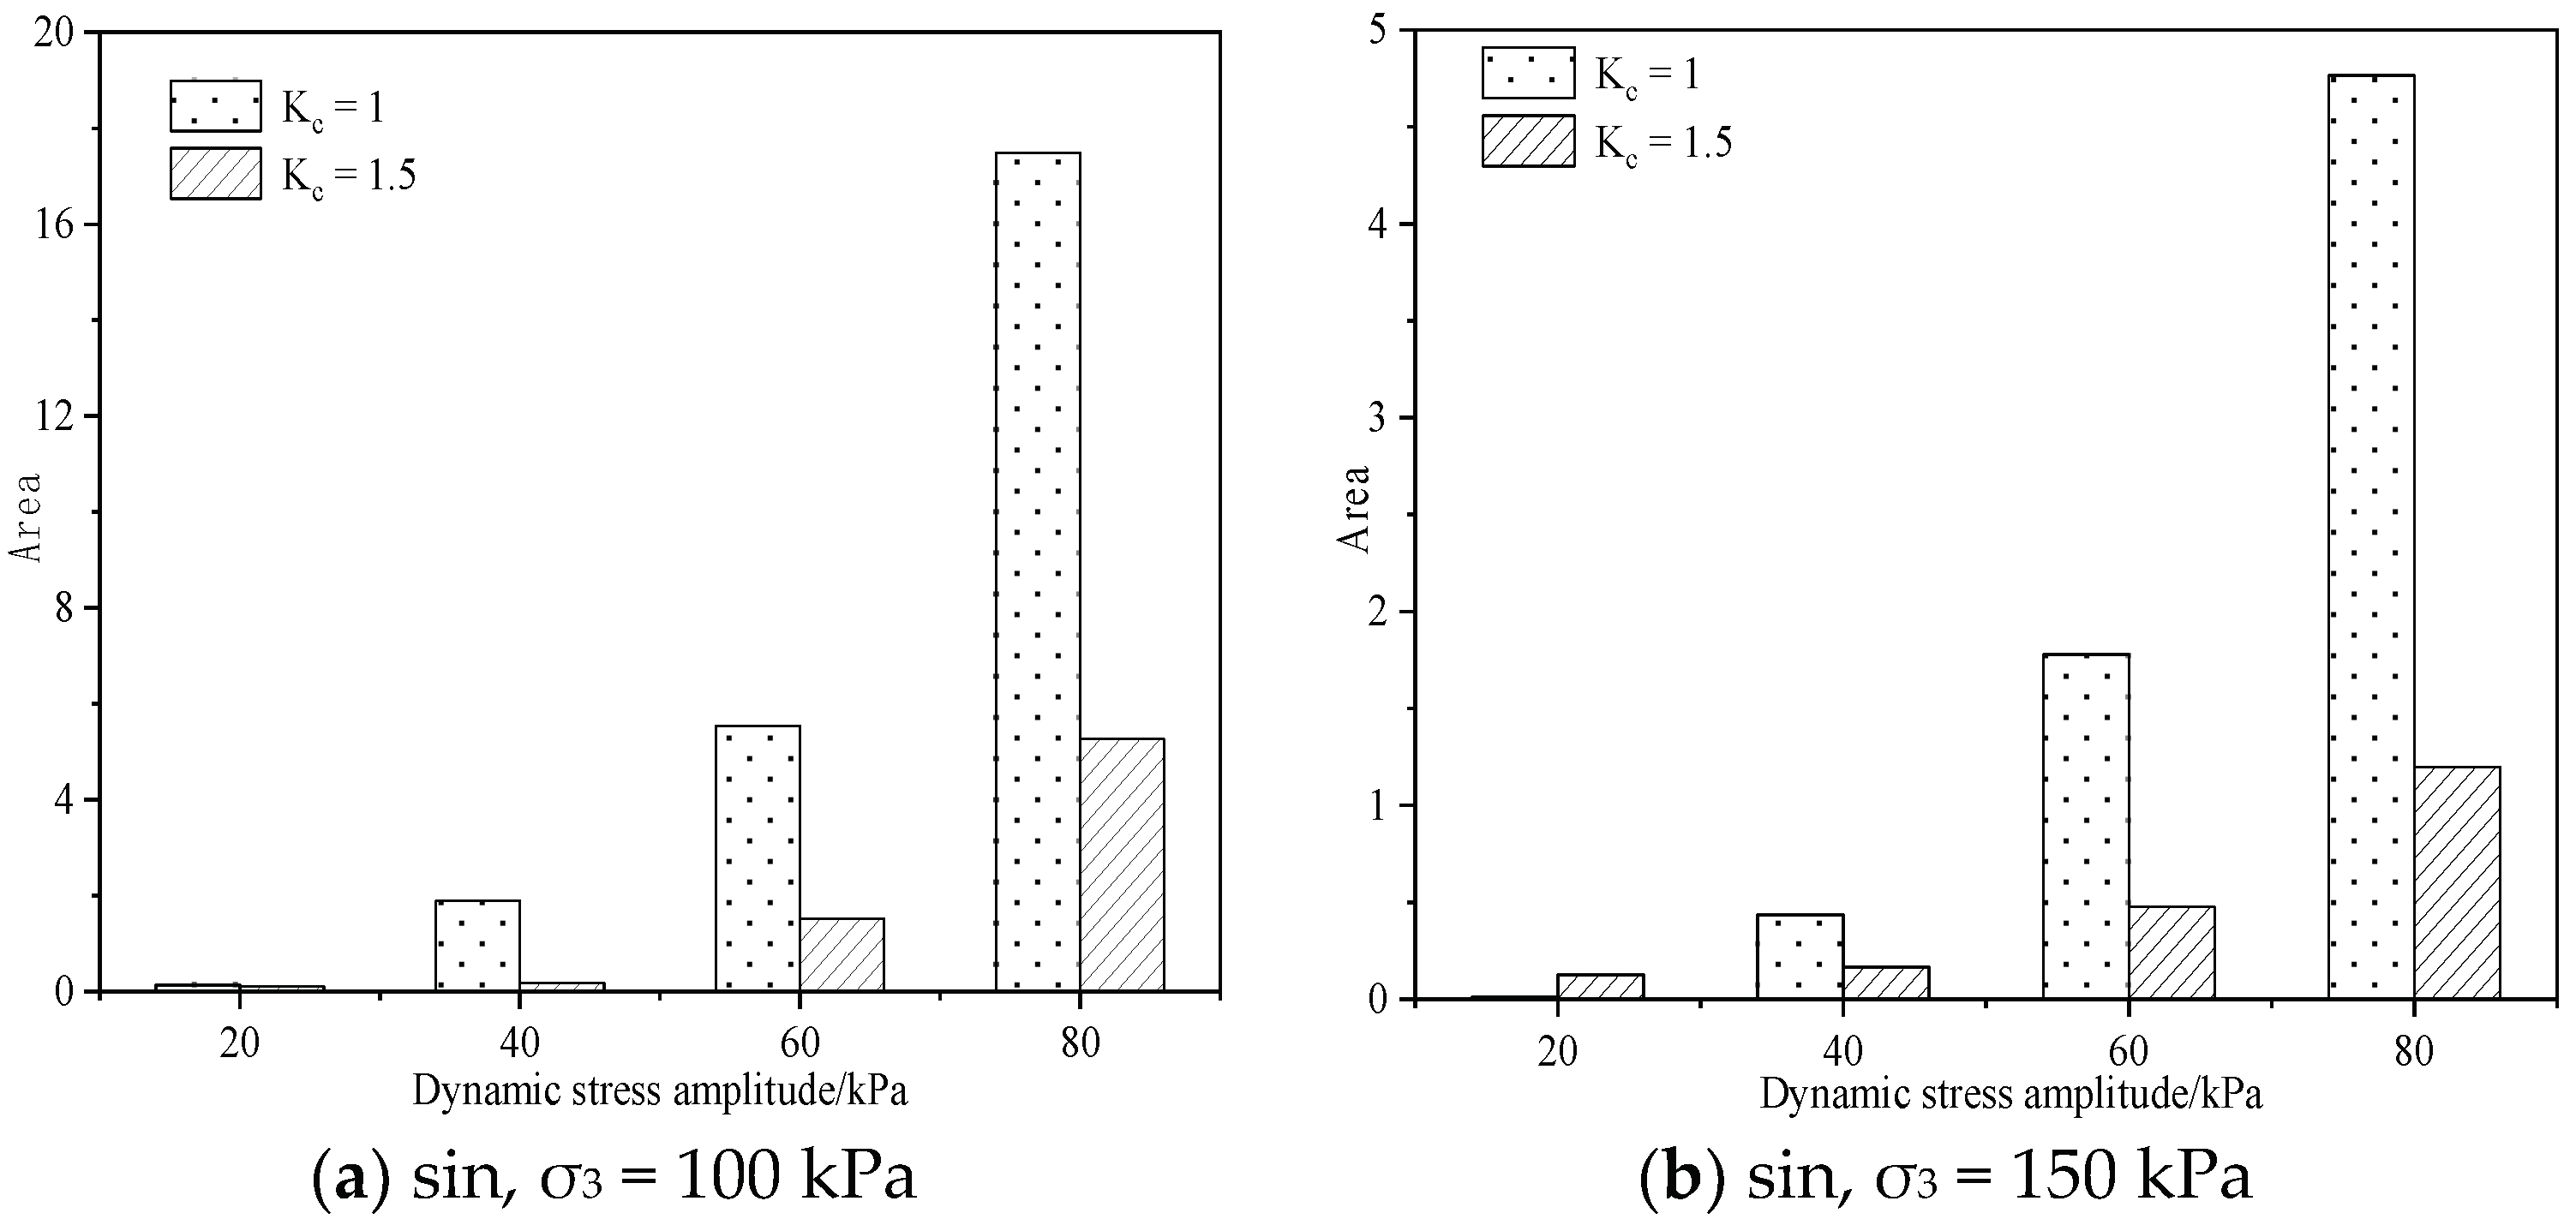
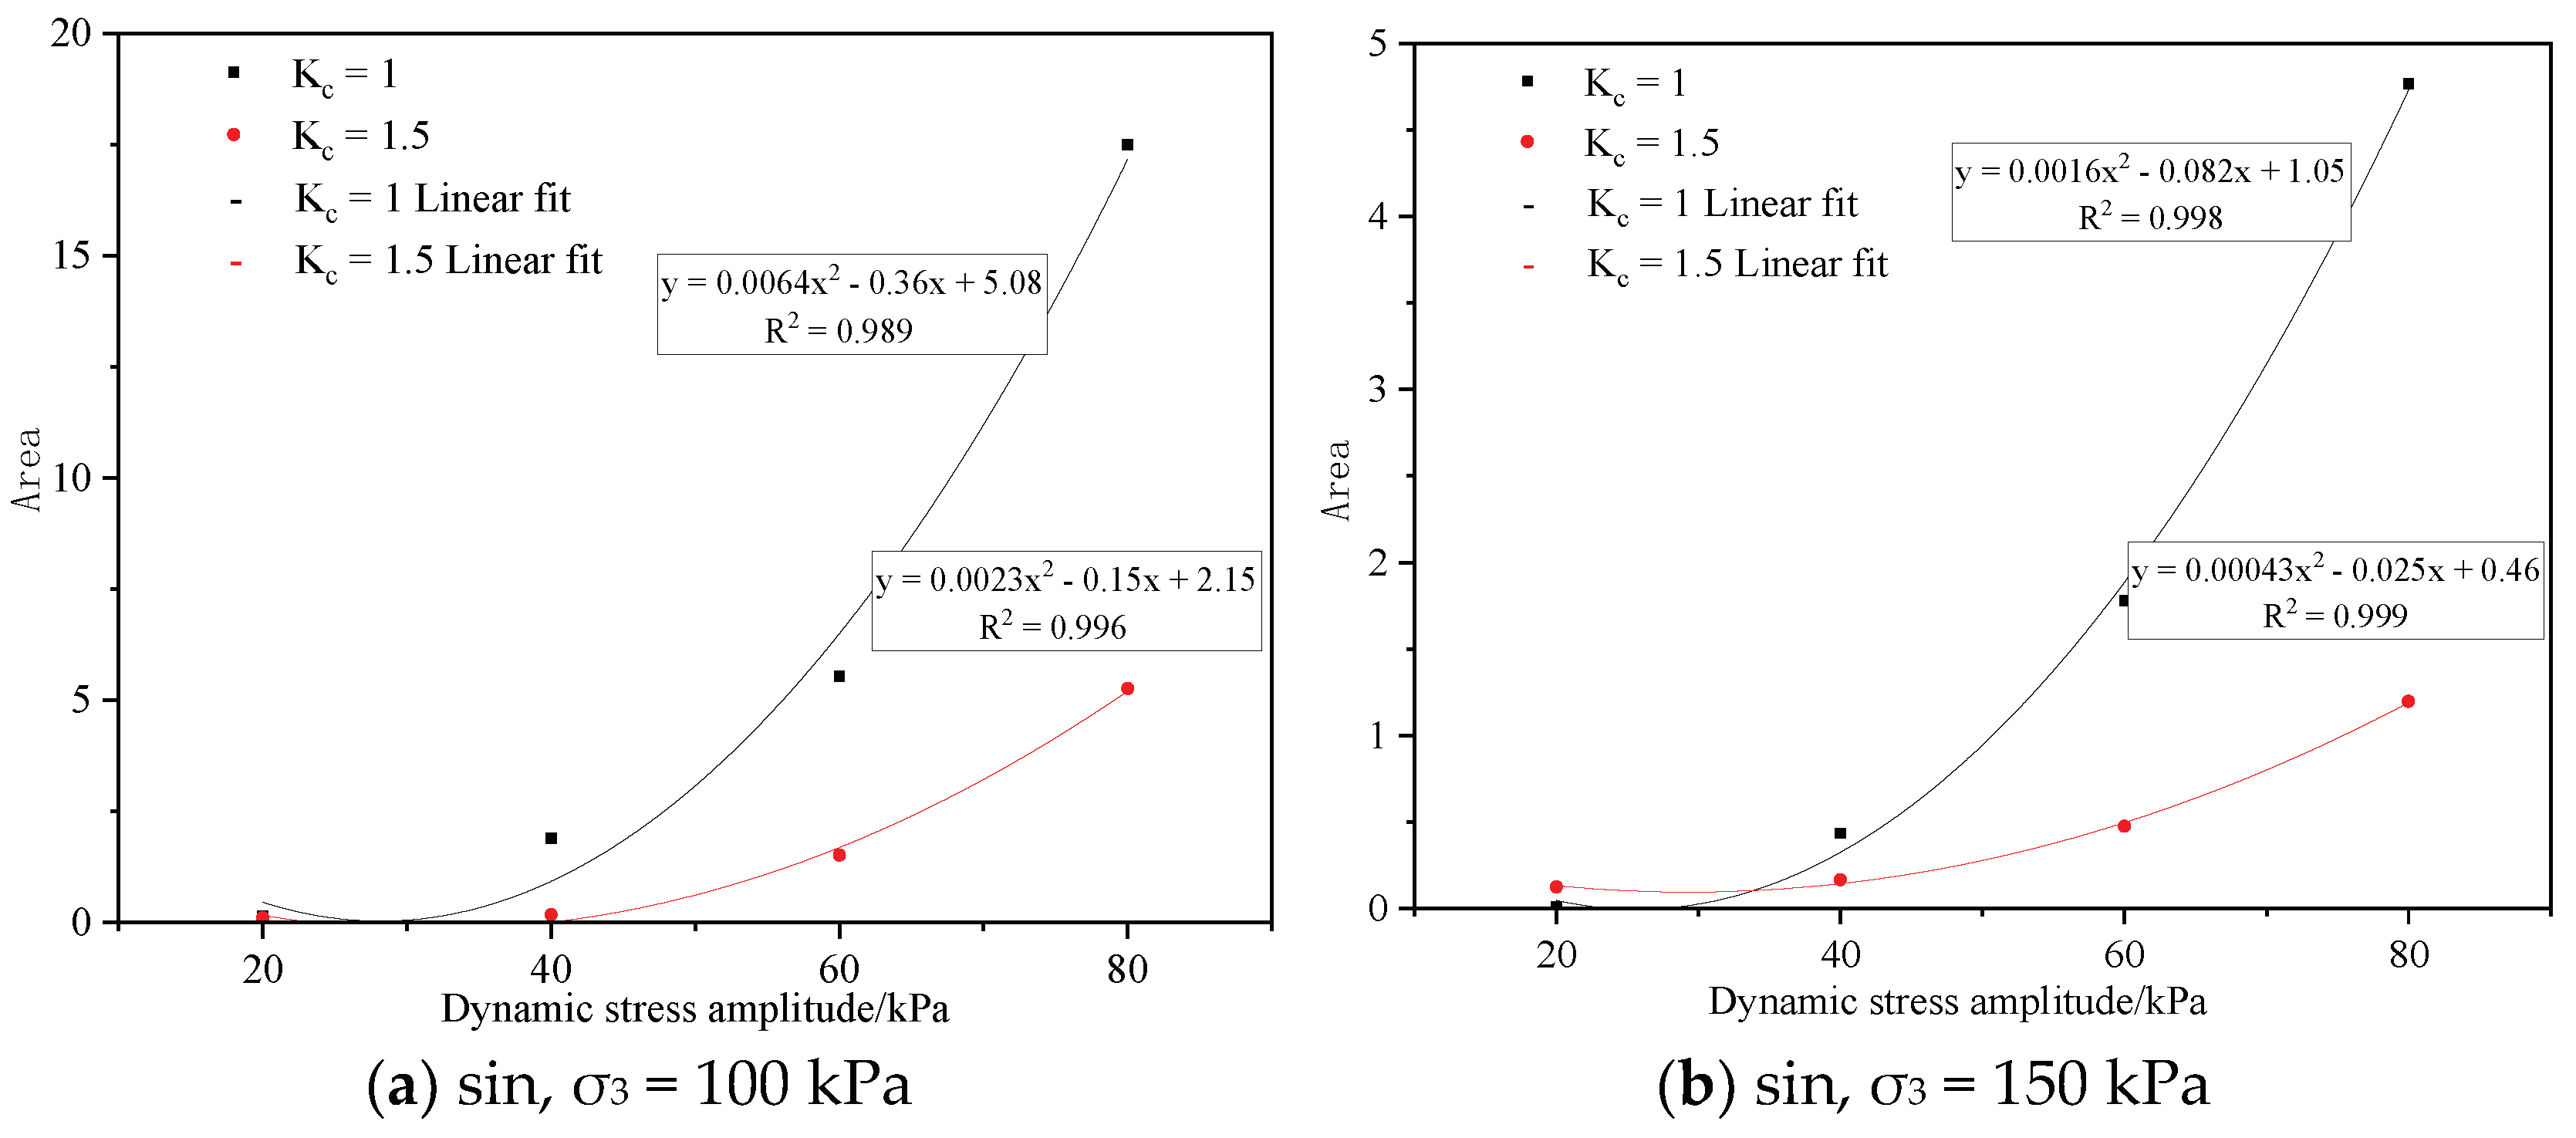
3.2. Analysis of Hysteretic Curve Characteristics under Different Consolidation Ratios
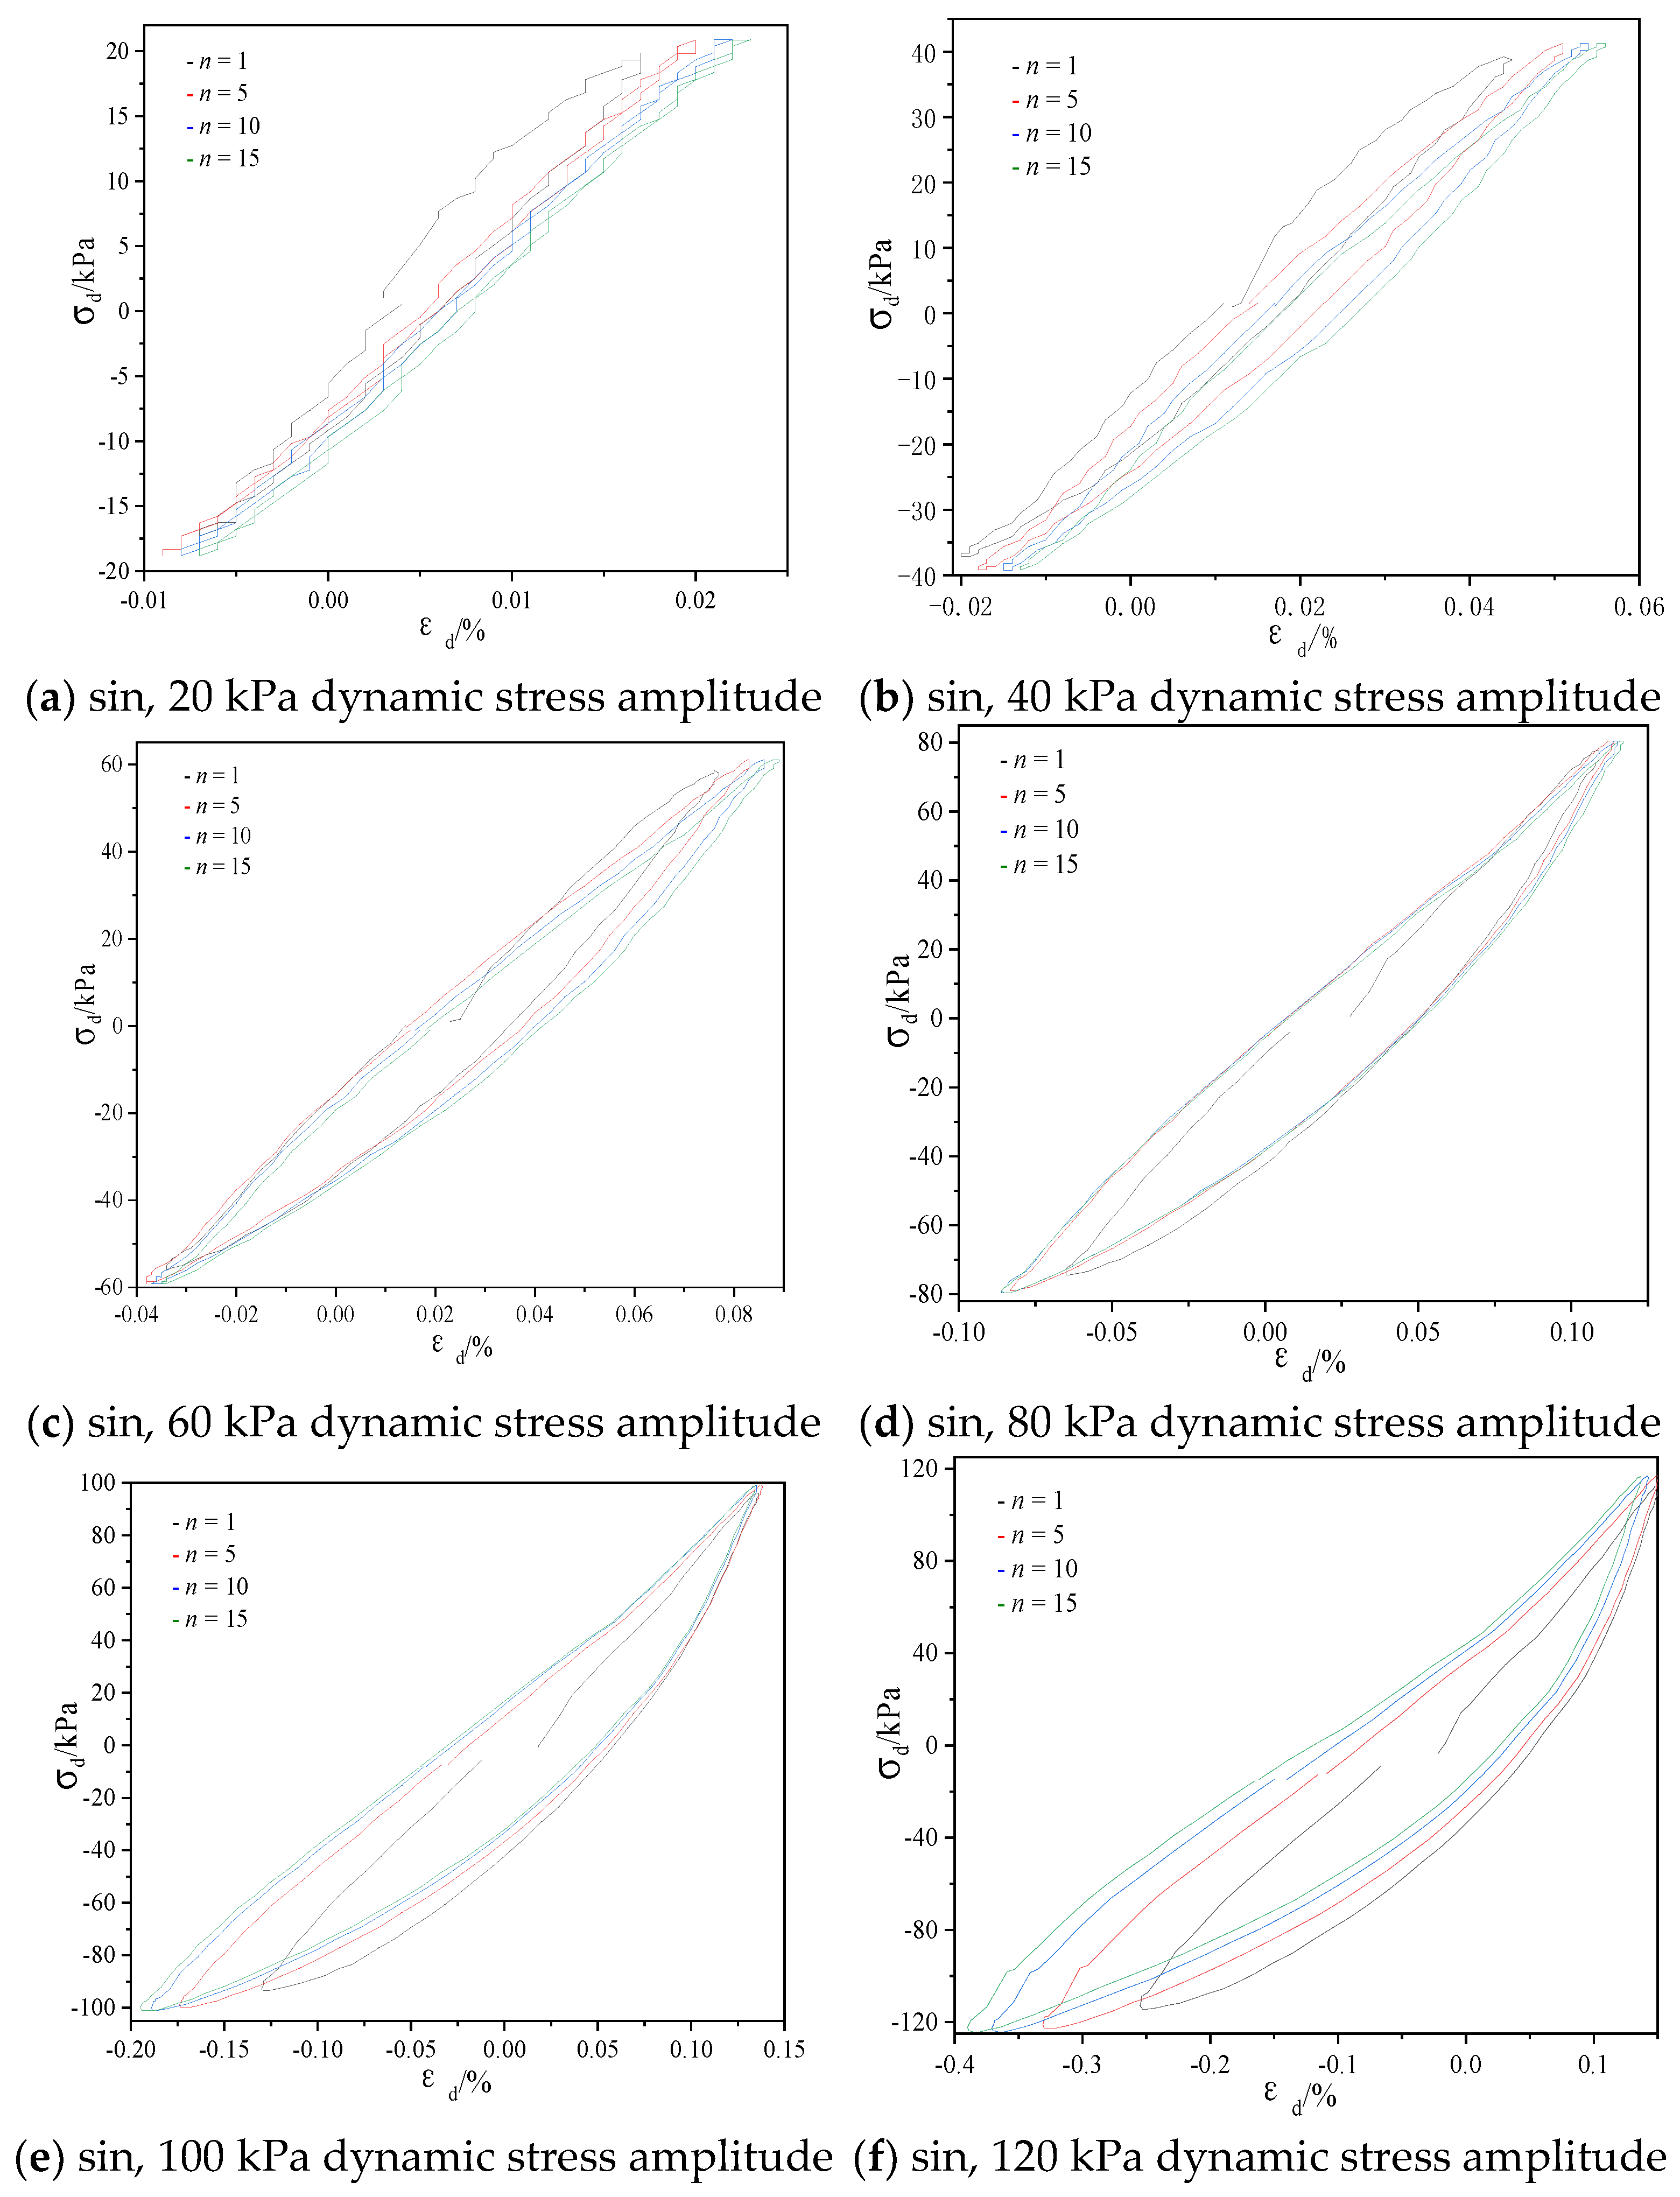
3.3. Analysis of Hysteretic Curve Characteristics under Different Cycle Times
4. Conclusions
- (1)
- Increasing the confining pressure can densify the internal spatial structure of soil. Under the same stress level, an increase in the confining pressure reduced the strain of the specimen, which shows that increasing the confining pressure can effectively inhibit the development of soil deformation. Increasing the confining pressure can significantly reduce the energy consumption of the coarse-grained soil specimen under cyclic load. The decrease in energy consumption shows that the stiffness of the coarse-grained soil specimen improved; the overall stability of the specimen improved, and it shows better strength characteristics.
- (2)
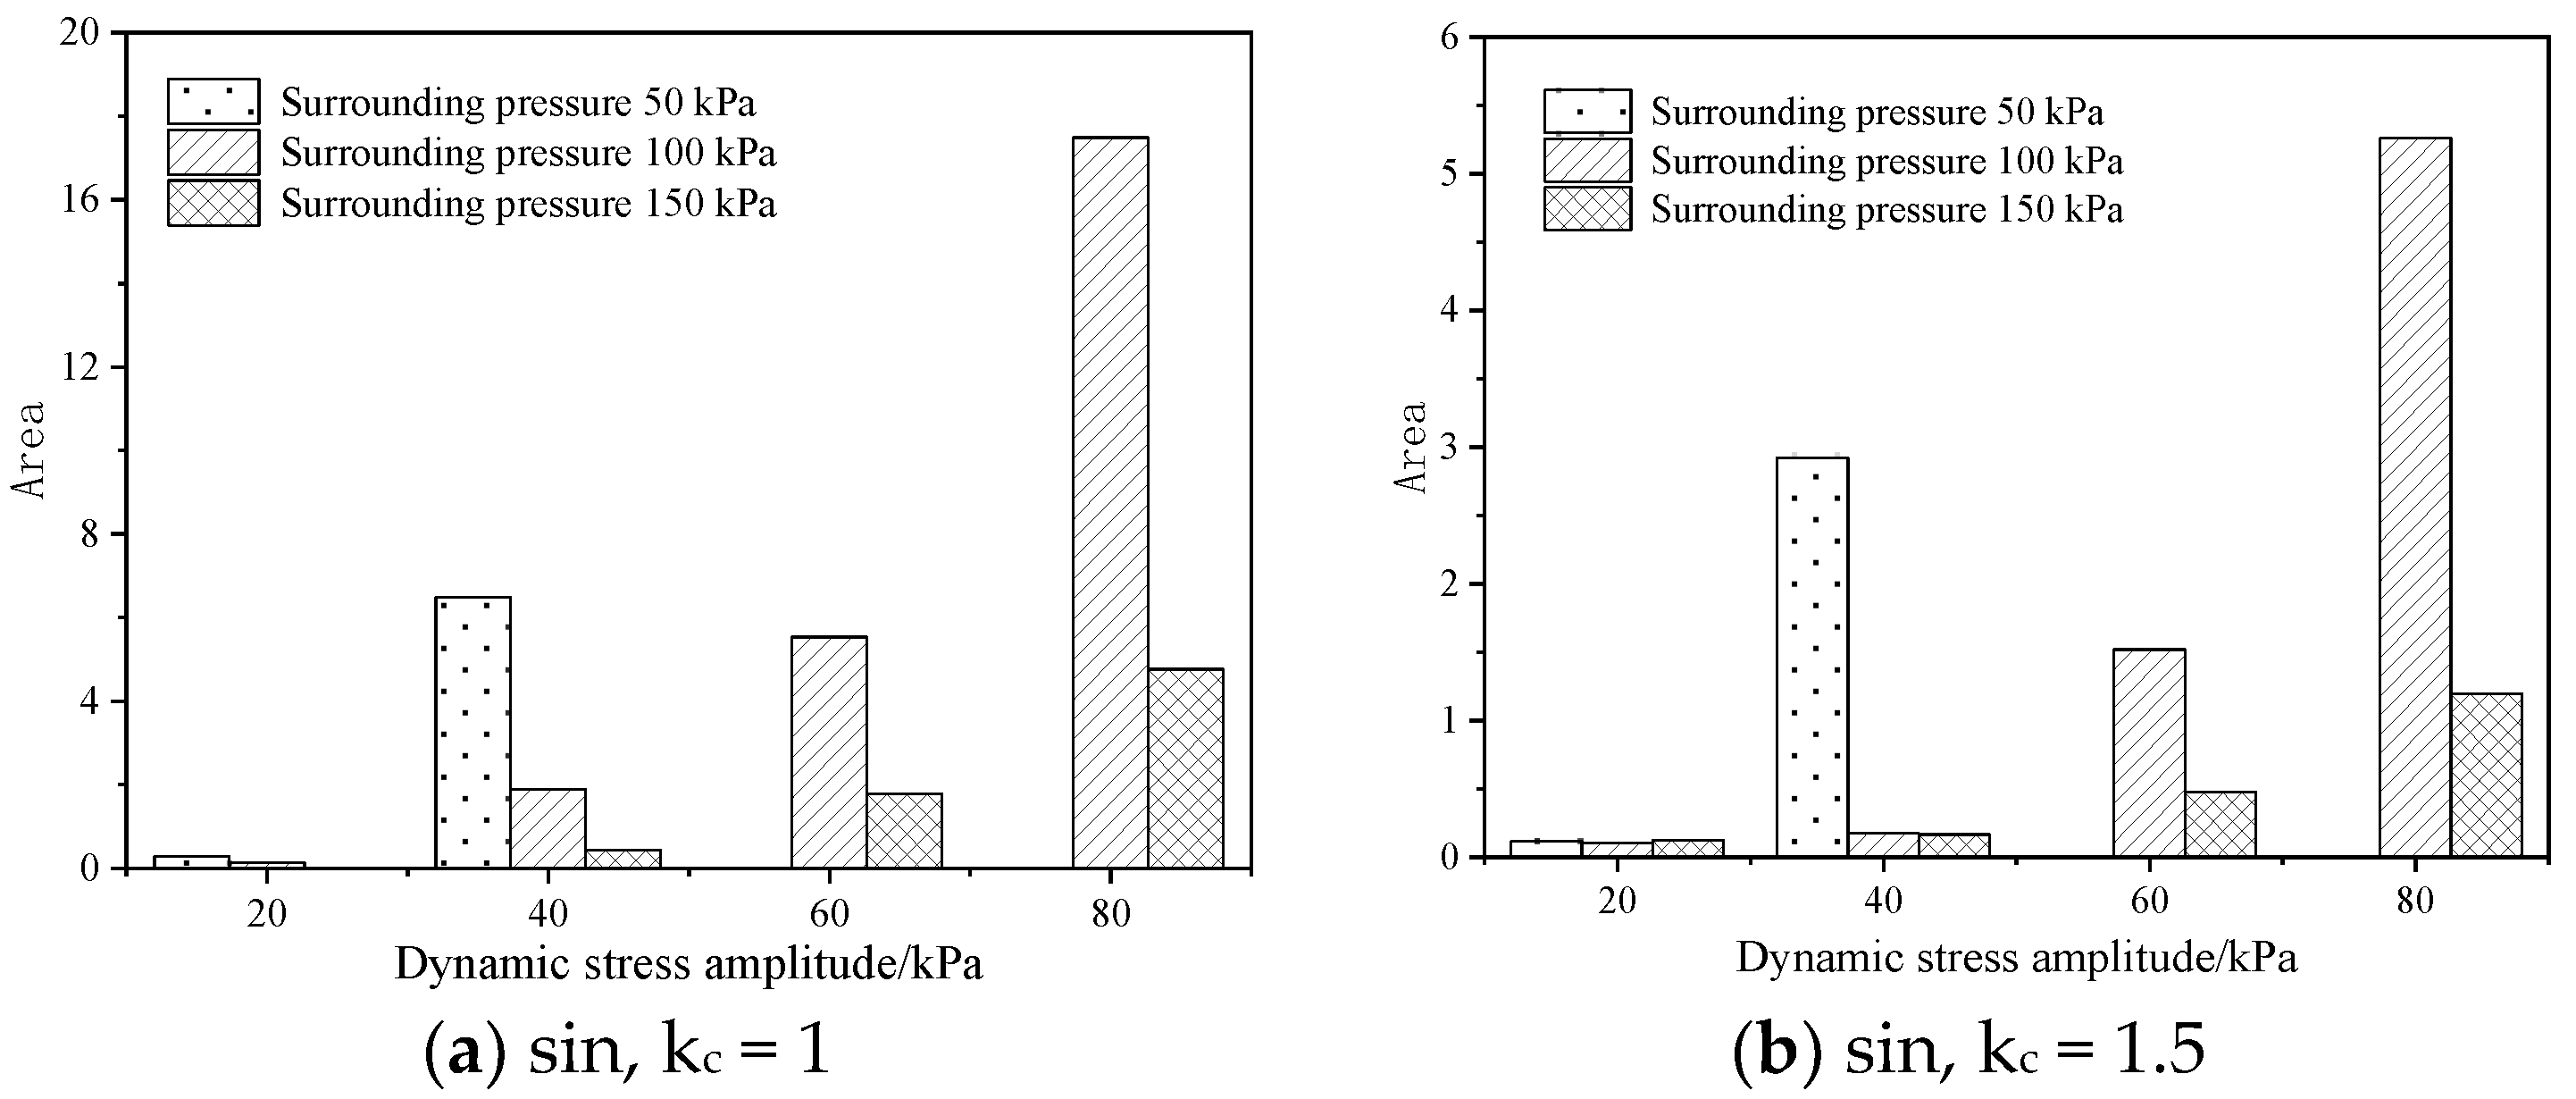
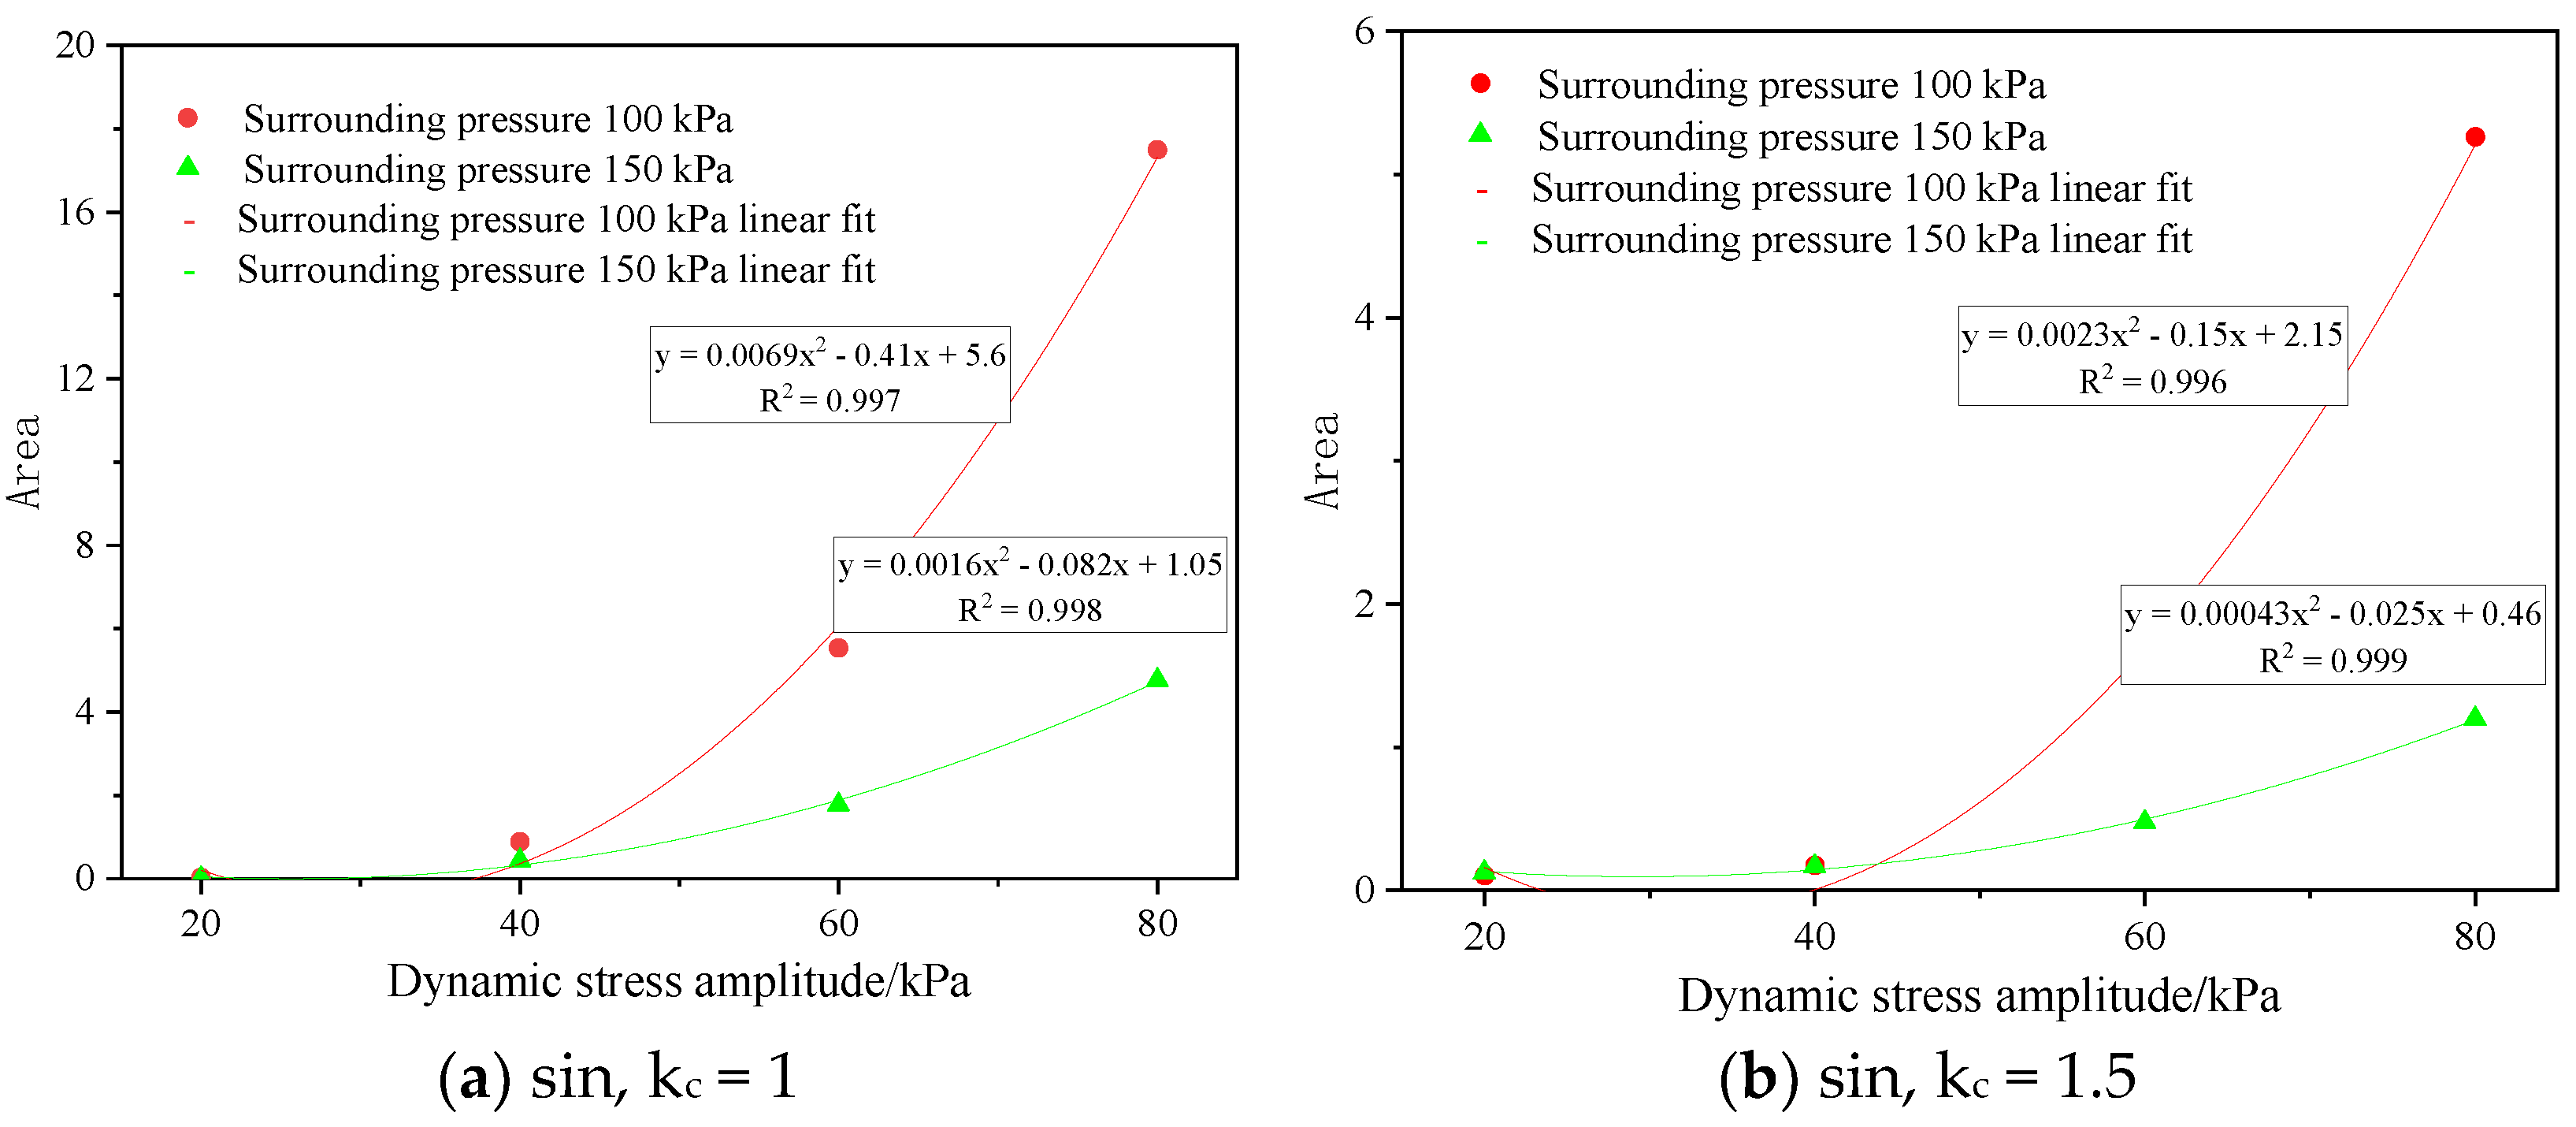
- Compared with isobaric consolidation, biased consolidation can inhibit the strain development of coarse-grained soil specimens better with an increasing stress level. Under the same stress level, increasing the consolidation ratio can effectively reduce the area surrounded by the hysteretic curve. Increasing the consolidation ratio can effectively inhibit the increase rate of its area with the increase in stress, thus controlling energy consumption under a high stress level, so as to show better overall stability.
- (3)
- In the case of a small dynamic stress amplitude, the hysteretic curve of the coarse-grained soil specimen was less affected by the number of cycles within a certain number of cycles. In the case of a large dynamic stress amplitude, the hysteretic curve of the coarse-grained soil specimen was greatly affected by the number of cycles. When the stress reaches a certain level, the response strain changes greatly with the increase of cyclic loading times.
Author Contributions
Funding
Institutional Review Board Statement
Informed Consent Statement
Data Availability Statement
Conflicts of Interest
References
- Hui, P.E.; Wei, M.A.; Yan-hu, M.U.; Long, J.; Dong-peng, Z. Analysis of disease investigation and long-term deformation characteristics of common fill embankment of the Qinghai-Tibet Highway. Rock Soil Mech. 2015, 36, 2049–2056. [Google Scholar]
- Yu, W.; She, S. On the particular settlement features of the soft soil subgrade in the area of Yangtze River Delta. J. Saf. Environ. 2016, 16, 108–114. [Google Scholar]
- Shi, Y.J.; Li, M.G.; Chen, J.J.; Wang, J.H. Long—term settlement behavior of a highway in land subsidence area. J. Perform. Constr. Facil. 2018, 32, 04018063. [Google Scholar] [CrossRef]
- Luo, J. Determination of traffic load parameters of indoor test Highway. Low Temp. Build. Technol. 2015, 37, 121–123. [Google Scholar]
- Long, Y.; Zhang, J.S.; Ding, J.Y.; Wang, W.B. The cyclic load experiments and an accumulated deformation model for coarse—grained soil filling. J. Vib. Shock 2017, 36, 128–133. [Google Scholar]
- Chen, Y.Y.; Huang, B.; Chen, Y.M. Raliability analysis of high level backfill based on chaotic optimization. Chin. J. Geotech. Eng. 2008, 30, 764–768. [Google Scholar]
- Tang, L.; Yan, M.H.; Ling, X.Z.; Tian, S. Dynamic behaviours of railway base course materials subjected to long-term low-level cyclic loading: Experimental study and empirical model. Geo-Tech. 2017, 67, 537–545. [Google Scholar]
- Bian, X.; Jiang, J.; Jin, W.; Sun, D.; Li, W.; Li, X. Cyclic and post cyclic triaxial testing of ballast and subballast. J. Mater. Civ. Eng. (ASCE) 2016, 28, 1–11. [Google Scholar]
- Trinh, V.N.; Tang, A.M.; Cui, Y.J.; Dupla, J.C.; Canou, J.; Calon, N.; Lambert, L.; Robinet, A.; Schoen, O. Mechanical characterisation of the fouled ballast in ancient railway track substructure by large-scale triaxial tests. Soils Found. 2012, 52, 511–523. [Google Scholar] [CrossRef]
- Leng, W.M.; Liu, W.J.; Zhou, W.Q. Experimental research on dynamic failure rules of compacted coarse-grained soil filling in heavy haul railway subgrade. Rock Soil Mech. 2015, 36, 640–646. [Google Scholar]
- JTG 3430-2020; Test Methods of Soils for Highway Engineering (JTG 3430-2020). People’s Communications Press: Beijing, China, 2020.
- Ling, H.I.; Yang, S. Unified sand model based on the critical state and generalized plasticity. J. Eng. Mech. ASCE 2006, 132, 1380–1391. [Google Scholar] [CrossRef]
- Liu, M.C.; Gao, Y.F.; Liu, H.L. Large scale triaxial test study on dilatancy characteristics of rockfill. J. Geotech. Eng. 2008, 29, 205–211. [Google Scholar]
- Chen, J.H.; Zhang, J.S.; Li, X.P. Rock blasting damage model considering rock mass integrity and its application. J. Geotech. Eng. 2016, 38, 857–866. [Google Scholar]
- Li, L.; Du, X.L.; Zhao, C.G. Study on elastoplastic dynamic constitutive model of saturated sand. J. Rock Mech. Eng. 2005, 24, 3380–3385. [Google Scholar]
- Zhang, G.D.; Wei, C.F. Constitutive model of sandy soil under cyclic loading. J. Solid Mech. 1998, 19, 19–24. [Google Scholar]
- Li, L.; Zhao, C.G. Research Progress on dynamic constitutive model of saturated soil. World Earthq. Eng. 2004, 20, 138–148. [Google Scholar]
- Yuan, X.Q.; Liu, H.Y.; Liu, J.P. Three-dimensional composite damage constitutive model of non-penetrating fractured rock mass. J. Geotech. Eng. 2016, 38, 91–99. [Google Scholar]
- Xie, D.Y. Soil Dynamics; Higher Education Press: Beijing, China, 2011. [Google Scholar]
- Zhang, X.X.; Zhang, J.M.; Wen, Y.F. Practical method to predict settlement of subgrade induced by long-term traffic loads. Chin. J. Geotech. Eng. 2015, 37, 2067–2072. [Google Scholar]
- Pérez-Acebo, H.; Linares-Unamunzaga, A.; Rojí, E.; Gonzalo-Orden, H. IRI performance models for flexible pavements in two-lane roads until first maintenance and/or rehabilitation work. Coatings 2020, 10, 97. [Google Scholar] [CrossRef] [Green Version]
- Olowosulu, A.T.; Kaura, J.M.; Murana, A.A.; Adeke, P.T. Development of framework for performance prediction of flexible road pavement in Nigeria using Fuzzy logic theory. Int. J. Pavement Eng. 2021, 1–10. [Google Scholar] [CrossRef]

| Mesh Size (mm) | 10 | 5 | 2 | 1 | 0.5 | 0.25 | 0.1 | 0.075 |
|---|---|---|---|---|---|---|---|---|
| Pass quality percentage (%) | 100 | 95.3 | 74.8 | 62.1 | 50 | 33.8 | 19.5 | 8.3 |
| Natural Water Content (%) | Maximum Dry Density /(g/cm³) | Optimum Moisture Content (%) | CBR (%) | Nonuniformity Coefficient CU (>5) | Curvature Factor CC (1~3) | Gradation |
|---|---|---|---|---|---|---|
| 2.1 | 2.13 | 8.03 | 51 | 5.6 | 1.1 | well |
| Surrounding Pressure (KPa) | Dynamic Stress Amplitude (KPa) | Solidification Ratio | Control Mode | Frequency (Hz) |
|---|---|---|---|---|
| 50 | 20 40 — — — — — | 1/1.5 | Stress control | 1 |
| 100 | 20 40 60 80 100 — — | |||
| 150 | 20 40 60 80 100 120 140 |
Publisher’s Note: MDPI stays neutral with regard to jurisdictional claims in published maps and institutional affiliations. |
© 2022 by the authors. Licensee MDPI, Basel, Switzerland. This article is an open access article distributed under the terms and conditions of the Creative Commons Attribution (CC BY) license (https://creativecommons.org/licenses/by/4.0/).
Share and Cite
Wang, P.; Hu, W.; Liu, P.; Yan, Z.; Kong, X.; Zhao, Q.; Yin, W. An Experimental Study on Dynamic Characteristics of Coarse-Grained Soil under Step Cyclic Loading. Coatings 2022, 12, 640. https://doi.org/10.3390/coatings12050640
Wang P, Hu W, Liu P, Yan Z, Kong X, Zhao Q, Yin W. An Experimental Study on Dynamic Characteristics of Coarse-Grained Soil under Step Cyclic Loading. Coatings. 2022; 12(5):640. https://doi.org/10.3390/coatings12050640
Chicago/Turabian StyleWang, Peisen, Wenjun Hu, Pingyun Liu, Zhenqiang Yan, Xianghui Kong, Quanman Zhao, and Wenhao Yin. 2022. "An Experimental Study on Dynamic Characteristics of Coarse-Grained Soil under Step Cyclic Loading" Coatings 12, no. 5: 640. https://doi.org/10.3390/coatings12050640
APA StyleWang, P., Hu, W., Liu, P., Yan, Z., Kong, X., Zhao, Q., & Yin, W. (2022). An Experimental Study on Dynamic Characteristics of Coarse-Grained Soil under Step Cyclic Loading. Coatings, 12(5), 640. https://doi.org/10.3390/coatings12050640