Article

Application of Advanced Analytical Techniques in Organic Cultural Heritage: A Case Study of Ancient Architecture Relics in the Palace Museum (Beijing)

1
Conservation Department, The Palace Museum, Beijing 100009, China
2
CAS Key Laboratory of Separation Sciences for Analytical Chemistry, Dalian Institute of Chemical Physics, Chinese Academy of Sciences, Dalian 116023, China
3
Ganjiang Chinese Medicine Innovation Center, Nanchang 330000, China
*
Authors to whom correspondence should be addressed.
Coatings 2022, 12(5), 636; https://doi.org/10.3390/coatings12050636
Submission received: 11 April 2022 / Revised: 28 April 2022 / Accepted: 30 April 2022 / Published: 5 May 2022

Abstract

:
Multilayer objects with different interfaces are quite typical for architectural heritage, and from them may be inferred the age, production process, and deterioration mechanism through analyzing characteristic compositions with advanced analytical techniques. The Meiwu ceiling in the Hall of Mental Cultivation of the Palace Museum was found to contain many paper-based layers during conservation. Once several surface strata were detached, a colorful layer of printed fabric textile was discovered integrally. Through microscopic observation and micro-attenuated total reflection-Fourier transform infrared spectroscopy (ATR-FTIR) imaging, the overall structure consisted of 11 layers, namely, bast paper, cotton wiring, xuan paper, cotton printed fabric, two yellow board papers, bamboo paper, three wood pulp paper and surface coatings, and starch was considered as an organic adhesive. For identification of the printed fabric’s color palette, ultra-performance liquid chromatography (UPLC) combined with high-resolution quadrupole time-of-flight (QTOF) technology, non-invasive macro X-ray fluorescence (MA-XRF) and desorption electrospray ionization mass spectrometry imaging (DESI-MSI) were applied in situ. Seven industrial synthetic dyes, including auramine O, malachite green, and eosin Y with corresponding by-products, as well as chromium-based pigments considered as dark draft line, were confirmed. By X-ray diffraction (XRD), scanning electron microscopy with energy dispersive X-ray spectroscopy (SEM-EDS), and micro Fourier transform infrared spectroscopy (micro FTIR, other results showed chalk soil and talc for the outermost coating. According to the synthetic time of industrial dyes and degradation degree of paper, there were at least four occurrences and their specific time periods were speculated.

1. Introduction

In recent years, advanced analytical techniques have impressively flourished in the field of organic cultural heritage. Various core analytical protocols have been applied for the conventional conservation and analysis of the morphology and material composition, such as microscopic observations for fiber identification [1], cross-section for coating sequences [2], state-of-the-art Fourier transform infrared spectroscopy (FTIR) for component types [3], and micro-invasive powerful liquid chromatography-mass spectrometry (LC-MS) for dye identifications [4]. Furthermore, the emergence of in situ techniques is especially indispensable for the non-invasive analysis of precious objects of art. Recent advances in FTIR imaging have achieved artifact surface analysis through the rapid distribution visualization of chemical complexity [5]. With the advent of micro FTIR mapping with focal plane array (FPA) detector and optical photothermal infrared (O-PTIR) spectroscopy, these novel methodologies with better spatial resolution at the (sub)micrometric scale have made great progress in this field [6,7,8]. Modern X-ray fluorescence techniques could provide valuable application for museum collections with the advantages of rapidity, ease-of-use, reproducibility, and high sensitivity as a method of acquiring trace element composition without extensive sample pretreatments [9,10]. The emergence of surface ionization mass spectrometry imaging (MSI) has been fully developed in artifact surface protection within the past two decades [11]. Desorption electrospray ionization (DESI) as an ambient ionization technique is a method of molecular-level and high-throughput analysis for mass spectrometry (MS) imaging, with the solvent conducting micro-extraction at artifact surface without matrix assistance and directed towards the MS inlet, so it is an effective and visual way to extract the information on the surface of cultural relics and reveal the features of ancient processes [12].
Surface science is helpful to give a comprehensive understanding of architectural decorations including their history, fabrication techniques, and evaluation of conservation state [13]. Color, as an important contributing factor, is an intuitive way of perception. Ink is the material made for printing of different substrates such as paper or fabric, where dyes (pigments) as the components give the coloration. Ink identifications, especially the industrial types which have boomed since the start of the 1700s, could infer the production time the works of art and reflect the specific alteration indirectly. Sometimes, their synthetic purities were not up to the demands at that time, limited by the underdevelopment of the industry, so the detected by-products of the targets may reflect the technical footprint of the production process in that era [14,15].
As one of the largest and best-preserved wooden structural ancient buildings in the world, the Palace Museum (also known as the Forbidden City) has more than 70 different types of palaces. The Hall of Mental Cultivation (Yangxin Palace) is a multi-functional architectural complex with an I-shaped structure integrating daily activities and dealing with state routine affairs since Emperor Yongzheng of the Qing Dynasty. Among them, Meiwu is located in its west ear location, and built in the thirty-ninth year of the Qing Emperor Qianlong (1774). The main body area is 26.6 m2 and special for leisure with beautiful outdoor scenery. Qianlong had deep love for plum blossoms, which represented noble quality in traditional Chinese culture and was to some extent extreme. During his reign, he built many buildings related to plum blossoms, such as the Bower of the Three Friends (Sanyou xuan) and Pavilion of Jade-green Conch (Biluo ting). The inscription written by himself fully demonstrated his ideological sustenance (Figure 1a). The ceiling stain from roof leaks can still be observed at the scene (Figure 1b). When repairing the wooden structure of the roof, a multi-layer paper-based accumulation was found (Figure 1c–e), especially a colorful layer of printed fabric among them (Figure 1f). Considering the overall protection, although the complete pattern was not shown, we could imagine from the uncovered sample that the red and cyan plum blossoms were in full bloom against the bright green background. Other structures were dotted with different shades of blue and red branches and leaves. It could be expected that all the ink collocation for the ceiling presented the ornamental effect, indicating the deep moral.
The interface is intrinsically important to multi-component composite materials and multi-layer objects produced since antiquity, and application in the pasting process related to the architecture has met the demands for warmth, windproofing, and light penetration thus far [16]. The surfaces of cultural relics with paper and textile as organic carriers are very sensitive and easily age, are brittle, and even crack due to the influence of ambient environmental factors containing light, temperature, and humidity changes. Hence, it is urgent to conduct scientific analysis of the material types and process features and investigate the composition, structure, and construction records of the interior decorations for the historic building. Several emperors once lived in the Hall of Mental Cultivation, so certain adjustments would be made during their different reigns, which may result in a superimposition phenomenon in terms of the ceiling decorations. Accordingly, multilayer analysis would help to find more information on the fabrication process and have certain practical significance for the overall research.
Herein, two cultural relic samples from the Meiwu ceiling were studied. One contained all layers which consisted of paper and fabric complexes (outermost: Figure 1d; innermost: Figure 1e) and the other was a piece of fabric among them which was rich in inks (Figure 1f). For the first sample with complete layers, microscopic observation was conducted for the whole cross-section, fiber materials, and adhesive; the coating composition for the outermost layer was analyzed with micro Fourier transform infrared spectroscopy (micro FTIR), scanning electron microscopy with energy dispersive X-ray spectroscopy (SEM-EDS), and X-ray diffraction (XRD). Another fabric sample was analyzed with liquid chromatography coupled with mass spectrometry for dye and by-product identifications and in situ analytical imaging techniques including micro-attenuated total reflection-Fourier transform infrared spectroscopy (ATR-FTIR) for fiber distribution and degradation, macro X-ray fluorescence (MA-XRF), and desorption electrospray ionization mass spectrometry imaging (DESI-MSI) for elemental and structural patterns. With a multi-analytical setup to characterize the artifacts, multi-layer surface information could be obtained for better understanding of the production process. Meanwhile, this particular case study links with the ageing and degradation of ancient materials including fibers and inks. Through the diagnostic, we want to shed light on deterioration changes to infer the possible time periods of superimposed constructions. These results are expected to give comprehensive instruction for artifact conservation of historic buildings.

2. Materials and Methods
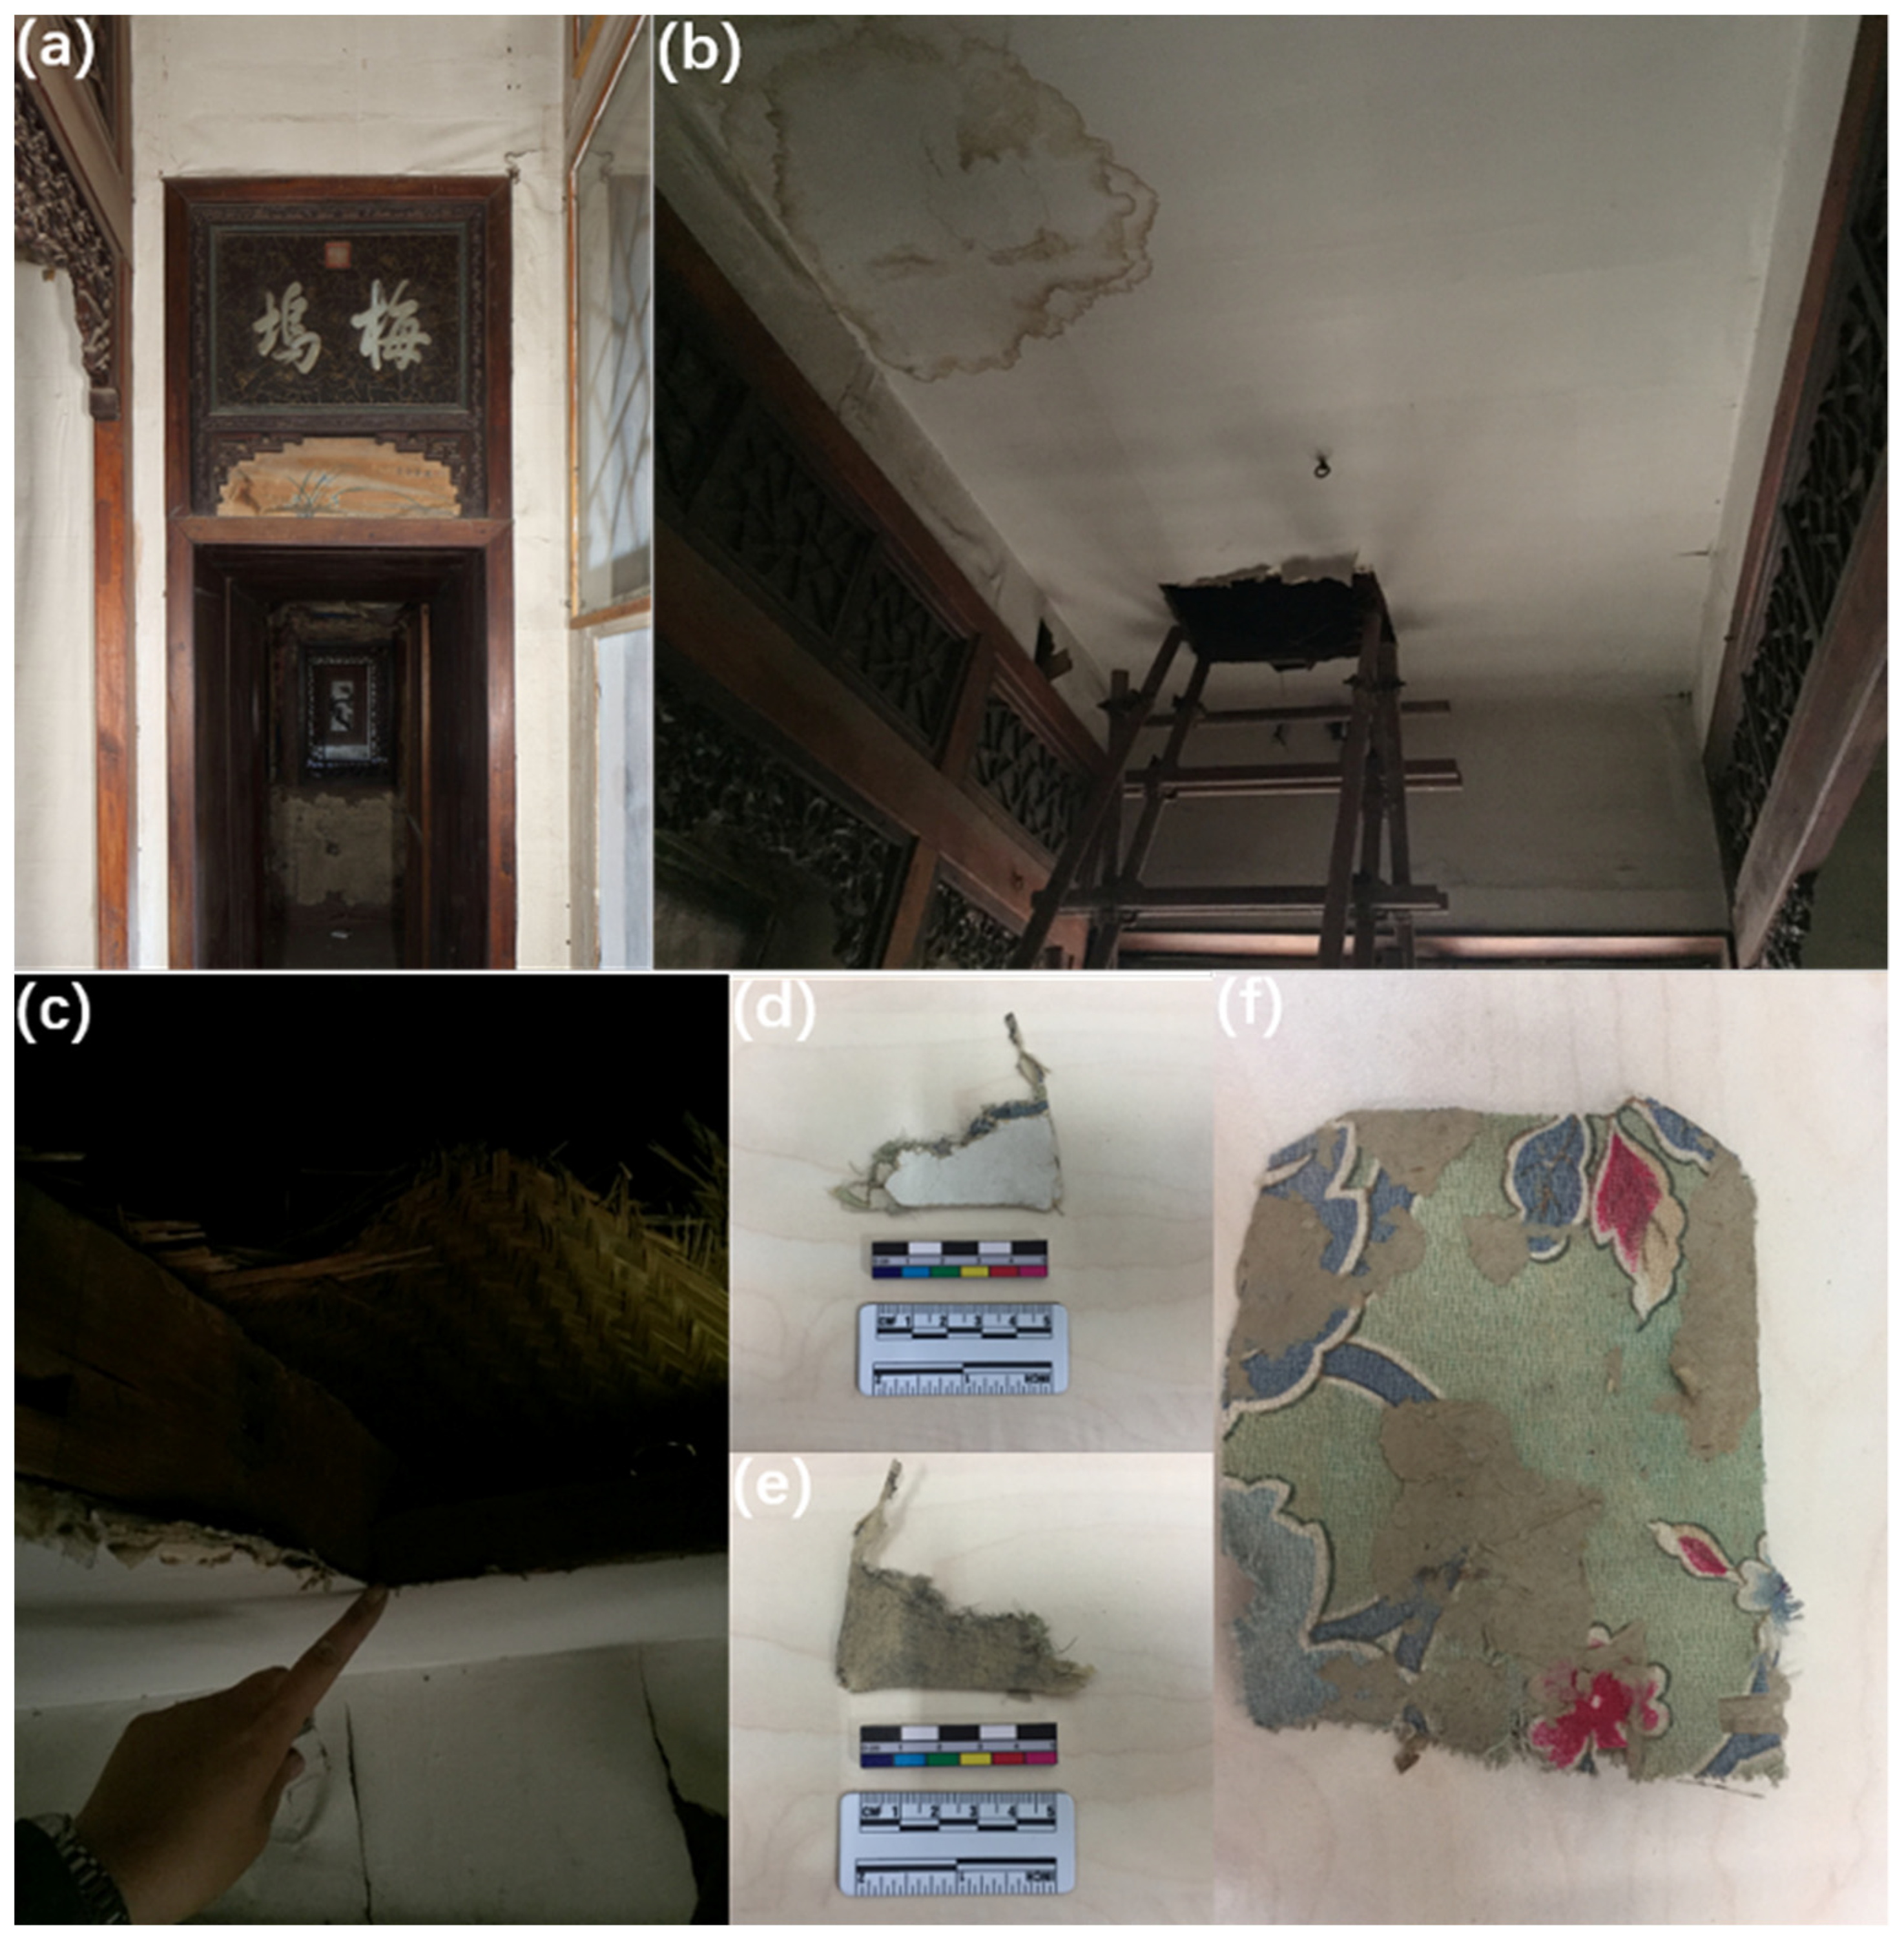
2.1. Materials

All chemicals are commercially available and analytically pure. The following chemicals were used: acetonitrile (CH3CN) and methanol (CH3OH) (MS grade, >99%, Fisher Scientific, Shanghai, China), formic acid (HCOOH) and DMSO (C2H6OS) (analytically pure, Aladdin, Shanghai, China), ethanol (CH3CH2OH, absolute, >99%, Fischer, Shanghai, China), leucine enkephalin (C28H37N5O7), and sodium formate (HCOONa) (MS grade, 98%, BOC Sciences, New York, NY, USA). A series of control standards including auramine O (C17H22ClN3), malachite green (C23H25ClN2), methyl violet (C24H28ClN3), crystal violet (C25H30ClN3), rhoduline blue (C23H24Cl2N2), and eosin Y (C20H8Br4O5) were purchased from Sinopharm chemical reagent company (Beijing, China) and used for testing. Distilled water for the experiment was from Millipore Elix Advantage 15 ultrapure system (Molsheim, France).

2.2. Sample Pretreatments

This experiment involved various sample pretreatments. The cross-section of the whole ceiling structure was observed by embedding into acrylic resin (Technovite 2000LC, Henraeus Kulzer, Hanau, Germany) and gritting with sandpapers followed by polishing cloths. The potassium iodide solution (4.2 g potassium iodide and 0.2 g iodine dissolved in 10 mL water) was used for positive staining reaction. Both the cross-sections with Hastelloy slicer (Shanghai Precision Instruments Co., Shanghai, China, Y172) and vertical areas of paper and textile fibers with Herzberg reagent [17] were observed, respectively. From the fabric samples, dye components of different inks were extracted. The extraction method for dyes was followed according to reported literature [18]: 0.2 mL DMSO for ultrasonic extraction at 75 °C for 10 min for the supernatant and 0.2 mL HCl (37%):MeOH:H2O = 2:1:1 (volume ratio) solution at 100 °C for 10 min for left residues. After filtering out and drying up with nitrogen, the concentrate was re-dissolved in the first step exact for analysis. For the in situ mass imaging experiment, the sample was stuck onto the glass slide using double-sided tape and fixed onto a DESI full plate using Blu-Tack (Bostik Ltd., Stafford, UK).

2.3. Apparatus and Methods

The samples were studied as regards their composition and structure using a multi-analytical method including microscopic observation, colorimetric measurements, micro-FTIR, SEM-EDS, UPLC-QTOF MS, XRD, and non-invasive mapping methods including ATR-FTIR, MA-XRF, and DESI-MSI.

2.3.1. Microscopic Observation

The cross-section of the microscopic structure subsequent staining was observed with optical microscopy (OM, DM4000M, Leica, Morrisville, NC, USA, automatic exposure) in combination with CellSens Dimension (Ver. 1. 18, 2017, OLYMPUS, Tokyo, Japan) processing software at different magnifications (32×, 50×) under both visible and ultraviolet light; however, this did not produce obvious fluorescence.

2.3.2. Colorimetric Measurements

Colorimetric measurements were performed with a CM-26d, Konica Minolta (Beijing, China) spectrophotometer under the standard condition of D65 and 10° observer. Specular Component Excluded (SCE) mode was adopted for determining CIE Lab values of the matt fabric surface.

2.3.3. Fourier Transform Infrared Spectroscopy (FTIR)

Infrared spectroscopy experiments were conducted on a Nicolet iN10 Mx Fourier, Thermo Fisher Scientific, Waltham, MA, USA transform microscope infrared spectrometer with a mercury cadmium telluride (MCT) detector. The detection patterns of micro-transmission on a microdiamond cell and attenuated total reflection (ATR) spectroscopic imaging with a high refractive index germanium probe at a step length of 100 μm were applied. Each absorption spectrum was collected, ranging from 4000 to 675 cm−1 at a spectral resolution of 4 cm−1, with an accumulation of 32 scans, and processed with OMNIC Picta (Ver. 1. 6. 160, 2017, Thermo Fisher Scientific, Waltham, MA, USA) software.

2.3.4. Scanning Electron Microscopy with Energy Dispersive X-ray Spectroscopy (SEM-EDS)

Scanning electron microscopy images were performed on an FEI QUANTA 600 with tungsten filament. The maximum voltage was 25 kV and working distance was 9.8 mm in high-vacuum mode. In order to confirm the elements of the outermost layer, an EDAX Genesis X-ray (Ametek, California, CA, USA) spectrometer was used and processed with ImageJ (Ver. 1.8.0, National Institutes of Health, Bethesda, MD, USA) software.

2.3.5. Ultra-Performance Liquid Chromatography Coupled with Quadrupole Time-of-Flight Mass Spectrometry (UPLC-QTOF MS)

UPLC-QTOF MS was carried out on a Waters ACQUITY H-Class UPLC (Milford, CT, USA) system coupled with Waters Xevo G2-XS Q-TOF MS with the electrospray ionization (ESI) ion source. Chromatographic separations were carried out on ethylene bridged hybrid (BEH) C18 column (2.1 × 100 mm, 1.7 μm). Temperature, 40 °C; Flow rate, 0.3 mL/min. The mobile phase was composed of water containing 0.1% formic acid as solvent A and acetonitrile as solvent B. The gradient was 95% A from 0 to 0.3 min, 95–5% A from 0.3 to 9.3 min, 5% A held for 1 min, then 5–95% A from 10.3 to 10.5 min and held at 95% A for 1.5 min. Mass spectrometry was operated under both positive and negative ion mode with MSE collection in sensitivity mode. Scan range, m/z 50–1200; source temperature, 120 °C; cone voltage, 40 V; capillary voltage, 2.5 kV; desolvation gas (N2) flow rate, 600 L/h; nebulize gas flow rate, 10 L/h; desolvation temperature, 450 °C; collision energy, ramp high energy from 20 to 45 eV. Real-time calibration (every 30 s) applied leucine enkephalin (0.4 ng/μL) as internal standard. Instrument control and data acquisition were performed using MassLynx V4.1 software (2018, Waters Corporation, Milford, CT, USA). Data were processed using UNIFI 1.9.3 (2018, Waters Corporation, Milford, CT, USA).

2.3.6. X-ray Diffraction (XRD)

The outermost coating was analyzed by XRD on a Rigaku D/max 2550PC (Osaka, Japan) diffractometer using Cu Kα radiation (40 kV, 100 mA), and a graphite monochromator at a scan speed of 8°/min in the range from 3° to 90°. Sample was sprinkled on a zero-background sample holder and was dispersed with ethanol. A JCPDS Powder Diffraction File gave diffraction patterns for the sample.

2.3.7. Macro X-ray Fluorescence (MA-XRF) Mapping

The determination of element distribution on a selected area (mapping region of 50 mm × 68.5 mm) of the fabric surface was performed with a Bruker M4 Tornado XRF (Berlin, Germany) spectrometer with a Rh X-ray tube and operated at the tube voltage and current of 50 kV and 600 μA, respectively, with a spot size of 20 μm and measurement time per pixel of 10 ms. The max pulse throughput was 130 kcps and maximum energy was 40 keV.

2.3.8. Desorption Electrospray Ionization Mass Spectrometry Imaging (DESI-MSI)

The capillary voltage 4.5 kV was applied both for polarity ES+ and ES−. During the examination, 100% methanol as the spray solvent was focused onto the surface of the printed sample and in situ analysis conducted at the flow rate of 2 μL/min. All the colors in the chosen area were represented and the pixel size was set at 250 μm. Both positive and negative spectra were recorded. Data were processed using HDImaging version 1.4 (2016, Waters Corporation, Wilmslow, UK).

3. Results and Discussion

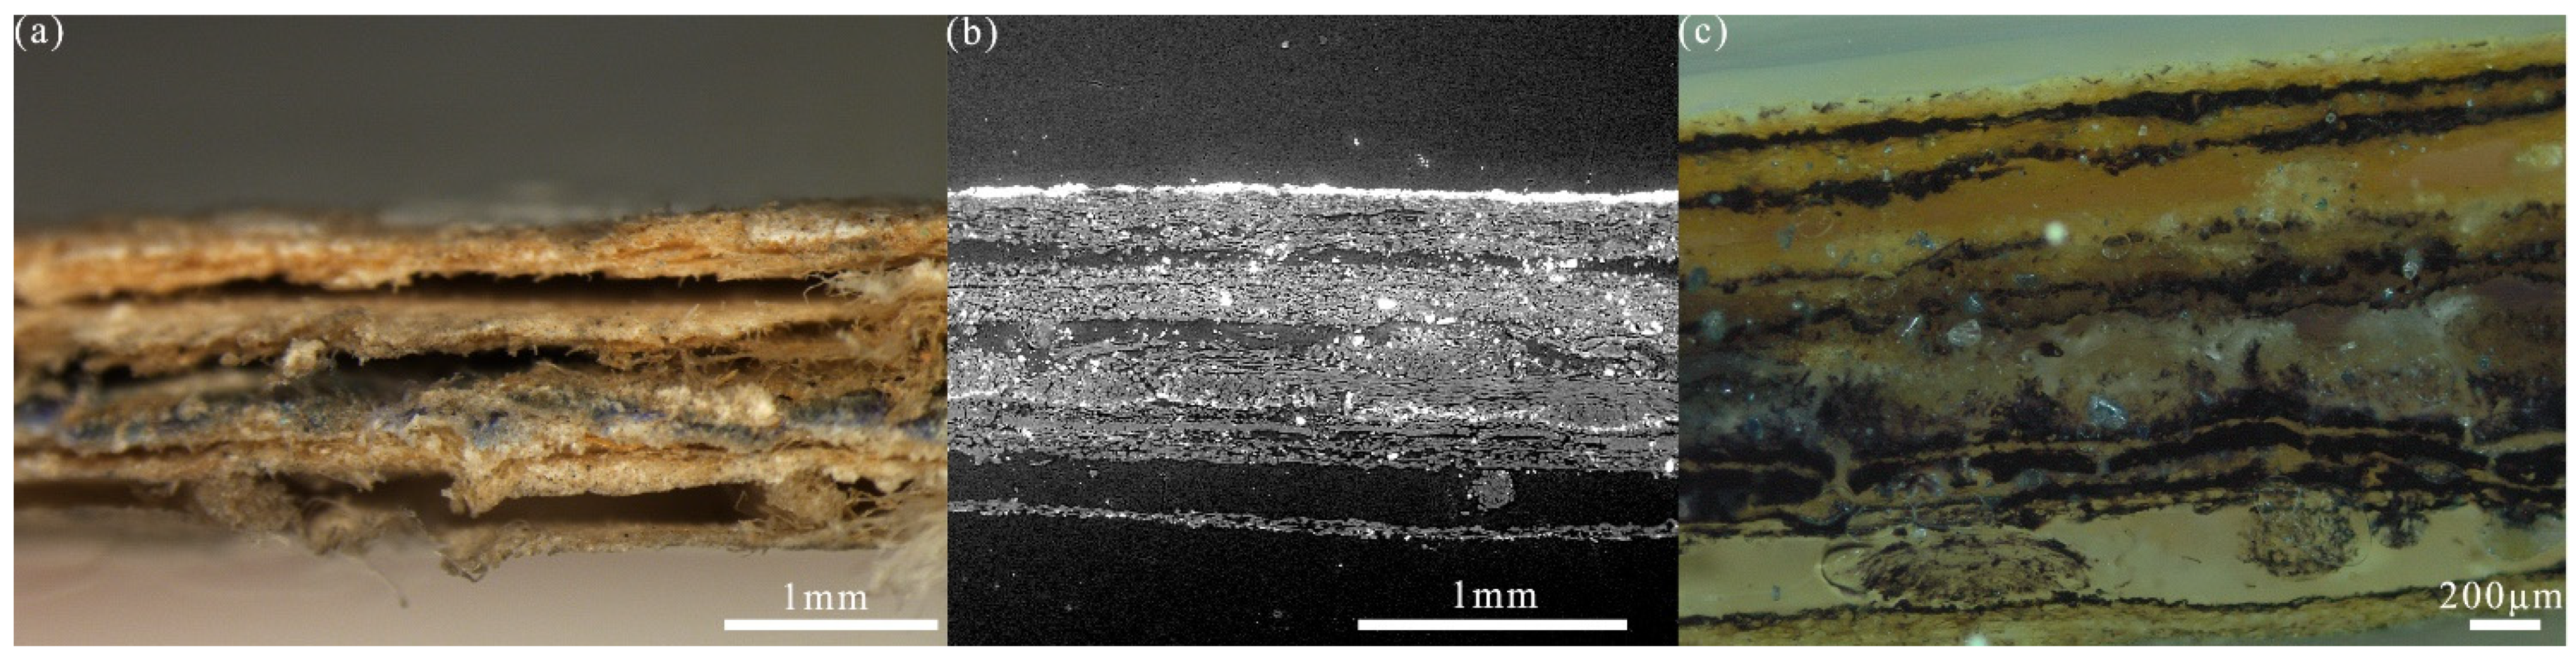
3.1. Cross-Section of the Whole Ceiling Structure

Microscopic observation of the complete ceiling complexes from innermost to outermost layer is illustrated in Figure 2 corresponding to every picture from bottom to top. The whole stratification without resin embedding could be observed obviously (Figure 2a), indicating the weak interaction between the interfaces. Corresponding observation of morphology embedding into resin at 100× magnification is exhibited in Figure 2b. The complete structure from the wooden ceiling to the outside could be divided into 11 layers. With the aid of staining agent, starch could be confirmed as the organic binding media which related to the condition of each layer directly (Figure 2c).
The whole layering sequence was marked in ascending numerical order from closest to the wooden ceiling outwards and analyzed by ATR-FTIR mapping for component variations and distributions (Figure 3). The degradation of cellulose induced by light would produce many carbonyls with characteristic infrared absorption bands around 1710–1740 cm−1 [19]. Herein, the absorption band at 1717 cm−1 assigning to the carbonyl vibrations was greatly enhanced in layer No. 7 compared with those in layers No. 8 to 10. In addition to wood cellulose, paper fiber was also made up of lignin, with bands ranging around 1500–1520 cm−1 for C=C vibrations. The characteristic absorption peak occurring at 1265 cm−1 was mainly distributed in layers No. 7–10, which had weakened due to its decomposition. By conferring the absorption intensity of 1717 cm−1 and 1265 cm−1, respectively, the ageing of the paper fiber could be qualitatively evaluated. Layer No. 7 had more obvious ageing in comparison with those in layers No. 8–10, and thus we speculated that the time periods of the three layers outside containing wood pulp paper should be in the 1950s or later for paper pasting combination with the relevant report of surface decoration evolution [20].
Distinctive localizations of paper and textile could be observed judging by the absorbance bands at 1111 cm−1 and 1050 cm−1 in the cellulosic fingerprint region attribution to an O–H association absorption band, and C–O–H (C–O stretching and O–H deformation) vibrations, respectively. A polysaccharide with C–O–C skeletal mode vibration was detected with the infrared band at 930 cm−1 assignment to α-1,4 glycosidic linkage [21]. Hence, starch was further verified as the adhesive in the ceiling pasting process along with the staining result.

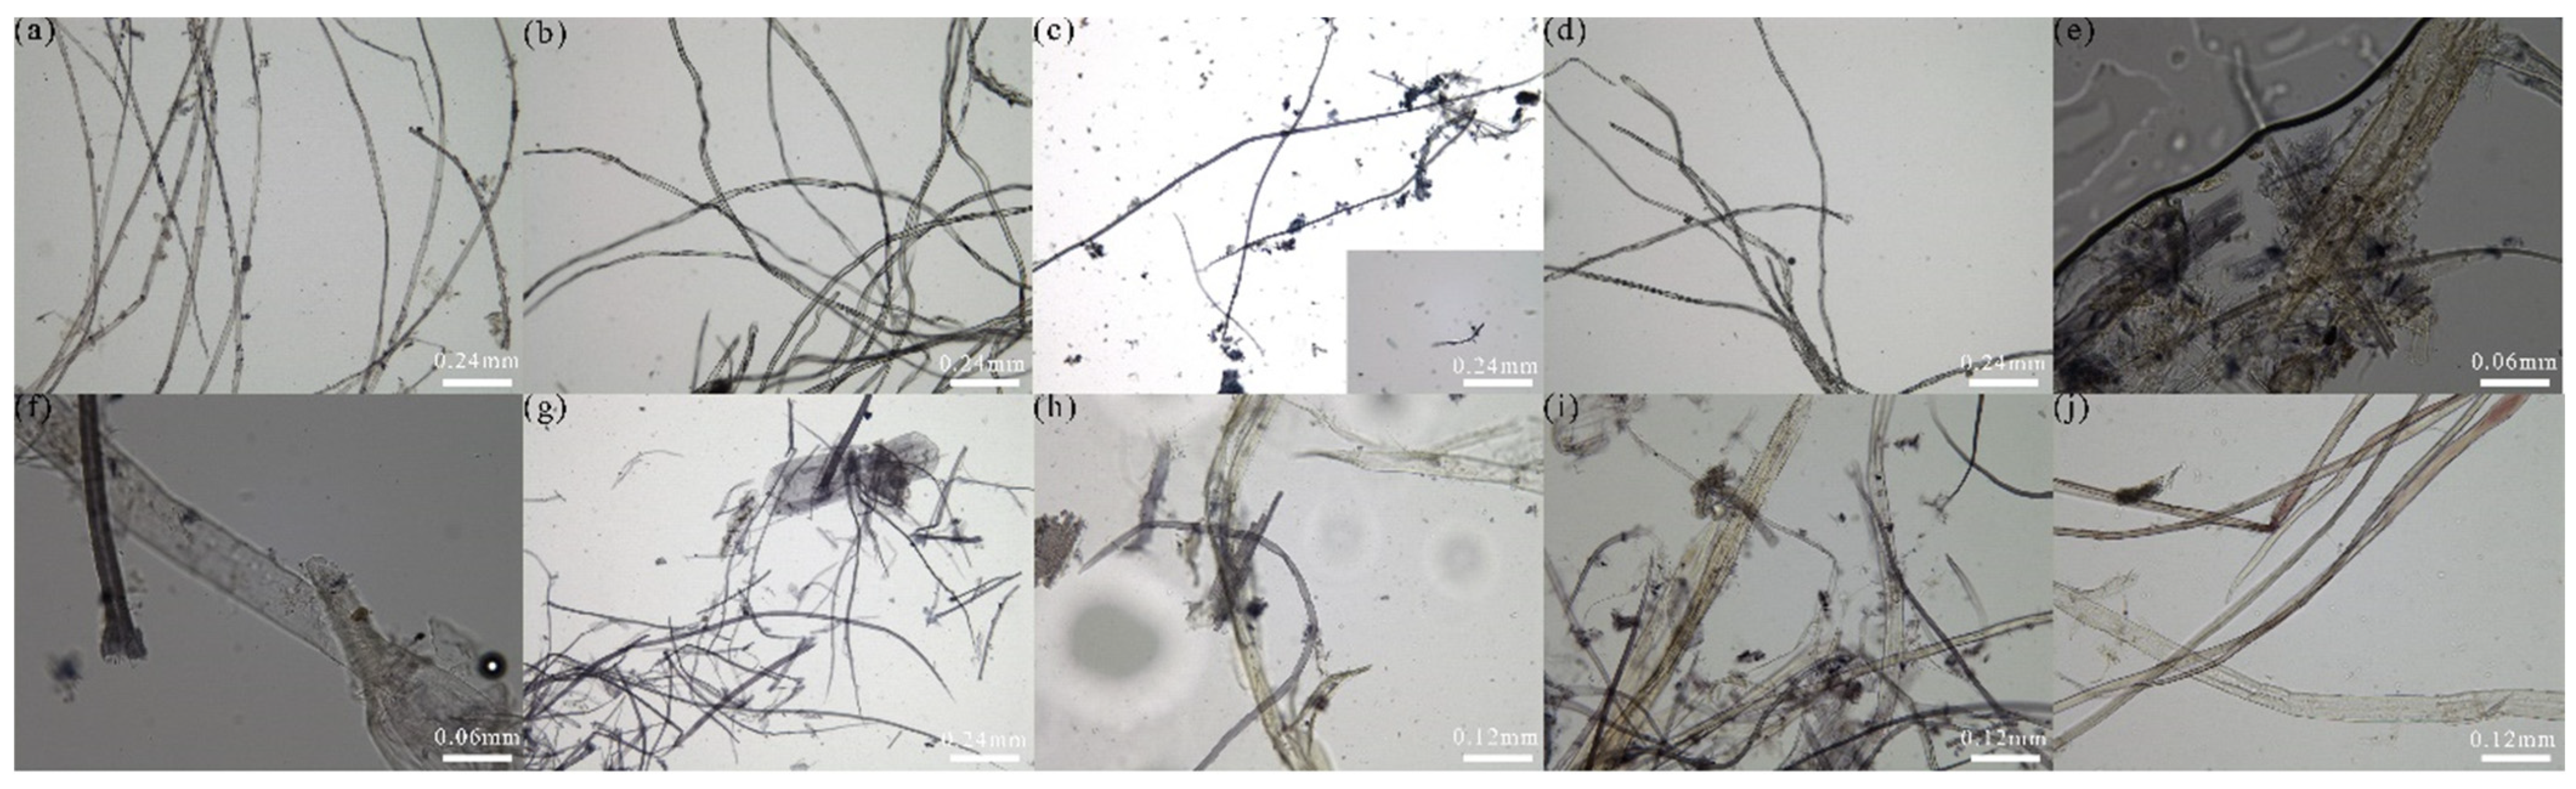
3.2. Fiber Morphology of Each Layer

The morphological features of paper and textile fibers were microscopically observed (Figure 4) and identified on each layer in accordance with instructions on identification of different kinds of characteristic fibers [17,22]. The innermost layer, No. 1, was the closest to the wooden suspended ceiling, with the main characteristics of gel coat, cell cavity, horizontal knots, and long size fiber, which was considered as bast paper for common pasting. The cotton fiber of layer No. 2 contained a flat and twisted ribbon without any knots or pores on the cell wall. Like those of layer No. 1, No. 3, with xuan paper, was found with epidermal cells of the grass fiber besides. The first three layers were together named as panbu, where the cotton fiber was located between the two layers of paper. Ma et al. have conducted series research of the paper in the Hall of Mental Cultivation collection and also found its utilization in the ceiling [23]. Layer No. 4 was very special as a colorful layer of printed fabric, and was mainly composed of cotton fibers similar to those of layer No. 2 because a typical cross-section from randomly selected parallel fibers could be observed (Figure S1, see Supplementary Materials) [24]. In the case of layer No. 5 and 6, the pores of the tubular cell wall, which could be observed on the wood fiber, resulted in the yellow board paper with a rough surface in general. Due to the shortage of raw materials, funds, and craftsmanship, this kind of paper was applied for restoration during the Republican period [25]. In layer No. 7, bamboo paper was applied with rigid fibers and thick vessel elements. From layers No. 8 to 10, wood pulp papers were used with the main features of undispersed sheet-like serrated epidermal tissues, as well as wood pores, gel coat, cell cavity, and horizontal knots.

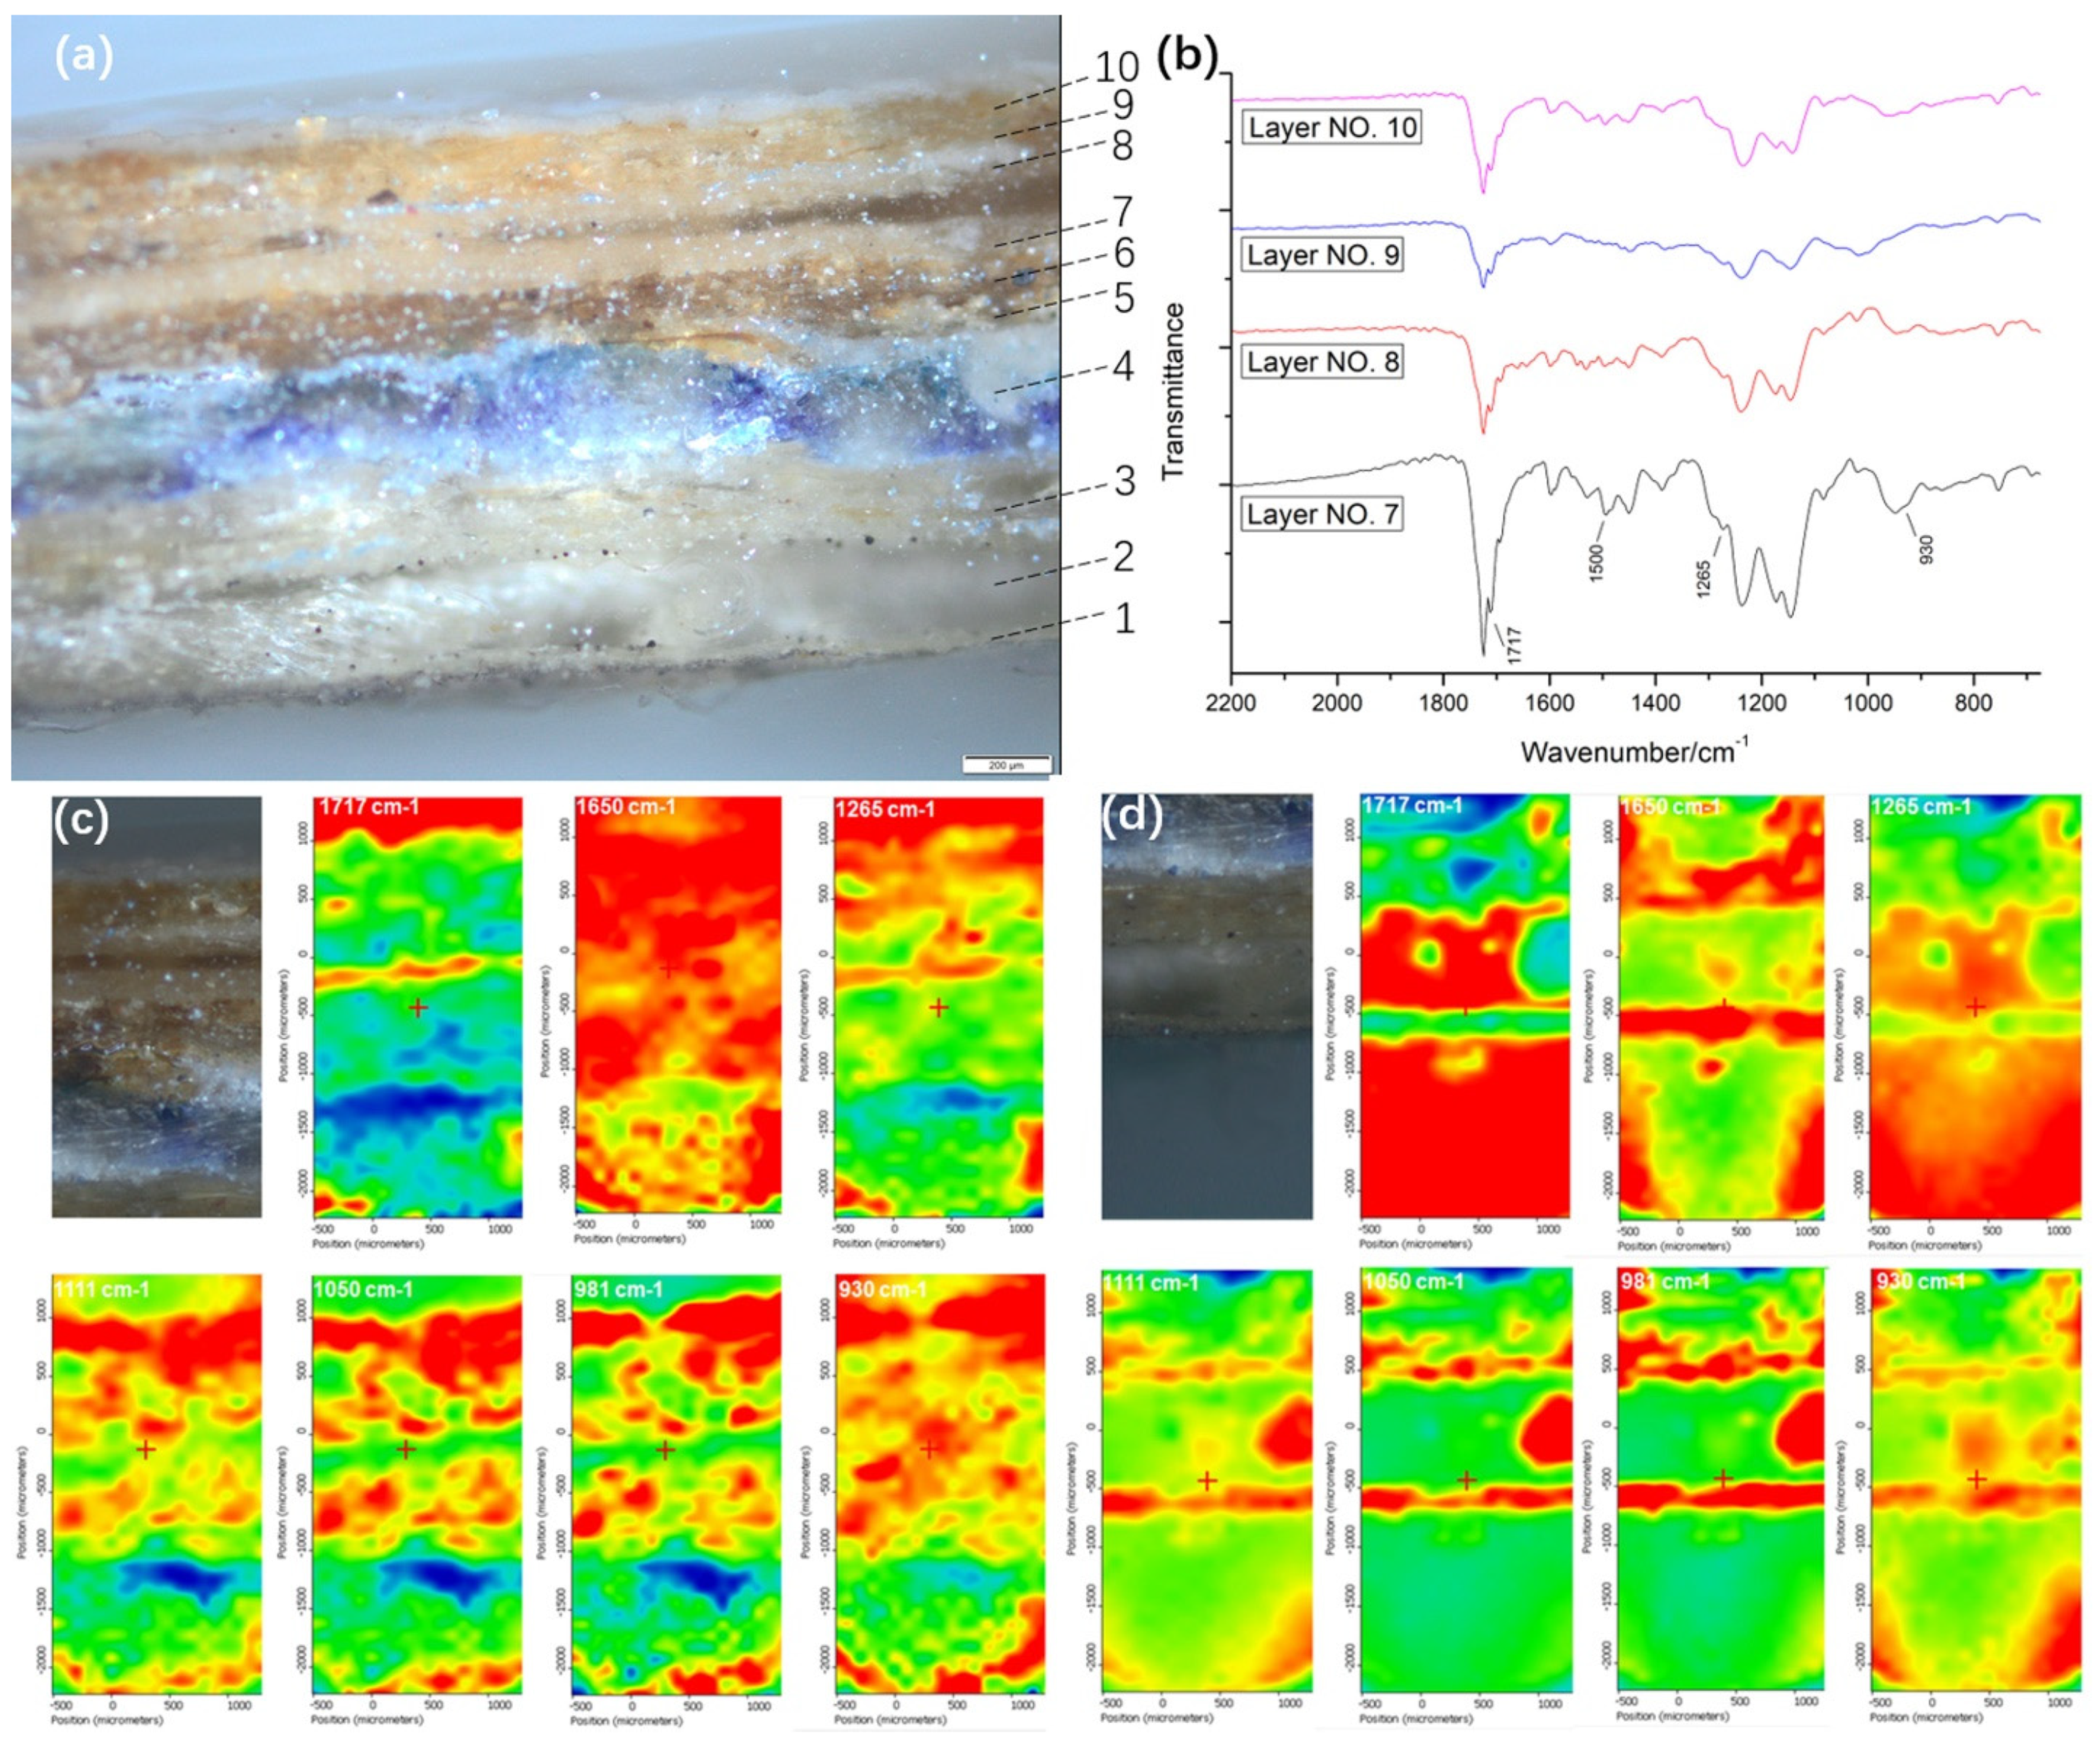
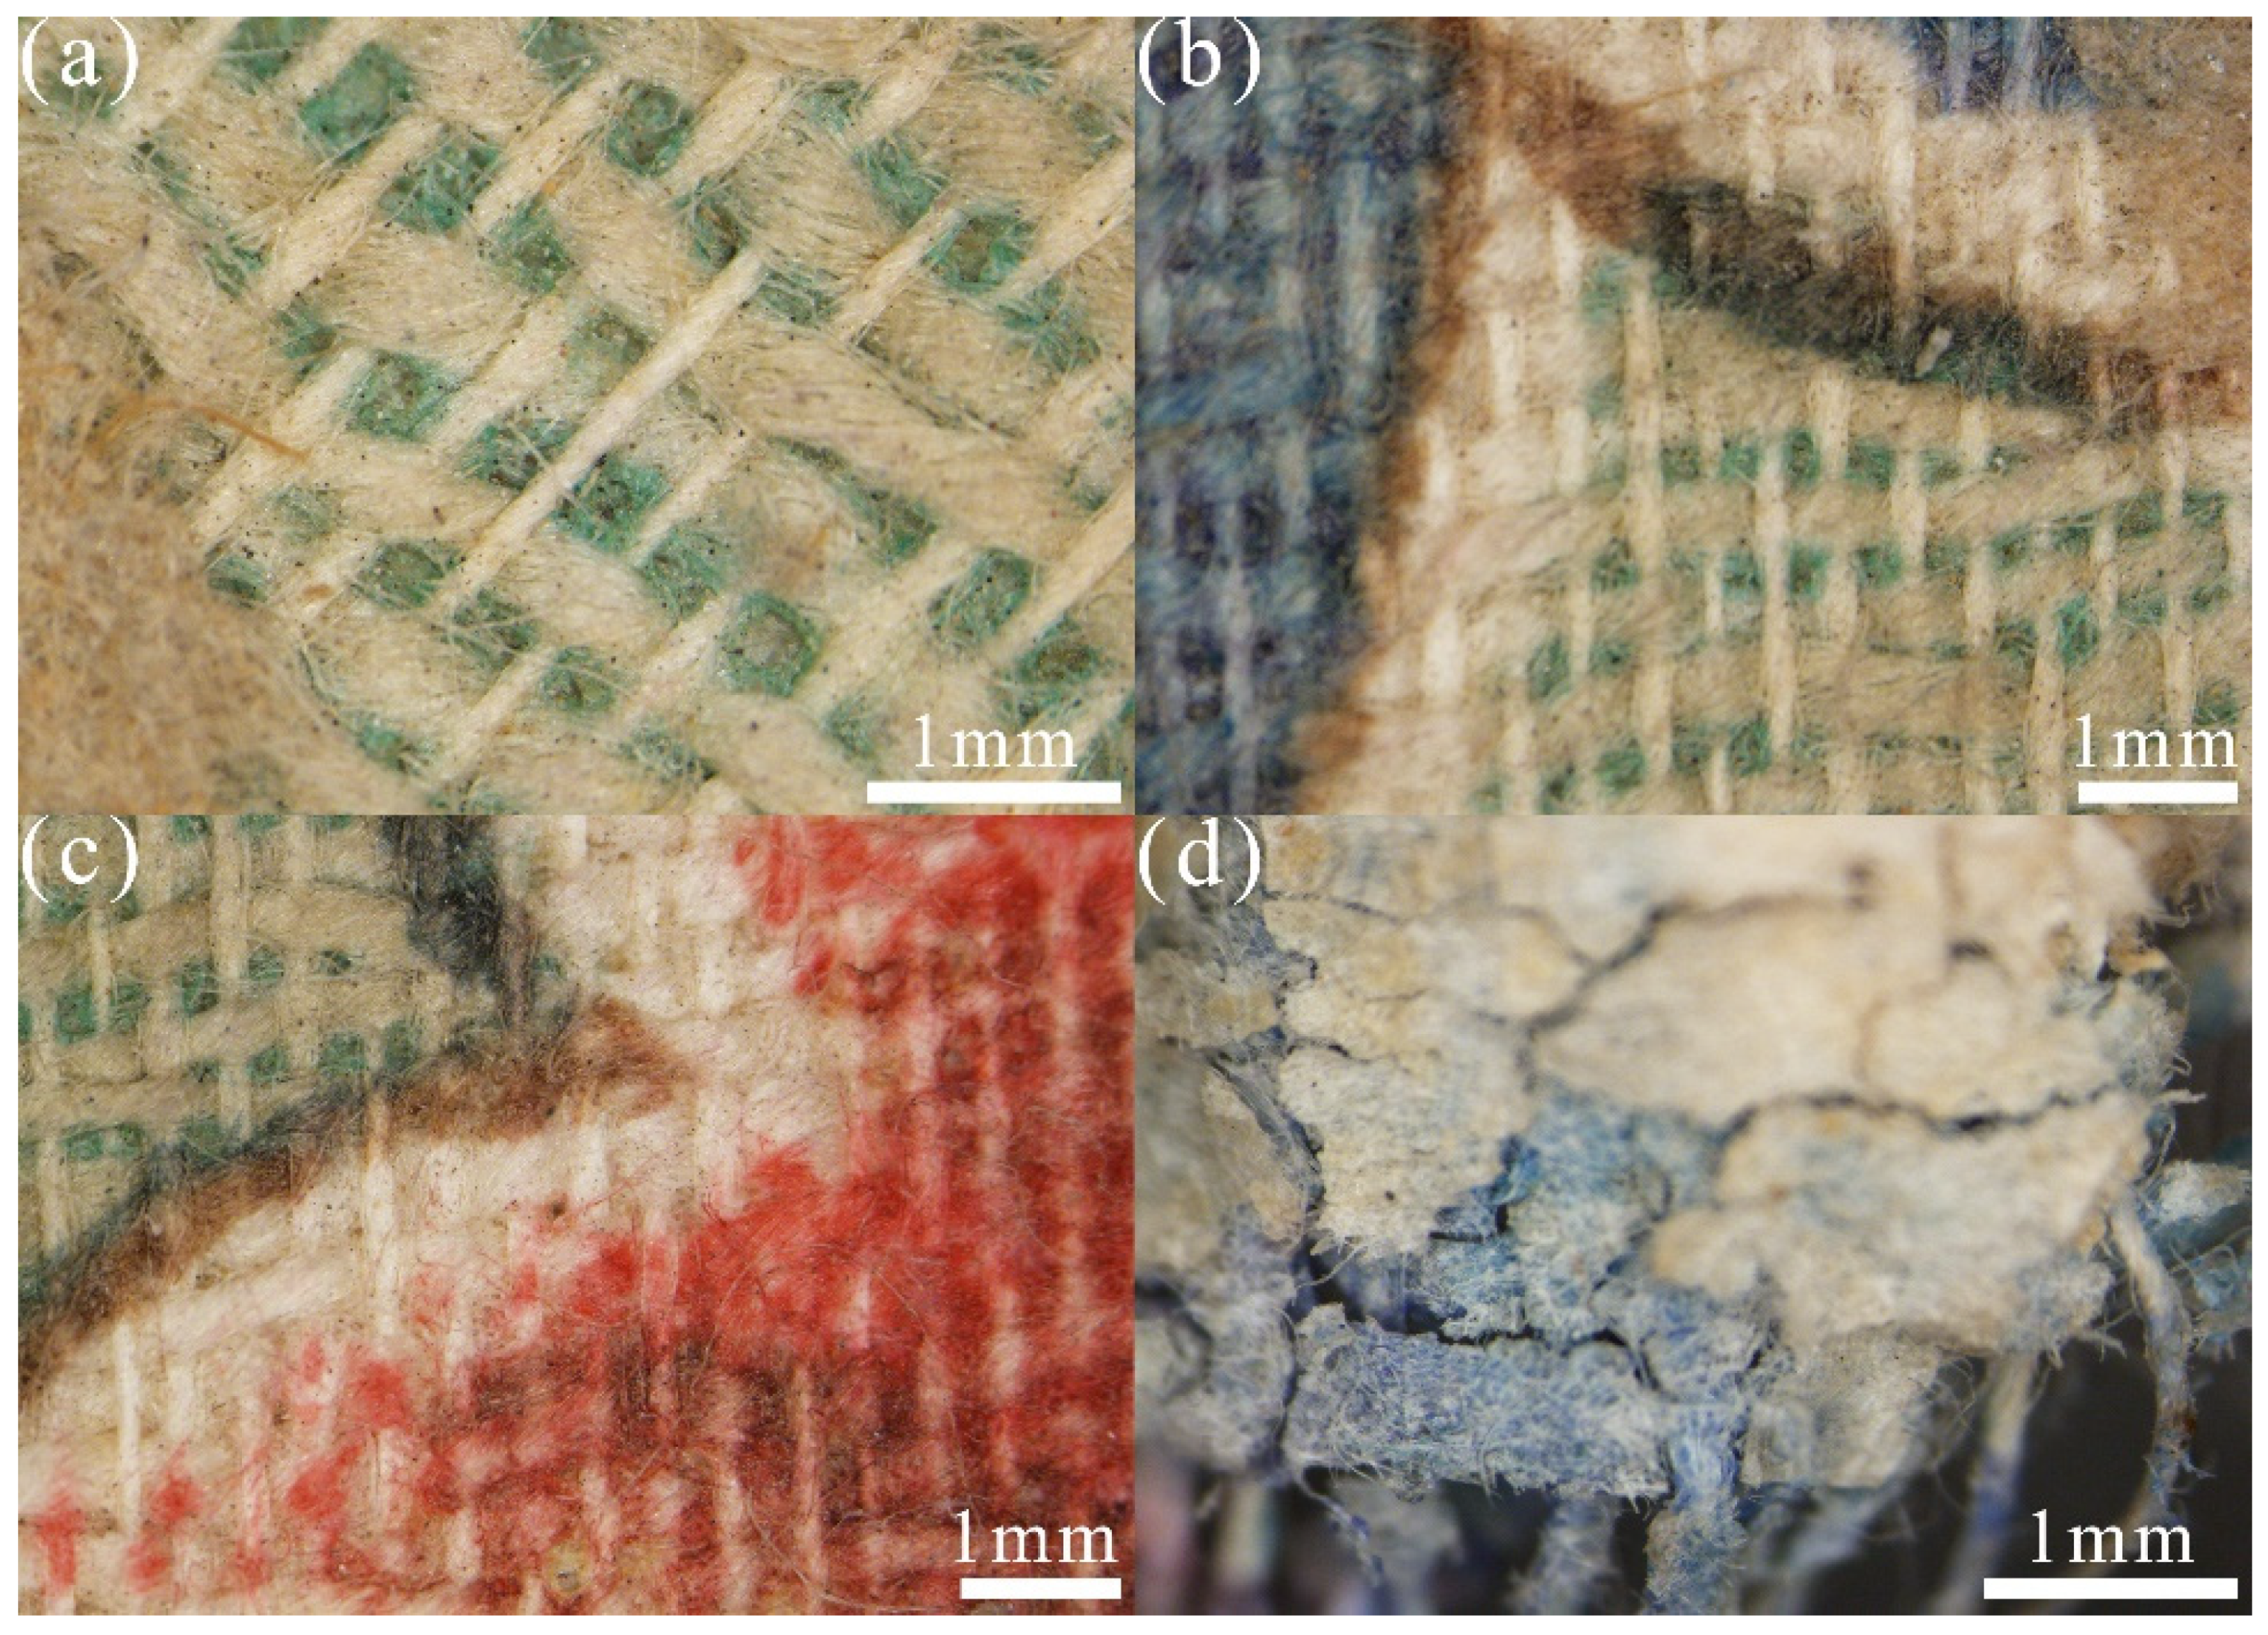
3.3. Analysis of Characteristic Fabric Layer

3.3.1. Woven Process

The fabric formation derived from jacquard weaving technology was observed to show an up-and-down plain cotton weave. The shades were not very uniform in the case of magnification and a pad dyeing process was most probably involved to make the green ink distribute on the bottom of the fabric, so the surface fiber of the background was not printed (Figure 5a). Except for the green ink which was lining the bottom of the warp and weft fibers, others were printed on the surface of the fabric (Figure 5b), especially for the red one (Figure 5c), albeit this was nonuniform but extremely bright and most likely manually embellished. The white margins on the pattern may refer to the white discharge in the printing process. There was a layer of transparent adhesive on the backing of the printed fabric and paper residues could be clearly observed (Figure 5d).

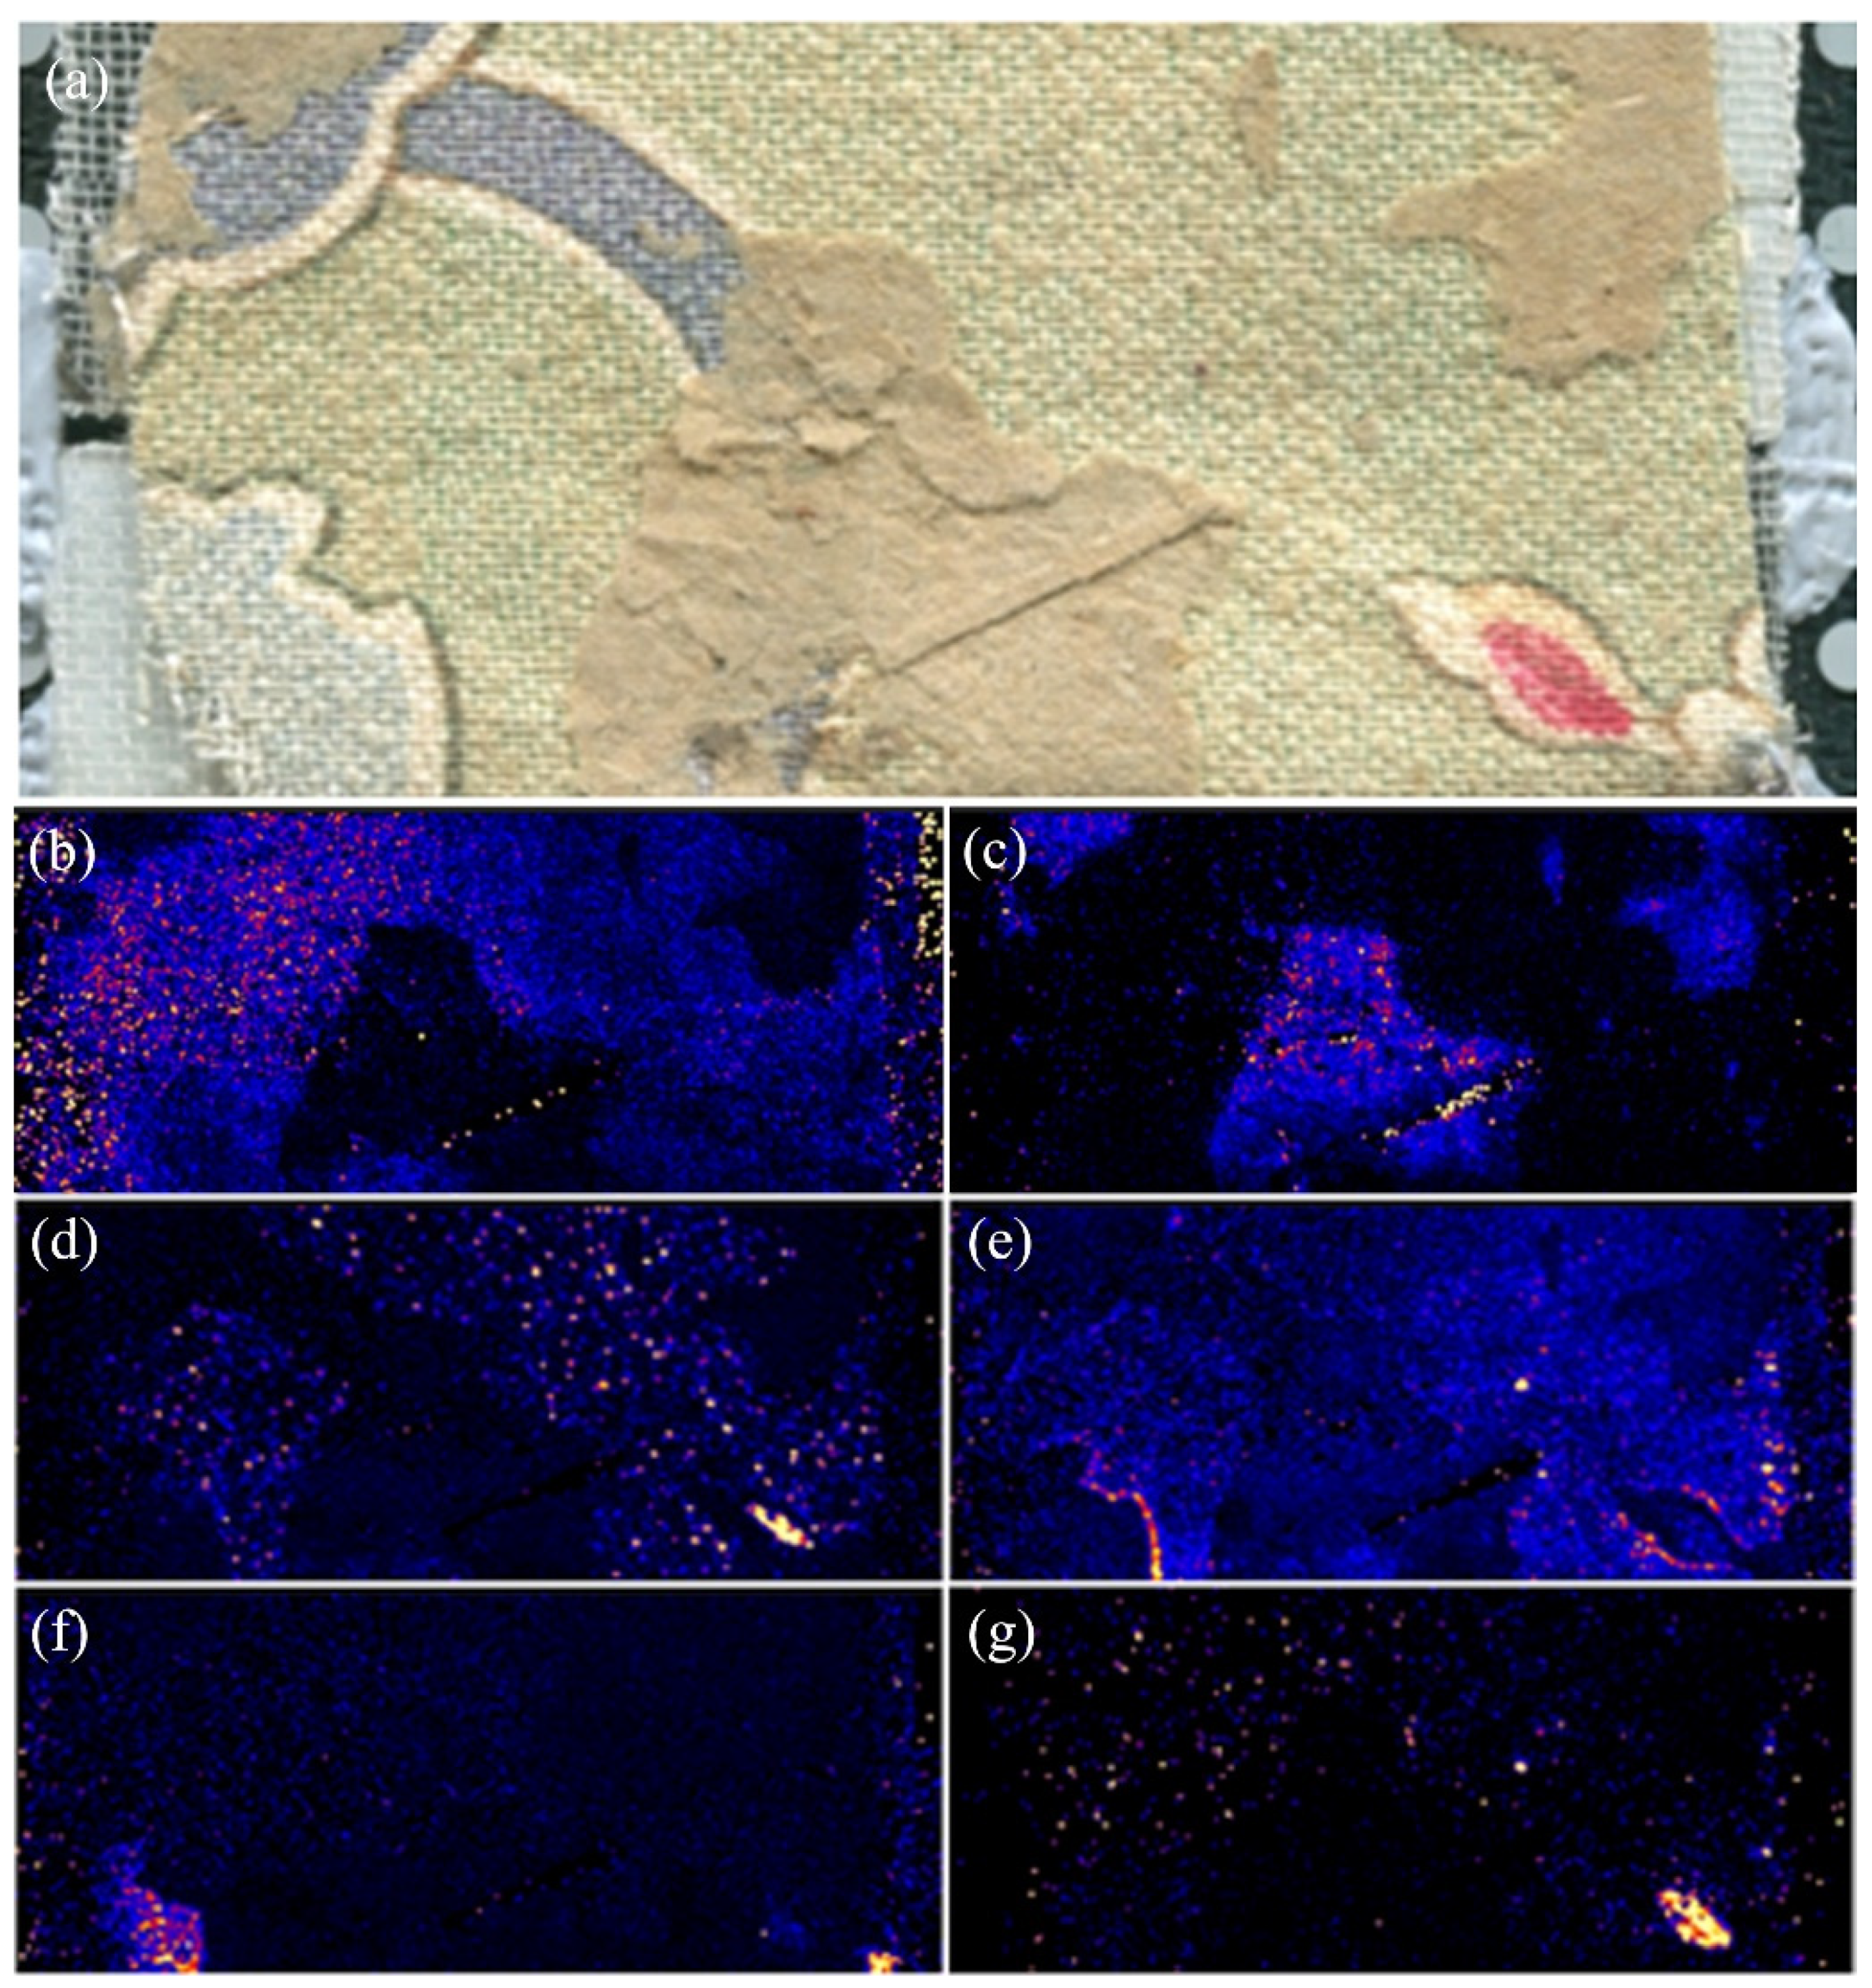
3.3.2. Trace Element Mapping Analysis

Surface element feature imaging was achieved over a selected area (Figure 6). The distribution pattern of the element Cr was very prominent such that an expensive chromium-based pigment may have been used as dark draft line. The chromium (electronic configuration [Ar]4s13d54p0) could form the coordinated structure with the coordination number of 6 given empty outer electronic orbitals. The tinting dyes could functionalize as multidentate ligands to form the chromium-based organometallic complex. This kind of dye–metal compound made the lightness of the color become lower and form dull shades with excellent light and wet fastness [26]. Trace of manganese was also detected in the draft line sample, which may be an impurity made from the original metal source during the synthesis of chromium-based pigment [27].
In addition, it was also detected that Mg, Al, Si, P, S, K, Ca, Ti, and Ba were distributed in the paper residue patterns on textile fiber from the layers No. 5 and 6, indicating the application of titanium-based pigments containing inorganic additives such as basic aluminum salts, calcium phosphate, and the silicate coagulant magnesium sulfate into the paper fiber. Titanium whites containing a series of titanium compounds including barium titanate, potassium titanate, and titanium silicate could be referred to according to the detected elements and used as the opacifier, filler, and coating in the pulp paper, and were considered as the products of twentieth-century industrial development [28].

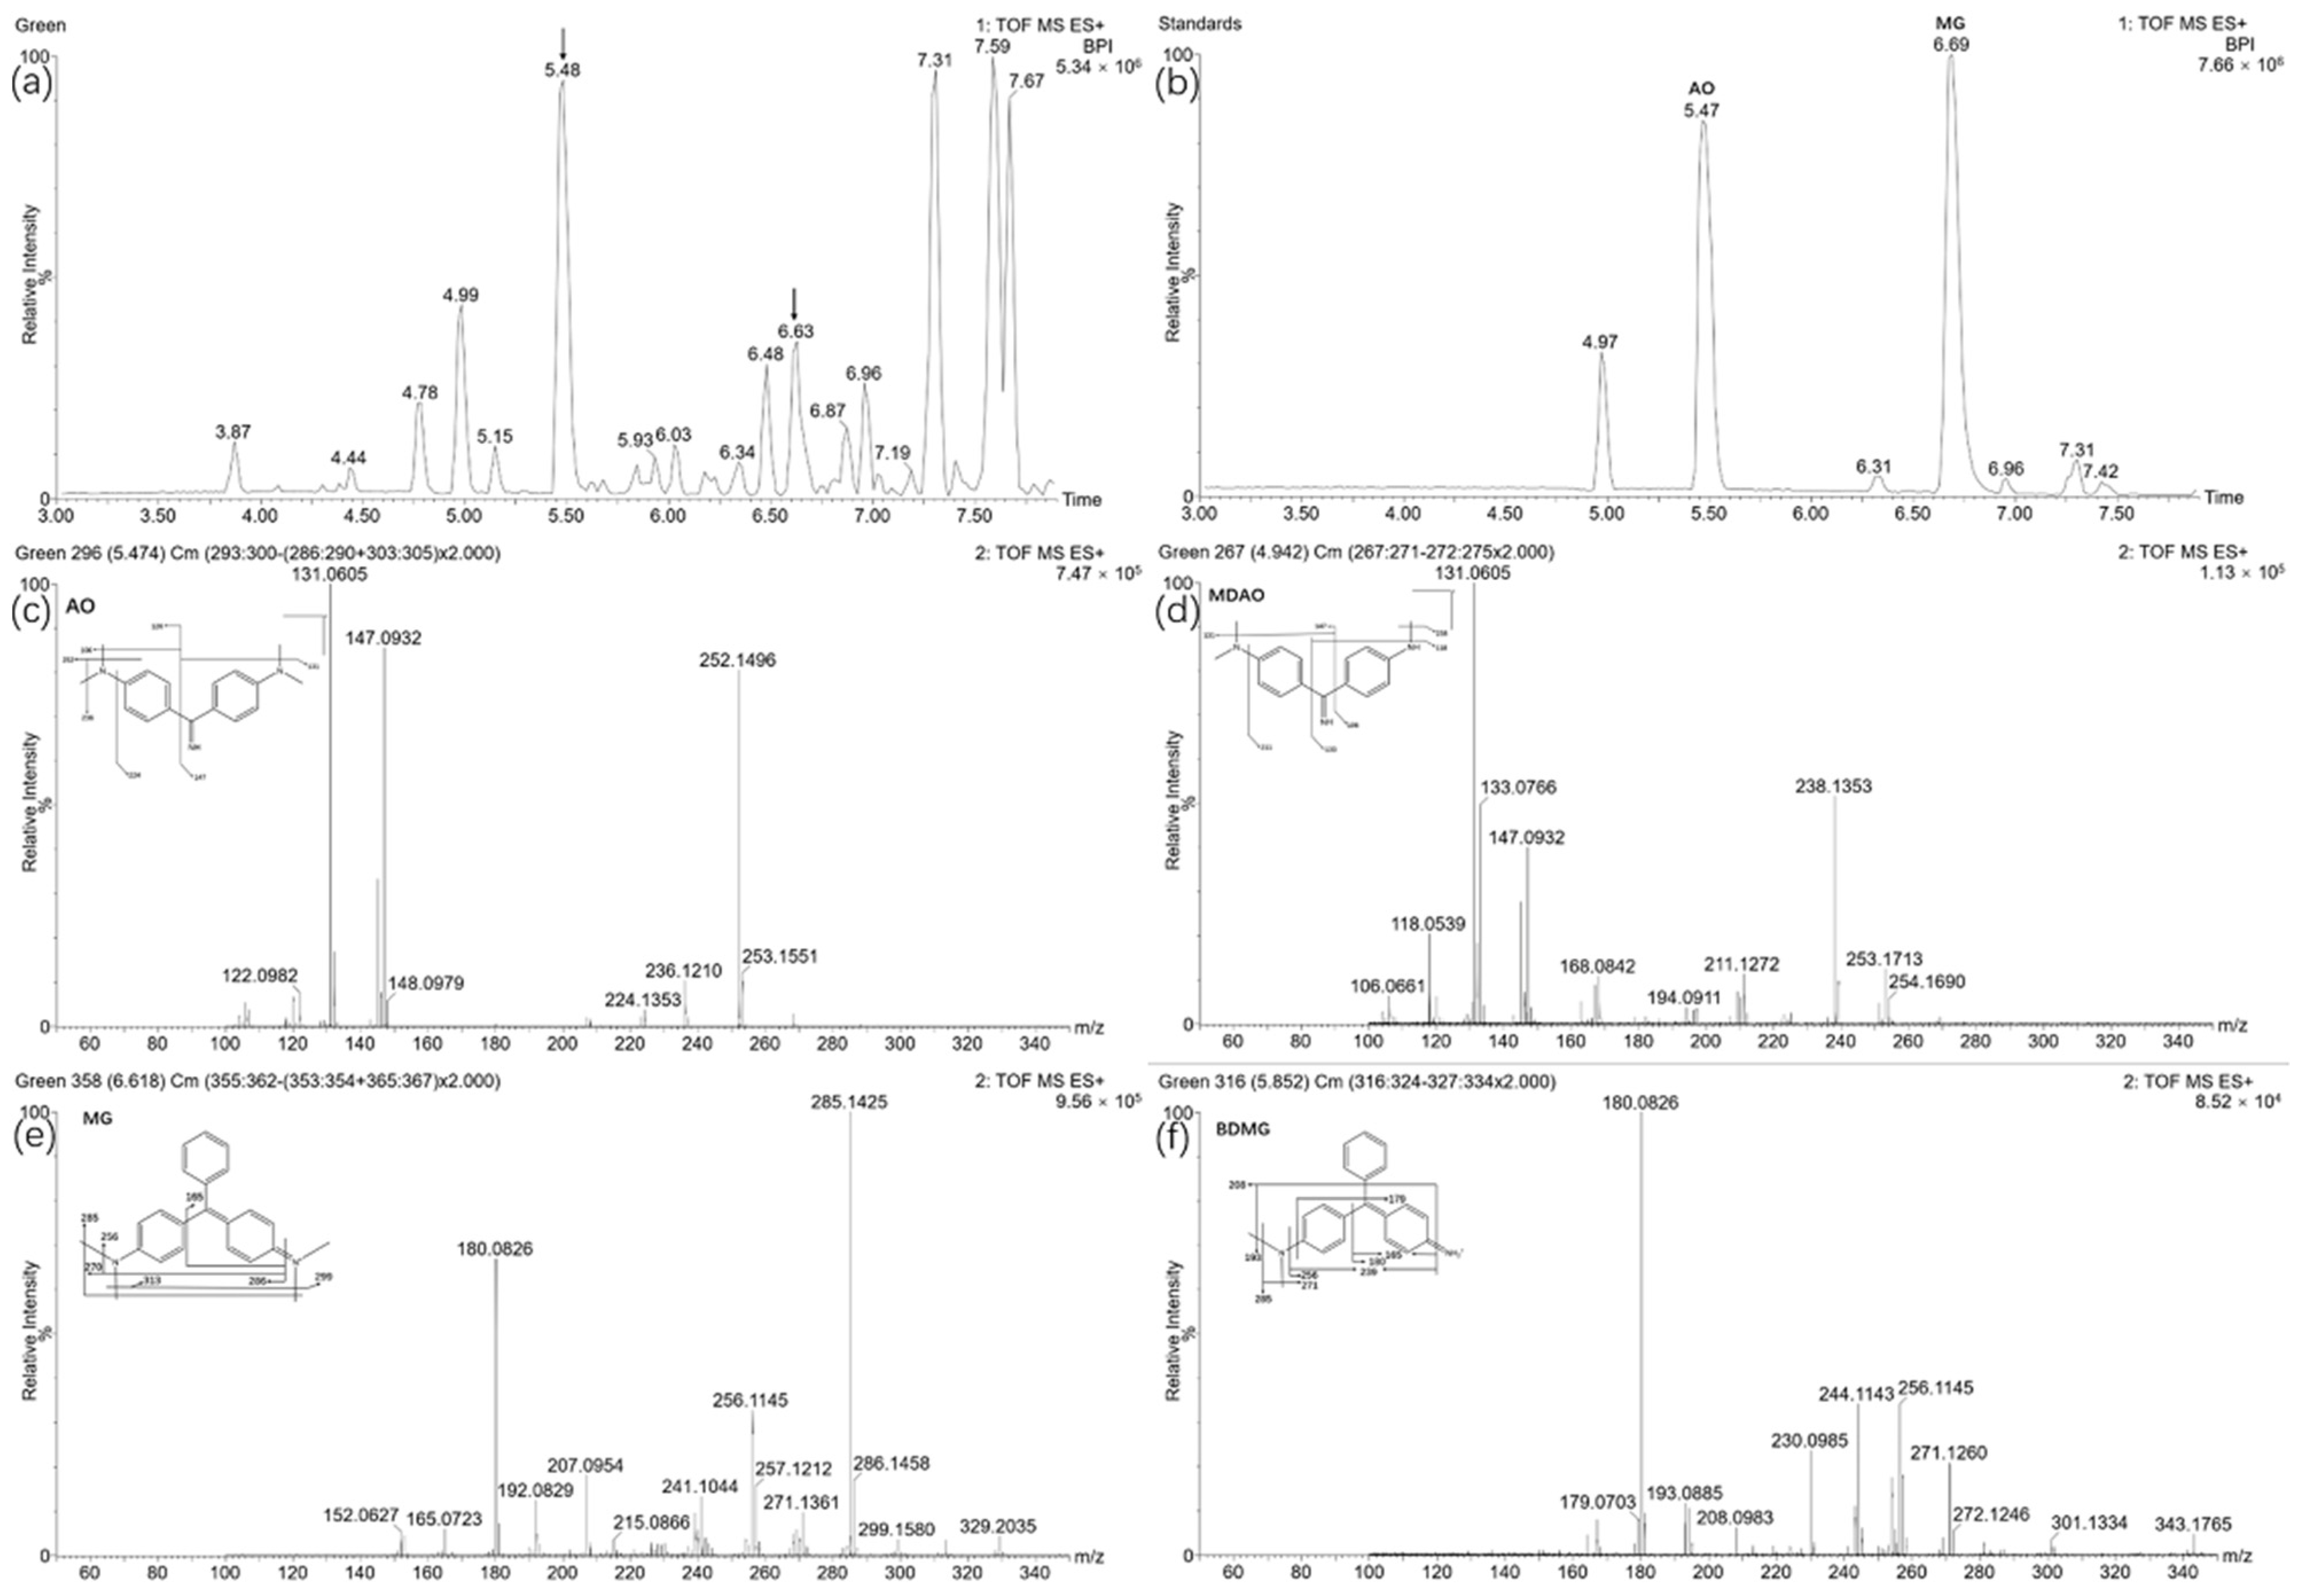
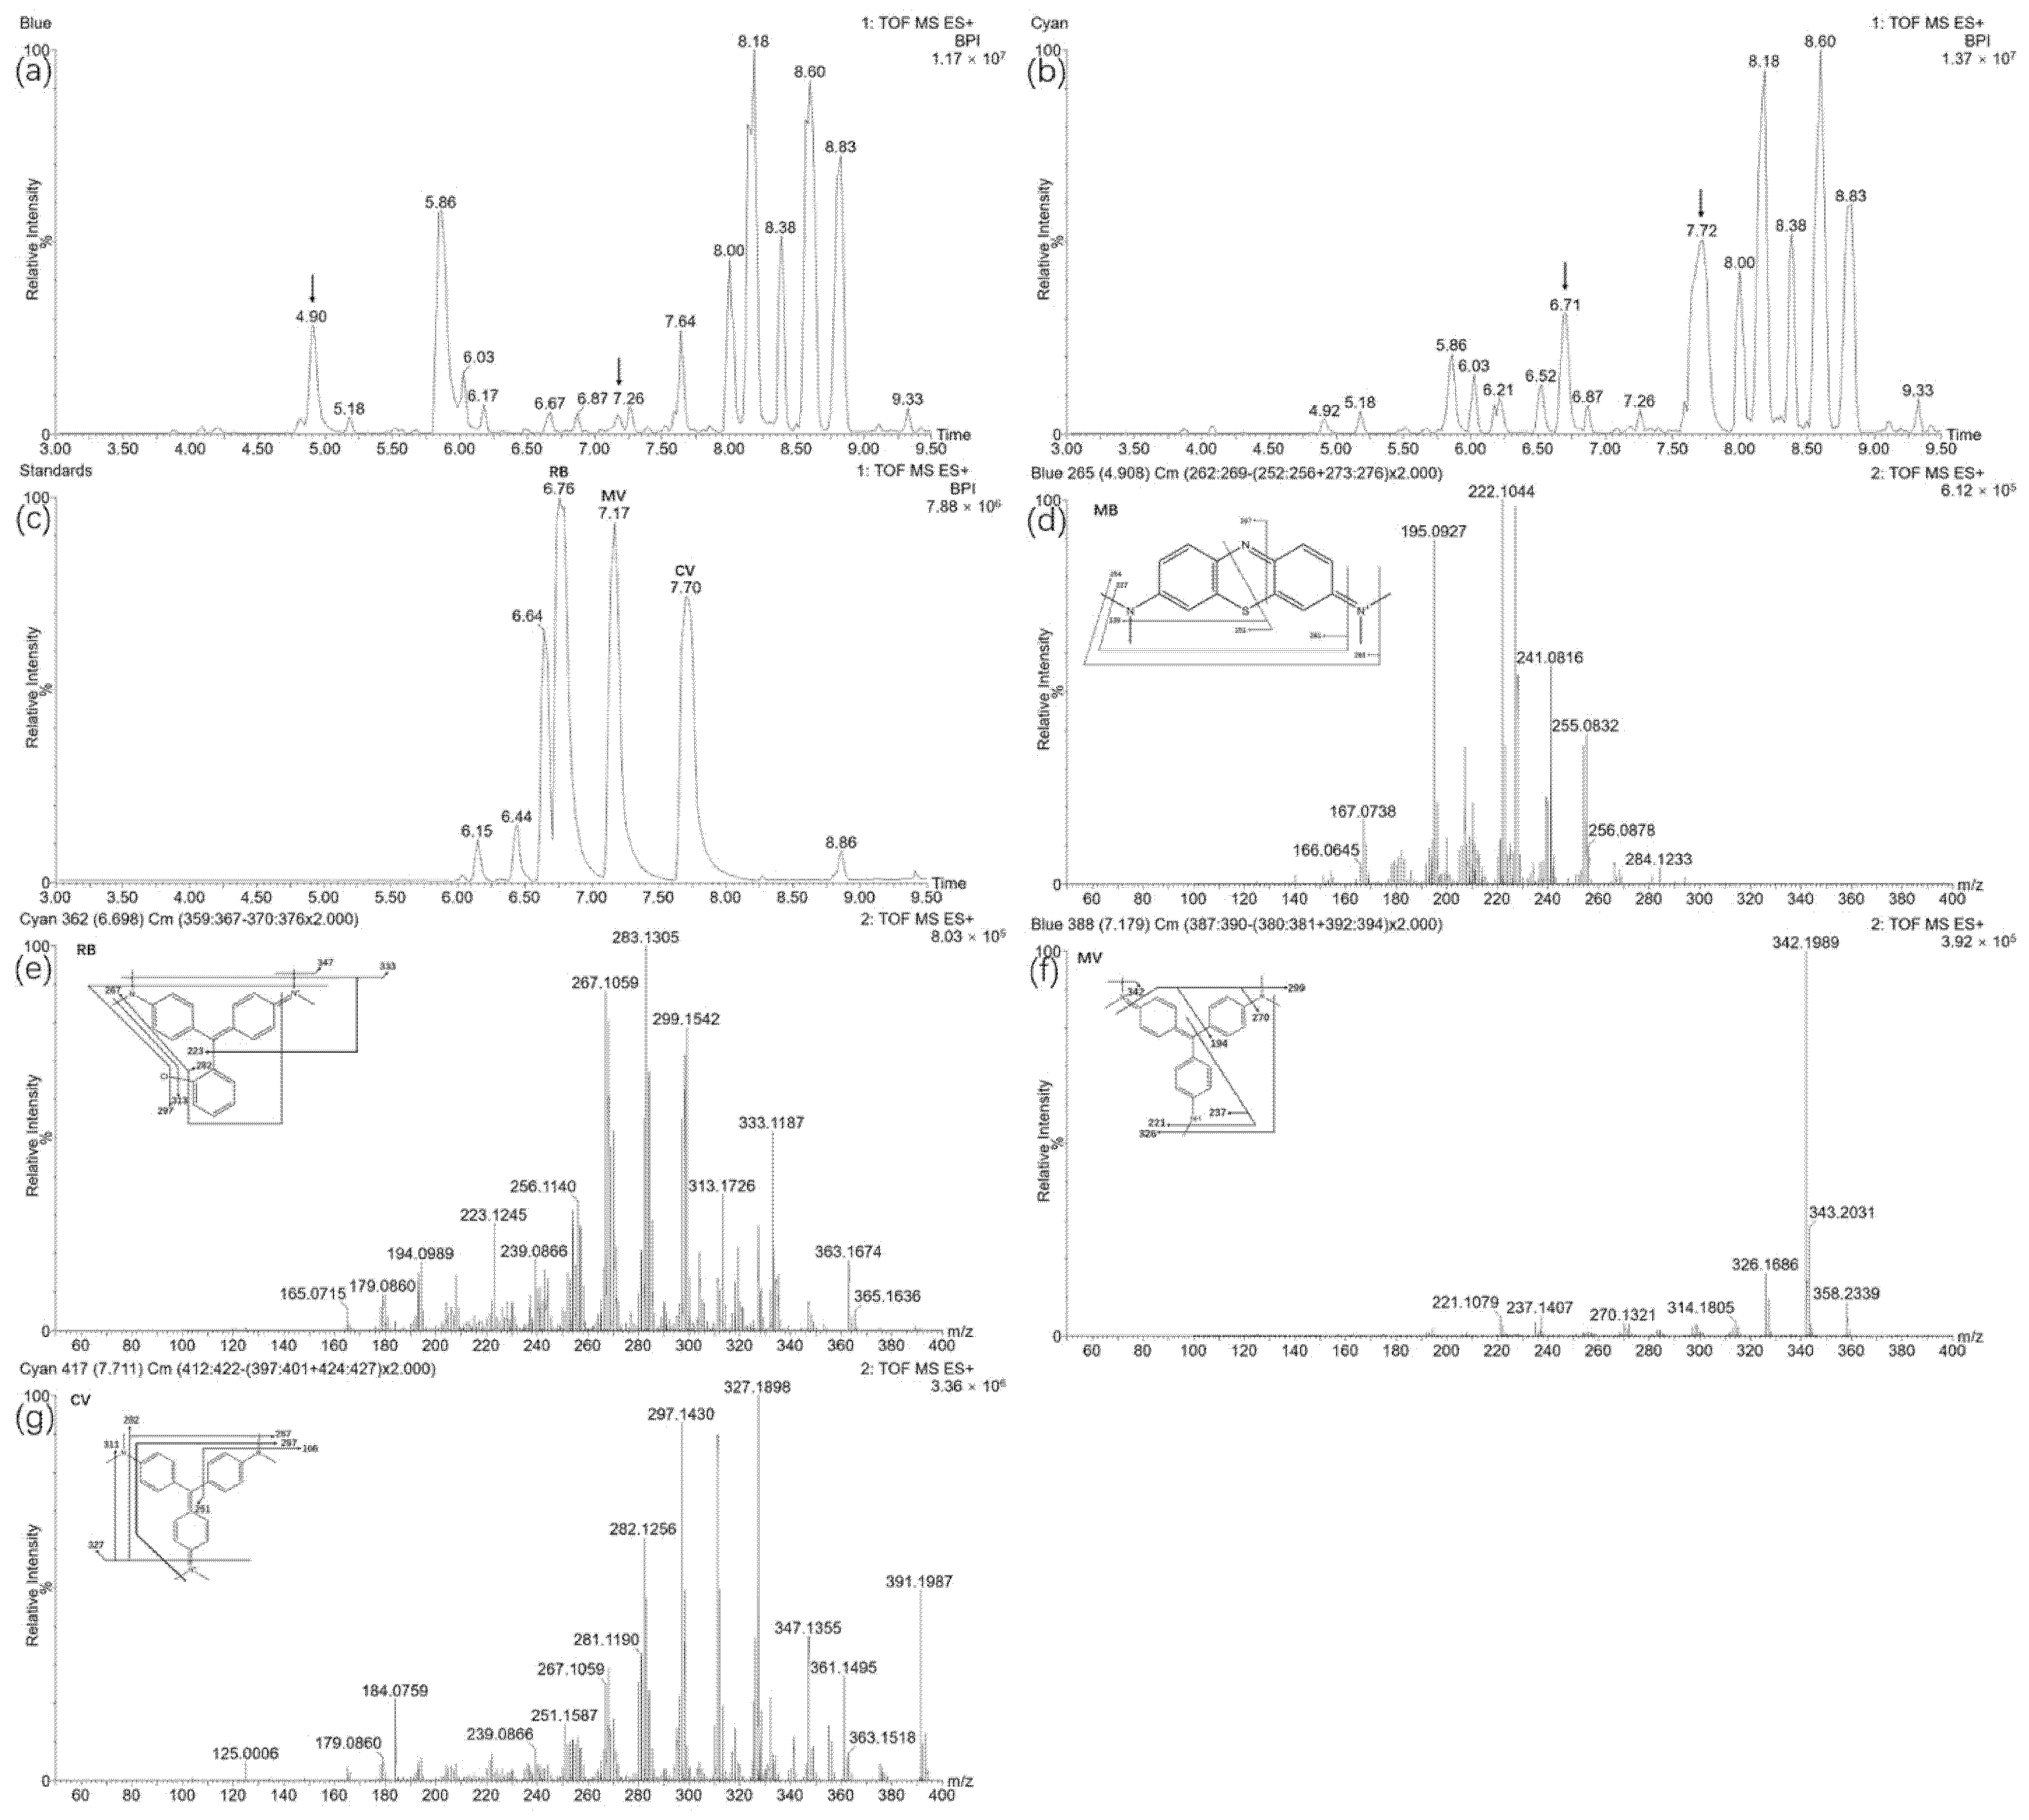
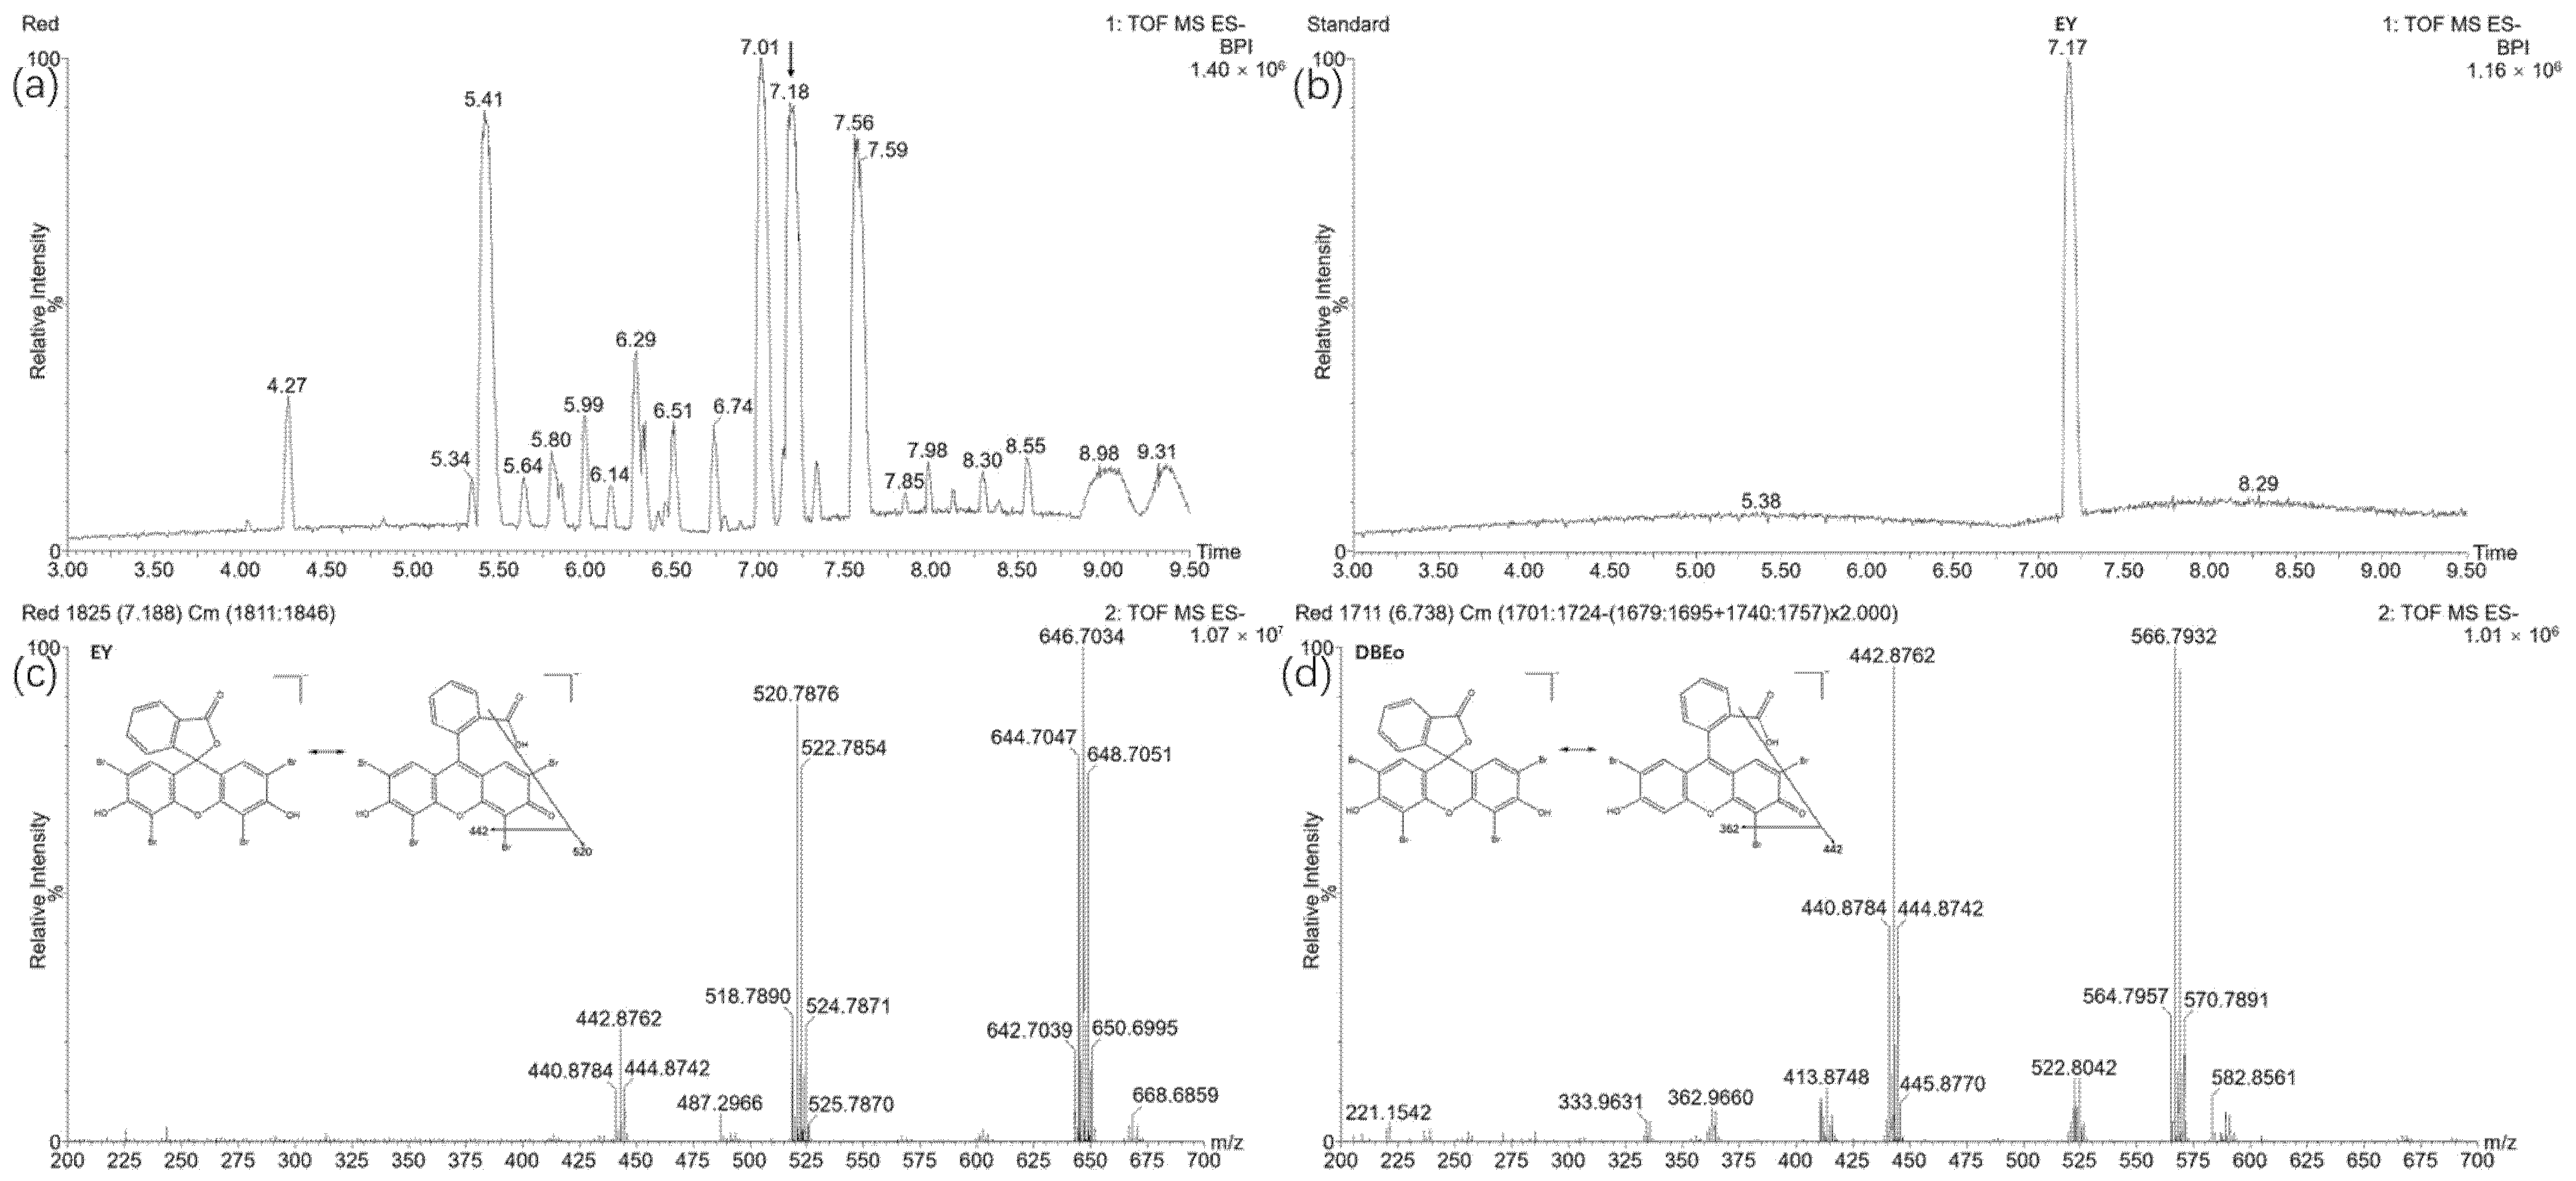
3.3.3. Industrial Dye Identification by LC-MS

The traditional Chinese patterns in the printed fabric were mainly composed of five inks: white inks represented patterned texture; green inks represented the background shade; blue inks represented the branches and leaves; cyan and red inks represented plum blossom petals. CIE Lab values were determined for different inks and are exhibited in Table S1. Seven industrial dyes were identified in total and the detailed analysis results are listed in Table 1. All the chromatographic profiles and product-ion mass spectra containing molecular structures and proposed fragmentations were exhibited. The white sample did not contain any dyes, while green, blue, and cyan samples maintaining basic dyes were all recognized in positive ion mode. The red sample in which only EY as acid dye was found among the identified dyes was easily analyzed in negative ion mode because of the deprotonated property.
In the case of the analysis of the green inks, the chromatogram spectra are shown in Figure 7. Compared with the standards, the green sample was found containing auramine O and malachite green eluting at the retention time of 5.48 min and 6.63 min, respectively. Auramine O was detected in the embroideries including “Breton women” and “Plants and flowers on orange fond” designed by French well-known painter Emile Bernard (1868–1941 C.E.) [29]. A demethylation product (MDAO) of auramine O was found eluting at 4.99 min (m/z 254). According to the preparation of auramine O, the main reason for the by-product was possibly caused by the source of raw material. During the synthesis for the first step or the last step [30], if dimethylaniline mixed with N-methylaniline, MDAO was easily prepared. A bis-demethylated MG derivative (m/z 301, RT 5.93 min) as degradation by-product was found in the green sample [4,31]. These two inks were used together to form a vivid green ground shade or tone.
For the analysis of characteristic blue inks (Figure 8), methylene blue and methyl violet were detected in the blue sample with the retention time of 4.90 min and 7.17 min, respectively [32]. The cyan sample was dyed using a combination of rhoduline blue and crystal violet with the retention time of 6.71 min and 7.72 min, respectively [33]. They were all basic dyes and could dye on cotton fibers by tannin mordant. Different dyes were tinted together for the special color and hue.
Considering the analysis of the red inks (Figure 9), the chromatogram profile showed significant strong isotopic peaks of bromine molecules, with retention time of 7.18 min compared to the standard eosin Y (EY) with the same chromatographic characterization. The molecular structure of EY attributed to the class of xanthenes and as acid dye was used in the masterpiece “Basket of pansies on a table” created by Vincent van Gogh in 1886, which is now in the Van Gogh Museum collection [34]. EY easily lost one bromine atom into mono-debrominated DBEo (C20H9Br3O5, m/z 566), which was detected with another bromine isotopic cluster peaks eluting at 6.74 min as synthetic by-products of raw material [35].

3.3.4. Direct DESI-MSI Analysis

DESI-MSI was conducted to distinguish the dye components of different inks on the printed fabric pattern and exhibited different localizations. Some of the molecular ions tracked to different patterns from the sample including the green background, dark draft line, cyan and red flower petals, cloth fiber, and paper residues. As shown in Figure 10, positive mode has larger differences than those in negative mode. The brighter the color, the more significant the content of characteristic molecular components.
In the positive ion mode, m/z 363 represented the distribution of rhoduline blue in the cyan pattern while m/z 268 and 329, respectively, represented the localization of auramine O and malachite green in the green pattern for the artifact MS imaging. Besides, the composition of cotton fiber with the molecular ion peak at m/z 279 ([M+H+H2O]+) in positive ion mode and m/z 259 ([M−H]) in negative ion mode confirmed the presence of a special component with a molecular weight of 260 Da in the fiber background with different inks (MS spectra were exhibited in the Figure S2). Furthermore, in the positive ion mode of DESI imaging experiment, we detected the molecular ion peak at m/z 329 of the brighter visible line, which confirmed that the dark draft line resulted from the Cr–oxo complex with the fiber as ligand.
In the negative ion mode, the spectra for this region were very different from other areas from the sample and a few peaks from the m/z 600–1000 range appeared in the red dye part. The unique strong isotope peaks (m/z 644, 646, 648) could correspond well to the red flower petals for EY. The molecular ion peaks for cloth fabric (m/z 146) and residual paper cellulose (m/z 291, 351) also had some characteristic molecular patterns, respectively.

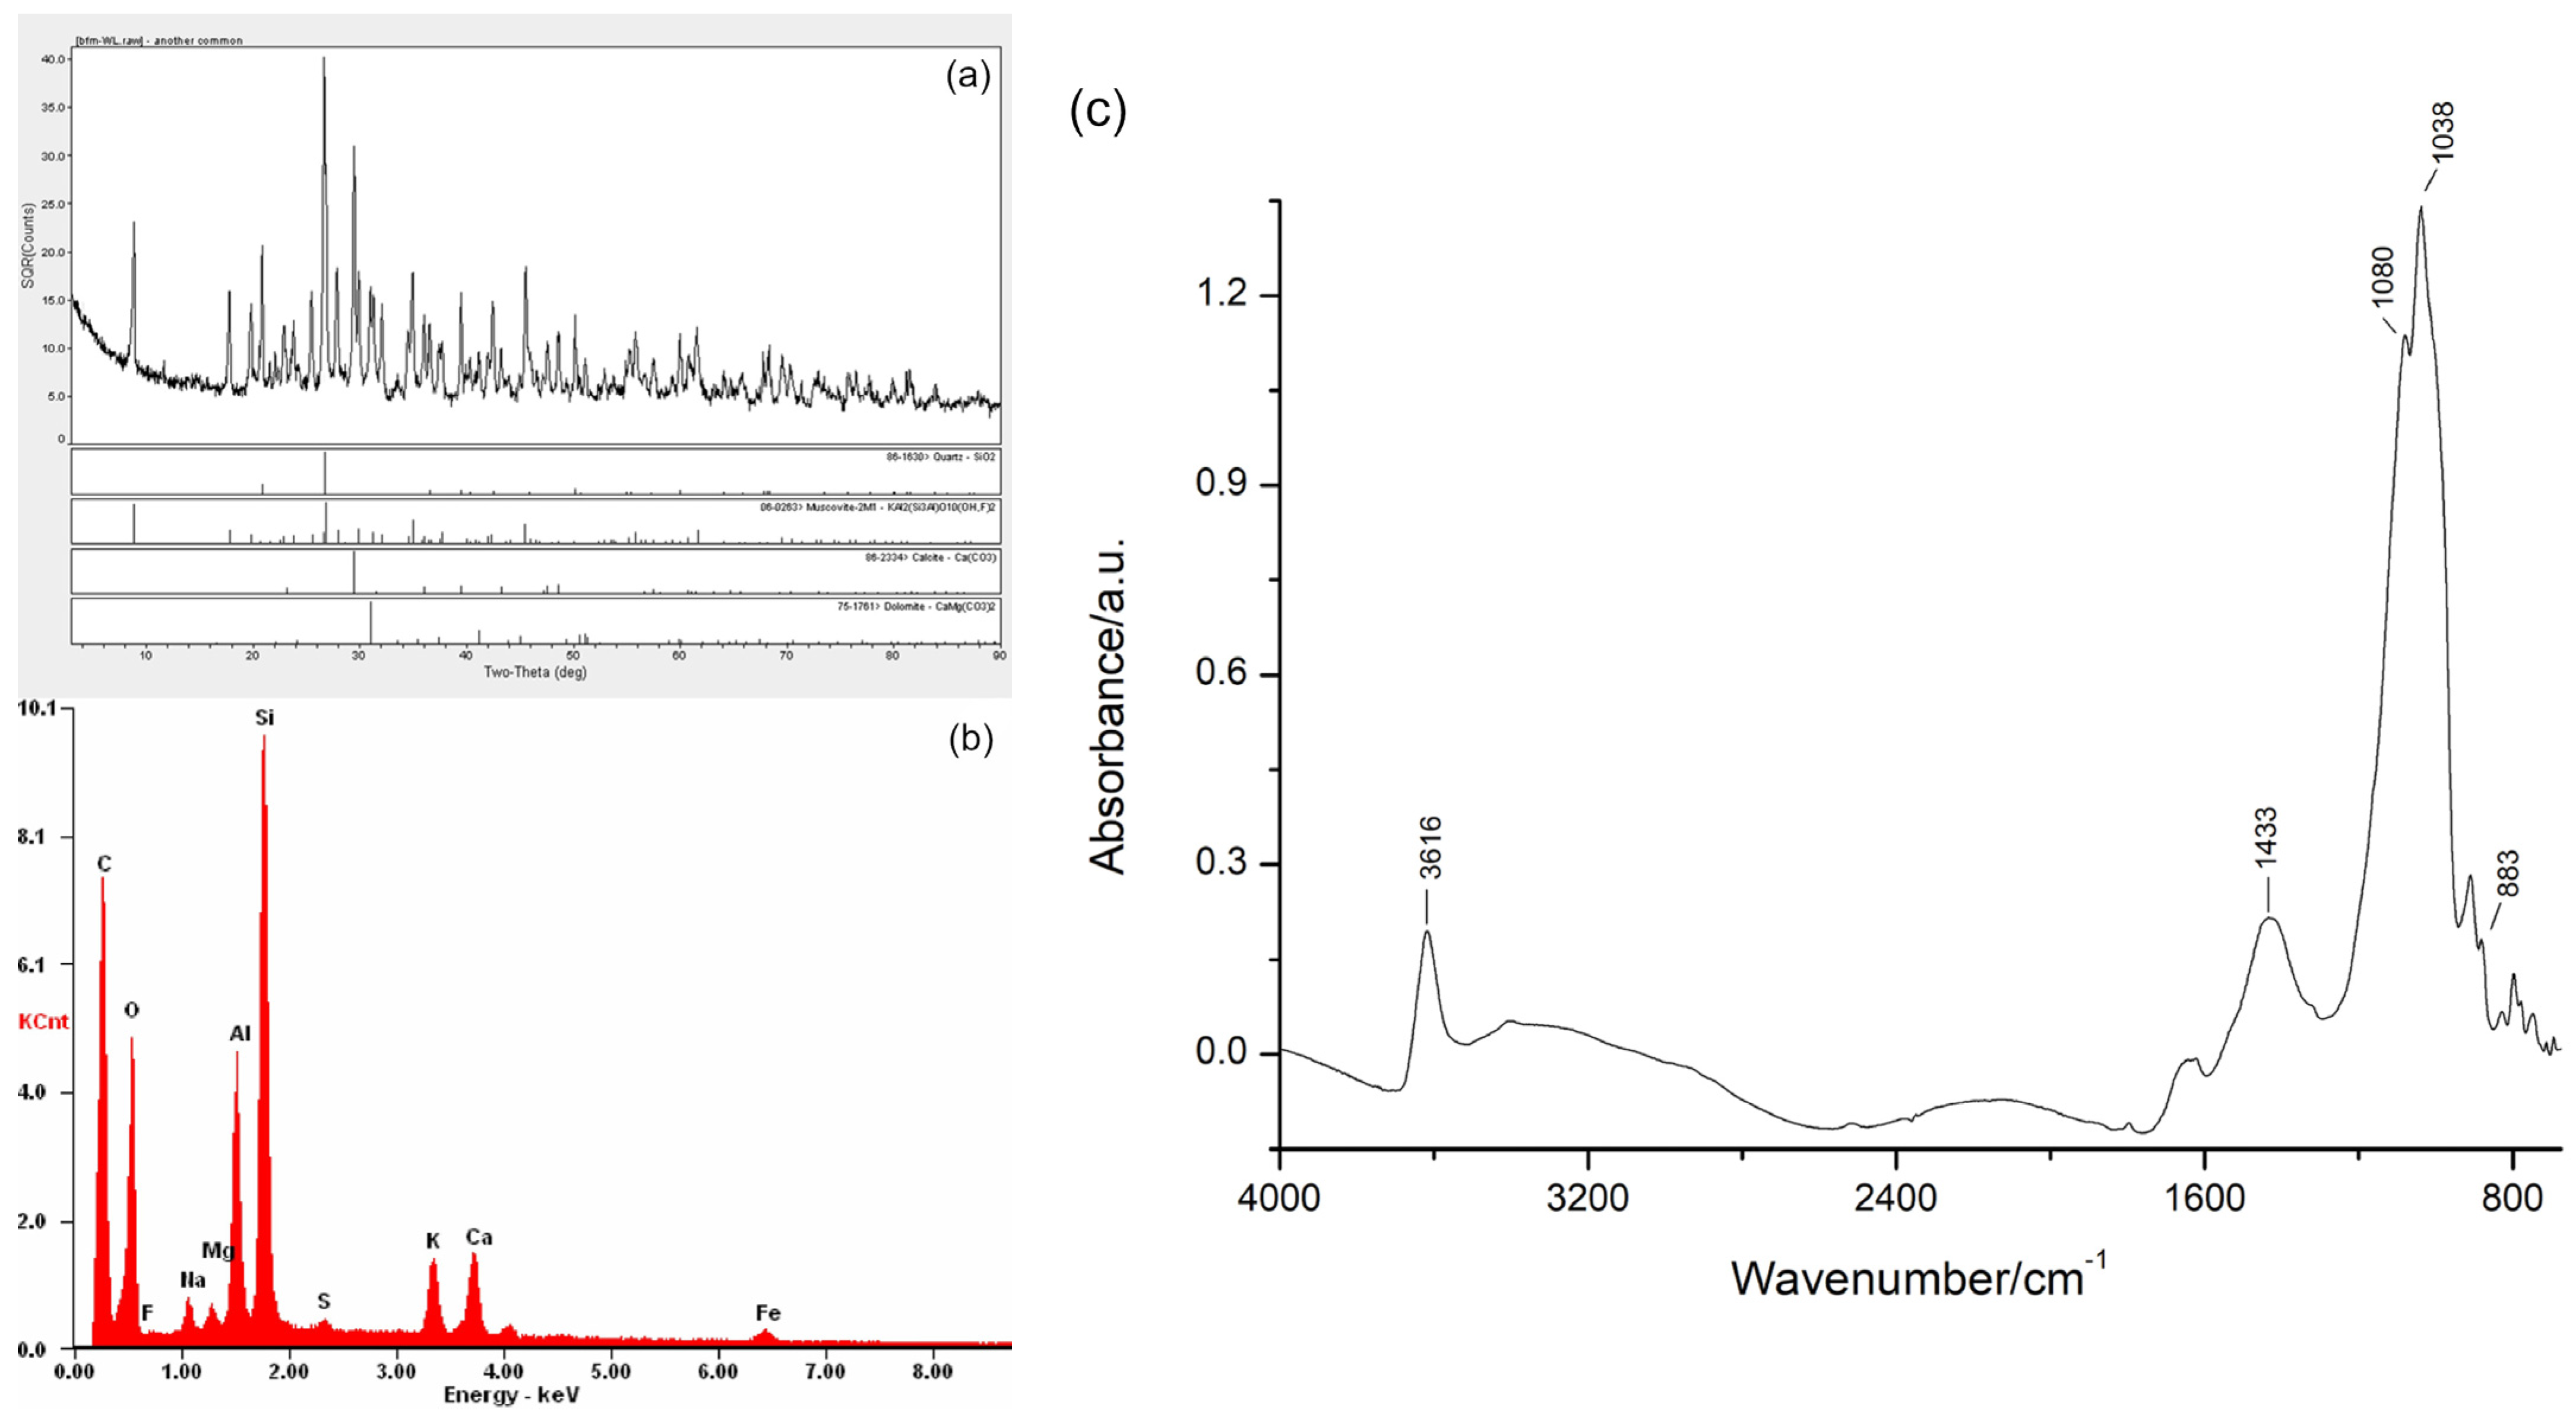
3.4. Coating Composition Analysis from the Outermost Layer

The surface white pigments were observed under 32× magnification (Figure S3) and analyzed by XRD, micro-FTIR and SEM-EDS as displayed in Figure 11. The results of XRD and micro-FTIR analysis depicted that the main components were: quartz (SiO2) with Si-O asymmetrical stretching vibration at 1080 cm−1, 1038 cm−1; muscovite mica (KAl2(Si3Al)O10(OH, F)2 with IR stretching vibration band at 3616 cm−1; and calcite (CaCO3) with characteristic IR absorbance bands at 1433 cm−1, 883 cm−1. A trace of Fe was detected according to the result of SEM-EDS. Generally, chalk could contain iron and often coexist with dolomite (CaMg(CO3)2) in nature, which was mainly confirmed by XRD in our work; therefore, the outermost white coating was composed of chalk and talc. The paper fiber of layer No. 10 and pigments of No. 11 made up a typical type of white coating paper.

4. Conclusions

In summary, with the aid of modern analytical techniques, information about the component, age, manufacture process, etc., of the Meiwu ceiling in the Hall of Mental Cultivation was fully analyzed.
In the aspect of microscopic observation with the main characterizations of OM and SEM, there were a total of 11 layers throughout the whole multi-layer stacking structure including bast paper, cotton wiring, xuan paper, cotton printed fabric, two yellow board papers, bamboo paper, three wood pulp papers, and surface coating, respectively. The woven structure in the fabric layer showed the plain cotton jacquard weaving process. The outermost visible layer was the white coating paper which consisted of chalk and talc according to XRD, micro-FTIR, and SEM-EDS analysis.
Starch was considered as the main organic adhesive and materials including paper and cotton fibers produced certain deterioration while some industrial dyes accompanied by side-products based on FTIR mapping and LC-MS, respectively. In the case of printed fabric analysis, seven industrial dyes were identified totally. The green background ink was dyed aligning with auramine O and malachite green. Methylene blue, methyl violet, rhoduline blue, and crystal violet were used for ink combination in different patterns of blue and cyan. The red pattern was most likely manually embellished with eosin Y along with the microscopic features. MA-XRF mapping showed that the chromium-based pigment containing trace of manganese was used as the dark draft line while titanium white pigments increased the opacity, smoothness, and whiteness for the paper coatings of layers No. 5 and 6. DESI-MSI was applied to the dye pattern images of the printed fabric and enabled localization of chemical information to distinguish among different sample textures. Positive ion mode contained peaks from several regions including the cyan flower petal pattern (m/z 363 for rhoduline blue), the green background ink (m/z 268 and 329 for auramine O and malachite green, respectively), and the dark draft line (m/z 329 for organometallic complex containing chromium). In the negative ion mode, there were a few distinct peaks for the red plum blossom petal pattern (m/z 644, 646, 648 for eosin Y). The cloth fabric (m/z 146) and paper residues (m/z 291, 351) also exhibited good specific imaging. These analyses of multi-layer coatings in this diagnostic setup could be received as a historic reference to the industrial fields related to dyes (pigments).
Accordingly, there should be at least four construction records for the Meiwu ceiling in history. Firstly, the initial construction period during Qianlong’s reign in the Qing dynasty; secondly, during the reign of Emperor Guangxu based on the discovery of a printed fabric layer which should be at least after 22nd year (approx. 1896) of his reign on the basis of synthesis time of identified industrial dyes; thirdly, a bamboo paper layer was applied for mounting and pasting according to the more serious ageing of paper in the layer No. 7 compared with those of three layers outside; finally, based on the main finding of wood pulp white paper pasting as well as reported archival research, the last two time intervals should be the republican period and the initial post-liberation period, respectively. The ceiling has been in disrepair for a long time, with loose layers, and is currently in need of conservation. According to the minimum intervention principle, the conservators need to keep the original display as much as possible. At the same time, control the temperature and humidity changes and reduce light to diminish the ageing process of organic heritage.

Supplementary Materials

The following supporting information can be downloaded at: https://www.mdpi.com/article/10.3390/coatings12050636/s1, Figure S1: Fiber cross-sections obtained from the layer No. 2 (a) (20×) and No. 4 (b) (20×) respectively, presenting stained lumen and periphery of cotton fibers, Figure S2: MS spectra of cotton fiber with the molecular ion peak at m/z 279 (a) and 259 (b) in positive and negative ion mode respectively, Figure S3: Microscopic observation of the surface white pigments (32×), Table S1: The colorimetric characterization of printed fabric.

Author Contributions

L.W.: Conceptualization, Methodology, Writing—original draft; Y.M.: Conceptualization, Resources; Z.G.: Funding acquisition, Methodology; J.D.: Formal analysis, Investigation; G.J.: Funding acquisition, Writing—review and editing; A.G.: Resources, Validation; Y.L.: Project administration, Supervision. All authors have read and agreed to the published version of the manuscript.

Funding

This research was funded by the National Key R&D Program of China (grant number 2019YFC1520300) and National Natural Science Foundation of China (grant number 22074141).

Institutional Review Board Statement

Not applicable.

Informed Consent Statement

Not applicable.

Data Availability Statement

Data sharing is not applicable to this article.

Acknowledgments

The completion of this article is inseparable from the warm-hearted assistance of our colleagues. We are grateful to Yunli Wang for her valuable advice on fiber identifications. Additionally, we would like to acknowledge Baoqiang Kang, Yuan Li, and Peiquan Duan for XRD, SEM-EDS, and MA-XRF technical support, respectively.

Conflicts of Interest

The authors declare no conflict of interest.

References

  1. Bicchieri, M.; Biocca, P.; Colaizzi, P.; Pinzari, F. Microscopic observations of paper and parchment: The archaeology of small objects. Herit. Sci. 2019, 7, 47. [Google Scholar] [CrossRef] [Green Version]
  2. Sandu, I.C.A.; Schäfer, S.; Magrini, D.; Bracci, S.; Roque, C.A. Cross-section and staining-based techniques for investigating organic materials in painted and polychrome works of art: A review. Microsc. Microanal. 2012, 18, 860–875. [Google Scholar] [CrossRef] [PubMed]
  3. Zamboni, C.B.; Redígolo, M.M.; Miura, V.T.; Costa, I.; Nagai, M.L.E.; Salvador, P.A.V.; Giovanni Nogueira da Silva, D. Non-destructive analysis in the study of historical photographs by pXRF and ATR-FTIR spectroscopies. J. Forensic Sci. 2021, 66, 1048–1055. [Google Scholar] [CrossRef] [PubMed]
  4. Tamburini, D.; Breitung, E.; Mori, C.; Kotajima, T.; Clarke, M.L.; McCarthy, B. Exploring the transition from natural to synthetic dyes in the production of 19th-century Central Asian ikat textiles. Herit. Sci. 2020, 8, 114. [Google Scholar] [CrossRef]
  5. Rosi, F.; Cartechini, L.; Sali, D.; Miliani, C. Recent trends in the application of Fourier Transform Infrared (FT-IR) spectroscopy in Heritage Science: From micro- to non-invasive FT-IR. Phys. Sci. Rev. 2019, 4, 20180006. [Google Scholar] [CrossRef]
  6. Gabrieli, F.; Rosi, F.; Vichi, A.; Cartechini, L.; Pensabene Buemi, L.; Kazarian, S.G.; Miliani, C. Revealing the nature and distribution of metal carboxylates in Jackson pollock’s Alchemy (1947) by micro-attenuated total reflection FT-IR spectroscopic imaging. Anal. Chem. 2017, 89, 1283–1289. [Google Scholar] [CrossRef]
  7. Badillo Sanchez, D.; Chelazzi, D.; Giorgi, R.; Cincinelli, A.; Baglioni, P. Characterization of the secondary structure of degummed Bombyx mori silk in modern and historical samples. Polym. Degrad. Stab. 2018, 157, 53–62. [Google Scholar] [CrossRef]
  8. Marchetti, A.; Beltran, V.; Nuyts, G.; Borondics, F.; De Meyer, S.; Van Bos, M.; Jaroszewicz, J.; Otten, E.; Debulpaep, M.; De Wael, K. Novel optical photothermal infrared (O-PTIR) spectroscopy for the noninvasive characterization of heritage glass-metal objects. Sci. Adv. 2022, 8, eabl6769. [Google Scholar] [CrossRef]
  9. de Winter, N.J.; Sinnesael, M.; Makarona, C.; Vansteenberge, S.; Claeys, P. Trace element analyses of carbonates using portable and micro-X-ray fluorescence: Performance and optimization of measurement parameters and strategies. J. Anal. At. Spectrom. 2017, 32, 1211–1223. [Google Scholar] [CrossRef]
  10. Vanhoof, C.; Bacon, J.R.; Fittschen, U.E.A.; Vincze, L. Atomic spectrometry update–A review of advances in X-ray fluorescence spectrometry and its special applications. J. Anal. At. Spectrom. 2021, 36, 1797–1812. [Google Scholar] [CrossRef]
  11. Watts, K.E.; Lagalante, A.F. Method development for binding media analysis in painting cross-sections by desorption electrospray ionization mass spectrometry. Rapid Commun. Mass Spectrom. 2018, 32, 1324–1330. [Google Scholar] [CrossRef] [PubMed]
  12. Takáts, Z.; Wiseman, J.M.; Gologan, B.; Cooks, R.G. Mass spectrometry sampling under ambient conditions with desorption electrospray ionization. Science 2004, 306, 471–473. [Google Scholar] [CrossRef] [PubMed] [Green Version]
  13. Aucouturier, M.; Darque-Ceretti, E. The surface of cultural heritage artefacts: Physicochemical investigations for their knowledge and their conservation. Chem. Soc. Rev. 2007, 36, 1605–1621. [Google Scholar] [CrossRef] [PubMed]
  14. Gutierrez, S.M.V.; He, Y.; Cao, Y.; Stone, D.; Walsh, Z.; Malhotra, R.; Chen, H.-L.; Chang, C.-H.; Robinson, S.C. Feasibility and surface evaluation of the pigment from Scytalidium cuboideum for inkjet printing on textiles. Coatings 2019, 9, 266. [Google Scholar] [CrossRef] [Green Version]
  15. Sabatini, F.; Eis, E.; Degano, I.; Thoury, M.; Bonaduce, I.; Lluveras-Tenorio, A. The issue of eosin fading: A combined spectroscopic and mass spectrometric approach applied to historical lakes. Dyes Pigments 2020, 180, 108436. [Google Scholar] [CrossRef]
  16. Ma, Y.; Lei, Y.; Wang, S. Composition and manufacturing techniques of wallpaper in the Bower of Purest Jade (Yu cuixuan), The Forbidden City, Beijing, China. Stud. Conserv. 2014, 59, S107–S110. [Google Scholar] [CrossRef]
  17. Shi, J.; Li, T. Technical investigation of 15th and 19th century Chinese paper currencies: Fiber use and pigment identification. J. Raman Spectrosc. 2013, 44, 892–898. [Google Scholar] [CrossRef]
  18. Wouters, J.; Grzywacz, C.M.; Claro, A. A comparative investigation of hydrolysis methods to analyze natural organic dyes by HPLC-PDA-nine methods, twelve biological sources, ten dye classes, dyed yarns, pigments and paints. Stud. Conserv. 2011, 56, 231–249. [Google Scholar] [CrossRef]
  19. Iannaccone, R.; Antona, A.; Magri, D.; Canu, A.; Marceddu, S.; Brunetti, A. First characterization of a Bronze Age textile fibre from Sardinia (Italy). Spectrochim. Acta A 2022, 265, 120398. [Google Scholar] [CrossRef]
  20. Ji, L. Practicing benevolent governance based on perfect self-cultivation. Archit. J. 2018, 601, 42–46. [Google Scholar]
  21. Kizil, R.; Irudayaraj, J.; Seetharaman, K. Characterization of irradiated starches by using FT-Raman and FTIR spectroscopy. J. Agric. Food Chem. 2002, 50, 3912–3918. [Google Scholar] [CrossRef] [PubMed]
  22. Wang, J. Papermaking Raw Materials of China: An Atlas of Micrographs and the Characteristics of Fibers; China Light Industry Press: Beijing, China, 1999. [Google Scholar]
  23. Ma, Y.; Ji, L. Study of Biaohu paper in Yan Xi Tang of Yang Xin Dian of the Palace Museum. Sci. Conserv. Archaeol. 2021, 33, 61–68. [Google Scholar]
  24. Thibodeaux, D.P.; Rajasekaran, K. Development of new reference standards for cotton fiber maturity. J. Cotton Sci. 1999, 3, 188–193. [Google Scholar]
  25. Ding, Y.; Ji, L. Ceiling wooden pane study of indoor papering in Yangxin Hall area. Tradit. Chin. Archit. Gard. 2017, 135, 81–85. [Google Scholar]
  26. Broadbent, A.D. Basic Principles of Textile Coloration, 2nd ed.; Society of Dyers and Colourists: Yorkshire, UK, 2001. [Google Scholar]
  27. Newman, R. Chromium oxide greens. In Artists’ Pigments: A Handbook of Their History and Characteristics; FitzHugh, E.W., Ed.; Oxford University Press: New York, NY, USA, 1997; Volume 3. [Google Scholar]
  28. Laver, M. Titanium dioxide whites. In Artists’ Pigments: A Handbook of Their History and Characteristics; FitzHugh, E.W., Ed.; Oxford University Press: New York, NY, USA, 1997; Volume 3. [Google Scholar]
  29. van Bommel, M.R.; Berghe, I.V.; Wallert, A.M.; Boitelle, R.; Wouters, J. High-performance liquid chromatography and non-destructive three-dimensional fluorescence analysis of early synthetic dyes. J. Chromatogr. A 2007, 1157, 260–272. [Google Scholar] [CrossRef]
  30. Bradford, F. Colour Index, 1st ed.; Society of Dyers and Colourists: Yorkshire, UK, 1971. [Google Scholar]
  31. Tamburini, D.; Shimada, C.M.; McCarthy, B. The molecular characterization of early synthetic dyes in E. Knecht et al’s textile sample book “A Manual of Dyeing” (1893) by high performance liquid chromatography-Diode array detector-Mass spectrometry (HPLC-DAD-MS). Dyes Pigments 2021, 190, 109286. [Google Scholar] [CrossRef]
  32. López-Montes, A.M.; Dupont, A.-L.; Desmazières, B.; Lavédrine, B. Identification of synthetic dyes in early colour photographs using capillary electrophoresis and electrospray ionisation-mass spectrometry. Talanta 2013, 114, 217–226. [Google Scholar] [CrossRef] [Green Version]
  33. Hu, Z.; Qi, P.; Wang, N.; Zhu, Q.; Lin, Z.; Chen, Y.; Mao, X.; Jiang, J.; Li, C. Simultaneous determination of multiclass illegal dyes with different acidic-basic properties in foodstuffs by LC-MS/MS via polarity switching mode. Food Chem. 2020, 309, 125745. [Google Scholar] [CrossRef]
  34. de Melo, J.S.S. The molecules of colour. Photochemistry 2018, 45, 68–100. [Google Scholar]
  35. Sabatini, F.; Degano, I.; Colombini, M.P. Development of a method based on high-performance liquid chromatography coupled with diode array, fluorescence, and mass spectrometric detectors for the analysis of eosin at trace levels. Sep. Sci. Plus 2020, 3, 207–215. [Google Scholar] [CrossRef]
Figure 1. The original condition (ac) and sampling photos (de): outermost and innermost of overall structure; (f): printed fabric surface, of the Meiwu ceiling in the Hall of Mental Cultivation.
Coatings 12 00636 g001
Figure 2. Microscopic observation of cross-section for the ceiling complexes containing all layers: (a) optical image (32×), (b) SEM micrograph (100×), and (c) stain image (50×).
Coatings 12 00636 g002
Figure 3. FTIR mapping for the cross-section of the whole structure: (a) cross-section photomicrograph (50×); (b) representative examples of extracted spectra corresponding to the layer locations; (c) chemical images of top half-part (layers No. 3–11); (d) chemical images of bottom half-part (layers No. 1–4). Red and green represent relatively higher and lower intensity, respectively.
Coatings 12 00636 g003
Figure 4. The fiber morphological observations of each layer: (a) No. 1, (b) No. 2, (c) No. 3, (d) No. 4, (e) No. 5, (f) No. 6, (g) No. 7, (h) No. 8, (i) No. 9, and (j) No. 10.
Coatings 12 00636 g004
Figure 5. Microscopic observation of woven structure: (ac) ink distributions on the surface fiber and (d) transparent adhesive and paper residues on the backing.
Coatings 12 00636 g005
Figure 6. MA-XRF mapping for element-specific distributions containing Mg, Al, Si, P, S, K, Ca, Ti, Cr, Mn, and Ba, respectively, corresponding to the top-left visible photograph of the selected area in the printed fabric pattern (element was listed in the top-left corner of each picture). Green and dark blue represent relatively higher and lower intensity, respectively.
Coatings 12 00636 g006
Figure 7. LC-MS chromatographic profiles obtained from the green sample extraction (a) and the mixture standards (b); Product-ion mass spectra of (c) AO, (d) MDAO, (e) MG, and (f) BDMG in positive ion mode.
Coatings 12 00636 g007
Figure 8. LC-MS chromatographic profiles obtained from the blue (a) and cyan (b) sample extractions and the mixture standards (c); Product-ion mass spectra of (d) MB, (e) RB, (f) MV, and (g) CV in positive ion mode.
Coatings 12 00636 g008
Figure 9. LC-MS chromatographic profiles of the red ink extraction (a) and the standard EY (b); Product-ion mass spectra of (c) EY and (d) DBEo in negative ion mode.
Coatings 12 00636 g009
Figure 10. Surface-specific composition imaging of the printed fabric layer with DESI-MSI: (a) selected area containing characteristic molecular ions, (b) m/z 146.9638 (−), (c) m/z 291.0132 and 351.1823 (−), (d) m/z 268.1768 (+), (e) m/z 329.2017 (+), (f) m/z 363.1808 (+), and (g) m/z 644.7028, 646.6999 and 648.7001 (−).
Coatings 12 00636 g010
Figure 11. The outermost coating characterization: (a) XRD; (b) SEM-EDS; (c) micro-FTIR.
Coatings 12 00636 g011
Table 1. Identifications for the industrial synthetic dyes corresponding to each specific ink by LC-MS.
Ink ColorIndustrial DyesSynonymColor Index (C.I.)Abbrev.FormulaAdductsObserved Pseudo-Molecular Ion (m/z)Mass Error (ppm)RT/minFragment Ion (m/z)Earliest Synthetic Time [30]
GreenAuramine OBasic Yellow 241,000AOC17H22ClN3M-Cl268 (+)0.75.48252/147/1311883
Mono-demethylated AO----MDAOC16H20ClN3M-Cl254 (+)0.54.99238/147/133--
Malachite GreenBasic Green 442,000MGC23H25ClN2M-Cl329 (+)−0.36.63313/285/1921877
Bis-demethylated MG----BDMGC21H21ClN2M-Cl3012.55.93285/256/180--
BlueMethylene BlueBasic Blue 952,015MBC16H18ClN3SM-Cl284 (+)−0.84.90268/241/2671876
Methyl VioletBasic Violet 142,535MVC24H28ClN3M-Cl358 (+)0.17.17342/326/2211861
CyanRhoduline BlueBasic Blue 142,025RBC23H24Cl2N2M-Cl363 (+)−0.16.71299/283/2671896
Crystal VioletBasic Violet 342,555CVC25H30ClN3M-Cl372 (+)0.17.72356/3401883
RedEosin YAcid Red 8745,380EYC20H8Br4O5M-H646 (−)0.17.18520/4421872
Mono-debrominated EY----DBEoC20H9Br3O5M-H566 (−)−1.06.74442/362--
Publisher’s Note: MDPI stays neutral with regard to jurisdictional claims in published maps and institutional affiliations.

