1. Introduction
In technical practice, fibre friction occurs, for example, in belt transmissions with V-belts and flat belts, cable transmissions (elevators, cable cars, ski lifts), conveyor belts, belt brakes, winches, etc. Fibre (also called belt) friction is the resistance that is imposed on a fibre (cable, conveyor belt, belt) as it slides over a curved surface. It is the friction of flexible fibres (ropes, straps and belts) on stationary and rotating cylindrical surfaces (rollers, pulleys, drums, discs).
In lifting devices, to improve the transmission capability and increase the traction capacity, the pulley’s circumference has specially shaped grooves (V-shaped, semi-circular or semi-circular with a notch). The magnitude of the coefficient of shear friction in a pulley groove fi [-] depends on the type of the groove and on the coefficient of shear friction μ [-] on the contact surfaces of the cable with the friction disc.
The measured values for the friction coefficient of the lining of a semi-circular groove in the friction disc of a mining machine with a friction disc (mine hoisting KOEPPE system) are given, for example, in [
1]. In [
1], Krešák et al. present the measured values of the friction coefficient of rubber friction lining samples, which were compared with the values of the friction coefficient of the friction lining (K25) usually mounted on the friction lining pulley.
Dynamic force transfer by friction and slip between a steel cable and a friction disc groove lining during underground mining is discussed by Wang et al. in [
2].
In the study [
3], the dynamic contact characteristics between the mining cable and the friction lining of the semi-circular pulley groove in a deep mine were analysed by Wang. The evolution of the slip states and stress distribution along the bottom of the friction lining groove during load lifting and the influence of the friction coefficient on this evolution were investigated by Wang in [
3] using the Finite Element Method.
In [
4], Stawowiak et al. deal with the problem of friction between the cable and friction liner of a mining hoist.
Ge [
5] investigated the frictional forces between a cable and the PVC groove lining and obtained friction coefficients related to the slip rate and pressure. It has been shown that the coefficient of friction decreases with increasing velocity or pressure.
Kumar at al. presents and discusses in a research article [
6] an experimental method to determine the coefficient of friction when using the technique of friction stir welding.
Newly found evidence on the negative slope of the friction–velocity curve is described by Kim et al. [
7] in terms of the contact area on the surface of brake friction materials. The tribotests were performed using two commercial friction materials with and without steel fibres.
Several studies have addressed the contact between the cable and the pulley [
8], and others are based on physical experiments [
9,
10,
11] rather than numerical simulations [
12,
13].
Hrabovsky [
14] describes the design and implementation of a device on which it is possible to determine in the laboratory the friction coefficient value of a cable in given types of traction disc grooves.
Takehara et al. in [
15] confirmed that the behaviour of a steel cable changes when both the modulus of elasticity of the steel cable in bending and the mass added to each end of the steel cable changes. Using numerical simulations, we confirm the proposed model of contact between the steel cable and the pulley.
The results obtained by Zhang in [
16] show that the friction coefficient first decreases and then increases as the tension force increases and decreases linearly with an increasing cable speed. The effect of the cable speed on the temperature of the steel cable is greater than the effect of the tension force.
The testing of the rheological properties of friction-enhancing lubricant and the monitoring of temperature and friction coefficient changes during the friction process between a friction lining and steel cable are addressed in [
17] by Feng et al.
The authors Ma and Lubrecht [
18] studied the contact pressure between a steel cable and a friction block. The results from the numerical contact model show that the local maximum contact pressure is approximately 45 times greater than the average pressure obtained from the “planar method” formula.
Special technical applications where pulleys are used to transfer the tractive force by friction to a steel cable and to set a cleaning robot or a railway carriage in motion are dealt with in [
19,
20].
The dependence of the coefficients of friction and wear on the temperature of the materials of a friction pair, i.e., brake lining, is presented by Nosko, A. L et al. in [
21].
Popper, D. and Weissenborn, H. [
22] proposed a testing device for which the friction coefficients can be determined with greater accuracy than those defined by Coulomb’s friction law and the Eytelwein equation [
14].
Chang et al., studied the wear and friction characteristics of the steel wire rope and the evolution of the tribological parameters at different friction stages [
23].
The results obtained by Yu-xing et al. [
24] show that the coefficient of friction in the steady-state period changes very little with an increase in the contact load and that it stabilises at about 0.61.
Huang at al., in their paper [
25], also discuss the development of the field of tribology, and highlight some of the main problems encountered in this area, such as the lack of systematicness, loose correlation, and inadequate focus on the microscopic perspective. In their article, they provide basic formulas of friction mechanics, taking into account friction’s effect on the formulas of classical mechanics.
The study by Liu et al. [
26] aims to find out the calculation formula for the friction resistance of steel wire’s flexible shaft in the bending push-pull state. The operation principle is based on the adhesive friction theory and Newton’s classical friction formula.
Guo et al. present in [
27] a new theory of “global dynamic wrap angle” for friction hoists. The theory is based on a mine hoist simulation model which combines the suspended rope with the wrapped rope.
To calculate the pulling forces in the sides of a cable belted over a pulley, the Euler (Eytelwein) equation for fibre friction applies. By modifying the Euler equation, the coefficient of shear friction in a pulley groove can be expressed according to Equation (1).
In expression (1), α [rad] use is made of the belting angle in the arc measure, Fn [N] is the cable tension in the cable on the advancing part of the cable on the friction disc, Fo [N] is the cable tension on the retreating side.
2. Coefficient of Friction in a Pulley Groove
The magnitude of the shear friction coefficient in a pulley groove f
i depends on the type of groove (semi-circular, semi-circular with notch or V-groove) and the shear friction coefficient μ [-] on the contact surfaces of the cable with the pulley. The shear friction coefficient μ decreases with increasing contact pressure between the cable and the pulley [
28] and is also affected by weather conditions.
According to ([
28] chap. M.2.2), which was terminated on 6/2010, the friction coefficient for a V-groove can be expressed according to Equation (2), and for a semi-circular groove or a semi-circular groove with a notch according to Equation (3).
where β [rad]-the angle of the undercut of the groove or semi-circular groove (β = 0 for semi-circular groove), γ [rad]-the angle of the V-groove, μ = 0.09-the coefficient of friction between the steel cable and the cast iron friction disc.
In [
29], Janovský states that the traction capacity increases with a decreasing angle of the V-groove γ, but at the same time, the contact pressure on the contact area between the cable and the groove wall increases. The angle γ must therefore not be less than 32 deg, and it is recommended to choose γ = 35 ÷ 40 deg. In ([
30] p. 23), it is stated that the β angle must not be greater than 105 deg, and a choice of up to 90 deg is recommended.
According to ([
29] chap. M.2.2), which was terminated on 8/2017, the friction coefficient for a semi-circular groove or a semi-circular groove with a notch can be determined according to Equation (4), for V-groove not hardened according to Equation (3) and for hardened V-groove according to Equation (2).
where β [deg]-the angle of the notch, γ [rad]-the angle of the V-groove (the value of γ suitable for the type of groove should be specified by the manufacturer. In no case should it be less than γ = 25 deg for a semi-circular groove. For a V-groove, it must not be less than γ = 35 deg), μ = 0.1-the coefficient of friction.
In Ref. ([
31] pp. 43–44) and Ref. [
32], it is stated that the maximum value of the notch angle β = 105 deg, should be chosen. The maximum size of the notch angle β
M = 106.3 deg (5) defines the width B [m] of the slot notch, which corresponds to 0.8 times the cable diameter d
L [m].
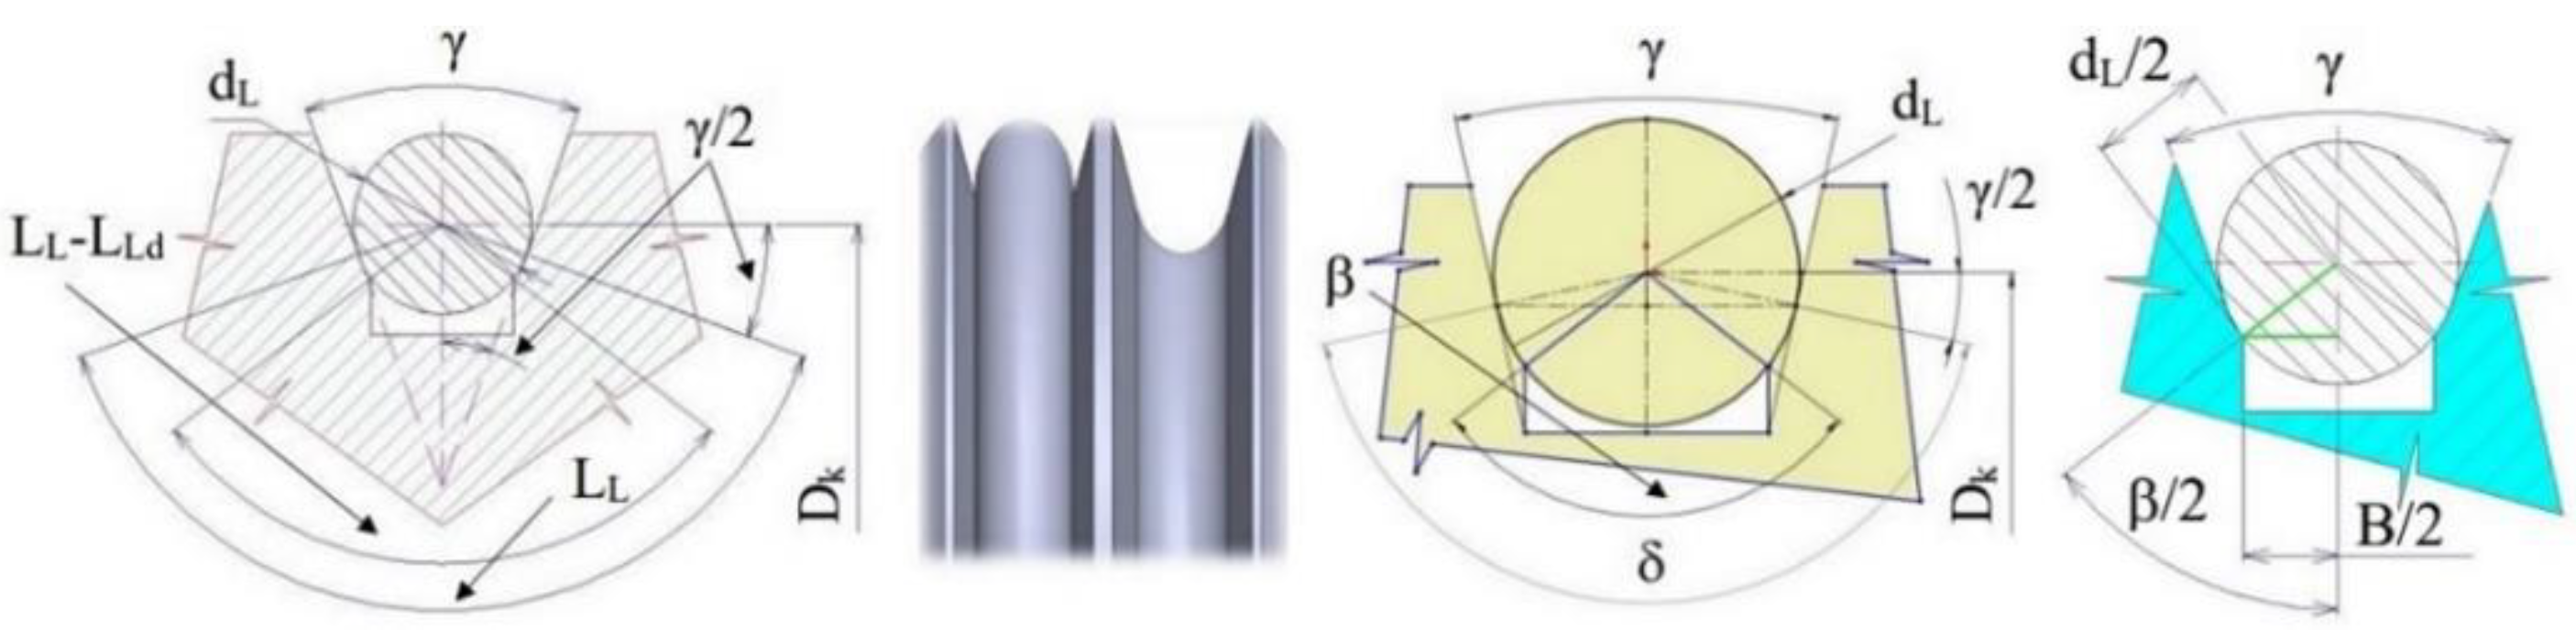
The length of contact of a cable with the surface of a semi-circular groove can be expressed by L
L = δ·d
L/2 [m], where δ = π − γ [rad] is the angle of contact of the cable with the groove (see
Figure 1). If the length of the contact between the cable and the surface of the semi-circular groove after the groove is formed is 20% of the length L
L [m], this length can be expressed as L
Ld = 0.2 · L
L [m]. The maximum size of the notch angle can be determined by the expression β
max = 2·(L
L − L
Ld)/d
L [deg].
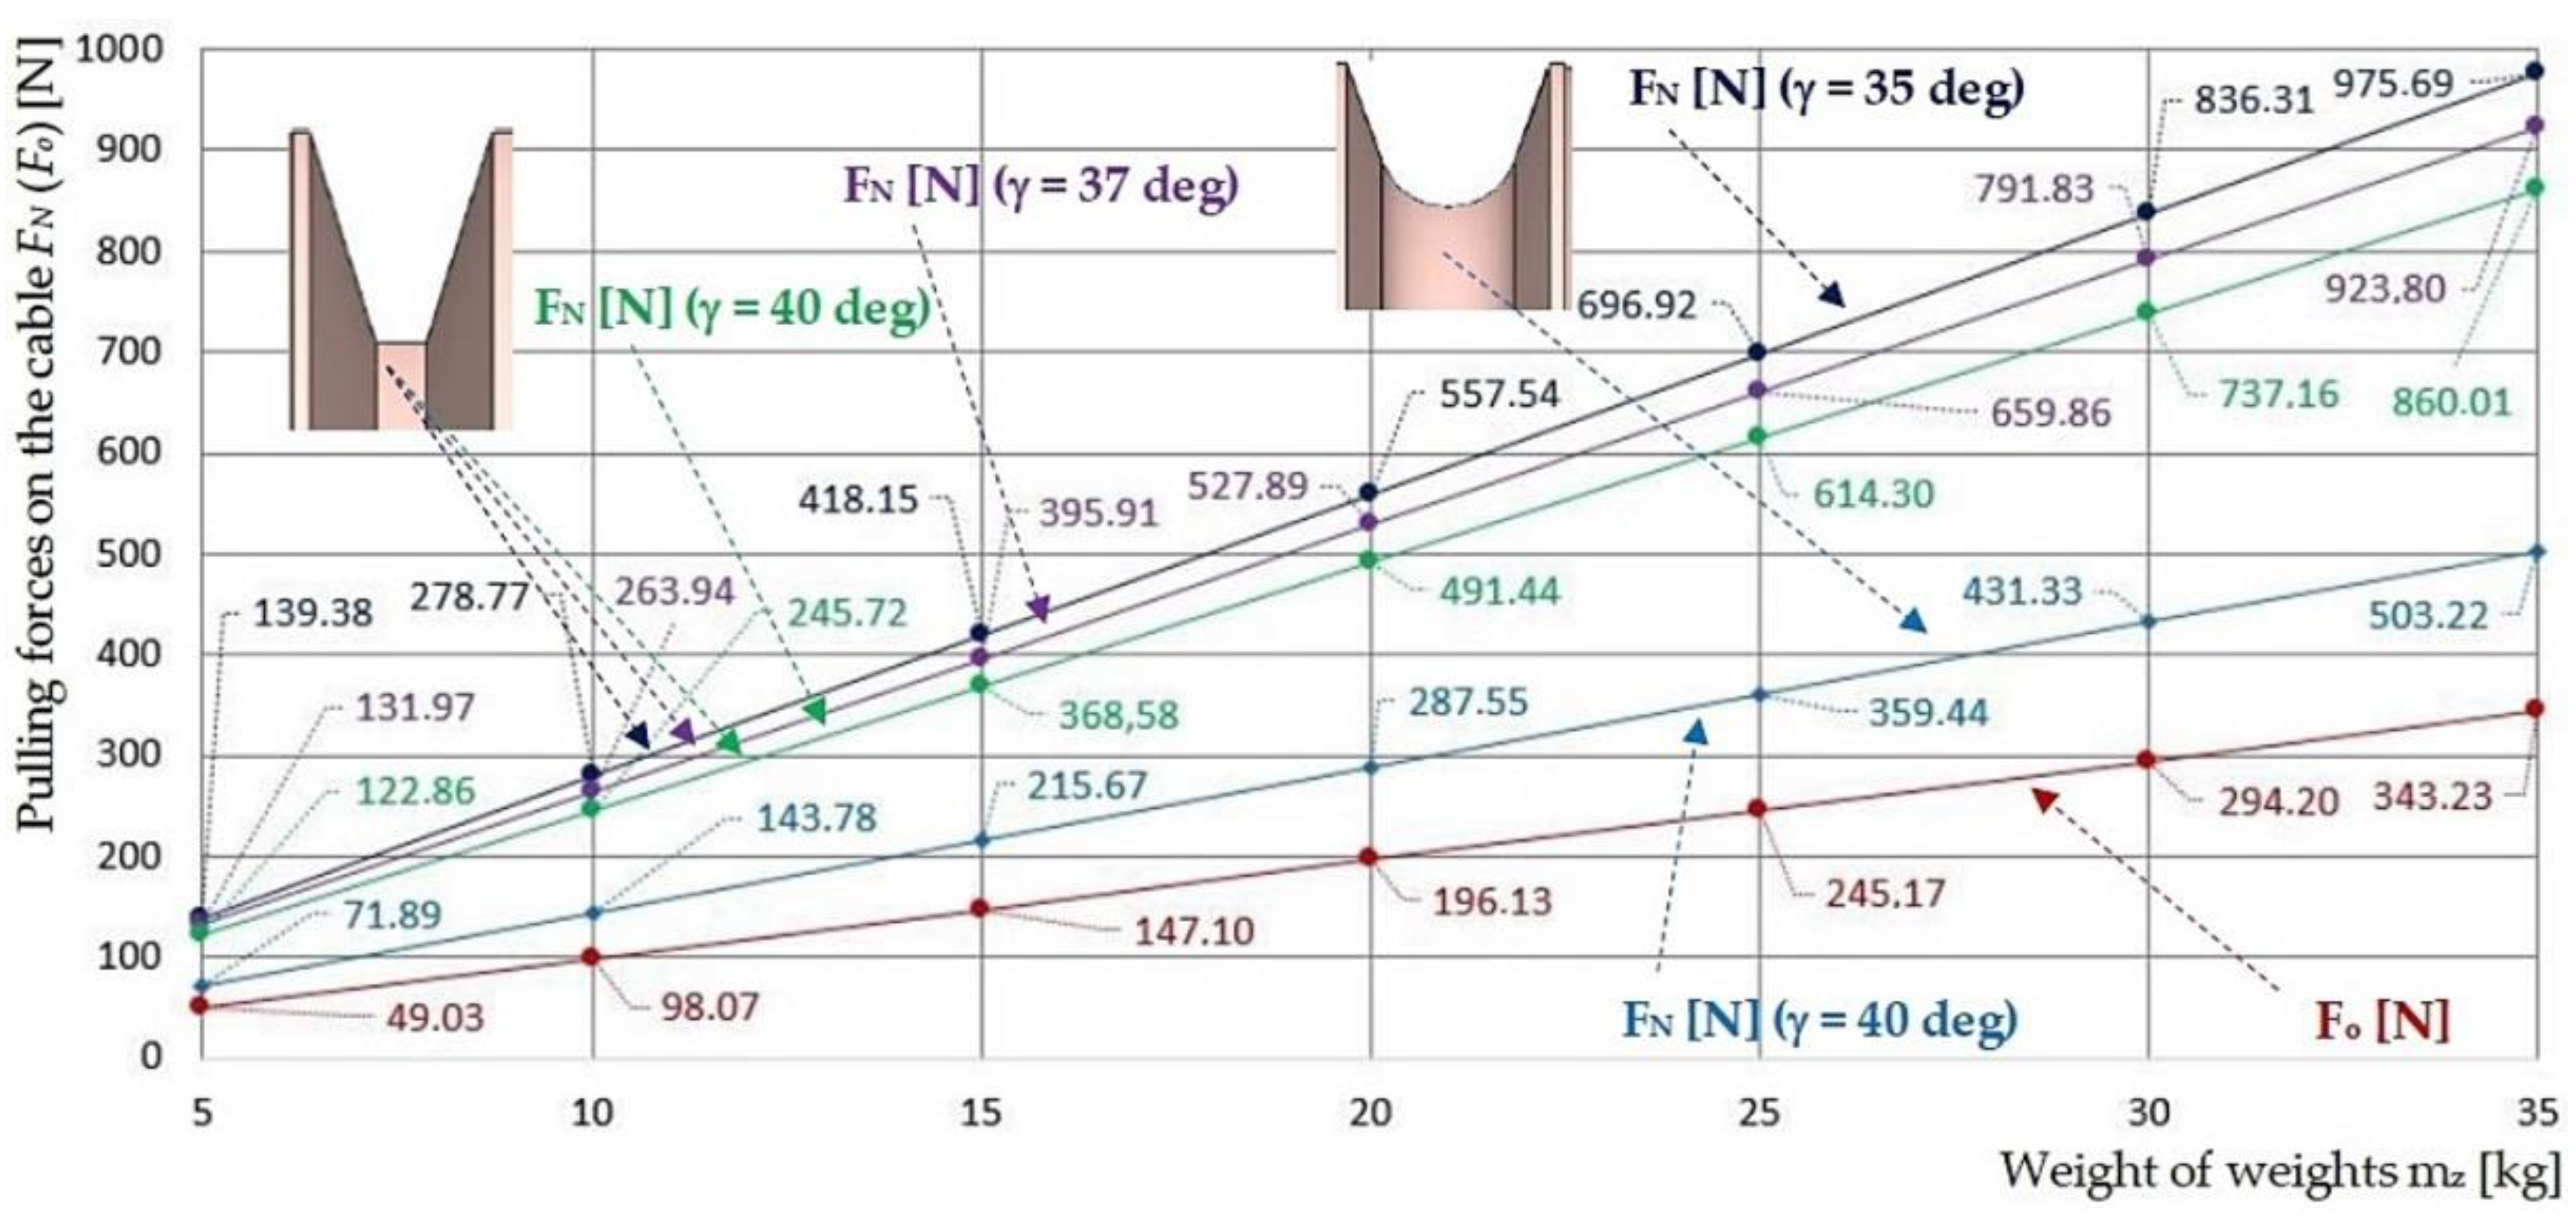
Table 1 shows the values of the friction coefficient in the semi-circular (according to Equation (4)) groove and V-groove (according to Equations (2) and (3)) of the pulley for the V-groove angle γ = 35 ÷ 40 deg (for β = 0 deg).
The calculated values of the advancing force F
n on the pulley induced by the magnitude of the retreating force F
o in the semi-circular groove according to Equation (4), and in the hardened V-groove according to Equation (2), for the V-groove angle γ = 40 deg are given in
Table 2.
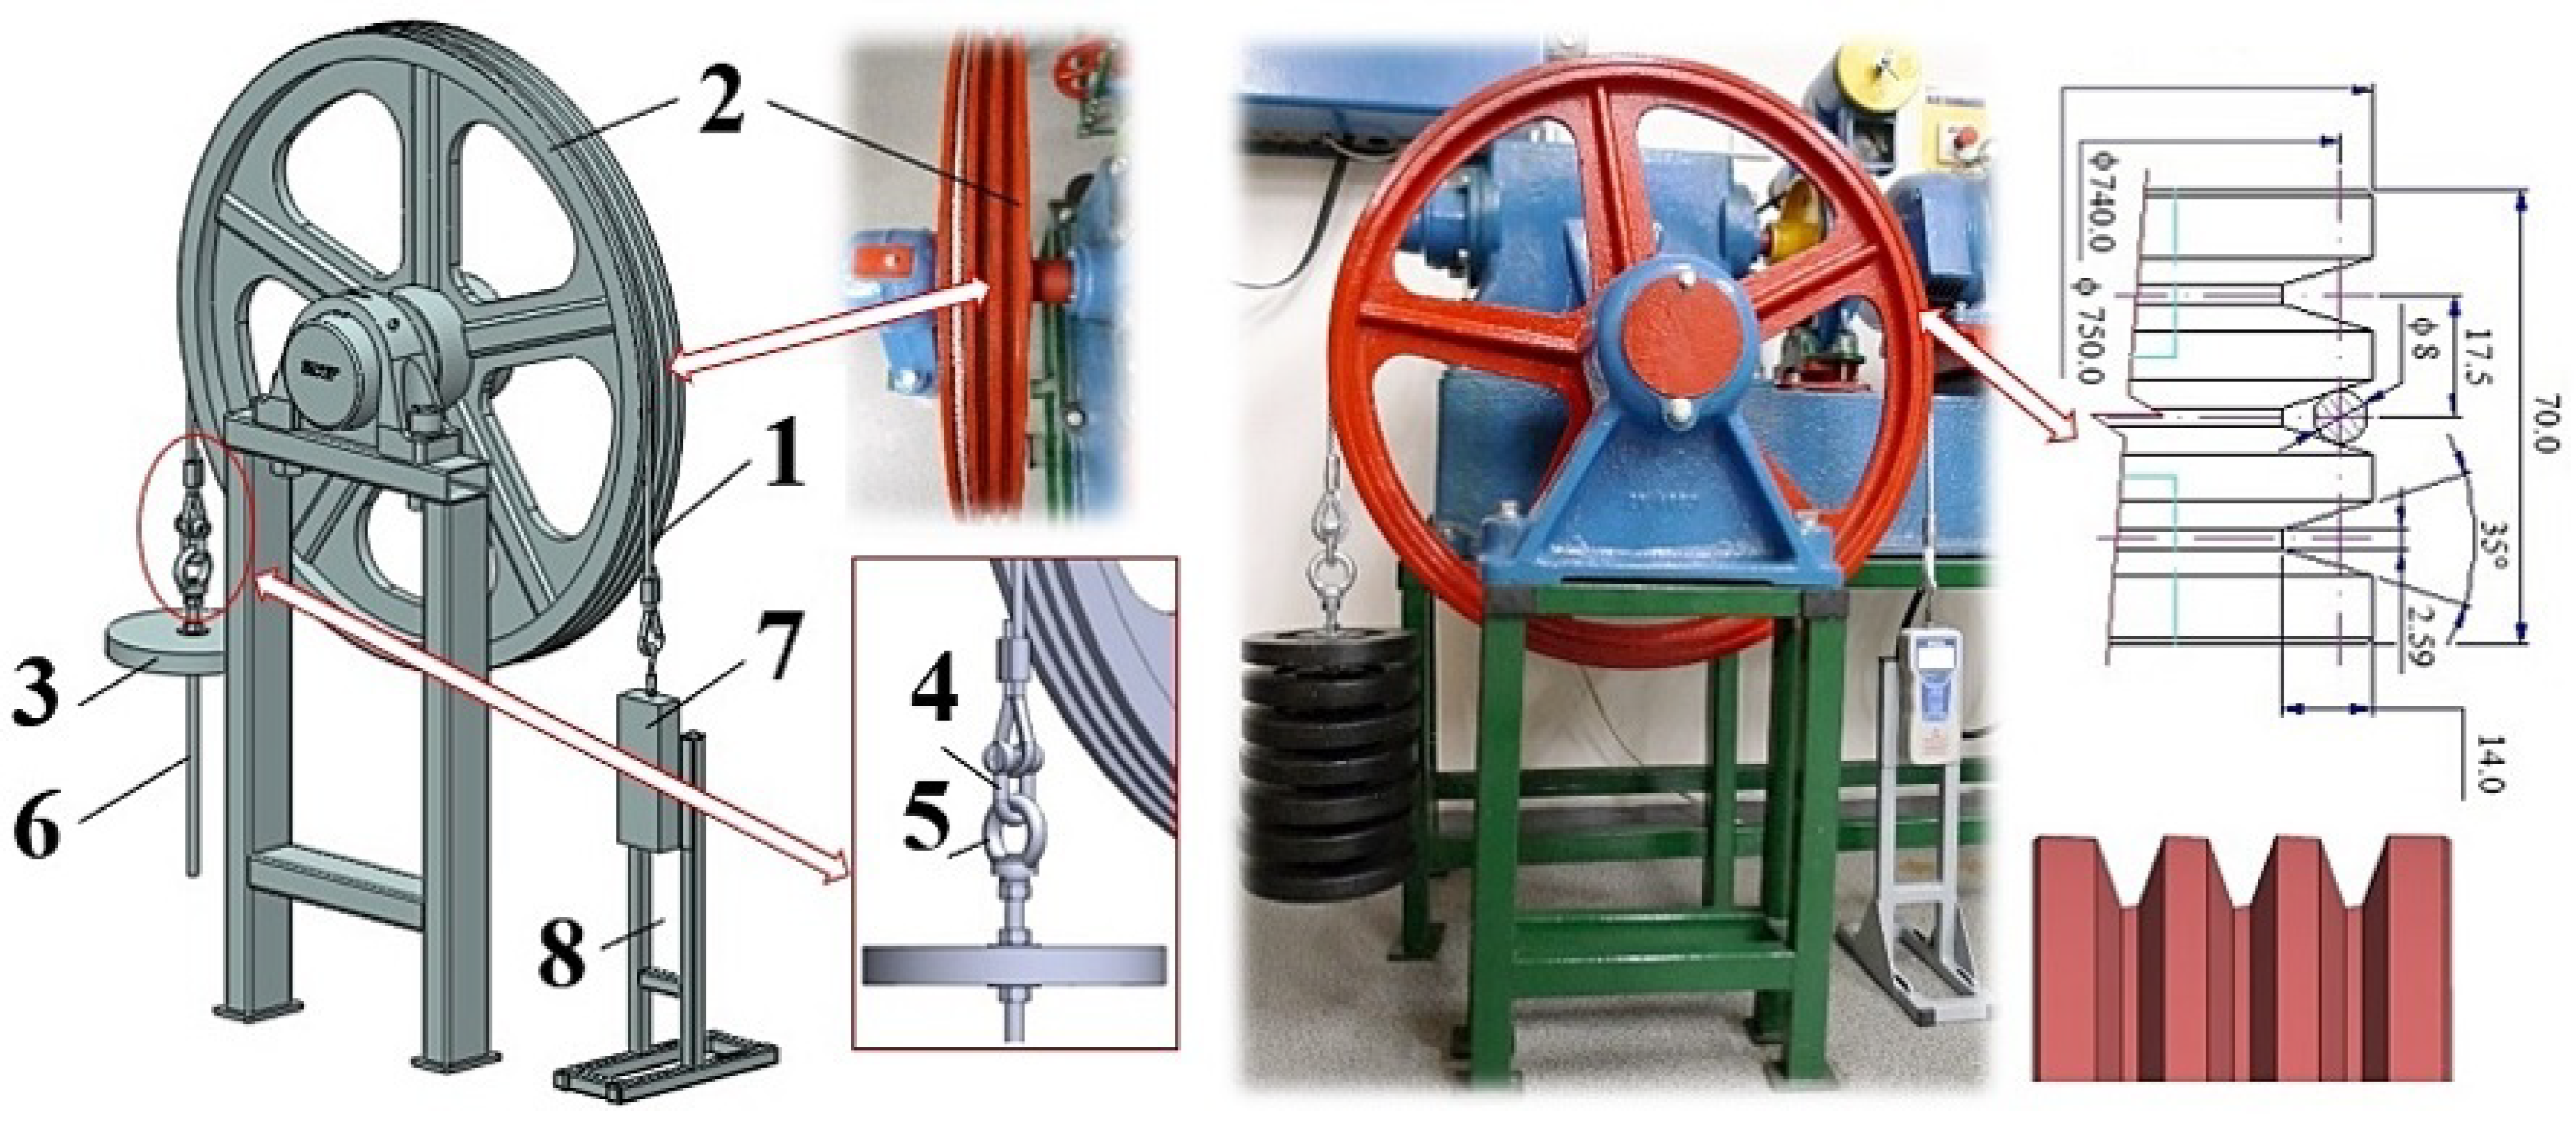
4. Discussion
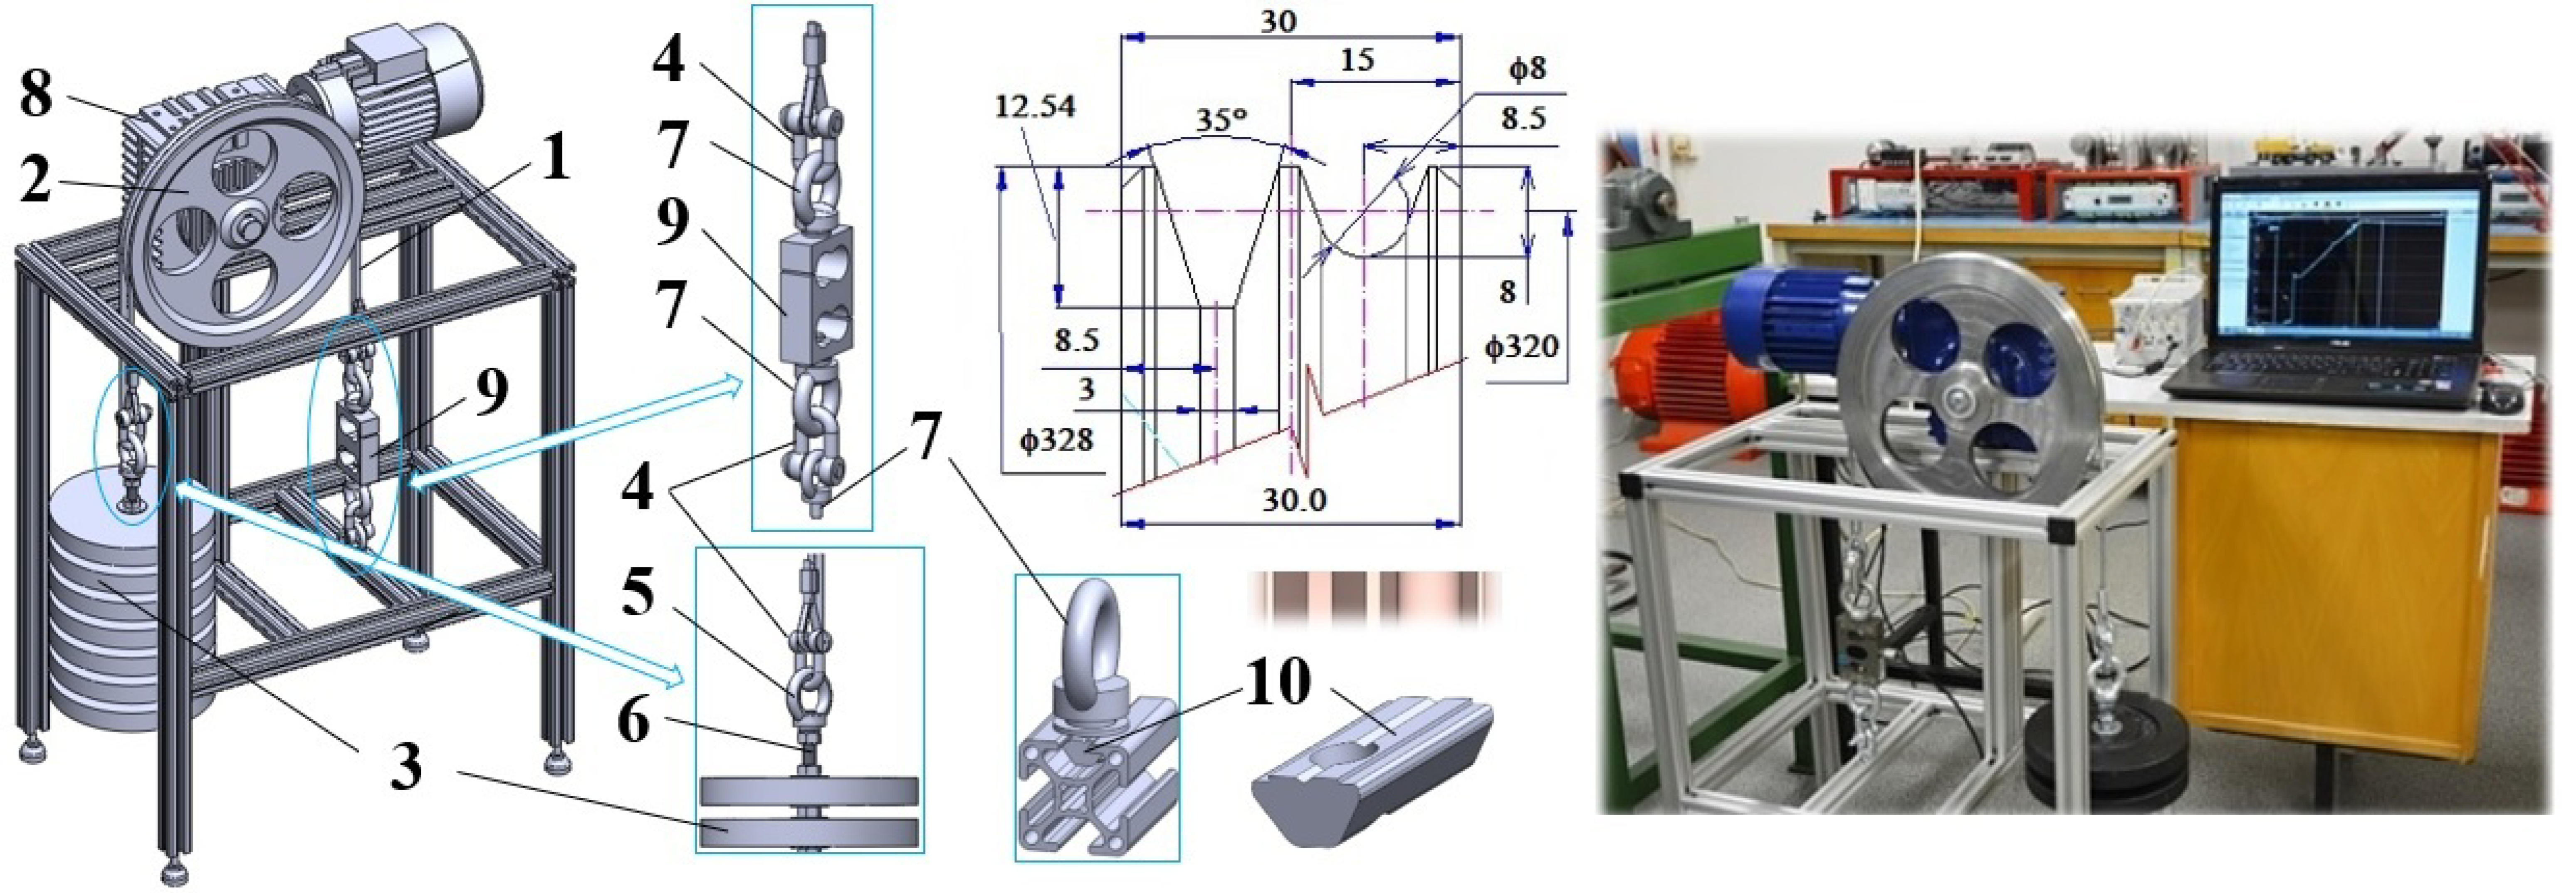
A weight
3 of known mass m
z is suspended from the end of cable
1 (on the retreating side of the pulley
2, see
Figure 7). The derived pulling force F
N on the advancing side of the pulley
2 by the weight
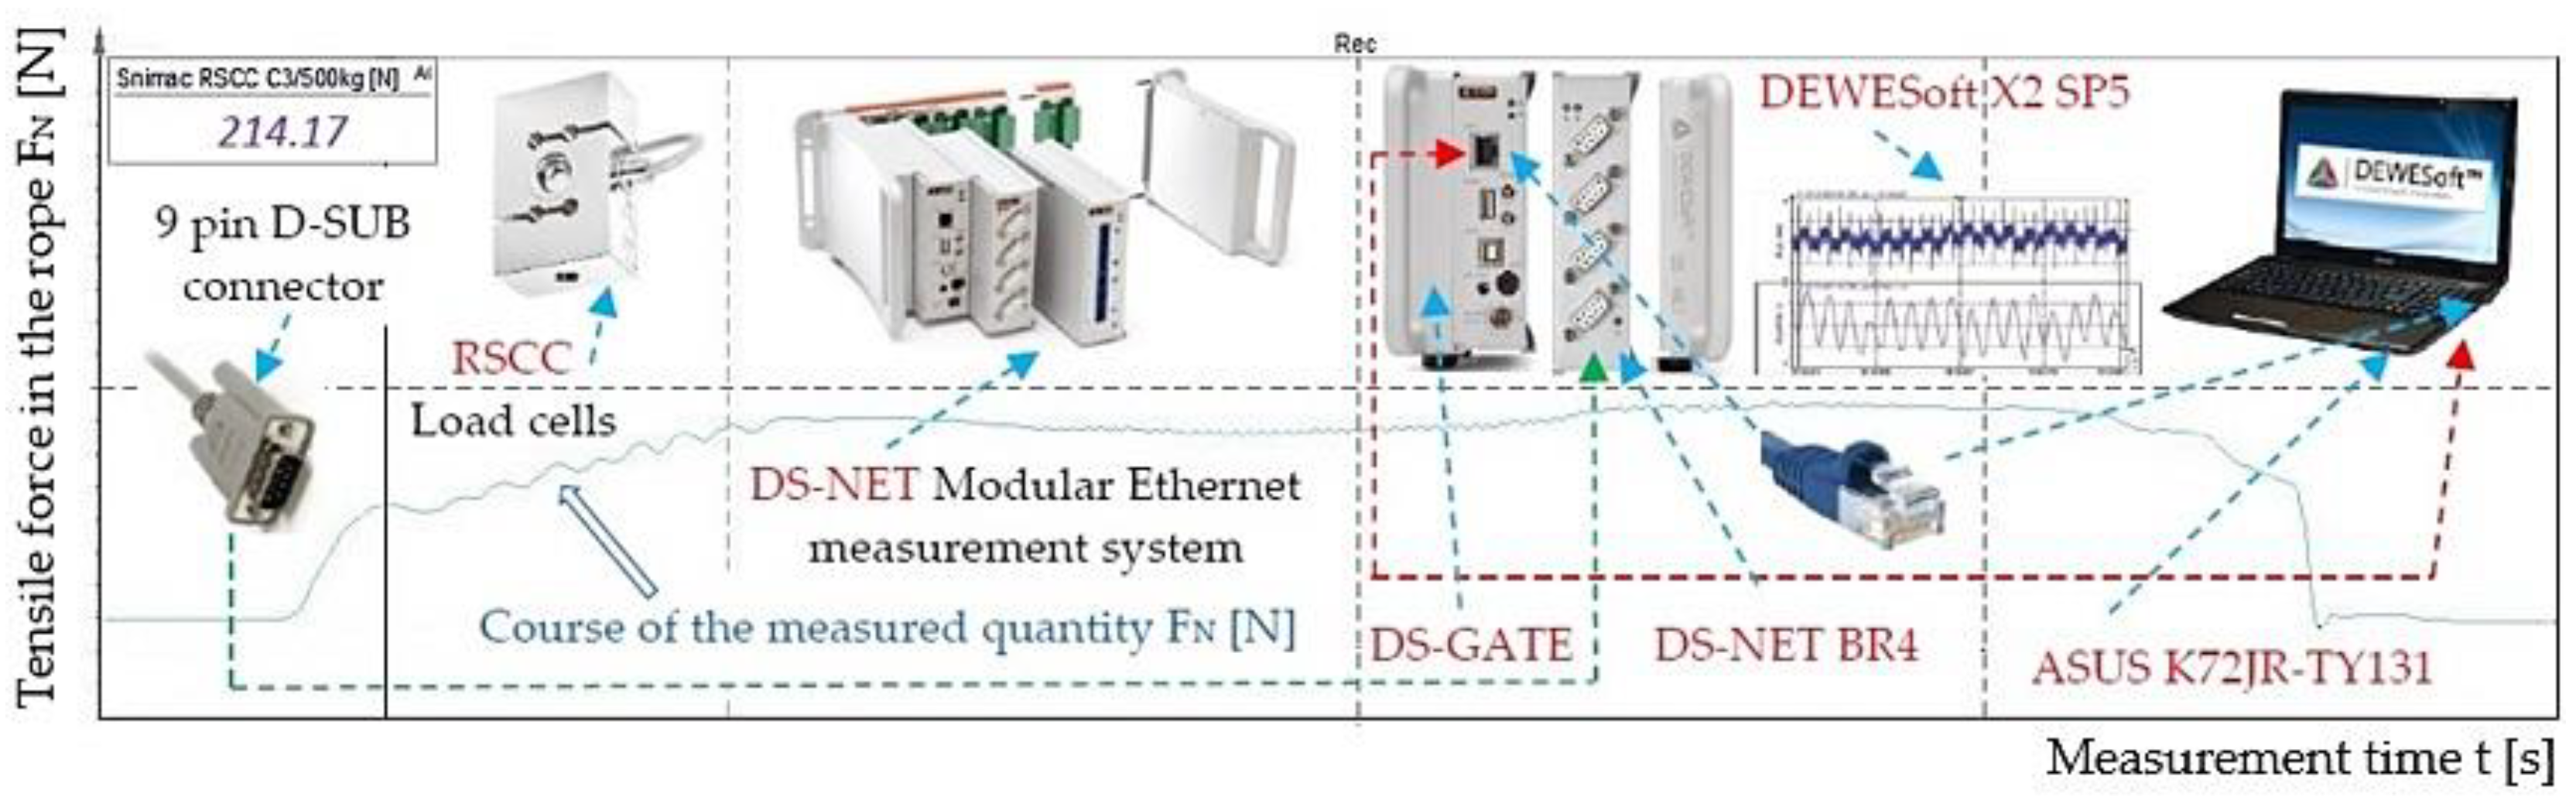
3 is detected by the load cell RSCC
9. A load sensor cable
9 equipped with a D-Sub plug was plugged into the socket of the measuring module BR4-D of the strain gauge apparatus DS NET during the laboratory measurements. A PC (ASUS K72JR-TY131 laptop) was connected to the DS NET strain gauge using a network cable with RJ-45 connectors at both ends. The time record of the measured F
N pulling force was displayed on a PC screen in the DEWESoft X2 SP5 software environment (see
Figure 9).
Through the supply of an electric current to the terminals of the electric motor, a tractive force F
2 [N] acts on the pitch diameter D
k of the pulley
2, which attempts to move the cable
1 in the pulley groove due to the frictional effect. Due to the anchoring of the cable
1 on the advancing side to the frame of the laboratory equipment (
Figure 7), the frictional force F
T [N] is generated on the contact area of the cable with the pulley groove under the action of the torque M
2. The instantaneous magnitude of the friction force F
T can be expressed as the product of the normal force N [N] and the friction coefficient of the cable in the groove f. The normal force can be expressed as the sum of the instantaneous magnitudes of the pulling forces in both cable sides N = F
o + F
N.
When the tractive force is transmitted by friction, relation (6) applies to the circumferential force F. The magnitude of the pulling force FN on the advancing side of the cable on the pulley increases with the increasing belting angle α of the cable through the pulley groove.
The pulling force F
N reaches the maximum value for the laboratory device (see
Figure 7) at a belting angle α = 180 deg. If the drive supplies the tractive force F
2, and if the maximum possible size of the circumferential force in the pulley groove is F (6), at F
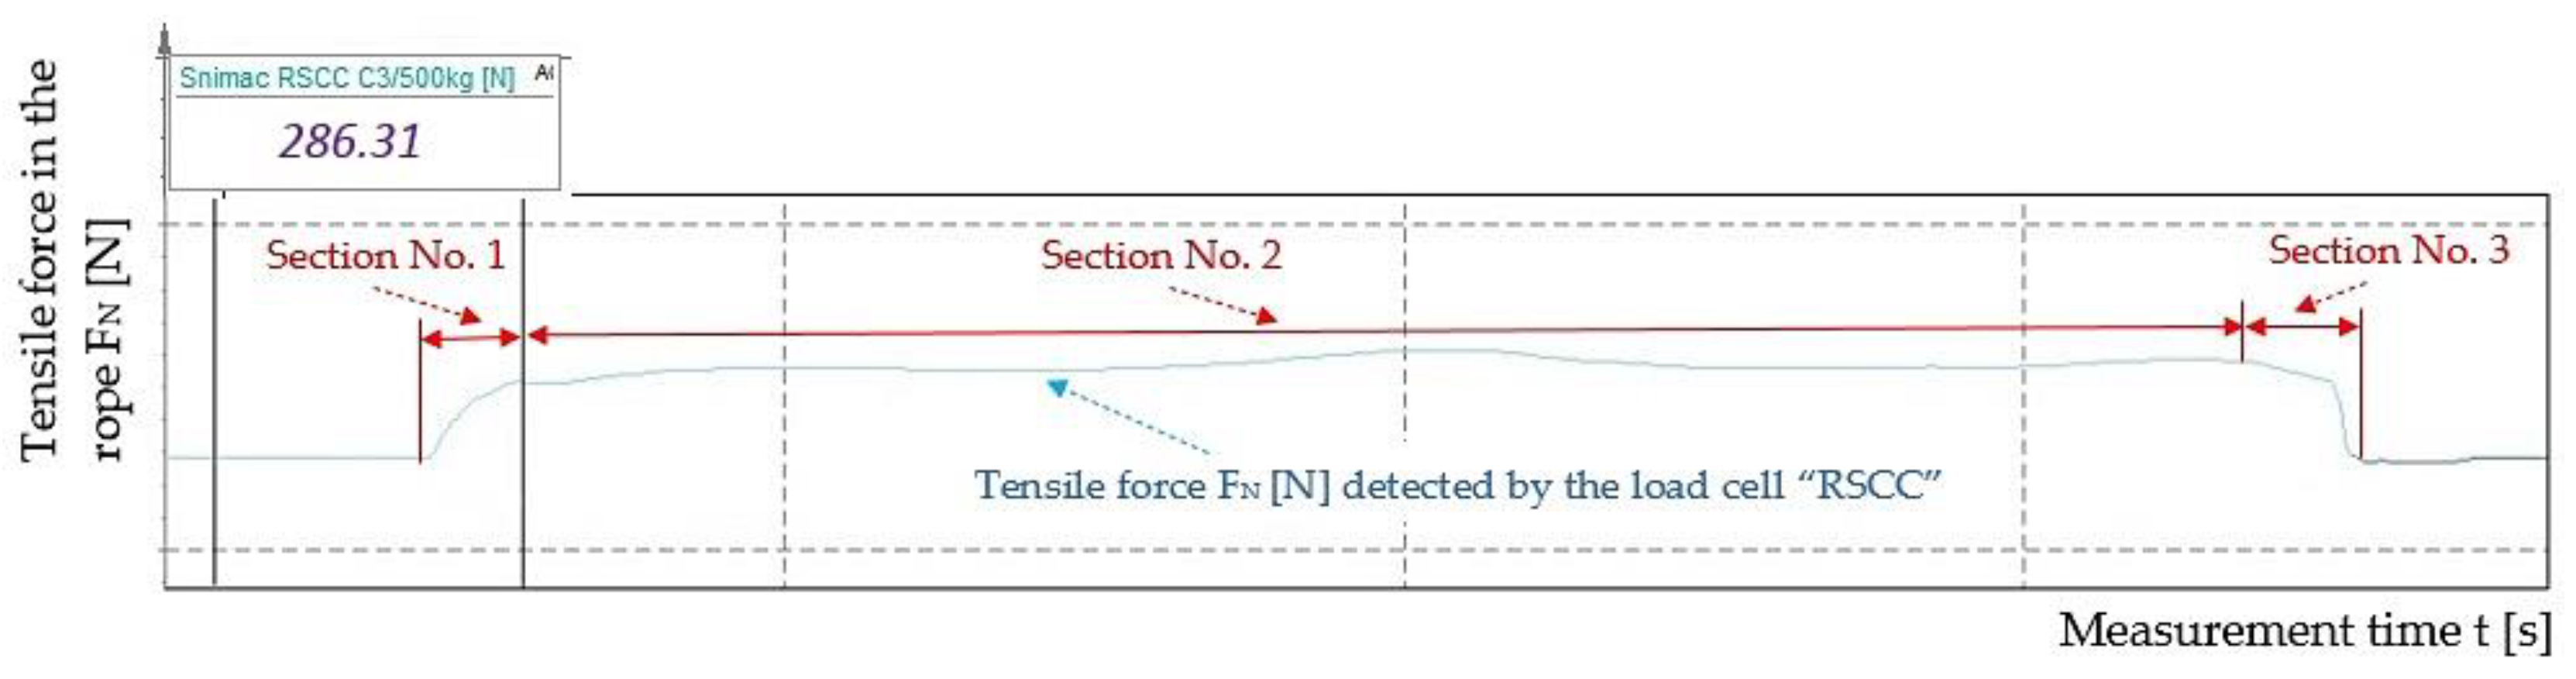
2 > F, the cable slips in the pulley groove.
Figure 10 present the measured force waveform of F
N, using the RSCC
9 load cell on the laboratory equipment.
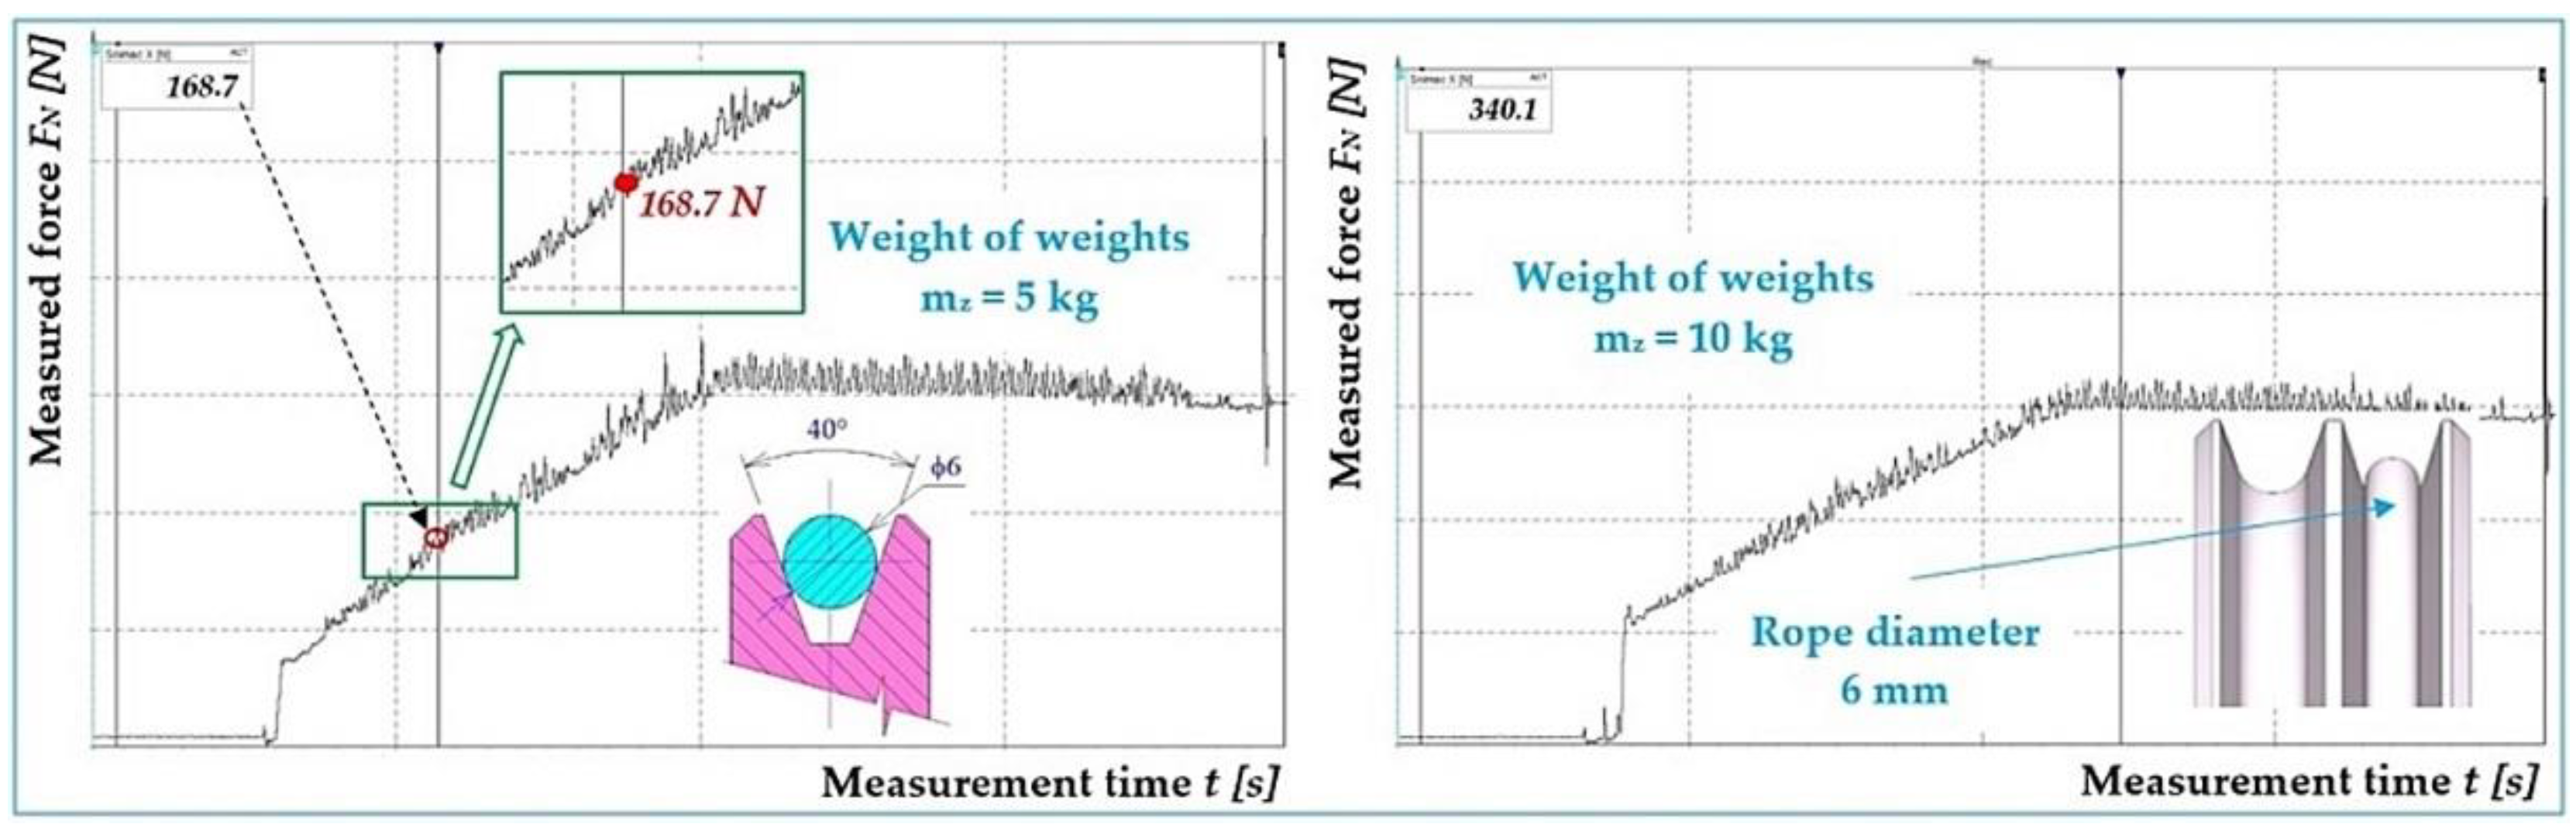
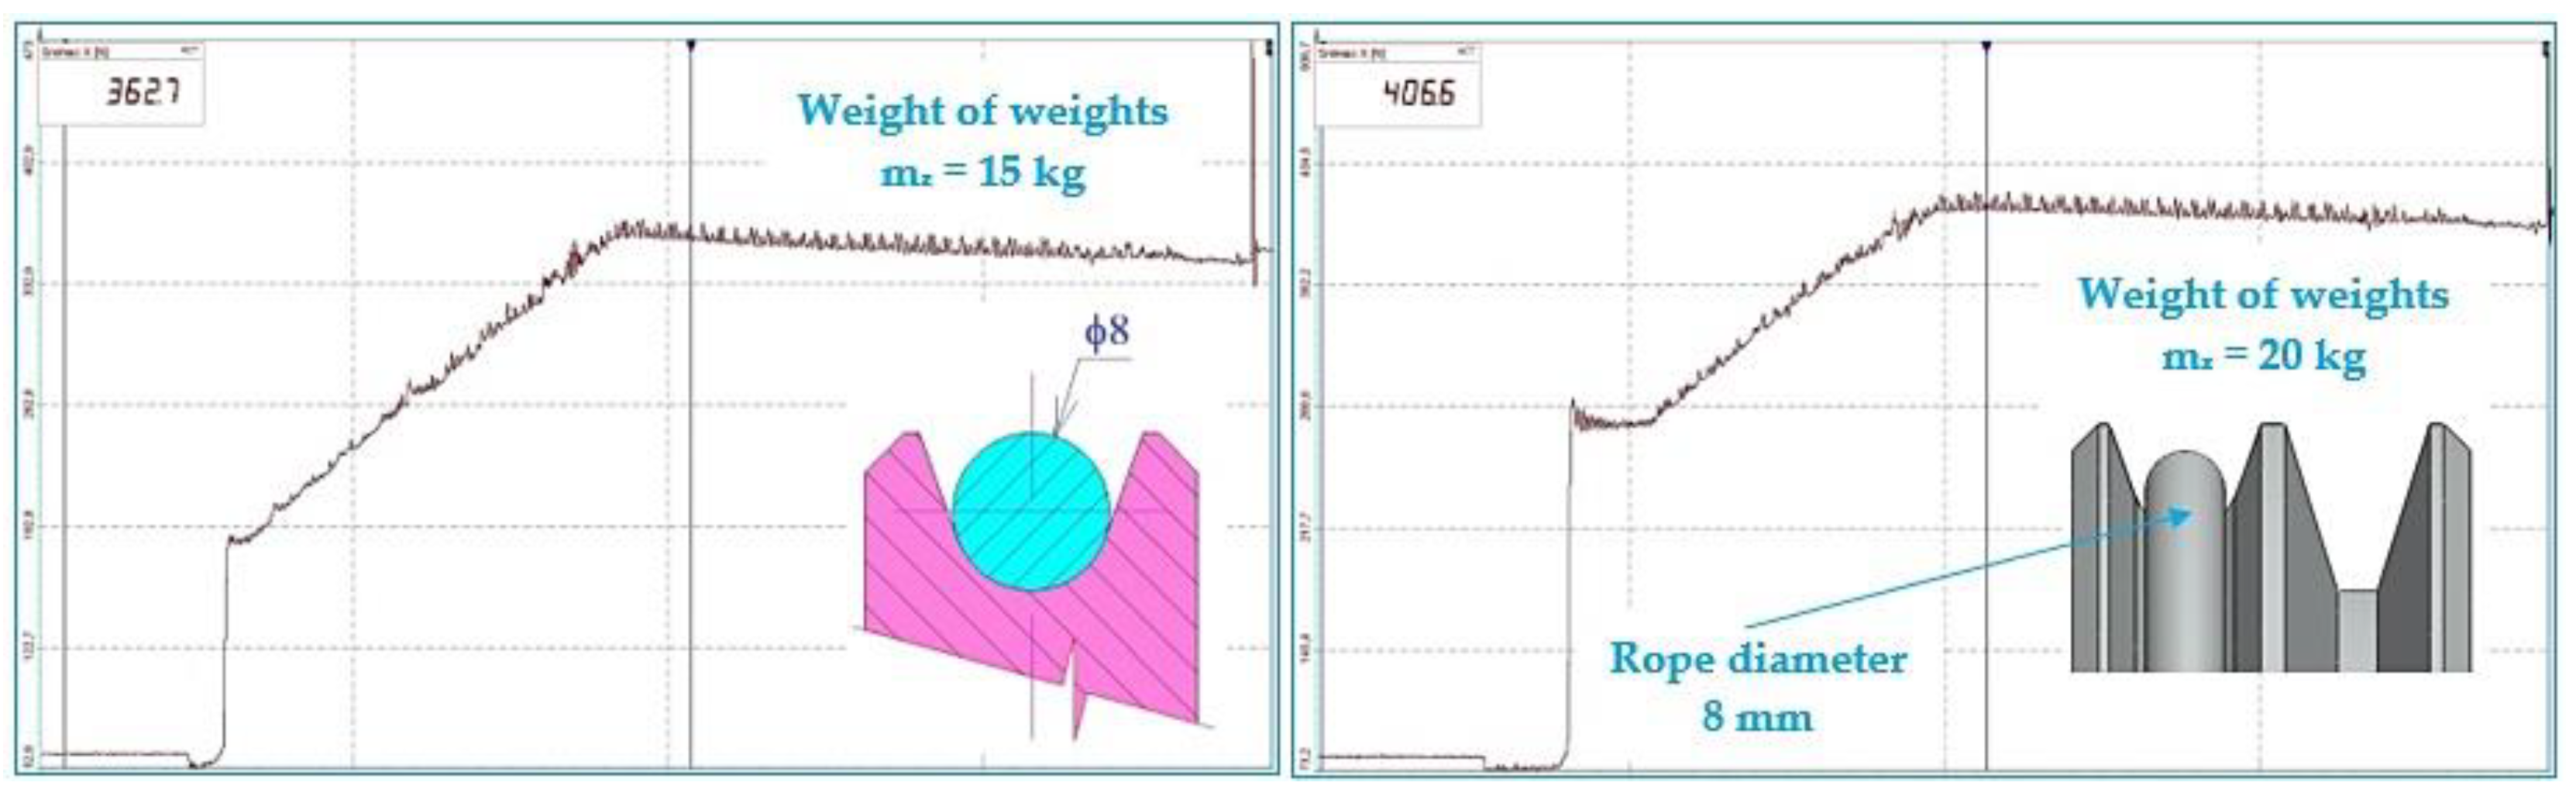
Experimental measurements of the generated pulling force in the cable were carried out on a measuring device (
Figure 2) under the static condition of the pulley, i.e., the cable was not subjected to friction in the groove of the rotating pulley. The experimentally measured F
oMi forces listed in
Table 3,
Table 4,
Table 5 and
Table 6 were detected by an IMADA force meter with a measuring range of 0 ÷ 1000 N, a resolution of 1 N and an accuracy of ±2%. The values of the friction coefficients in the V-groove f
Mi determined by the indirect method from the measurements carried out on the experimental device (see
Figure 2) were calculated from relation (1). Refinement of the measured F
oMi force values could be achieved by using a force gauge with more sensitive resolution.
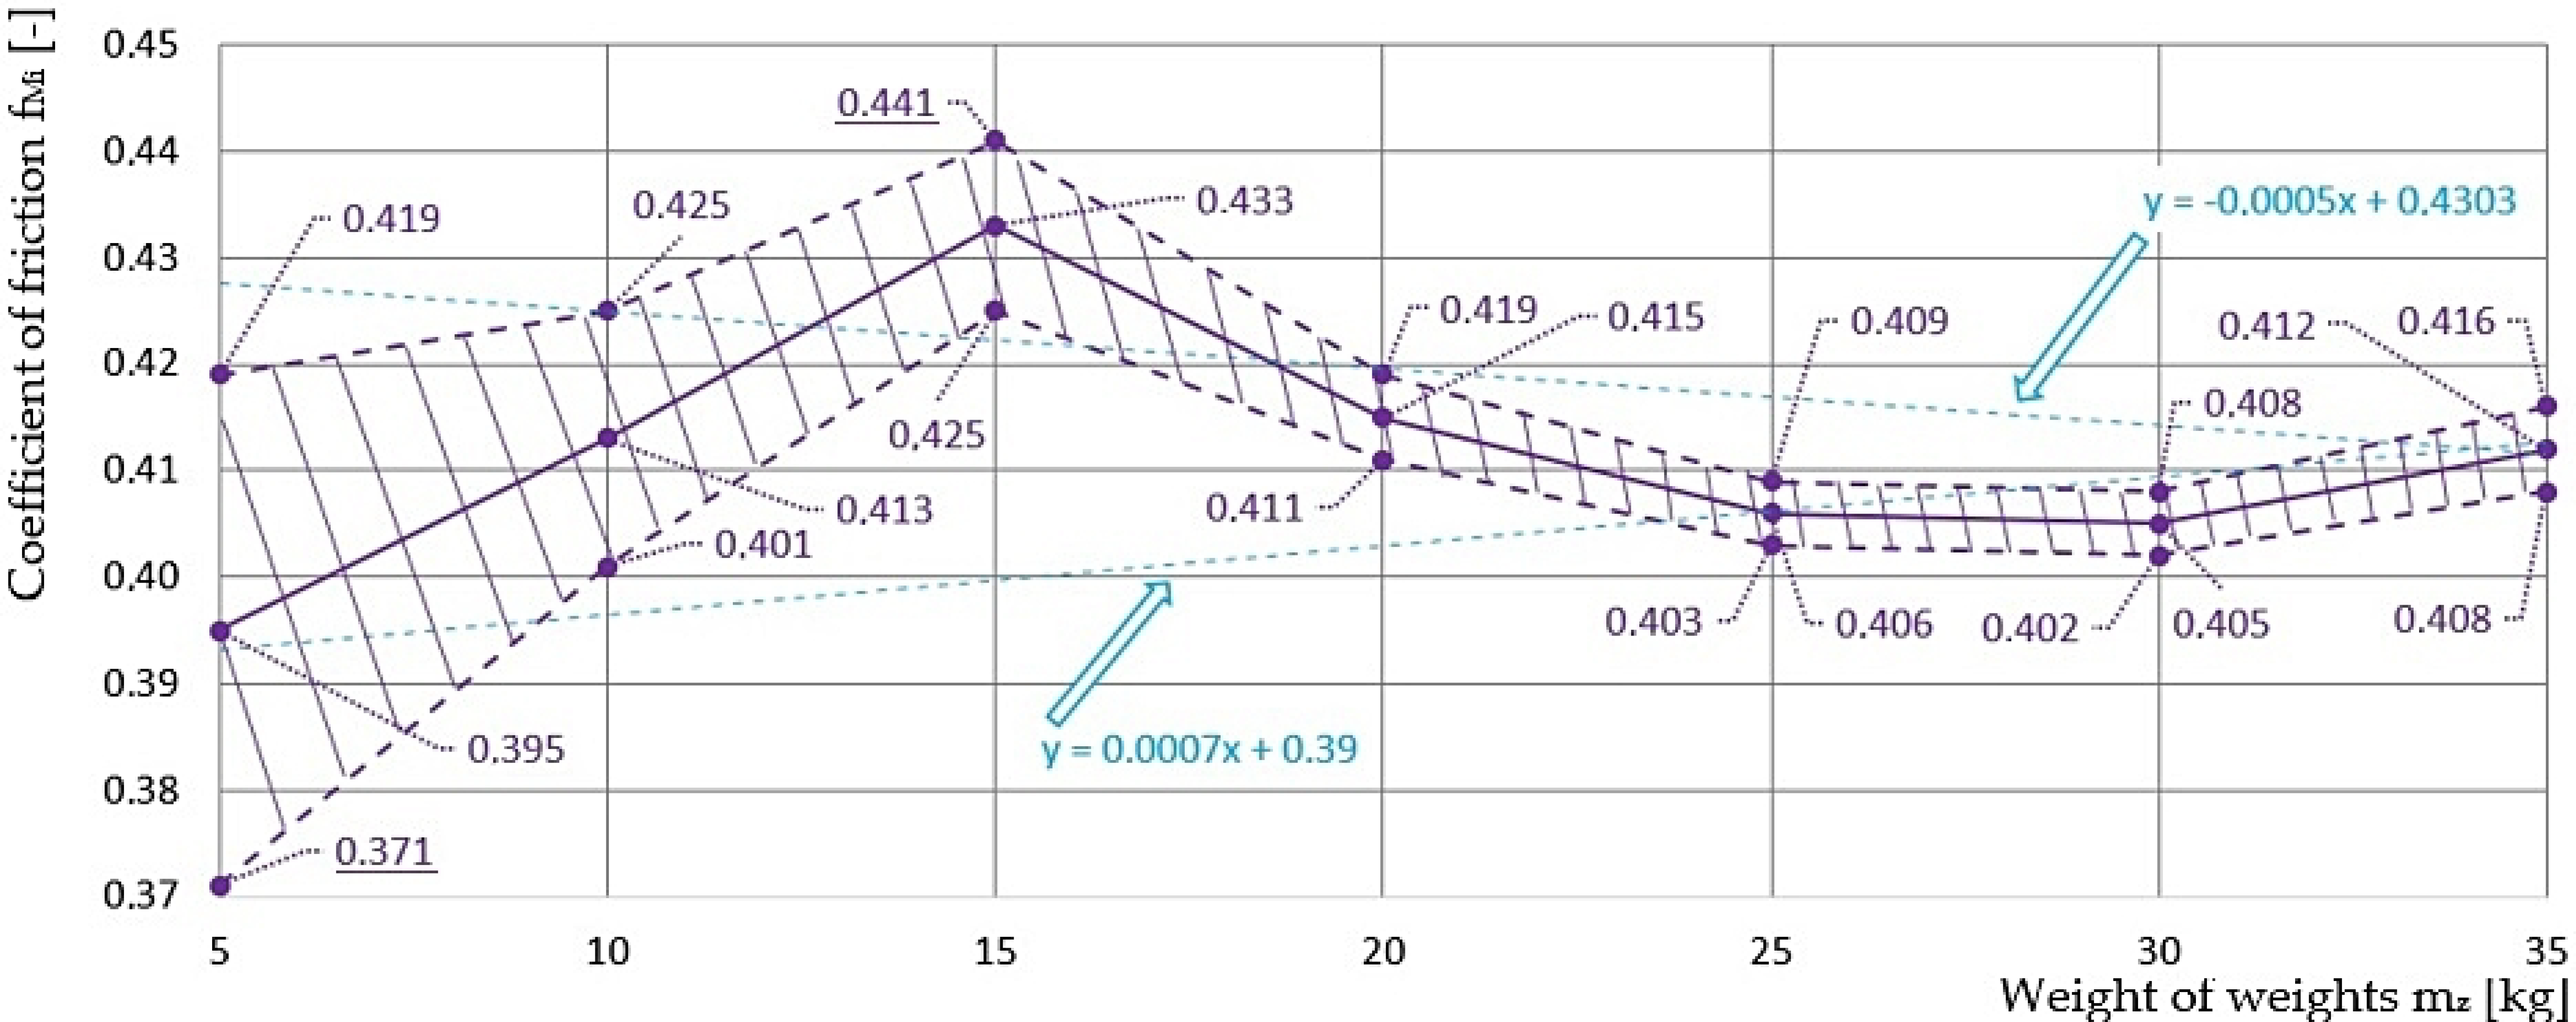
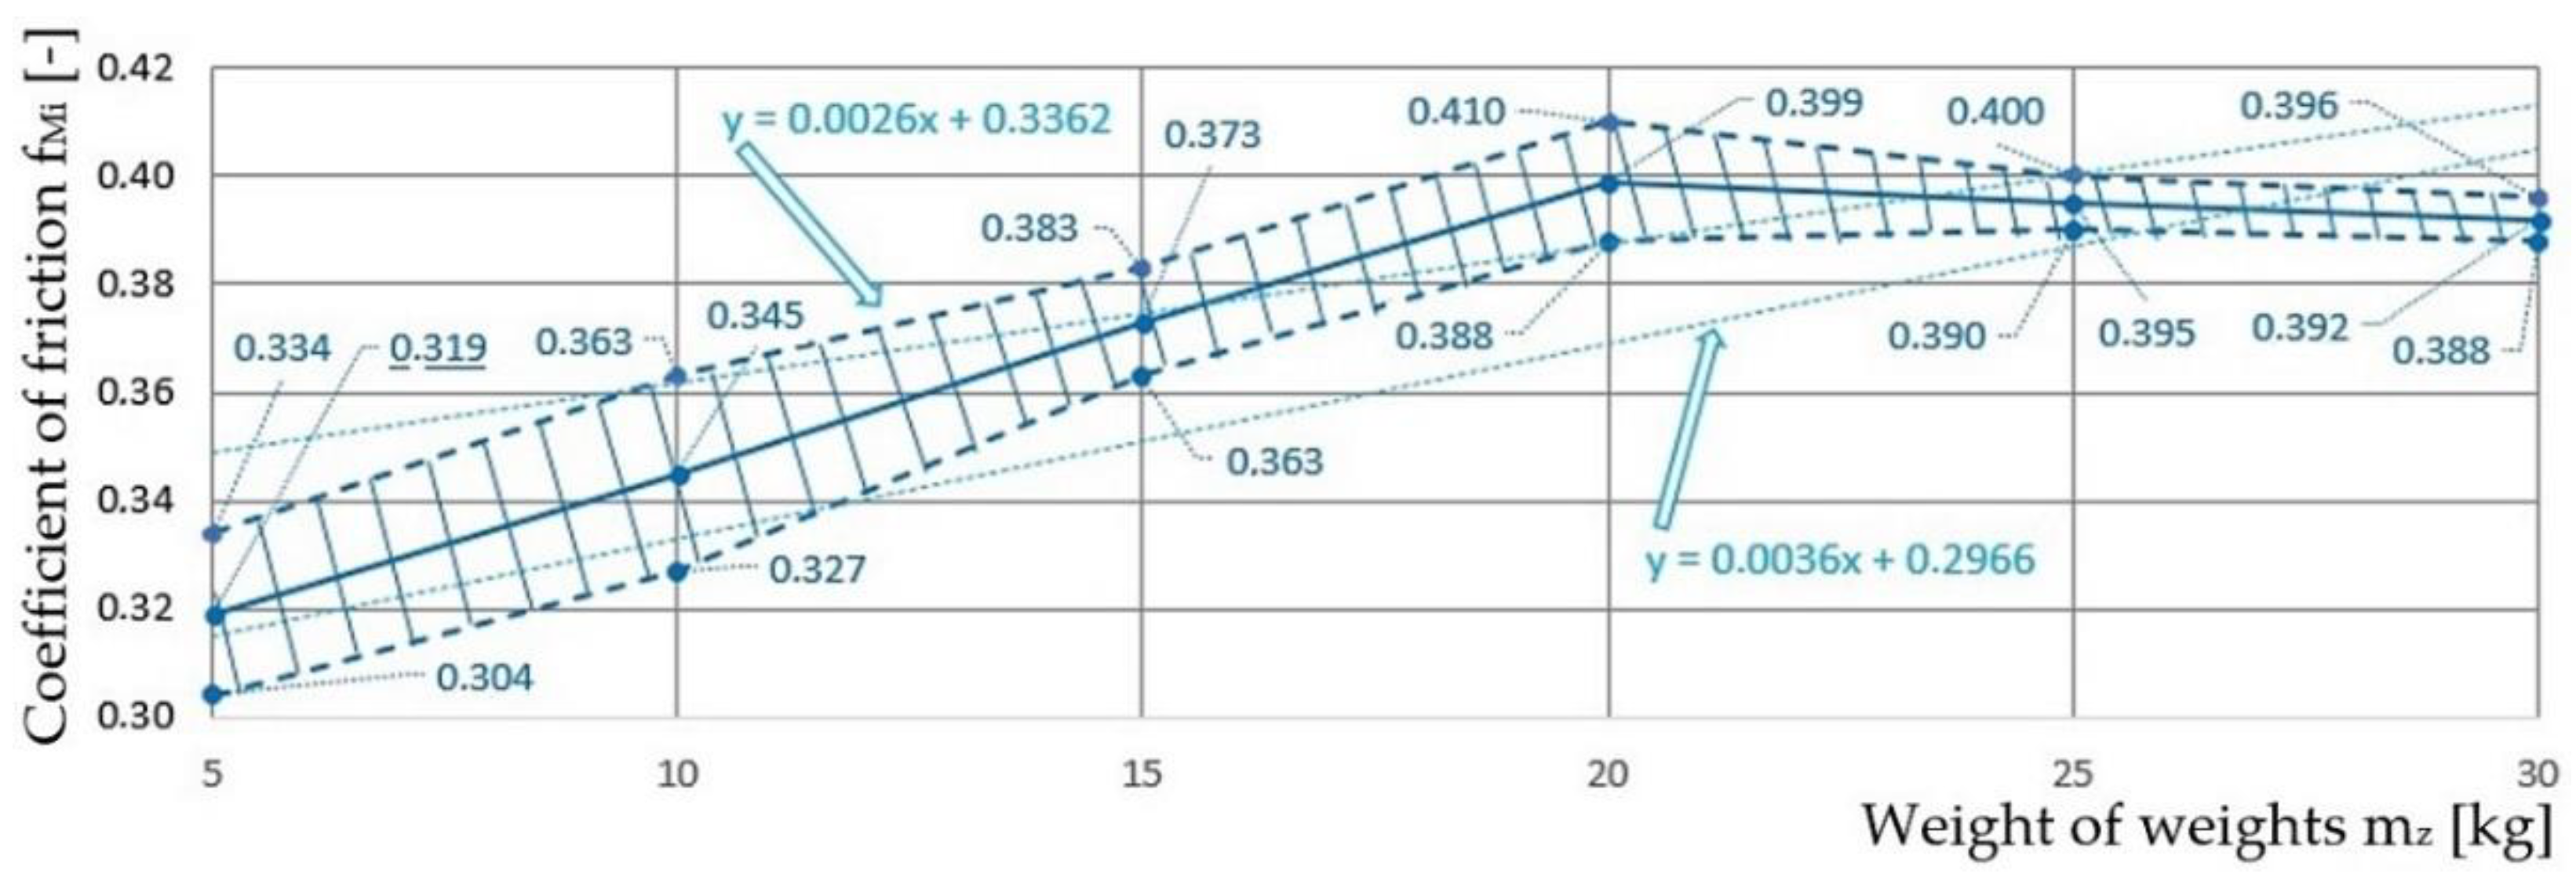
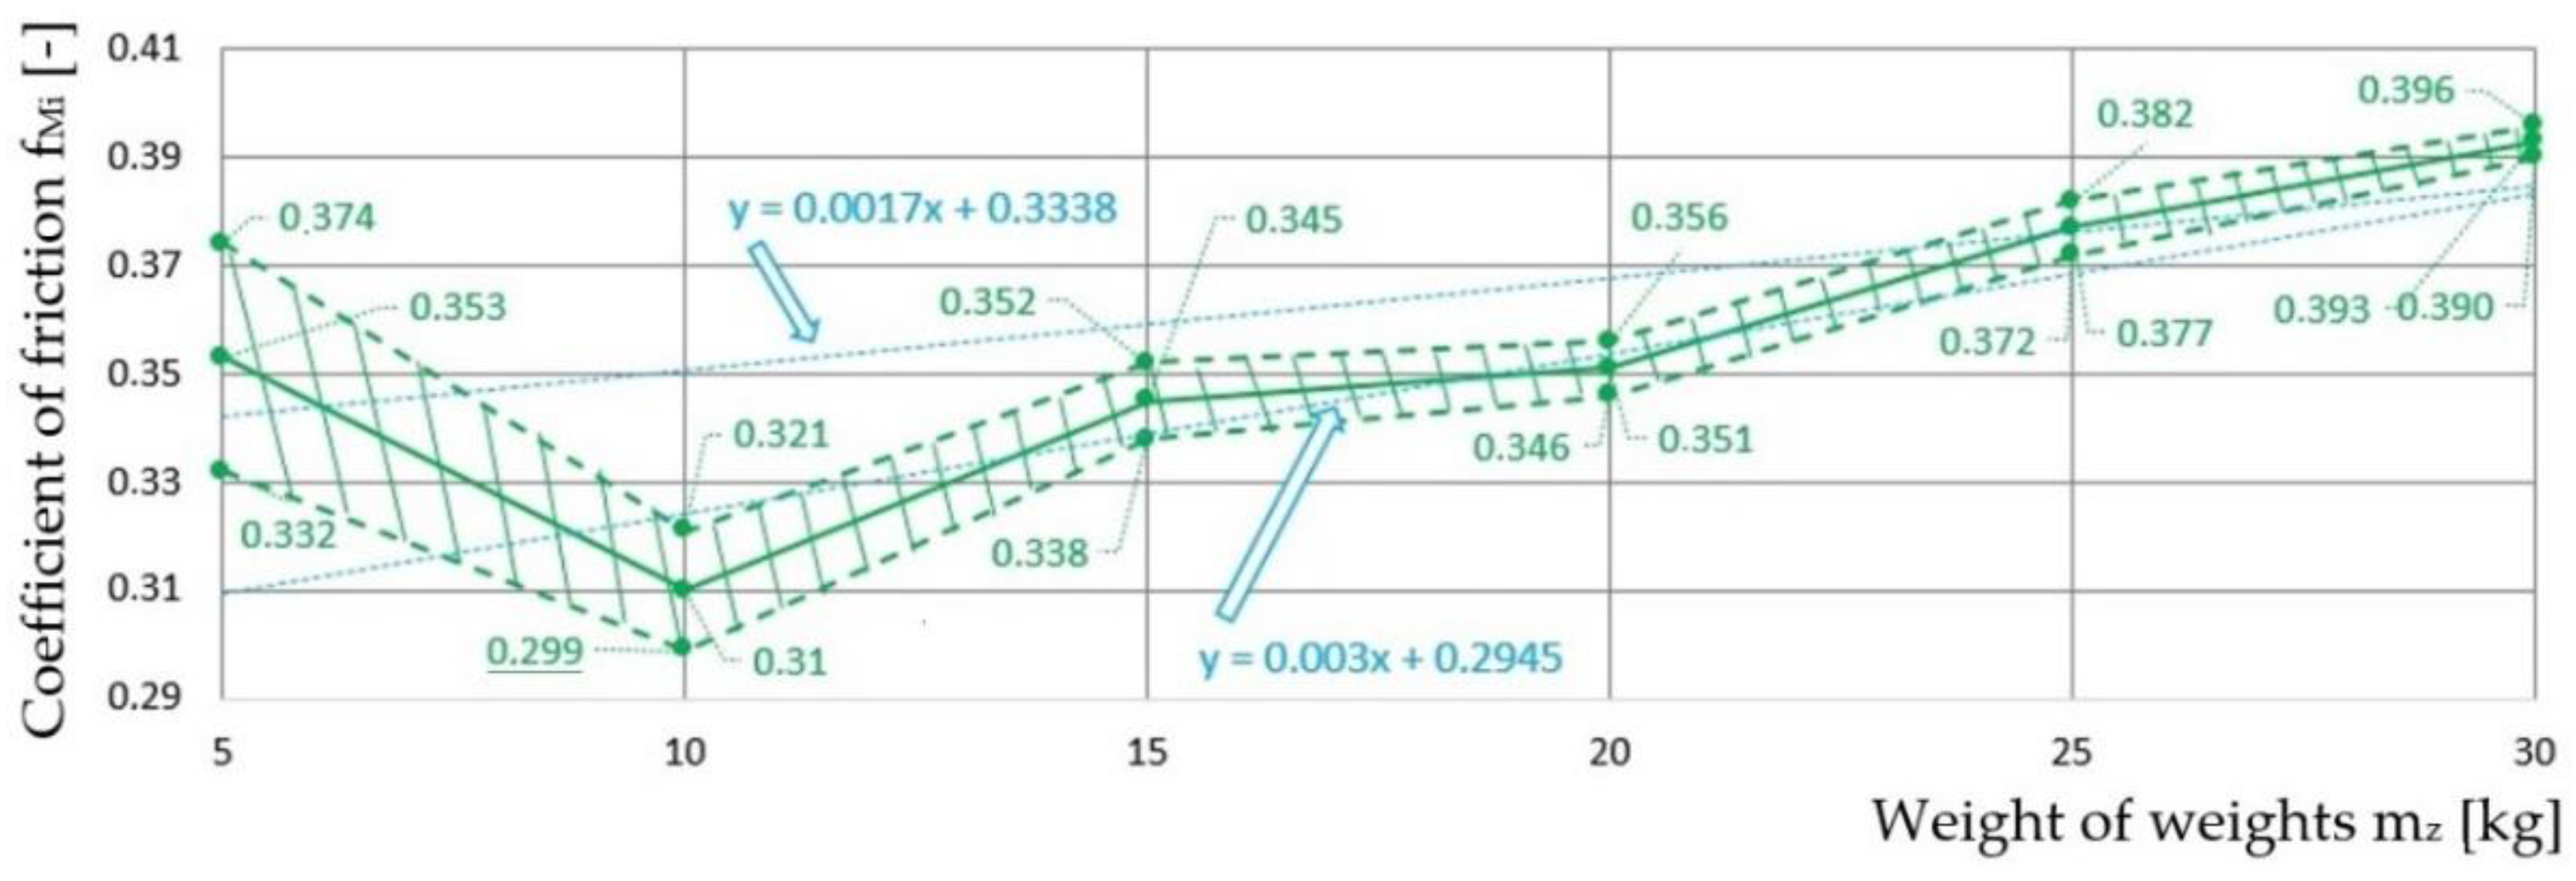
The laboratory results of the friction coefficients confirm the assumption that the coefficient of friction of the cable in the pulley groove reaches smaller values for the operating condition when the contact surfaces of the groove are contaminated with oil in relation to the operating condition of the groove dry and clean, see
Figure 11.
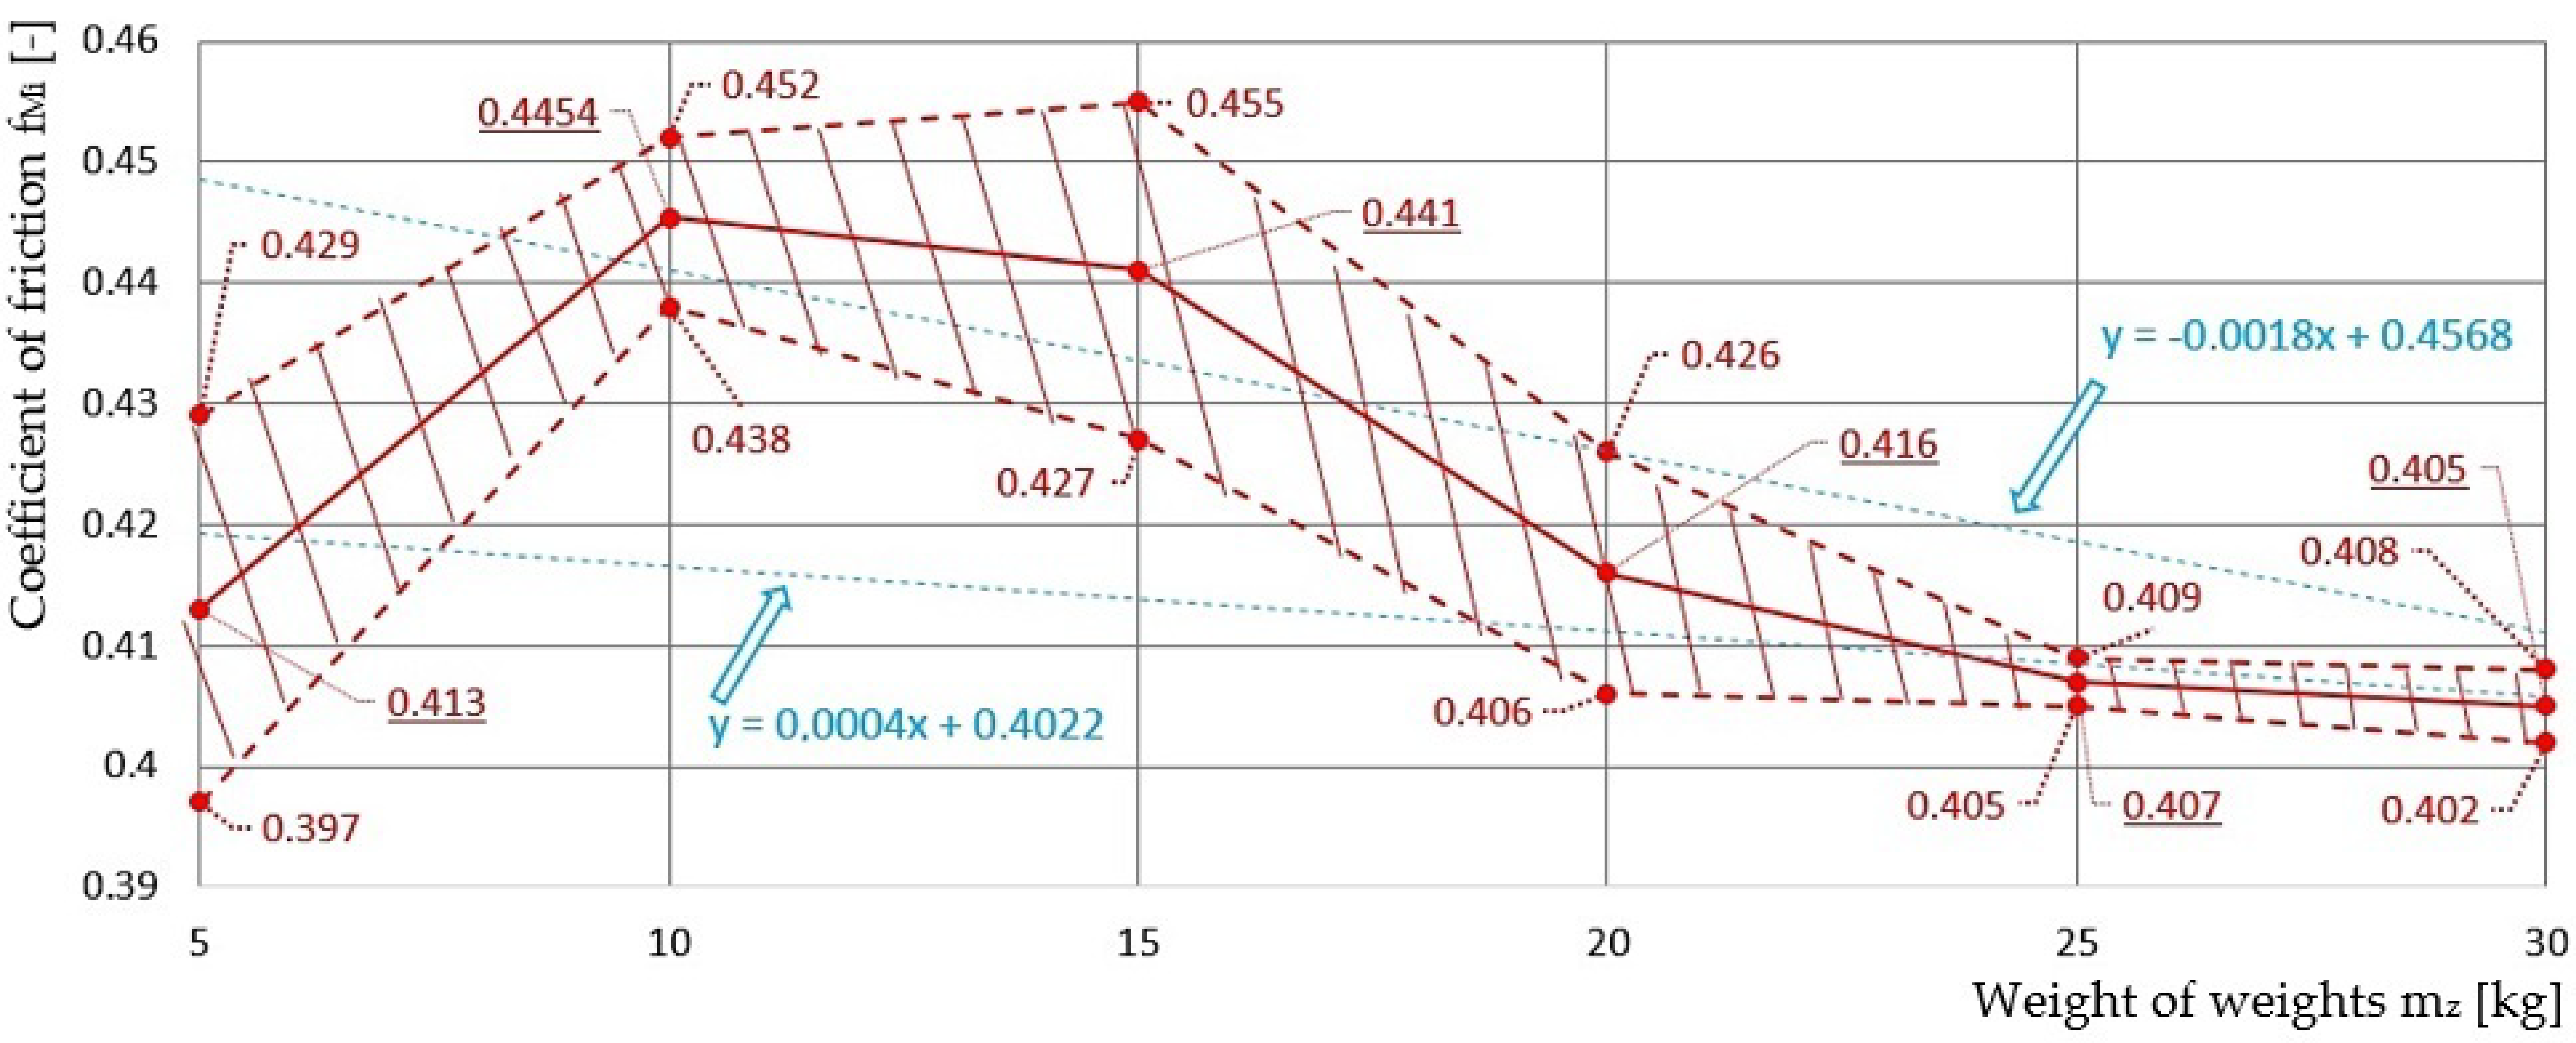
The theoretical assumptions, see
Figure 12, of the physical phenomenon known as fibre friction and the validity of the Euler equation for fibre friction were also confirmed by experimental measurements. The measured values of the coefficient of friction of the 10 mm diameter cable under the condition of the groove “dry and clean” showed values about 32% higher than the recommended value according to [
36]. This difference between the measured and the actual value of the coefficient of friction of the cable in the hardened V-groove can be justified by the fact that the technical standard [
30] gives a recommended value for the calculation which takes into account the least favourable operating condition of the contamination of the groove.
5. Conclusions
This paper presents two experimental devices designed at the Department of Machine and Industrial Design, Faculty of Mechanical Engineering, VSB-Technical University of Ostrava, and constructed in the Laboratory of Research and Testing. Both laboratory devices are used to detect pulling forces in both sides of the final length of a cable belted in a pulley groove and to verify the phenomenon defined by the name fibre friction.
The purpose of the created measuring devices (
Figure 2 and
Figure 7) is to obtain by experimental measurements the most accurate true value possible of the coefficient of friction acting on the contact surface of the cable with the pulley groove. The values of the friction coefficients obtained by indirect measurements on laboratory equipment, when the tractive force is transferred by friction, differ in many cases and do not coincide with the values calculated using theoretical relationships, e.g., (2), (3) and (4).
A notch which can be formed in the base of the groove profile of the pulley can reduce the contact pressure on the contact area of the cable running through a semi-circular groove. The width of the groove must be designed in accordance with [
30] so that its size reaches a maximum of 80% of the cable diameter. The relation (5) gives the maximum value that can be used for the angle of the groove.
The instantaneous value of the tractive force on the advancing cable side while the pulley was rotating was recorded during the time period of each measurement, while laboratory measurements were performed on the measuring device (
Figure 7). The plotted time history of the F
N tractive force on the laboratory device (see
Figure 10), is composed of three basic parts.
The first section of the time record of the measured FN force is defined by a rising curve. This section presents the increase in the magnitude of the tractive force FN on the advancing side of the cable on the driven pulley. When the pulley rotates, the tractive force FN increases according to Euler’s equation for fibre friction to its maximum value, which is defined by the friction factor (the size of the cable girth angle α and the friction coefficient f in the pulley groove). If the magnitude of the force in the cable reaches the maximum value of the circumferential force F (given by the difference between FN and tractive force Fo on the retreating side of the cable from the pulley, which is equal to the weight suspended from the end of the cable, at the belting angle α), which is greater than the frictional force FT of the loaded cable, the cable will start to slip in the pulley groove (assuming a sufficient magnitude of the tractive force F2 and torque M2).
The second section of the time record of the measured force FN is defined by a horizontal curve and presents the slip of the cable in the pulley groove.
The third section of the time record of the measured FN force is defined by a falling curve. When the power supply to the electric motor terminals is interrupted, the pulling force F2 ceases to act on the pitch diameter Dk of the pulley. The maximum magnitude of the measured force FN drops to a value equal to the magnitude of the tractive force on the retreating side, i.e., to the value Fo.
By successive (repeated under the same conditions) laboratory measurements of the tractive force F
N (
Figure 11 and
Figure 12) on the advancing side of the cable on the pulley at a known belting angle α = 180 deg, it is possible to determine on laboratory equipment (
Figure 7) by the indirect method the actual value of the coefficient of friction in a given type of cable groove (semi-circular, V-groove) under the operating conditions of surface contamination (clean and dry, contaminated with dust, contaminated with oil, etc.) of the groove surfaces in contact with the steel cable. The actual value of the friction coefficient obtained by laboratory measurement can be verified with the values theoretically calculated (see
Table 7) according to relations (2) to (4).


