Article

Assessment of Modulus Attenuation of Cement and Lime-Fly Ash Semi-Rigid Road Base Materials

1
Shandong Hi-Speed Group Co., Ltd., Jinan 250101, China
2
Shandong Hi-Speed Transportation Construction Group Co., Ltd., Jinan 250101, China
3
Shandong Transportation Institute, Jinan 250101, China
*
Author to whom correspondence should be addressed.
Coatings 2022, 12(2), 216; https://doi.org/10.3390/coatings12020216
Submission received: 18 January 2022 / Revised: 28 January 2022 / Accepted: 1 February 2022 / Published: 7 February 2022
(This article belongs to the Special Issue Asphalt Pavement Materials and Surface)

Abstract

:
For asphalt pavement structures, semi-rigid road base course has to sustain repeated high-axle load during its service life and the performance of semi-rigid road base materials directly influences the durability of pavement structures. The dynamic compressive resilience modulus of two commonly used semi-rigid road base materials, cement stabilized aggregates (CSG) and lime-fly ash stabilized aggregates (LFSG) were evaluated at different frequencies using a Universal Testing Machine (UTM). The results showed that LFSG had higher dynamic modulus than that of CSG and the load frequency had less influence on the dynamic modulus of these two semi-rigid road base materials. The four-point bending test was applied to measure the flexural-bending strength and the fatigue life of these two semi-rigid materials. A higher flexural-bending strength of LFSG indicated its better bearing capacity than that of CSG. The fatigue life of LFSG and CSG decreased with the increase of stress–strength ratio and the LFSG performed better in terms of fatigue resistance. The fatigue damage models of CSG and LFSG based on Stress-Life (S-N) curve are established. As per incremental-recursive mechanics, a general modulus degradation model was established and verified by the results of full-scale accelerate loading test. This model cannot only be used to predict the fatigue deterioration of semi-rigid road base materials under different stress levels, but is also able to calculate the current bending elastic modulus based on its initial modulus value.

1. Introduction

An asphalt pavement can be recognized as a multiple-layer structure, which is typically composed of asphalt surface layers, road base layers and road sub-base layers. As a layered system, each layer carries and spreads loads from the above layer and passes the load to the next layer below [1,2,3]. Due to its high strength, good moisture stability and low cost, semi-rigid material is the most commonly used road base material for asphalt pavements in China. The semi-rigid base material is a type of hydraulic material which is produced by mixing predetermined ratios of water, aggregates (coarse and fine) and hydraulic materials, after a paving and compaction process to form a semi-rigid road base [4,5]. In general, the two commonly used semi-rigid road base materials are lime-fly ash stabilized aggregate (LFSG) and cement stabilized aggregate (CSG). Compared to flexible/asphalt base materials, LFSG and CSG can be more environmentally friendly as they consumed more fly ash and other waste materials [6,7].
In a semi-rigid pavement structure system, semi-rigid road base plays an important role for structural bearing capacity and has to sustain repeated traffic loading. One of main failure modes in the semi-rigid base is then the bending fatigue damage. Fatigue of semi-rigid pavement is a type of distress associated with the weakening behavior of semi-rigid base materials caused by repeatedly applied loads at certain stress levels [8]. The fatigue distress of semi-rigid base material is usually initiated in the form of microcracks and propagated to macrocracks due to repeated shear and tensile stresses in the semi-rigid base layer [9]. Propagation of cracks in the base layer is related to the fractures of both adhesive and cohesive modes in mastic films [10]. The fatigue life of the road base layer is strongly affected by the mechanical properties of semi-rigid base materials [11].
Mechanical properties of semi-rigid base materials are important for the pavement durability and many researchers have focused on this field. Sheng et al. investigated the modulus attenuation of semi-rigid base material and found that the mechanical behavior of pavement is stable when the modulus of semi-rigid road base is in a proper range [12]. Sheng et al. also studied the influence of elastic modulus on the pore pressure of the semi-rigid pavement and established correlations between semi-rigid base modulus and pore pressure [13]. Wang et al. investigated the dynamic compressive resilient modulus of semi-rigid base materials and demonstrated that the cement content and curing time are the main factors [14]. The research of Yao et al. reached the same conclusion [15,16,17]. Zhou et al. investigated the fatigue resistance of semi-rigid base material and established a fatigue performance model including aggregate gradation, cement dosage, water content as well as air void [18]. Sha et al., evaluated the fatigue performance of semi-rigid base material by using MTS and analyzed the influence of structure type and flexural strength on the fatigue life of semi-rigid base materials [19].
In summary, a significant amount of research has been conducted to understand the mechanical performance of semi-rigid road base materials. However, the dynamic modulus and fatigue resistance of semi-rigid road base materials still need to researched because of the discreteness and variability.
The objective of this paper is to further understand the dynamic performance of different semi-rigid base materials. A comparative study of two commonly used semi-rigid base materials (LFSG and CSG) was conducted by characterizing the dynamic compressive resilience modulus and four-point bending fatigue life. The dynamic compressive resilience modulus of semi-rigid base materials was evaluated by using uniaxial dynamic compression test through a Universal Testing Machine (UTM). The four-point bending test was performed by using a Universal Testing Machine (UTM) to measure the fatigue resistance of semi-rigid base materials. Finally, a general modulus degradation model of these two semi-rigid road base materials was developed based on fatigue test results and mechanical principle of continuous damage.

2. Materials and Experimental

2.1. Materials

2.1.1. Cement

Ordinary Portland cement of 425 type supplied by Lvzhou cement factory (Jinan, China) was used to prepare cement stabilized aggregate (CSG). The property of this cement was evaluated in accordance with the Chinese Standard JTG E30-2005 [20], and the results are listed in Table 1.

2.1.2. Lime

A type of calcareous hydrated lime supplied by Jinan lime factory (Jinan, China) was used to prepare lime-fly ash stabilized aggregate (LFSG). The physical and chemistry properties of this lime were characterized according to the Chinese Standard JTG E51-2009, and the results are listed in Table 2.

2.1.3. Fly Ash

The fly ash used for LSFG preparation was supplied by Laiwu coal-fired power plants in Shandong Province (Jinan, China). The properties including loss on ignition, particle size and chemical components were tested in accordance with the Chinese Standard JTG E51-2009 [21], and the results are presented in Table 3.

2.1.4. Aggregate

The aggregate used for CSG and LSFG preparation was obtained from a limestone quarry named Changqing in Shandong Province (Xinli stone factory, Jinan, China). The mineral composition of this type of limestone was evaluated by using an X-ray Diffraction (XRD) test (D2 PHASER, Bruker, Billerica, MA, USA). The dominant composition is calcite with the content of 99.15 wt.%, and another two low-content components are quartz (0.81 wt.%) and iron-oxide (0.04%). The physical properties of fine and coarse aggregate were characterized according to the Chinese standard JTG E20-2011 [22], and the results are listed in Table 4.

2.2. Mix Design

2.2.1. Aggregate Gradation

Dense gradations with a maximum particle size of 31.5 mm were chosen in this research to prepare the LFSG and CSG, according to the Chinese Standard JTG D50-2017 [23]. The aggregate size distribution of LFSG and CSG is presented in Table 5 and Table 6, respectively.

2.2.2. Cement Dosage and Optimum Moisture Content

A compaction test was conducted to decide the cement dosage as well as the optimum moisture content of LFSG and CSG in accordance with the Chinese standard JTG E51-2009, and their determined values are presented in Table 7. The significantly higher unconfined compressive strength of CSG showed its higher pavement structural capacity than that of LFSG.

2.3. Test Methods

2.3.1. Dynamic Modulus Test

The dynamic modulus of LFSG and CSG was evaluated by using a Universal Testing Machine with the maximum force of 10 kN (UTM-100, IPC global Co., Ltd., Milan, Italy). The dynamic modulus of the stabilized material is defined as the ratio of the axial stress to the recoverable axial strain. Before testing, cylinder specimens with dimensions of φ 150 mm × 150 mm were first prepared by using a static pressing method according to the predetermined moisture dosage and maximum dry density. Then, these specimens were put in a curing chamber with a curing temperature of (20 ± 2) °C and humidity of >95% (T 0845-2009). The dynamic modulus of the stabilized material specimens was measured at a temperature of 20 °C and loading frequency from 0.1 to 25 Hz. During testing, the UTM loading head generated a sinusoidal loading wave and the strain level was controlled at 25 µm. The stress was recorded by the UTM stress sensor (UTM-100, IPC, Milan, Italy) and the strain was measured by the Linear Variable Differential Transformer (LVDT, UTM-LVDT, IPC, Milan, Italy) attached on the specimen surface. The dynamic modulus of semi-rigid materials at different loading cycle and different frequency was calculated automatically by the UTM [14].

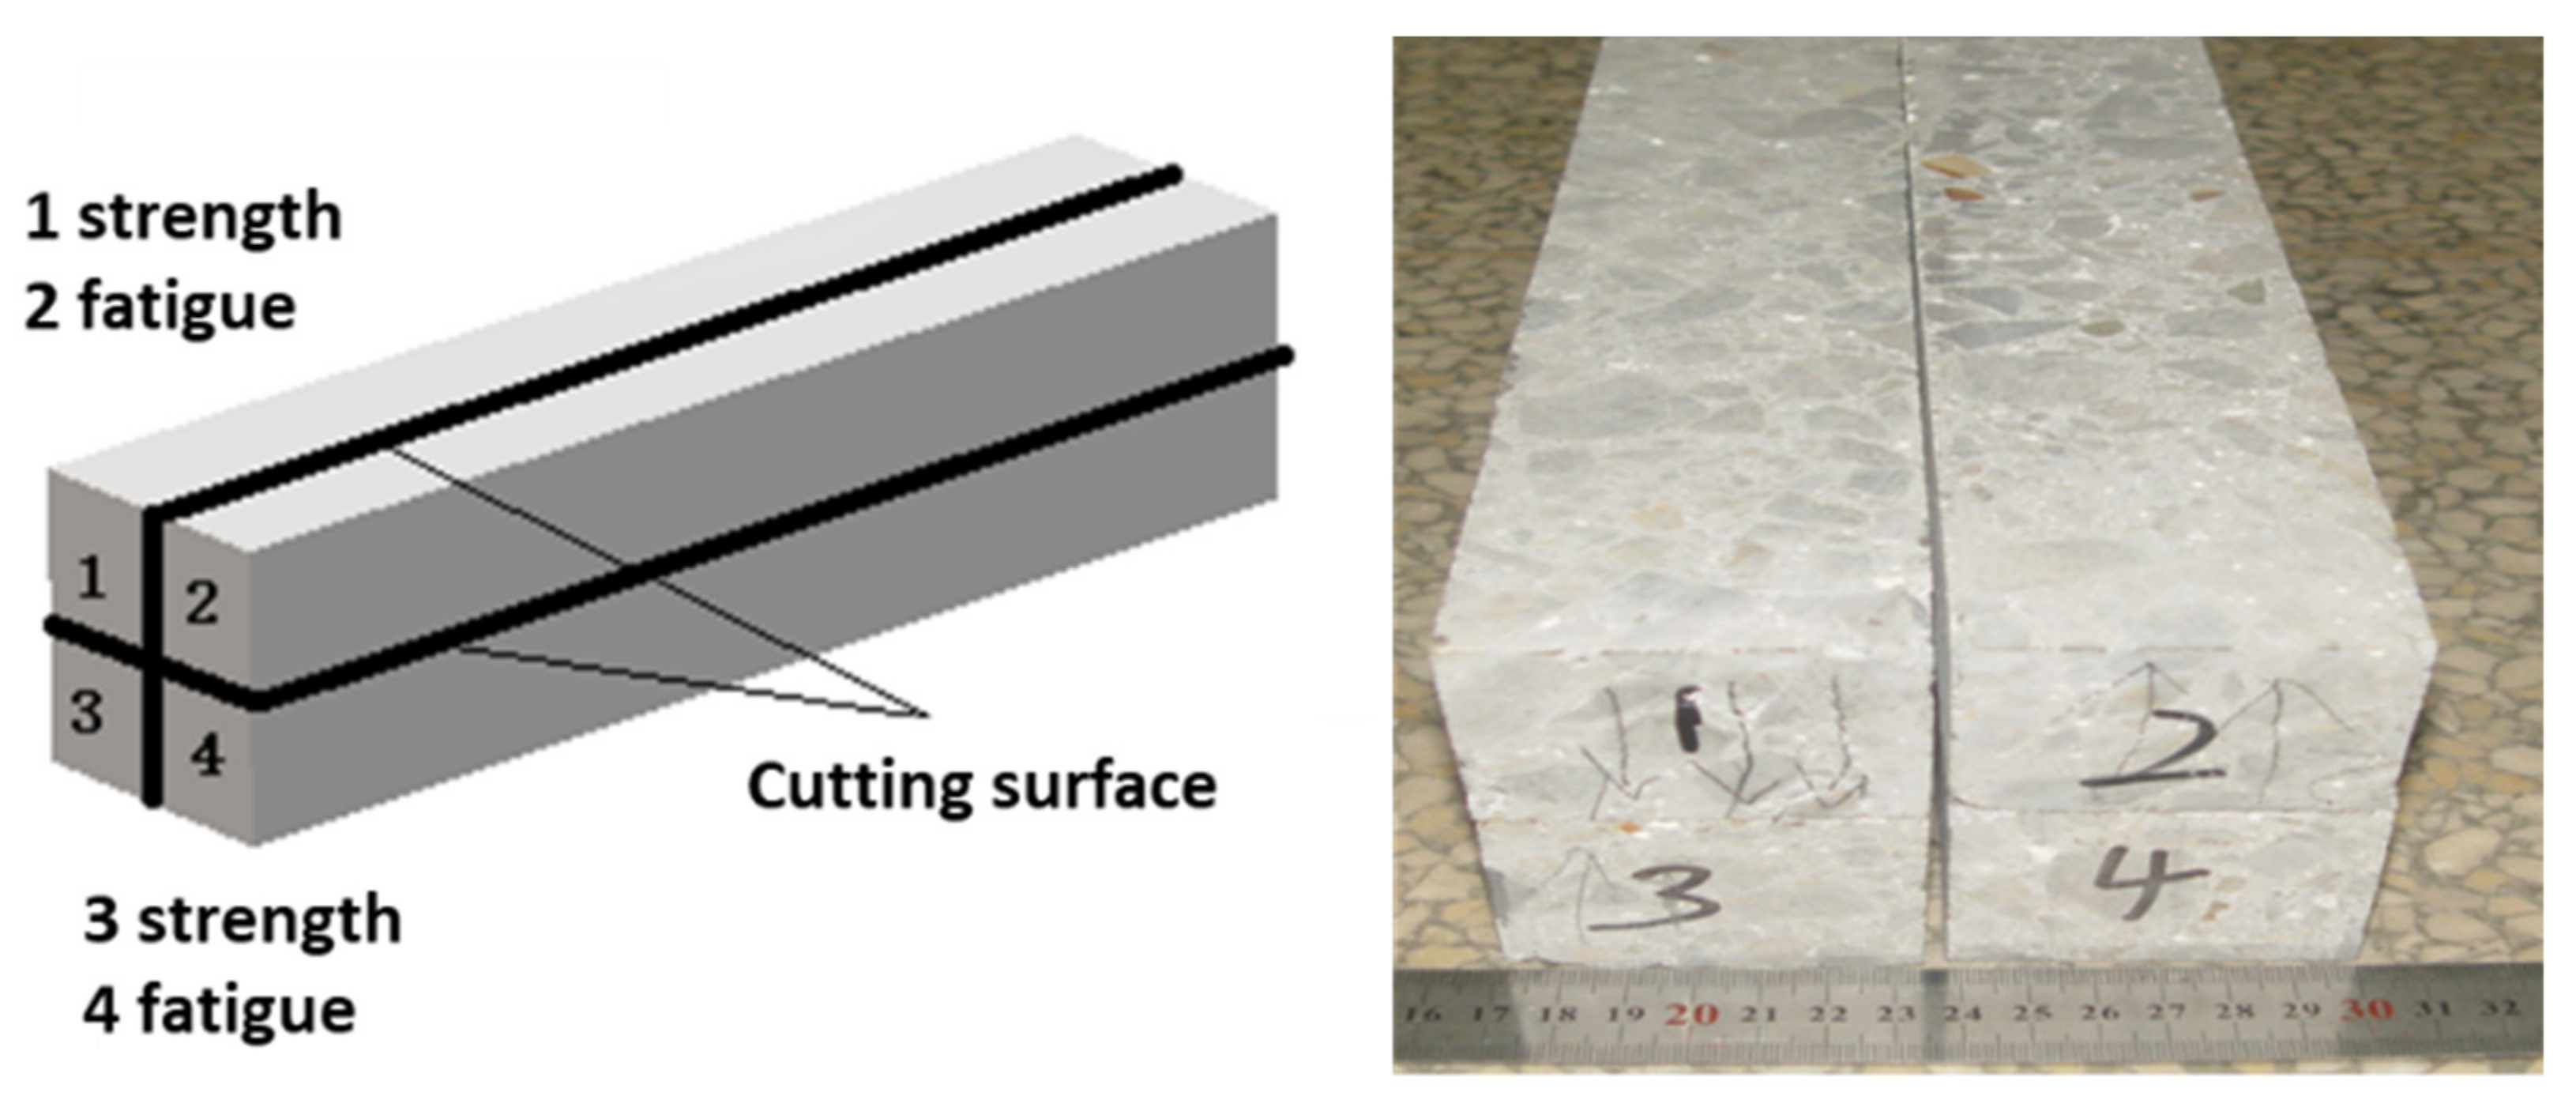
2.3.2. Four-Point Bending Fatigue Test

Fatigue cracking is a major type of distress observed in pavements and the fatigue resistance of semi-rigid road base material plays an important role in the service duration of asphalt pavements. The four-point bending is a commonly used test to assess the fatigue life of asphalt mixtures. According to the JTG E51-2009 standard, the fatigue resistance of CSG and LSFG was carried out after 90 d age and 180 d age, respectively. Before testing, beam specimens with dimensions of 380 mm × 63.5 mm × 50 mm need to be prepared. Big semi-rigid road base material beams with dimensions of 150 mm × 150 mm × 550 mm were first prepared and then separated by cutting machine to obtain required dimensions. With the view of neglecting the dispersion of test results, two beam specimens from the same layer were performed for flexural-tensile strength and fatigue evaluation, respectively, as shown in Figure 1.
The flexural-bending strength of CSG and LSFG was evaluated by using a three-point pressure at a constant loading rate of 50 mm/min and the detailed procedure was described in the JTG E51-2009 standard. Four replicate tests were performed on each stabilized material. Based on this test, the ultimate failure load was recorded and the flexural-bending strength was calculated according to Equation (1). This parameter provides a standard index for the determination of loading level in the fatigue test.
R s = P L b 2 h
where, Rs is the flexural-bending strength (MPa), P is the ultimate failure load (N), L is the span of the beam (mm), b is the width of the beam (mm), and h is the height of the beam (mm).
The four-point bending test was conducted using a Universal Testing Machine (UTM) at a controlled stress mode to evaluate the fatigue resistance of semi-rigid materials. The target stress–strength ratios of LSFG were 0.6, 0.65, 0.7 and 0.75, while the target stress ratios of CSG were 0.55, 0.6, 0.65 and 0.7. Six replicate tests were performed at each stress ratio. Before testing, samples need to be conditioned at the target temperature (20 °C) for at least 4 h. During testing, a sinusoidal loading pattern was induced to the specimen at a loading cycle frequency of 10 Hz. The failure life was defined when the beam specimen was brittle break. Physical parameters such as the initial flexural modulus (MPa), initial flexural strain (µm), critical failure flexural modulus (MPa), and flexural fatigue life (times) were calculated automatically by the UTM.

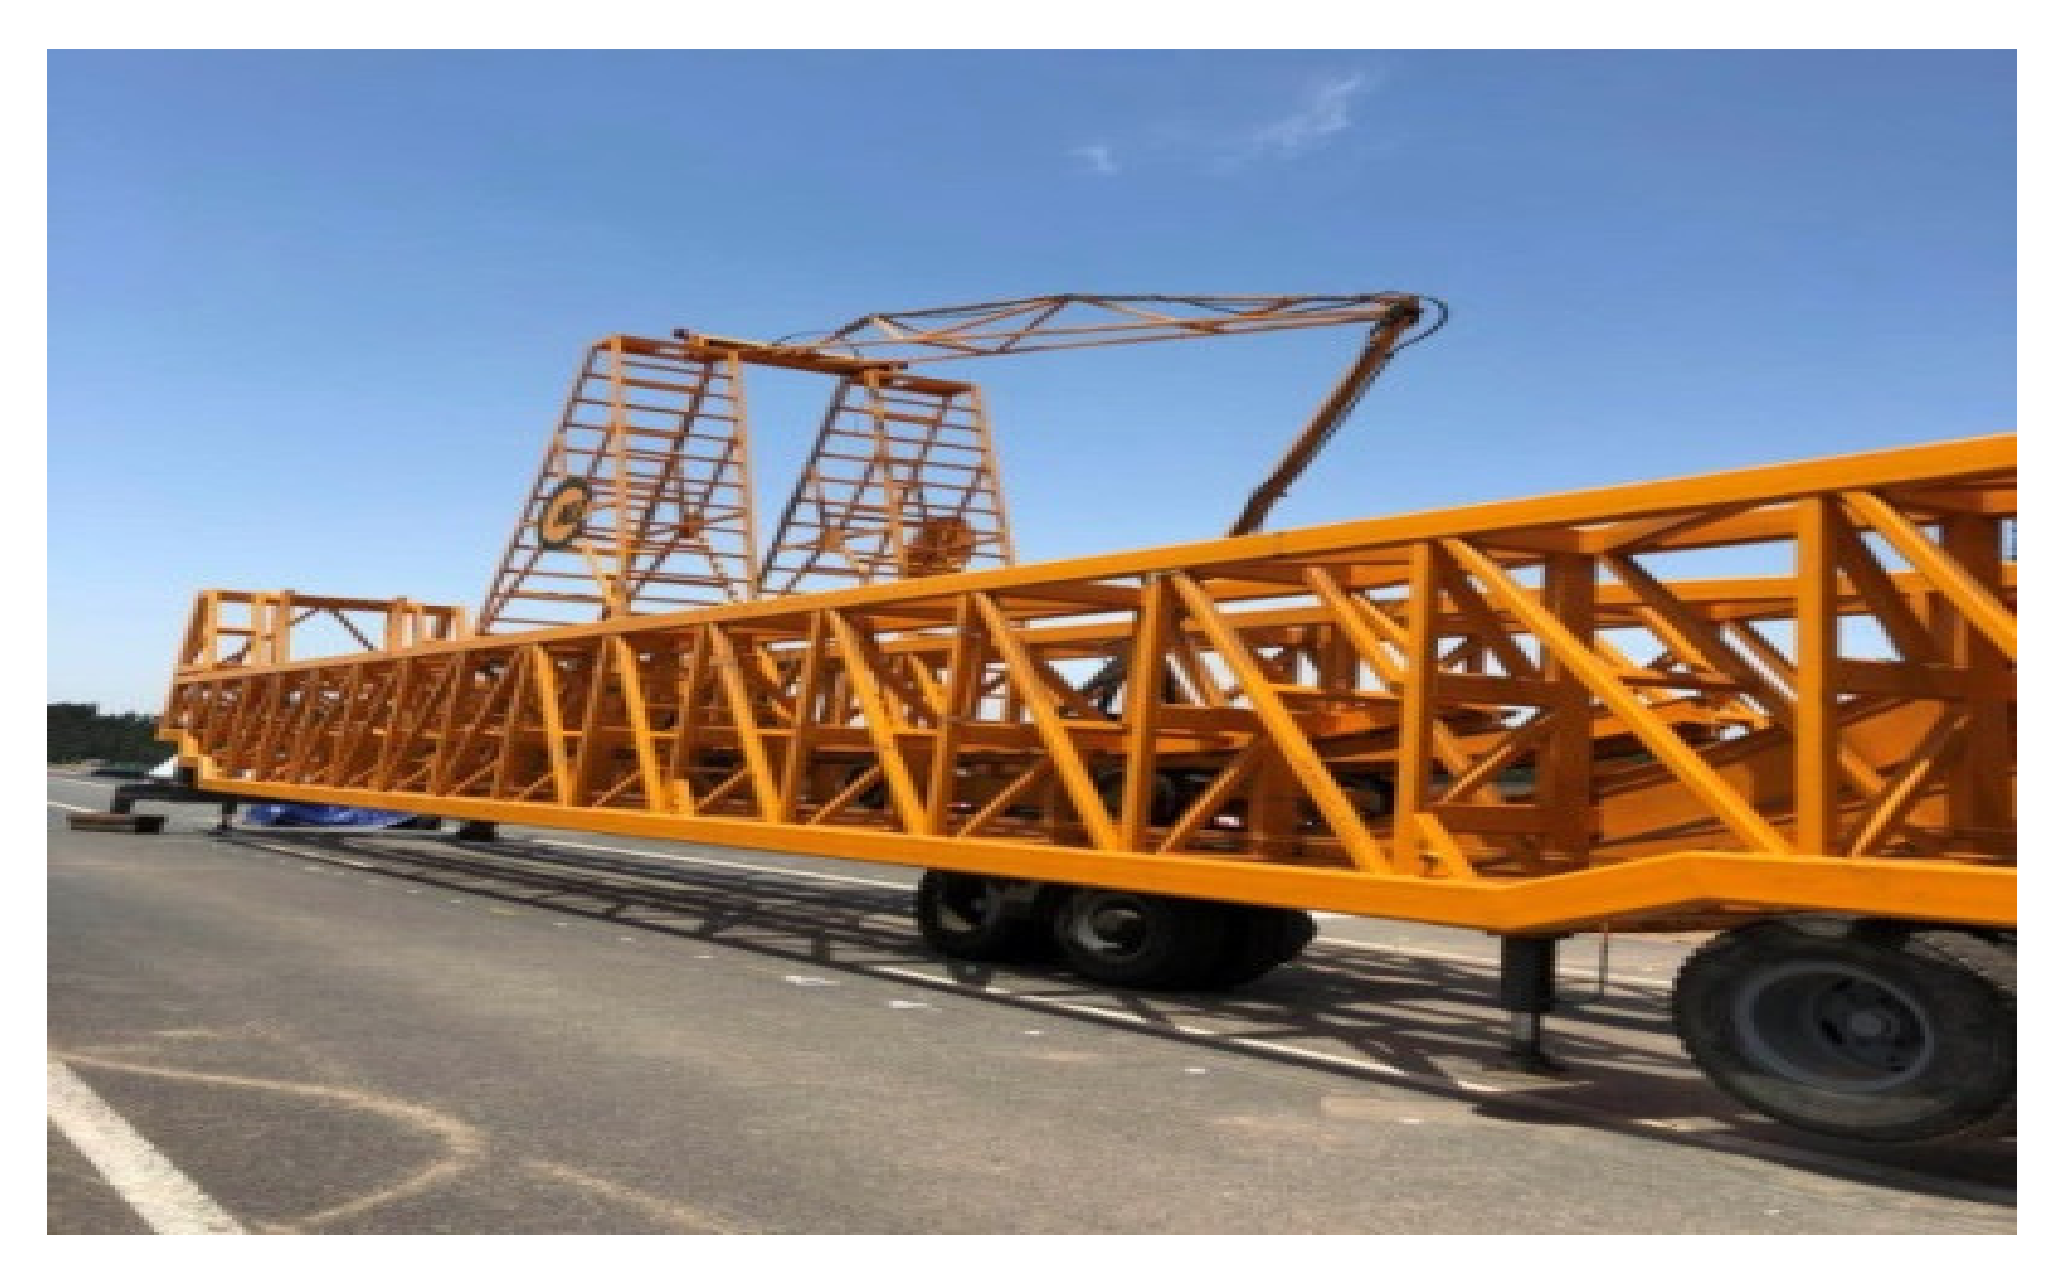
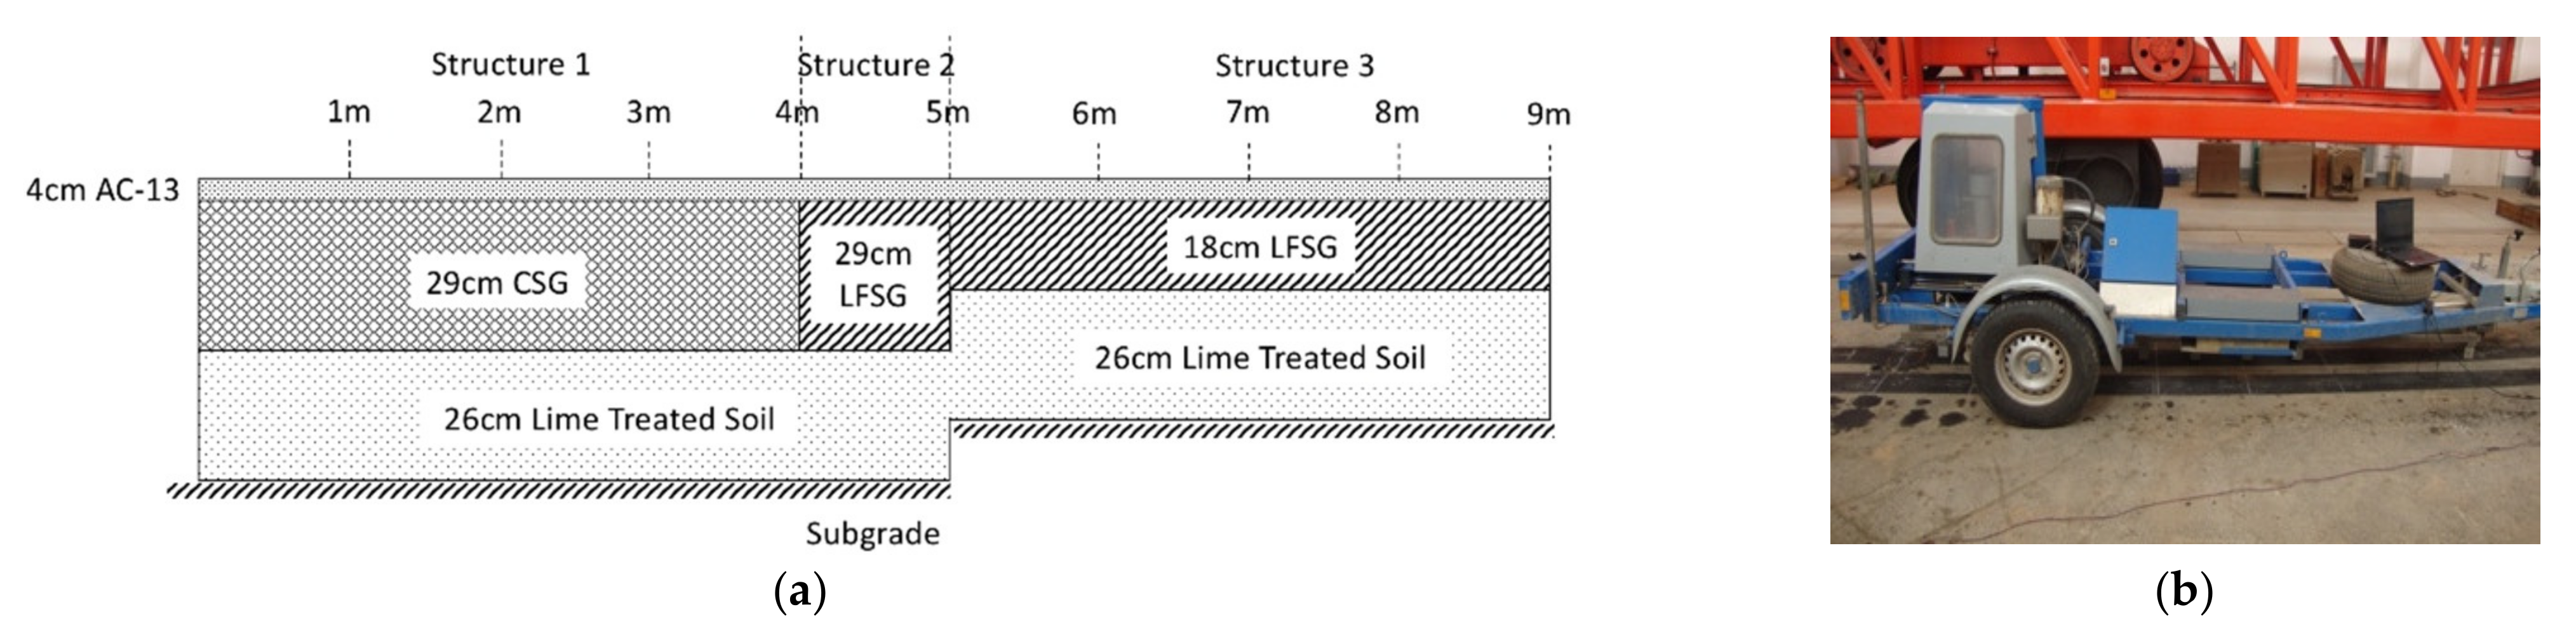
2.3.3. Full-Scale Accelerated Loading Test

In order to investigate the fatigue deterioration and verify the fatigue model of semi-rigid road base materials in the full-scale pavement, the accelerated loading test was performed [24]. The full-scale accelerated loading test was conducted on an experimental road in Jinan, China. The accelerated loading system was employed to induce fatigue damage for the experimental CSG and LFSG materials. The dimensions of the accelerated loading system are 26.24 × 3.48 × 7.92 m. A 20.2 t axle load with dual-tire wheels and 1.15 MPa tire pressure was applied to the experimental pavement at an average speed of 23 km/h, as shown in Figure 2. In each day, around 50,000 loading passes were applied.
The full-scale pavement had three different pavement structures with CSG and LFSG, as shown in Figure 3. The thicknesses of the pavement layers in Structure 1 and 2 included 40 mm of asphalt surface layer and 290 mm of CSG or LFSG base over a 260 mm of subgrade treated with lime soil. The thicknesses of the pavement layers in Structure 3 included 40 mm of asphalt surface layer and 180 mm of LFSG base over a 260 mm of subgrade treated with lime soil.
The pavement deflection was detected after every 70,000 loading cycles by Dynatest 8000, Falling Weight Deflectometer (FWD, Dynatest 8000, Ballerup, Denmark). As shown in Figure 3, three different pavement structures were prepared and their deflection on the wheel pass was detected. The diameter of FWD-bearing plates is 30 cm. FWD had nine deflection sensors and three levels of loading with 566, 707 and 848 kPa, respectively. The modulus of CSG and LFSG bases was back calculated by the pavement deflection using SIDMOD software (version 1.0, Zhengzhou University, Zhengzhou, China).

3. Results and Discussion

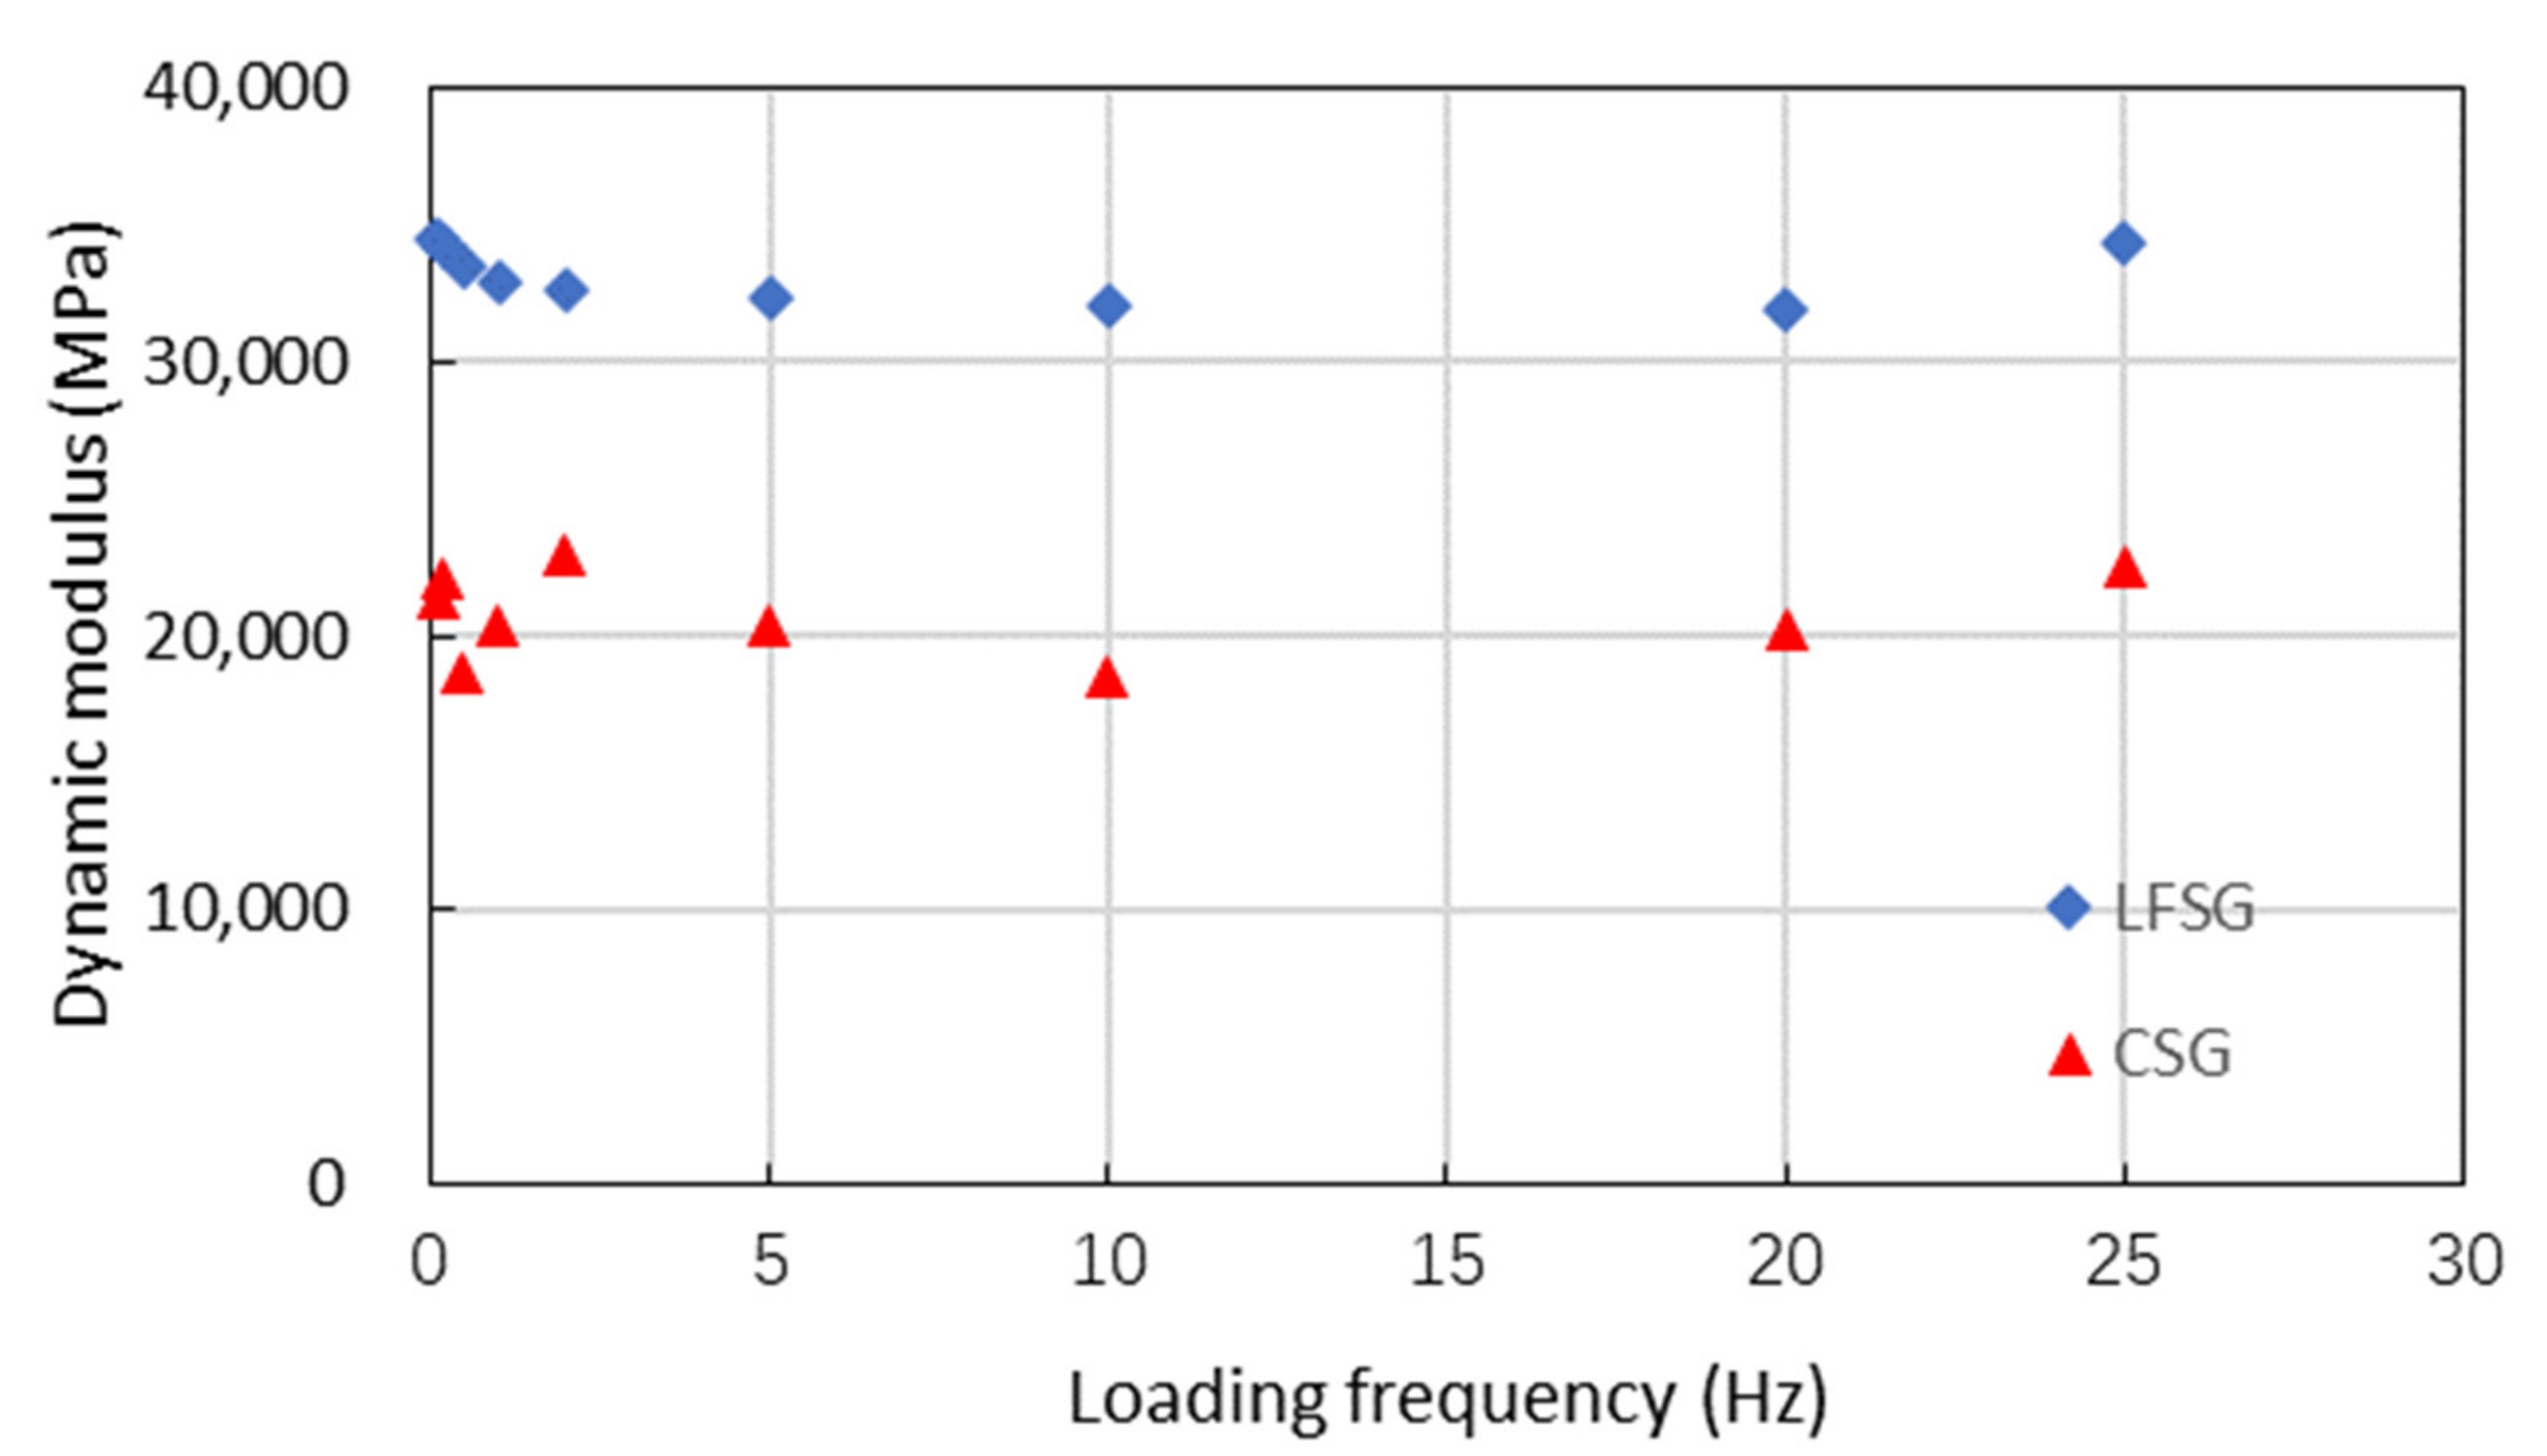
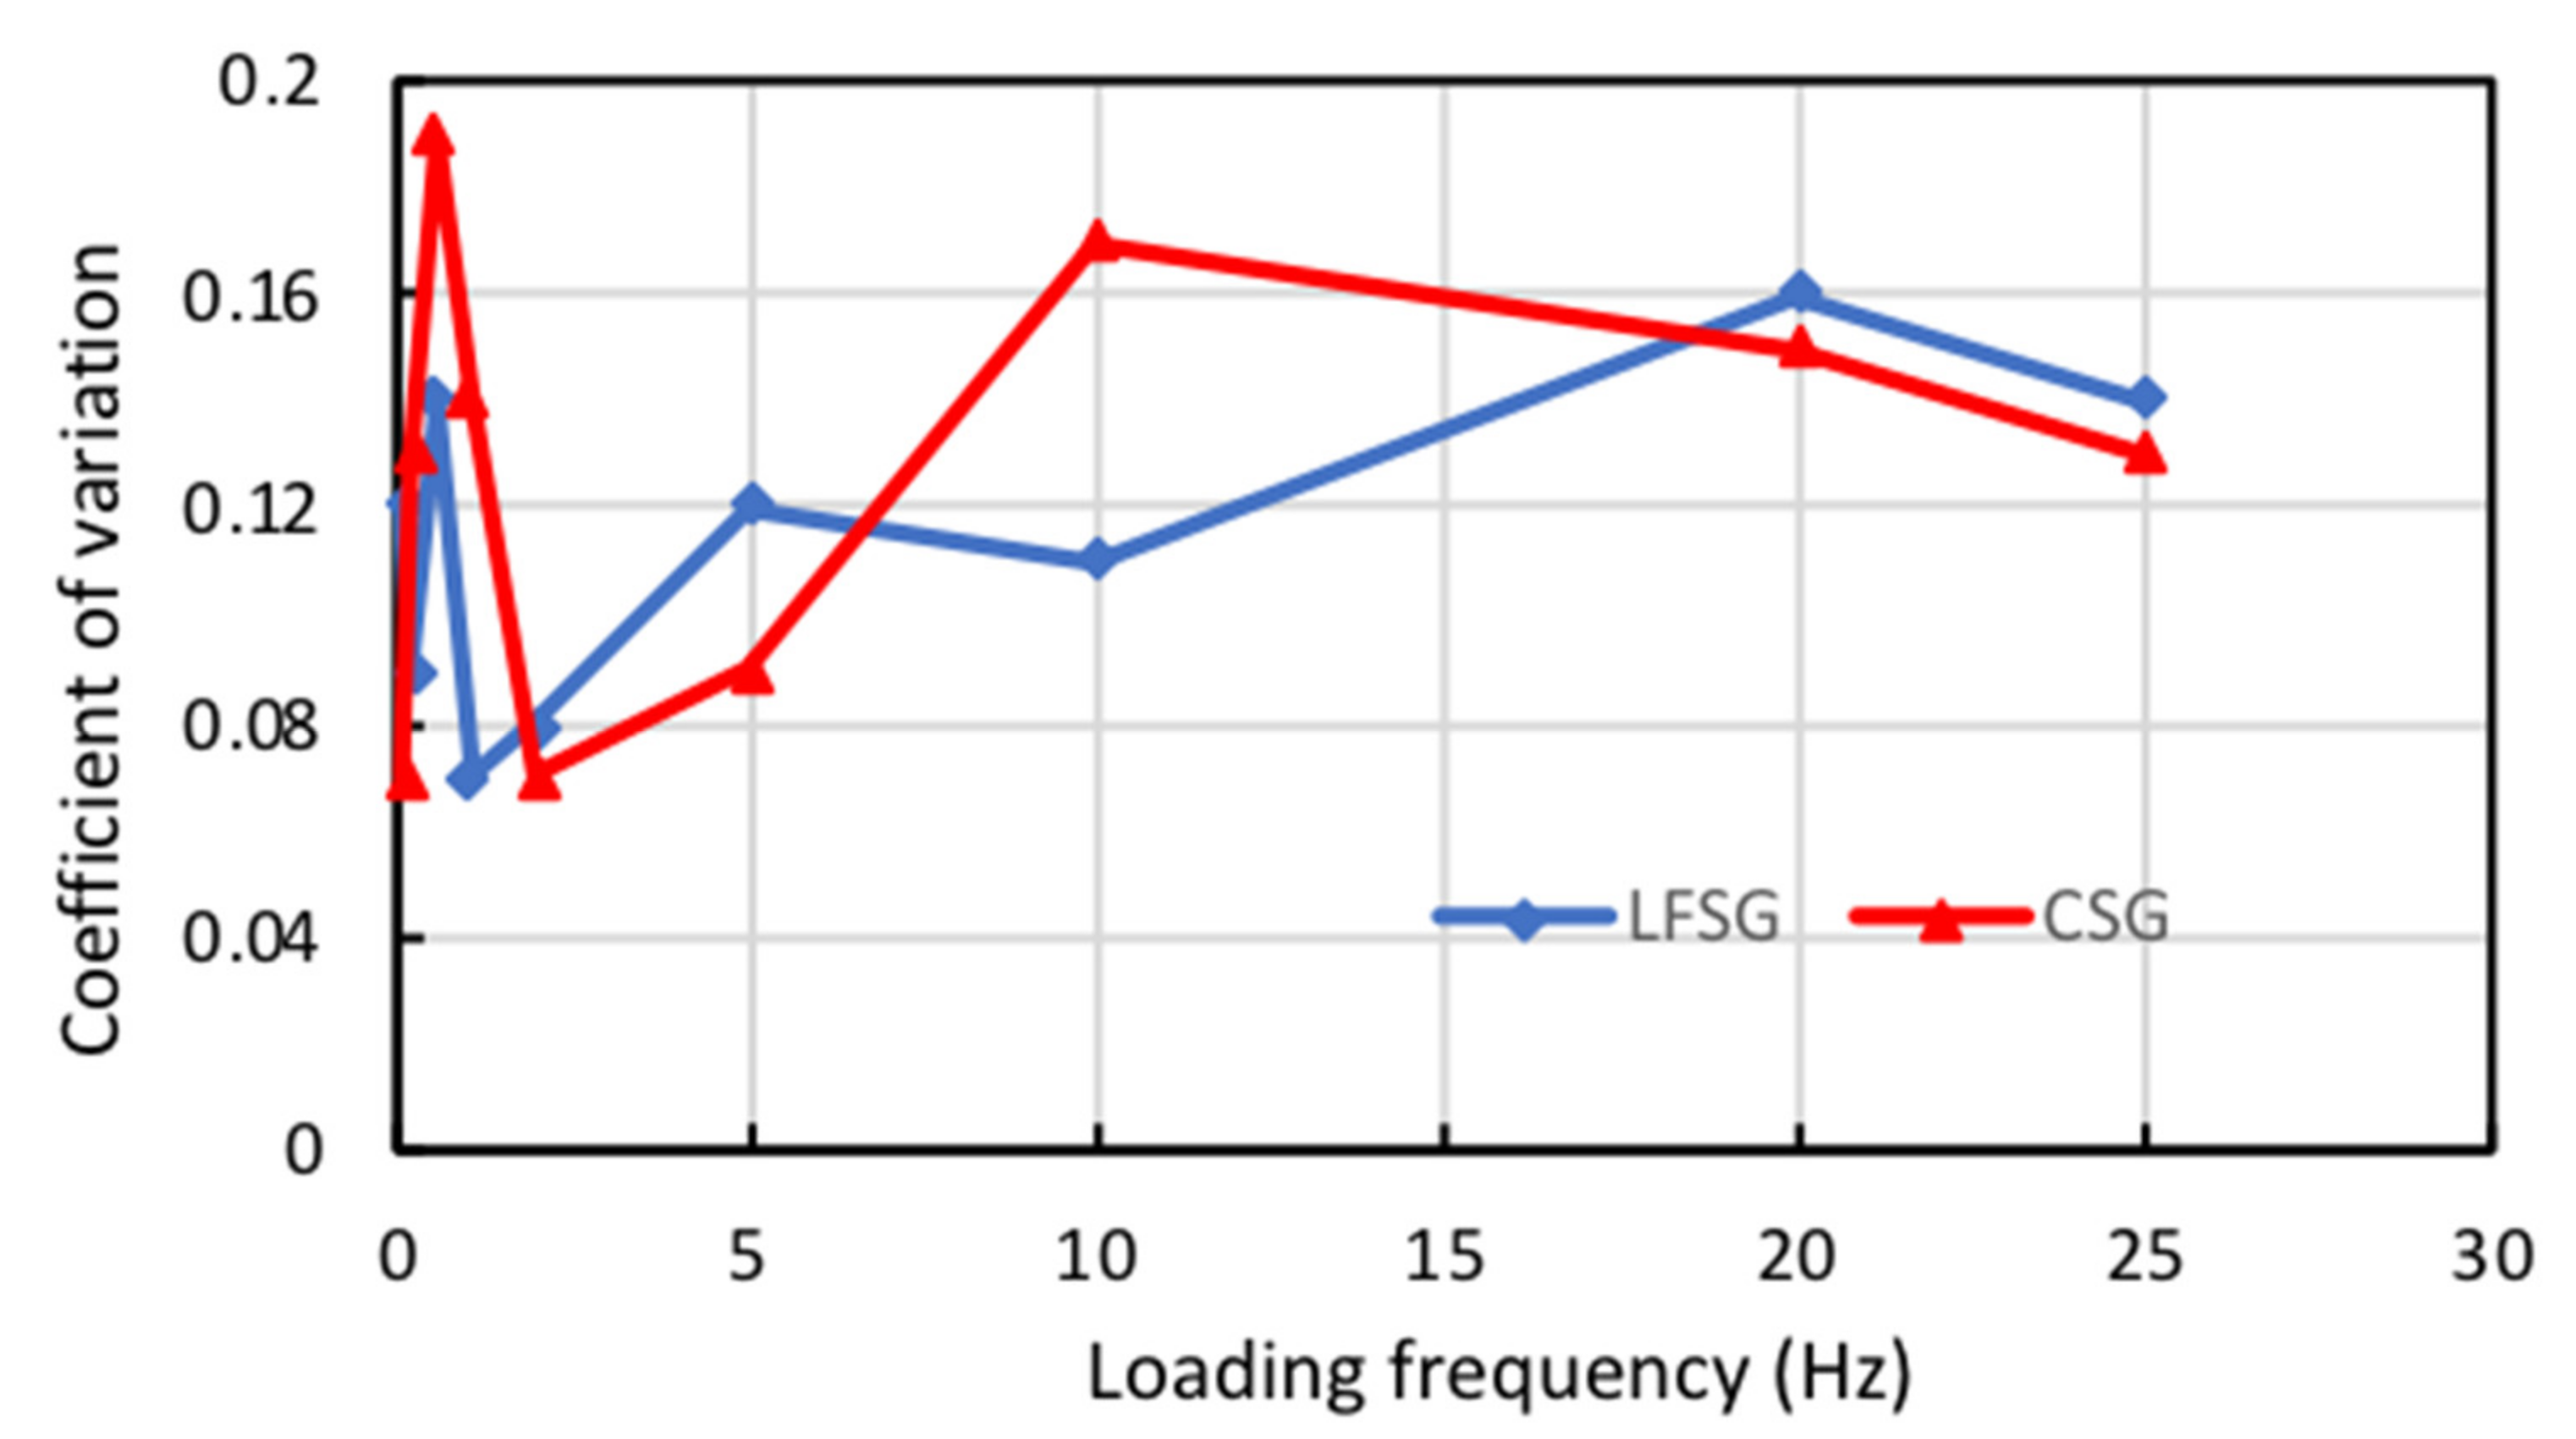
3.1. Dynamic Modulus of LFSG and CSG

The dynamic modulus of LFSG and CSG at different loading frequencies was measured and the results are presented in Figure 4. The coefficient of variation (the ratio of standard deviation to the average value) of the dynamic modulus of LFSG and CSG is shown in Figure 5.
As shown in Figure 4, the dynamic modulus of LFSG is in the range of 32,000–35,000 MPa, which is obviously higher than that of CSG with the values between 18,000 and 22,000 MPa. This indicates the LFSG road base course can generate less vertical strain than that of CSG under the same loading level. This can supply two benefits to the pavement structure. Firstly, the traffic load can be transferred to the roadbed area more evenly and reduce the pressure in roadbed area. Secondly, less vertical strain of base course can reduce the strain level of upper asphalt surface, which in turn improves the fatigue life of the asphalt layer.
With respect to the same semi-rigid material, the influence of loading frequency on the dynamic modulus seems not obvious. After considering the coefficient of variation in Figure 5, the data fluctuation of dynamic modulus can be neglected. It indicates that the dynamic modulus of semi-rigid material remains unchanged at different frequencies.

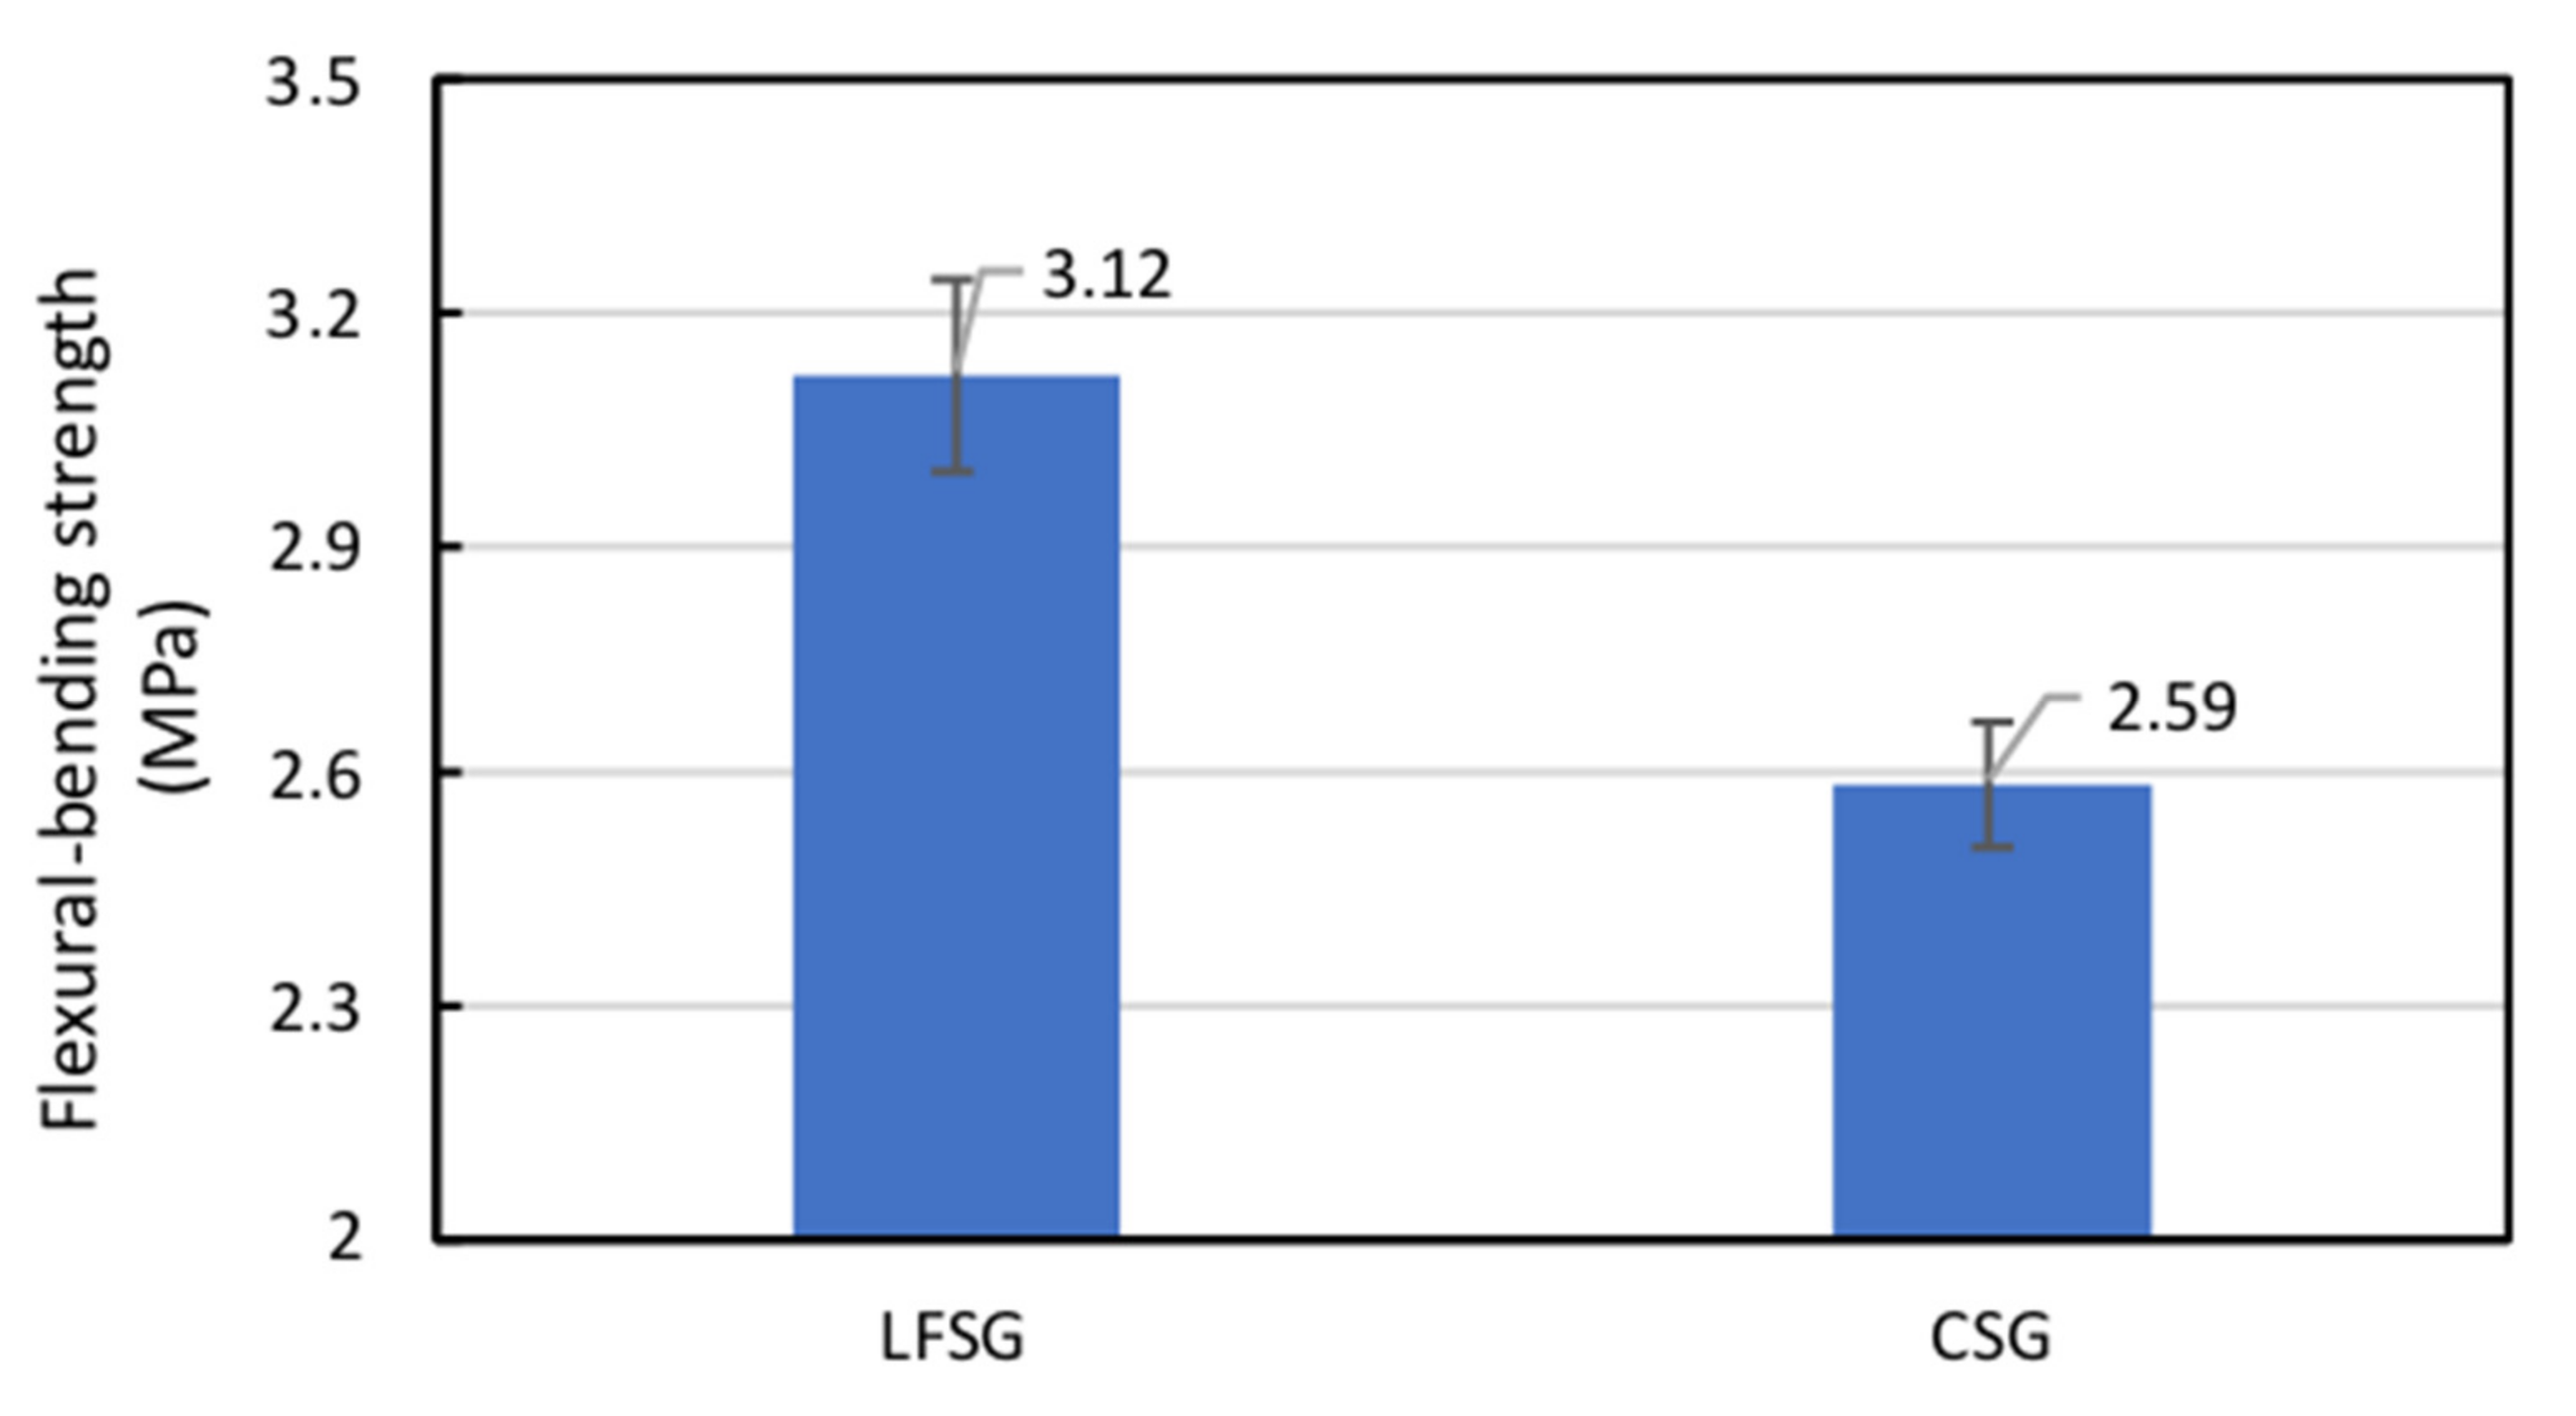
3.2. Flexural-bending Strength of LFSG and CSG

The flexural-bending strength of stabilized materials is an indicator of resistance to bending and tension in the pavement layer. Figure 6 presents the flexural-bending strengths of CSG and LSFG. It can be seen that the flexural-bending strength of LFSG is 3.12 MPa, which is higher than that of CSG, at 2.59 MPa. The higher flexural-bending strength of LFSG shows its better resistance to high traffic loading. When used for the base course of pavement, the LFSG can supply a higher bearing capacity than that of CSG, which in turn has better resistance to reflection crack.
As expected, based on previous studies [25], two types of CSG with the same cement contents had different flexural strength. The CSG in this study was 119% higher than the previous study. The result showed the flexural strength of CSG was influenced by different aggregate gradation.

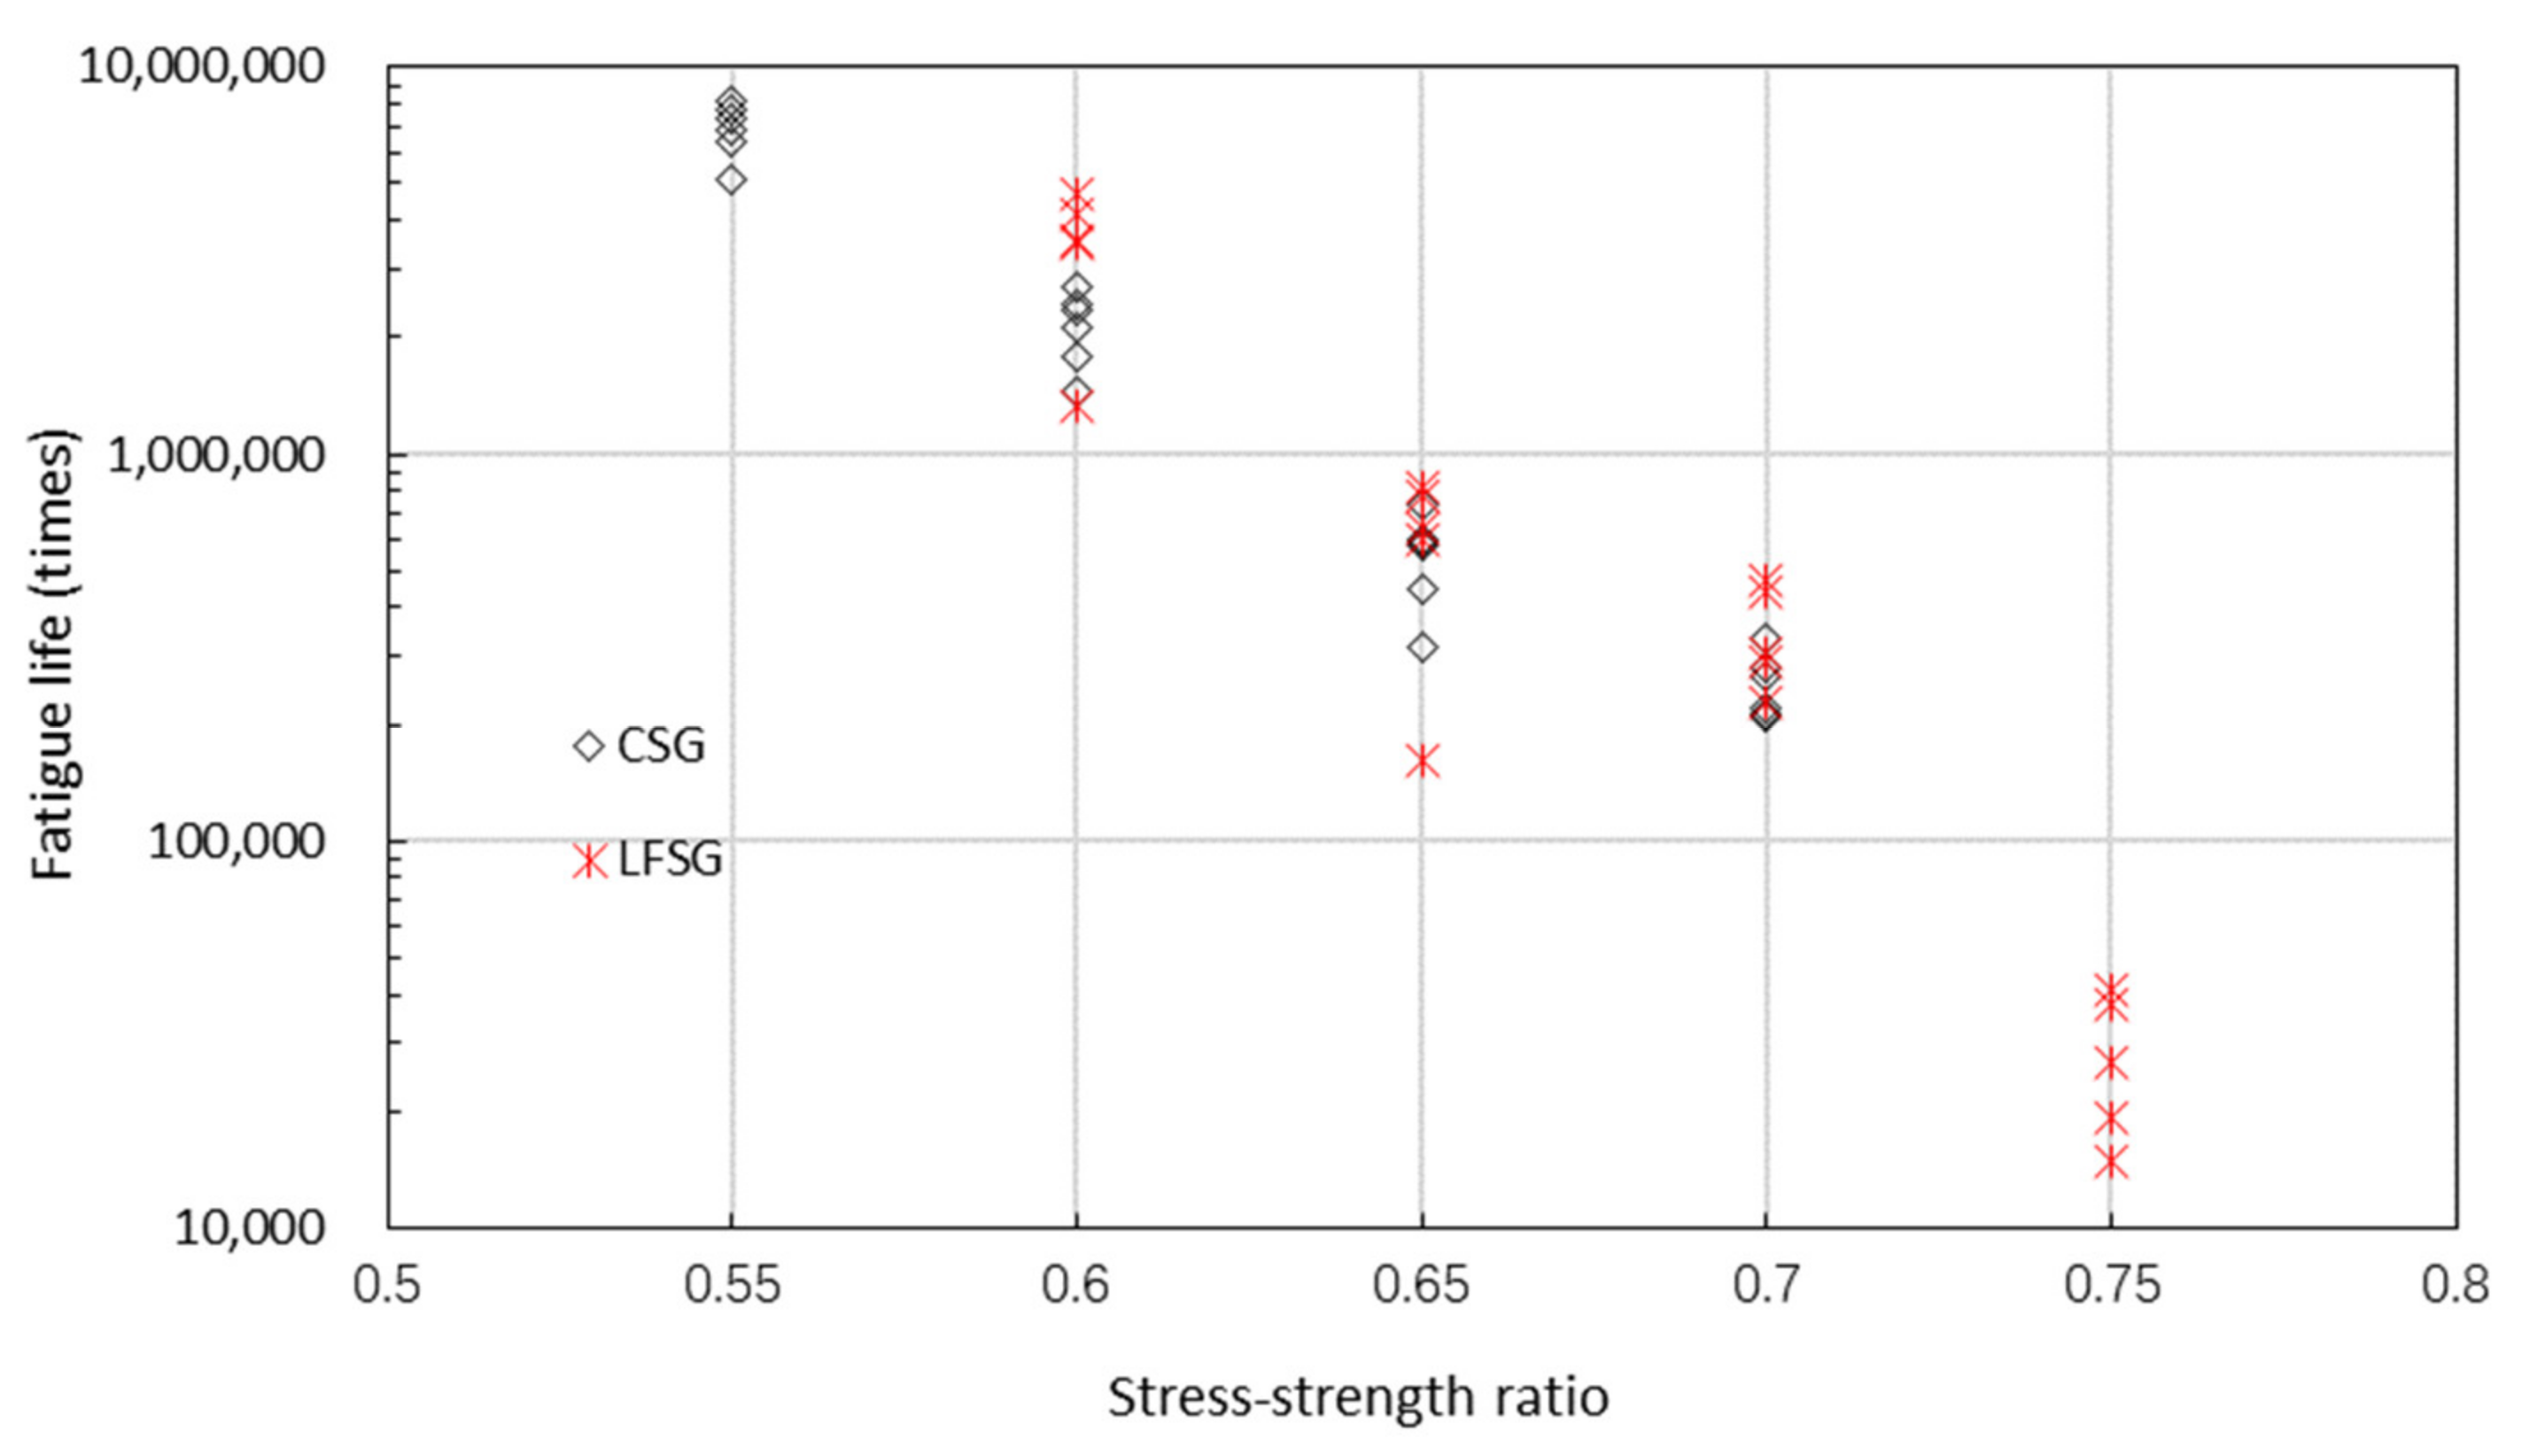
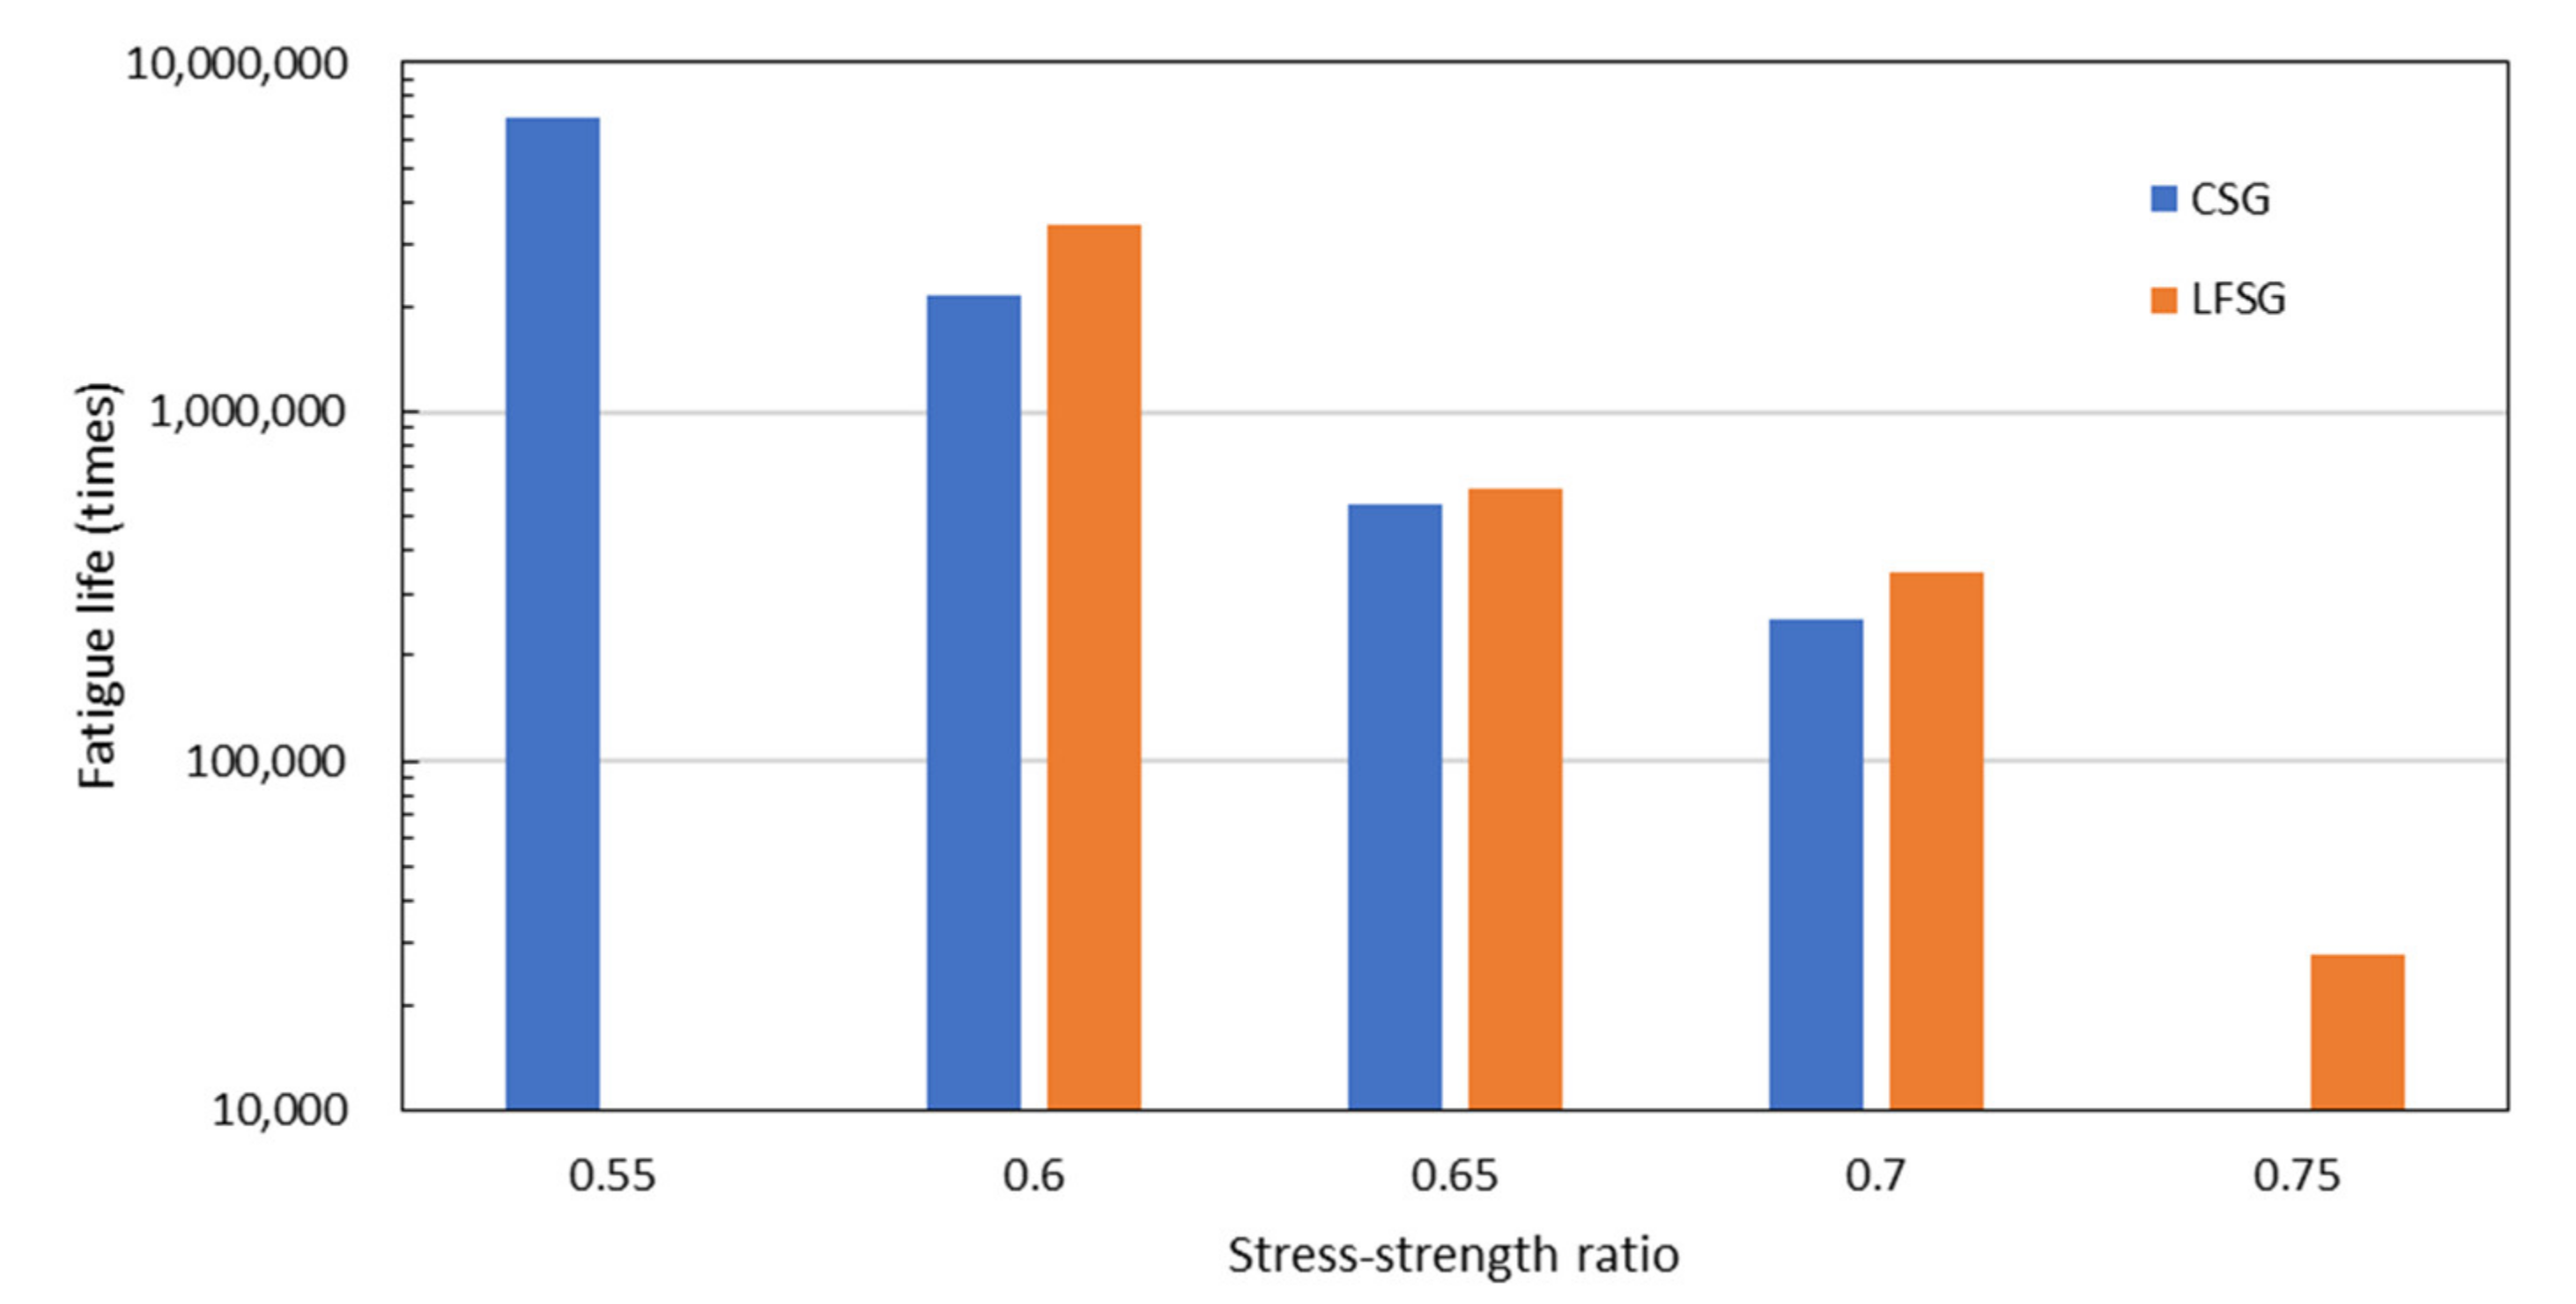
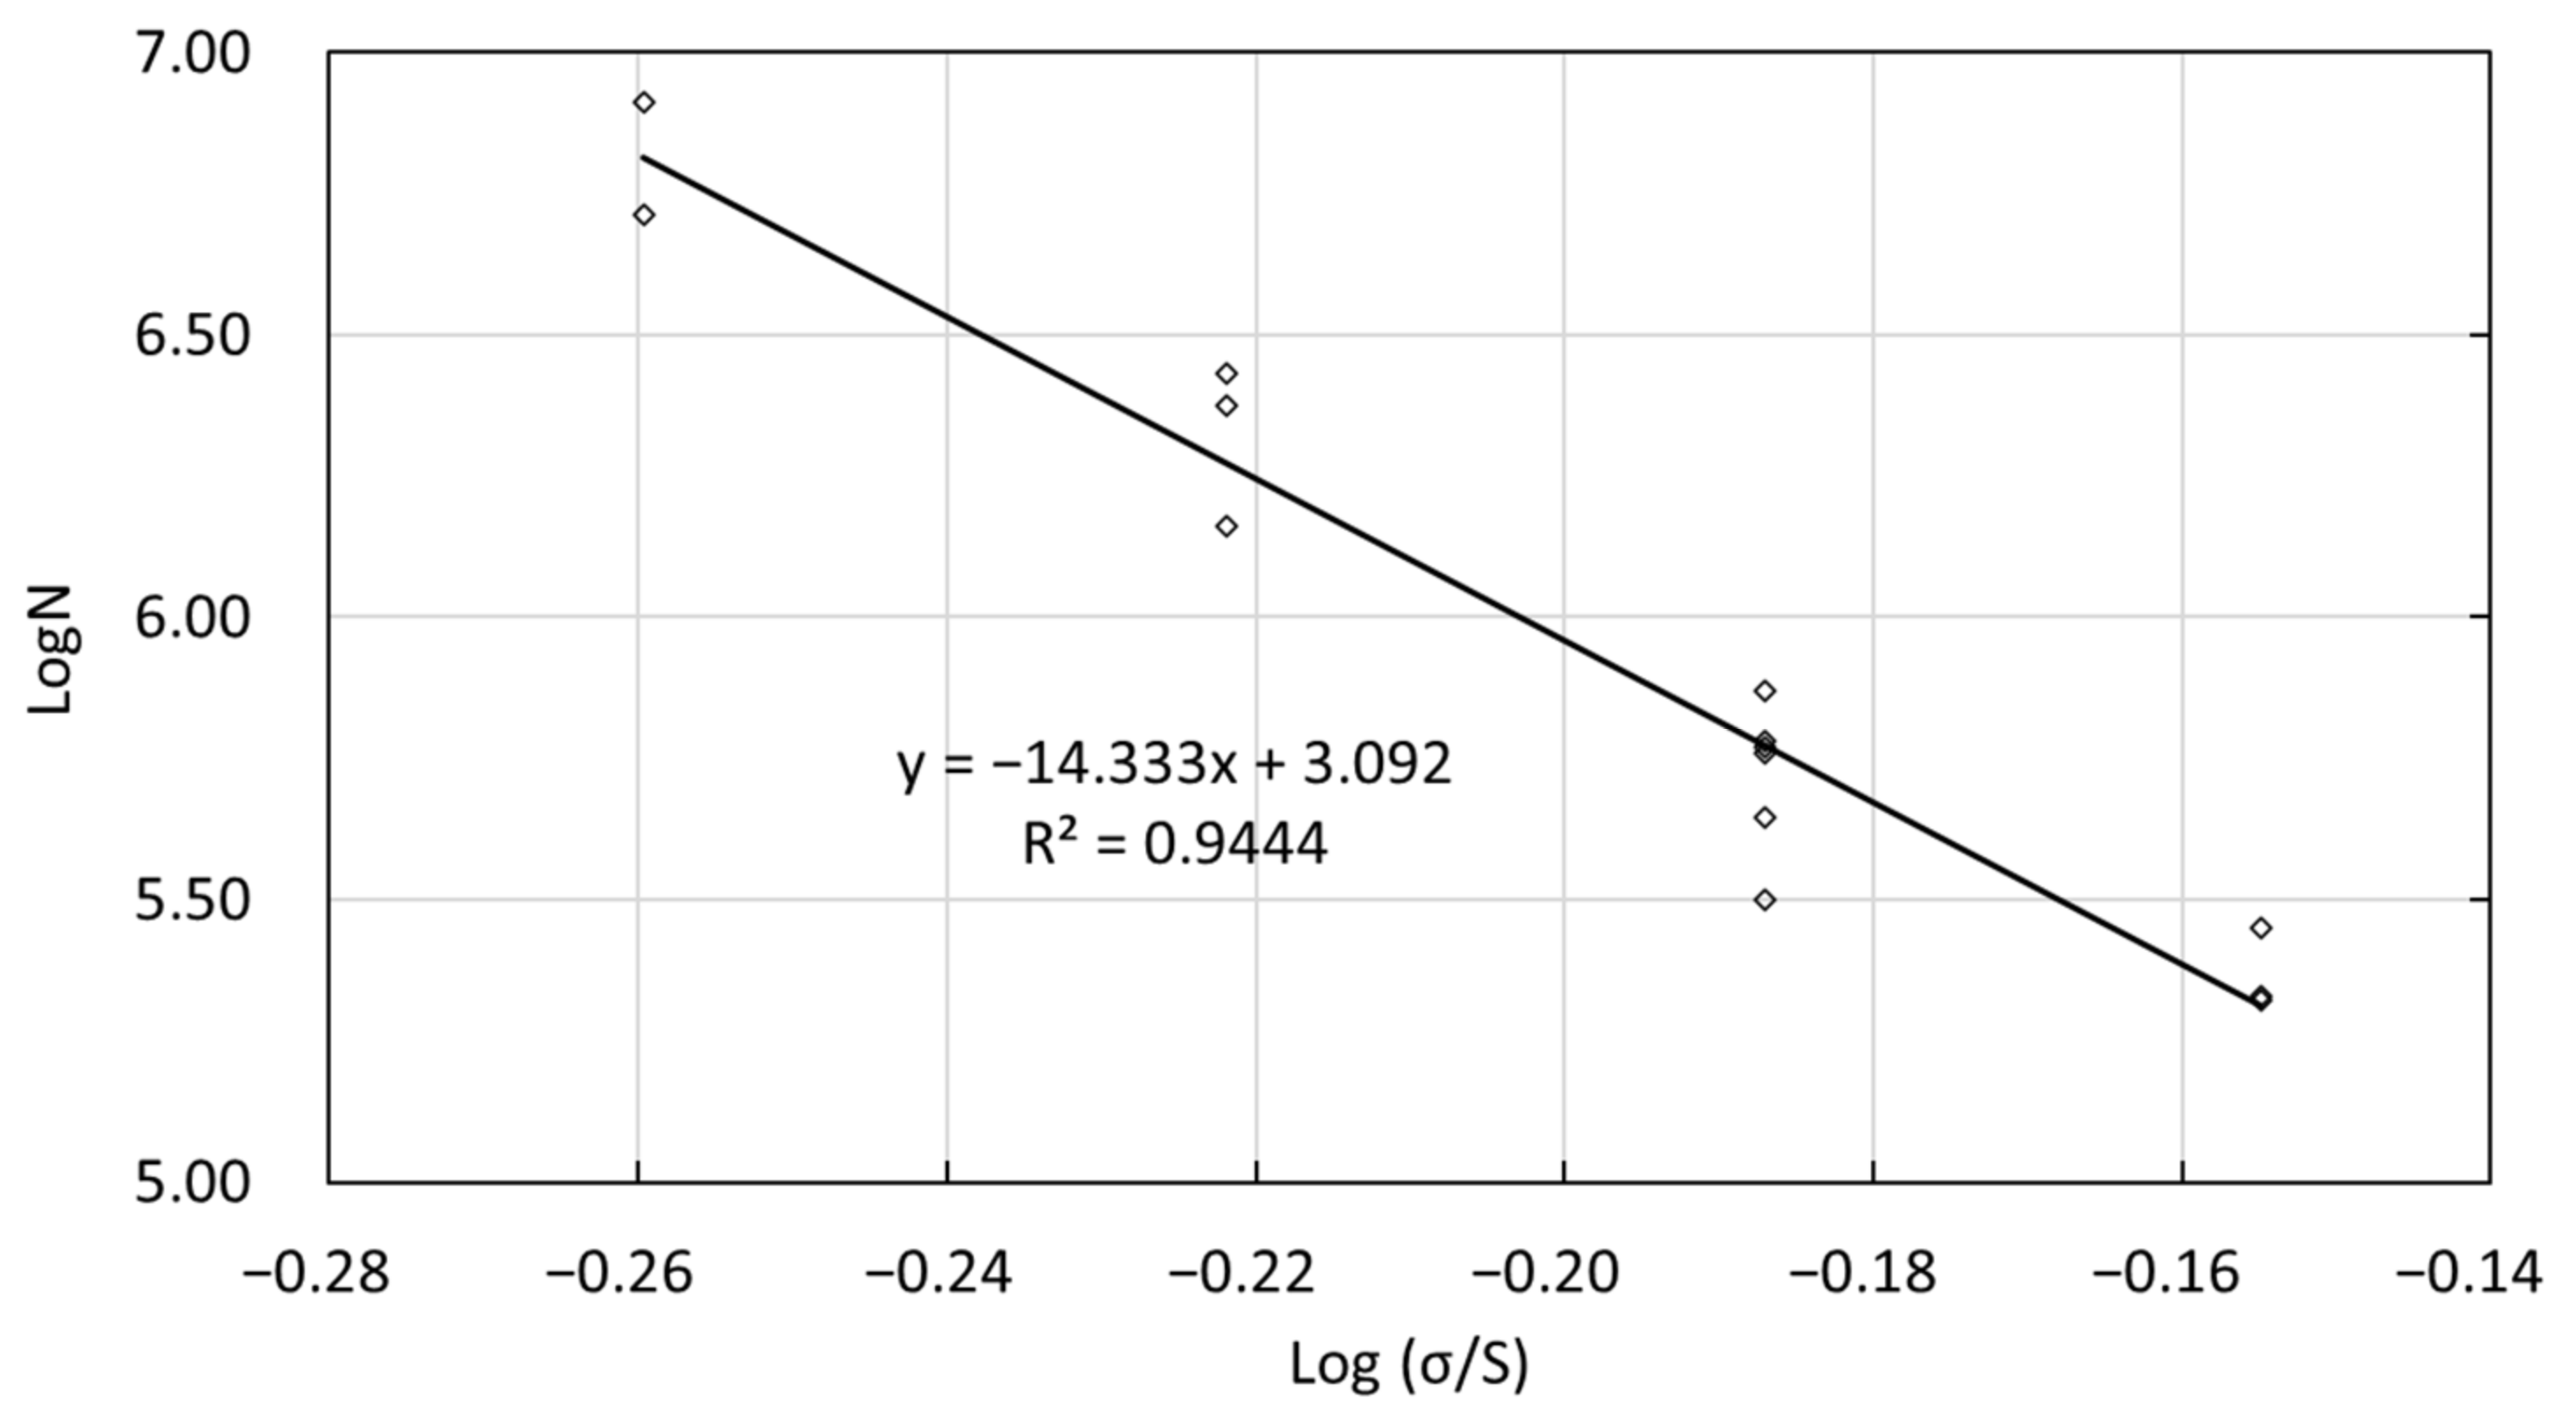
3.3. Fatigue Behavior of CSG and LSFG

In this research, the flexural stiffness at the 100th cycle of repeated loading was defined as the initial flexural modulus. This parameter reflects the capability of the beam to resist the flexural deformation. Figure 7 presents initial flexural modulus of CSG and LFSG. It can be found that the initial flexural modulus of CSG was higher than that of LFSG at any stress–strength level, which indicates better resistance of CSG to the flexural deformation. With respect to the same stabilized material, the initial flexural modulus first increased with the increase of stress–strength ratio and followed by a rapid decline once the peak value reached. This is because high stress level may cause potential damage of stabilized material, which in turn decrease the flexural stiffness. Based on the curves presented in Figure 7, the peak initial flexural modulus value of CSG occurs at the stress–strength ratio of around 0.65, while the LFSG reached to the peak initial flexural modulus at the stress–strength ratio of around 0.675. This means that the LFSG is more flexible than CSG. In combined with the analysis in Figure 6, the LFSG has both better ability of deformation and toughness.
In this research, the fatigue life of the stabilized material beam was defined as the occurrence of brittle fracture. Figure 8 shows the fatigue life of CSG and LFSG and the average fatigue life of these two materials was presented in Figure 9. As shown in Figure 8, the fatigue life of these two stabilized materials decreased with the increase of stress–strength ratio. The stress level significantly influenced the fatigue life of these two materials. It was found that a higher traffic load will accelerate the fatigue deterioration of the stabilized materials in the road base course. With respect to the same stress–strength ratio, some fatigue life values of these two materials nearly overlapped. With respect to the average fatigue life in Figure 9, the influence of stress level on the fatigue life is obvious. For instance, when the stress ratio increased from 0.6 to 0.65, it can result in around a five-times decline of the fatigue life. As for these two materials, the LFSG obtained slightly higher fatigue life than that of CSG under the same stress ratio. It is suggested that the LFSG is expected to be more fatigue-resistant than CSG. This phenomenon is well corresponded to the initial flexural modulus in Figure 7. It is demonstrated that stabilized materials with more flexibility have a positive effect on its fatigue resistance.

3.4. Analysis on Fatigue Damage of Semi-rigid Road Base Materials

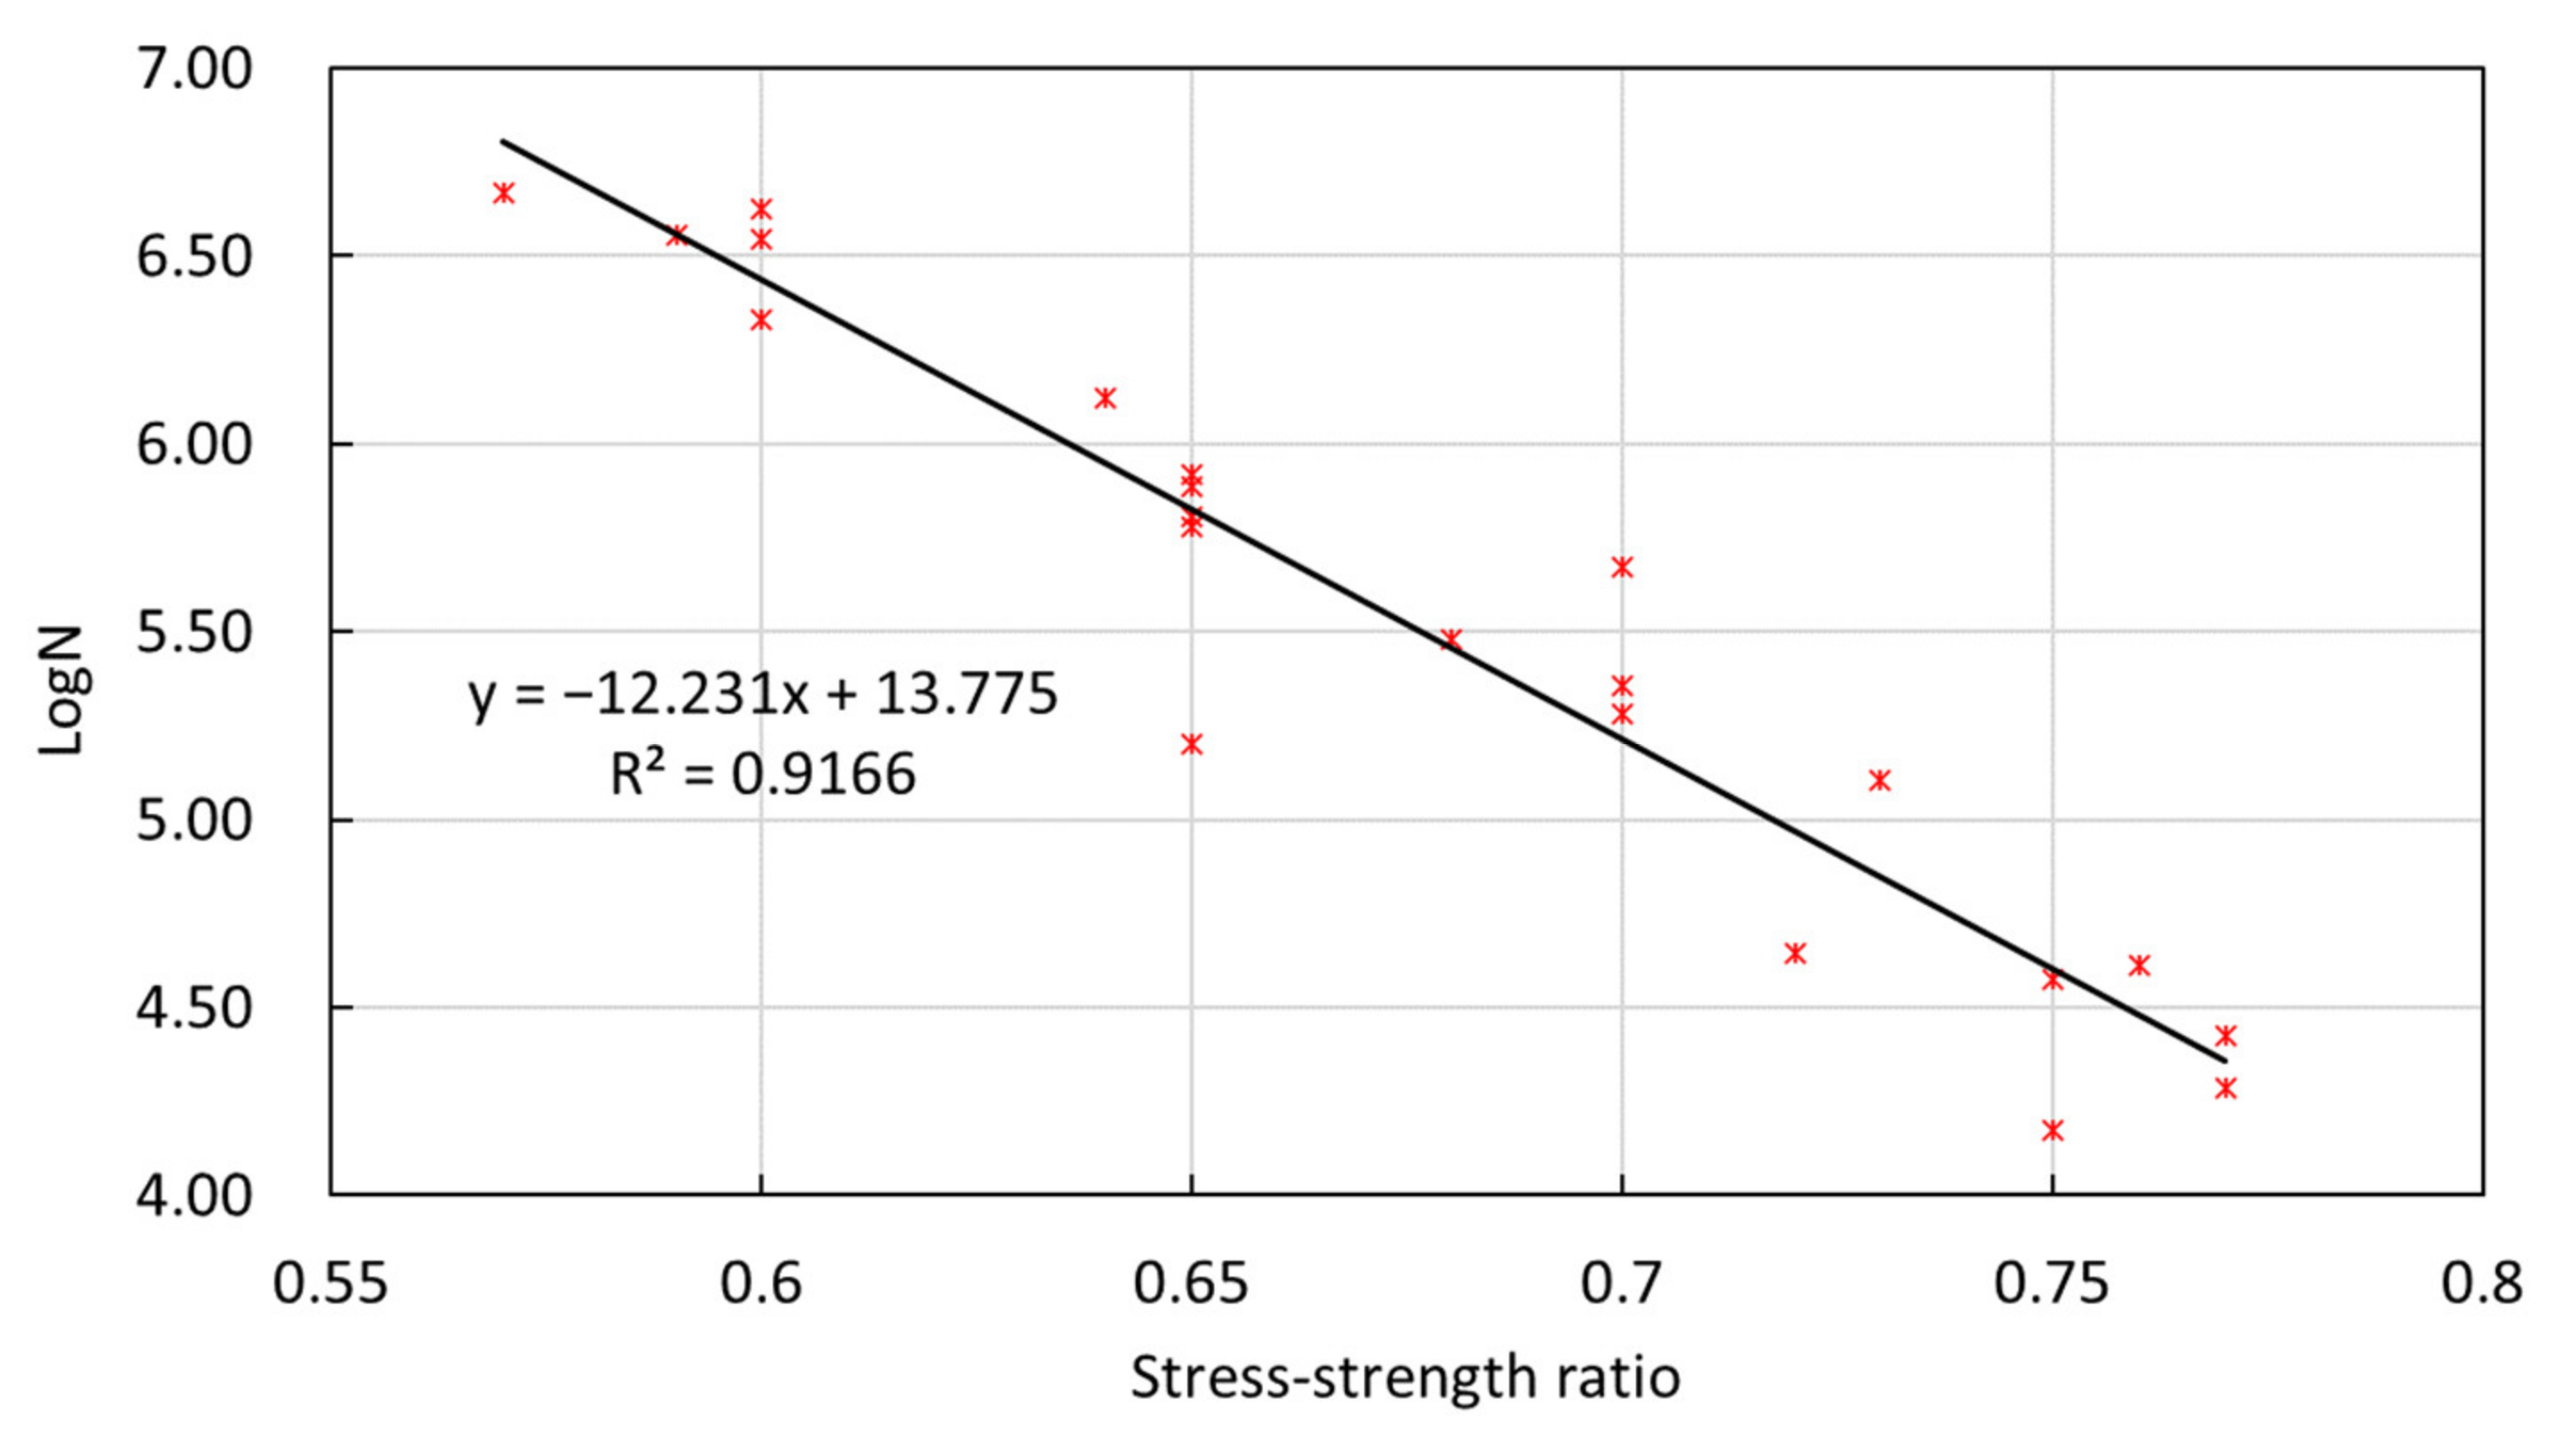
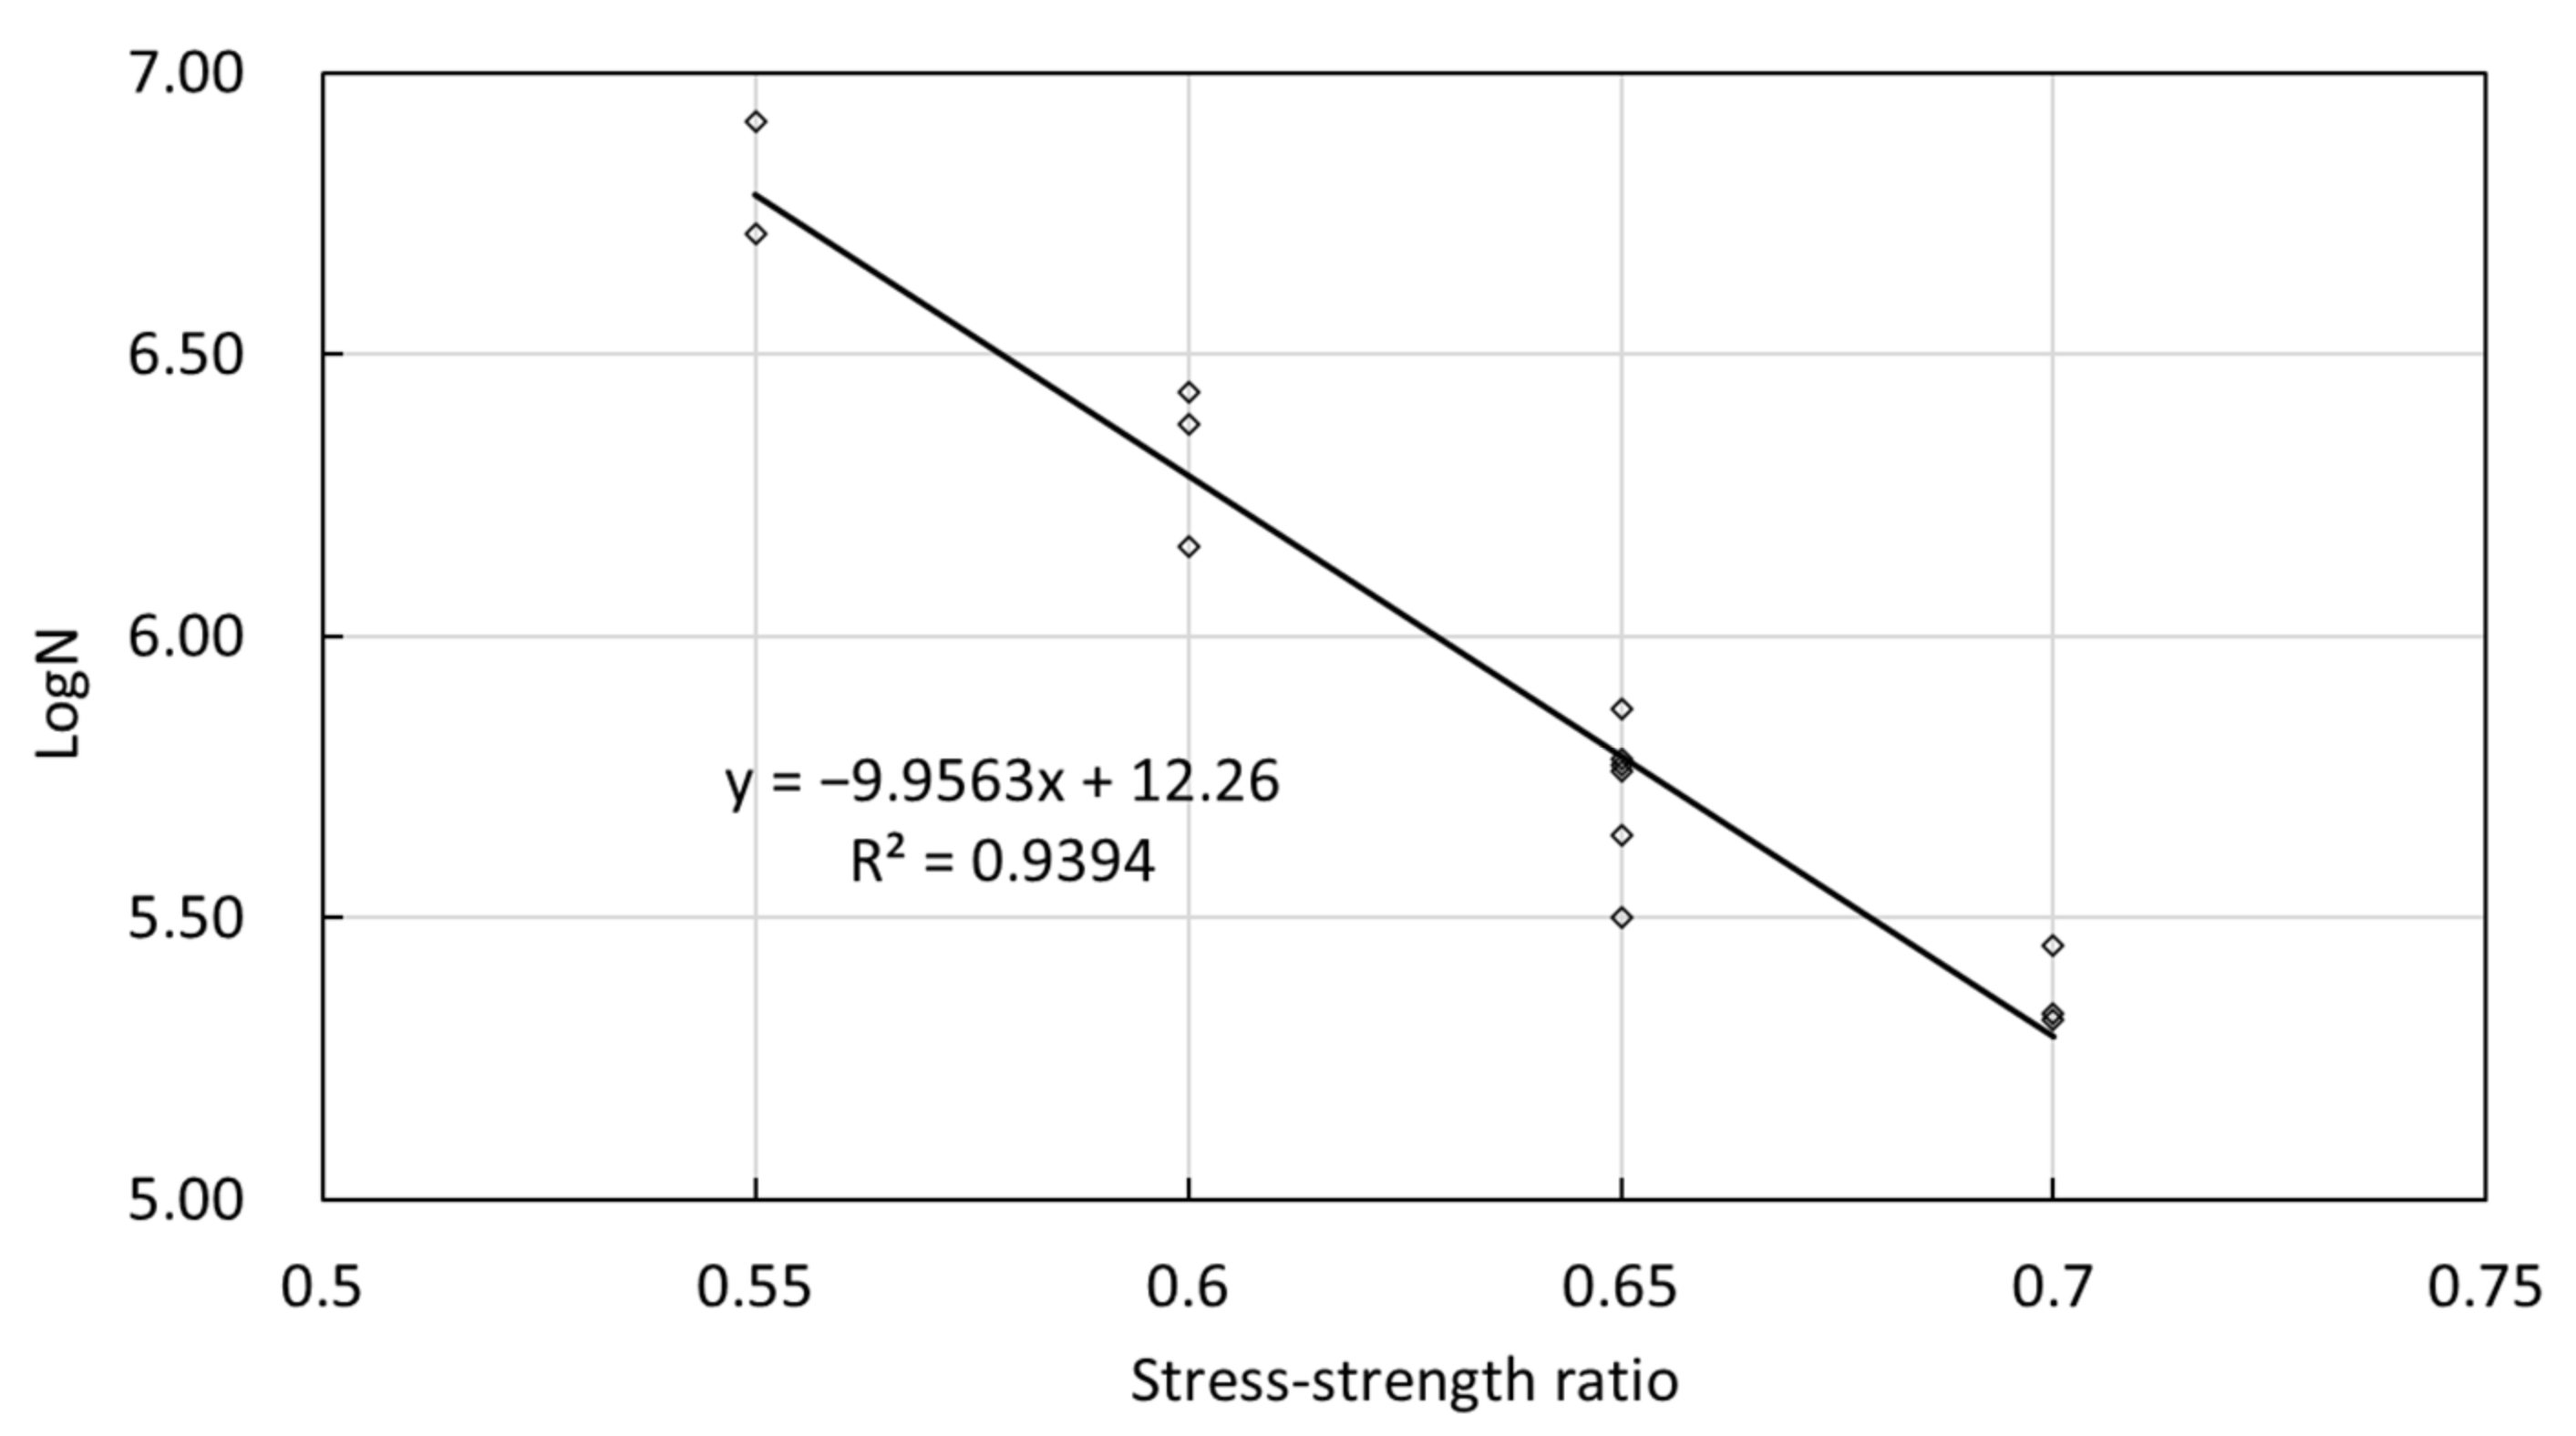
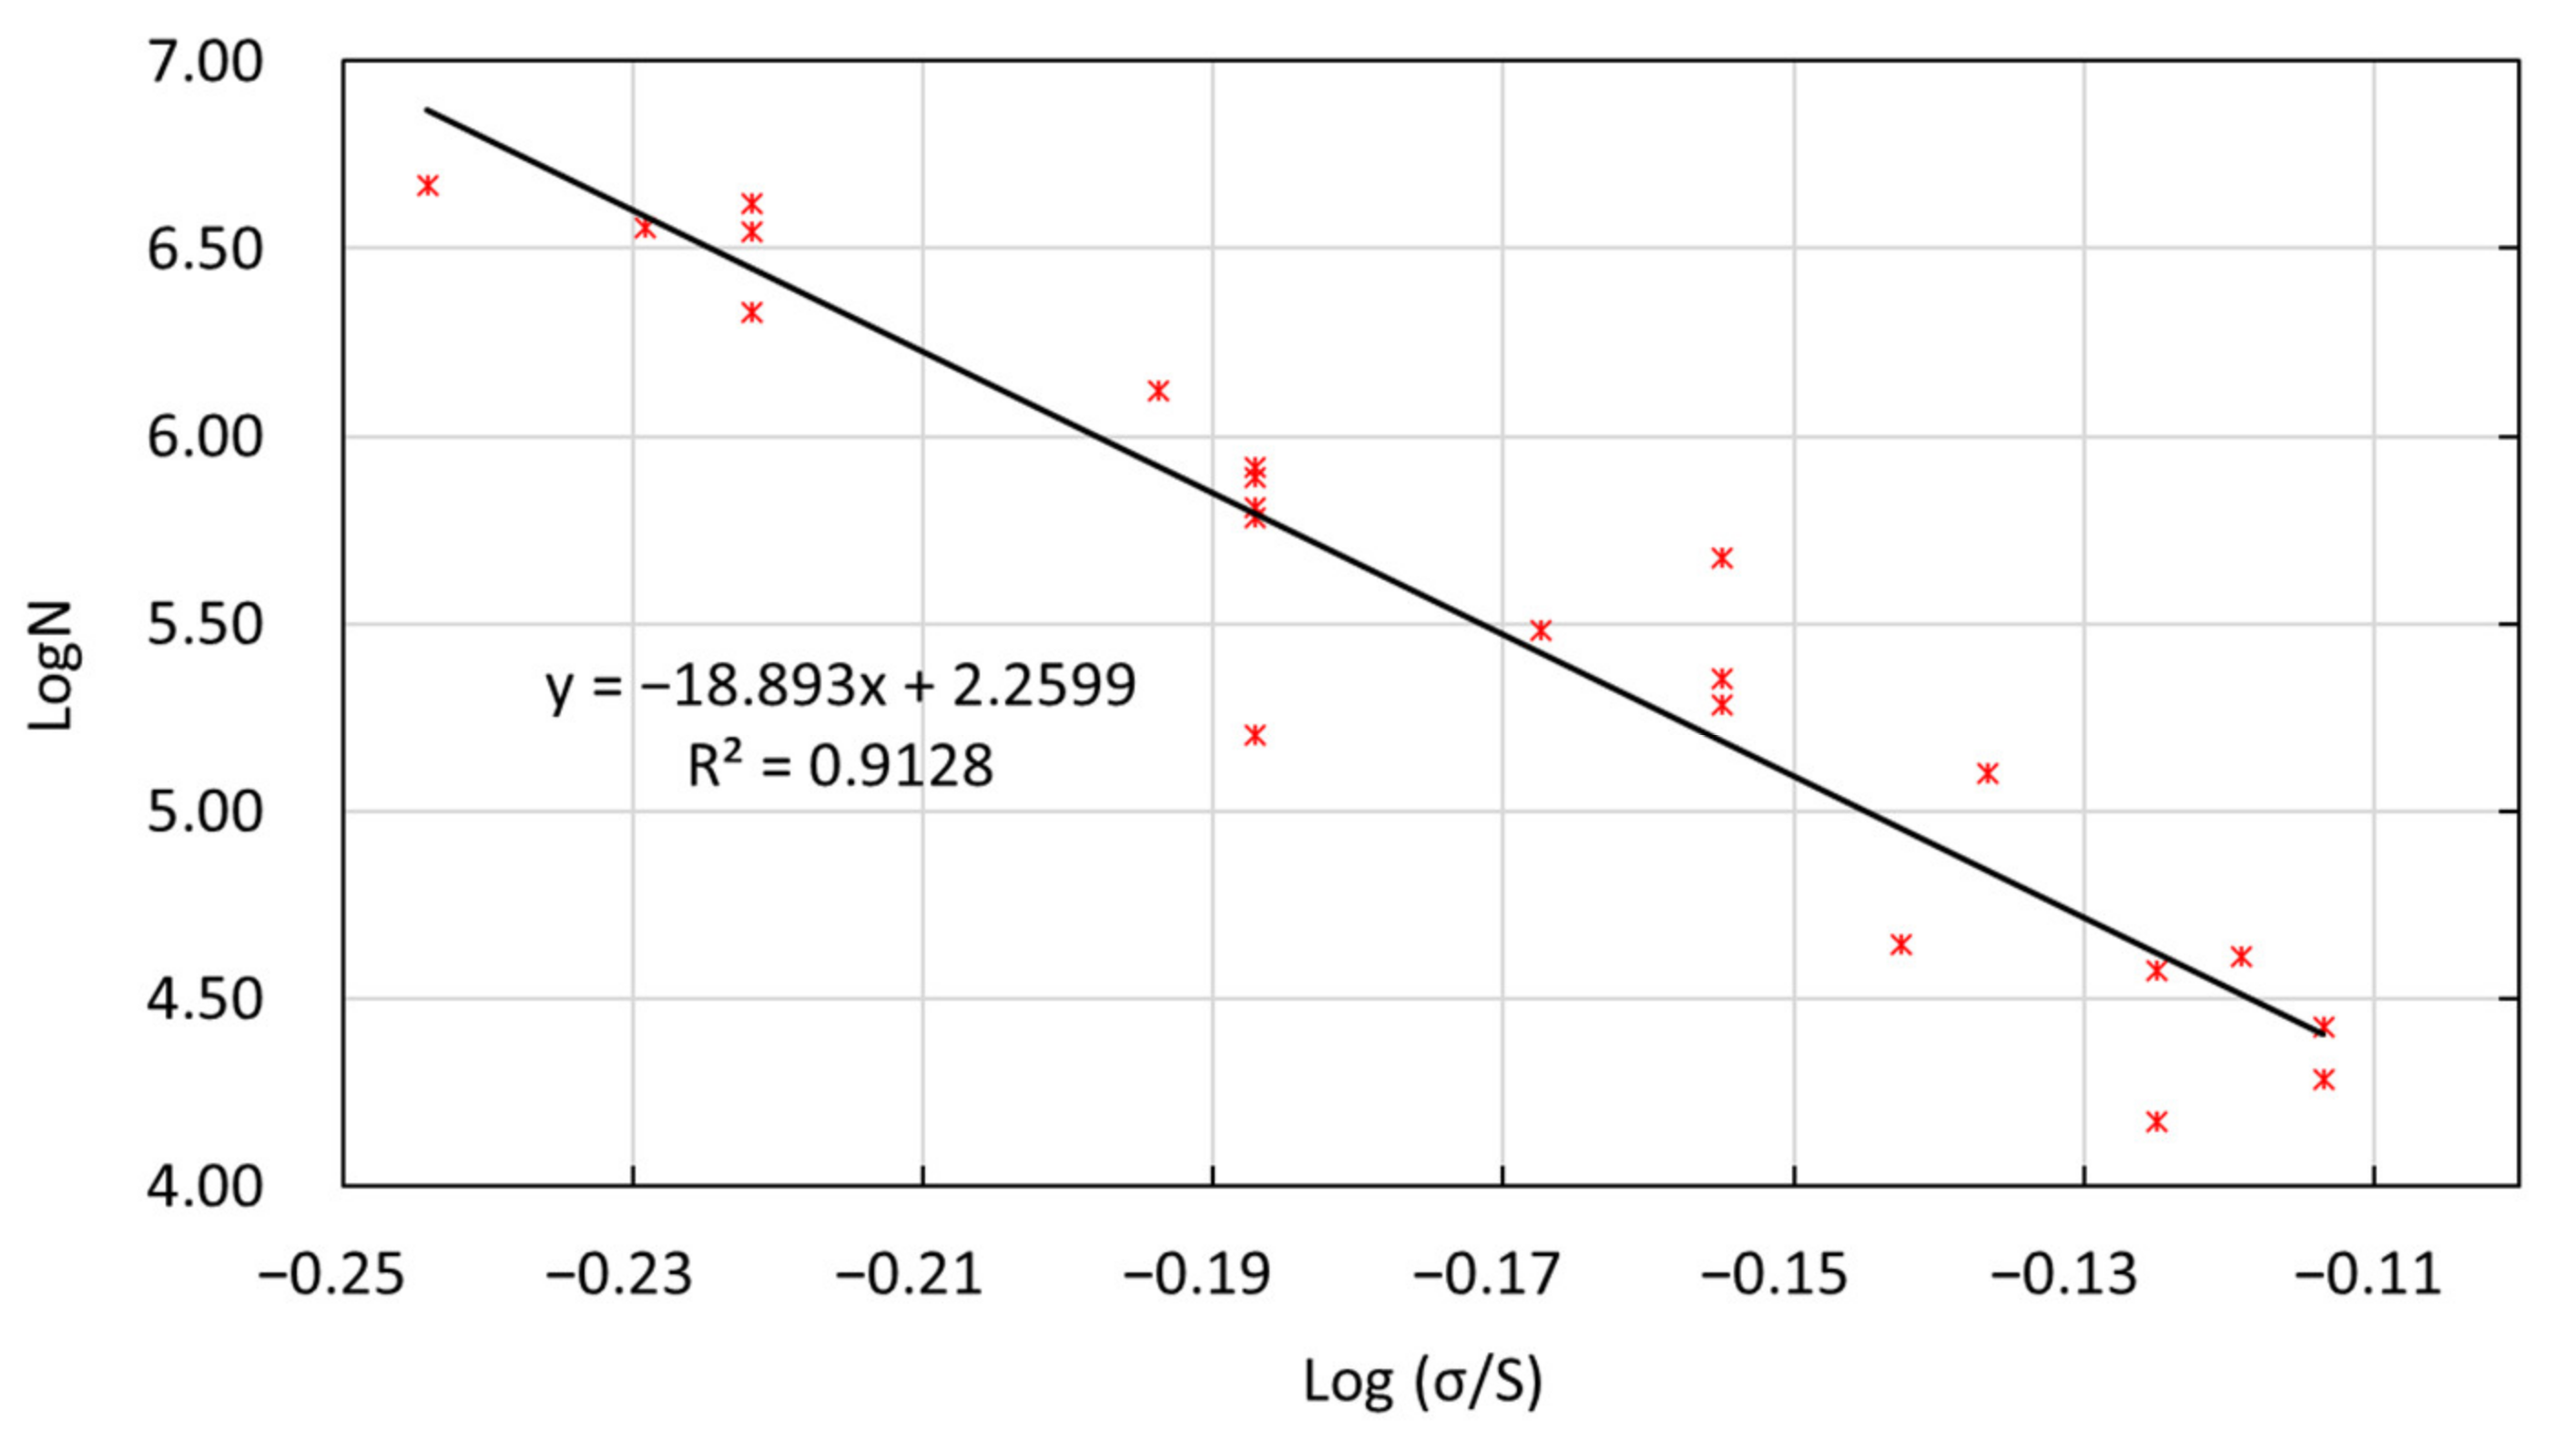
3.4.1. Introduction of Fatigue Damage Model

The fatigue deterioration behavior of semi-rigid road base materials is usually represented by an empirical method, such as an S-N curve, Basquin equation and Goodman method [25,26]. The S-N curve is based on the calculation of accumulated fatigue damage and indicated the relationship between fatigue stress levels and number of loading cycles at failure. The parameter S represents the stress level which is indicated by the stress–strength ratio. N represents the fatigue life which is indicated by the number of loading cycles at fatigue failure. S-N curves can be represented by Equations (2)–(4), respectively.
S = a b log N
log S = a b log N
S S 0 a N = b
where, S is stress–strength ratio, N is the number of loading cycles at fatigue failure, a and b are calculated by linear regression, S0 is fatigue limit stress.

3.4.2. Fatigue Damage Model Construction

The four-point bending fatigue test results of LFSG and CSG are regressed by Equation (5), which is based on Equation (2).
log N = a + b σ / S
where, N denotes number of loading cycles at fatigue failure, σ denotes flexural-tensile stress (MPa), S denotes flexural-tensile strength (MPa), a and b denote regression coefficients.
Fitting curves of logarithm fatigue life with stress–strength ratio of LFSG and CSG are shown in Figure 10 and Figure 11, respectively. According to the two fitting curves, fatigue damage models of Equations (6) and (7) are established. And the results of significance test are shown in Table 8 and Table 9. The results show that the effects of curve regression are significant, and the values of a and b are reliable.
log N = 13.76 12.23 σ / S
log N = 12.26 9.96 σ / S
The fatigue test results of LFSG and CSG are also regressed by Equation (8) which is based on Equation (3).
log σ / S = a b log N
where, N denotes number of loading cycles at fatigue failure, σ denotes flexural-tensile stress (MPa), S denotes flexural-tensile strength (MPa), a and b denote regression coefficients.
Fitting curves of logarithm fatigue life with logarithm stress–strength ratio of LFSG and CSG are shown in Figure 12 and Figure 13, respectively. According to the two fitting curves, fatigue damage models of Equations (9) and (10) are constructed. And the results of significance test are shown in Table 10 and Table 11. The results show that the effects of curve regression are significant, and the values of a and b are reliable.
log N = 2.26 18.89 σ / S
log N = 3.09 14.33 σ / S

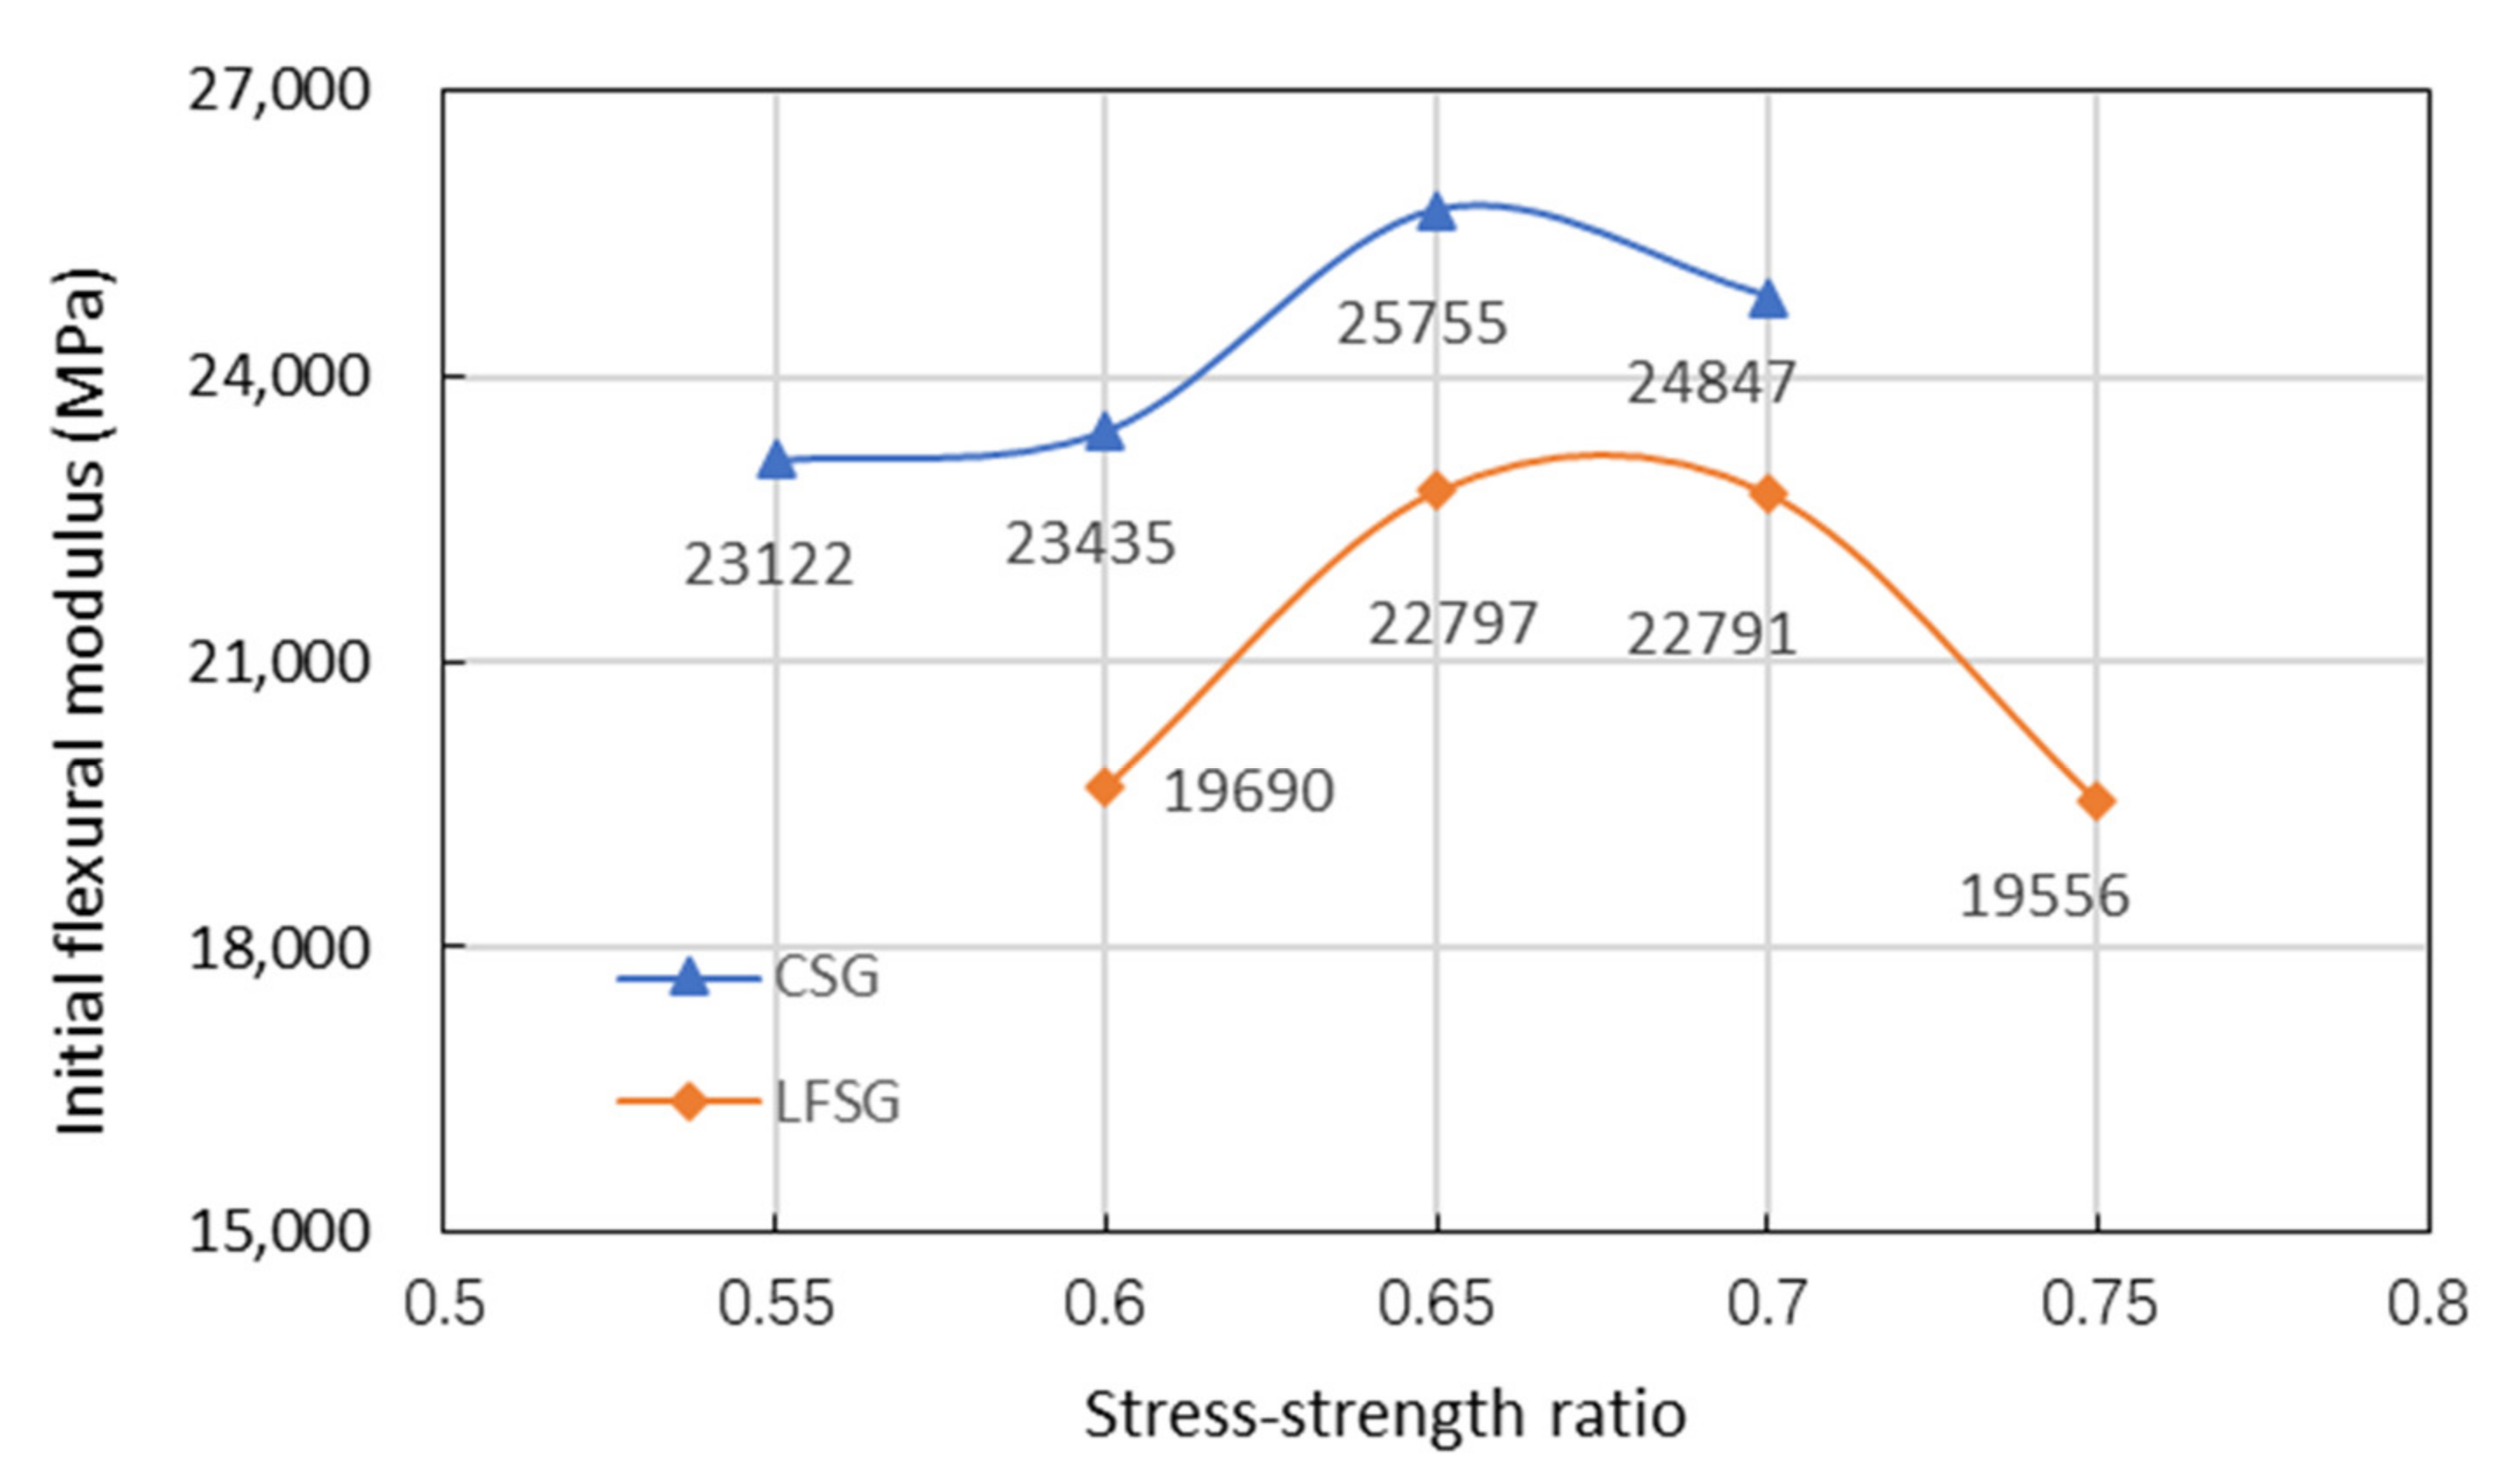
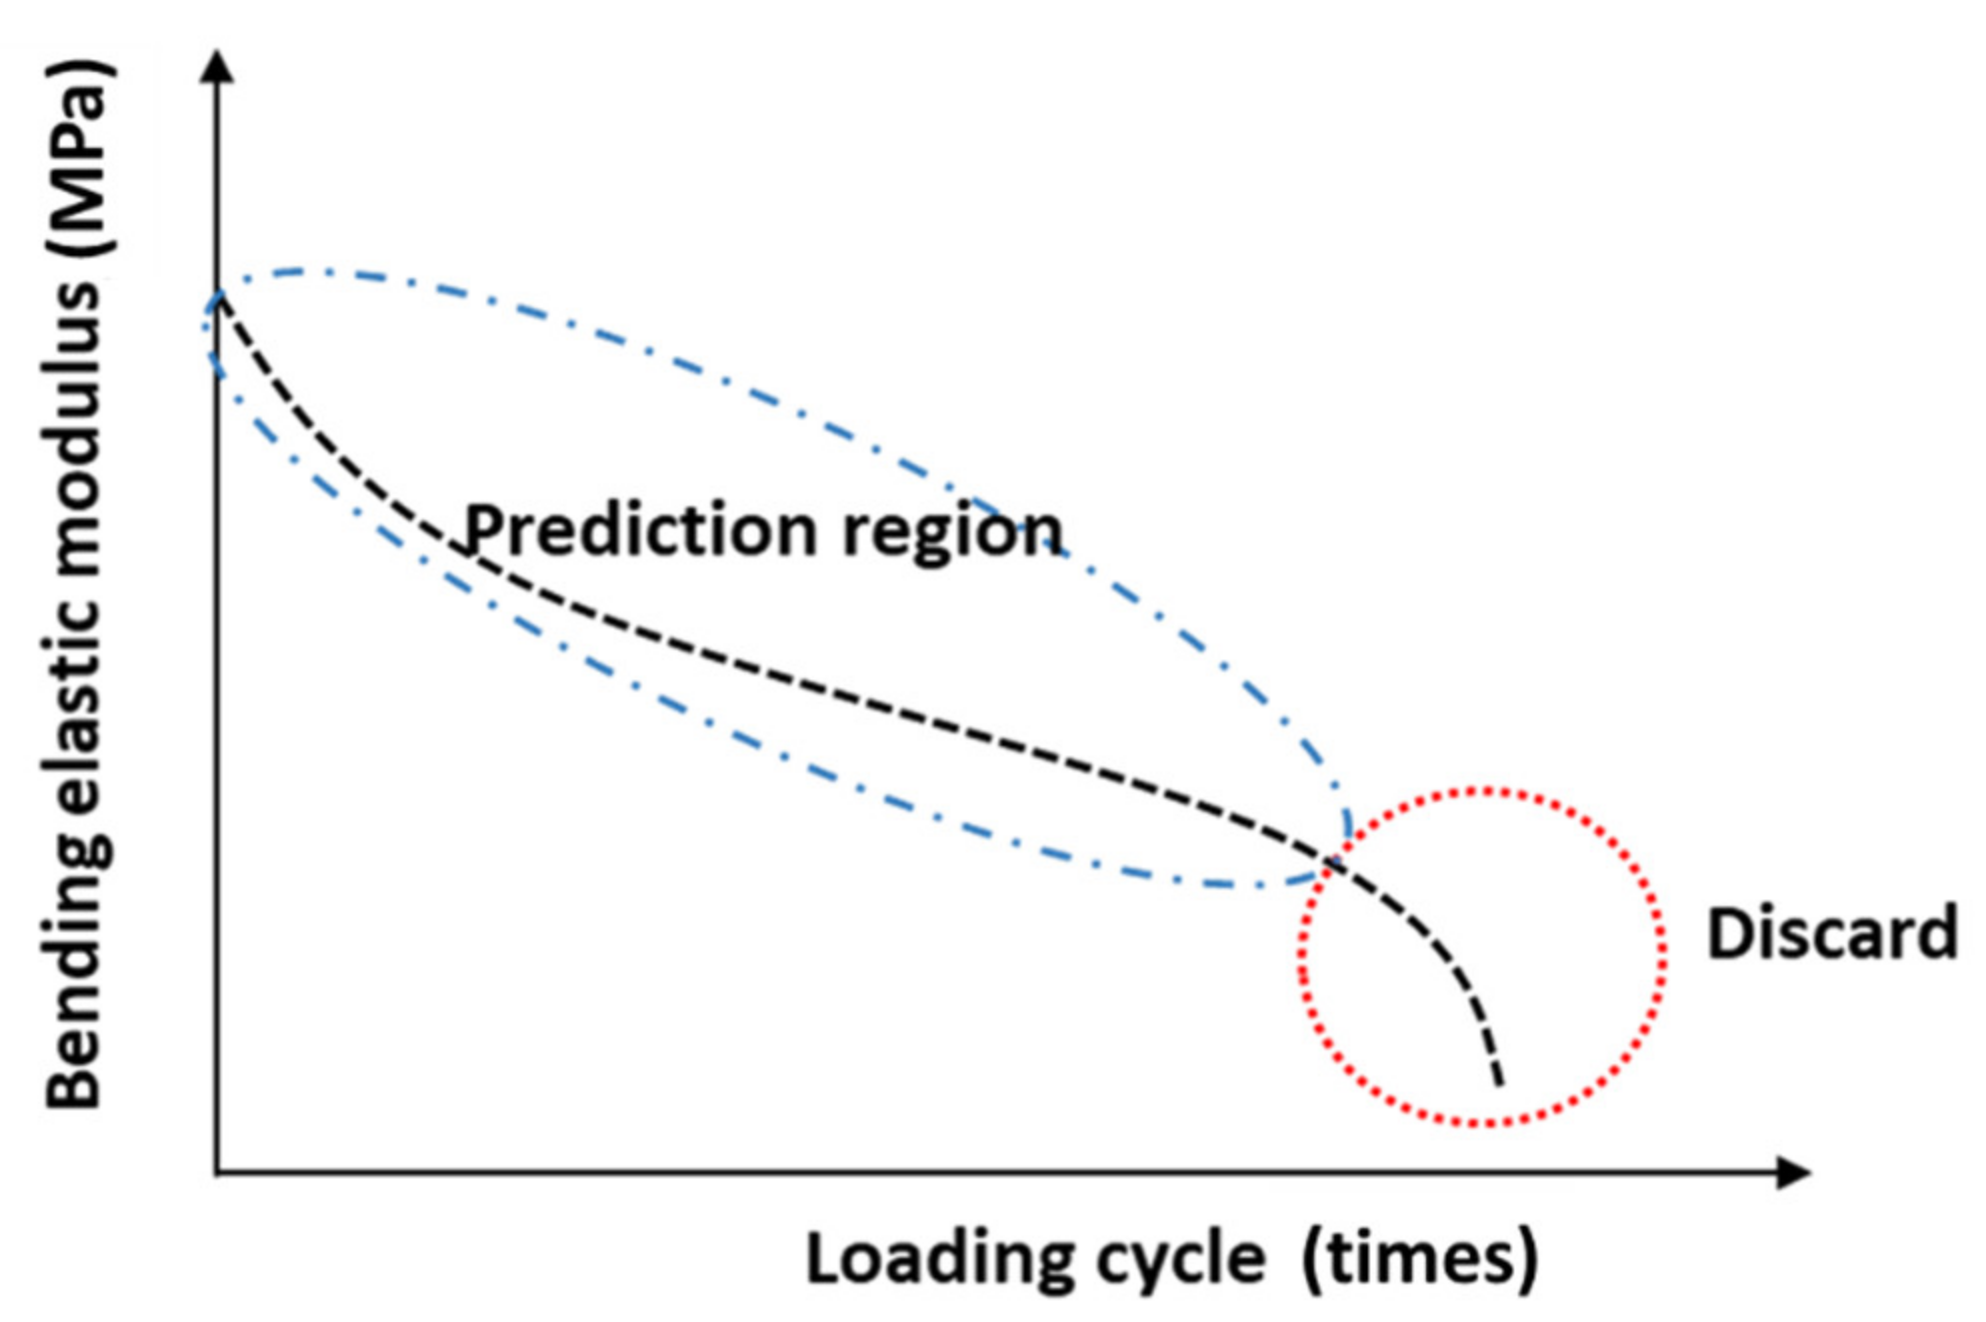
3.5. Analysis on Attenuation of Bending Modulus of Semi-Rigid Road Base Materials

As for the beam specimen in the four-point bending test, the bending moment in the one third of the middle region is the same. So, the deterioration mechanism of the material modulus in this region is also the same. During the four-point bending testing, parameters such as the load and the displacement on each loading cycle were recorded by sensors, and the bending elastic modulus of beam specimen at each loading cycle was calculated. Based on the four-point bending fatigue test, the bending elastic modulus of every loading cycle under each stress–strength ratio can be obtained. It attempts to establish the relation models of the bending elastic modulus attenuation, loading cycles and stress ratio [27,28].

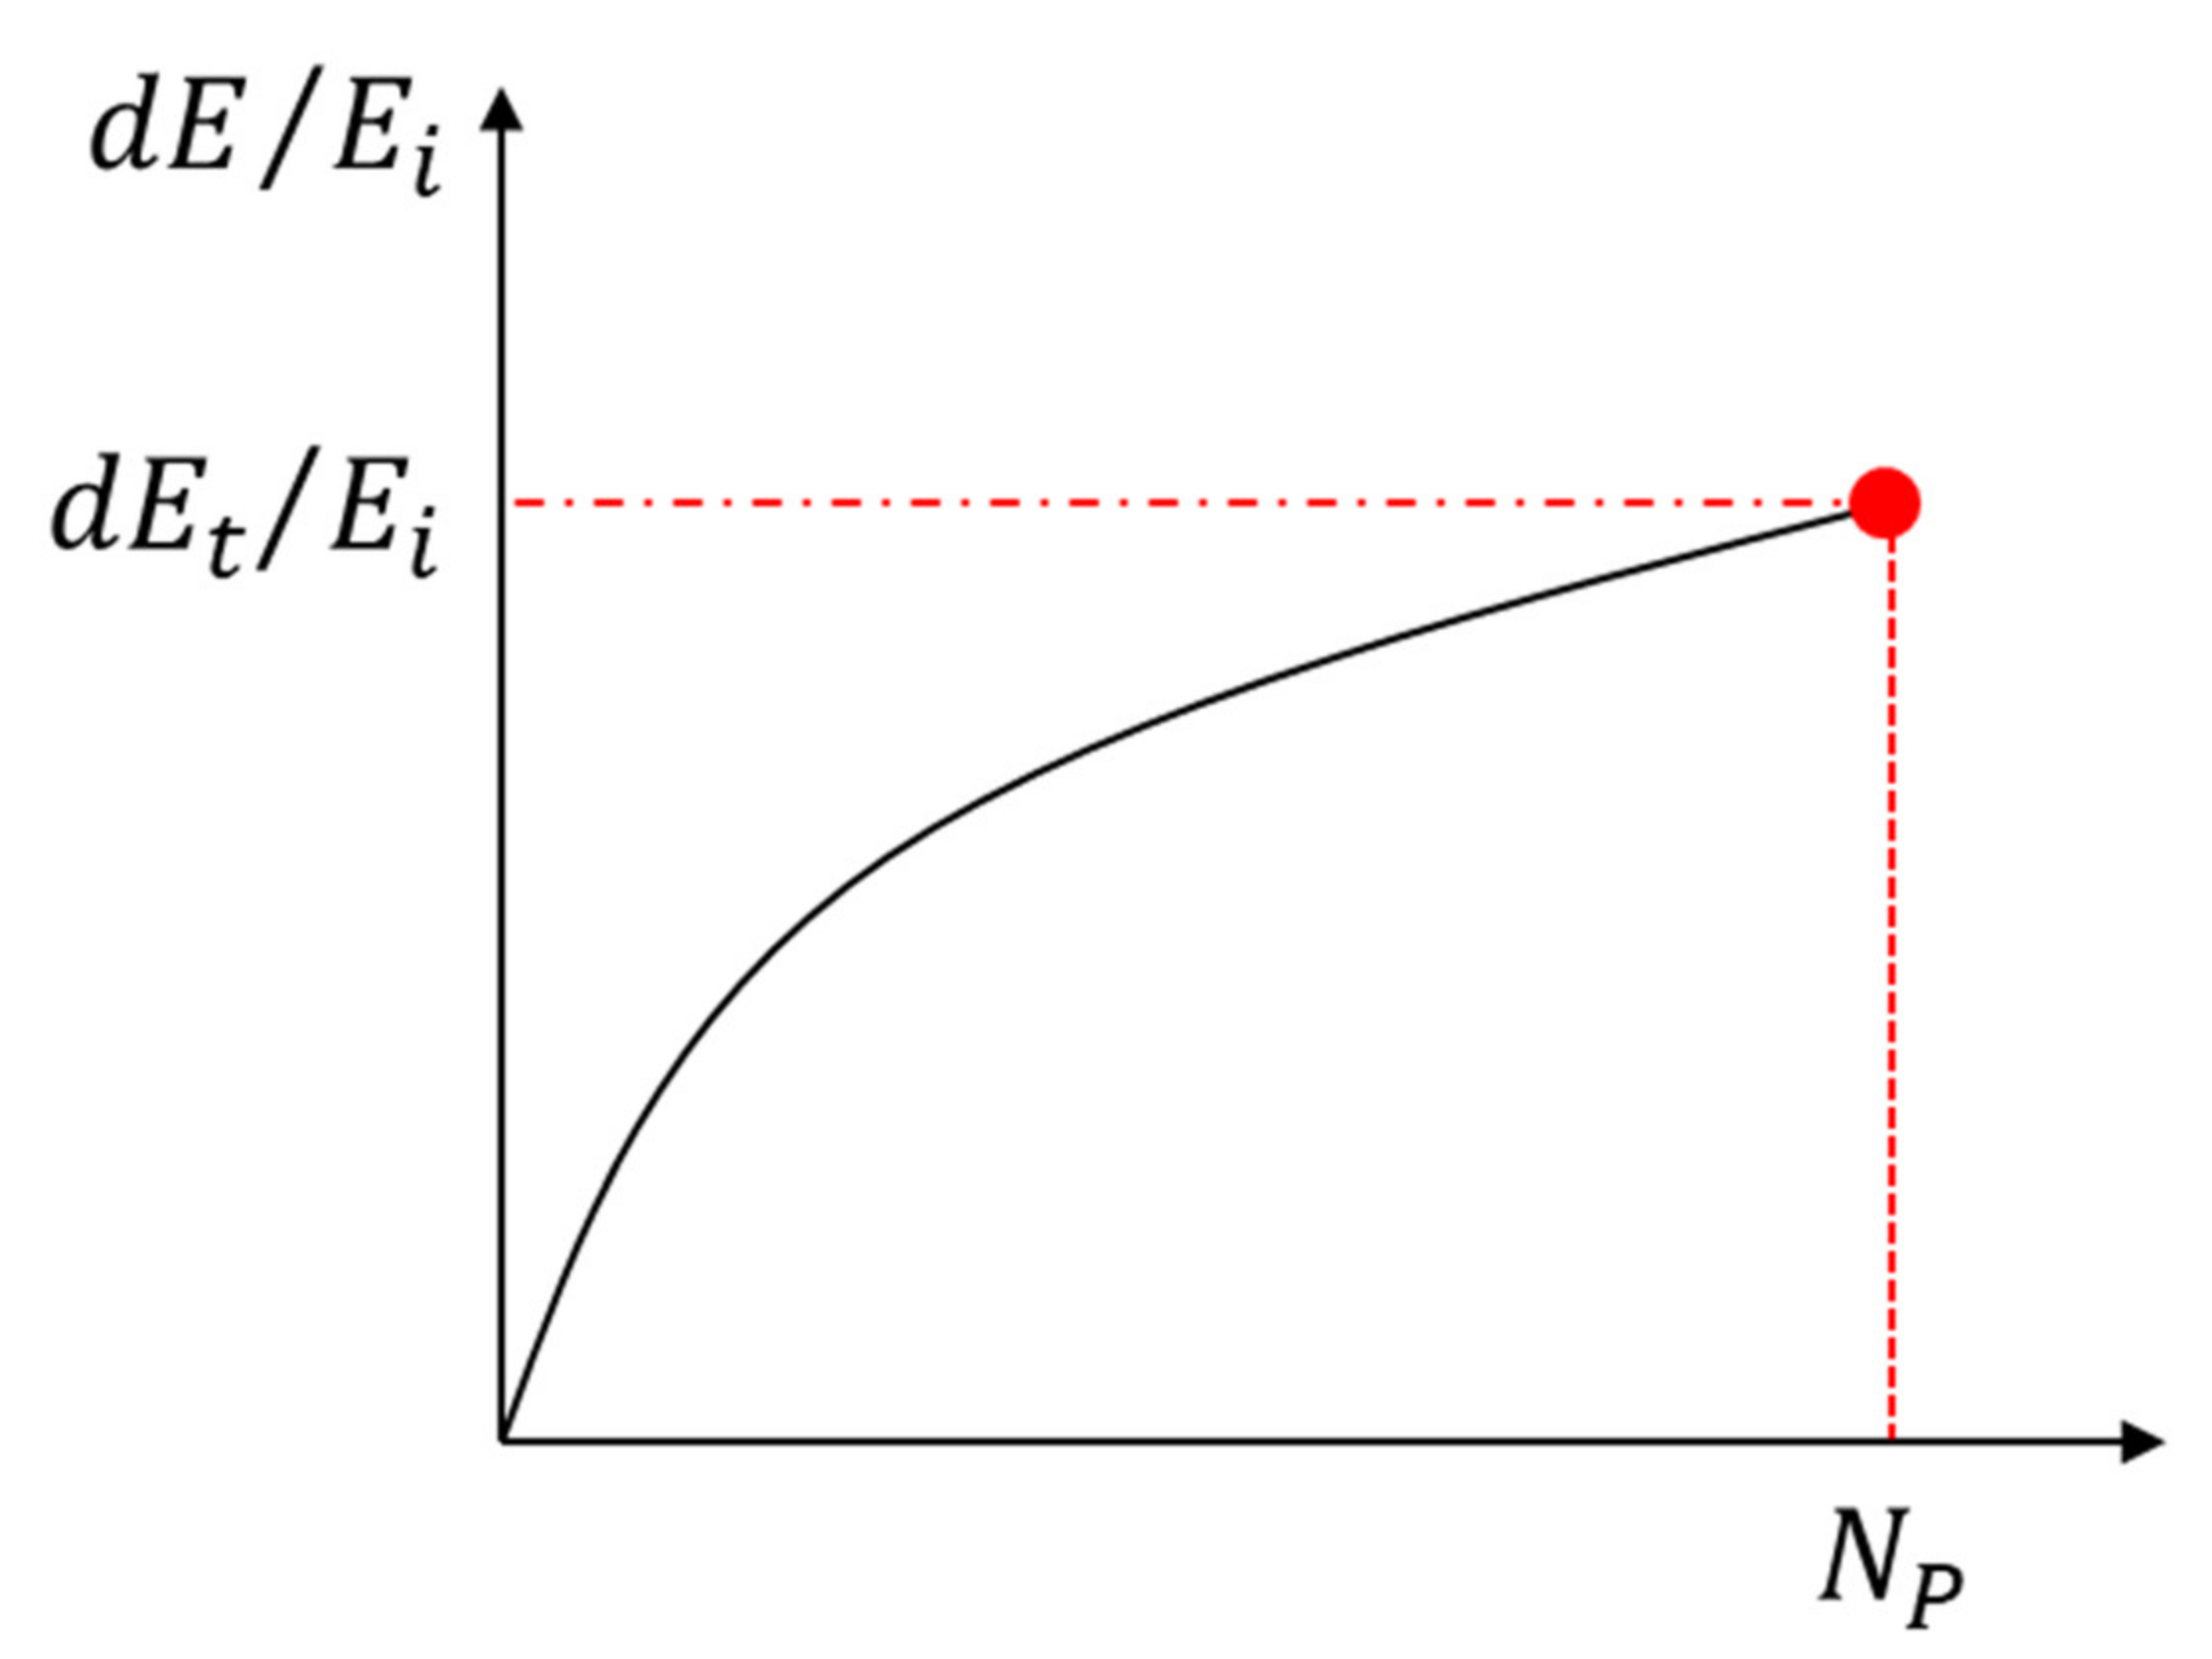
3.5.1. Introduction of Modulus Degradation Model

Incremental-recursive mechanics of continuous damage was applied in this research to establish a modulus degradation model related to the stress ratio. As a type of algorithm, incremental-recursive has been utilized to perform pavement structure analysis. For instance, mechanical-empirical Pavement Design Guide (MEPDG) used the incremental-recursive to analyze the fatigue and permanent deformation of asphalt pavement [29]. The characteristic of this method is to separate the whole process into several stages. The deterioration at this stage was defined as an increment to iterate with the summation of previous stages [30]. As a non-linear fatigue damage curve in Figure 14, the Ei is the initial modulus of the material, Np is the accumulated loading cycles, dE is the decrement of modulus. The incremental-recursive model is establishing the relationship between the modulus degradation rate (dE/Ei) and loading cycles (N) (Equation (11)):
d E E i = F N , S
where, S is the mechanical response under loading, this parameter can be selected as required (stress, strain, or stress ratio).
According to the theory of continuum damage mechanics, cracks result from the growth and accumulation of micro-cracks in material microstructures [31,32].
In the uniaxial tensile test, the occurrence of fracture will cause the decrease of effective cross-section, and the stress must be transferred to the remaining intact cross-section. So, the damage can be defined as the relative value of the effective cross-sectional reduction, as shown in Equation (12):
ω = A 0 A A 0 = d A A 0
where, ω is the damage, A0 is the initial cross-section, A is the retained cross-section.
The damage can also be explained as the attenuation of material modulus, as shown in Equation (13):
ω = E 0 E E 0 = d E E 0
where, ω is the damage, E0 is the initial material modulus, E is the modulus after material damage.
The development of material damage is a function of the actual stress, as shown in Equation (14):
ω = N 10 6 α × σ S β × 1 ω γ
where, ω is the damage, σ/S is the stress ratio, N is the loading cycles, and α, β, γ are constant.
The modulus attenuation model related to the mechanical index of fatigue equation can be established by using Equation (14).

3.5.2. Modulus Attenuation Model Construction

Fatigue damage of semi-rigid base material accumulates continuously under the repeated loading. When the loading cycle accumulates to a certain degree, the material will eventually lead to fatigue damage. As the accumulation of fatigue damage in the semi-rigid base material is a gradual process, it is impossible to observe the damage process directly. The deterioration of bending elastic modulus provides a feasible approach to evaluate the damage degree of semi-rigid base material. Therefore, the change of elastic modulus is very important to evaluate the damage state of semi-rigid materials and structures.
During the model establishment, the development of bending elastic modulus under different stress ratios and different loading cycles need to be considered. The attenuation of bending elastic modulus had three stages included rapid decline stage, slow decline stage and destruction stage, respectively. The rapid decline and slow decline stages were prediction regions. The destruction stage was the discarded stage, as shown in Figure 15. In order to ensure the fitting accuracy, the bending elastic modulus data in the destruction stage were neglected. So, the incremental-recursive model only predicts the degradation of bending elastic modulus from the initial modulus to the decay of the modulus before failure.
According to the data of bending elastic modulus and the incremental-recursive model, constants in Equation (5) were obtained by using Levenberg–Marquardt fitting algorithm method. The fitting equations of LFSG and CSG are presented in Equations (15) and (16), respectively. The relatively high correlation coefficients R2 (0.9674 and 0.8488) of these two equations indicate this model can achieve reliable fitting effect.
ω = N 10 6 0.33 × σ S 3.73 × 1 ω 1.58
ω = N 10 6 0.31 × σ S 2.78 × 1 ω 0.78
This modulus degradation model can not only be used to predict the fatigue deterioration of semi-rigid materials under different stress levels, but is also able to calculate the current bending elastic modulus based on the initial modulus value [33]. So, the fatigue life of LFSG and CSG under different loading levels can be predicted, which in turn supplies a reliable model and indexes for the fatigue damage analysis of semi-rigid base course of pavement structure.
As expected based on previous studies [25], two types of CSG with same cement contents had different modulus degradation models. The results showed the stress–strength ratio should be considered.

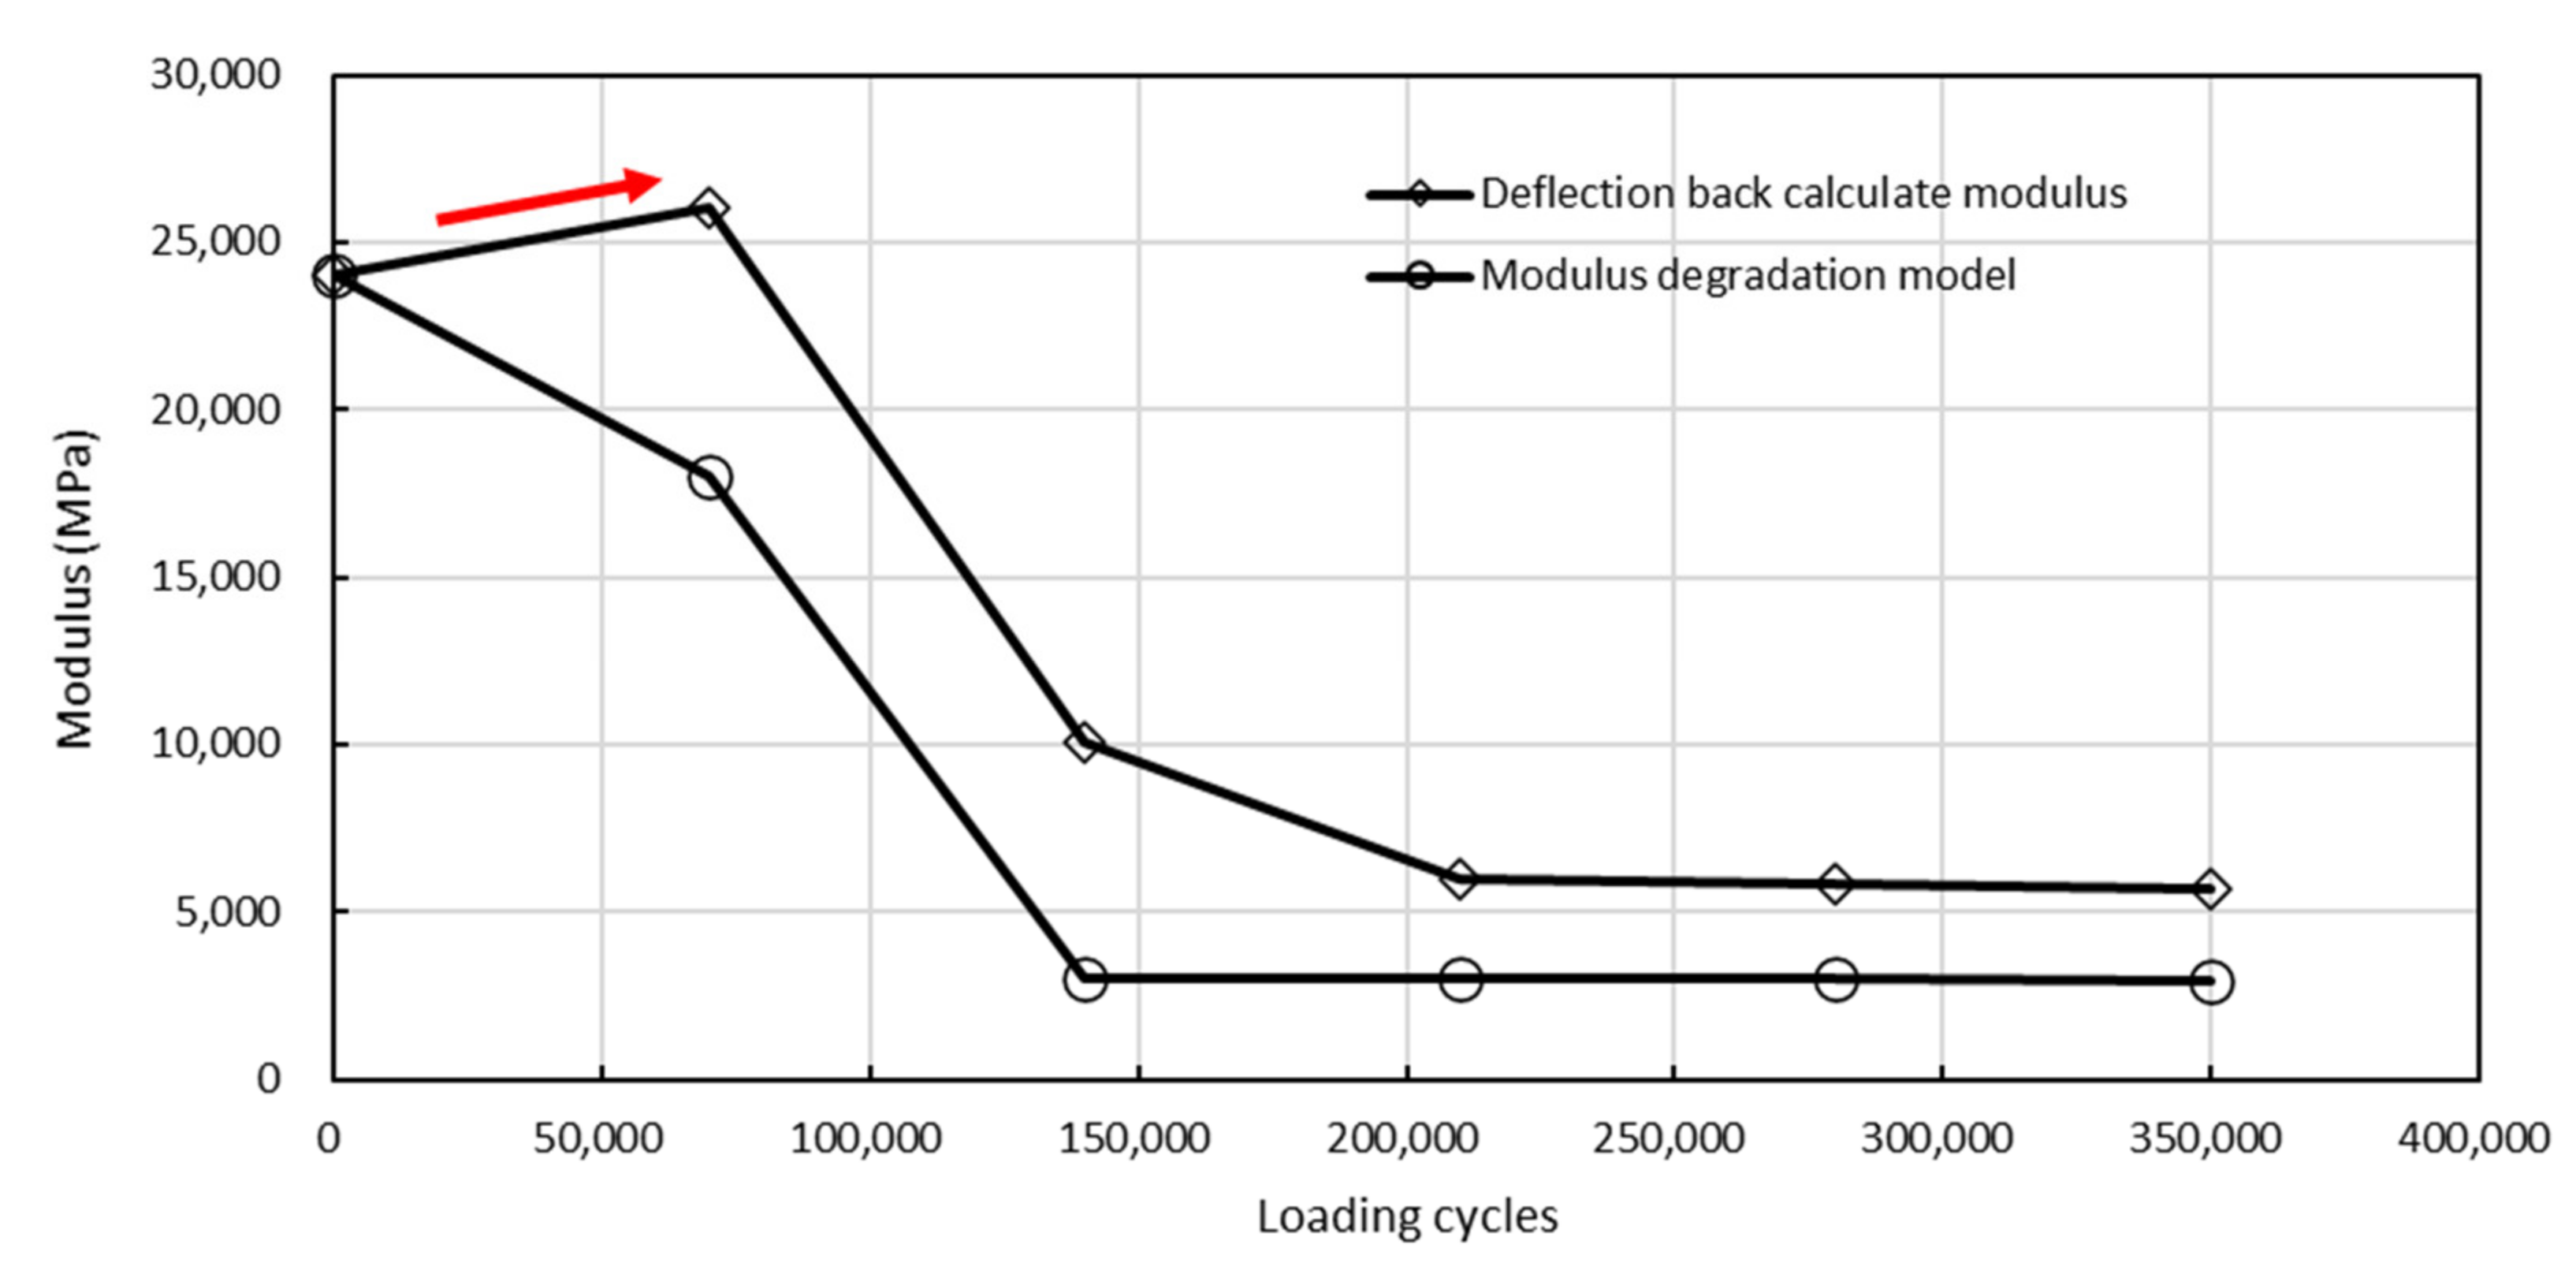
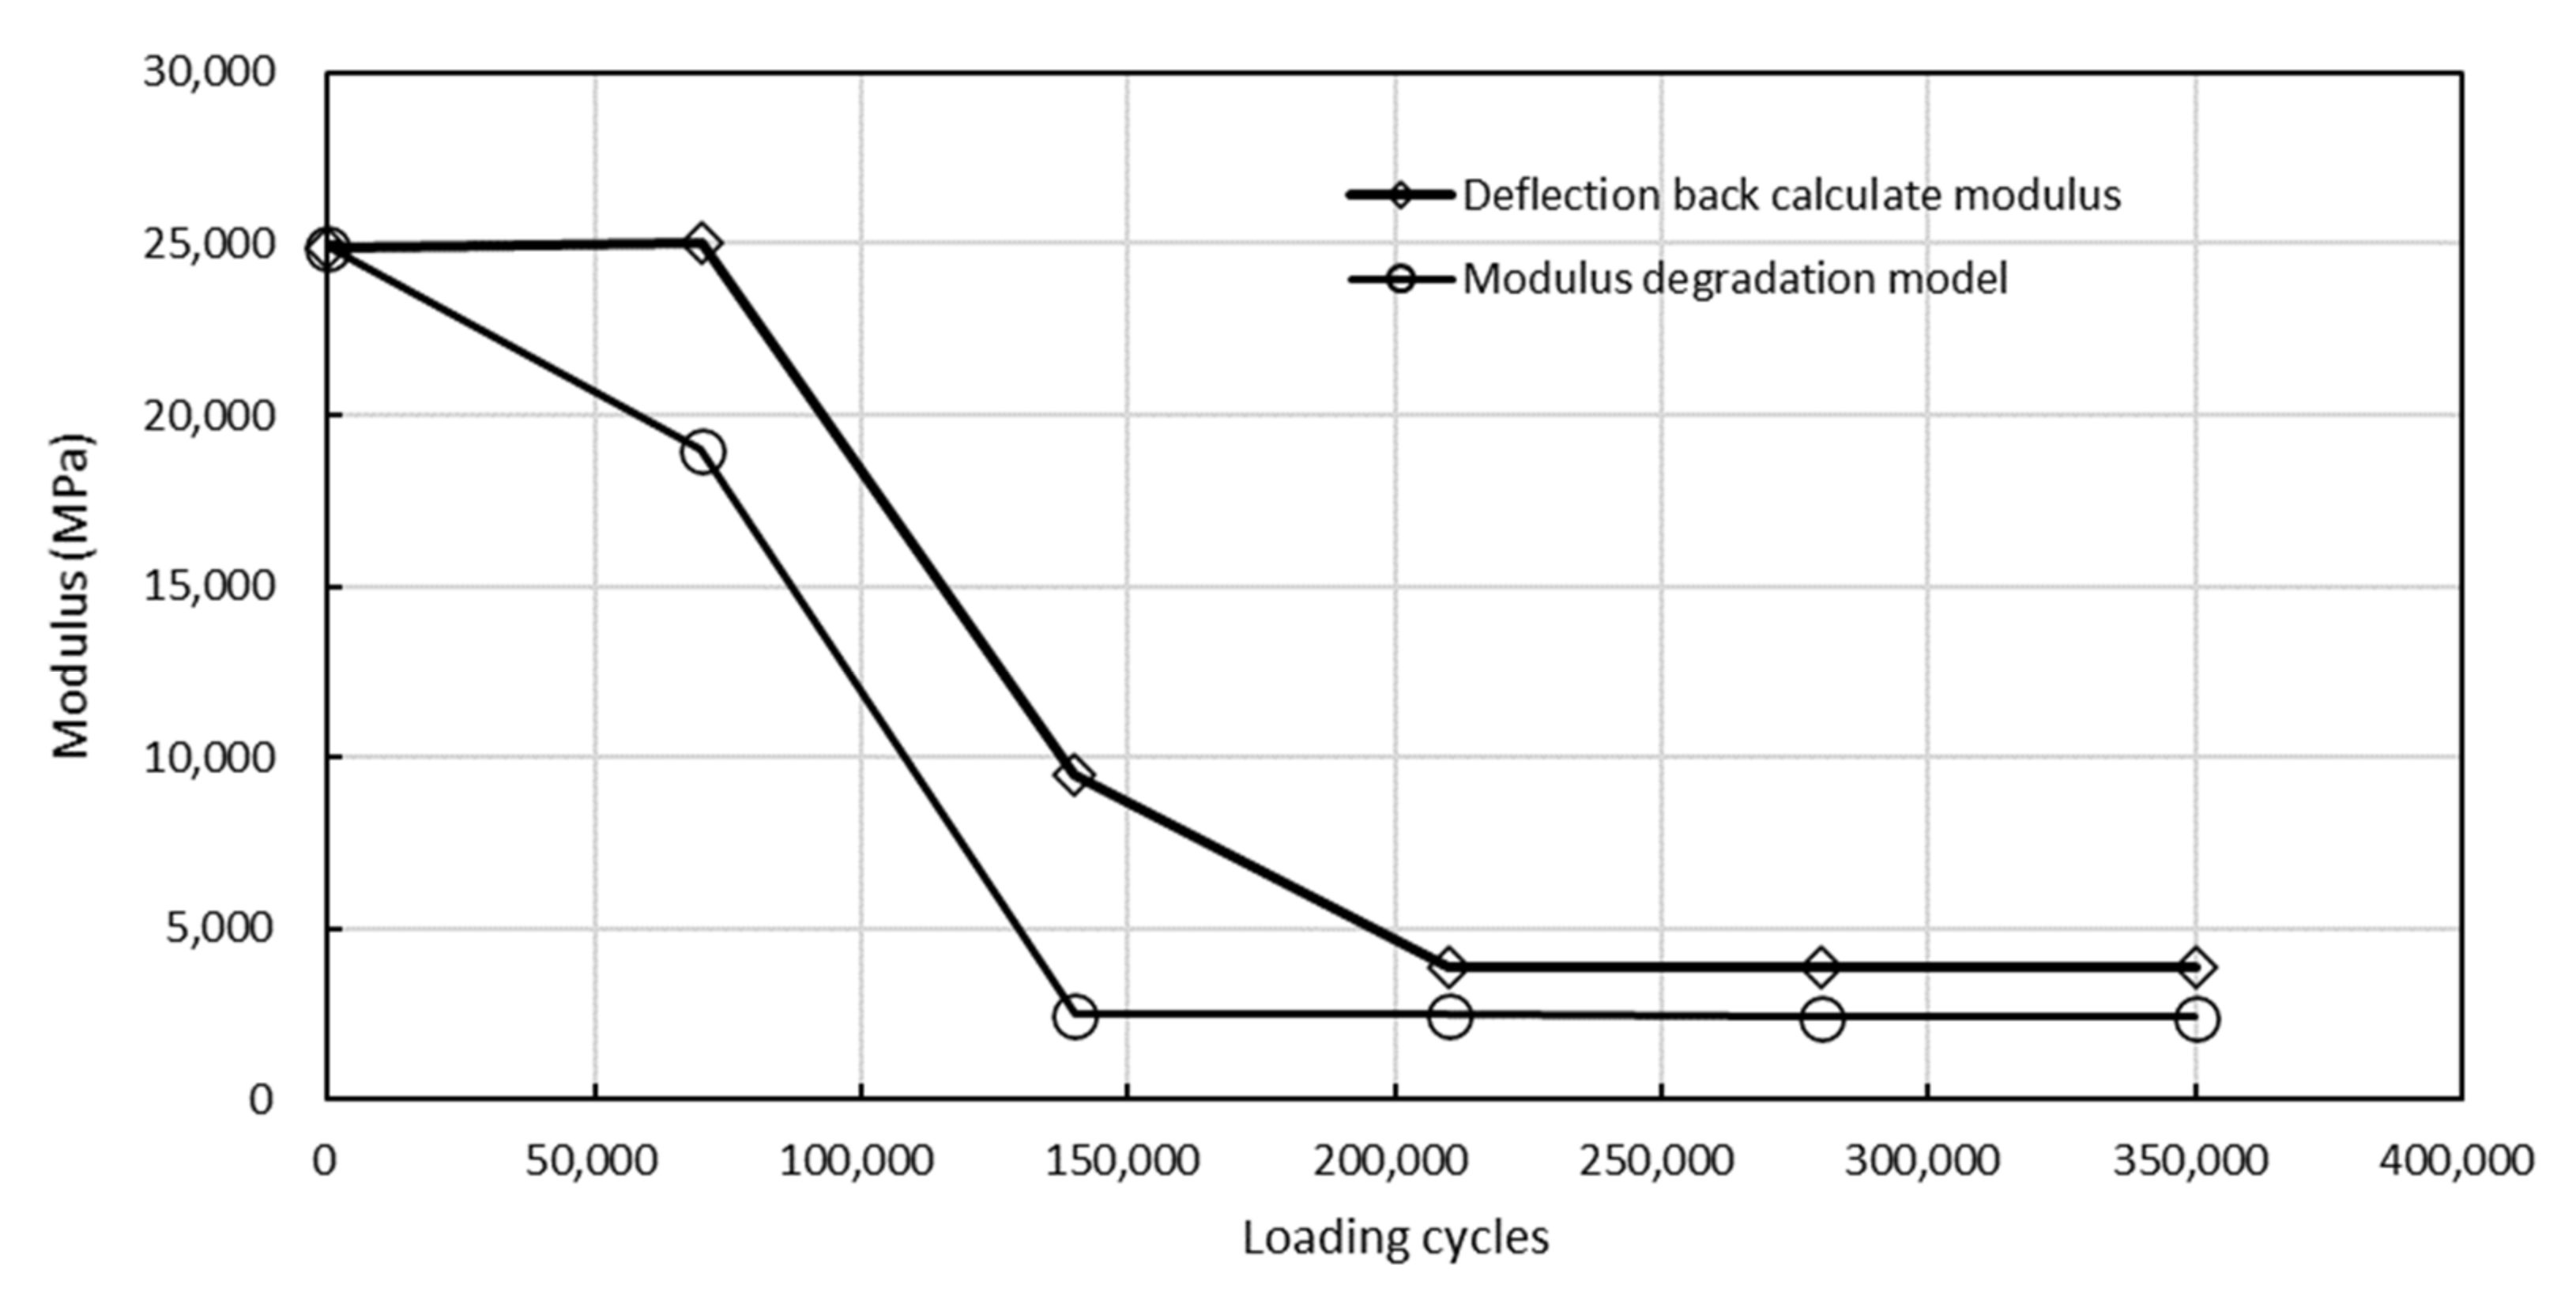
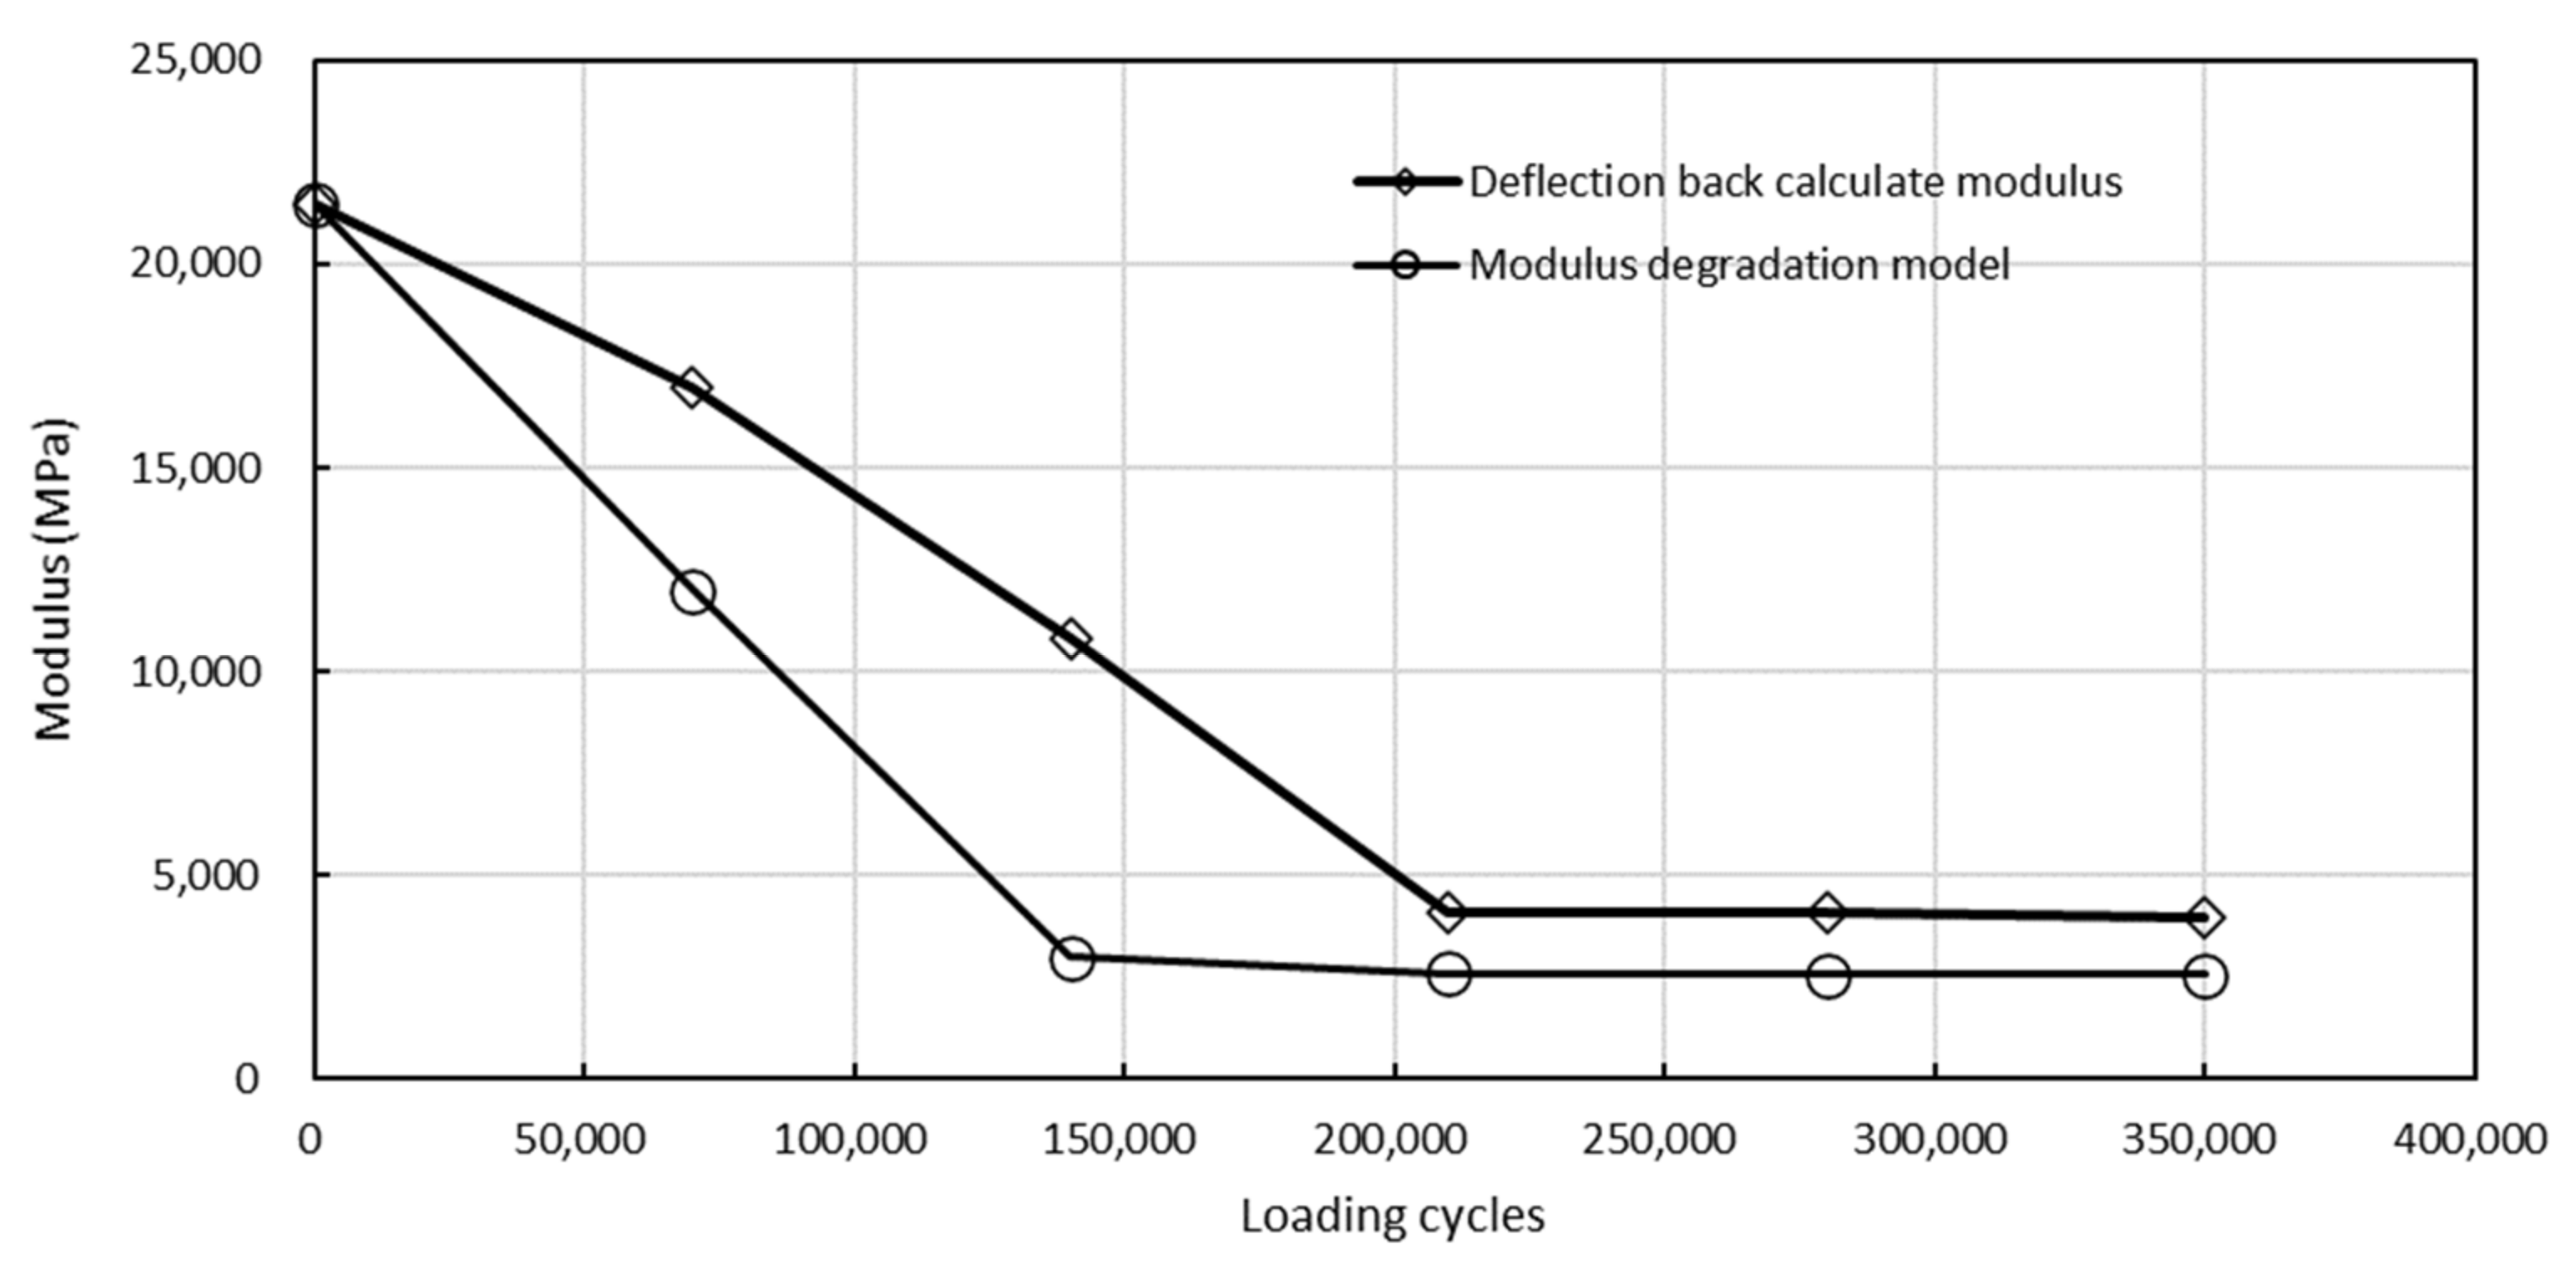
3.5.3. Modulus Attenuation Model Verification

The modulus of three pavement structures with CSG and LFSG is back calculated after different loading cycles. Meanwhile, the modulus of CSG and LFSG under the same loading cycles is calculated by the two modulus attenuation models. The modulus of back calculation and degradation model in three pavement structures are shown in Figure 16, Figure 17 and Figure 18. In these figures, the deflection back calculate modulus was back calculated by the surface deflection basin data in the three pavement structures. The degradation modulus was calculated by the Equations (15) and (16). The deflection back calculates the modulus based on the actual measurement deflection basins. However, the degradation modulus is based on the fitting models.
According to the back-calculation modulus of Structure 1 to 3, the modulus degradation of semi-rigid base can be classified as three stages, which are the fatigue cracking generation stage, cracking development stage and cracking stable stage, in the cyclic loading. The time of fatigue cracking generation stage is equal to the fatigue life of the four-point bending fatigue test. The four-point bending fatigue test is influenced by specimen dimensions and loading modes. As microcracks appear on the bottom of specimen, the cracks will spread across the specimen rapidly and lead to the specimen failure. However, the full-scale accelerate loading test is different. Cracks through the semi-rigid base require a long time as microcracks appear and this is the cracking development stage. When the cracks go through the semi-rigid base completely, the modulus of the semi-rigid base will be stable. It is the cracking stable stage.
In cracking stable stage, the modulus of deflection back-calculation is decreased to 18.3%, 15.7% and 18.8% of the initial modulus in Structure 1 to Structure 3, respectively. The average modulus of deflection back-calculation reduced to 17.6% of its initial modulus. The modulus calculated by modulus degradation models is less than the modulus of deflection back-calculation. However, in the full-scale accelerated test, the results of the modulus prediction model still have good correlation with the results of FWD.

4. Conclusions

This research assessed the mechanical performance of semi-rigid road base materials (LFSG and CSG) under the dynamic load. The dynamic compression test, the four-point bending test and full-scale accelerate loading test were performed to evaluate the dynamic compressive resilience modulus and fatigue resistance of semi-rigid base materials, respectively. The following conclusions were given based on the results in this study:
  • From the dynamic compression test, the LFSG had a 59% higher dynamic modulus than that of the CSG. The load frequency had less influence on the dynamic modulus of these two semi-rigid road base materials;
  • The LFSG obtained a 19.7% higher flexural-bending strength than that of the CSG, which indicated its higher bearing capacity as a road base course material. The LFSG had the potential to resist flexural tensile failure as a road base course;
  • The fatigue life of LFSG and CSG decreased with the increase of stress ratio. It is indicated that a higher traffic loading will accelerate the fatigue deterioration of the semi-rigid base course. Slightly higher fatigue life of LFSG indicated its better fatigue resistance than that of the CSG;
  • A fatigue damage model was established by S-N curve. This model can be used to predict the fatigue life of CSG and LFSG materials under different stress–strength ratios; and
  • A modulus degradation model was developed based on the incremental-recursive mechanics. This model can not only be used to predict the fatigue deterioration of semi-rigid materials under different stress levels, but is also able to calculate the current bending elastic modulus based on the initial modulus value.
The results of this study will help to evaluate the performance decay and predict the residual life of road accurately in the future. The results will also guide the preventive maintenance of the highway. However, these results could only predict the fatigue life of semi-rigid road base asphalt pavement. In the future works, the investigation of fatigue life with different types of asphalt mixtures was recommended.

Author Contributions

Conceptualization, S.Y. and J.W.; methodology, X.Z.; software, X.W.; validation, T.C., Q.S. and L.C.; formal analysis, Y.Z.; investigation, X.Z.; resources, W.W.; data curation, T.C.; writing—original draft preparation, X.Z.; writing—review and editing, W.W.; visualization, X.W.; supervision, J.W.; project administration, S.Y.; funding acquisition, L.C. All authors have read and agreed to the published version of the manuscript.

Funding

This research was funded by the National Key R&D Program of China, grant number 2018YFB1600103 and project ZR2020QE271 was supported by Shandong Provincial Natural Science and Foundation and Key Research and Development Program of Shandong Province, grant number 2019GSF109020.

Institutional Review Board Statement

Not applicable.

Informed Consent Statement

Not applicable.

Data Availability Statement

Data sharing is not applicable to this article.

Conflicts of Interest

The authors declare no conflict of interest.

References

  1. Zhang, J.Z.; Li, P.Z.; Liang, M.; Jiang, H.G.; Yao, Z.Y.; Zhang, X.M.; Yu, S. Utilization of red mud as an alternative mineral filler in asphalt mastics to replace natural limestone powder. Constr. Build. Mater. 2020, 237, 117821. [Google Scholar] [CrossRef]
  2. Zhang, J.Z.; Sun, C.J.; Li, P.Z.; Liang, M.; Jiang, H.G.; Yao, Z. Experimental study on rheological properties and moisture susceptibility of asphalt mastic containing red mud waste as a filler substitute. Constr. Build. Mater. 2019, 211, 159–166. [Google Scholar] [CrossRef]
  3. Zhang, J.Z.; Sun, H.; Jiang, H.G.; Xu, X.B.; Liang, M.; Hou, Y.; Yao, Z. Experimental assessment of reclaimed bitumen and RAP asphalt mixtures incorporating a developed rejuvenator. Constr. Build. Mater. 2019, 215, 660–669. [Google Scholar] [CrossRef]
  4. Li, S.L.; Wu, G.M.; Wu, H.S. Study on acoustic emission characteristics of a semirigid base of dense skeleton type during complete uniaxial compression tests. Adv. Mater. Sci. Eng. 2016, 6, 1–8. [Google Scholar] [CrossRef] [Green Version]
  5. Xuan, D.X.; Houben, L.J.M.; Molenaar, A.A.A.; Shui, Z.H. Mechanical properties of cement-treated aggregate material-A review. Mater. Design 2012, 33, 496–502. [Google Scholar] [CrossRef]
  6. Huang, B.; Dong, Q.; He, W. Laboratory evaluation of reclaimed asphalt pavement used as unbound base material. In Proceedings of the 87th Annual Meeting of Transportation Research Board 2008, National Research Council, Washington, DC, USA, 13–17 January 2008. [Google Scholar]
  7. Xuan, D.X.; Molenaar, A.A.A.; Houben, L.J.M. Shrinkage cracking of cement treated demolition waste as a road base. Mater. Struct. 2016, 49, 631–640. [Google Scholar] [CrossRef]
  8. Fallon, E.; McNally, C.; Gibney, A. Evaluation of fatigue resistance in asphalt surface layers containing reclaimed asphalt. Constr. Build. Mater. 2016, 128, 77–87. [Google Scholar] [CrossRef]
  9. Moghaddam, T.B.; Karim, M.R.; Abdelaziz, M. A review on fatigue and rutting performance of asphalt mixes. Sci. Res. Essays 2011, 6, 670–682. [Google Scholar] [CrossRef]
  10. Underwood, B.S.; Guido, Z.; Gudipudi, P.; Feinberg, Y. Increased costs to US pavement infrastructure from future temperature rise. Nat. Clim. Change 2017, 7, 704–710. [Google Scholar] [CrossRef]
  11. Micaelo, R.; Pereira, A.; Quaresma, L.; Cidade, M.T. Fatigue resistance of asphalt binders: Assessment of the analysis methods in strain-controlled tests. Constr. Build. Mater. 2015, 98, 703–712. [Google Scholar] [CrossRef]
  12. Sheng, Y.P.; Li, H.B.; Zhao, H.S.; Chang, M.F. Effect on mechanical behavior of asphalt pavement structure based on semi-rigid base modulus attenuation. J. Hebei University of Tech. 2016, 45, 101–107. [Google Scholar]
  13. Sheng, Y.P.; Chen, S.F.; Wang, D.; Wang, L.B. Pore water pressure characteristics of semi-rigid base for cement concrete pavement. J. Transp. Eng. 2012, 12, 6–12. [Google Scholar]
  14. Wang, Y.Q.; Tan, Y.Q.; Guo, M.; Liu, Z.Y.; Wang, X.L. Study on the dynamic compressive resilient modulus and frost resistance of semi-rigid base materials. Road Mater. Pavement 2017, 18, 259–269. [Google Scholar] [CrossRef]
  15. Yao, K.; Chen, Q.; Xiao, H.; Liu, Y.; Lee, F.H. Small-strain shear modulus of cement-treated marine clay. J. Mater. Civil Eng. 2020, 32, 04020114. [Google Scholar] [CrossRef]
  16. Yao, K.; Li, N.; Chen, D.H.; Liu, Y. Generalized hyperbolic formula capturing curing period effect on strength and stiffness of cemented clay. Constr. Build. Mater. 2019, 199, 63–71. [Google Scholar] [CrossRef]
  17. Yao, K.; Chen, Q.; Ho, J.; Xiao, H.; Lee, F.H. Strain-dependent shear stiffness of cement-treated marine clay. J. Mater. Civil Eng. 2018, 30, 04018255. [Google Scholar] [CrossRef]
  18. Zhou, H.; Sha, A.M. Analysis on the influence of material composition on semi-rigid base fatigue property. J. Wuhan University of Tech. 2012, 34, 41–45. [Google Scholar] [CrossRef]
  19. Sha, A.M.; Jia, K.; Li, X.G. Fatigue performances of semi-rigid base course materials. J. Transp. Eng. 2009, 9, 29–33. [Google Scholar] [CrossRef] [Green Version]
  20. Standard, No. JTG E30-2005; Test Methods of Cement and Concrete for Highway Engineering. Renmin Communication Press: Beijing, China, 2005.
  21. Standard, No. JTG E51-2009; Test Methods of Materials Stabilized with Inorganic Binders for Highway Engineering. Renmin Communication Press: Beijing, China, 2009.
  22. Standard No. JTG E20-2011; Standard Test Methods of Bitumen and Bituminous Mixtures for Highway Engineering. Renmin Communication Press: Beijing, China, 2011.
  23. Standard, No. JTG D50-2017; Specifications for Design of Highway Asphalt Pavement. Renmin Communication Press: Beijing, China.
  24. Ozer, H. Prediction of pavement fatigue cracking at an accelerated testing section using asphalt mixture performance tests. Int. J. Pavement Eng. 2018, 9, 264–278. [Google Scholar] [CrossRef]
  25. Lv, S.T.; Xia, C.D.; Liu, H.F.; You, L.Y.; Qu, F.T.; Zhong, W.L.; Yang, Y.; Washko, S. Strength and fatigue performance for cement-treated aggregate base materials. Int. J. Pavement Eng. 2019, 22, 690–699. [Google Scholar] [CrossRef]
  26. Ma, Y. The bending fatigue performance of cement-stabilized aggregate reinforced with polypropylene filament fiber. Constr. Build. Mater. 2015, 83, 230–236. [Google Scholar] [CrossRef]
  27. Zhang, J.P.; Cu, S.C.; Cai, J.; Pei, J.Z.; Jia, Y.S. Life-cycle reliability evaluation of semi-rigid materials based on modulus degradation model. KSCE J. Civ. Eng. 2018, 22, 2043–2054. [Google Scholar] [CrossRef]
  28. Xue, J.; Jiang, Y. Analysis on the fatigue properties of vertical vibration compacted lime-fly ash-stabilized macadam. Constr. Build. Mater. 2017, 155, 531–541. [Google Scholar] [CrossRef]
  29. ARA, Inc. ERES Consultants Division, Guide for Mechanistic-Empirical design of new and rehabilitated pavement structure; NCHRP 1-37A Final Report; ARA, Inc.: Villa Park, IL, USA, 2004. [Google Scholar]
  30. ARA, Inc. ERES Division. Guide for Mechanistic-Empirical Design of New and Rehabilitated Pavement Structures 2003; ARA, Inc.: Villa Park, IL, USA, 2003. [Google Scholar]
  31. Kachanov, L.M. Mechanics of Elastic Stability; Martinus Nijhoff Publishers: Leiden, The Netherlands, 1986. [Google Scholar]
  32. Li, S.L.; Wu, G.M.; Wu, H.S. Acoustic emission characteristics of semi-rigid bases with three moisture conditions during bending tests. Road Mater. Pavement 2019, 20, 187–198. [Google Scholar] [CrossRef]
  33. Naser, M.Z.; Alavi, A.H. Error Metrics and Performance Fitness Indicators for Artificial Intelligence and Machine Learning in Engineering and Sciences. Archit. Struc. Constr. 2021, 1–19. [Google Scholar] [CrossRef]
Figure 1. Testing beam specimens from a large beam specimen for the strength and fatigue test.
Coatings 12 00216 g001
Figure 2. Accelerated loading system.
Coatings 12 00216 g002
Figure 3. Full-scale pavement structure design (a) and FWD test in the full-scale pavement (b).
Coatings 12 00216 g003
Figure 4. Dynamic modulus of CSG and LSFG.
Coatings 12 00216 g004
Figure 5. Coefficient of variation of dynamic modulus for CSG and LSFG.
Coatings 12 00216 g005
Figure 6. Flexural-bending strength of CSG and LSFG.
Coatings 12 00216 g006
Figure 7. Initial flexural modulus of CSG and LFSG with different stress–strength ratio.
Coatings 12 00216 g007
Figure 8. Fatigue life of CSG and LFSG in different stress–strength ratios.
Coatings 12 00216 g008
Figure 9. Average fatigue life of CSG and LFSG in different stress–strength ratios.
Coatings 12 00216 g009
Figure 10. Fitting curves of LFSG fatigue test in different stress–strength ratios.
Coatings 12 00216 g010
Figure 11. Fitting curves of CSG fatigue test in different stress–strength ratios.
Coatings 12 00216 g011
Figure 12. Fitting curves of LFSG fatigue test.
Coatings 12 00216 g012
Figure 13. Fitting curves of CSG fatigue test.
Coatings 12 00216 g013
Figure 14. Model of non-linear fatigue damage.
Coatings 12 00216 g014
Figure 15. Development of bending elastic modulus in two regions.
Coatings 12 00216 g015
Figure 16. The modulus of deflection back calculation and degradation model in Structure 1.
Coatings 12 00216 g016
Figure 17. The modulus of deflection back calculation and degradation model in Structure 2.
Coatings 12 00216 g017
Figure 18. The modulus of deflection back calculation and degradation model in Structure 3.
Coatings 12 00216 g018
Table 1. Physical properties of cement used.
Inspection ItemsTest ResultsTechnical Requirement
Fineness (%)Qualified≤10
Water quantity for standard consistence (%)28Actual measurement
Stability (Standardized Approach)Qualified≤5 mm
Setting Time (min)Initial setting210≥45 min
Final setting280≤12 h
Cement mortar strength (MPa)Compressive strength3 d18.9≥16.0
28 d43.1≥42.5
Bending Strength3 d4.5≥3.5
28 d8.23≥6.5
Table 2. Physical and chemistry properties of lime.
Inspection ItemsTest ResultsTest Method
CaO content (%)52.6T 0811-1994
MgO content (%)3.79T 0812-1994
CaO + MgO content (%)56.4T 0813-1994d
Table 3. Physical chemistry properties of fly ash.
Inspection ItemsTest ResultsTechnical Requirement
Loss on ignition (%)3.32≤20
Passing rate (%)0.3 mm99.20≥90
0.075 mm72.30≥70
Chemical component (%)SiO256.62∑ > 70
Fe2O37.05
Al2O327.40
Table 4. Physical properties of aggregates.
Inspection ItemsTest ResultTechnical Requirement
Fine AggregateCoarse Aggregate
Specific gravity (g/cm3)2.732.73≥2.6
Water absorption (%)0.750.38≤2.0
LA Abrasion loss (%)-17.60≤28
Crushing value (%)-14.30≤26
Table 5. Aggregate gradation passing rate of LFSG.
Sieve Pit (mm)31.526.5199.54.752.361.180.60.075
Composed gradation100.097.268.133.515.610.28.16.12.2
Lower limit100954824116200
Upper limit100100683421161263
Table 6. Aggregate gradation passing rate of CSG.
Sieve Pit (mm)31.5199.54.752.360.60.075
Composed gradation100.081.150.526.417.69.03.1
Lower limit1006838221680
Upper limit10086583228153
Table 7. Mixture design of LFSG and CSG.
Stabilized AggregateMixture Ratio
(by Weight)
Moisture Content (%)Maximum Dry Density (g/m3)7d Compressive Strength (MPa)
LFSGlime: fly ash: aggregate = 6: 12: 826.202.130.95
CSGcement: aggregate = 4.5: 1005.302.336.70
Table 8. Mixture design of LFSG and CSG.
Quadratic SumDegree of FreedomStandard DeviationStatistics FConfidence Interval
Fα (1, 20)
α = 0.01
Regression12.401
Residue1.12200.24219.758.10
Sum13.5321 Significant
Table 9. Significance test of CSG fatigue model.
Quadratic SumDegree of FreedomStandard DeviationStatistics FConfidence Interval
Fα (1, 12)
α = 0.01
Regression3.191
Residue0.21120.13185.979.33
Sum3.3913 Significant
Table 10. Significance test of CSG fatigue model.
Quadratic SumDegree of FreedomStandard DeviationStatistics FConfidence Interval
Fα (1, 20)
α = 0.01
Regression19.161
Residue5.63200.5368.098.10
Sum13.5321 Significant
Table 11. Significance test of CSG fatigue model.
Quadratic SumDegree of FreedomStandard DeviationStatistics FConfidence Interval
Fα (1, 12)
α = 0.01
Regression3.201
Residue0.19120.13203.649.33
Sum3.3913 Significant
Publisher’s Note: MDPI stays neutral with regard to jurisdictional claims in published maps and institutional affiliations.

