Abstract
In order to systematically study and develop a type of gussasphalt (GA) mix with superior performance, namely GA-10; the effect of Qingchuan Rock Asphalt (QRA) and Trinidad Lake asphalt (TLA) on the GA-10 mix was assessed based on the study of composite natural asphalt modified gussasphalt (CNAMGA) binder. Various analytical tests were used to evaluate the engineering properties, thermal stability and microstructure of CNAMGA mix. The results indicate that the stability of QRA modified binder and TLA modified binder in the normal temperature range and the high temperature range have been improved, and the temperature susceptibility is reduced. The optimal asphalt–aggregate ratio of the GA mix is determined to be 9.7%, which has good high-temperature stability, low-temperature crack resistance and construction workability. The QRA mix has better high-temperature stability than the TLA mix, whereas the low-temperature cracking resistance of the TLA mix is better than that of the QRA mix. The two kinds of GA-10 mix have similar construction workability. The fact that the abundant fine aggregates wrapped in binder fill the coarse aggregates surface contributes to the better adhesion of the GA asphalt concrete. The distribution of aggregate and binder is relatively uniform with fewer pores, and the overall proportion of the binder is greater than that of aggregate.
1. Introduction
As a type of concrete classification based on construction technology [1], GA concrete presents a flowing state at the appropriate construction temperature, which can autonomously reach the required density and flatness without compaction [2]. Therefore, it is more suitable for bridge deck paving and other construction occasions in which heavy compaction machinery cannot be used. The overlays of an orthotropic deck, which is one of the most effective structure forms for long span bridges, has good durability, fatigue resistance and water resistance. The disposal of which, if not well regulated, could pose a huge concern [3,4,5]. The enclosed space structure of steel box girder bridges exposed to sunlight could lead the overlays’ temperature to reach 70 °C and even higher, so it is extremely important that the overlays be armed with good thermal stability [6]. GA concrete not only meets these performance requirements, but can also effectively resist the stress caused by the partial deflection of steel plate. Simultaneously, it also possesses excellent adhesion and compliance towards the steel bridge deck. Thus, it is suitable for deck paving in the application of long-span and medium-span steel bridges [7,8]. GA was accepted as the preferred overlays for the Hong Kong-Zhuhai-Macao Bridge, which currently keeps the record of the world’s longest cross-sea bridge [9].
Such excellent performance is attributed to the mix proportion design of GA concrete [10,11]. The mix proportion design of GA binder is characterized by the high content of mineral powder, the high content of asphalt binder, the high mixing temperature and the low content of coarse aggregate. Chen et al. [12], Wang and Li [13] investigated the effects of the content and type of binder, mineral filler, aggregate gradation and fabrication technics etc. on gussasphalt performance with fundamental approaches, and thereby obtained the recommended optimum formula, which suggests the TLA content of 25–30%. Different temperatures, asphalt types and filler-asphalt ratios on the high-temperature properties with laboratory testing, Xin et al. [6] found that NES-1 rock asphalt has more significant influence than TLA on improving the high-temperature performance, and Jin et al. [14] thought the generalized shear modulus can be regarded as a stiffness index to evaluate the high temperature stability. Qian et al. [15], Zhang et al. [16] and Wu et al. [17] focused on the influence of different strain levels of loading on the fatigue performance of GA mix. Results show that polymer modified agent can effectively improve the fatigue strength of GA mix, and the loading times can reach millions under 700 με. Modifying Burgers mechanical model, Xie et al. [18] and Luo et al. [19] derived the viscoelastic material parameters with laboratory and theoretical equations. They found that high temperature reduces the viscoelastic deformation recovery ability, increases the viscoelastic residual strain and accelerates the generation of permanent deformation. Based on the physical examinations, Zou et al. [9], Ke et al. [8] and Shan et al. [20] studied the thermo-oxidative aging properties of GA with Fourier transform infrared spectroscopy, the potential applications of GA concrete on bridge deck were evaluated. Given the practical applications on steel bridge deck overlays, generally, the vehicle speed on the bridge deck is faster than that on the common city road, thus, the requirements for rutting resistance of pavement are lower. However, steel deck, as we all know, is strongly susceptible to temperature variation, so it is important to know the stability of asphalt concrete under drastic temperature changes. Temperature susceptibility can be employed to quantify the thermal performance of asphalt concrete [6,21]. However, Zhao et al. [22] claimed that the GA applied in Jiangyin Bridge had a weaker high-temperature stability and less modulus [23], according to the analysis of long-term maintenance data. What can be seen is the urgent need to optimize the gussasphalt concrete to tolerate a more varied application environment.
Note that none of the above studies involves the microscopic study of GA concrete. Materials science research shows that the acquisition or improvement of each specific property is realized through the change of its microstructure [24]. The identification of the chemical components associated with the formation of microstructure can reveal asphalt’s rheology [25,26,27]. The physical properties such as stiffness, elasticity and plasticity, adhesion, surface energy and healing mainly depend on the microstructure [28]. At present, most of the asphalt mix design methods adopt macroscopic parameters as the design index [13,23,27]. However, a mass of engineering practices has proved that current design method cannot control the material performance well. In some cases, the test indicators are the same but the performance varies greatly, implying that some macroscopic design indicators do not conform to the material damage mode [29,30,31,32].
The asphalt binder replaces the coarse aggregate acting as the skeleton structure, and the strength of GA concrete mainly depends on the binder’s properties [33,34]. In addition, air void proportion is an important characteristic that affects the properties of GA concrete, for example, its strength and durability [35]. Caro et al. [36] and Ma et al. [37] revealed the effect of porosity on the fatigue life of asphalt concrete with discrete element and finite element models. In fact, errors in measuring air void proportion with traditional methods are inevitable, even some measures, such as coring, are destructive for pavement. Hoegh et al. [38] conducted a nondestructive assessment of air-void variability using an air-coupled step-frequency array system. Artificial neural networks and multiple linear regression were employed by Zavrtanik et al. [39] to establish the relationship between different parameters and air void content. Without a doubt, understanding the properties of GA concrete at the microscale with modern advanced techniques is beneficial to improving the knowledge of their macro-performance [40]. It was highly evaluated by Mahmud et al. [41] that X-ray Computerized Tomography (CT) provides an all-directional understanding of the distribution and properties of air voids, indicating strongly that CT might have great potential applications in the field.
Using different techniques to study the microstructure of asphalt is conducive to establishing the relationship between the microstructure and the physical properties of asphalt. After foundational laboratory tests, differential scanning calorimetry (DSC), scanning electron microscope (SEM) and X-ray CT, the thermal properties and microstructure and the engineering properties of the composite natural asphalt modified gussasphalt (CNAMGA) mix were revealed. The optimal collocation of CNAMGA mix was determined and verified. What this study indicates can serve as a basis for further research as regards GA.
2. Experimental Materials
2.1. Base Asphalt
The 70 # and 90 # Kunlun-Asphalt (PetroChina Fuel Oil Co., Ltd, Panjin, China). are taken as base asphalt, relevant performance tests are conducted strictly according to the Chinese standard of E20-2011, Standard Test Methods of Bitumen and Bituminous Mixtures for Highway Engineering [42], the results are shown in Table 1 and Table 2.

Table 1.
Technical indexes of 70 # base asphalt.
Table 2.
Technical indexes of 90 # base asphalt.
2.2. Natural Asphalt
In recent years, natural asphalt has been extensively studied and widely used in asphalt pavement, especially the Trinidad Lake Asphalt (TLA) [6,12,43]; the composition of natural asphalt is similar to that of petroleum asphalt, but the content of hard components (resin and asphaltene) is higher in natural asphalt. In China, lake asphalt mainly depends on import from foreign countries. To explore more substitutes with high yield, stable properties and low cost, Chinese Qingchuan Rock Asphalt (QRA) was employed to the fabrication of GA in this study.
2.3. Aggregate and Mineral Filler
Three kinds of basalt aggregate (aggregate I: 0–3 mm, aggregate II: 3–5 mm, aggregate III: 5–10 mm) and limestone mineral filler are adopted for this study, relevant performance tests for aggregate and mineral filler are conducted according to the Chinese standard of E20-2011 [42], the results are provided in Table 3 and Table 4.
Table 3.
Density test of materials.
Table 4.
Passing rate of materials.
2.4. Modifying Agent
To enhance the performance and workability of the construction of the GA mix, modifying agents were necessary in the preparation of the GA mix. The linear structure SBS with a molecular weight of 220–260 kD, block styrene content of 40.4 wt%, Shore A hardness of 82; TR with a molecular weight of 650–2600 kD, specific gravity of 0.97, softening point of 110 °C, glass transition temperature of 84 °C; FEO with a density (20 °C) of 0.994 g/cm3, flashing point of 251 °C, aniline point of 30 °C, kinematic viscosity (100 °C) of 35.36, aromatic hydrocarbon content of 82%, produced by Chong Qing Wu Sheng Building Materials Co., Ltd. (Chongqing, China) and the long-chain aliphatic alkanes SAW with a melting point of 115 °C, flashing point of 290 °C were employed in this study to prepare the modifier. With the consultation of relative references and basic test in the early stage of the study, the modifiers ratio was determined by SBS:SAW:TR:FEO = 2:2:0.5:0.5.
3. Test Methods
3.1. Differential Scanning Calorimetry (DSC)
DSC is a technique for measuring the power and temperature difference between the sample and the reference object under programmed temperature control. The enthalpy change size (the area of the heat absorption peak) and the location of the heat absorption peak (the temperature range of the heat absorption peak) can be realized by the DSC curve. With high accuracy and reproducibility, DSC provides an effective means to quantify the thermal analysis of the asphalt binder [44,45]. The range of measured temperature was between −40 and 140 °C. In a nitrogen atmosphere (flow rate of 20 mL/min), the heating rate was set to 10 °C. The heat flow value of different specimens was recorded at an increment of 20 °C.
3.2. Engineering Properties Examination
The evaluated specimen (70.7 mm × 70.7 mm × 70.7 mm) for the indentation test (Figure 1a) was maintained at a specified temperature (60 °C is used as a design index for the torrid zone in the summer in China, 50 and 40 °C are adopted for the hot zone and warm zone in the summer in China, respectively) in a water bath for at least one hour. The load of 52.5 kg was applied at 0.05 m2 acting area on the specimen, and the depth of the indenter was recorded to the nearest 0.01 mm after 30 and 60 min, respectively. The depth of the indenter recorded at 30 min is defined as the indentation (technical requirements 1–4 mm), and the depth increment of the indenter between 30 and 60 min is defined as the indentation increment (technical requirements ≤0.4 mm).

Figure 1.
Performance test, (a) indentation test; (b) Low-temperature bending test.
The Lueer fluidity test instrument consists of a container, a support frame and a 995 g dombra-shaped drop hammer made of brass. An indicator of 50 mm was marked on the upper part of the bar of the drop hammer. The time required for the mix at 240 °C to pass from the container through the 50 mm indicator is called the Lueer fluidity [13,46], it is advisable to keep the fluidity within 3–20 s.
The low-temperature bending test (Figure 1b) was conducted according to the Technical Guide on Design and Construction of Bridge Deck Paving of Highway Steel Box Girder. At the specified temperature of −10 °C, the specimen (300 mm × 100 mm × 50 mm) was loaded at the loading velocity of 50 mm/min through the MTS810 testing machine. The data acquisition system automatically collected electrical signals from sensors and displacement meters. The ultimate tensile strain should be not less than 8 × 10³ μ.
The wheel tracking test was conducted at 60 °C in a dry environment. A device like the Hamburg Wheel-Tracking device, a solid-steel wheel traveling at a speed of 42 cycles/min, was applied on a specimen (300 mm × 300 mm × 70 mm). The minimum requirement of the dynamic stability was 350 cycle/mm for a GA mix. Without an interlocking skeleton structure of coarse aggregates, the GA mix may show a weakness of rutting. Therefore, the dynamic stability requirement for a GA mix is lower than that of other common mixes, which is to be around 1500 cycle/mm.
The preparation of specimens for different tests is listed in Table 5.
Table 5.
The preparation of specimens.
3.3. Scanning Electron Microscopy (SEM)
SEM is the most widely used method for sample characterization, which is convenient for observing and analyzing the surface morphology and sample structure. Realizing the observation and analysis of samples from macro to micro dimensions, the magnification times of SEM can be continuously adjustable in the range from several times to several hundred thousand times. Additionally, SEM can be equipped with different detectors and can observe the dynamic process in real time. FEI Quanta 200 SEM (Hillsborocity, OR, USA) was employed for this study, a specimen taken from mix was subjected to the metal spraying process.
3.4. X-ray Computerized Tomography (CT)
Slice images obtained through X-ray CT can truly reflect the heterogeneous and multi-level structure characteristics of the bituminous mixture [47,48]. Taking the evaluated bituminous mixture specimen in this study as an example, after X-rays emitted by the Xradia 510 Versa microscope (Oberkochen, Germany) traverses the specimen, the recorded CT numbers are reconstructed and transformed into a series of visualized grayscale images (Figure 2a) by three-dimensional image processing techniques [49,50]. Denser materials (Figure 2(bi)) in asphalt mixture absorb more X-rays; therefore, they show greater intensity and appear to be brighter, and air voids (Figure 2(bii)) appear to be darker. The density of asphalt mastic (Figure 2(biii)) is between aggregate and air voids, it presents as gray and black in the image. The perspective of each phase of the asphalt mixture specimen can be quickly and easily presented and separated for further analysis after computer image processing.
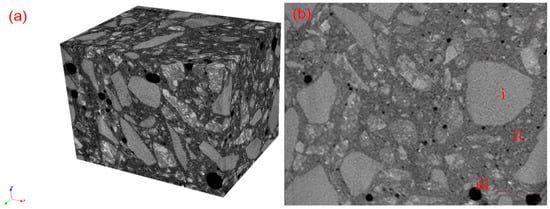
Figure 2.
Grayscale treatment of CT, (a) 3D reconstruction; (b) CT slice image i: Aggregate, ii: Air void, iii: Asphalt mastic.
4. CNAMGA Binder
4.1. Fabrication and Examination
Two kinds of natural asphalt (QRA and TLA) and modifier (SBS:SAW:TR:FEO = 2:2:0.5:0.5) were used for specimen fabrication. Published work [12] indicated that a limited increase in the softening point was found at a TLA content of less than 20% when TLA only acted as a disperse additive, and reference [51] showed that the QRA content of 8% had no considerably adverse influence on low-temperature performance. In view of the addition of a modifier, 20% TLA for 70 # base asphalt and 12.5% QRA for 90 # base asphalt were determined. Standby base asphalt (70 # and 90 #) were heated to reach a flowing state in the constant temperature oven at 145 °C, then a proper amount of base asphalt was heated up to 165 °C in the magnetic stirring electric heating mantle. SBS was added bit by bit until all the SBS was added, while the binder was being stirred for 40–50 min, according to the content of natural asphalt (20% TLA for 70 # base asphalt and 12.5% QRA for 90 # base asphalt), a corresponding amount of asphalt was weighted. SAW, TR and QRA were added a small amount at a time until the required amount had been added, while the binder was being stirred for 1 h. Then, keeping the mixing temperature under 180 °C, the asphalt binder was stirred with homomixer at a speed of 3500 rpm for 40–50 min. Finally, specimens were prepared and subjected to a physical performance test.
The asphalt penetration test (25 °C, 100 g, 5 s), ductility test (10 °C, 5 cm/min) softening point test (R&B), RTFOT (163 °C, evaporation for 5 h) were conducted respectively according to the T0604-2011, T0605-2011 and T0606-2011 and T0608-1993 of E20-2011. The dynamic shear rheometer (DSR, Malvern, UK) test and bending beam rheometer (BBR) test were conducted in accordance with the procedures outlined in AASHTO T 315 [52] and AASHTO T 313 [53], respectively. On the basis of these previous works, the results are shown in Table 6. It can be seen from test results that all four kinds of collocation meet the technical requirements.
Table 6.
CNAMGA binder properties.
4.2. Temperature Susceptibility Examination
The rheological properties and thermal stability are of significance for a GA binder; therefore, DSC was employed to explore the aggregation state condition of two types of natural asphalt in different modified asphalt and to characterize the asphalt binders. The DSC curve is presented and the determination of the baseline and peak area is shown in Figure 3.
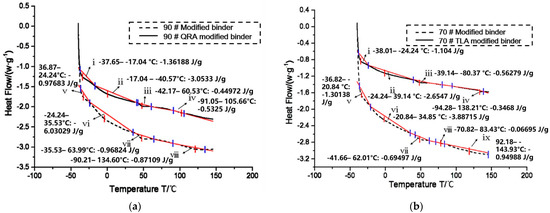
Figure 3.
The DSC curve of (a) 90 # modified asphalt and 90 # QRA asphalt; (b) 70# modified asphalt and 70# TLA asphalt.
An exothermic and endothermic effect is detected during the cooling and heating scan that represents the wax fractions in asphalt crystallization and melting, respectively. It can be seen from Figure 3a, in the temperature range of −40–−36 °C, that there is no obvious change between the curve of 90 # modified asphalt and QRA modified binder. With the increase in temperature, binder changes from a glass state to a viscoelastic state. The endothermic peak area of the QRA modified binder increased by 39.4% compared with that of the 90 # modified binder within the temperature range of −35–−20 °C. In the ranges of −20–40, 30–65 and 90–140 °C, compared with the 90 # modified binder, the endothermic peak area of the QRA modified binder decreased by 39.4%, 53.6% and 38.9%, respectively. The above changes in the endothermic peak area indicate that the change in enthalpy at 30–65 °C is smaller than that of other temperature ranges, which results in a smaller endothermic peak area of the QRA modified binder. It follows that most wax fractions in the QRA modified binder remains constant, the stability of the QRA modified binder in the normal temperature range and the high temperature range has been improved, and the temperature susceptibility is reduced.
In the temperature range of −40–−38 °C, there is no obvious change between the curve of the 90 # modified binder and the TLA modified binder. The fact that no endothermic peak occurs in this temperature range indicates that the glass transition temperature of asphalt is not changed by the incorporation of TLA. In the ranges of −21–35, −40–83 and 92–144 °C, compared with the 90 # modified binder, the endothermic peak area of the TLA modified binder decreased by 31.7%, 29.6% and 63.5%, respectively. The above changes in the endothermic peak area indicate that the endothermic peak area is smaller at 92–144 °C, where most wax fractions in the TLA modified binder remain constant. The changes indicate that the stability of the TLA modified binder in the high temperature range has clearly been improved, and that the temperature susceptibility is effectively reduced.
The above results of the experiment show that the modified asphalt forms a more stable aggregation structure due to the addition of TLA and QRA; therefore, the two binders are employed to prepare the GA-10 mix.
5. GA-10 Mix
5.1. Proportions of Composite Natural Asphalt Modified Gussasphalt Mix
GA contained a high content of asphalt binder and mineral powder, therefore, the mix design of the GA mix is different from that of other asphalt mix, different countries also have different design characteristics according to their own engineering practice experience and their own climatic conditions [10]. Basalt aggregate and limestone mineral filler have three particle sizes (5–10 mm, 3–5 mm, 0–3 mm), the proportions of TLA mix are aggregate III:aggregate II:aggregate I:mineral filler = 23%:11%:39%:27%, the proportions of the QRA mix are aggregate III:aggregate II:aggregate I:mineral filler = 27%:16%:30%:27%, the two kinds of GA-10 mix gradation is shown in Figure 4.
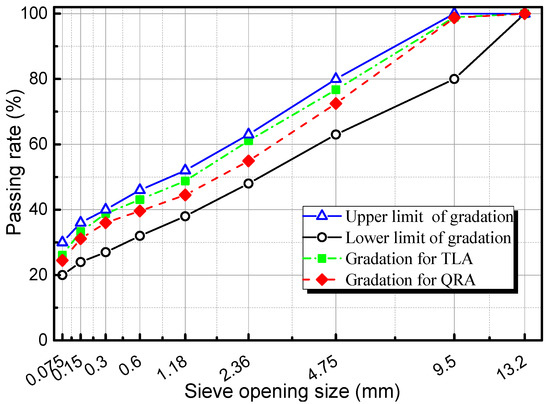
Figure 4.
GA-10 gradation curve.
The GA mix with continuous gradation contains more fine aggregate, free asphalt binder also accounts for a large part of it, therefore, the internal friction angle of the mix is smaller; its shear strength mainly depends on the cohesive force of binder. It can be seen that the content of asphalt binder is an important factor affecting the performance of the GA mix. In this study, the asphalt–aggregate ratio sweeps from 9.1% to 10.3% at an increment of 0.3%. Because the type of binder has little influence on the pavement performance of the mix, based on the five kinds of asphalt–aggregate ratio, the QRA mix is taken as an example to be subjected to the performance test.
5.2. Asphalt–Aggregate Ratio
The indentation test was used to evaluate the mix strength and high-temperature deformation resistance. According to the different asphalt–aggregate ratios, the corresponding asphalt mix was prepared at the mixing temperature of 240 °C, and then the indentation test was carried out. Figure 5 depicts the results of the indentation test.
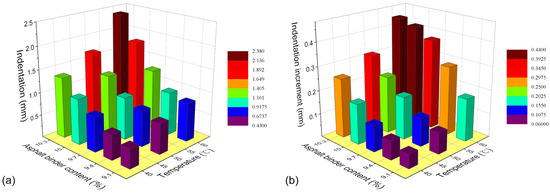
Figure 5.
Influence of asphalt content on (a) indentation and (b) the indentation increment.
As can be seen from Figure 5, with the climbing asphalt content, the indentation and the indentation increment of the GA mix gradually increase at the same temperature, with the ascending test temperature; the indentation and indentation increment of the GA mix gradually rise at the same asphalt content. When the temperature goes up from 40 to 60 °C, the indentation of the five asphalt–aggregate ratios from 9.1 to 10.3% increase by 97.7%, 70.9%, 70.1%, 84% and 78.9%, respectively, the indentation increment of the five asphalt–aggregate ratios from 9.1 to 10.3% soar by 200%, 262.5%, 245.5%, 147.1% and 76%, respectively, this shows that the indentation with the asphalt–aggregate ratio of 9.4% or 9.7% is less affected by temperature, and that the indentation increment with the asphalt–aggregate ratio of 10.0% or 10.3% has weaker temperature susceptibility. According to the Technical Guide on Design and Construction of Bridge Deck Paving of Highway Steel Box Girder, the indentation and indentation increment with the asphalt–aggregate ratio of 9.7% can simultaneously meet the requirements for the torrid zone in the summer in China; when the asphalt–aggregate ratio is 10% or 10.3%, the indentation and indentation increment can simultaneously meet the requirements for the hot or warm zone in the summer in China.
Lueer fluidity is an important index to characterize the construction workability of the GA mix. Low-temperature crack resistance refers to ability of the asphalt mixture to resist cracking diseases at low temperatures, the low-temperature bending test and Lueer fluidity test results were performed and the results are given in Figure 6.
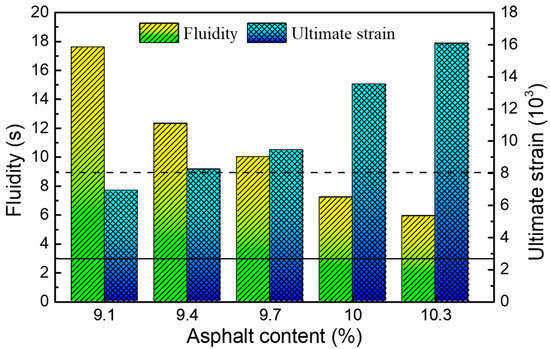
Figure 6.
Influence of asphalt content on fluidity and ultimate strain. Note: fluidity value above the solid line, ultimate strain value above the dash line meets the requirements.
Figure 6 shows that the fluidity of the GA-10 mix declines with the ascending asphalt content, which indicates that the mix becomes easier to pour with the increase of the asphalt–aggregate ratio. Note that when the asphalt–aggregate ratio rises from 9.1% to 10.3%, the fluidity reduces from 17.6 to 5.9 s, with a decrease of 66.5%, but the fluidity still meets the requirements. The ultimate strain of the GA-10 mix rises with the increase of the asphalt content, which indicates that the low-temperature crack resistance of the mix has been improved with the climbing asphalt–aggregate ratio. The ultimate strain of the GA-10 mix rises from 6890 to 16,073 μ, with an increase of 133.3%, however, it cannot meet the requirements when the asphalt–aggregate ratio is less than 9.4%. Taking all the above factors into consideration, the optimal asphalt–aggregate ratio of the GA-10 mix is determined to be 9.7%, it meets the design requirements and has good high-temperature stability, low-temperature crack resistance and construction workability.
5.3. Verification Examinations
The wheel tracking test is a direct test to evaluate the performance of pavement under dynamic load, it is also used to evaluate the high-temperature stability of the GA mix. The road performance of the two GA-10 mixes was further compared and verified. The mix specimens with the optimal asphalt–aggregate ratio were tested. The test results are shown in Table 7.
Table 7.
Performance of two kinds of GA-10.
As can be seen from Table 6, the indentation and indentation increment of the QRA mix at 60 °C test temperature are less than that of the TLA mix, the dynamic stability of the QRA mix at 60 °C test temperature is larger than that of the TLA mix, which indicates that the QRA mix has better high-temperature stability than the TLA mix, which confirms the previous conclusion of the DSC. However, the ultimate strain of the TLA mix is 1.59 times as that of the QRA mix; thus, the low-temperature cracking resistance of the TLA mix is better than that of the QRA mix. The two kinds of GA-10 mix do not differ much in fluidity, which implies that they two have similar construction workability.
6. Microstructure Characterization
6.1. SEM Detection
The successful application of modern detection technologies has made the examination of the asphalt mix even better [54,55]; with the help of SEM, the morphology of the mix can be revealed distinctly [56,57,58]. The two kinds of GA-10 mix were subjected to the SEM detection; the effect of the modifier and natural asphalt on the asphalt mix microstructure was characterized and studied. The images are given in Figure 7.
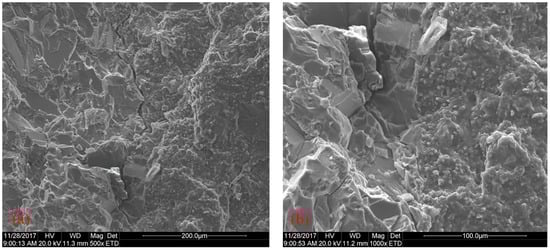

Figure 7.
The SEM images of the (a) QRA mix (200 μm); (b) QRA mix (100 μm); (c) TLA mix (200 μm) and (d) TLA mix (100 μm).
Figure 7 demonstrates the accuracy of the size and appearance of the different components the two kinds of GA-10 mix; it shows that the modifier distributes and interconnects well with the asphalt in the mix. Figure 7a depicts that the fine aggregates wrapped by the binder contribute to the better adhesion of the GA asphalt concrete interior. Figure 7b further displays the stable interface between the coarse aggregates and binder; the fissures and holes on the aggregate surface are effectively filled and glued. Figure 7c,d also depict the phenomenon of the evenly distributed coarse aggregate densely packed by binder, the rough surface of coarse aggregate can be filled by abundant fine particles in binder, which is also conducive to the combination of the binder and aggregate. The whole structure network is established by the modifier and binder, which may, to a certain extent, be responsible for the physical properties, such as elastic-plastic, stiffness and surface healing.
6.2. CT Detection
The two kinds of GA-10 were subjected to CT detection. According to the distribution characteristics of gray value in the grey histogram, the objects distributed on the darker gray level form a wave crest, and the background distributed on the brighter gray level forms another crest. The gray value at the valley bottom between the two crests is used as the threshold value. Based on the self-compiled program of MATLAB, the threshold division range of aggregate, binder and air void could be determined according to the gray histogram. These components were then subjected to recognition and segmentation; the processing results of four arbitrary cross-sections are shown in Figure 8.
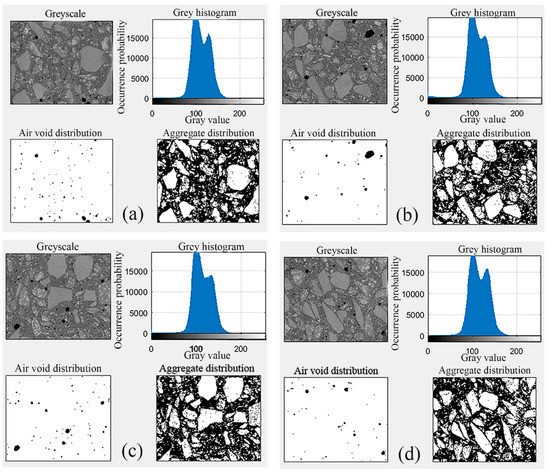
Figure 8.
Images after greyscale treatment at the position of (a) one third of the TLA mix specimen length, (b) two thirds of the TLA mix specimen length, (c) one third of the QRA mix specimen length and (d) two thirds of the QRA mix specimen length.
As can be seen from Figure 8, the air void proportion is less; the threshold division range of air void is determined reasonably. In the aggregate distribution diagram, the aggregates are evenly distributed; the proportion of coarse and fine aggregates is appropriate, but there are some dots on the aggregates. The reason may be that the threshold is not determined properly, or there is asphalt binder adhering in the inner pore of aggregate. Ten pieces of CT cross-sections were taken from each of the two kinds of GA-10 mix at different positions. The proportion of air voids, aggregates and binder were calculated with repeatability tests; the results are given in Figure 9, on the left part of dash line in Figure 9 is the QRA mix, the right one is the TLA mix.
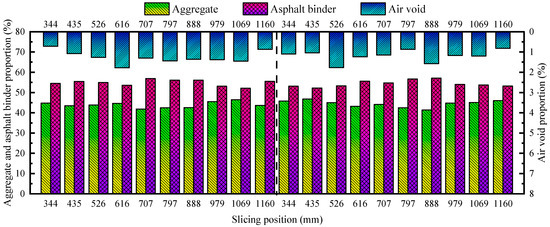
Figure 9.
The proportion of air voids, aggregates and binder.
According to the data of twenty slicing images, the internal air void distribution of the two GA-10 mix specimens is relatively uniform with no obvious upward or downward trend, and the overall air void proportion fluctuates between 0.8% and 1.8%. The average air void proportion of the QRA mix is 1.27%, the average air void proportion of the TLA mix is 1.19%. The air void proportion at the upper and lower ends of specimen is relatively small and that of the middle part is larger. With the help of CT technology, it can be accurately seen that the air void proportion of the whole specimen is higher than the specified value by 1%. The aggregate proportion fluctuates between 41% and 47%, the average aggregate proportion of the QRA mix is 43.27%, the average aggregate proportion of the TLA mix is 44.44%. The asphalt binder proportion fluctuates between 52% and 57%, the average asphalt binder proportion of the QRA mix is 54.83%, the average asphalt binder proportion of the TLA mix is 54.37%. The maximum fluctuation range of the aggregate and binder proportion of the two GA-10 mix is not more than 6%, thus, it can be concluded that the distribution of aggregate and binder is relatively uniform with fewer pores and that the overall proportion of binder is greater than that of aggregate.
7. Conclusions
This study evaluated the thermal properties and microstructure, and engineering properties of the CNAMGA mix. The optimal collocation of the CNAMGA mix was determined and verified. The following conclusions can be drawn based on the aforementioned results and discussion.
(1) The asphalt forms a more stable aggregation structure due to the addition of natural asphalt. The stability of the QRA modified binder in the normal temperature range and the high temperature range has been clearly improved, the TLA modified binder in the high temperature range has been clearly improved, and the temperature susceptibility of both is reduced.
(2) The optimal asphalt–aggregate ratio of the GA mix is determined to be 9.7%, the QRA mix has better high-temperature stability than the TLA mix, which confirms the previous conclusion of the DSC. However, the low-temperature cracking resistance of the TLA mix is better than that of the QRA mix. The two kinds of GA-10 mix have similar construction workability.
(3) That fact that the abundant fine aggregates wrapped in binder fill the coarse aggregates surface contributes to the better adhesion of the GA asphalt concrete. The distribution of aggregate and binder is relatively uniform with fewer pores, and the overall proportion of binder is greater than that of aggregate.
Author Contributions
Conceptualization, H.S. and P.J.; methodology, Y.D.; software, P.J.; writing—original draft preparation, P.J.; writing—review and editing, H.S. and Y.L.; visualization, L.P. and Y.W.; supervision, H.S. and Y.L.; project administration, L.P. and X.S.; funding acquisition, H.S. All authors have read and agreed to the published version of the manuscript.
Funding
This research was funded by the China Postdoctoral Science Foundation (Grant No. 2019M662442), the National Natural Science Foundation of China (No. 51803109), and the Young Talent of Lifting engineering for Science and Technology in Shandong (SDAST2021qt01).
Institutional Review Board Statement
Not applicable.
Informed Consent Statement
Not applicable.
Data Availability Statement
The data used to support the findings of this study are available from the corresponding author upon request.
Acknowledgments
The authors wish to express their sincere gratitude for the support of the Shandong Jiaotong University and Shandong University.
Conflicts of Interest
The authors declare no conflict of interest.
References
- Wu, W.; He, Z.; Hao, Z.; Zhang, H. Experimental study on fatigue performance of gussasphalt mixture. J. Wuhan Univ. Technol. Mater. Sci. Ed. 2014, 29, 745–750. [Google Scholar] [CrossRef]
- Wang, M.; Zhang, H.; Zhu, M.; Hao, Z.; Xue, X. Research on structure and properties of embedded Gussasphalt. In Proceedings of the GeoHunan International Conference, Hunan, China, 9–11 June 2011. [Google Scholar]
- Qiu, Y.; An, S.; Rahman, A.; Ai, C. Evaluation and optimization of bridge deck waterproof bonding system using multi-objective grey target decision method. Road Mater. Pavement Des. 2019, 21, 1844–1858. [Google Scholar] [CrossRef]
- Jia, X.; Huang, B.; Chen, S.; Shi, D. Comparative investigation into field performance of steel bridge deck asphalt overlay systems. KSCE J. Civ. Eng. 2016, 20, 2755–2764. [Google Scholar] [CrossRef]
- Liu, Y.; Qian, Z.; Hu, J.; Jin, L. Temperature behavior and stability analysis of orthotropic steel bridge deck during gussasphalt pavement paving. J. Bridg. Eng. 2018, 23, 04017117. [Google Scholar] [CrossRef]
- Xin, C.; Lu, Q.; Ai, C.; Rahman, A.; Qiu, Y. Optimization of hard modified asphalt formula for gussasphalt based on uniform experimental design. Constr. Build. Mater. 2017, 136, 556–564. [Google Scholar] [CrossRef]
- Luo, S.; Qian, Z.; Yang, X.; Lu, Q. Laboratory evaluation of double-layered pavement structures for long-span steel bridge decks. J. Mater. Civ. Eng. 2018, 30, 04018111. [Google Scholar] [CrossRef]
- Ke, Z.; Mingzhi, S.; Yunjie, Q. Study on the Rheological Properties of Gussasphalt after Superheat Aging. In IOP Conference Series: Earth and Environmental Science; IOP Publishing: Bristol, UK, 2019. [Google Scholar]
- Zou, G.; Xu, X.; Li, J.; Yu, H.; Wang, C.; Sun, J. The effects of bituminous binder on the performance of gussasphalt concrete for bridge deck pavement. Materials 2020, 13, 364. [Google Scholar] [CrossRef] [Green Version]
- Zhang, R.; Huang, X.; Zhao, Y. Design of gussasphalt gradation. Dongnan Daxue Xuebao (Ziran Kexue Ban)/J. Southeast Univ. (Nat. Sci. Ed.) 2007, 47, 661–665. [Google Scholar]
- Luo, S.; Qian, Z.; Yang, X.; Wang, H. Design of gussasphalt mixtures based on performance of gussasphalt binders, mastics and mixtures. Constr. Build. Mater. 2017, 156, 131–141. [Google Scholar] [CrossRef]
- Chen, J.S.; Liao, M.C.; Huang, C.C.; Wang, C.H. Fundamental characterization of engineering properties of gussasphalt mixtures. J. Mater. Civ. Eng. 2011, 23, 1719–1726. [Google Scholar] [CrossRef]
- Wang, H.; Li, G. Study of factors influencing gussasphalt mixture performance. Constr. Build. Mater. 2015, 101, 193–200. [Google Scholar] [CrossRef]
- Jin, L.; Qian, Z.; Zheng, Y. High temperature performance and evaluation index of gussasphalt mortar based on DMA method. Dongnan Daxue Xuebao (Ziran Kexue Ban)/J. Southeast Univ. (Nat. Sci. Ed.) 2014, 44, 1062–1067. [Google Scholar] [CrossRef]
- Qian, J.; Wang, Q.; Wu, W.; Zhang, H. Fatigue performance of gussasphalt concrete made from modified AH-70# asphalt. Mater. Des. 2013, 52, 686–692. [Google Scholar] [CrossRef]
- Zhang, H.; Qian, J.S.; Wu, W.J.; Zhang, F.; Hao, Z.H. Fatigue life analysis of Gussasphalt concrete based on energy method. Tumu Jianzhu yu Huanjing Gongcheng/J. Civ. Archit. Environ. Eng. 2010, 32, 135–140. [Google Scholar]
- Wu, W.J.; He, Z.Y.; Hao, Z.H.; Wang, M. Differences in fatigue behavior among the Gussasphalt, SMA and AC. In Advanced Materials Research; Trans Tech Publications, Ltd.: Bach, Swizerland, 2013. [Google Scholar]
- Xie, F.; Zhang, D.; Zhou, A.; Ji, B.; Chen, L. On the viscoelastic parameters of gussasphalt mixture based on modified burgers model: Deviation and experimental verification. Adv. Mater. Sci. Eng. 2017, 2017, 4324765. [Google Scholar] [CrossRef] [Green Version]
- Luo, R.; Shi, C.; Fan, X.; Feng, G. Research on permanent deformation of gussasphalt mixture under dynamic penetration. Huazhong Keji Daxue Xuebao (Ziran Kexue Ban)/J. Huazhong Univ. Sci. Technol. (Nat. Sci. Ed.) 2018, 46, 13–16. [Google Scholar] [CrossRef]
- Shan, H.; Li, Q.; Mi, L.; Ye, Q.; Jia, X. Failure mechanism of shoving on steel bridge deck with gussasphalt overlay. Tumu Jianzhu yu Huanjing Gongcheng/J. Civ. Archit. Environ. Eng. 2016, 38, 104–109. [Google Scholar] [CrossRef]
- Pouget, S.; Sauzéat, C.; Di Benedetto, H.; Olard, F. Numerical simulation of the five-point bending test designed to study bituminous wearing courses on orthotropic steel bridge. Mater. Struct. 2010, 43, 319–330. [Google Scholar] [CrossRef]
- Zhao, Y.; Ni, F.; Zhou, L.; Jiang, J. Performance evaluation of long-span suspension bridge pavement based on long-term maintenance data. J. Mater. Civ. Eng. 2020, 32, 04019363. [Google Scholar] [CrossRef]
- Yao, B.; Cheng, G.; Wang, X.; Cheng, C. Characterization of the stiffness of asphalt surfacing materials on orthotropic steel bridge decks using dynamic modulus test and flexural beam test. Constr. Build. Mater. 2013, 44, 200–206. [Google Scholar] [CrossRef]
- Mazumder, M.; Ahmed, R.; Wajahat Ali, A.; Lee, S.J. SEM and ESEM techniques used for analysis of asphalt binder and mixture: A state of the art review. Constr. Build. Mater. 2018, 186, 313–329. [Google Scholar] [CrossRef]
- Das, P.K.; Baaj, H.; Tighe, S.; Kringos, N. Atomic force microscopy to investigate asphalt binders: A state-of-the-art review. Road Mater. Pavement Des. 2016, 17, 693–718. [Google Scholar] [CrossRef]
- Yu, X.; Burnham, N.A.; Tao, M. Surface microstructure of bitumen characterized by atomic force microscopy. Adv. Colloid Interface Sci. 2015, 218, 17–33. [Google Scholar] [CrossRef] [PubMed]
- Singh, D.; Sawant, D. Understanding effects of RAP on rheological performance and chemical composition of SBS modified binder using series of laboratory tests. Int. J. Pavement Res. Technol. 2016, 9, 178–189. [Google Scholar] [CrossRef] [Green Version]
- Kim, H.H.; Mazumder, M.; Torres, A.; Lee, S.-J.; Lee, M.-S. Characterization of CRM binders with wax additives using an atomic force microscopy (afm) and an optical microscopy. Adv. Civ. Eng. Mater. 2017, 6, 504–525. [Google Scholar] [CrossRef]
- Yao, H.; You, Z. Effectiveness of micro-and nanomaterials in asphalt mixtures through dynamic modulus and rutting tests. J. Nanomater. 2016, 2016, 2645250. [Google Scholar] [CrossRef] [Green Version]
- Du, S. Interaction mechanism of cement and asphalt emulsion in asphalt emulsion mixtures. Mater. Struct. 2014, 47, 1149–1159. [Google Scholar] [CrossRef]
- Kim, H.H.; Lee, M.S.; Lee, S.J. Identification of the microstructural components of crumb rubber modified asphalt binder (CRMA) and the feasibility of using environmental scanning electron microscopy (ESEM) coupled with energy dispersive X-ray spectroscopy (EDX). Int. J. Highw. Eng. 2016, 18, 41–50. [Google Scholar] [CrossRef]
- Cavalli, M.C.; Griffa, M.; Bressi, S.; Partl, M.N.; Tebaldi, G.; Poulikakos, L.D. Multiscale imaging and characterization of the effect of mixing temperature on asphalt concrete containing recycled components. J. Microsc. 2016, 264, 22–33. [Google Scholar] [CrossRef] [PubMed]
- Widyatmoko, I.; Elliott, R.C.; Read, J.M. Development of heavy-duty mastic asphalt bridge surfacing, incorporating trinidad lake asphalt and polymer modified binders. Road Mater. Pavement Des. 2005, 6, 469–483. [Google Scholar] [CrossRef]
- Artamendi, I.; Allen, B.; Allpress, C.; Phillips, P.; Wingrove, C. Resurfacing of the queen elizabeth ii bridge: Binder selection and evaluation. In Bearing Capacity of Roads, Railways and Airfields, Proceedings of the 10th International Conference on the Bearing Capacity of Roads, Railways and Airfields, BCRRA 2017, Athens, Greece, 28–30 June 2017; CSC Press: Boca Raton, FL, USA, 2017. [Google Scholar]
- Nambiar, E.K.K.; Ramamurthy, K. Air-void characterisation of foam concrete. Cem. Concr. Res. 2007, 37, 221–230. [Google Scholar] [CrossRef]
- Caro, S.; Diaz, A.; Rojas, D.; Nuñez, H. A micromechanical model to evaluate the impact of air void content and connectivity in the oxidation of asphalt mixtures. Constr. Build. Mater. 2014, 61, 181–190. [Google Scholar] [CrossRef]
- Ma, T.; Zhang, Y.; Zhang, D.; Yan, J.; Ye, Q. Influences by air voids on fatigue life of asphalt mixture based on discrete element method. Constr. Build. Mater. 2016, 126, 785–799. [Google Scholar] [CrossRef]
- Hoegh, K.; Khazanovich, L.; Dai, S.; Yu, T. Evaluating asphalt concrete air void variation via GPR antenna array data. Case Stud. Nondestruct. Test. Eval. 2015, 3, 27–33. [Google Scholar] [CrossRef] [Green Version]
- Zavrtanik, N.; Prosen, J.; Tušar, M.; Turk, G. The use of artificial neural networks for modeling air void content in aggregate mixture. Autom. Constr. 2016, 63, 155–161. [Google Scholar] [CrossRef]
- Yang, J.; Zhu, X.; Yuan, Y.; Li, L. Effects of aging on micromechanical properties of asphalt binder using AFM. J. Mater. Civ. Eng. 2020, 32, 04020081. [Google Scholar] [CrossRef]
- Mahmud, M.Z.H.; Hassan, N.A.; Hainin, M.R.; Ismail, C.R. Microstructural investigation on air void properties of porous asphalt using virtual cut section. Constr. Build. Mater. 2017, 155, 485–494. [Google Scholar] [CrossRef]
- Code of China. JTG E20-2011, Standard Test Methods of Bitumen and Bituminous Mixtures for Highway Engineering; China Communications Press: Beijing, China, 2011. [Google Scholar]
- Luo, S.; Lu, Q.; Qian, Z.; Wang, H.; Huang, Y. Laboratory investigation and numerical simulation of the rutting performance of double-layer surfacing structure for steel bridge decks. Constr. Build. Mater. 2017, 144, 178–187. [Google Scholar] [CrossRef]
- Das, P.K.; Kringos, N.; Birgisson, B. Microscale investigation of thin film surface ageing of bitumen. J. Microsc. 2014, 254, 95–107. [Google Scholar] [CrossRef] [PubMed] [Green Version]
- Das, P.K.; Kringos, N.; Wallqvist, V.; Birgisson, B. Micromechanical investigation of phase separation in bitumen by combining atomic force microscopy with differential scanning calorimetry results. Road Mater. Pavement Des. 2013, 14, 25–37. [Google Scholar] [CrossRef]
- Guilian, Z.; Xiaoning, Z.; Wu, C. Evaluation of steel bridge deck ma mixture properties during construction. J. Mar. Sci. Technol. 2015, 23, 293–301. [Google Scholar] [CrossRef]
- Evans, C.L.; Wightman, E.M.; Yuan, X. Quantifying mineral grain size distributions for process modelling using X-ray micro-tomography. Miner. Eng. 2015, 82, 78–83. [Google Scholar] [CrossRef]
- Cnudde, V.; Boone, M.N. High-resolution X-ray computed tomography in geosciences: A review of the current technology and applications. Earth-Sci. Rev. 2013, 123, 1–17. [Google Scholar] [CrossRef] [Green Version]
- Jin, C.; You, Z.; Zhang, W.; Liu, K. Microstructural modeling method for asphalt specimens supporting 3D adaptive and automatic mesh generation. J. Comput. Civ. Eng. 2016, 30, 04015013. [Google Scholar] [CrossRef]
- Chen, L.; Wang, Y. Improved image unevenness reduction and thresholding methods for effective asphalt X-ray CT image segmentation. J. Comput. Civ. Eng. 2017, 31, 04017002. [Google Scholar] [CrossRef]
- Lu, Z.; He, Z.; Yu, Q.; Gang, H. Influence of rock asphalt modified asphalt on asphalt rheological property. Chongqing Jiaotong Univ. (Nat. Sci. Version) 2009, 28, 543–547. [Google Scholar]
- American Association of State Highway and Transportation Officials. AASHTO T 315, Standard Method of Test for Determining the Rheological Propertiesof Asphalt Binder Using a Dynamic ShearRheometer (DSR); American Association of State Highway and Transportation Officials: Washington, DC, USA, 2012. [Google Scholar]
- American Association of State Highway and Transportation Officials. AASHTO T 313, Standard Method of Test for Determining the Flexural Creep Stiffnessof Asphalt Binder Using the Bending BeamRheometer (BBR); American Association of State Highway and Transportation Officials: Washington, DC, USA, 2016. [Google Scholar]
- Al-Rawashdeh, A.S.; Sargand, S. Performance assessment of a warm asphalt binder in the presence of water by using surface free energy concepts and nanoscale techniques. J. Mater. Civ. Eng. 2014, 26, 803–811. [Google Scholar] [CrossRef]
- Nazzal, M.D.; Abu-Qtaish, L.; Kaya, S.; Powers, D. Using atomic force microscopy to evaluate the nanostructure and nanomechanics of warm mix asphalt. J. Mater. Civ. Eng. 2015, 27, 04015005. [Google Scholar] [CrossRef]
- Fang, X.; Chen, Z.; Jiao, Z.; Xiao, G.; Shao, L. Study on microstructure, rheology and thermal stability of cement epoxy asphalt mortar multiphase materials. Mag. Concr. Res. 2013, 65, 475–485. [Google Scholar] [CrossRef]
- Qin, Q.; Farrar, M.J.; Pauli, A.T.; Adams, J.J. Morphology, thermal analysis and rheology of Sasobit modified warm mix asphalt binders. Fuel 2014, 115, 416–425. [Google Scholar] [CrossRef]
- Menapace, I.; Masad, E.; Bhasin, A.; Little, D. Microstructural properties of warm mix asphalt before and after laboratory-simulated long-term ageing. Road Mater. Pavement Des. 2015, 16, 2–20. [Google Scholar] [CrossRef]
Publisher’s Note: MDPI stays neutral with regard to jurisdictional claims in published maps and institutional affiliations. |
© 2022 by the authors. Licensee MDPI, Basel, Switzerland. This article is an open access article distributed under the terms and conditions of the Creative Commons Attribution (CC BY) license (https://creativecommons.org/licenses/by/4.0/).