Article

Fracture Toughness of Different Region Materials from a Dissimilar Metal Welded Joint in Steam Turbine Rotor

1
School of Materials Science and Engineering, Lanzhou Jiaotong University, Lanzhou 730070, China
2
Dongfang Steam Turbine Limited Company, Deyang 618000, China
*
Author to whom correspondence should be addressed.
Coatings 2022, 12(2), 174; https://doi.org/10.3390/coatings12020174
Submission received: 13 December 2021 / Revised: 25 January 2022 / Accepted: 28 January 2022 / Published: 29 January 2022

Abstract

:
This study systematically evaluated the fracture toughness of a CrMoV/NiCrMoV dissimilar metal welded joint (DMWJ) with buttering layer technology in a steam turbine rotor. The fracture resistance curves and parameters of base metals (BM-1 and BM-2), weld metal (WM), buttering layer (BL), and heat-affected zones (HAZ-1 and HAZ-2) in the welded joint were all obtained. The characteristic microstructures, carbides, and fracture surfaces were observed by optical microscopy (OM), scanning electron microscopy (SEM), and transmission electron microscopy (TEM). The results revealed a different fracture toughness of each region in the DMWJ. The BM-1 showed a brittle fracture mode, mainly related to the directional needle-shaped carbide M3C. However, HAZ-1, BL, WM, HAZ-2, and BM-2 illustrated ductile fracture mode. The tempered microstructure and dispersed carbides increased the toughness of each material. Except for BM-1, the ductile fracture toughnesses of BL and WM were low in DMWJ due to coarse spherical carbide M7C3. The fracture toughness in the middle of HAZs was higher than that of the corresponding BMs owing to the fine tempered martensite and bainite. The fracture toughness along DMWJ appeared uneven. In sum, these findings look promising for the accurate integrity evaluation of DMWJs.

1. Introduction

A rotor is the “heart” of steam turbines, playing an important role in the safe operation of power stations. Because the rotor has to work under different temperature and pressure environments [1], manufactured rotors must consider different temperature working environments, as well as manufacturing cost and convenience. Forged rotors are often processed into large-sized components to meet the material performance requirements of the rotor under different working environments (temperature and pressure) [2]. However, the manufacturing of large forged rotors with uniform and excellent properties is usually challenging due to the limitations of equipment and technology, including expensive hot furnaces, large forging hammers, heat treatment, and machining. The currently utilized method consists of selecting suitable dissimilar materials under different working environments in the rotor followed by joining them by welding to form a completely dissimilar metal welded rotor [3,4]. Compared to forged rotors, welded rotors are not only advantageous to dissimilar materials but also reduce production costs and cycles. Besides, welding is a lightweight design method facilitating the manufacturing of larger steam turbine rotors. Multi-layer and multi-pass narrow-gap submerged arc welding (NG-SAW) technologies are used for the manufacturing of large and thick-walled steam turbine welded rotors due to their advantages in terms of good reliability combined with low residual stress and high deposition efficiency [5,6,7]. Buttering layer welding technology is also employed in the manufacturing of dissimilar metal welded rotors to alleviate the chemical composition and property differences between dissimilar base metals and weld metals [8,9].
However, characteristics such as the high inhomogeneity of the microstructure, mechanical, thermal, and fracture, as well as the random appearance of defects during the welding process, render dissimilar metal welded joint (DMWJ) more vulnerable. Various types of defects at different positions within DMWJs have been noticed in power-station equipment, and serious leakage events on DMWJs have been determined [10,11]. Therefore, the study of fracture toughness of welded structures in power plants has received increasing attention from the scientific and technological standpoints, especially for DMWJs of steam turbines [12,13]. Moreover, the continuous increase in the design life of power stations led to higher requirements of fracture resistance in the DMWJ. Hence, studying the fracture toughness of DMWJs in steam turbines is important to both the reliability evaluation and design optimization of entire power stations. Parameters such as stress intensity factor (KIC), J-integral, and crack tip opening displacement (CTOD or δ) taking into account large amounts of plastic deformation are commonly used to evaluate the fracture toughness of materials with different properties. However, many high-strength and high-toughness materials are still difficult to quantify in terms of KIC. Hence, CTOD [14] or J-integral [15] often replace KIC during the evaluation of fracture toughness in such materials.
In the past few decades, the fracture toughness of welded joints has been extensively investigated through experiments and numerical simulations. For instance, Gao et al. [16] studied the fracture toughness of thick-wall circular weld of 316L stainless steel under different orientations (circumferential and thickness directions). The results showed that fracture toughness in the circumferential direction was higher than that in the thickness direction. Compared to the thickness direction, the grains of circumferential direction specimens were more irregular. The thickness direction was mainly made of lamellar columnar crystals, conducive to crack propagation and thereby reducing fracture toughness. Yang et al. [17] evaluated the elasto-plastic fracture toughness of different regions of welded joint of X80 pipeline steel and identified fracture toughness of welded metal (WM) as the lowest around the fracture risk zone of the entire welded joint. Microstructure analysis revealed significant hard-brittle martensite–austenite (M–A) due to welding hardening and embrittlement. On the other hand, the influence of the precipitated phase on the fracture toughness of heat-resistant steel can not be ignored. For example, the shape and size of the precipitated phase might affect the fracture behavior of materials [18,19]. In particular, spherical precipitates might improve the fracture toughness of materials, while the precipitates with sharp corners could reduce fracture toughness. Therefore, the influence of precipitated phases in steam turbine welded rotors on fracture toughness requires further studies. Samal et al. [20] used experiments and numerical simulations to determine the fracture toughness resistance curves of different regions in heterogeneous welded joints of martensitic heat-resistant steel and austenitic stainless steel. The results obtained by experiment and numerical simulation were mutually verified thanks to the selection of suitable micro-region material performance data. Shen et al. [21] examined the fracture toughness of base metal (BM), welded metal (WM), and heat-affected zone (HAZ) in a low-pressure welded rotor. They determined a smaller fracture toughness parameter of WM, while the middle region of HAZ was the largest with the best toughness. However, Guo et al. [22] noticed that the fracture toughness of HAZ near the fusion line was not as good as those of BM and WM. Therefore, uneven microstructures in HAZ may lead to opposite test results. Moreover, the mechanical mismatch at the interface of heterogeneous materials could influence the fracture toughness and crack growth behavior of the fusion line. Fan et al. [23] employed the finite element method (FEM) to study the crack propagation behavior of DMWJs. They noticed no extension of cracks in the fusion line, but deflection was obtained due to the mechanical mismatch caused by uneven microstructures near the fusion line. Zhu et al. [24] studied the effects of welding strength mismatch on fracture toughness through an elastoplastic finite element method. They observed that strength mismatch affected the contour shape of the plastic strain field at the crack-tip in the interface of dissimilar materials. The plastic strain field looked symmetric during equal matching, while the plastic strain field was asymmetric during low matching and overmatching. In general, the differences in dissimilar materials and changes in the microstructure caused by the thermal welding process are the microstructure factors affecting the inhomogeneity of fracture toughness of DMWJs. Therefore, newly processed DMWJs of steam turbine rotors would require systematic evaluation of fracture toughness in different regions before use. Establishing the relationships between microstructure and fracture toughness of micro-regions in DMWJs would also be important as it can provide support for the safe design and material selection of steam turbine welded rotors.
In this study, heterogeneous base metals made of 30Cr1Mo1V and 30Cr2Ni4MoV were welded into a new type of DMWJ through buttering layer and multi-layer and multi-pass narrow gap welding technology. Submerged arc welding (SAW) and tungsten inert gas (TIG) welding methods were employed to fabricate DMWJs. The fracture toughness curves and parameters along variable characteristic regions of the welded joint were obtained at room temperature. The microstructures, carbides, and fracture surfaces were analyzed by surface techniques such as optical microscopy (OM), scanning electron microscopy (SEM), and transmission electron microscopy (TEM). The main goal of this paper was to measure the fracture toughness parameters in the welded joint, determine the fracture weakness zone of DMWJ, analyze the relationship between microstructure and fracture toughness, and identify the fracture mechanism. This study provided a useful reference for manufacturing new-type steam turbine welded rotors.

2. Experimental

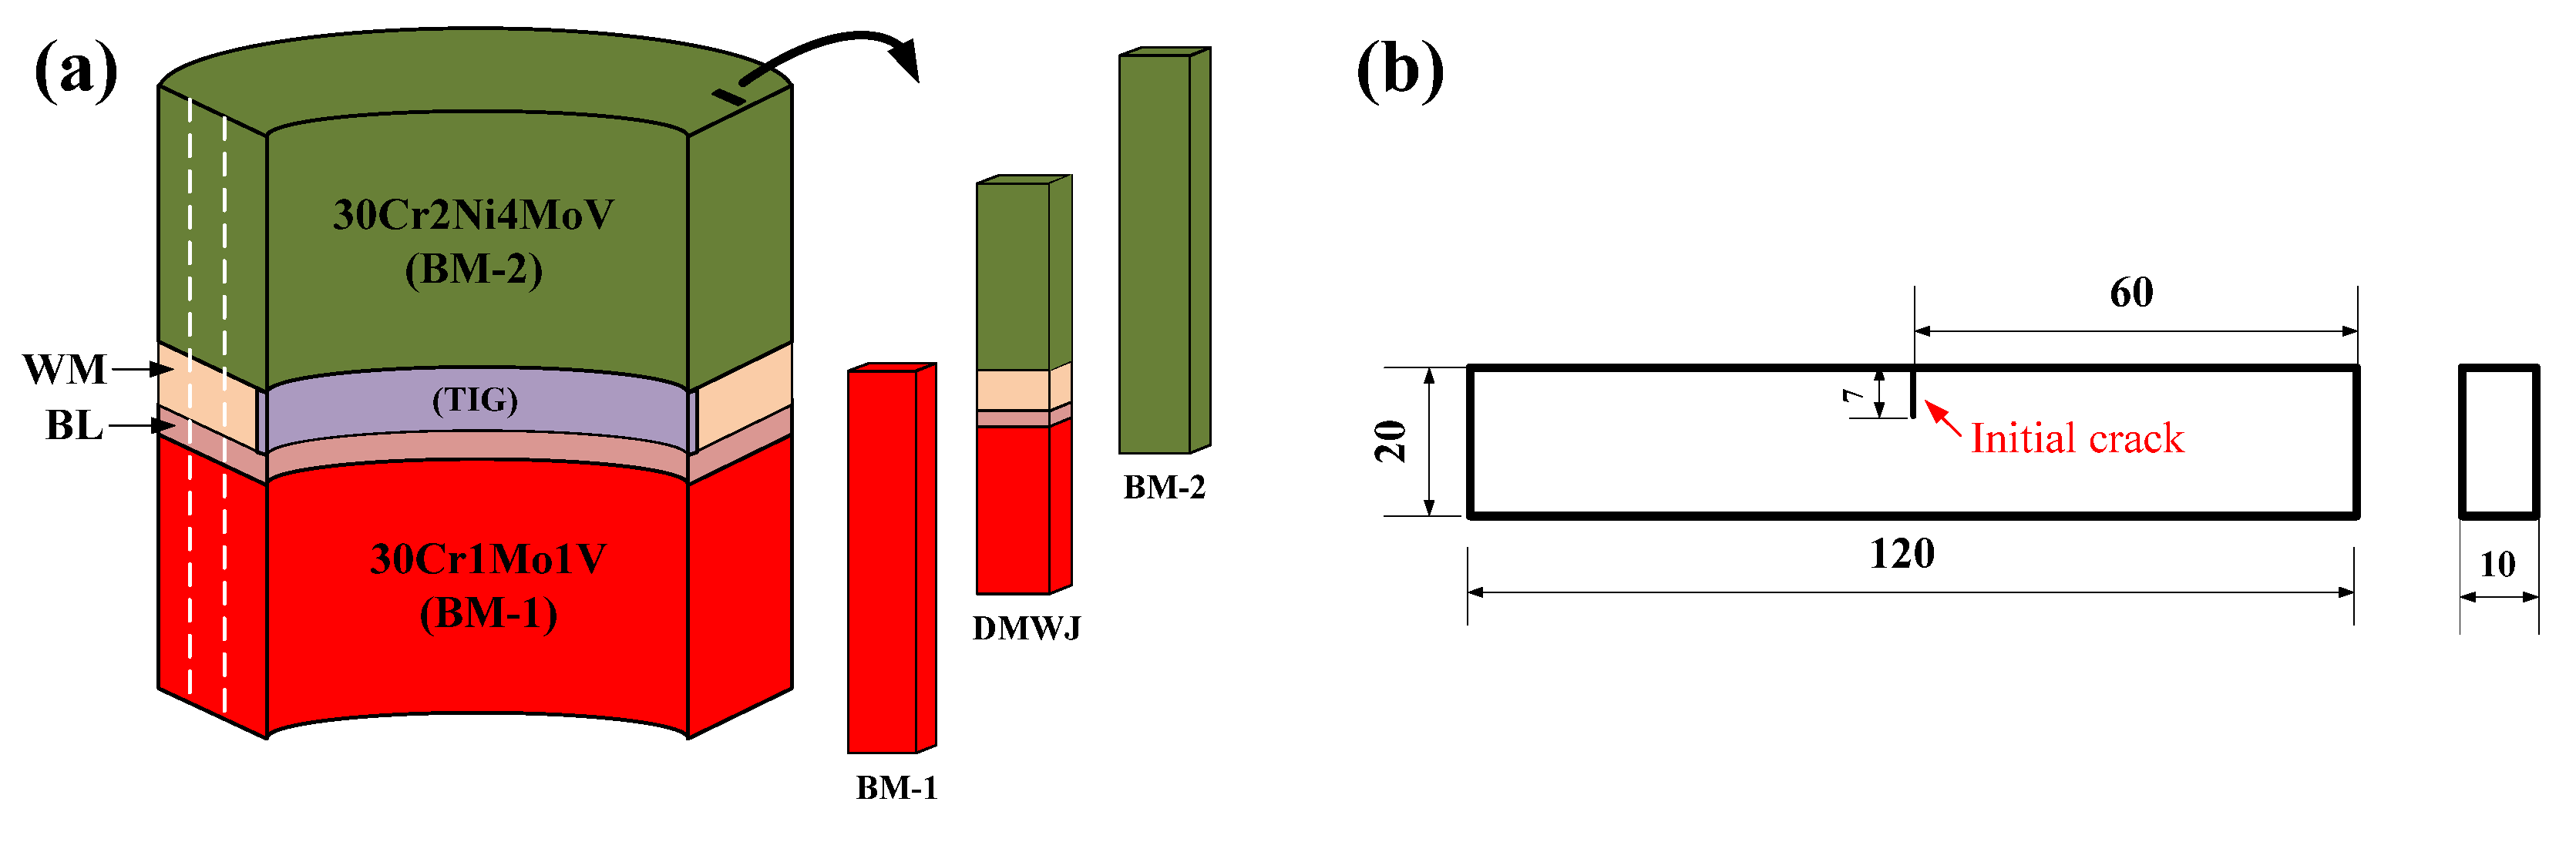
2.1. Materials and Weld Manufacture

A schematic diagram of a DMWJ is shown in Figure 1. The base metals (BMs) used for welding were made of two different types of rotor steels. The first consisted of 30Cr1Mo1V high-medium pressure rotor steel denoted as BM-1, and the second was 30Cr2Ni4MoV low-pressure rotor steel named BM-2. The welding processes of the DMWJ consisted of first forming a buttering layer (BL) by multi-layer SAW surfacing on BM-1. Next, BL was subjected to a local post-weld heat treatment (PWHT) at 670 °C for 8 h. Next, a U-shaped groove was processed on BL and BM-2, and narrow gap TIG welding was used for bottoming. Then, multi-layer and multi-pass NG-SAW welding was employed to form welded metal (WM). Finally, WM was subjected to local PWHT at 590 °C for 8 h to eliminate any residual stress. The final thickness of DMWJ was determined as 98 mm, and those of TIG and SAW welds were 12 mm and 86 mm, respectively. The NG-SAW weld occupying the most welded metal surface was the research aim of this paper. The WM mentioned later would be SAW weld. The chemical compositions of BM-1, BM-2, and the welding wire are listed in Table 1. BL and WM used the same welding wire. The sum of Cr and Mo contents of the welding wire was lower than those of BM-1 and BM-2. The original mechanical properties of the BMs and welding wire are summarized in Table 2. The initial mechanical properties of the welding wire looked intermediate between those of BM-1 and BM-2.

2.2. Fracture Toughness Tests

The sampling of fracture toughness test was set along the axial direction of the DMWJ. As shown in Figure 1a, the three types of specimens, BM-1, BM-2, and welded joints, were cut by wire cutting technology to form the DMWJ. The sampling of two BMs was far away from the welding joint. To eliminate the influence of welding thermal cycles, the welded joint samples were further processed into BL, WM, and heat-affected zones (HAZs) samples. Figure 1b show the dimensions of the single edge notched bend (SENB) specimen used for fracture toughness tests. The initial cracks were placed on the regions tested by the DMWJ. A macro photo of the DMWJ with all six distinct regions BM-1, BM-2, BL, WM, HAZ-1, and HAZ-2 is displayed in Figure 2. The widths of BL and WM were identified as 5 mm and 21 mm, respectively. The multi-layer and multi-pass welding structure was seen on BL and WM. The widths of HAZ-1 and HAZ-2 were estimated to be about 3 mm and 4 mm, respectively. Two obvious fusion boundaries (FB-1 and FB-2) near HAZs also existed. Next, fracture toughness tests were carried out on all six relatively independent characteristic regions in the DMWJ. As shown by the red arrow in Figure 2, the initial cracks in the four regions of HAZ-1, BL, WM, and HAZ-2 were located on their geometric midlines, respectively. Fracture toughness tests adopted the multi-sample method, and each test group included eight specimens. After processing the specimens, fracture toughness testing based on a load-reducing method was used to prefabricate the fatigue cracks on the fatigue testing machine GPS100, SINOTEST, Changchun, China). SENB tests were performed on the universal mechanical testing machine, and “force-displacement” curves were recorded. Finally, the specimens completed tests were knocked off to measure crack propagation length (Δa) by a nine-point method. The crack tip opening displacement (CTOD or δ) was calculated according to the relevant method of standard ISO 12135-2021 [25]. After testing, the fracture resistance curves (δ-R curves) between δ and Δa were drawn.

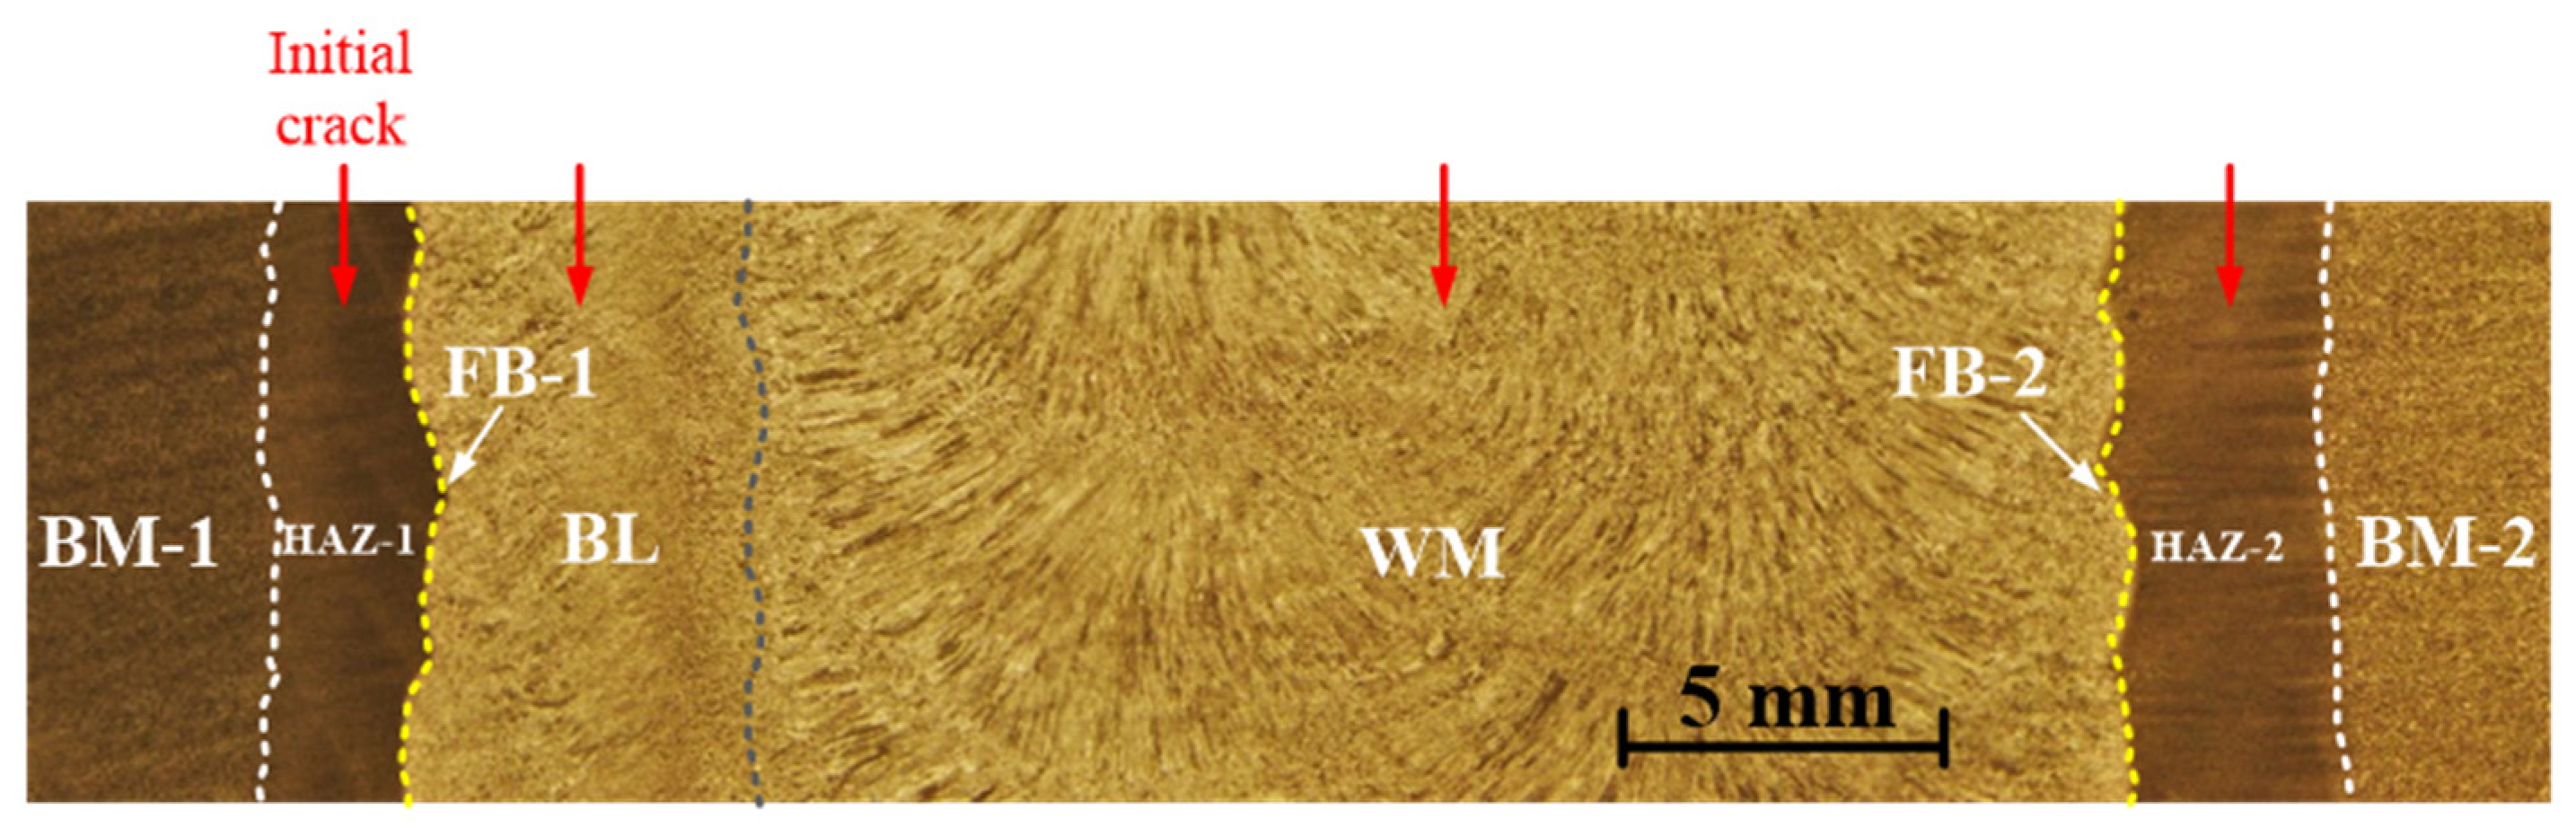
2.3. Microstructure Analysis

The specimen used for macro morphology observation in Figure 2 was also employed for microstructure analysis of six characteristic regions in the DMWJ. To this end, a solution containing 4% HNO3 and ethanol solution was utilized to etch the specimens. The microstructures and carbides of all six characteristic regions were observed and analyzed by OM (Nikon ECLIPSE MA200, Tokyo, Japan), SEM (FEI, 25 V, Hillsboro, OR, USA), and TEM (JEM-2100F, JEOL, Tokyo, Japan). The SEM images were then employed to observe and analyze the fracture surface.

3. Results and Discussion

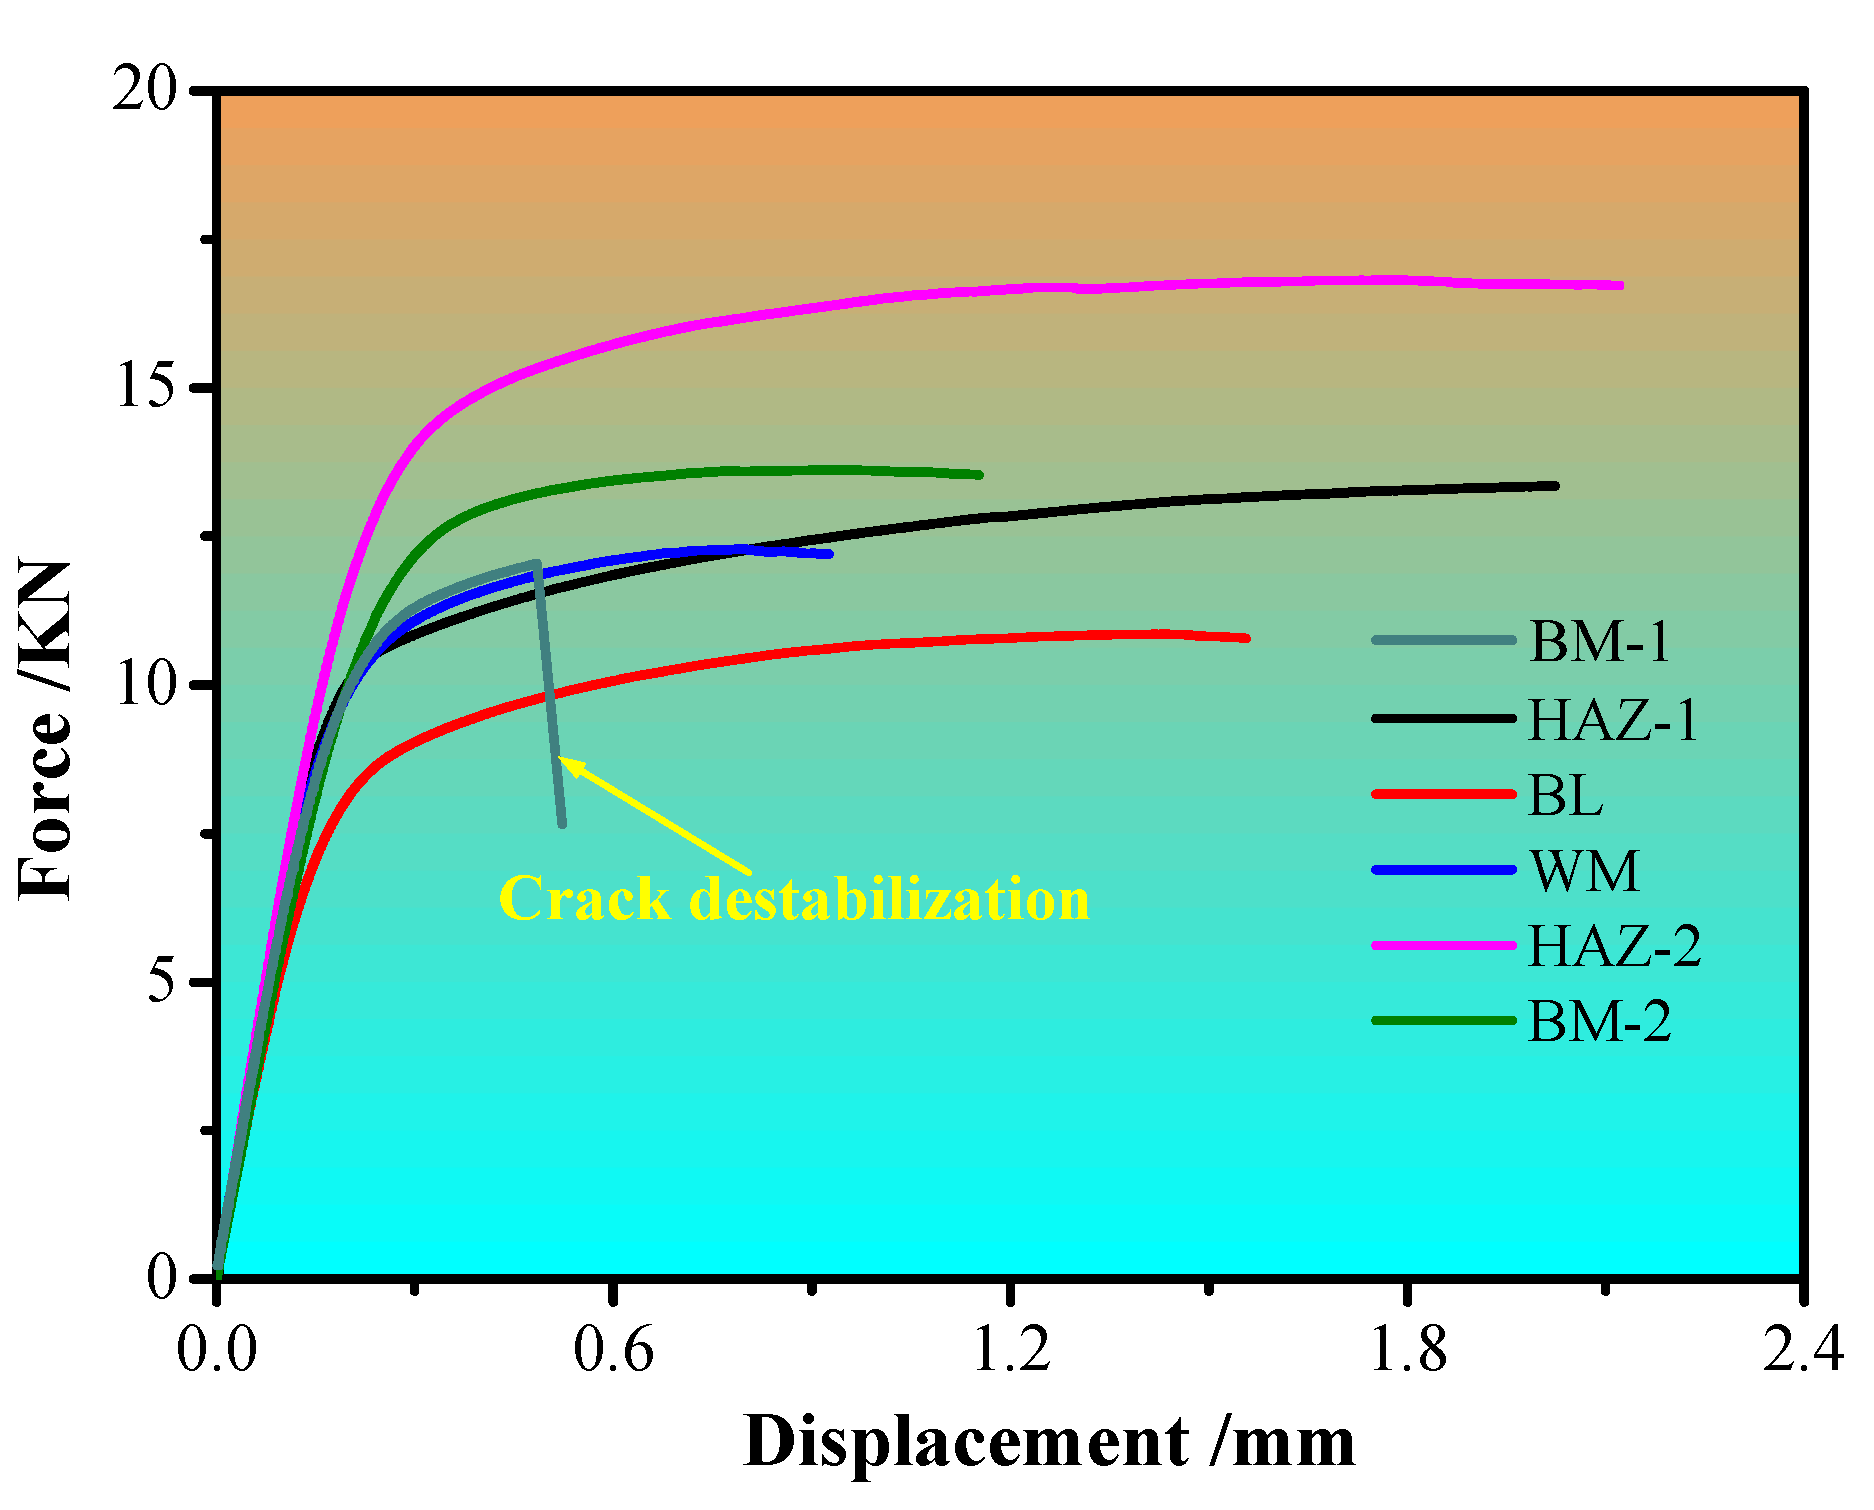
3.1. Force-Displacement Curves

The force-displacement curves obtained from SENB tests in different regions of the DMWJ are provided in Figure 3. The force-displacement curve of BM-1 looked different from those of other regions. The curve of BM-1 only reflected the stage of elastic deformation, and crack instability led to a sudden drop in force and the occurrence of brittle fracture. The force-displacement curves of HAZ-1, BL, WM, HAZ-2, and BM-2 included two stages, namely elastic deformation and plastic deformation, indicating the occurrence of ductile fracture in these five regions. The difference in fracture toughness of DMWJ can be clarified by fracture morphology and microstructure analysis, which will be discussed later. In Figure 3, the maximum displacements of HAZ-1 and HAZ-2 were greater than those of BM-1 and BM-2, suggesting greater stable crack propagation in the middle of HAZs than that in corresponding BMs. In addition, although BL showed a greater displacement value, its maximum force was lower than in other regions, affecting its fracture toughness. Similarly, though WM had a higher maximum force, the displacement was small, thereby influencing its toughness.
Note that KQ represented the condition value of KIC, and KQ was affected by the size of the test specimen. To compare the fracture toughnesses in six regions of the DMWJ, KQ was calculated by Equation (1), and the results are listed in Table 3. The KQ value of BM-1 was estimated to be 91.2 MPa m1/2. The KQ value in the middle of HAZ was higher than that of BM. In addition, the KQ value of BL was lower than those in other regions. However, KQ cannot be effectively used to express the fracture toughnesses of HAZ-1, BL, WM, HAZ-2, and BM-2 due to the presence of plastic deformation on the force-displacement curve. Therefore, their fracture toughness parameters were further studied by CTOD (δ).
K Q = [ ( S W ) F Q ( B B N W ) 0.5 ] [ g 1 ( a 0 W ) ]
where FQ represents the maximum load obtained in the force-displacement curve, S is the span of the SENB specimen, and a0 refers to the initial crack length. B and W are the thickness and width of the SENB specimen, respectively. BN denotes the thickness between two grooves with a value equal to B in this test. The function g1(a0/W) represents the stress intensity factor coefficient.

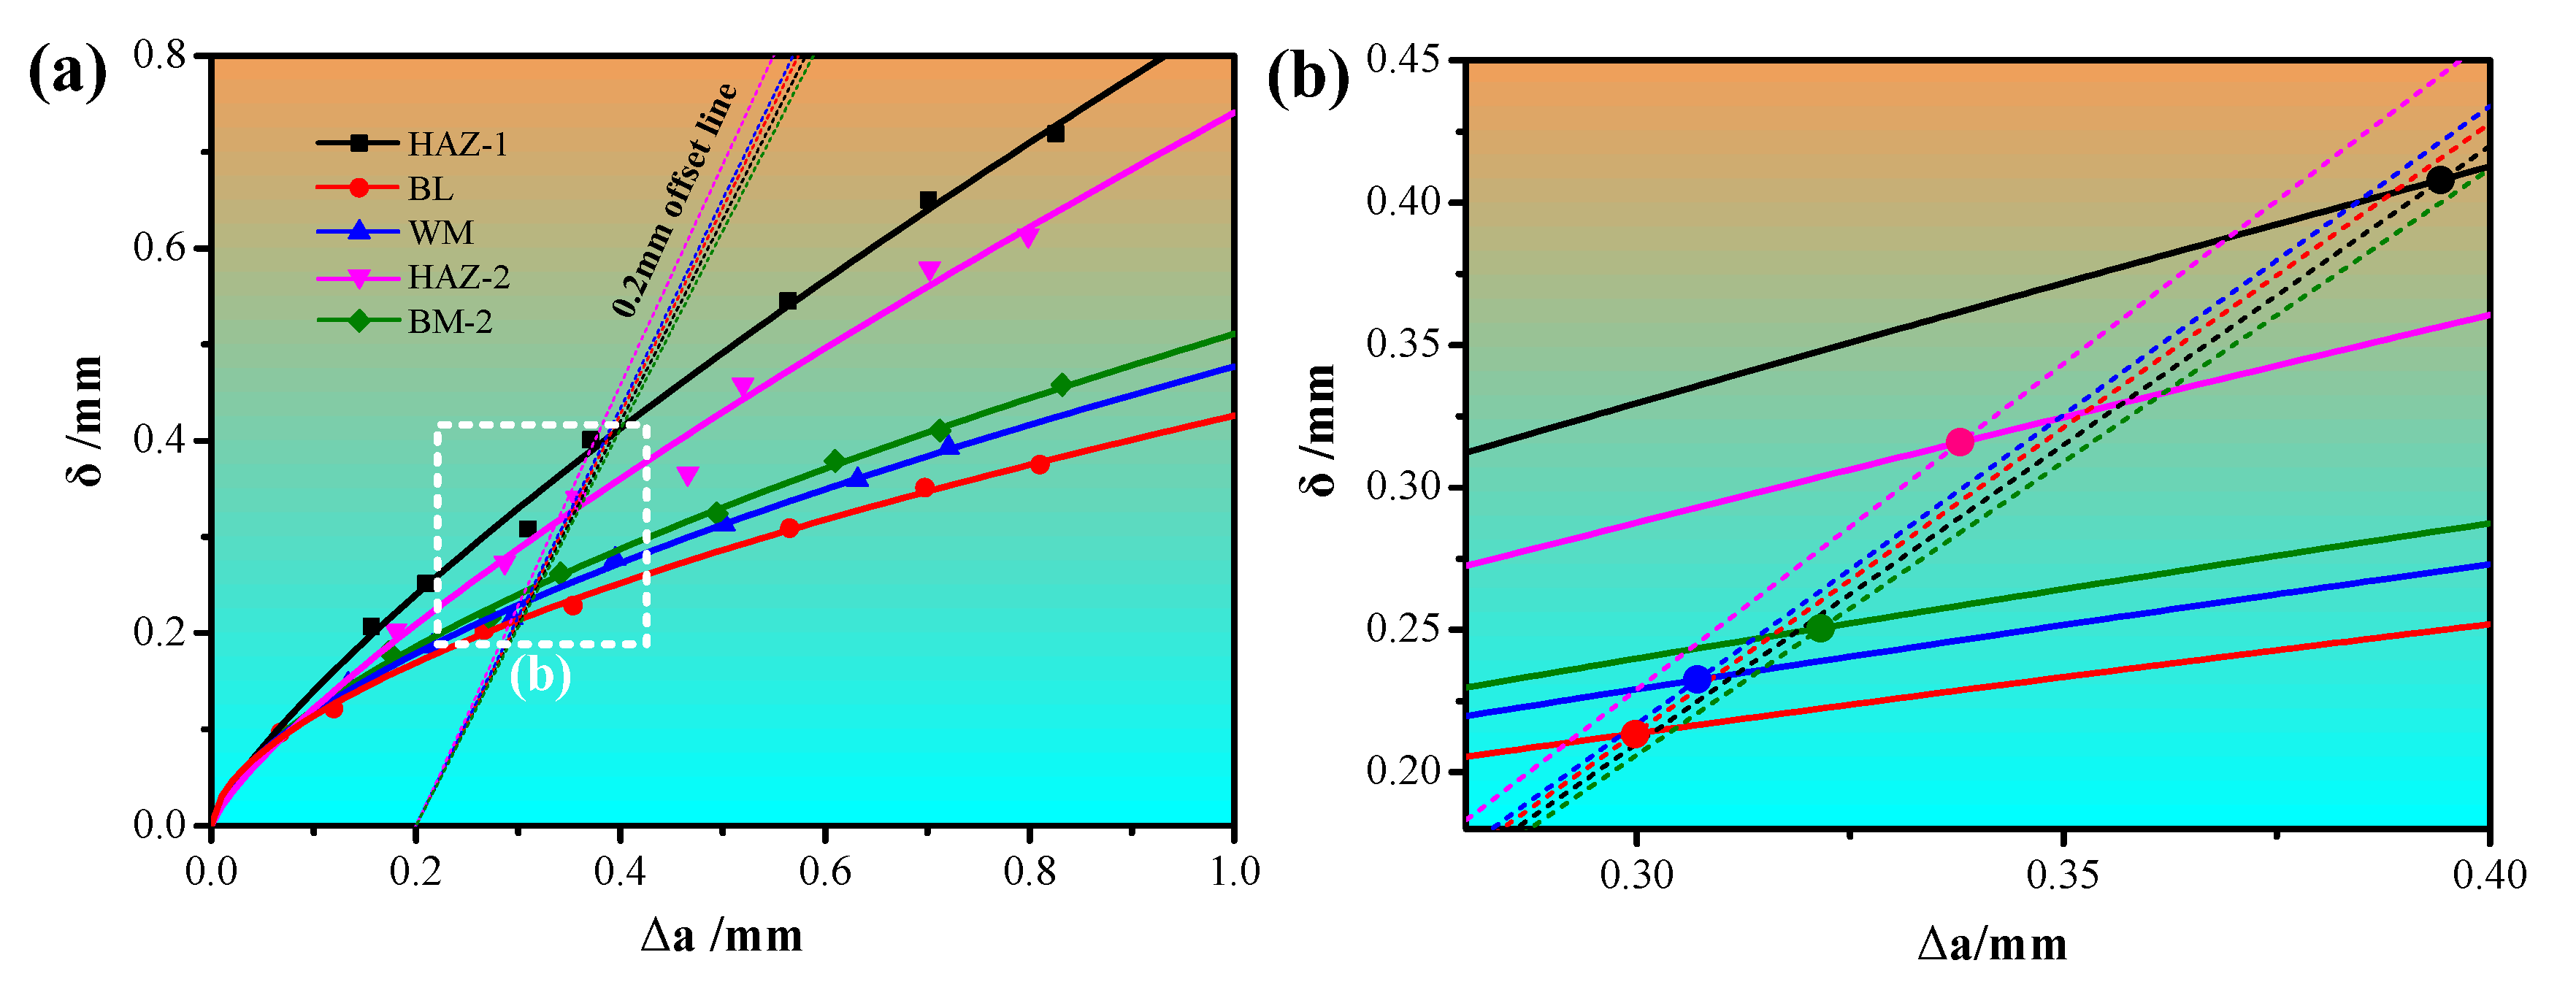
3.2. Fracture Resistance Curves and Parameters

According to the standard ISO 12135-2021, the Δa of each specimen was tested and calculated by a nine-point method, and δ was obtained by Equation (2). In order to compare the fracture toughness of the regions in the welded joint, the Δa and δ values of HAZ-1, BL, WM, HAZ-2, and BM-2 are depicted in Figure 4. It can be seen that with the increase of the crack propagation length Δa, the crack opening displacement δ increases, but the increases of δ in each region are not the same. The data points of HAZ-1, HAZ-2, BL are more scattered than WM and BM-2. First, HAZ-1, HAZ-2, and BL are three narrower regions; their microstructures are quite different from the surrounding regions. In addition, welding defects in HAZ, such as liquation cracks, may also affect the fracture toughness of HAZ, resulting in relatively scattered test data in HAZ. The fracture toughness test results are not only related to their own microstructures and defects but also affected by the surrounding materials due to restraint effects. Therefore, the data points of HAZ-1, HAZ-2, and BL looked more scattered than those of WM and BM-2.
The data points of every region were nonlinearly fitted using Equation (3) to obtain δ-R curves. As shown in Figure 4, the δ-R curve of BL was lower than in other regions, leading to poor fracture toughness. The δ-R curve of WM was higher than that of BL. Despite the same chemical compositions of the wire in BL and WM, both showed different fracture toughness. The chemical composition stirring and PWHT of the welding process led to BL and WM with different mechanical properties. The curve of HAZ-1 is above the other curves, indicating the best fracture toughness. The curve of HAZ-2 is above BM-2, meaning that the fracture toughness of HAZ-2 is higher than that of BM-2. The δ-R curve of HAZ was higher than that of BM, indicating better fracture toughness in the middle of HAZ when compared to BM. According to the literature [22], the fracture toughness of HAZ was found lower than that of BM. The microstructure and mechanical properties of HAZ are often identified as the gradient change. Therefore, the fracture toughness of HAZ was related to the initial crack location. In literature [22], initial cracks were located near the fusion boundary (coarse grain zone, CGZ), while initial cracks in our study were located in the middle of HAZ (fine grain zone, FGZ). This led to completely different results.
An important ductile fracture parameter δ0.2BL can be obtained from the intersection of 0.2 mm offset line of blunting line and δ-R curve. The blunting line can be obtained using Equation (4). A local enlarged image of the dashed box area in Figure 4a is provided in Figure 4b. Here, the δ0.2BL value can be seen more clearly. The δ0.2BL values of HAZ-1, BL, WM, HAZ-2, and BM-2 were estimated to be 0.407, 0.214, 0.232, 0.316, and 0.250 mm, respectively, as shown in Table 4. Thus, the differences in fracture toughness resistance curves and parameters in DMWJ were mainly determined by the microstructure, which will be further explained in Section 3.4.
δ = [ ( S W ) F B B N W 0.5 × g 1 ( a 0 W ) ] 2 [ ( 1 ν 2 ) 2 R p 0.2 E ] + 0.6 Δ a + 0.4 ( W a 0 ) V p 0.6 ( a 0 + Δ a ) + 0.4 W + z
δ = α + β Δ a γ
δ = 1.87 ( R m / R p 0.2 ) Δ a
In Equation (2), F represents the maximum load, and ν is the Poisson’s ratio set to 0.3. Vp is a plastic component of crack opening displacement (COD) with the value obtained by the force-displacement curve. z is the distance from the clamping position of the extensometer and specimen surface. In Equation (3), α, β, and γ are all constants obtained by the nonlinear fitting of the resistance curve. In Equation (4), Rm and Rp0.2 are the ultimate tensile strength and yield strength, respectively.

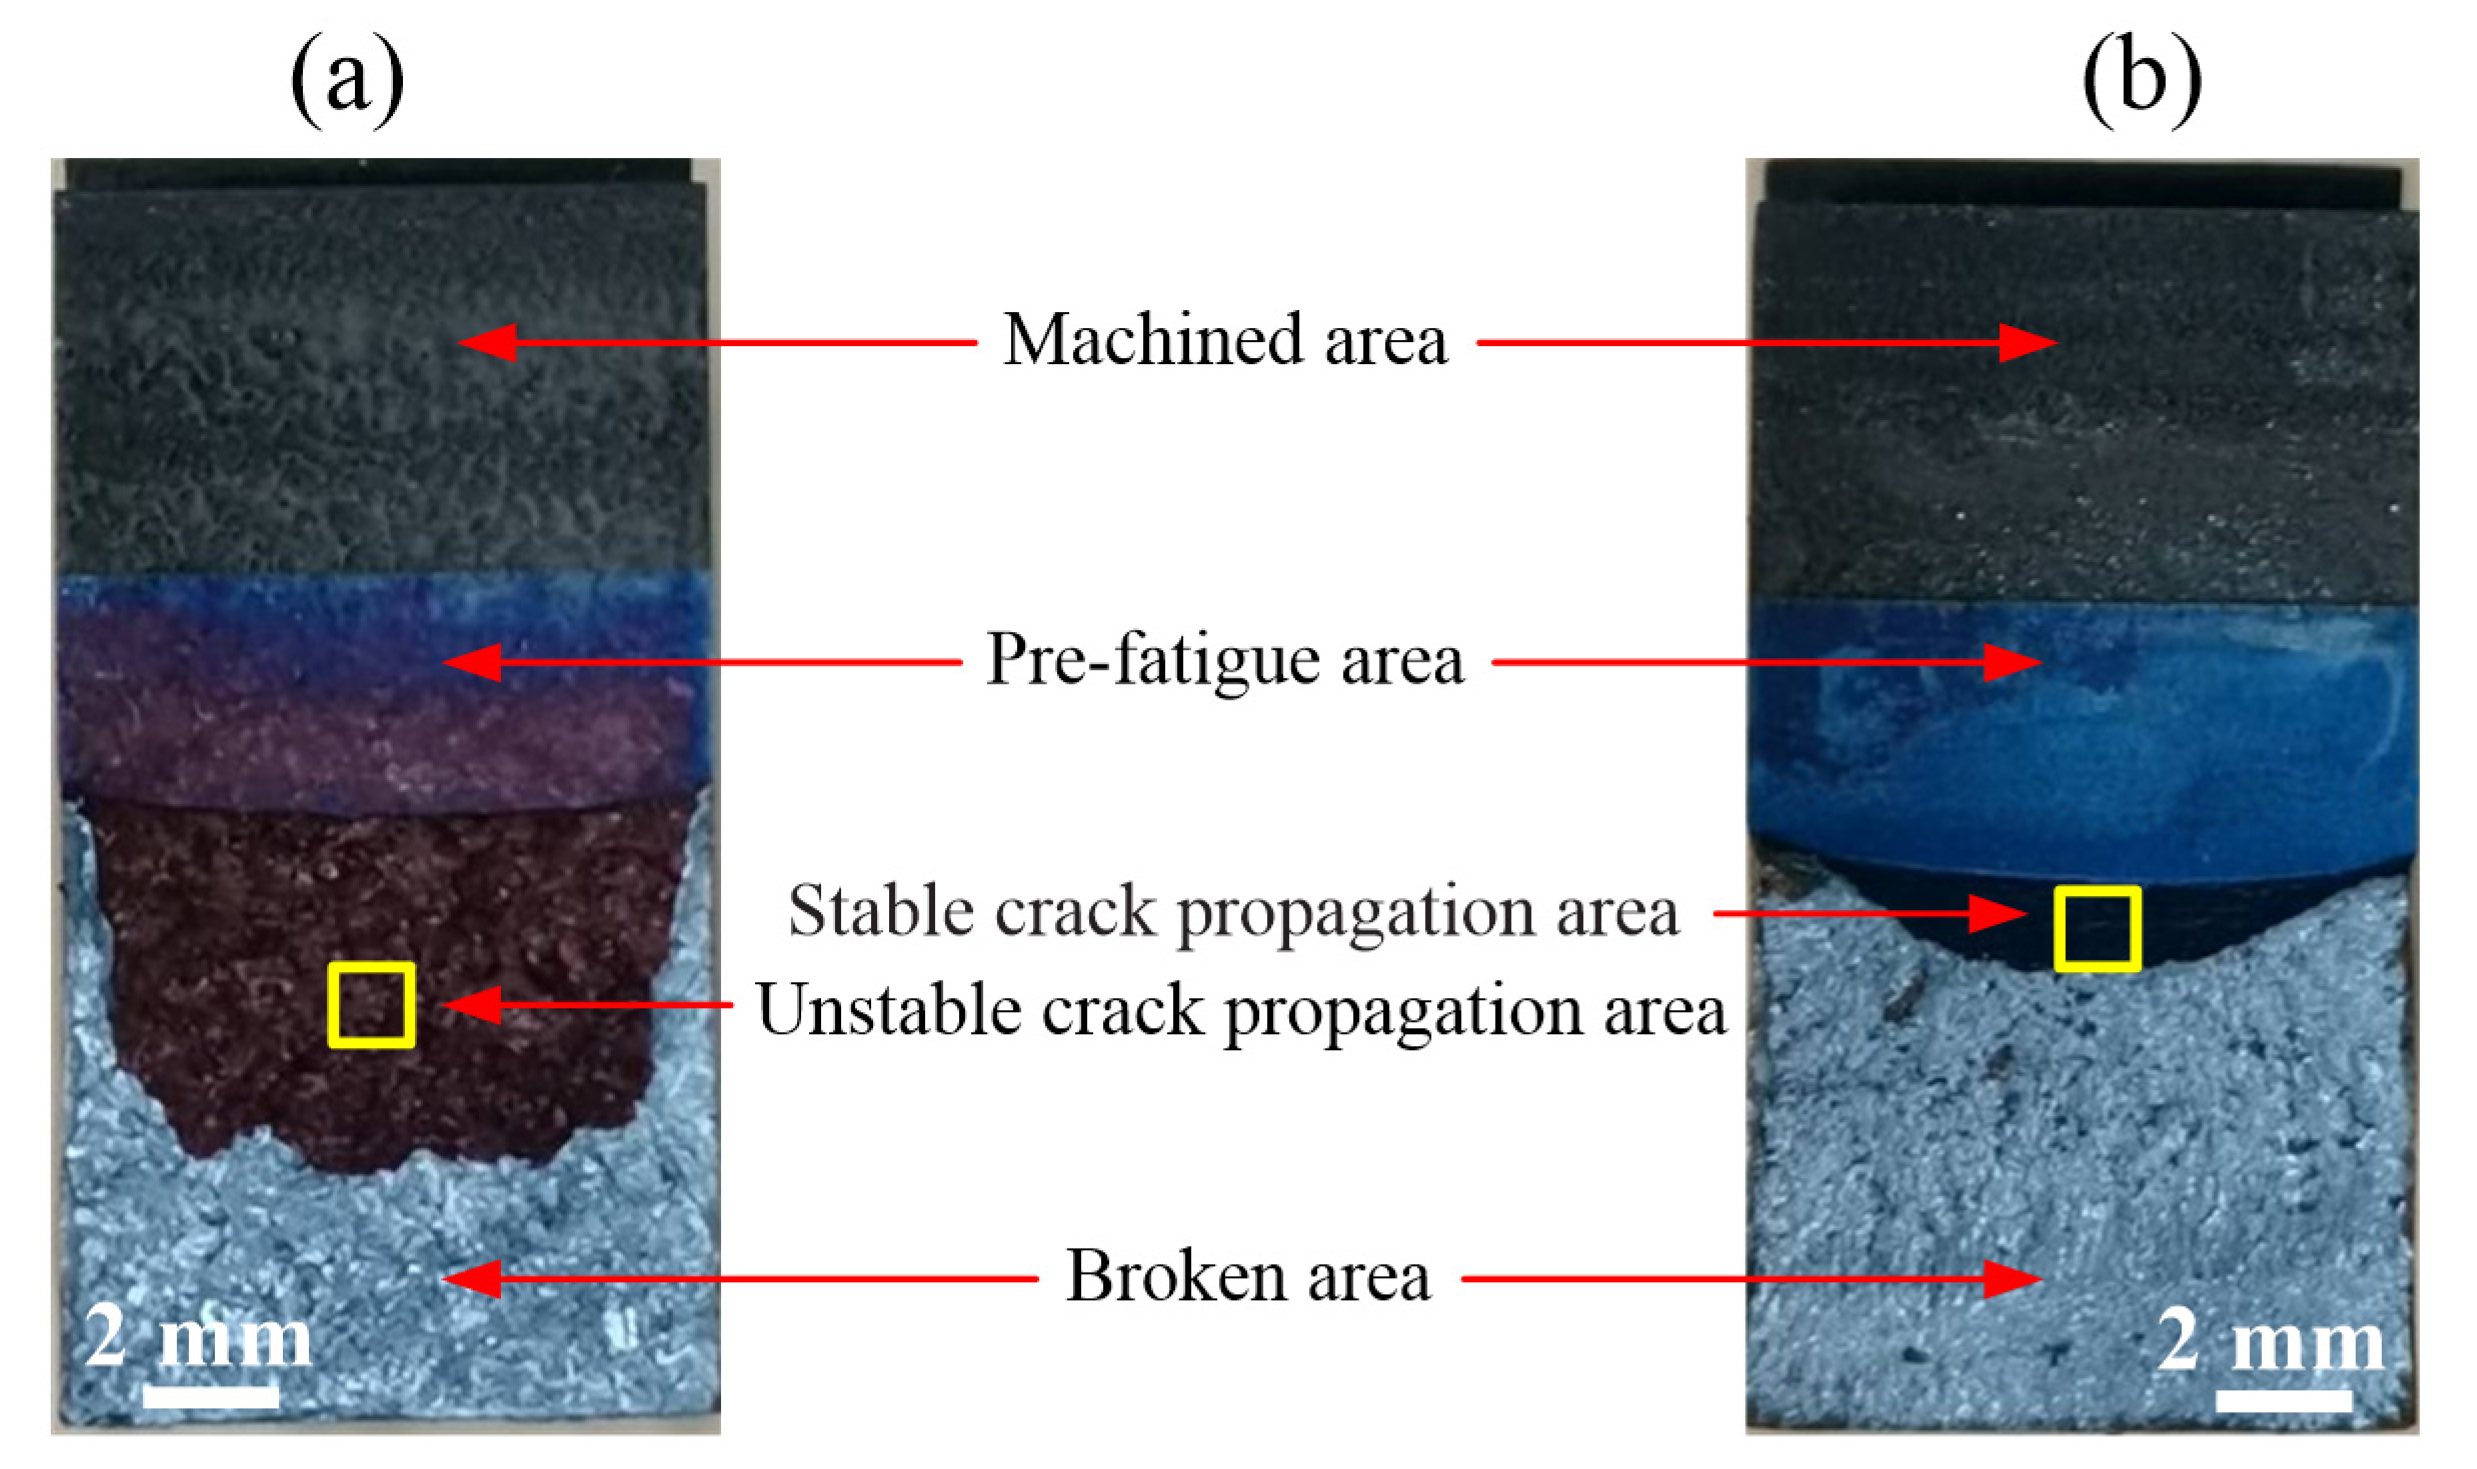
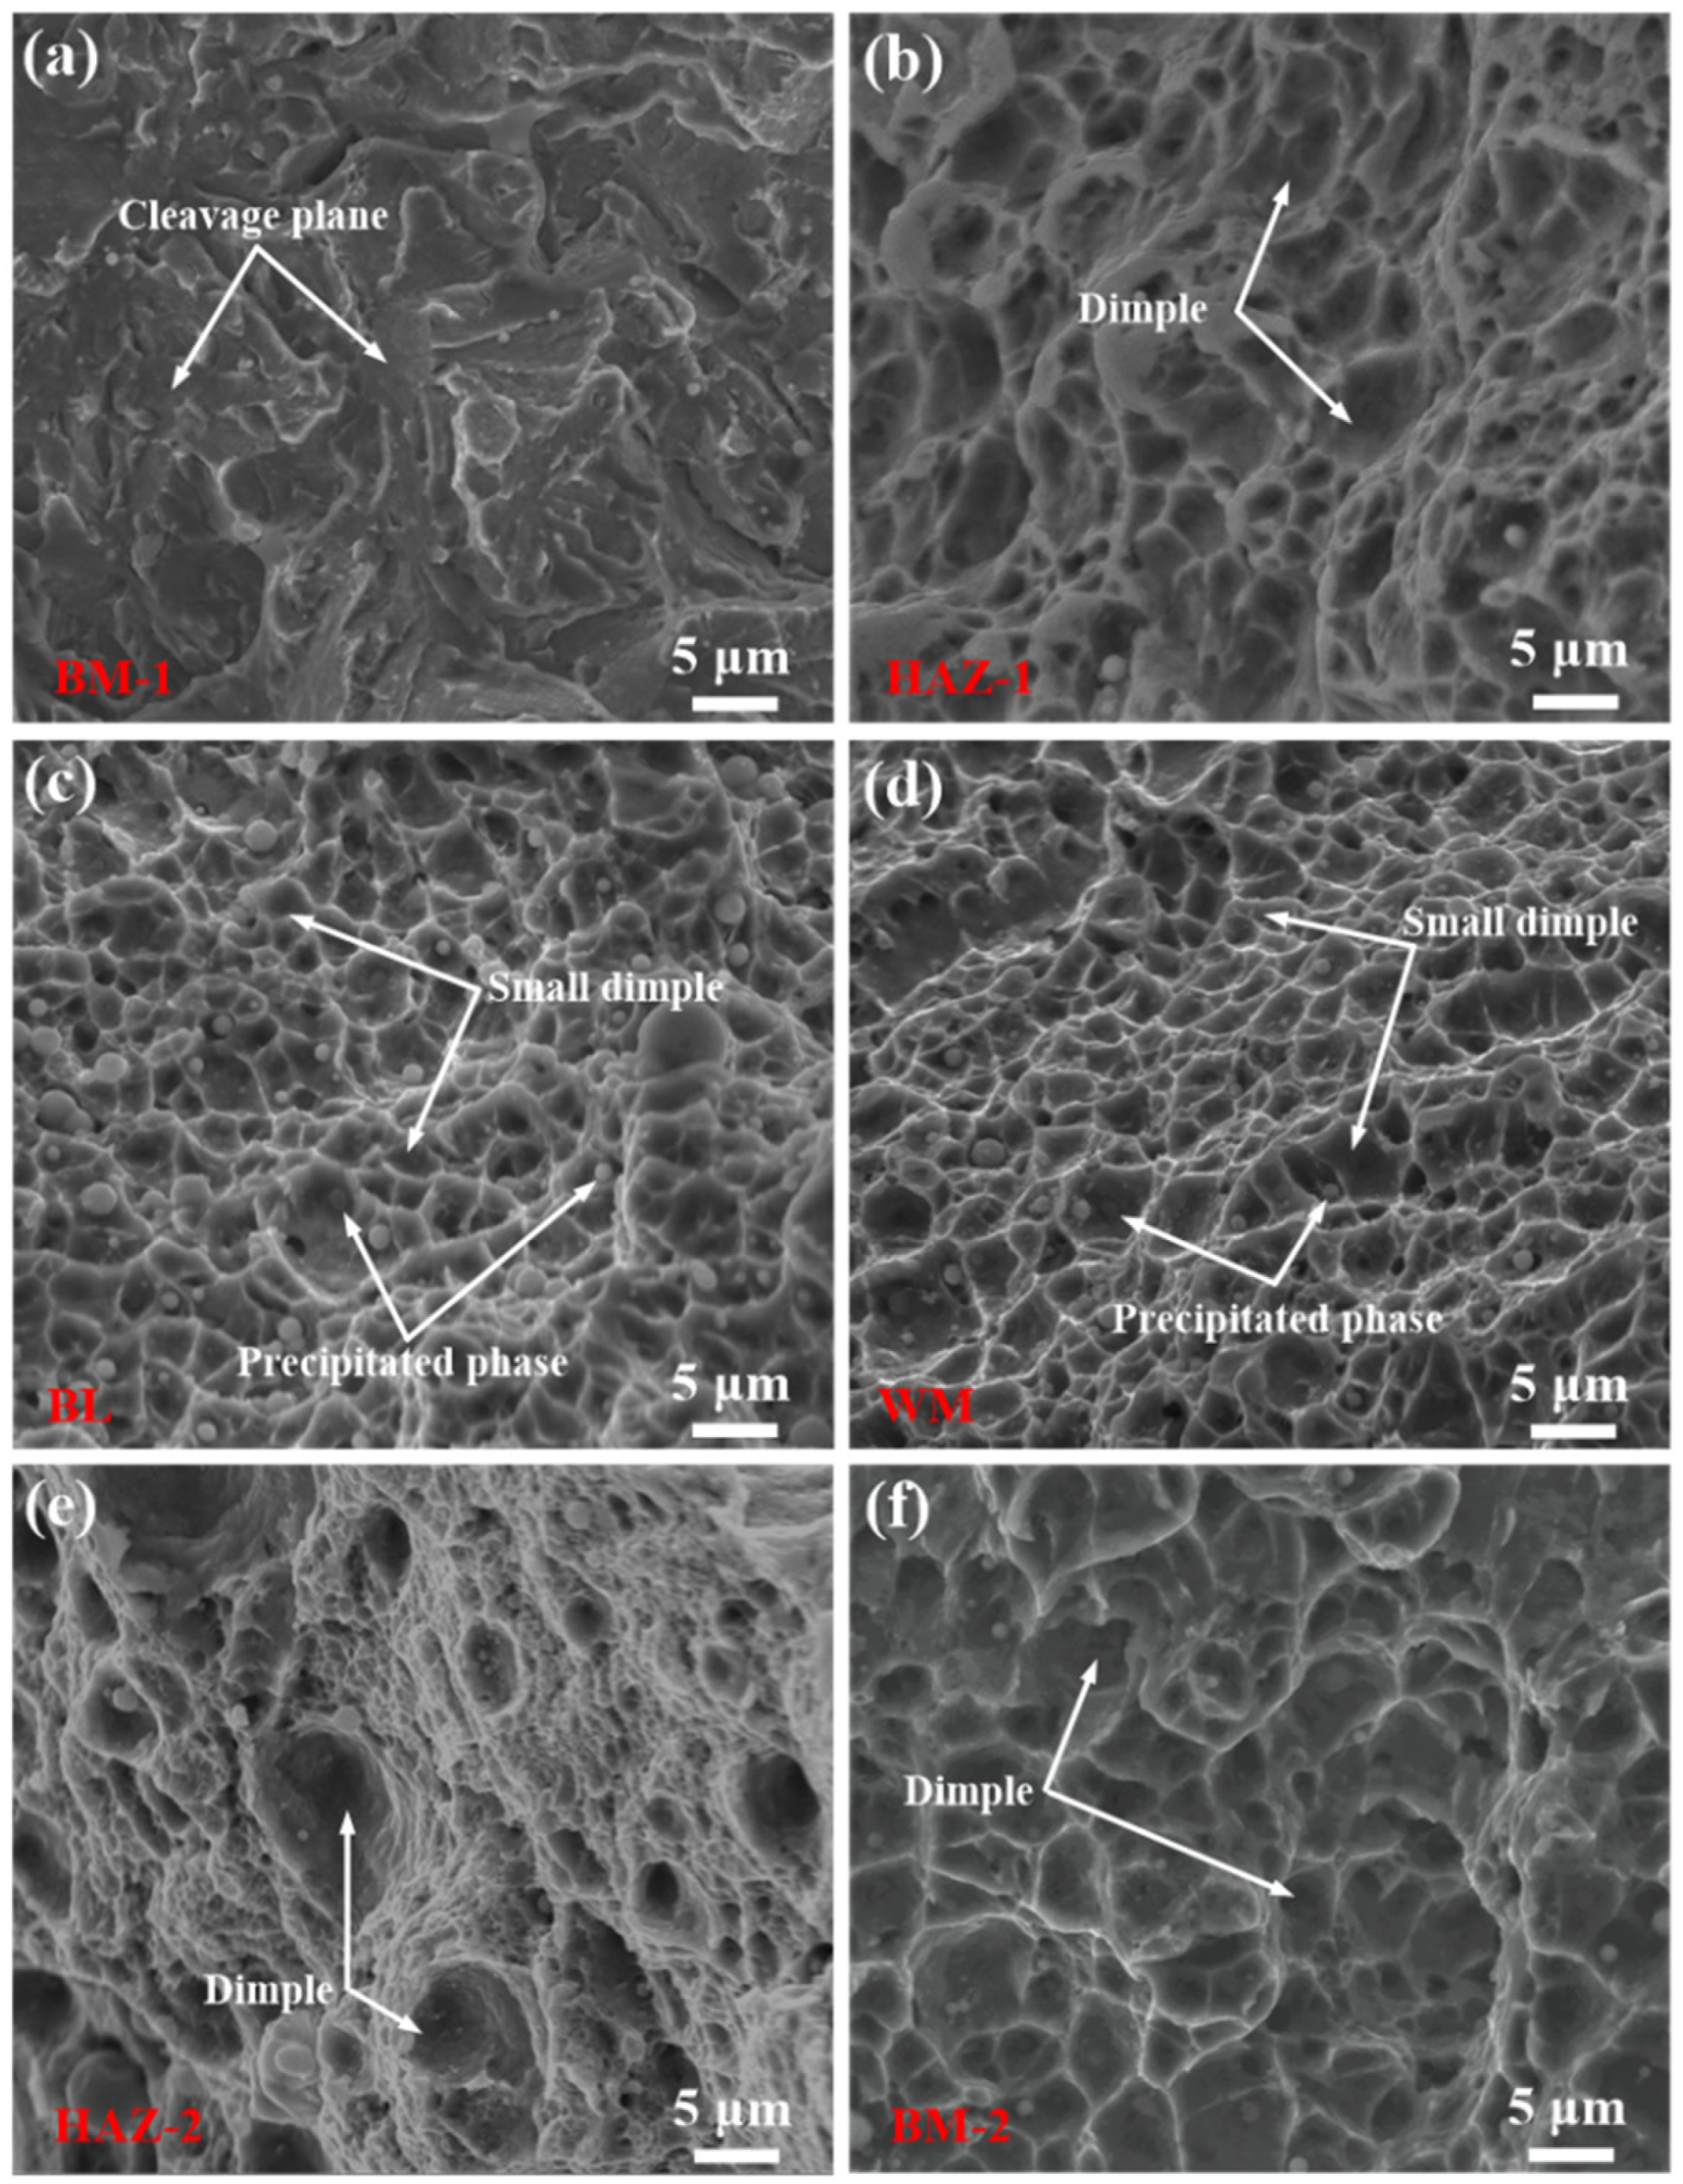
3.3. Fractography Analysis

To obtain the macroscopic fracture surfaces, the specimens after fracture toughness tests were cut in liquid nitrogen. As shown in Figure 5, several areas were identified, including the machined area, pre-fatigue area, crack propagation area, and broken area. The crack propagation zone of BM-1 represented a large unstable zone, while those of HAZ-1, BL, WM, HAZ-2, and BM-2 were stable propagation zones with a crescent shape. To analyze the fracture model of different regions in the DMWJ, the crack propagation areas were further observed and analyzed.
SEM images of crack propagation areas (yellow box area in Figure 5) in different regions of the DMWJ are provided in Figure 6. BM-1 and HAZ-1 illustrated completely different fracture surfaces. The fracture of BM-1 showed the cleavage platform, while HAZ-1 represented the dimple. Though HAZ-1 was derived from BM-1, the fracture modes looked completely different. BM-1 presented cleavage brittle fracture mode, while HAZ-1 showed dimple ductile fracture mode. The large dimples in the fracture of HAZ-1 indicated better toughness. The fracture surfaces of BL and WM were mainly dimples, indicating ductile fracture models. In addition, the dimples in BL and WM were small, suggesting lower toughness. These results were consistent with the δ-R curves in Figure 4. Moreover, some precipitated phases can be observed in the dimples of BL and WM and may play important roles in the fracture behavior. As shown in Figure 6e,f, the fracture surfaces of BM-2 and HAZ-2 were both dimple ductile fracture models. Compared to BM-2, some dimples in HAZ-2 were large, consistent with better toughness of HAZ-2 when compared to BM-2. Different fracture surfaces reflected variable fracture modes and mechanisms, with microstructure as the main affecting factor.

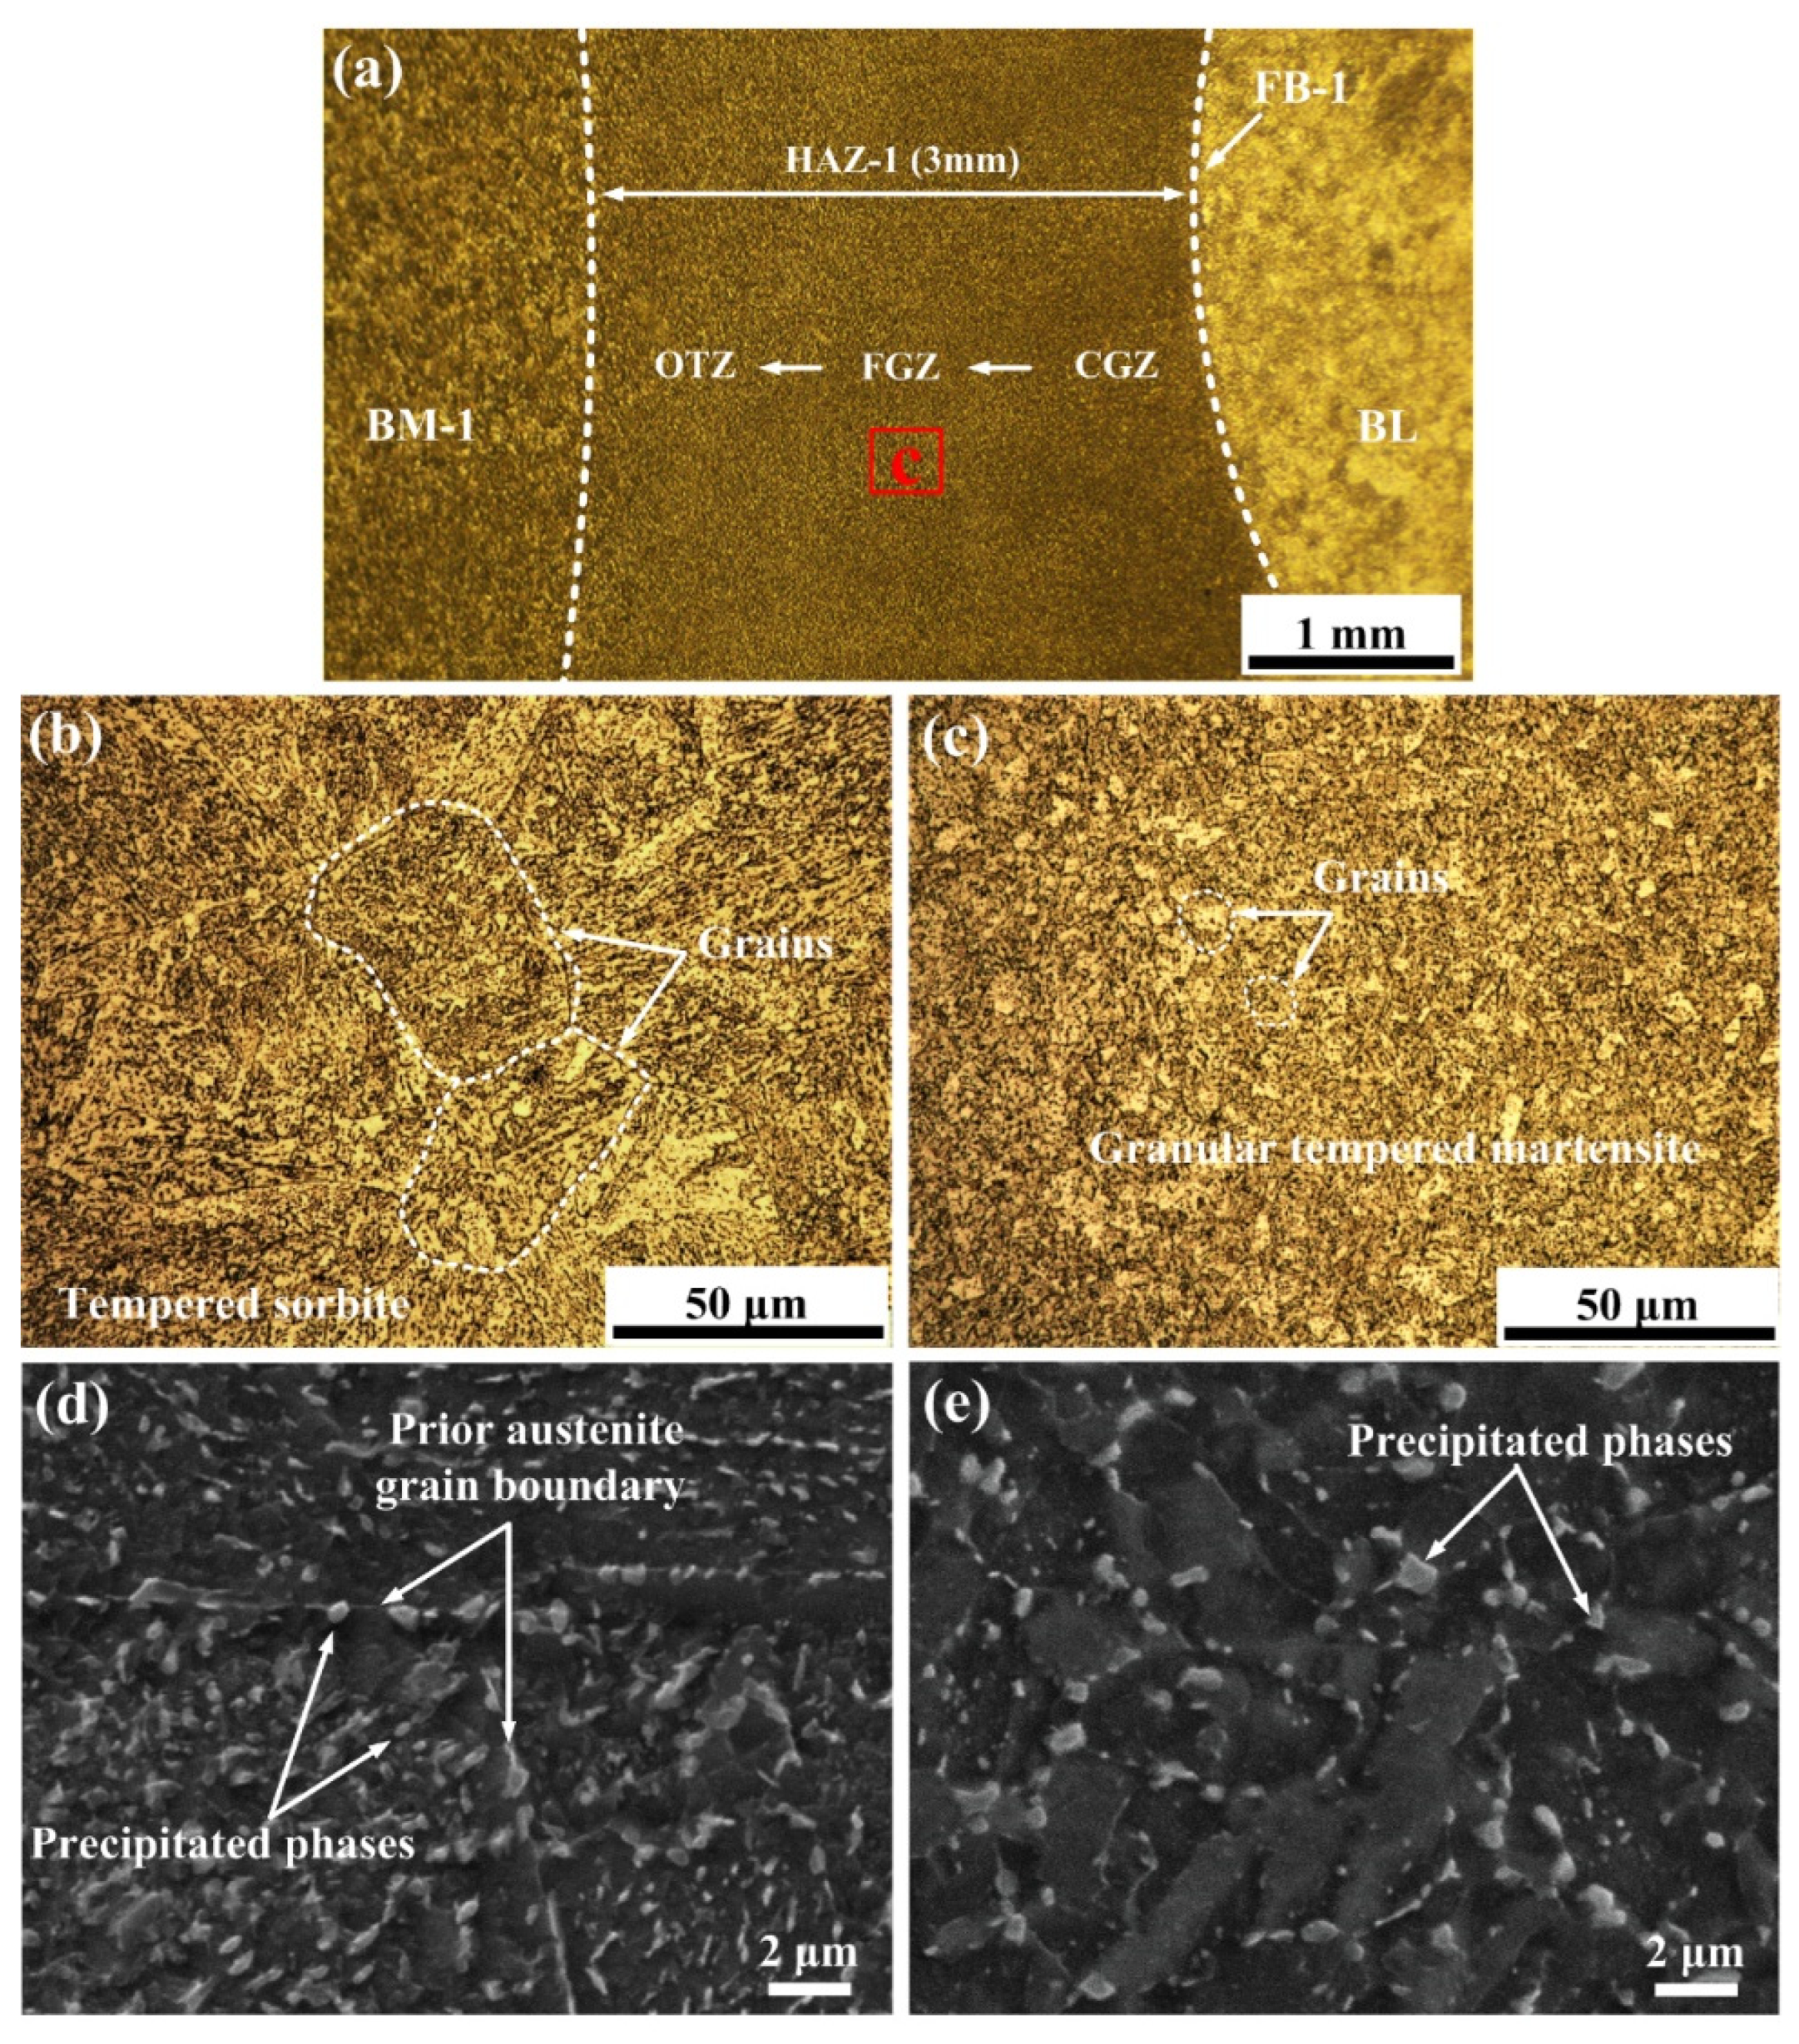
3.4. Microstructure Analysis

The microstructures of BM-1 and HAZ-1 are depicted in Figure 7. From the macro image of HAZ-1 (Figure 7a), the width of HAZ-1 was estimated to be about 3 mm. Hence, the microstructure of HAZ-1 was different from those of BM-1 and BL on both sides. The variation from FB-1 to BM-1 can be divided into coarse grain zone (CGZ), fine grain zone (FGZ), and over tempered zone (OTZ). The microstructure showed gradient change gradually becoming finer from CGZ to FGZ [22,26]. The microstructure of BM-1 was mainly made of tempered sorbite and some ferrite with grain size estimated to be about 50 μm (Figure 7b). The initial crack of the HAZ-1 specimen was located in the middle of HAZ-1 at the area of FGZ. Compared to BM-1 (Figure 7c), the microstructure in the middle of HAZ-1 (FGZ) was mainly made of fine tempered martensite and bainite with a grain size of about 10 μm. Small grains improved the fracture toughness of HAZ-1 and led to completely different fracture toughness than BM-1. Note that the precipitated phase in welded rotors is an important strengthening and toughening microstructure [26,27]. In the SEM image of BM-1 (Figure 7d), large numbers of precipitated phases were distributed in grain boundary and grain. The precipitated phases on the grain boundary illustrated relatively larger sizes. Here, precipitated phases distributed in the grain boundary helped improve the strength and hardness while degrading fracture toughness [28]. Additionally, numerous striped precipitated phases existed in grains of BM-1. In the SEM image representing the middle of HAZ-1 (Figure 7e), many precipitates were distributed on the matrix. Compared to the stripe-shaped precipitated phase in BM-1, the precipitated phase of HAZ-1 revealed spheroidized tendency. The morphology and type of precipitated phases in BM-1 were furthermore analyzed by TEM. As shown in Figure 8a, many needle-shaped precipitated phases with the same arrangement direction were regularly distributed on the matrix. Such needle-shaped and directional precipitates caused anisotropy in material properties, not conducive to fracture toughness [29]. The selected area electron diffraction pattern (SAEDP) results identified the needle-shaped precipitated phase in BM-1 as M3C-type carbide from our previous work [30]. Therefore, the aggregated carbides on the grain boundary, as well as the regularly distributed needle-shaped carbides, were the major reason behind the brittle fracture of BM-1. By comparison, fine microstructures and spheroidized precipitates were the main reason leading to the better fracture toughness and ductile fracture of HAZ-1.
The microstructures of BL and WM are shown in Figure 9. Both BL and WM revealed similar microstructures made mainly of granular and lath tempered bainite (Figure 9a,b). In turn, the similar microstructures of BL and WM led to comparable resistance curves (Figure 4). Nevertheless, WM illustrated more granular bainite than BL, where granular bainite in this kind of steel could improve toughness and strength [26]. Thus, the presence of more granular bainite helped improve the fracture toughness of WM. In SEM images in Figure 9c,d, the precipitated phases of BL and WM were mainly distributed on the sub-grain boundaries. Figure 10 show the TEM analysis of carbides in BL and WM. It can be seen that both BL and WM have coarse spherical precipitated phases distributed along the grain boundaries (Figure 10a,b). However, some small carbides in WM were also formed in addition to coarse spherical carbide, conducive to improving the fracture toughness of WM. EDS and SAEDP analysis showed precipitated phases of BL and WM made of coarse spherical M7C3 type carbides with a size of about 400 nm, as shown in Figure 10c. Coarse spherical precipitates were found to affect fatigue crack growth behavior in our previous work [31]. During welding and PWHT, elements, such as Cr and Mo, combined with carbon to form carbides, accumulating and growing along sub-grain boundaries to form coarse spherical carbides [32]. The interface between coarse spherical carbide and matrix could act as sites for crack nucleation, regarded as the inherent microstructural factor that led to lower fracture toughness resistance curves and parameters for both BL and WM [33]. However, some small carbides in WM were also formed in addition to coarse spherical carbide, conducive to improving the fracture toughness of WM.
The microstructures of BM-2 and HAZ-2 are shown in Figure 11. The width of HAZ-2 obtained from Figure 11a was estimated to be about 4 mm. Similarly, the microstructure of HAZ-2 varied gradually from CGZ to OTZ. The metallographic characteristics of WM and BM-2 looked very different from those of HAZ-2. In Figure 11b, the microstructure of BM-2 was made of tempered martensite and the grain size was approximately 50 μm. The initial crack of the HAZ-2 specimen was located in the middle of HAZ-2, placing it in FGZ. The microstructure of FGZ was mainly composed of fine granular martensite and bainite with a grain size of about 10 μm (Figure 11c). The fine microstructure helped improve the fracture toughness of HAZ-2, explaining why the fracture toughness of HAZ-2 was better than that of BM-2. The SEM analysis of the microstructure and precipitated phases of BM-2 and HAZ-2 are provided in Figure 11d,e, respectively. In BM-2, a large volume fraction of tiny precipitates was discontinuously dispersed in lath martensite. Compared to microstructures in BM-2, the laths of martensite became shorter and narrower, while original precipitates became bigger. In numerous studies [31,34], dispersed precipitated phases were shown to restrain the release of stress and become a barrier for preventing the movement of dislocation. As a result, relatively better fracture toughness was obtained in HAZ-2 and BM-2. The TEM analyses of BM-2 are presented in Figure 12. Lath martensite and tiny precipitated phases can be seen more clearly in Figure 12b, with a width of the lath martensites estimated to be about 200 nm. The tiny precipitated phase analyzed by SAEDP was made of M23C6 type carbide. The fine dispersed precipitated phases could significantly strengthen and toughen the matrix, as reported in the literature [35]. Hence, relatively moderate fracture toughness for BM-2 was obtained in the DMWJ.
From the above analysis of fracture toughness and microstructure, it can be determined that the microstructure affects the local fracture toughness of welded joints. In addition to the type of microstructure, the factors affecting fracture toughness are mainly the grain size and the size, shape, and number of precipitated phases. The grain size of the six regions was counted according to OM analysis. The average size and number of precipitated phases were counted according to SEM and TEM analysis, and the results are shown in Figure 13 and Figure 14. The brittle fracture characteristics of BM-1 are mainly related to the directional distribution of striped precipitated phases. The fracture toughness of the HAZ is better than that of the BM, which is mainly related to the grain size. The grain size of the HAZ shown in Figure 13 is much smaller than that of the corresponding BM. In addition to BM-1, Figure 14 show that the number of precipitated phases for BL, WM, and BM-2 increases respectively, while the average size of the precipitated phases decreases orderly. It can be seen from the resistance curve in Figure 4 that the fracture toughness of BL, WM, and BM-2 increases sequentially. This shows that under certain conditions, the number of precipitated phases is positively related to fracture toughness, while the size of precipitated phases is negatively related to fracture toughness. Therefore, it is beneficial to obtain precipitated phases with a larger number, finer size, and smaller aspect ratio relative to enhancing the fracture toughness of the welded rotor.

3.5. Inhomogeneity of Fracture Toughness in DMWJ

The above analyses revealed different fracture toughnesses in six characteristic regions of the DMWJ. This could mainly be related to the difference in the microstructure. However, more regions existed on the DMWJ, which can be approximated as an uneven structure formed by multiple continuous micro-regions [36,37]. In our previous work, micro-region strengths were obtained along the DMWJ by layered tensile testing every 1 mm, as shown in Figure 15 [30]. Here, the yield strength (YS) and ultimate tensile strength (UTS) along the DMWJ looked unevenly distributed, especially near HAZs and FBs. The distributions of strength on BM-1 and BM-2 were stable, while small fluctuation was seen in WM. The strength in BL showed larger fluctuations due to the narrow region of BL. The strength in HAZ-1 and HAZ-2 was reduced in a gradient from FB to BM, while the strength on both sides of the FBs changed drastically. The uneven distribution of strength on the DMWJ was attributed to changes in microstructure. The relationship between the microstructure, strength, and fracture toughness of metal materials [38,39], as well as the microstructures in Figure 7, Figure 8, Figure 9, Figure 10, Figure 11, Figure 12, Figure 13 and Figure 14 and strength distributions in Figure 15, revealed unevenly distributed fracture toughness along the DMWJ. For BM-1 and BM-2 with uniform microstructures, the fracture toughness remained unchanged. The influence of multi-layer and multi-pass weld structure led to slight fluctuations in fracture toughness on WM, similar to strength distribution. The influence of the welding heat thermal cycle combined with a multi-layer surfacing structure led to larger fluctuations in fracture toughness of the narrow BL (5 mm). Furthermore, the gradient microstructure in HAZs inevitably induced a gradient distribution of fracture toughness. At FBs, the chemical composition and microstructure contrast on both sides of HAZ-1/BL and HAZ-2/WM boundaries were the largest in the entire DMWJ, causing a big leap in fracture toughness on both sides of FBs. In short, the fracture toughness along the heterogeneous welded joint was not uniformly distributed, and the distribution law of fracture toughness along the welded joint was related to the microstructure.
The micro-region fracture toughness of welded joint was also related to strength mismatch around the initial crack. The strength mismatch would affect the crack growth driving force, fracture toughness, and crack growth behavior [40,41]. In Figure 15, the inhomogeneity distribution of strength inevitably led to the strength mismatch effect in the micro-region of the DMWJ. No mismatch effect was noticed on BM-1 and BM-2 with uniform strength distribution. The plastic strain field and triaxial stress distribution at the crack tip were symmetrical, leading to approximately straight line crack propagation paths in BM-1 and BM-2. In HAZs, the strength of the gradient distribution caused a mismatch effect in the micro-region. For example, an initial crack located in FGZ induced one side crack as CGZ with higher strength, and the other side was OTZ with lower strength. These features formed an asymmetric crack tip plastic strain field. Meanwhile, the strain field on the high-strength CGZ side was small, while that on the low-strength OTZ side was large. Since the energy held by CGZ was not as much as that of OTZ, the cracks preferentially propagated to the CGZ side. Eventually, the cracks then deviated and expanded toward the CGZ. The same would apply to cases with initial cracks located in CGZ and OTZ. Strength mismatch might cause deflection of crack propagation from FGZ to CGZ or OTZ, which affects the fracture behavior of HAZ. In FBs, the strength mismatch counted as the most serious phenomenon in the entire DMWJ. For example, the strength on the HAZ-1 side at FB-1 (HAZ-1/BL boundary) was very high, while that on the BL side was very low. In addition, great strength contrast was seen on the boundary, meaning a more serious strength mismatch effect. When the initial crack was generated and propagated on FB-1, asymmetric plastic strain fields appeared on both sides of the boundary. The HAZ-1 side possessed higher strength but a smaller plastic strain field. By comparison, the BL side had lower strength but a larger plastic strain field. Since the HAZ-1 side with a small plastic strain zone could absorb less energy, sudden instability in the crack and brittle fracture could be induced. However, the plastic strain field on the BL side was large, can thereby absorb more energy and induce ductile fracture of crack. Hence, FBs were made of mixed models based on brittle and ductile fracture. FB-2 (WM/HAZ-2 boundary) showed the same situation as FB-1. Therefore, the ability to accurately determine the fracture toughness characteristics of HAZ and FB was key in evaluating the integrity of the crack structure in the DMWJ.
In sum, the micro-region fracture toughness possessed inhomogeneity along the DWMJ and was affected by both the microstructure and strength mismatch. Hence, better understanding and mastering of such inhomogeneous order would benefit the accurate integrity evaluation of DMWJs.

4. Conclusions

The micro-region fracture toughness of the DMWJ in a steam turbine rotor fabricated by the buttering layer surfacing welding process and multi-layer and multi-pass welding technology was successfully evaluated. The δ-R curves and fracture toughness parameters were obtained, and the fracture and microstructure of each region were analyzed. The following conclusions can be drawn:
  • The fracture resistance curves and parameters of six characteristic regions in the welded joint looked different. BM-1 was not able to obtain a resistance curve under the current test conditions. The resistance curve is highest in the middle of HAZ-1 but the lowest in BL. The fracture toughness parameters δ0.2BL of HAZ-1, BL, WM, HAZ-2, and BM-2 were estimated to be 0.407, 0.214, 0.232, 0.316, and 0.250 mm, respectively. The KQ of BM-1 was calculated as 91.2 MPa m1/2.
  • BM-1 was made of cleavage brittle fracture mode, while HAZ-1, BL, WM, HAZ-2, and BM-2 were all based on dimple ductile fracture mode. The fracture toughnesses of the welded joint are not uniformly distributed. It is recommended that BM-1 be evaluated using the linear elastic fracture method KIC instead of the elastoplastic fracture methods CTOD and J-integral.
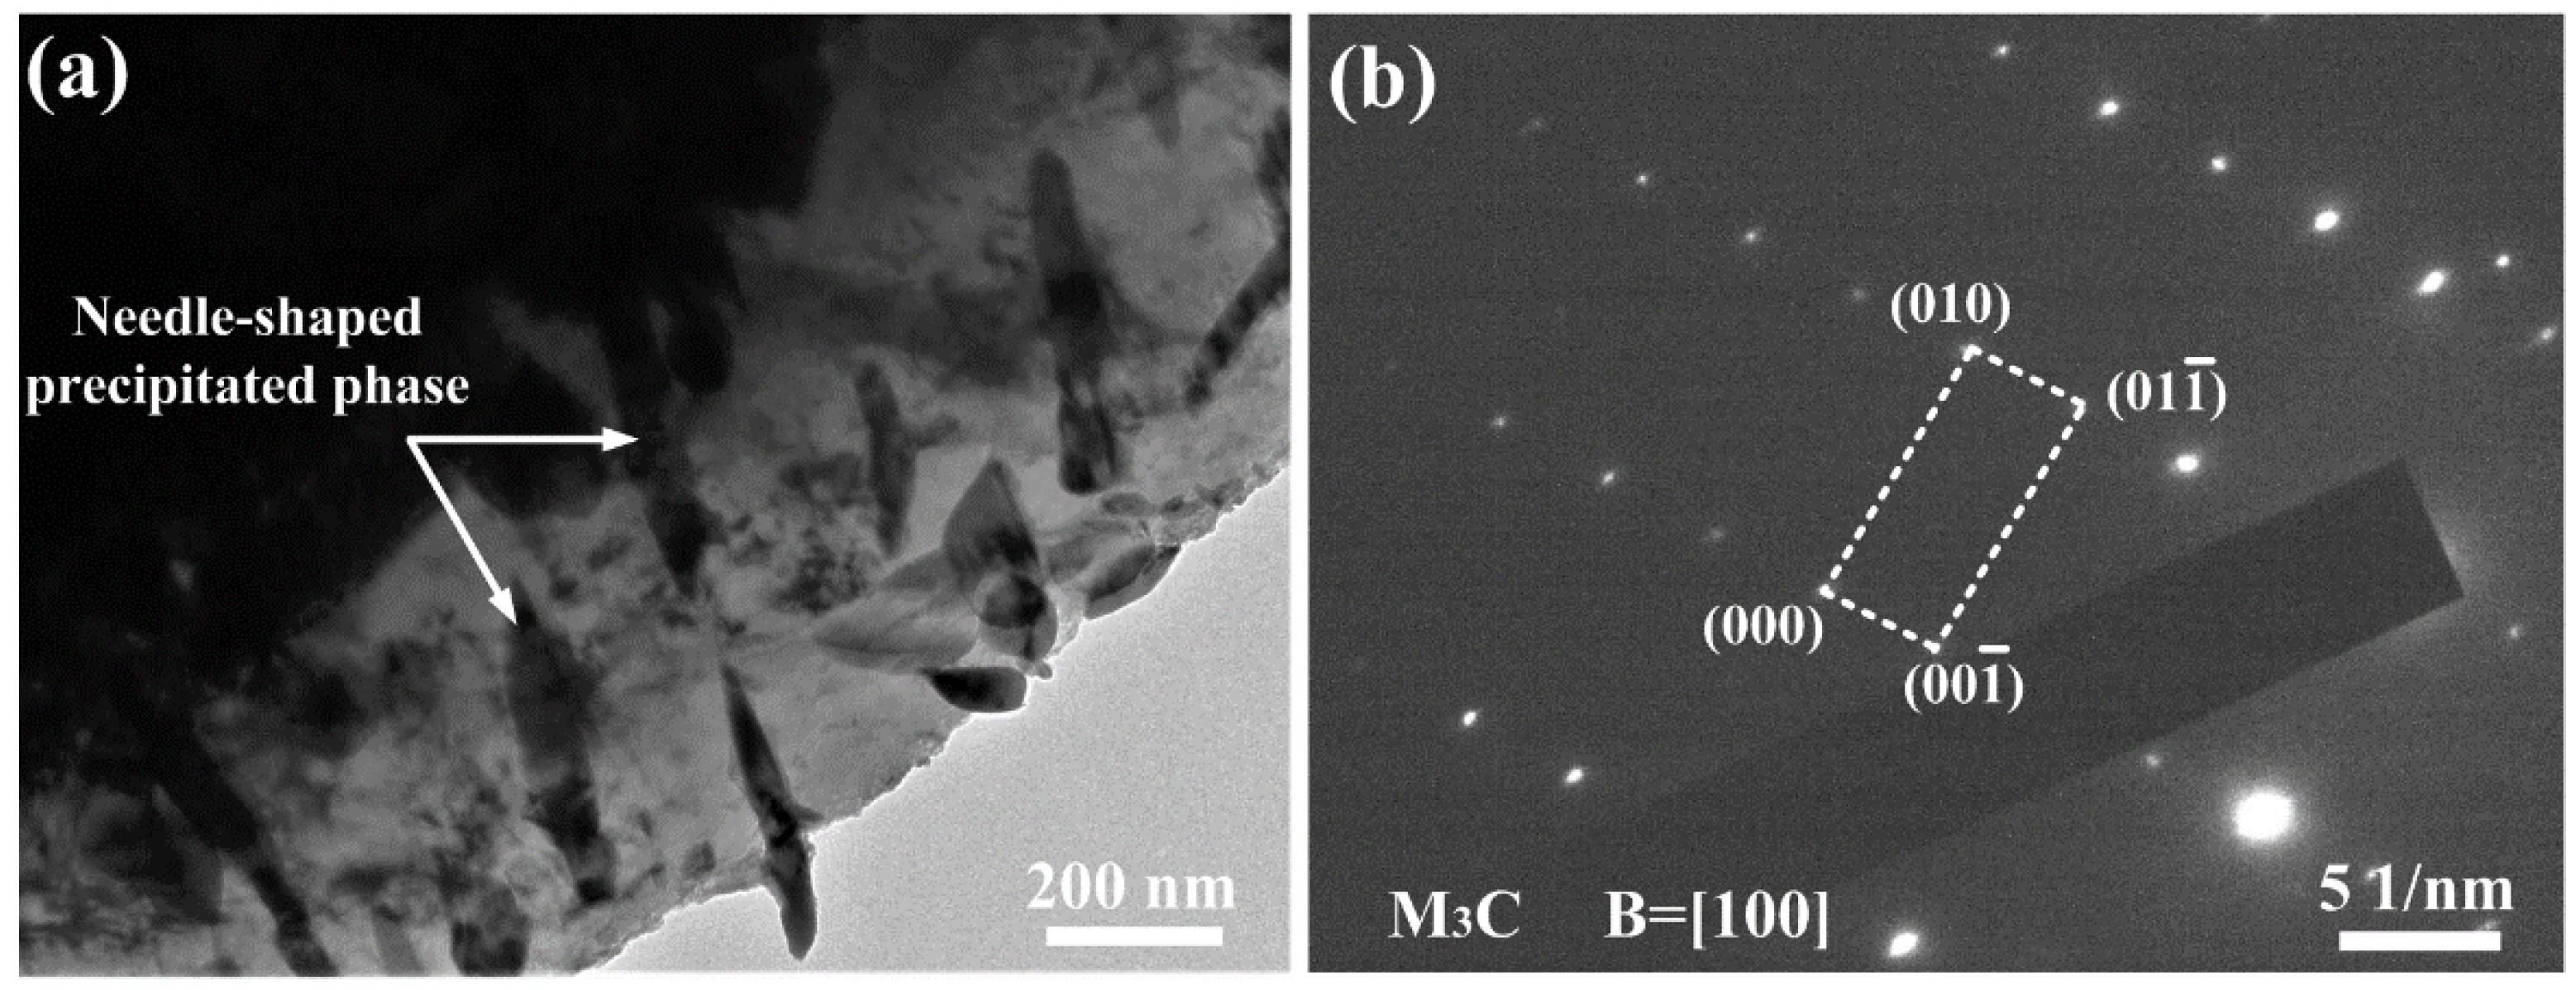
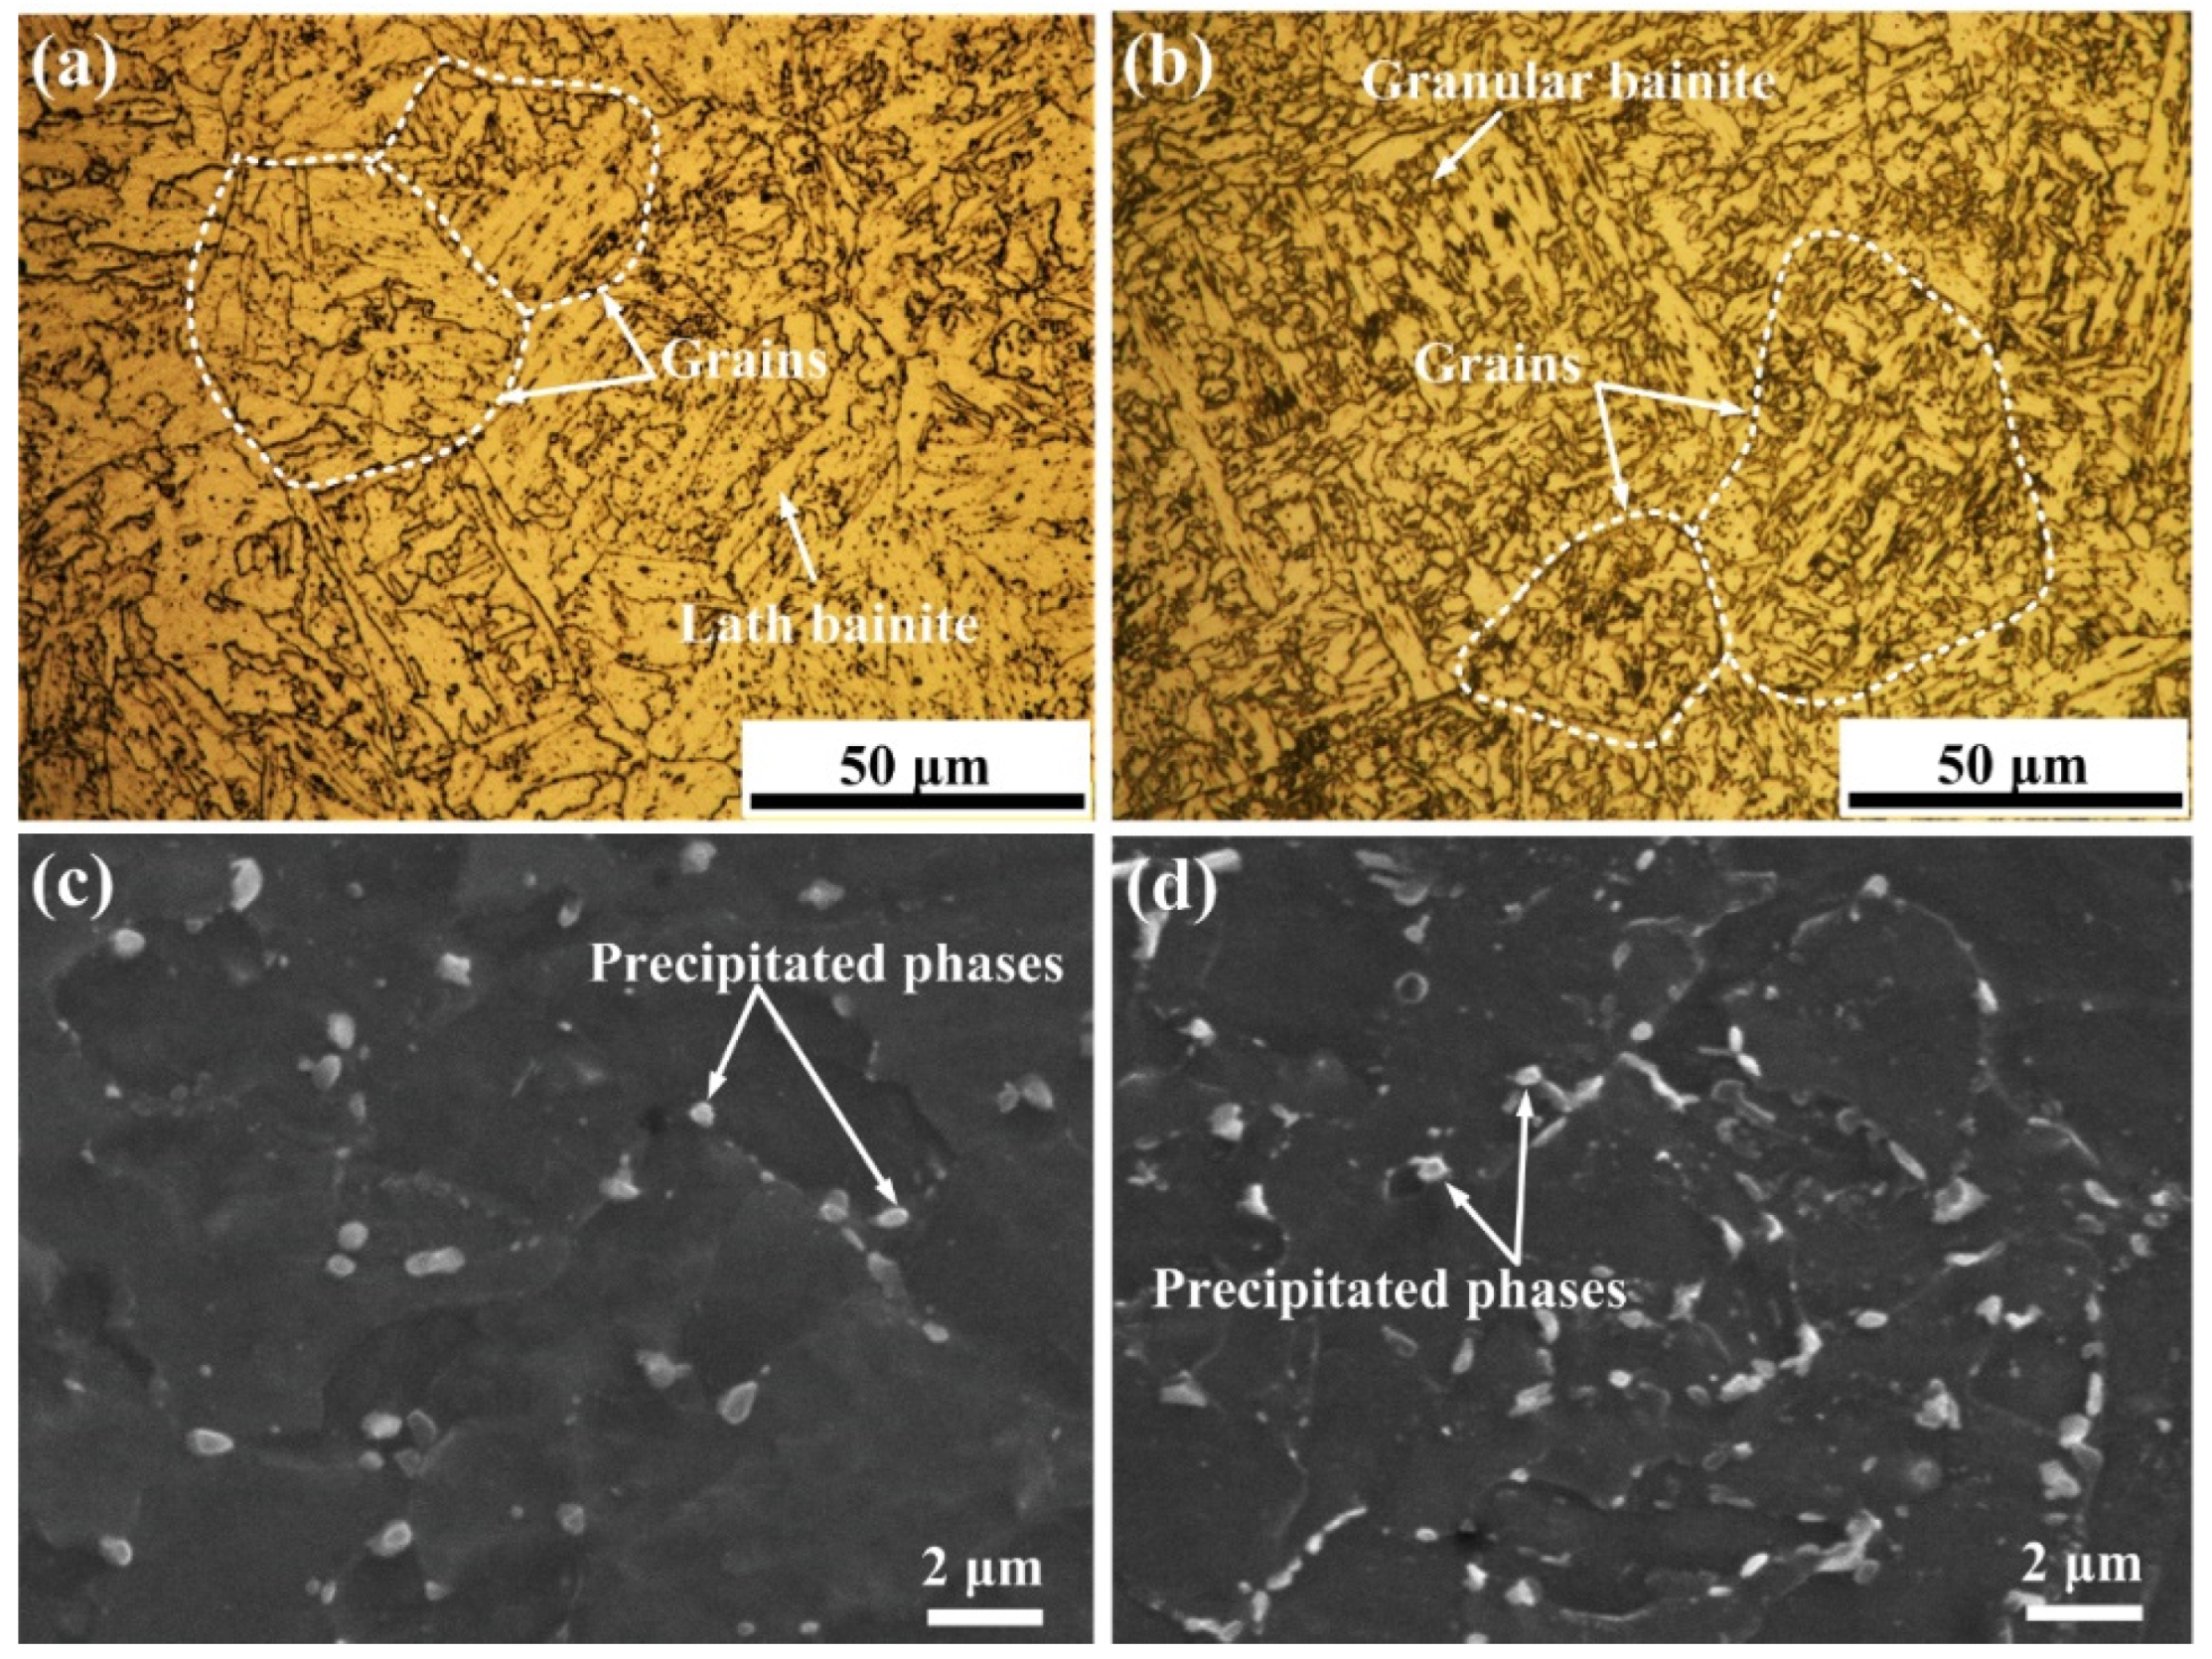
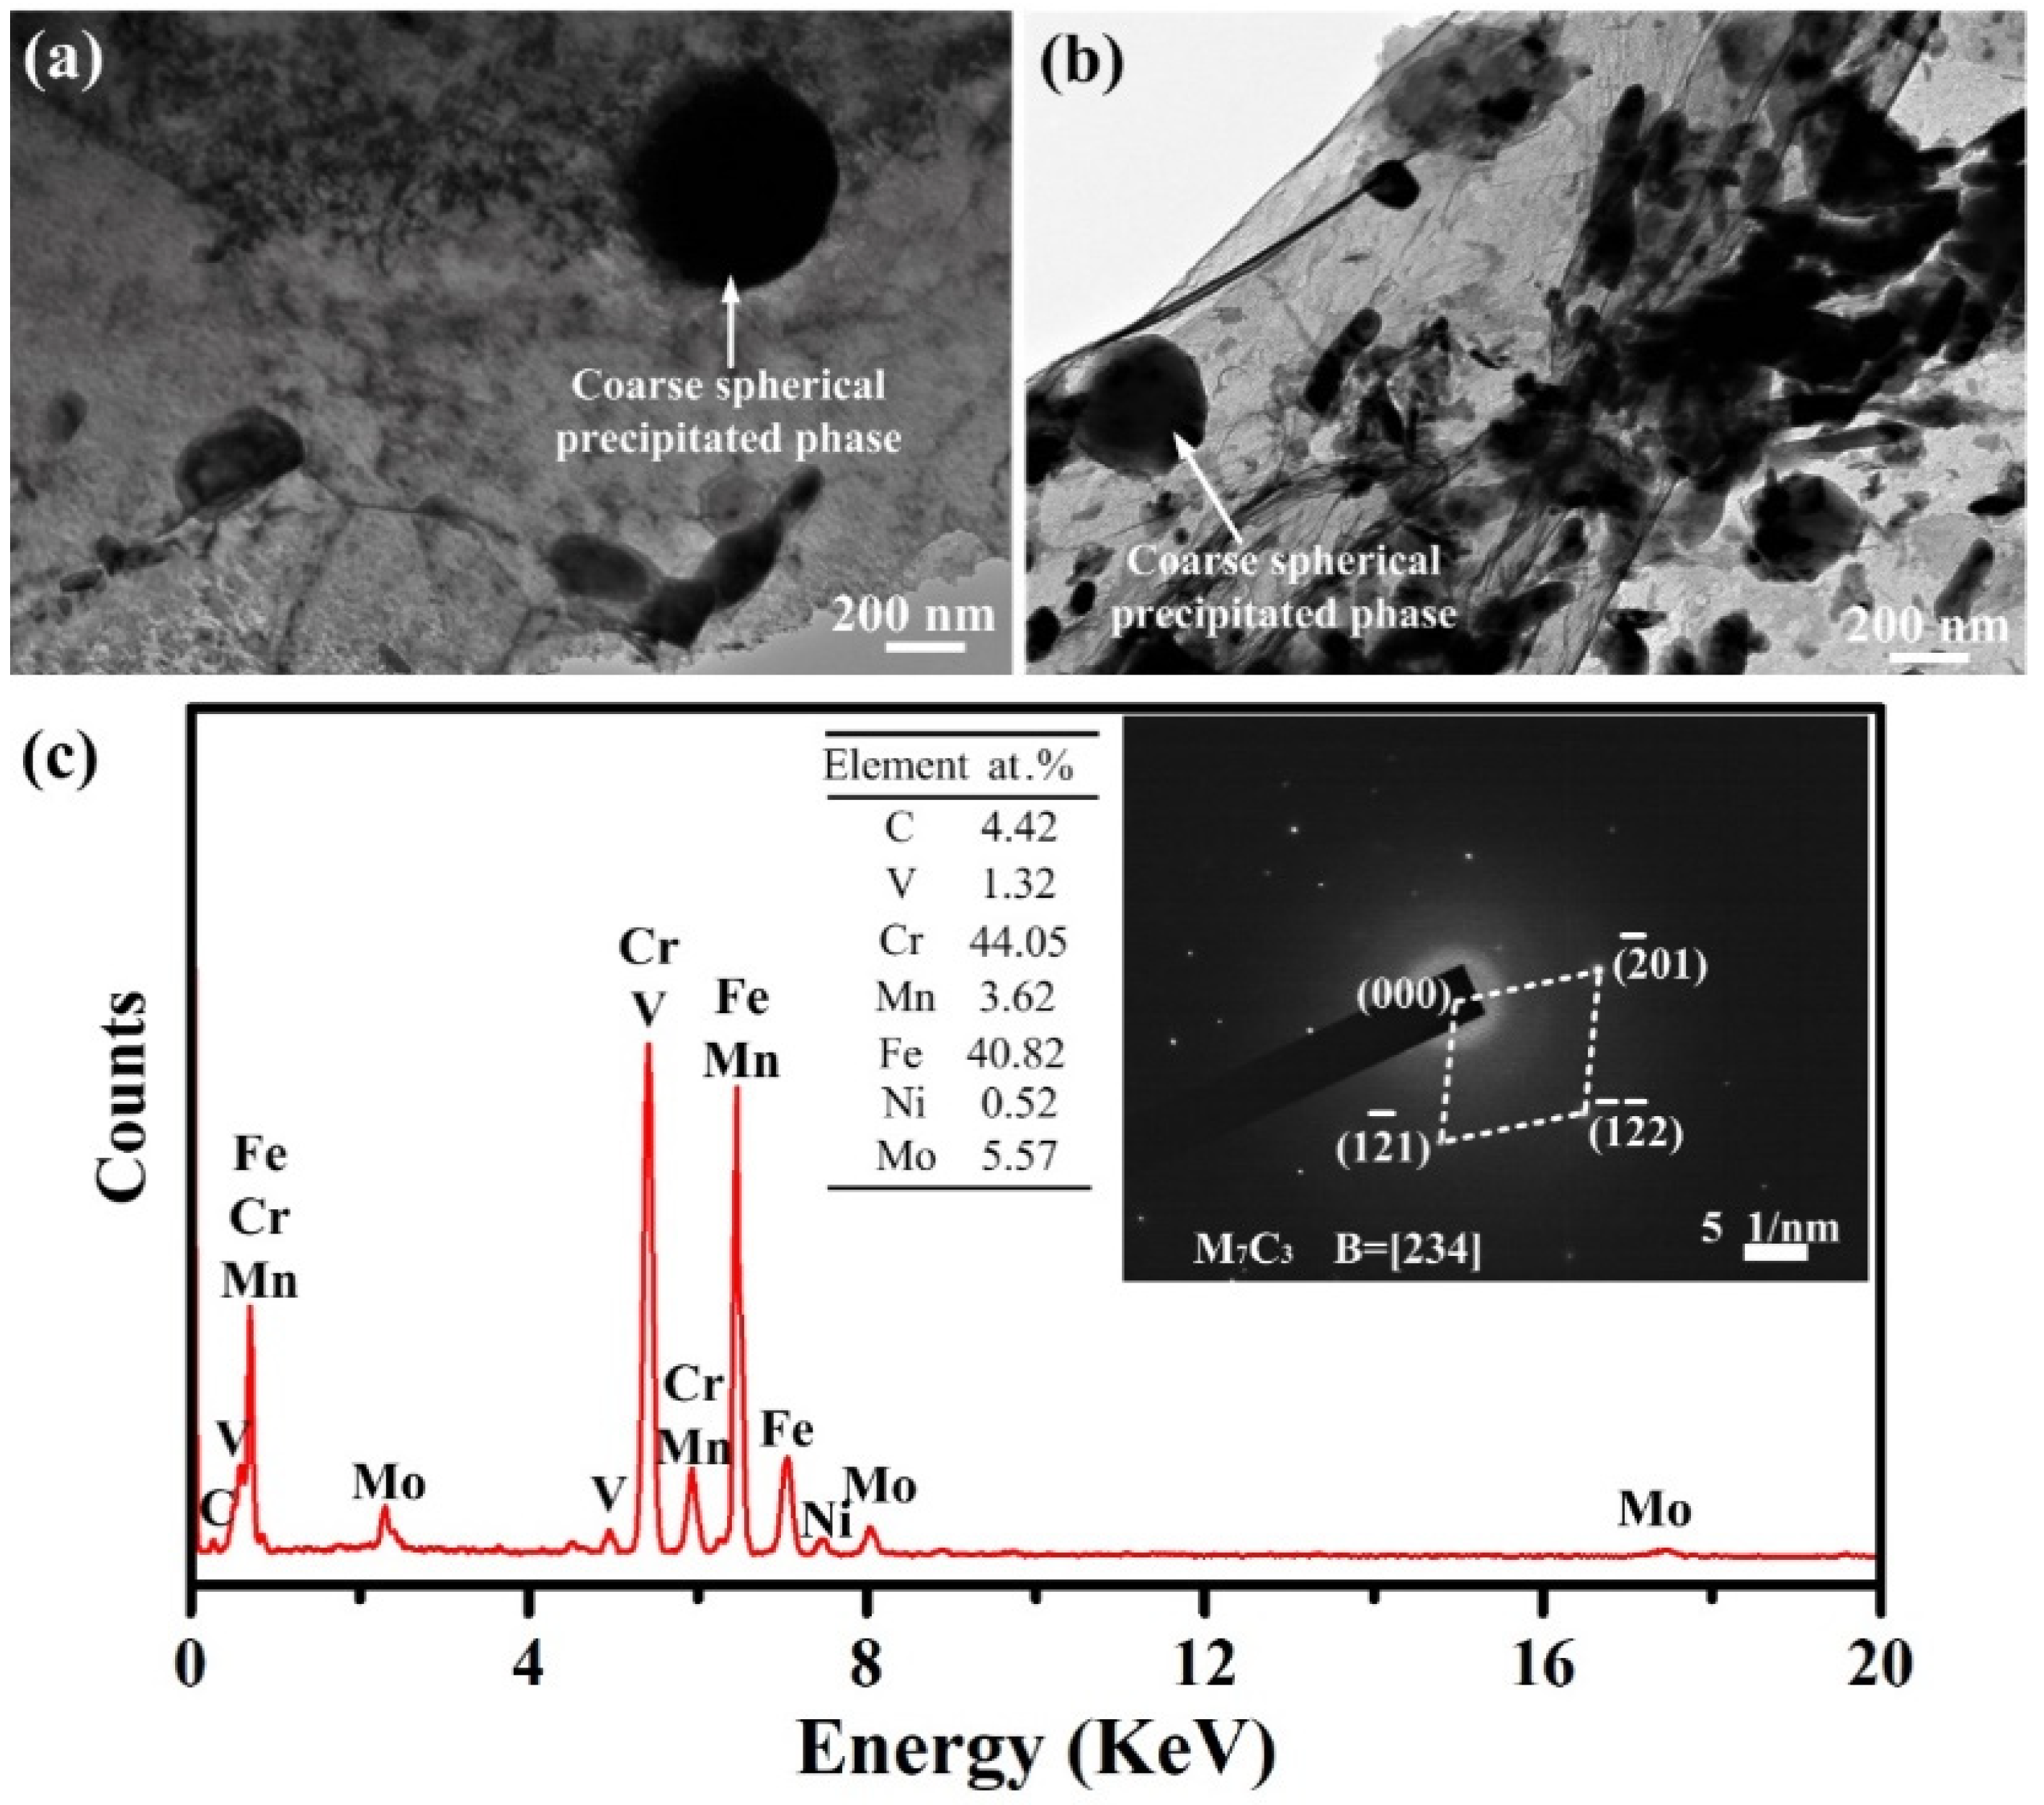
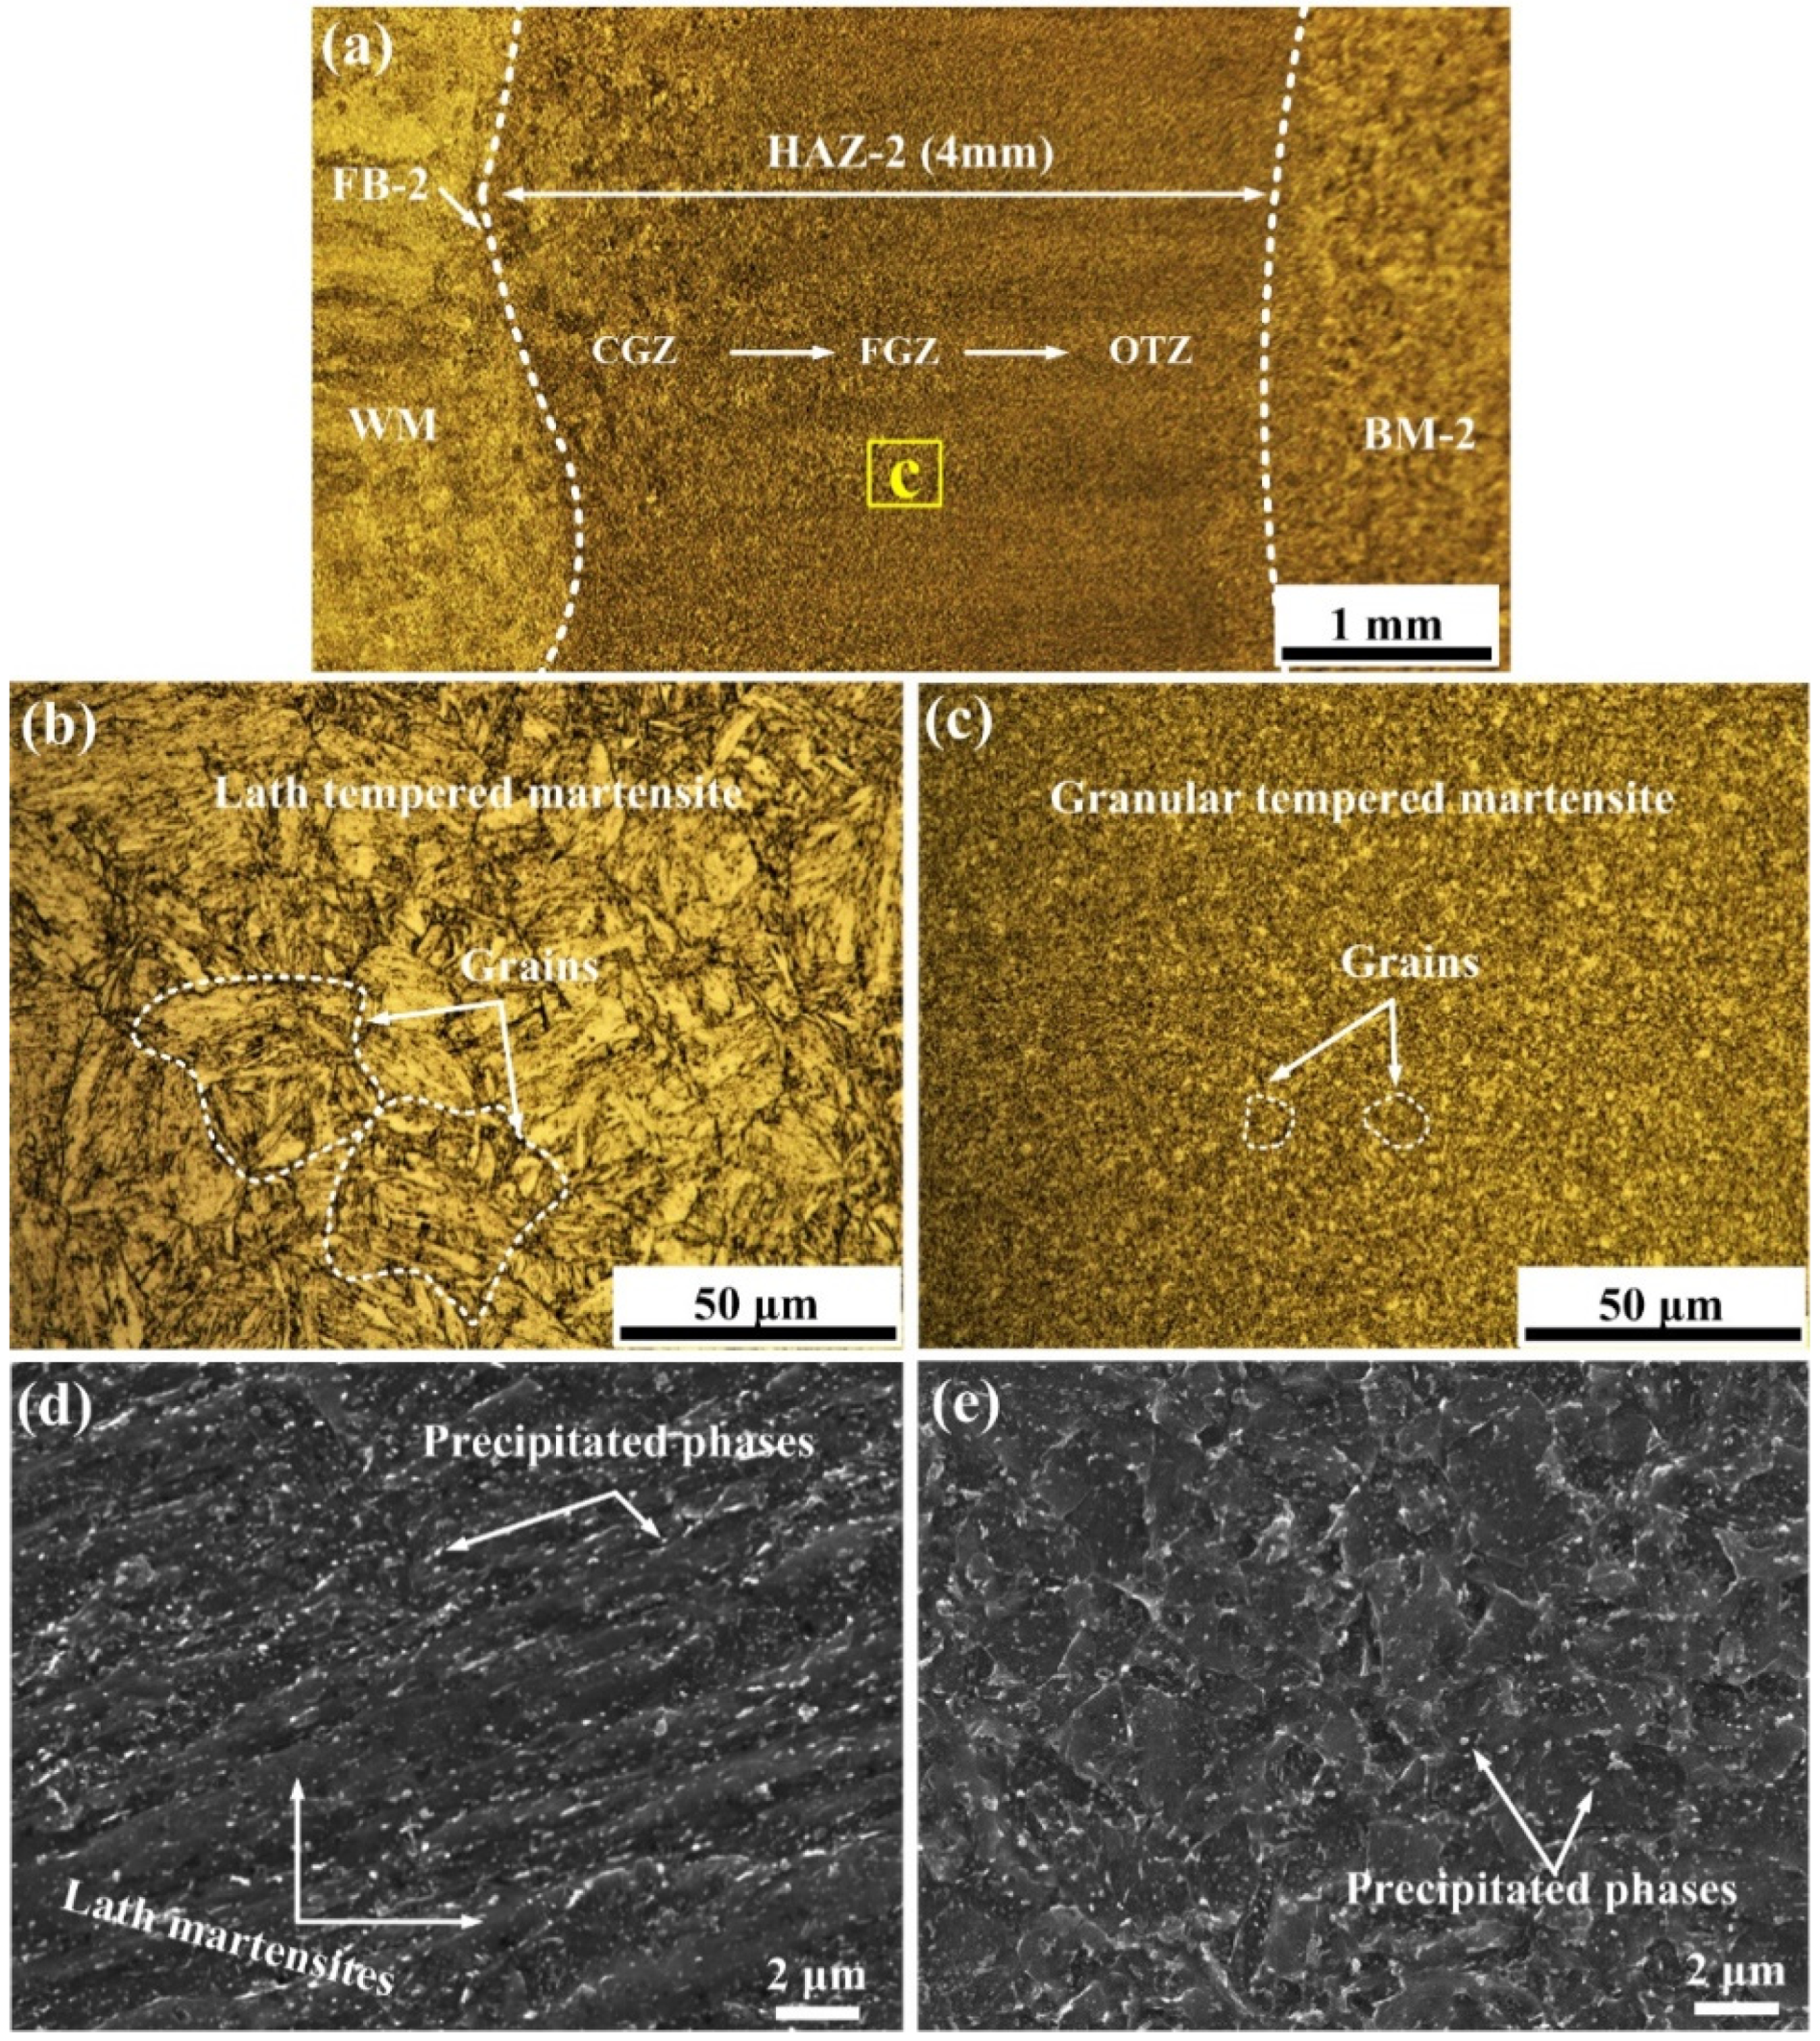
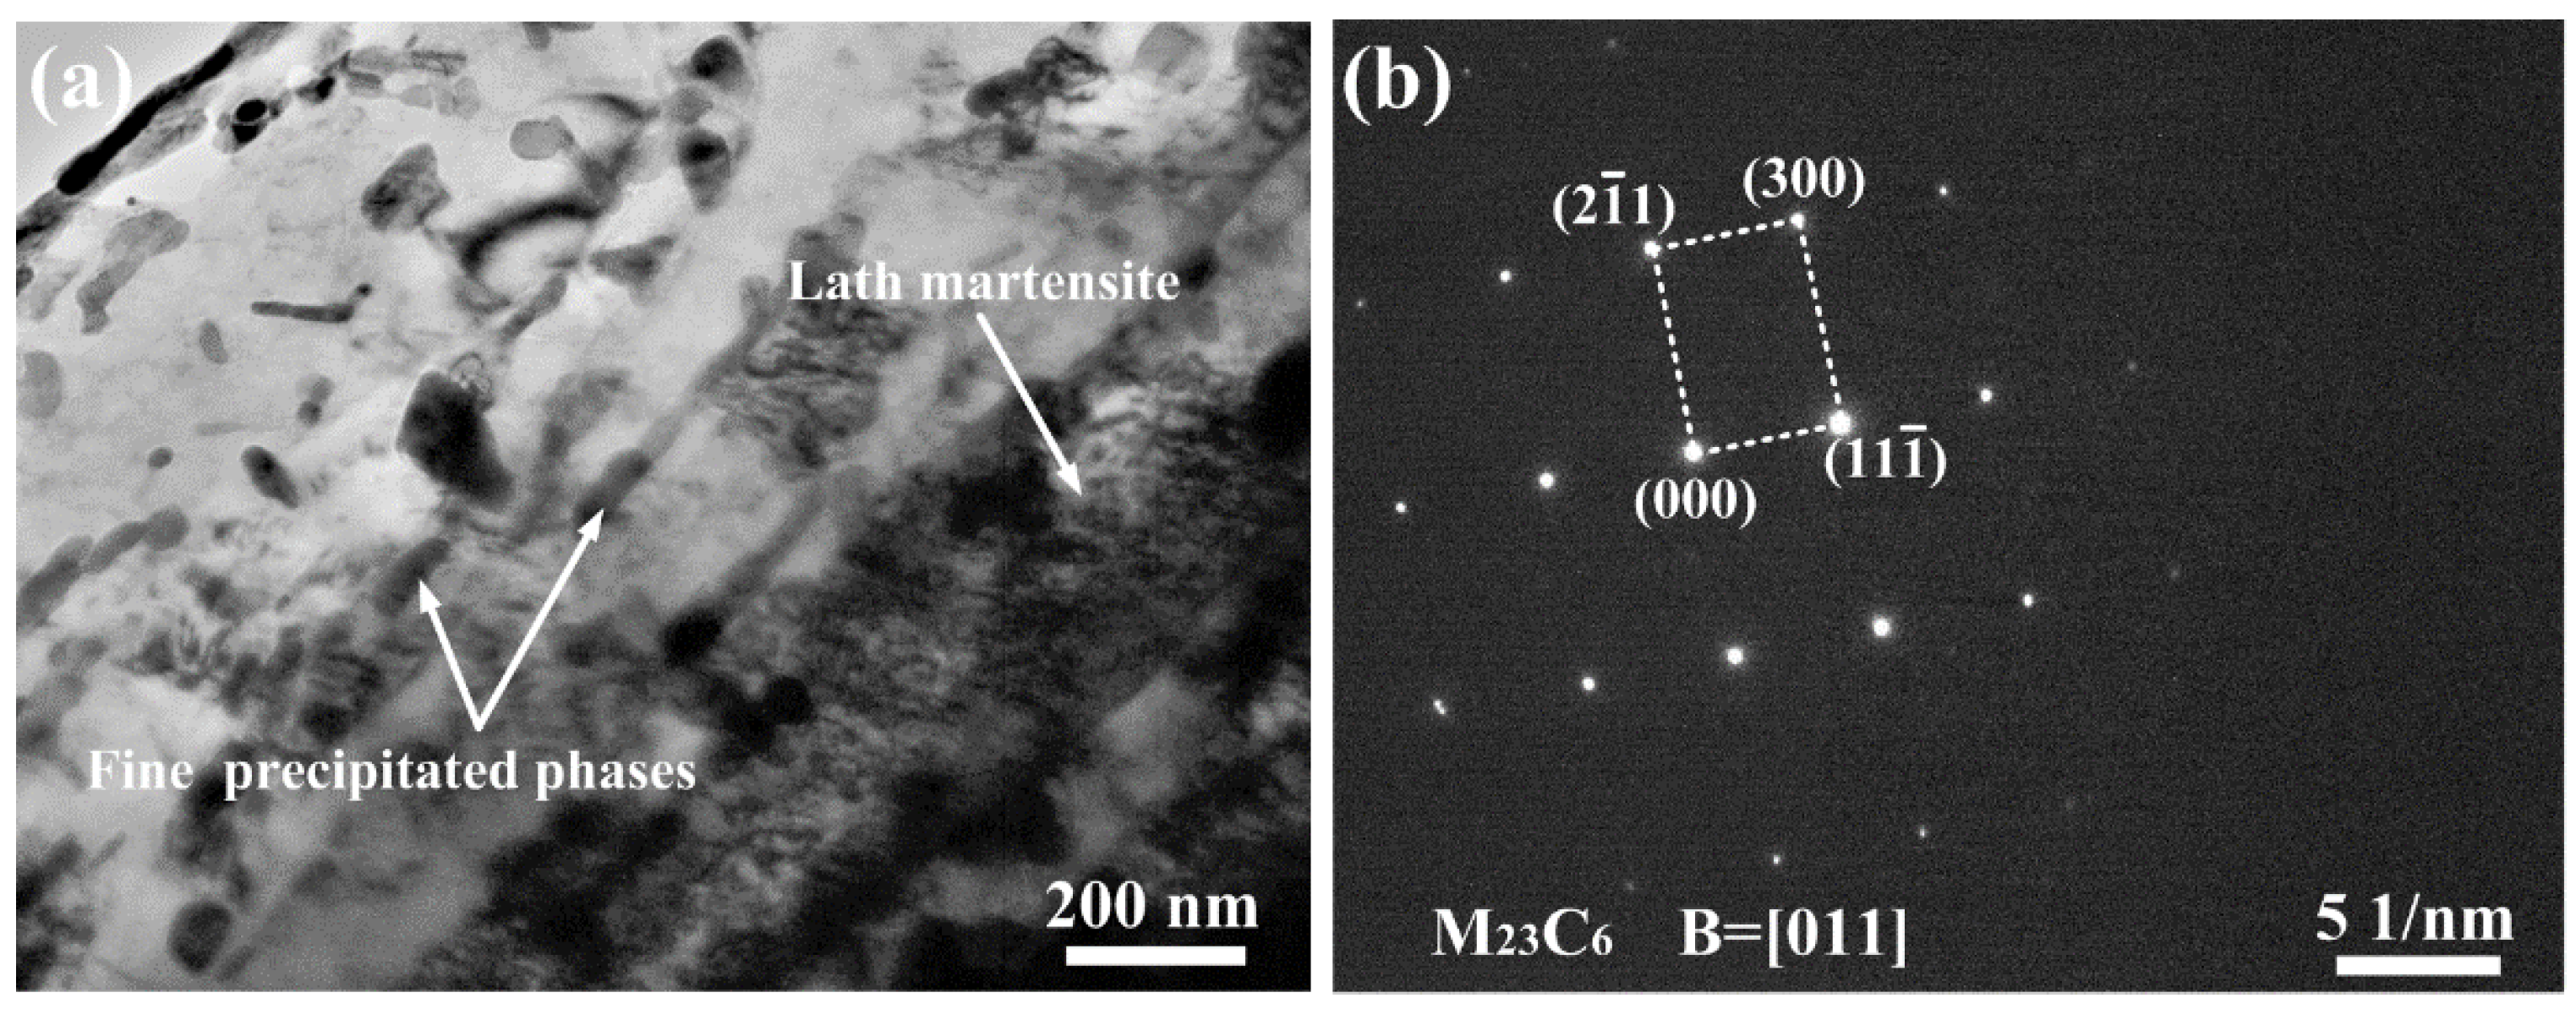
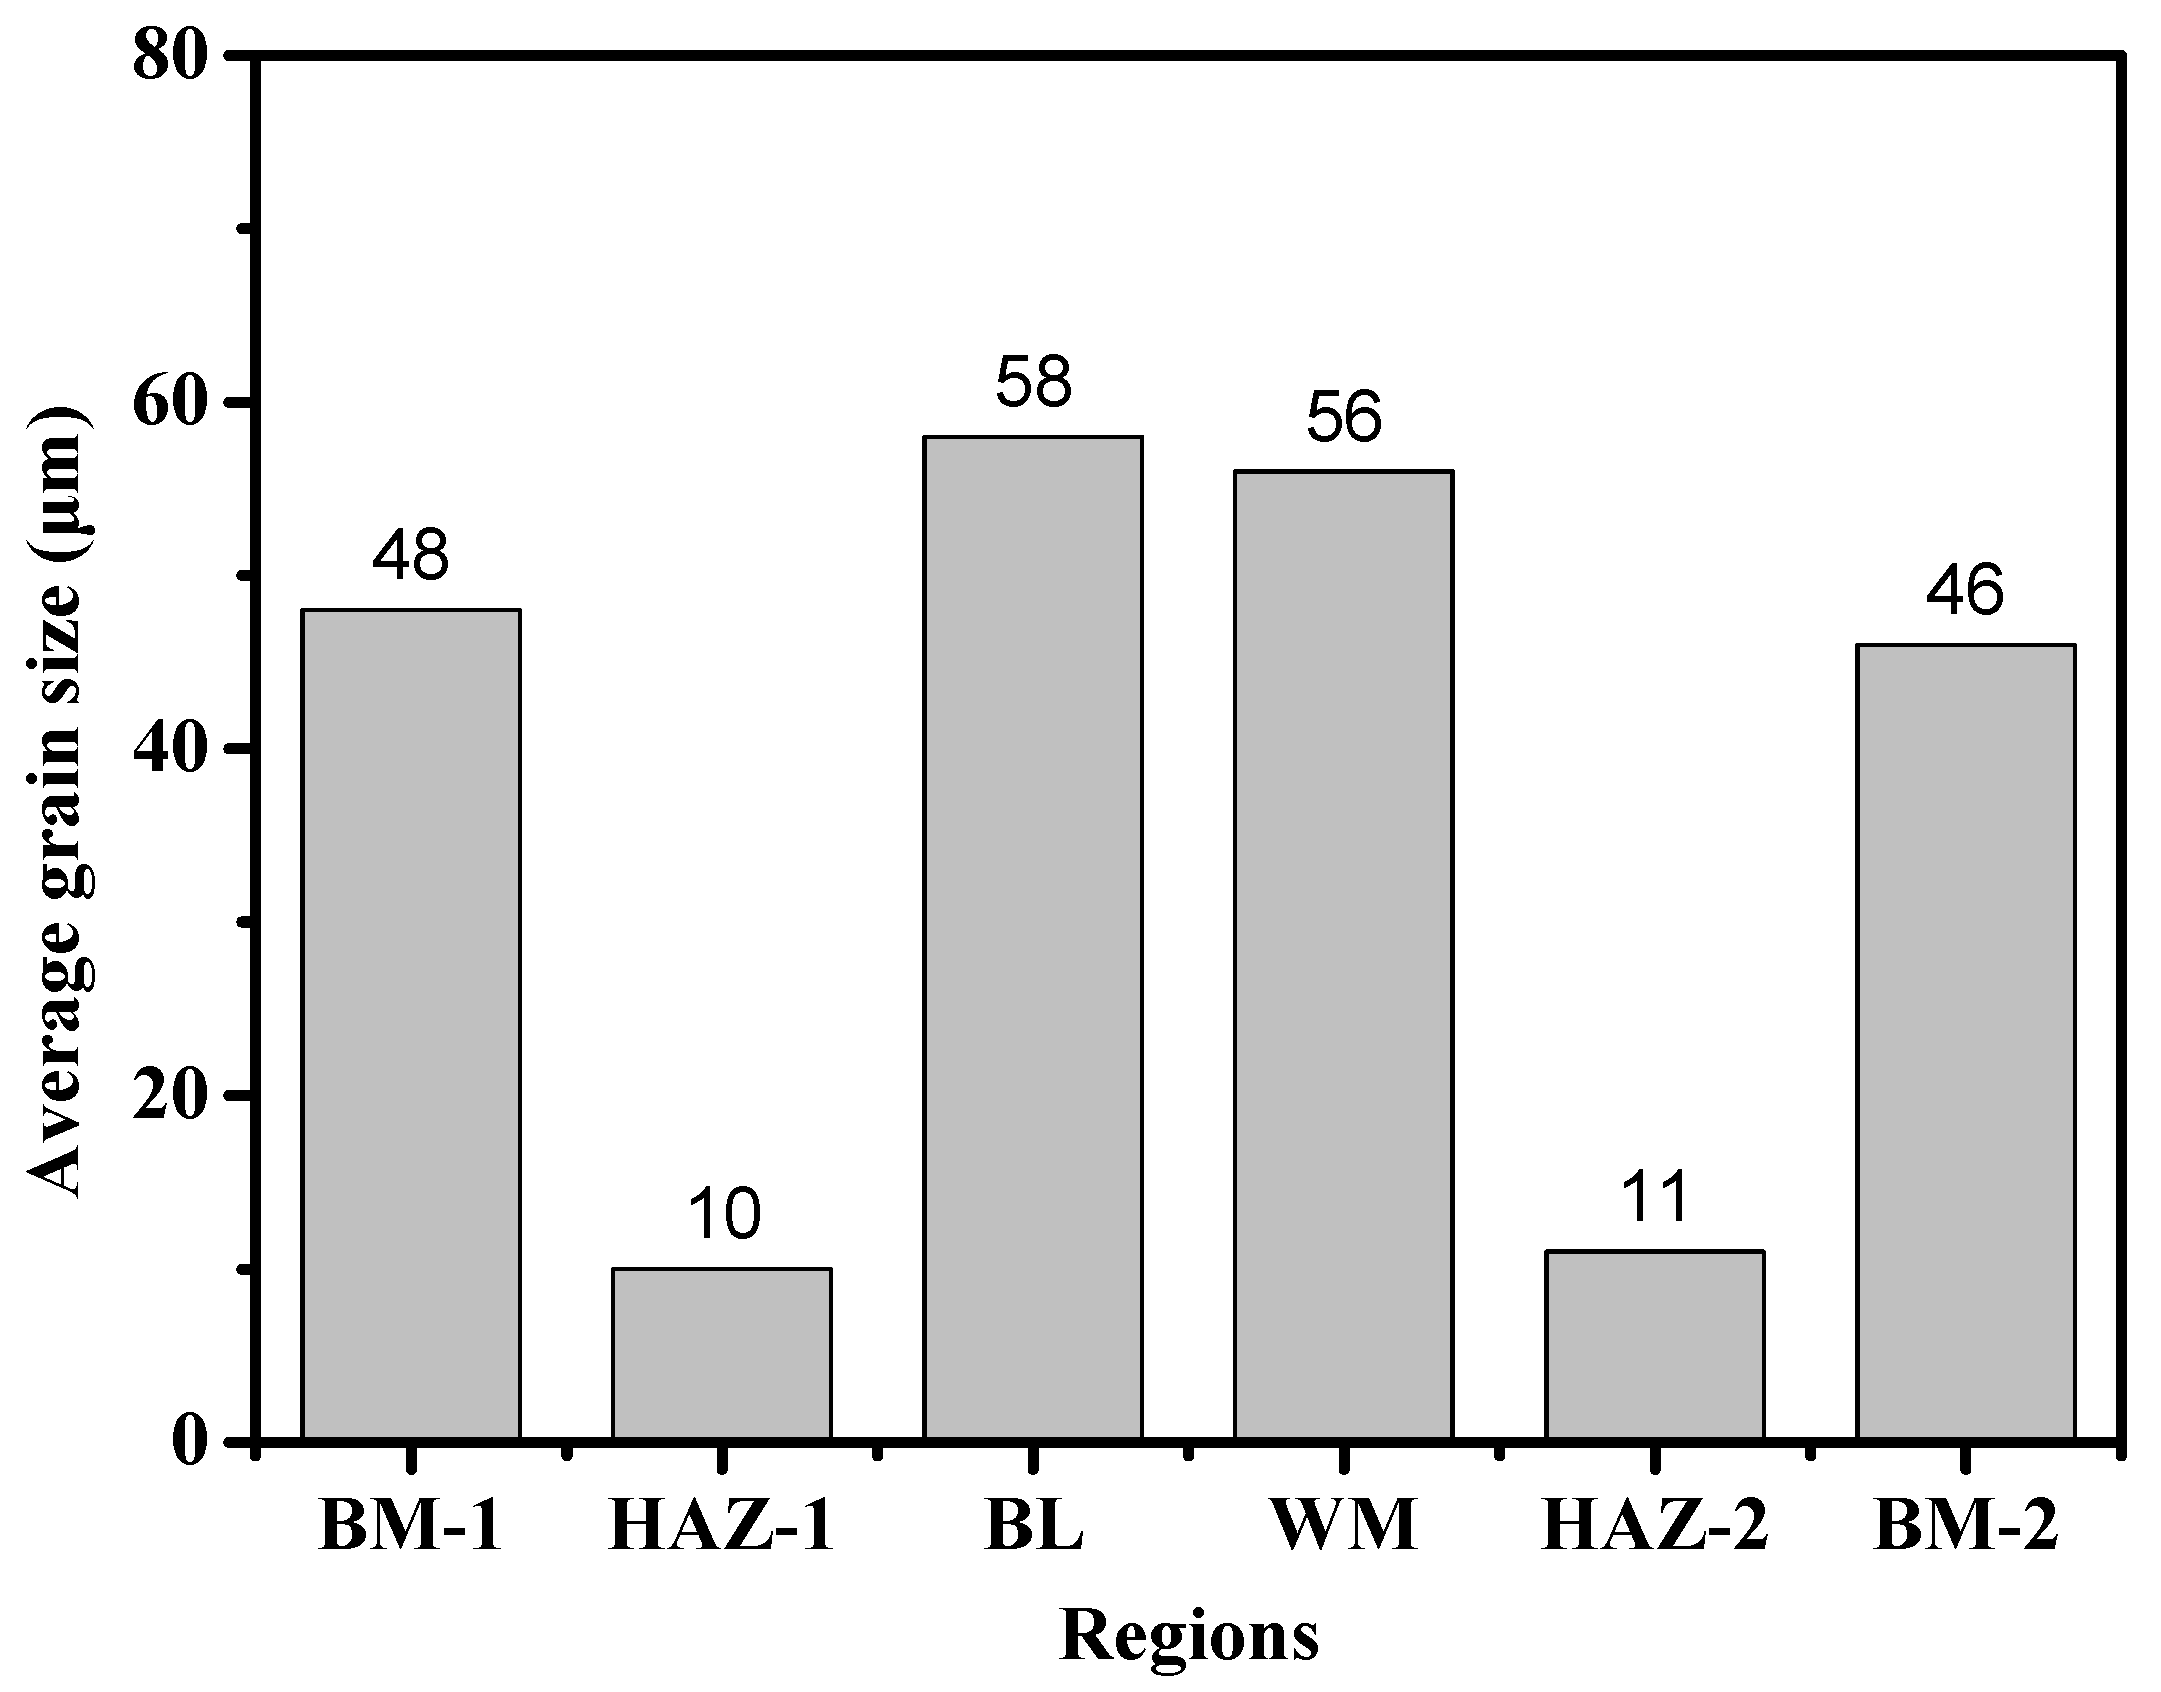
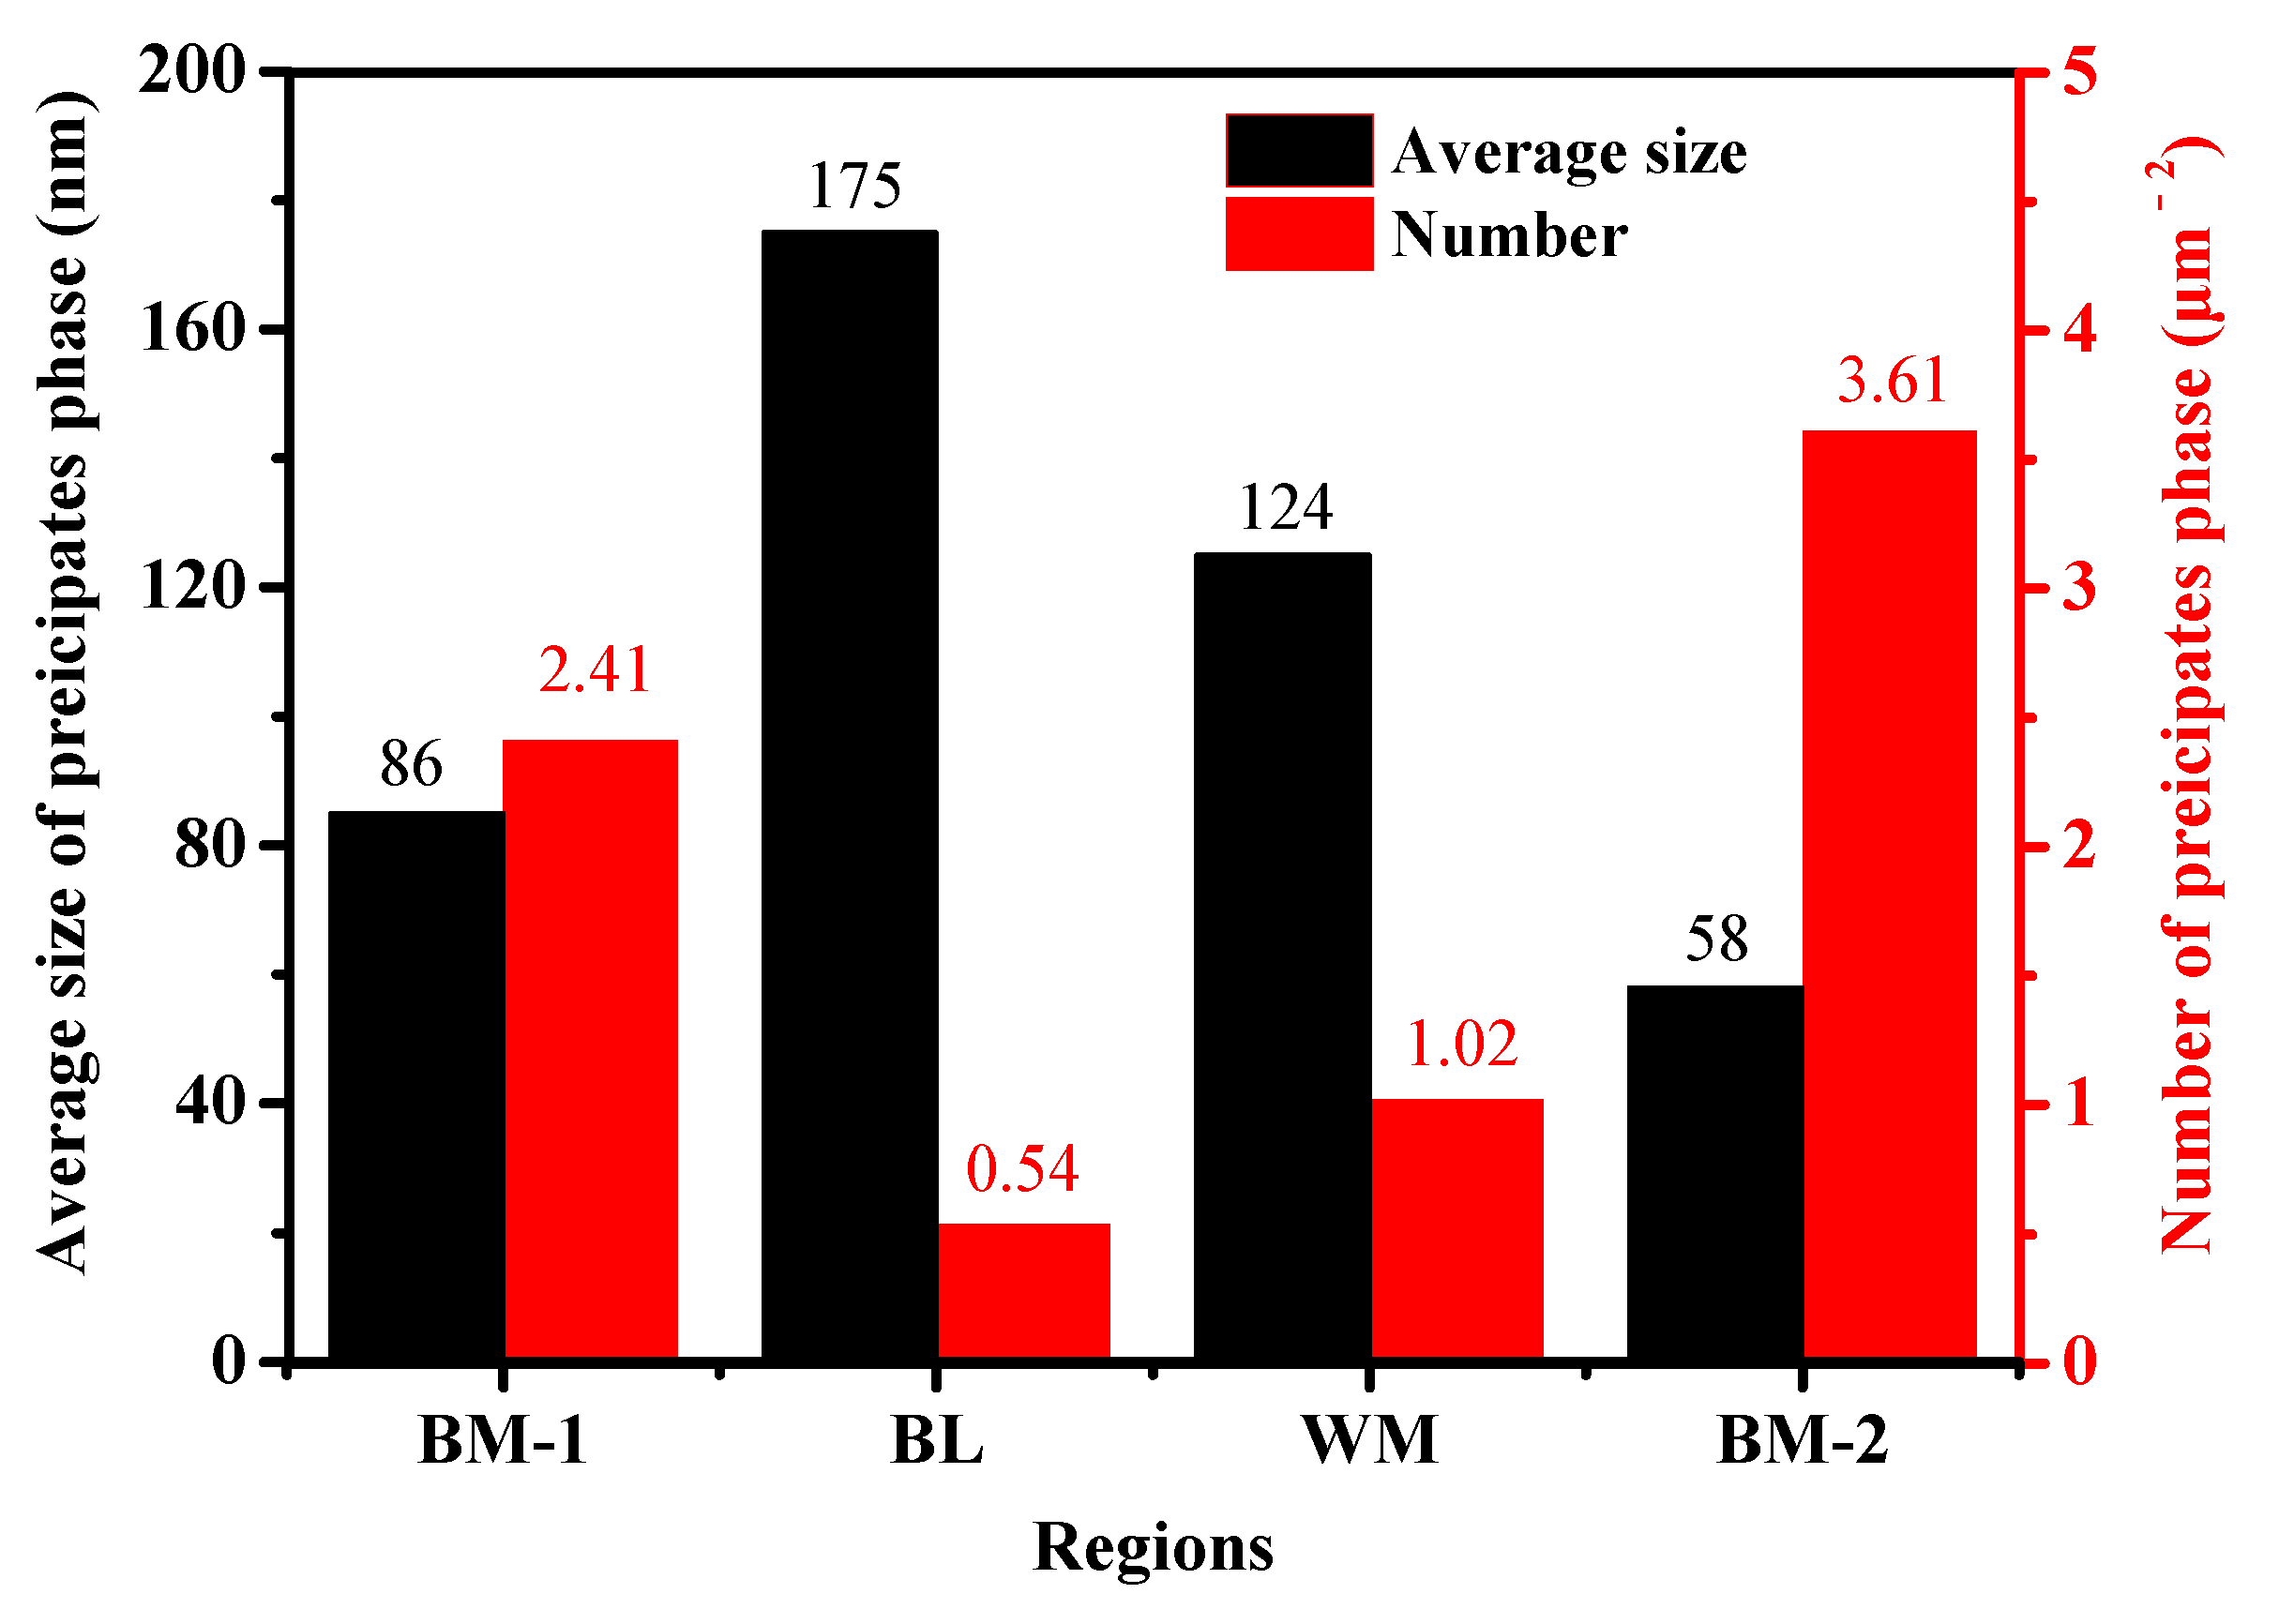
  • Inhomogeneous fracture toughness existed in the DMWJ and was related to the grain size and the size, shape, and number of precipitated phases. The precipitated phase on grain boundary and regularly arranged needle-shaped carbide M3C were the reasons behind the brittle fracture of BM-1. The fine grain size and narrow lath of tempered martensite and bainite improved the toughness in the middle of HAZs, leading to better fracture toughness in the middle of HAZs than the corresponding BMs. The coarse spherical carbide M7C3 in BL and WM was the reason behind the lower fracture toughness of the welding area.
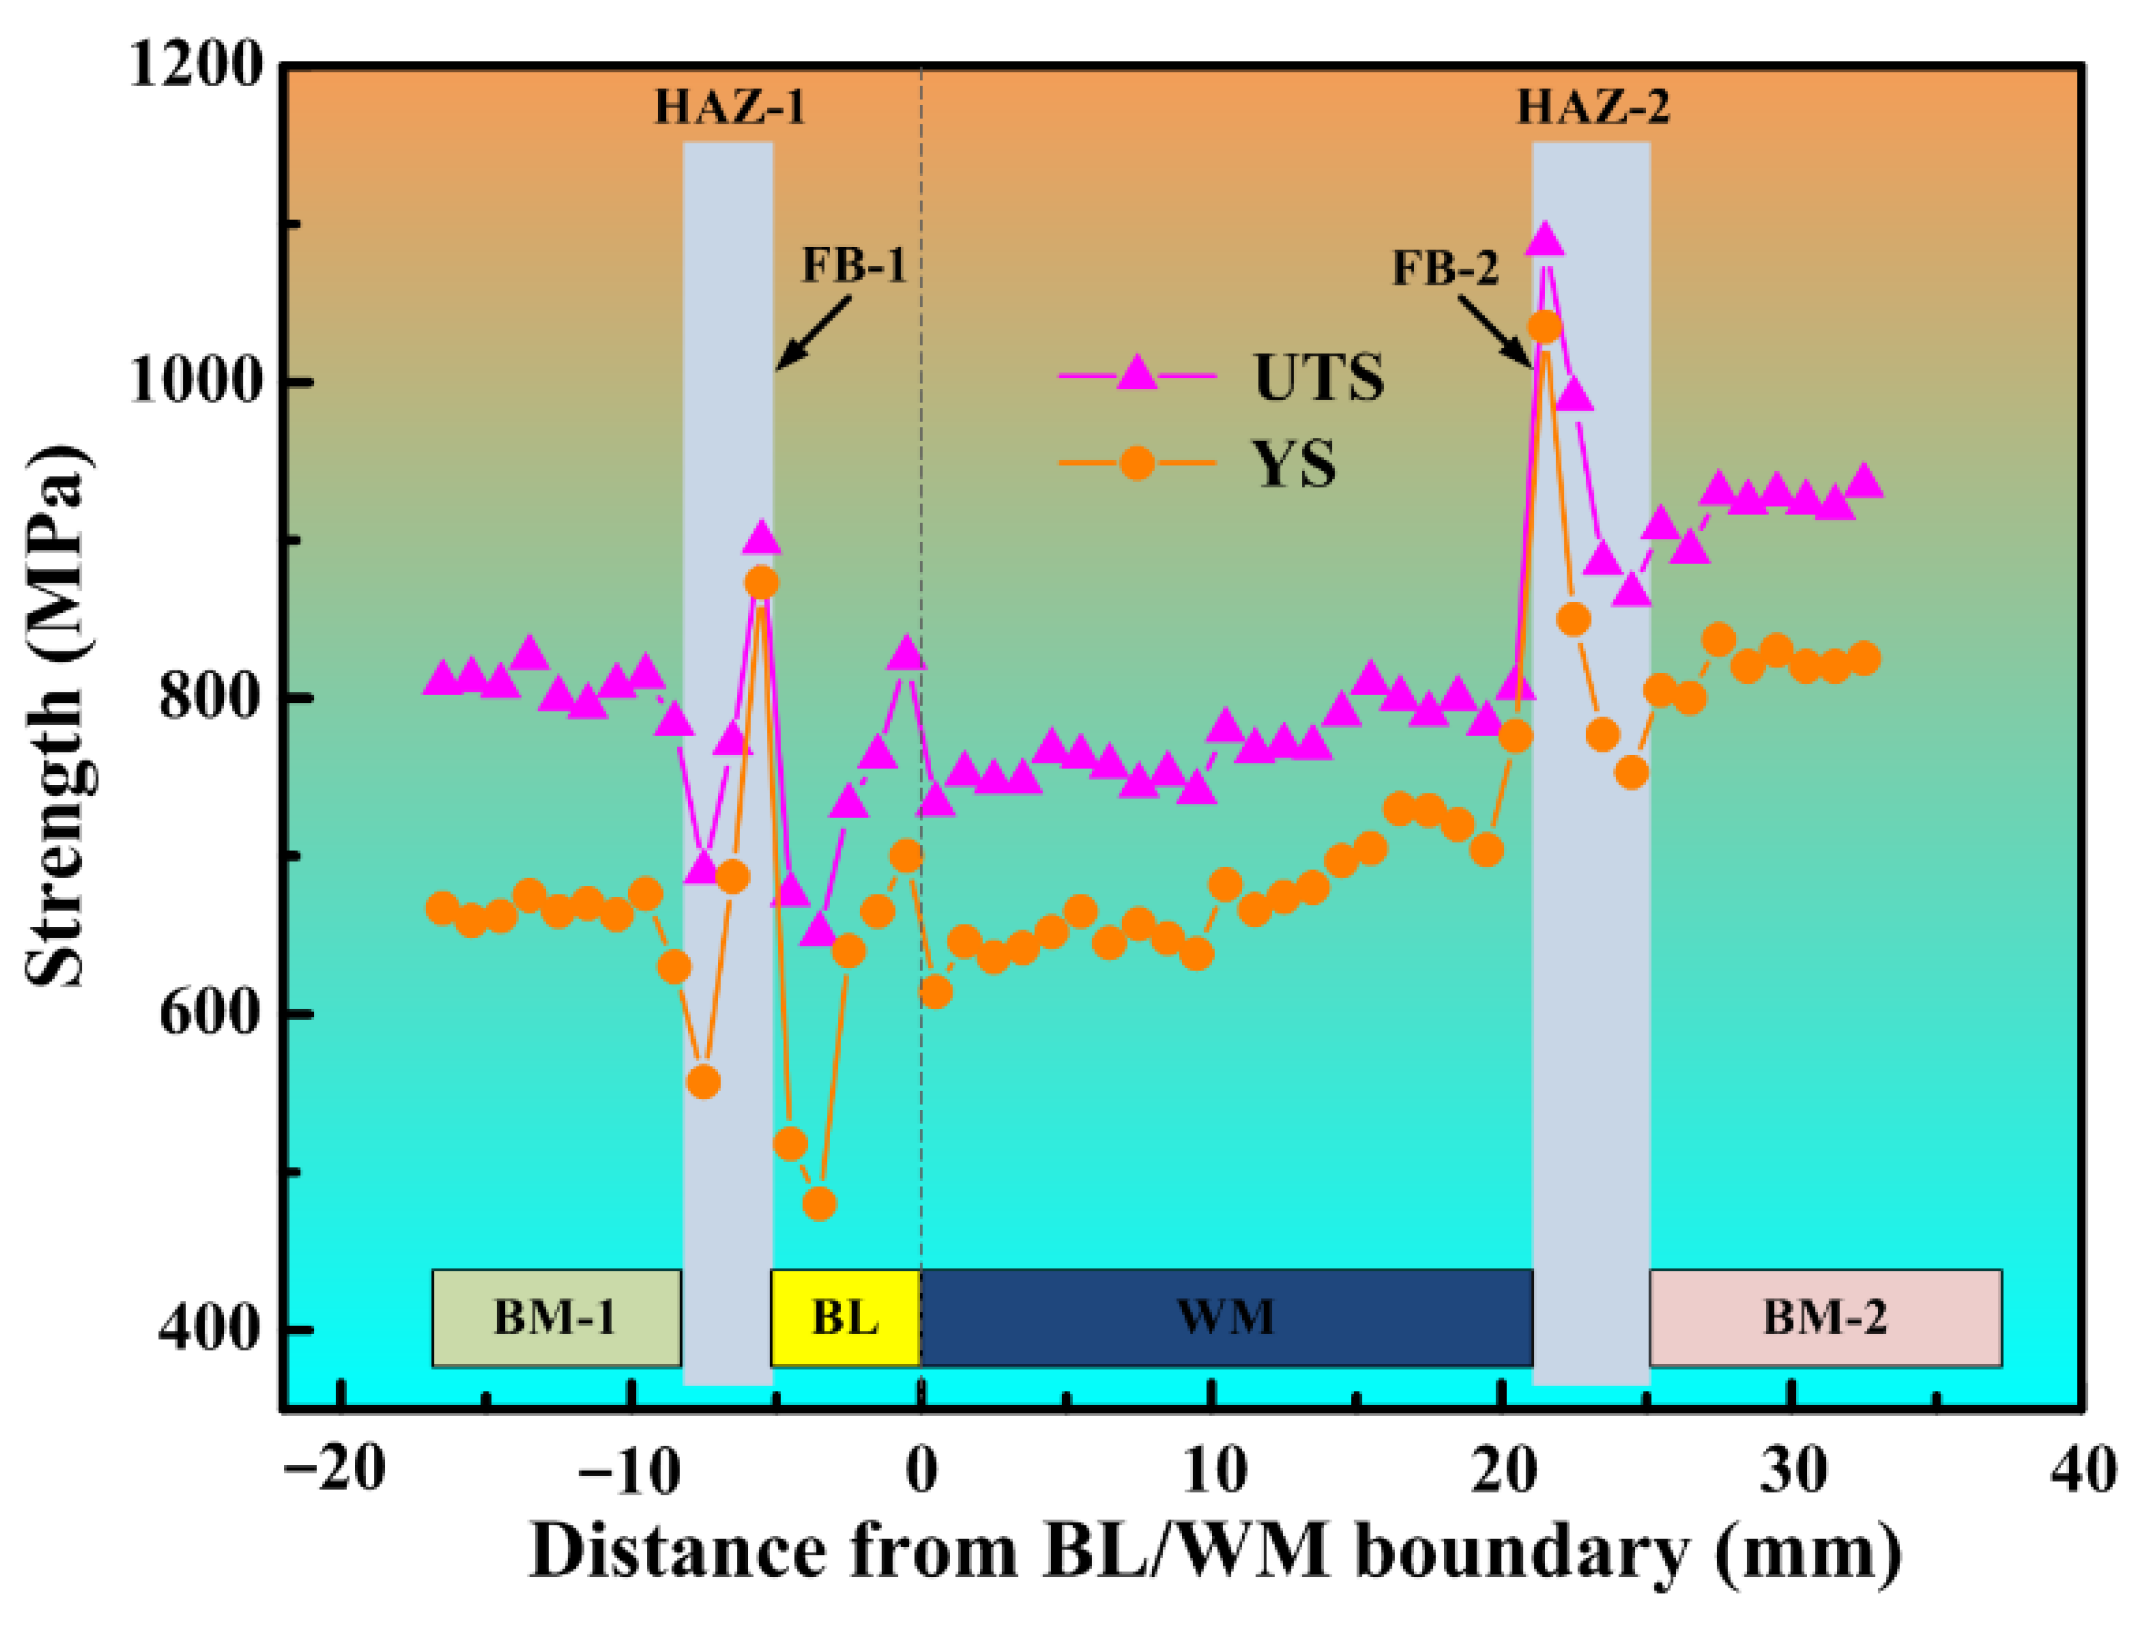
  • Inhomogeneous fracture toughness is related to the strength mismatch of the DMWJ. Accurate micro-region mechanical properties contribute to the integrity evaluation of fracture toughness of DMWJs.

Author Contributions

Data curation, Y.G.; formal analysis, W.W.; funding acquisition, W.W., Y.L. and Z.L.; supervision, Y.G.; writing—original draft, W.W.; writing—review and editing, W.W. All authors have read and agreed to the published version of the manuscript.

Funding

This work is supported by the Natural Science Foundation of Gansu Province, China (Grant Nos. 21JR7RA312 and 21JR7RA308). The Project was supported by the Young Scholars Science Foundation of Lanzhou Jiaotong University (1200061002) and the Innovation Foundation of Education Department of Gansu Province (2021A-038).

Institutional Review Board Statement

Not applicable.

Informed Consent Statement

Not applicable.

Data Availability Statement

Not applicable.

Conflicts of Interest

The authors declare no conflict of interest.

References

  1. Sun, Y.-J.; Liu, X.-Q.; Hu, L.-S.; Tang, X.-Y. Online life estimation for steam turbine rotor. J. Loss Prev. Process Ind. 2013, 26, 272–279. [Google Scholar] [CrossRef]
  2. Liu, X.G.; Meng, D.N.; Wang, Y.H.; Chen, H.; Jin, M. Influences of high-temperature diffusion on the homogenization and high-temperature fracture behavior of 30Cr1Mo1V. J. Mater. Eng. Perform. 2014, 24, 1079–1085. [Google Scholar] [CrossRef]
  3. Magoshi, R.; Tanaka, Y.; Nakano, T.; Konishi, T.; Nishimoto, S.; Shige, T.; Kadoya, Y. Development of welded rotors for high-temperature steam turbines. In Proceedings of the ASME 2005 Power Conference, Chicago, IL, USA, 5–7 April 2005; pp. 617–623. [Google Scholar]
  4. Shige, T.; Magoshi, R.; Itou, S.; Ichimura, T.; Kondou, Y. Development of large-capacity, highly efficient welded rotor for steam turbines. Tech. Rev. 2001, 38, 6–11. [Google Scholar]
  5. Yurioka, N.; Horii, Y. Recent developments in repair welding technologies in Japan. Sci. Technol. Weld. Join. 2013, 11, 255–264. [Google Scholar] [CrossRef]
  6. Sorrentino, S. Welding technologies for ultra-supercritical power plant materials. Weld. Consum. Res. Dev. 2017, 9, 247–319. [Google Scholar]
  7. Tan, L.; Zhang, L.; Zhang, J.; Zhuang, D. Effect of geometric construction on residual stress distribution in designing a nuclear rotor joined by multipass narrow gap welding. Fusion Eng. Des. 2014, 89, 456–465. [Google Scholar] [CrossRef]
  8. Zhang, C.; Lu, P.; Hu, X. Residual stress and softening in welded high-strength low-alloy steel with a buffering layer. J. Mater. Processing Technol. 2014, 214, 229–237. [Google Scholar] [CrossRef]
  9. Zhang, C.; Lu, P.; Hu, X.; Song, X. Effect of buffer layer and notch location on fatigue behavior in welded high-strength low-alloy. J. Mater. Processing Technol. 2012, 212, 2091–2101. [Google Scholar] [CrossRef]
  10. Celin, R.; Tehovnik, F. Degradation on of a Ni-Cr-Fe alloy in a pressurised-water power plant. Mater Technol 2011, 45, 151–157. [Google Scholar]
  11. Farley, S. An Overview of Non Destructive Inspection Services in Nuclear Power Plants. In Proceedings of the International Conference Nuclear Energy for New Europe, Portoraz, Slovenia, 6−9 September 2004. [Google Scholar]
  12. Rathod, D.W.; Singh, P.K.; Pandey, S.; Aravindan, S. Effect of buffer-layered buttering on microstructure and mechanical properties of dissimilar metal weld joints for nuclear plant application. Mater. Sci. Eng. A 2016, 666, 100–113. [Google Scholar] [CrossRef]
  13. Wang, H.; Wang, G.; Xuan, F.; Tu, S. Fracture mechanism of a dissimilar metal welded joint in nuclear power plant. Eng. Fail. Anal. 2013, 28, 134–148. [Google Scholar] [CrossRef]
  14. Antunes, F.V.; Ferreira, M.S.C.; Branco, R.; Prates, P.; Gardin, C.; Sarrazin-Baudoux, C. Fatigue crack growth versus plastic CTOD in the 304L stainless steel. Eng. Fract. Mech. 2019, 214, 487–503. [Google Scholar] [CrossRef]
  15. Simonovski, I.; Oliver, M.; Bourgeois, M. J-integral fracture toughness assessment of specimens containing dissimilar metal welds. In Proceedings of the 23nd Conference on Structural Mechanics in Reactor Technology, Manchester, UK, 10–14 August 2015. [Google Scholar]
  16. Gao, W.; Chen, K.; Guo, X.; Zhang, L. Fracture toughness of type 316LN stainless steel welded joints. Mater. Sci. Eng. A 2017, 685, 107–114. [Google Scholar] [CrossRef]
  17. Yang, J.; Wang, G.Z.; Xuan, F.Z.; Tu, S.T.; Liu, C.J. An experimental investigation of in-plane constraint effect on local fracture resistance of a dissimilar metal welded joint. Mater. Des. 2014, 53, 611–619. [Google Scholar] [CrossRef]
  18. Li, J.; Zhang, C.; Jiang, B.; Zhou, L.; Liu, Y. Effect of large-size M23C6-type carbides on the low-temperature toughness of martensitic heat-resistant steels. J. Alloy. Compd. 2016, 685, 248–257. [Google Scholar] [CrossRef]
  19. Zheng, Y.; Wang, F.; Li, C.; Li, Y.; Cheng, J.; Cao, R. Effect of Microstructure and Precipitates on Mechanical Properties of Cr–Mo–V Alloy Steel with Different Austenitizing Temperatures. ISIJ Int. 2017, 58, 1126–1135. [Google Scholar] [CrossRef] [Green Version]
  20. Samal, M.K.; Seidenfuss, M.; Roos, E.; Balani, K. Investigation of failure behavior of ferritic–austenitic type of dissimilar steel welded joints. Eng. Fail. Anal. 2011, 18, 999–1008. [Google Scholar] [CrossRef]
  21. Shen, M.H.H.; Akanda, S.R.; Liu, X.; Wang, P. Fracture toughness of welded joints of a steam turbine low pressure rotor. Int. J. Damage Mech. 2014, 24, 828–839. [Google Scholar] [CrossRef]
  22. Guo, Q.; Lu, F.; Liu, X.; Yang, R.; Cui, H.; Gao, Y. Correlation of microstructure and fracture toughness of advanced 9Cr/CrMoV dissimilarly welded joint. Mater. Sci. Eng. A 2015, 638, 240–250. [Google Scholar] [CrossRef]
  23. Fan, K.; Wang, G.; Xuan, F.; Tu, S. Local fracture resistance behavior of interface regions in a dissimilar metal welded joint. Eng. Fract. Mech. 2015, 136, 279–291. [Google Scholar] [CrossRef]
  24. Zhu, L.; Tao, X. The study of weld strength mismatch effect on limit loads of part surface and embedded flaws in plate. Int. J. Press. Vessel. Pip. 2016, 139–140, 61–68. [Google Scholar] [CrossRef]
  25. Metallic Materials-Unified Method of Test for Determination of Quasistatic Fracture Toughness; ISO 12135, MOD; ISO International Standard: Geneva, Switzerland, 2021.
  26. Zhu, M.; Wang, D.; Xuan, F. Effect of long-term aging on microstructure and local behavior in the heat-affected zone of a Ni–Cr–Mo–V steel welded joint. Mater. Charact. 2014, 87, 45–61. [Google Scholar] [CrossRef]
  27. Hong, S.-P.; Kim, S.-I.; Ahn, T.-Y.; Hong, S.-T.; Kim, Y.-W. Effects of extended heat treatment on carbide evolution in Cr-Mo steels. Mater. Charact. 2016, 115, 8–13. [Google Scholar] [CrossRef]
  28. Kong, X.; Lan, L.; Hu, Z.; Li, B.; Sui, T. Optimization of mechanical properties of high strength bainitic steel using thermo-mechanical control and accelerated cooling process. J. Mater. Processing Technol. 2015, 217, 202–210. [Google Scholar] [CrossRef]
  29. Wen, T.; Hu, X.; Song, Y.; Yan, D.; Rong, L. Carbides and mechanical properties in a Fe–Cr–Ni–Mo high-strength steel with different V contents. Mater. Sci. Eng. A 2013, 588, 201–207. [Google Scholar] [CrossRef]
  30. Wang, W.K.; Liu, Y.; Zhang, Q.B.; Zhang, L.J.; Zhang, J.X. Microstructure and local mechanical properties of a dissimilar metal welded joint with buttering layer in steam turbine rotor. Mater. Sci. Eng. A 2019, 747, 244–254. [Google Scholar] [CrossRef]
  31. Wang, W.-K.; Liu, Y.; Guo, Y.; Xu, Z.-Z.; Zhong, J.; Zhang, J.-X. High cycle fatigue and fracture behaviors of CrMoV/NiCrMoV dissimilar rotor welded joint at 280 °C. Mater. Sci. Eng. A 2020, 786, 139473. [Google Scholar] [CrossRef]
  32. Jiang, Z.H.; Wang, P.; Li, D.Z.; Li, Y.Y. The evolutions of microstructure and mechanical properties of 2.25Cr-1Mo-0.25V steel with different initial microstructures during tempering. Mater. Sci. Eng. A 2017, 699, 165–175. [Google Scholar] [CrossRef]
  33. Moitra, A.; Parameswaran, P.; Sreenivasan, P.R.; Mannan, S.L. A toughness study of the weld heat-affected zone of a 9Cr-1Mo steel. Mater. Charact. 2002, 48, 55–61. [Google Scholar] [CrossRef]
  34. Hong, S.; Lee, J.; Lee, B.-J.; Kim, H.S.; Kim, S.-K.; Chin, K.-G.; Lee, S. Effects of intergranular carbide precipitation on delayed fracture behavior in three TWinning Induced Plasticity (TWIP) steels. Mater. Sci. Eng. A 2013, 587, 85–99. [Google Scholar] [CrossRef]
  35. Baker, B.W.; McNelley, T.R.; Brewer, L.N. Grain size and particle dispersion effects on the tensile behavior of friction stir welded MA956 oxide dispersion strengthened steel from low to elevated temperatures. Mater. Sci. Eng. A 2014, 589, 217–227. [Google Scholar] [CrossRef] [Green Version]
  36. Wang, H.T.; Wang, G.Z.; Xuan, F.Z.; Liu, C.J.; Tu, S.T. Local mechanical properties of a dissimilar metal welded joint in nuclear power systems. Mater. Sci. Eng. A 2013, 568, 108–117. [Google Scholar] [CrossRef]
  37. Wang, W.; Dong, Z.; Xu, Z.; Zhu, B.; Zhang, X.; Zhong, J.; Zhang, J. Local strain hardening behavior in a dissimilar metal welded joint with buttering layer of ultra-supercritical turbine rotor. Mater. Sci. Eng. A 2020, 785, 139379. [Google Scholar] [CrossRef]
  38. Zhu, M.; Xuan, F. Correlation between microstructure, hardness and strength in HAZ of dissimilar welds of rotor steels. Mater. Sci. Eng. A 2010, 527, 4035–4042. [Google Scholar] [CrossRef]
  39. Li, H.; Wei, J.; Yang, S.; Liu, Y. The relationship between fracture toughness and tensile property in high-strength steels. Eng. Fail. Anal. 2021, 131, 105854. [Google Scholar] [CrossRef]
  40. Wang, H.; Wang, G.; Xuan, F.; Tu, S. An experimental investigation of local fracture resistance and crack growth paths in a dissimilar metal welded joint. Mater. Des. 2013, 44, 179–189. [Google Scholar] [CrossRef]
  41. Zhang, M.; Shi, Y.; Zhang, X. Influence of strength mis-matching on crack driving force and failure assessment curve of weldment. Int. J. Press Ves. Pip. 1997, 70, 33–41. [Google Scholar]
Figure 1. Welding structure, sampling method, and specimen size. (a) is welding structure and sampling method, (b) is specimen size
Coatings 12 00174 g001
Figure 2. Macro morphology and initial crack location in DMWJ.
Coatings 12 00174 g002
Figure 3. Force-displacement curves of six regions.
Coatings 12 00174 g003
Figure 4. δ-R curves of five regions (a) and local enlarged image (b).
Coatings 12 00174 g004
Figure 5. Macroscopic fracture surface. (a) Unstable propagation observed with BM-1. (b) Stable propagation observed with HAZ-1, BL, WM, HAZ-2, and BM-2.
Coatings 12 00174 g005
Figure 6. (af) Fracture surfaces in different regions of DMWJ.
Coatings 12 00174 g006
Figure 7. Microstructures of BM-1 and HAZ-1 obtained by OM and SEM. (a) Overall micrograph of HAZ-1. (b) OM micrograph of BM-1. (c) OM micrograph of FGZ in HAZ-1. (d) SEM micrograph of BM-1. (e) SEM micrograph of FGZ in HAZ-1.
Coatings 12 00174 g007
Figure 8. TEM analysis of BM-1. (a) Bright-field image. (b) Carbide in (a) analyzed by SAEDP.
Coatings 12 00174 g008
Figure 9. Microstructures of BL and WM obtained by OM and SEM. (a) OM micrograph of BL. (b) OM micrograph of WM. (c) SEM micrograph of BL. (d) SEM micrograph of WM.
Coatings 12 00174 g009
Figure 10. TEM analysis of BL and WM. (a) Bright-field image of BL. (b) Bright-field image of WM. (c) Coarse spherical carbide. (d) Carbide in (c) analyzed by SAEDP.
Coatings 12 00174 g010
Figure 11. Microstructures of BM-2 and HAZ-2 obtained by OM and SEM. (a) Overall micrograph of HAZ-2. (b) OM micrograph of BM-2. (c) OM micrograph of FGZ in HAZ-2. (d) SEM micrograph of BM-2. (e) SEM micrograph of FGZ in HAZ-2.
Coatings 12 00174 g011
Figure 12. TEM analysis of BM-2. (a) Bright-field image. (b) Carbide in (a) analyzed by SAEDP.
Coatings 12 00174 g012
Figure 13. Average grain size in different regions of the DMWJ.
Coatings 12 00174 g013
Figure 14. Average size and number of precipitated phases in different regions of the DMWJ.
Coatings 12 00174 g014
Figure 15. Strength along the DMWJ [30].
Coatings 12 00174 g015
Table 1. Chemical composition of base metals and filler wires (wt.%).
MaterialCMnNiCrMoV
30Cr1Mo1V0.25~0.360.66~1.04≤0.531.00~1.400.98~1.320.20~0.30
30Cr2Ni4MoV≤0.370.17~0.433.18~3.821.45~2.050.22~0.620.06~0.16
BL and WM wire≤0.101.30~2.252.00~2.80≤0.080.30~0.80/
Table 2. Mechanical properties of base and deposited metals.
MaterialsYield Strength
(MPa)
Ultimate Tensile Strength
(MPa)
Elongation Percentage (%)Charpy Impact Energy
/J (25 °C)
30Cr1Mo1V6377892656
30Cr2Ni4MoV83492835145
SAW wire7708633089
Table 3. The KQ values in different regions of the DMWJ.
RegionBM-1HAZ-1BLWMHAZ-2BM-2
KQ (MPa·m1/2)91.2101.883.693.5127.7103.4
Table 4. δ0.2BL values in different regions of the DMWJ.
RegionBM-1HAZ-1BLWMHAZ-2BM-2
δ0.2BL (mm)/0.4070.2140.2320.3160.250
Publisher’s Note: MDPI stays neutral with regard to jurisdictional claims in published maps and institutional affiliations.

