
Effect of Trehalose on the Physicochemical Properties of Freeze-Dried Powder of Royal Jelly of Northeastern Black Bee

Abstract
1. Introduction
2. Materials and Methods
2.1. Materials
2.2. Fabrication of Lyophilized Powder
2.3. Characterization of Compositional of Royal Jelly Powder
2.3.1. Protein
2.3.2. Total Sugars
2.3.3. Fat
2.3.4. 10-Hydroxy-2-Decanoic Acid (10-HDA)
2.3.5. Moisture
2.3.6. pH Value
2.3.7. Ash
2.3.8. Water Activity
2.4. Characterization of Royal Jelly Lyophilized Powder
2.4.1. Angle of Repose
2.4.2. Bulk Density and Tapped Density
2.5. Solubility
2.6. Hygroscopicity
2.7. Measurement of Total Flavonoid Content (TFC)
2.8. Measurement of Total Phenolic Contents (TPC)
2.9. The Free Radical Scavenging Activity Assays
2.10. Color Measurements
2.11. Particle Size
2.12. Scanning Electron Microscopy (SEM)
2.13. Differential Scanning Calorimetry (DSC)
2.14. X-ray Diffraction (XRD)
2.15. Fourier Transform Infrared Spectroscopy (FTIR)
2.16. Statistical Analysis
3. Results
3.1. Chemical Composition and Water Activity of Royal Jelly Powder
3.2. Evaluation of Royal Jelly Freeze-Dried Powder
3.2.1. Angle of Repose
3.2.2. Bulk Density and Tapped Density
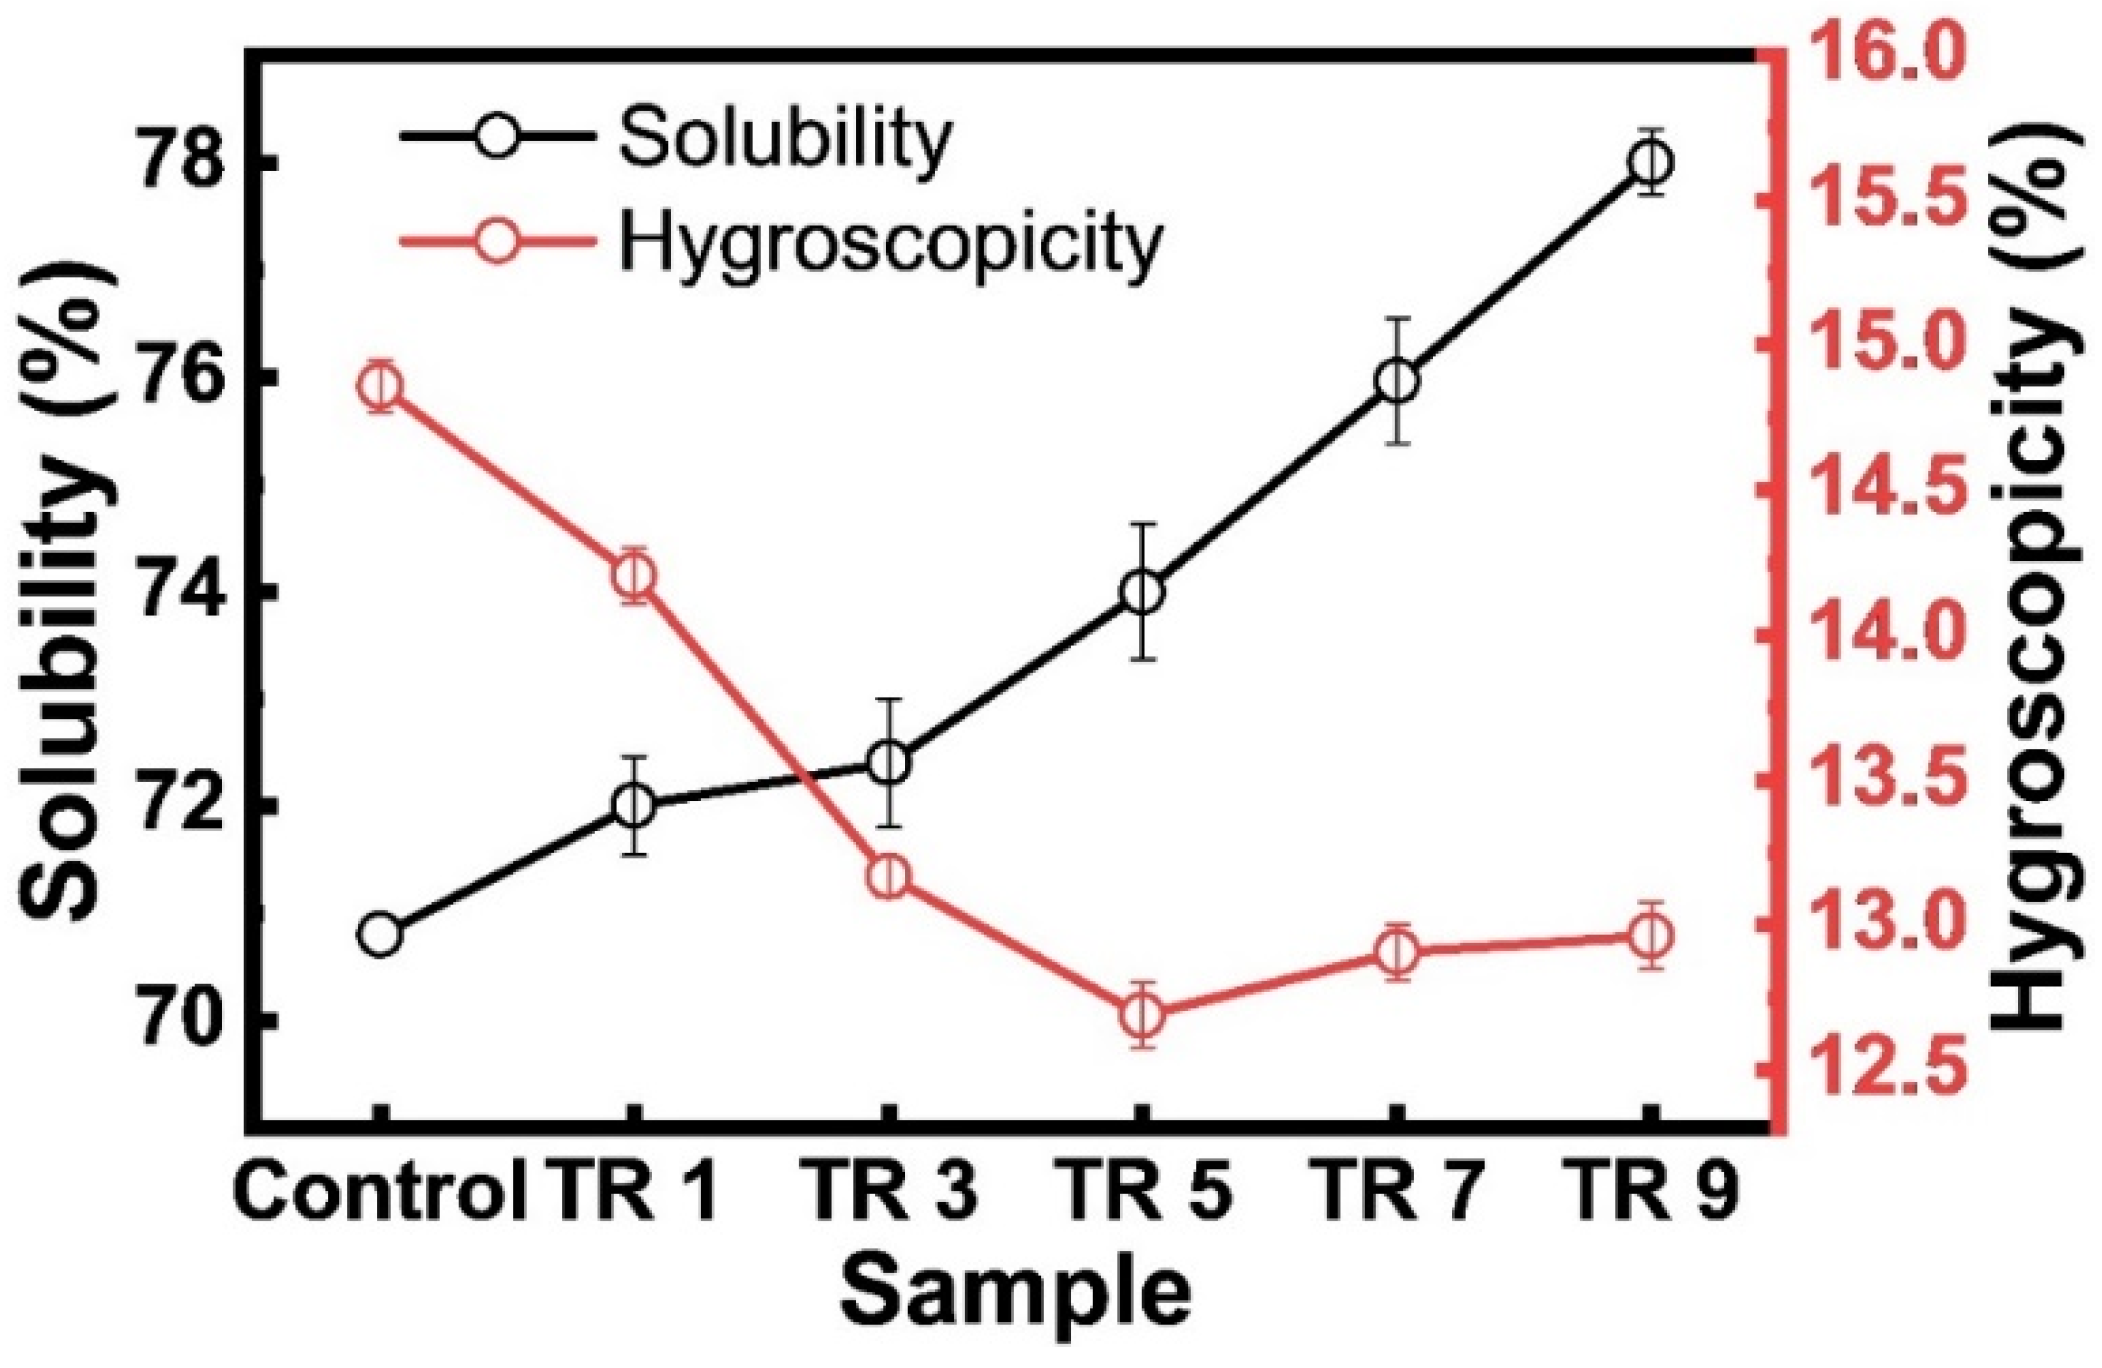
3.3. Solubility
3.4. Hygroscopicity
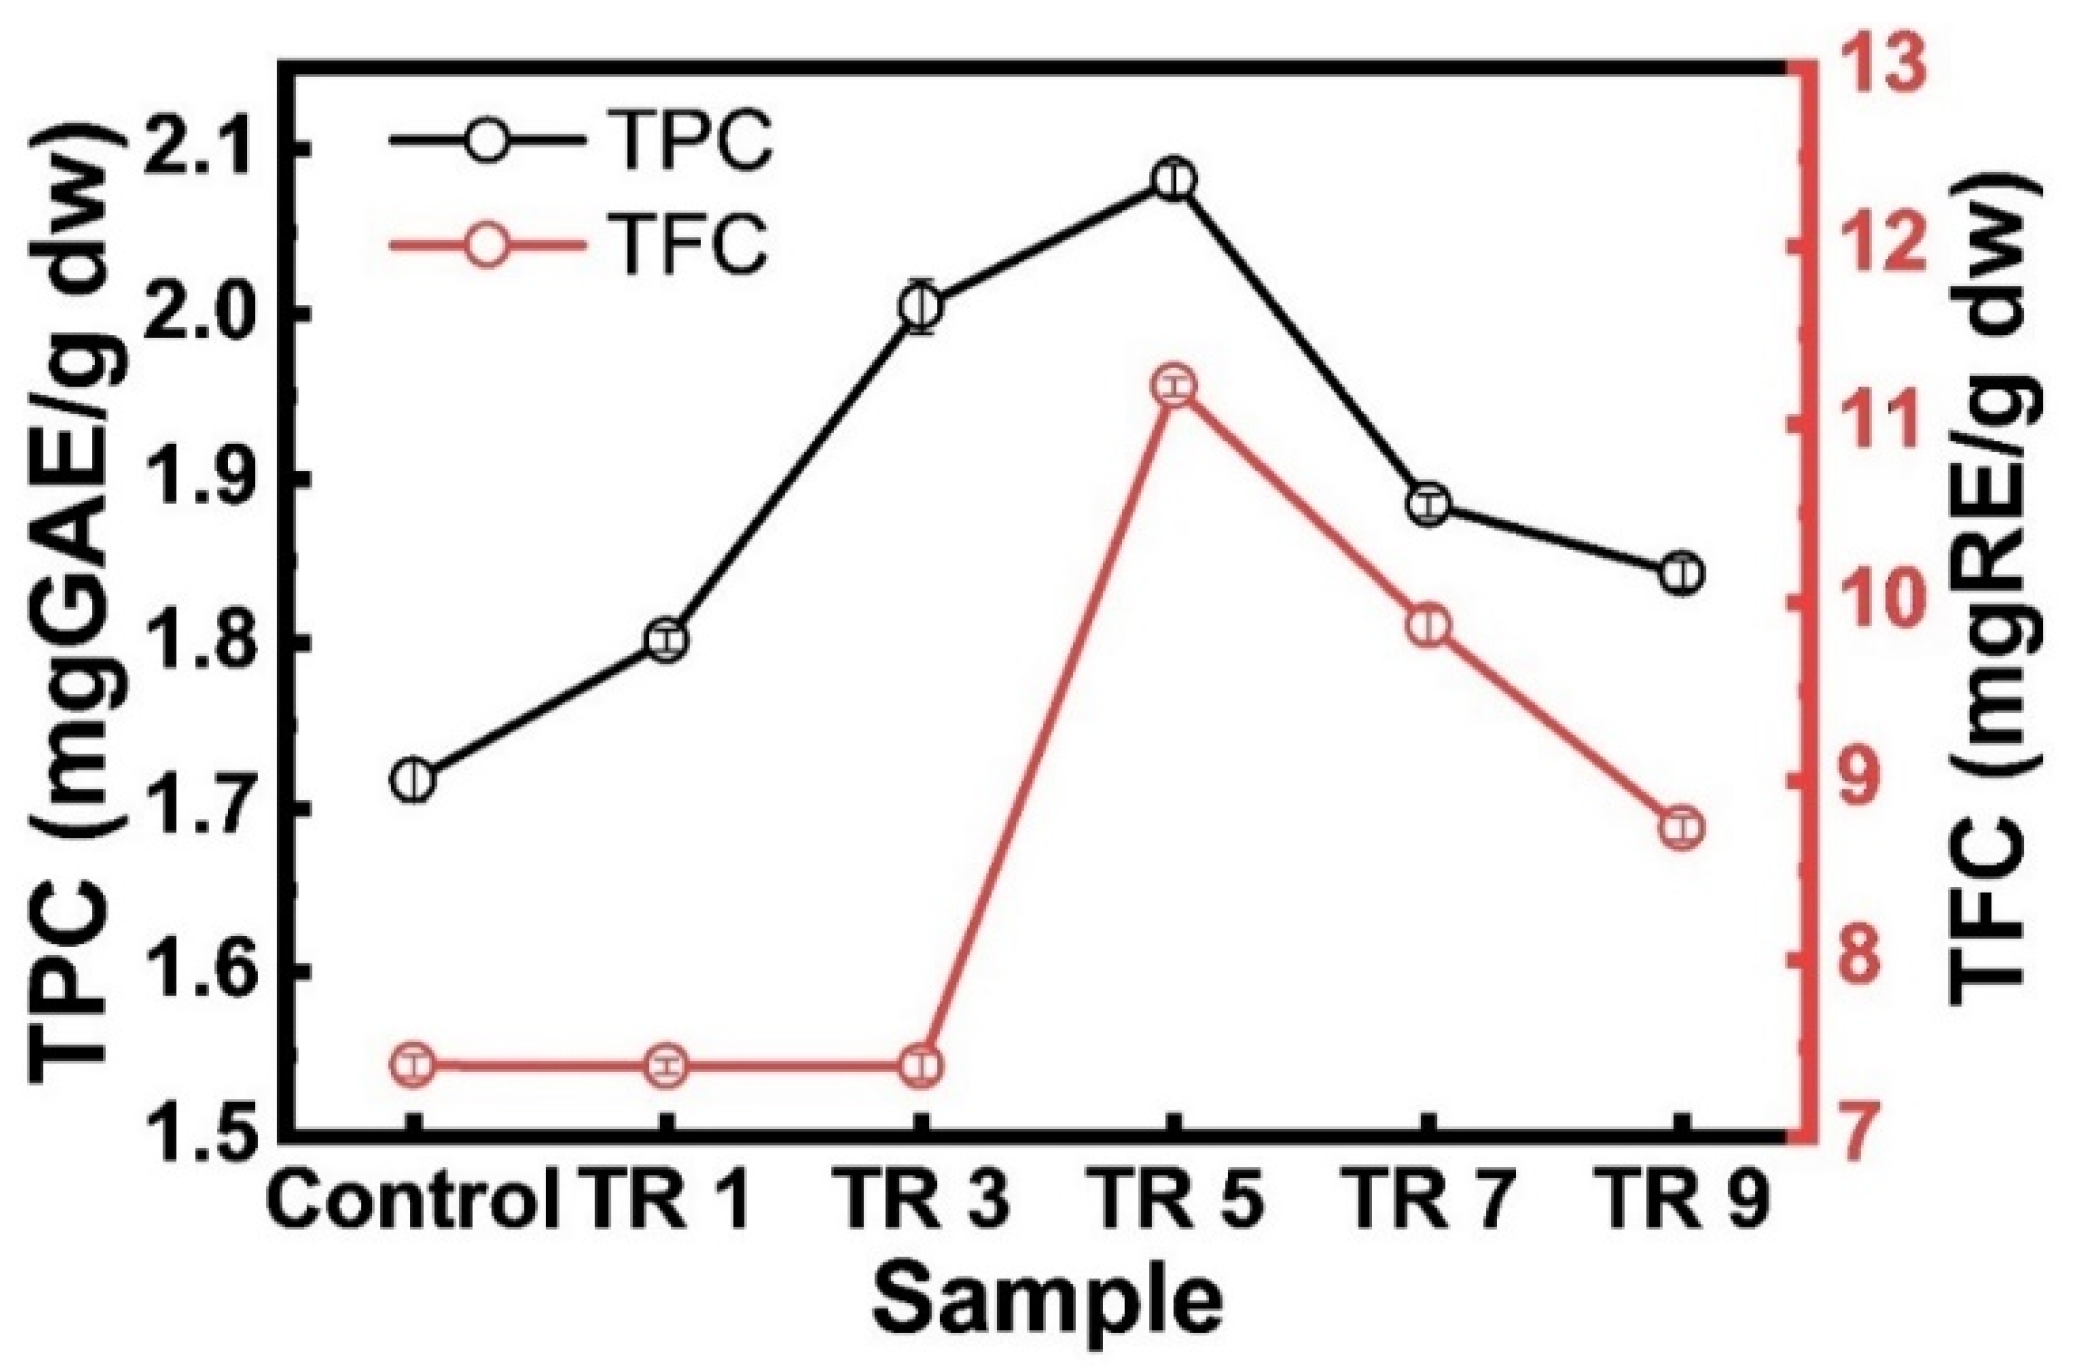
3.5. Total Flavonoids and Total Phenols Contents (TFC and TPC)
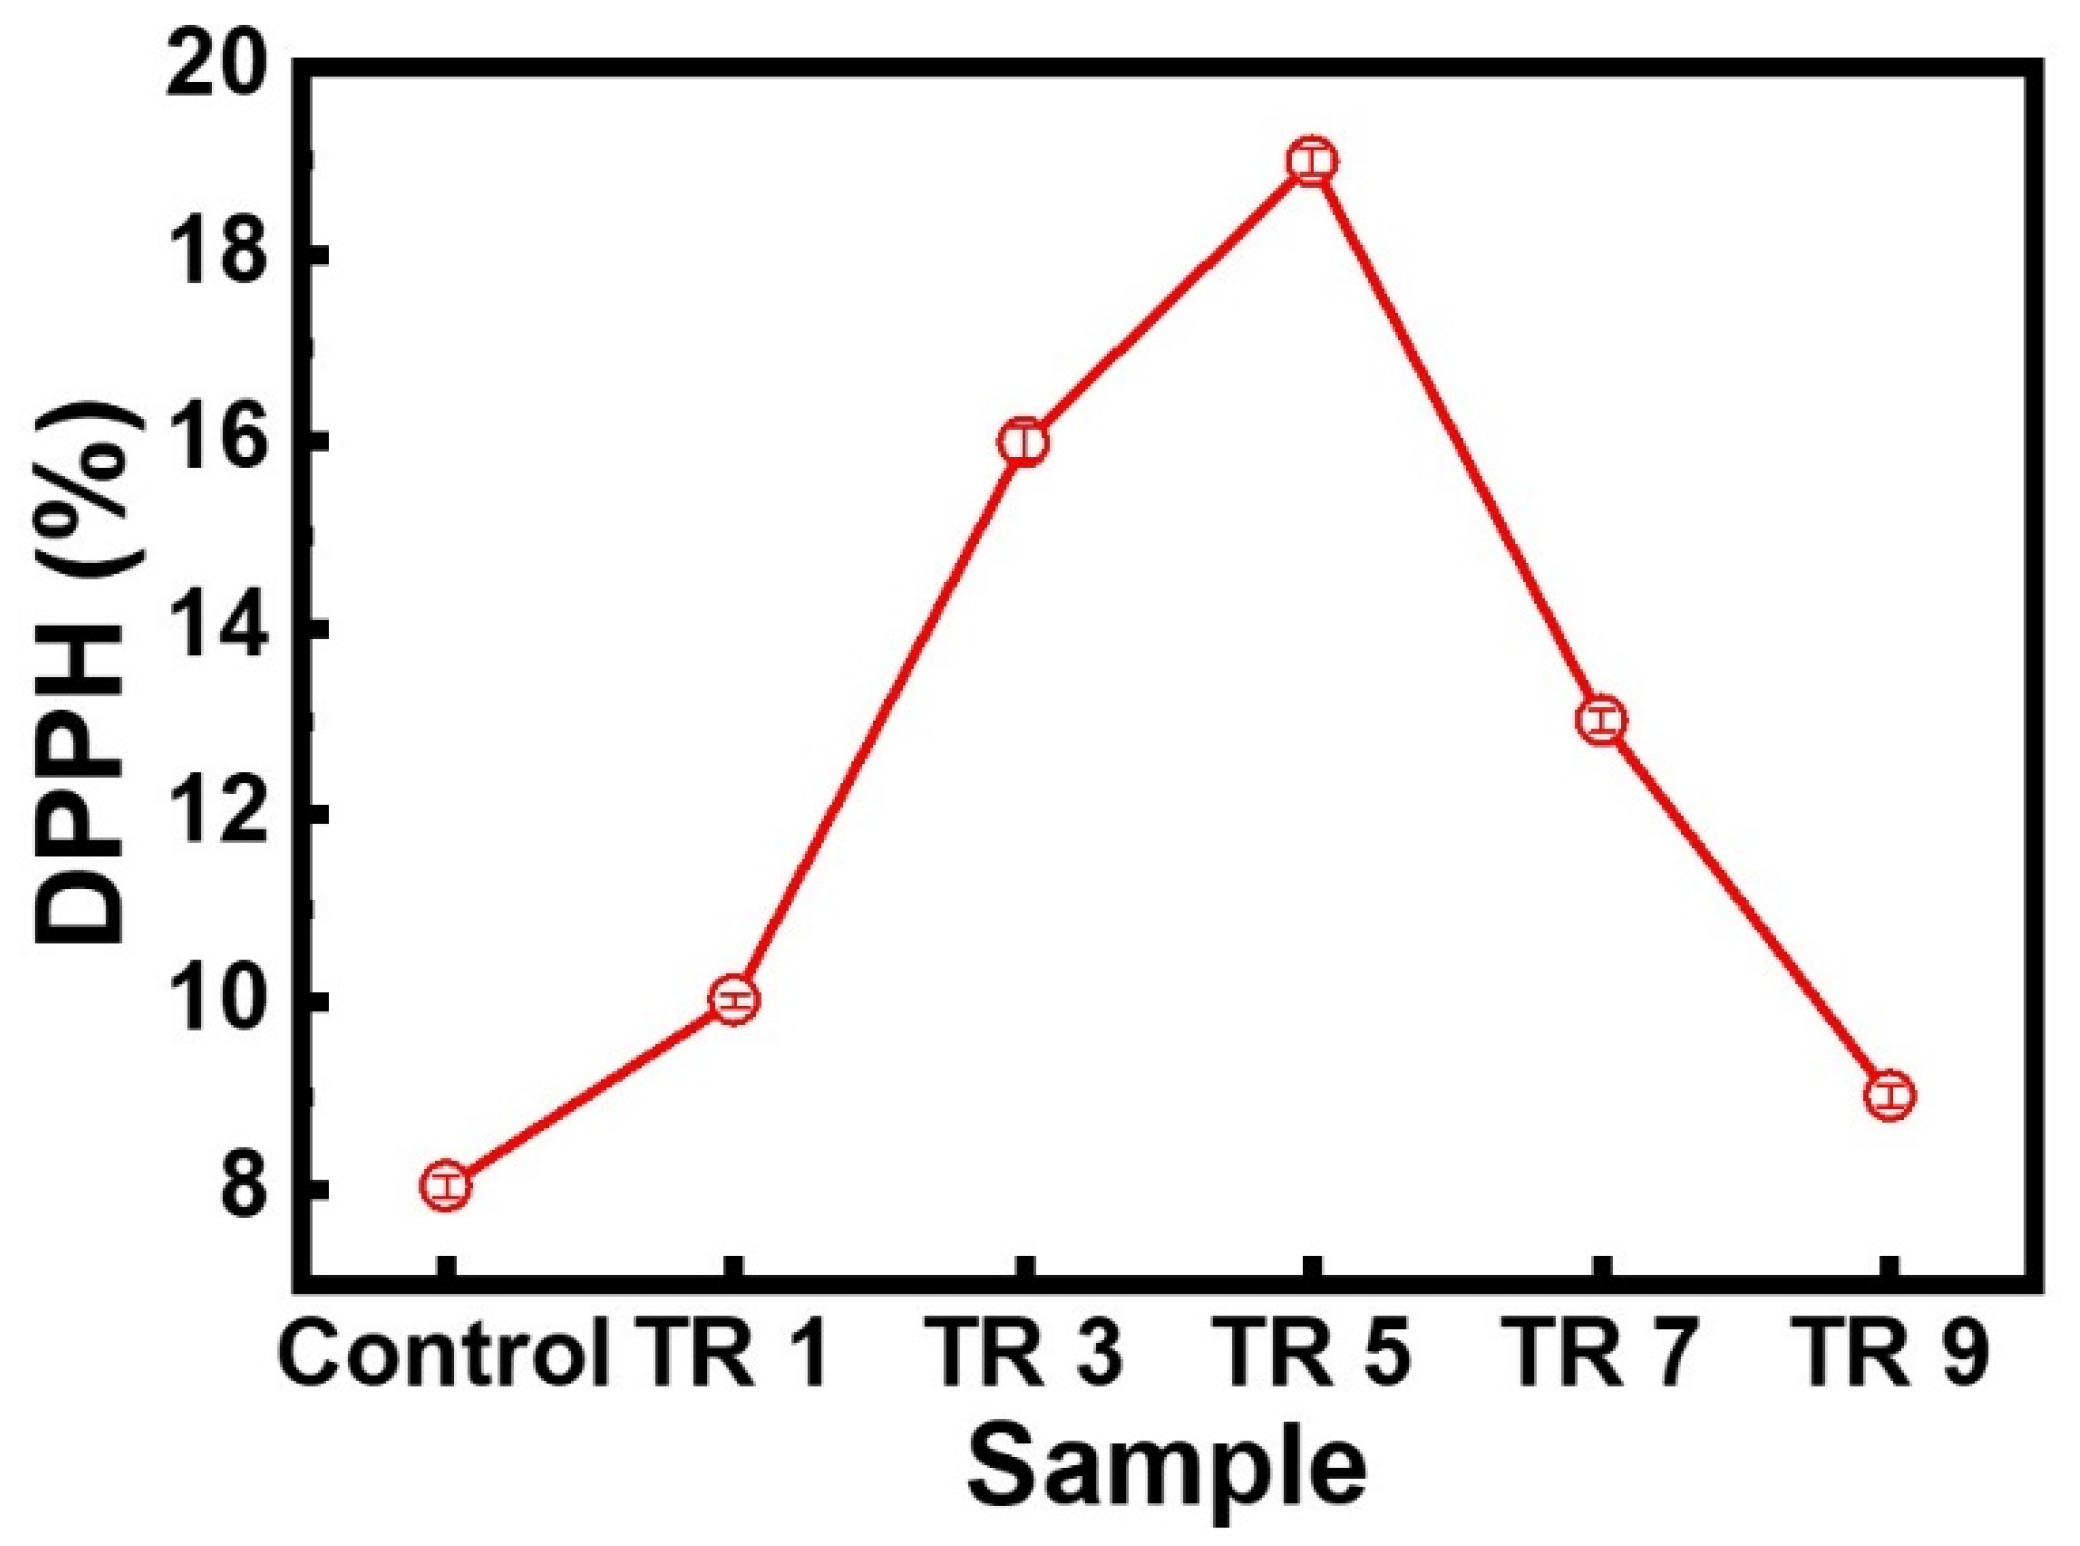
3.6. The Free Radical Scavenging Activity of Lyophilized Powder
3.7. Color
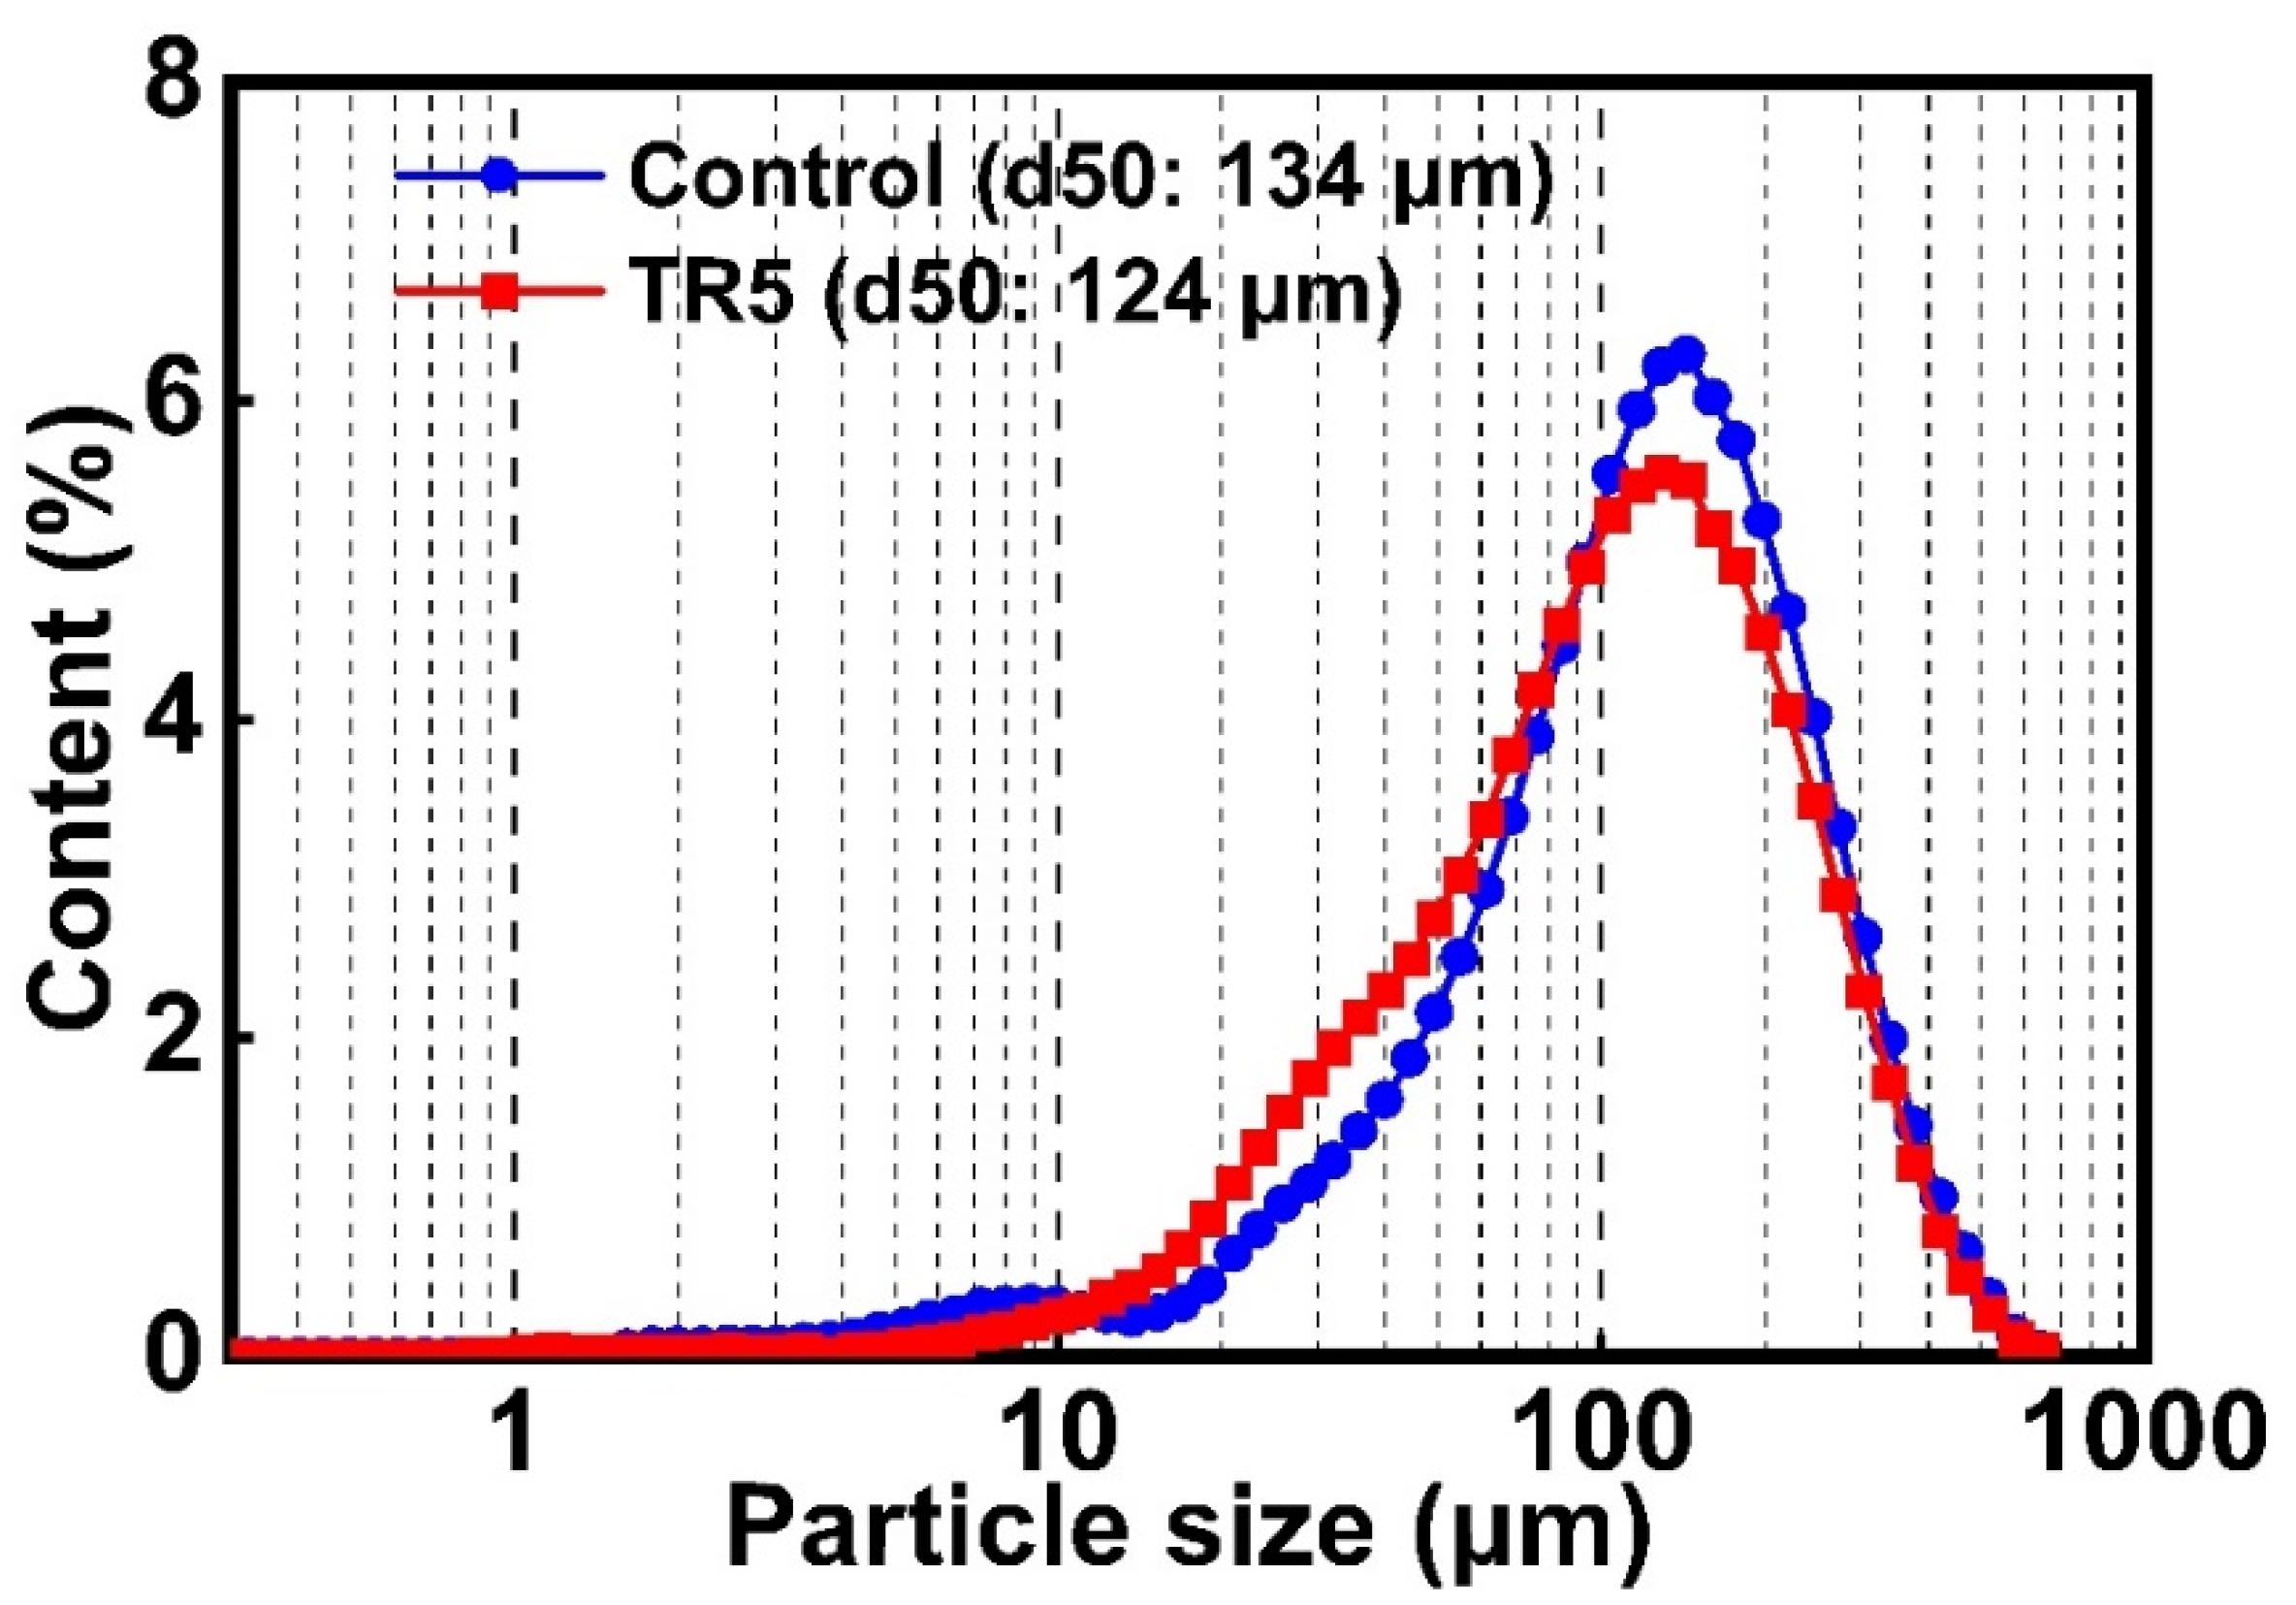
3.8. Particle Size
3.9. SEM
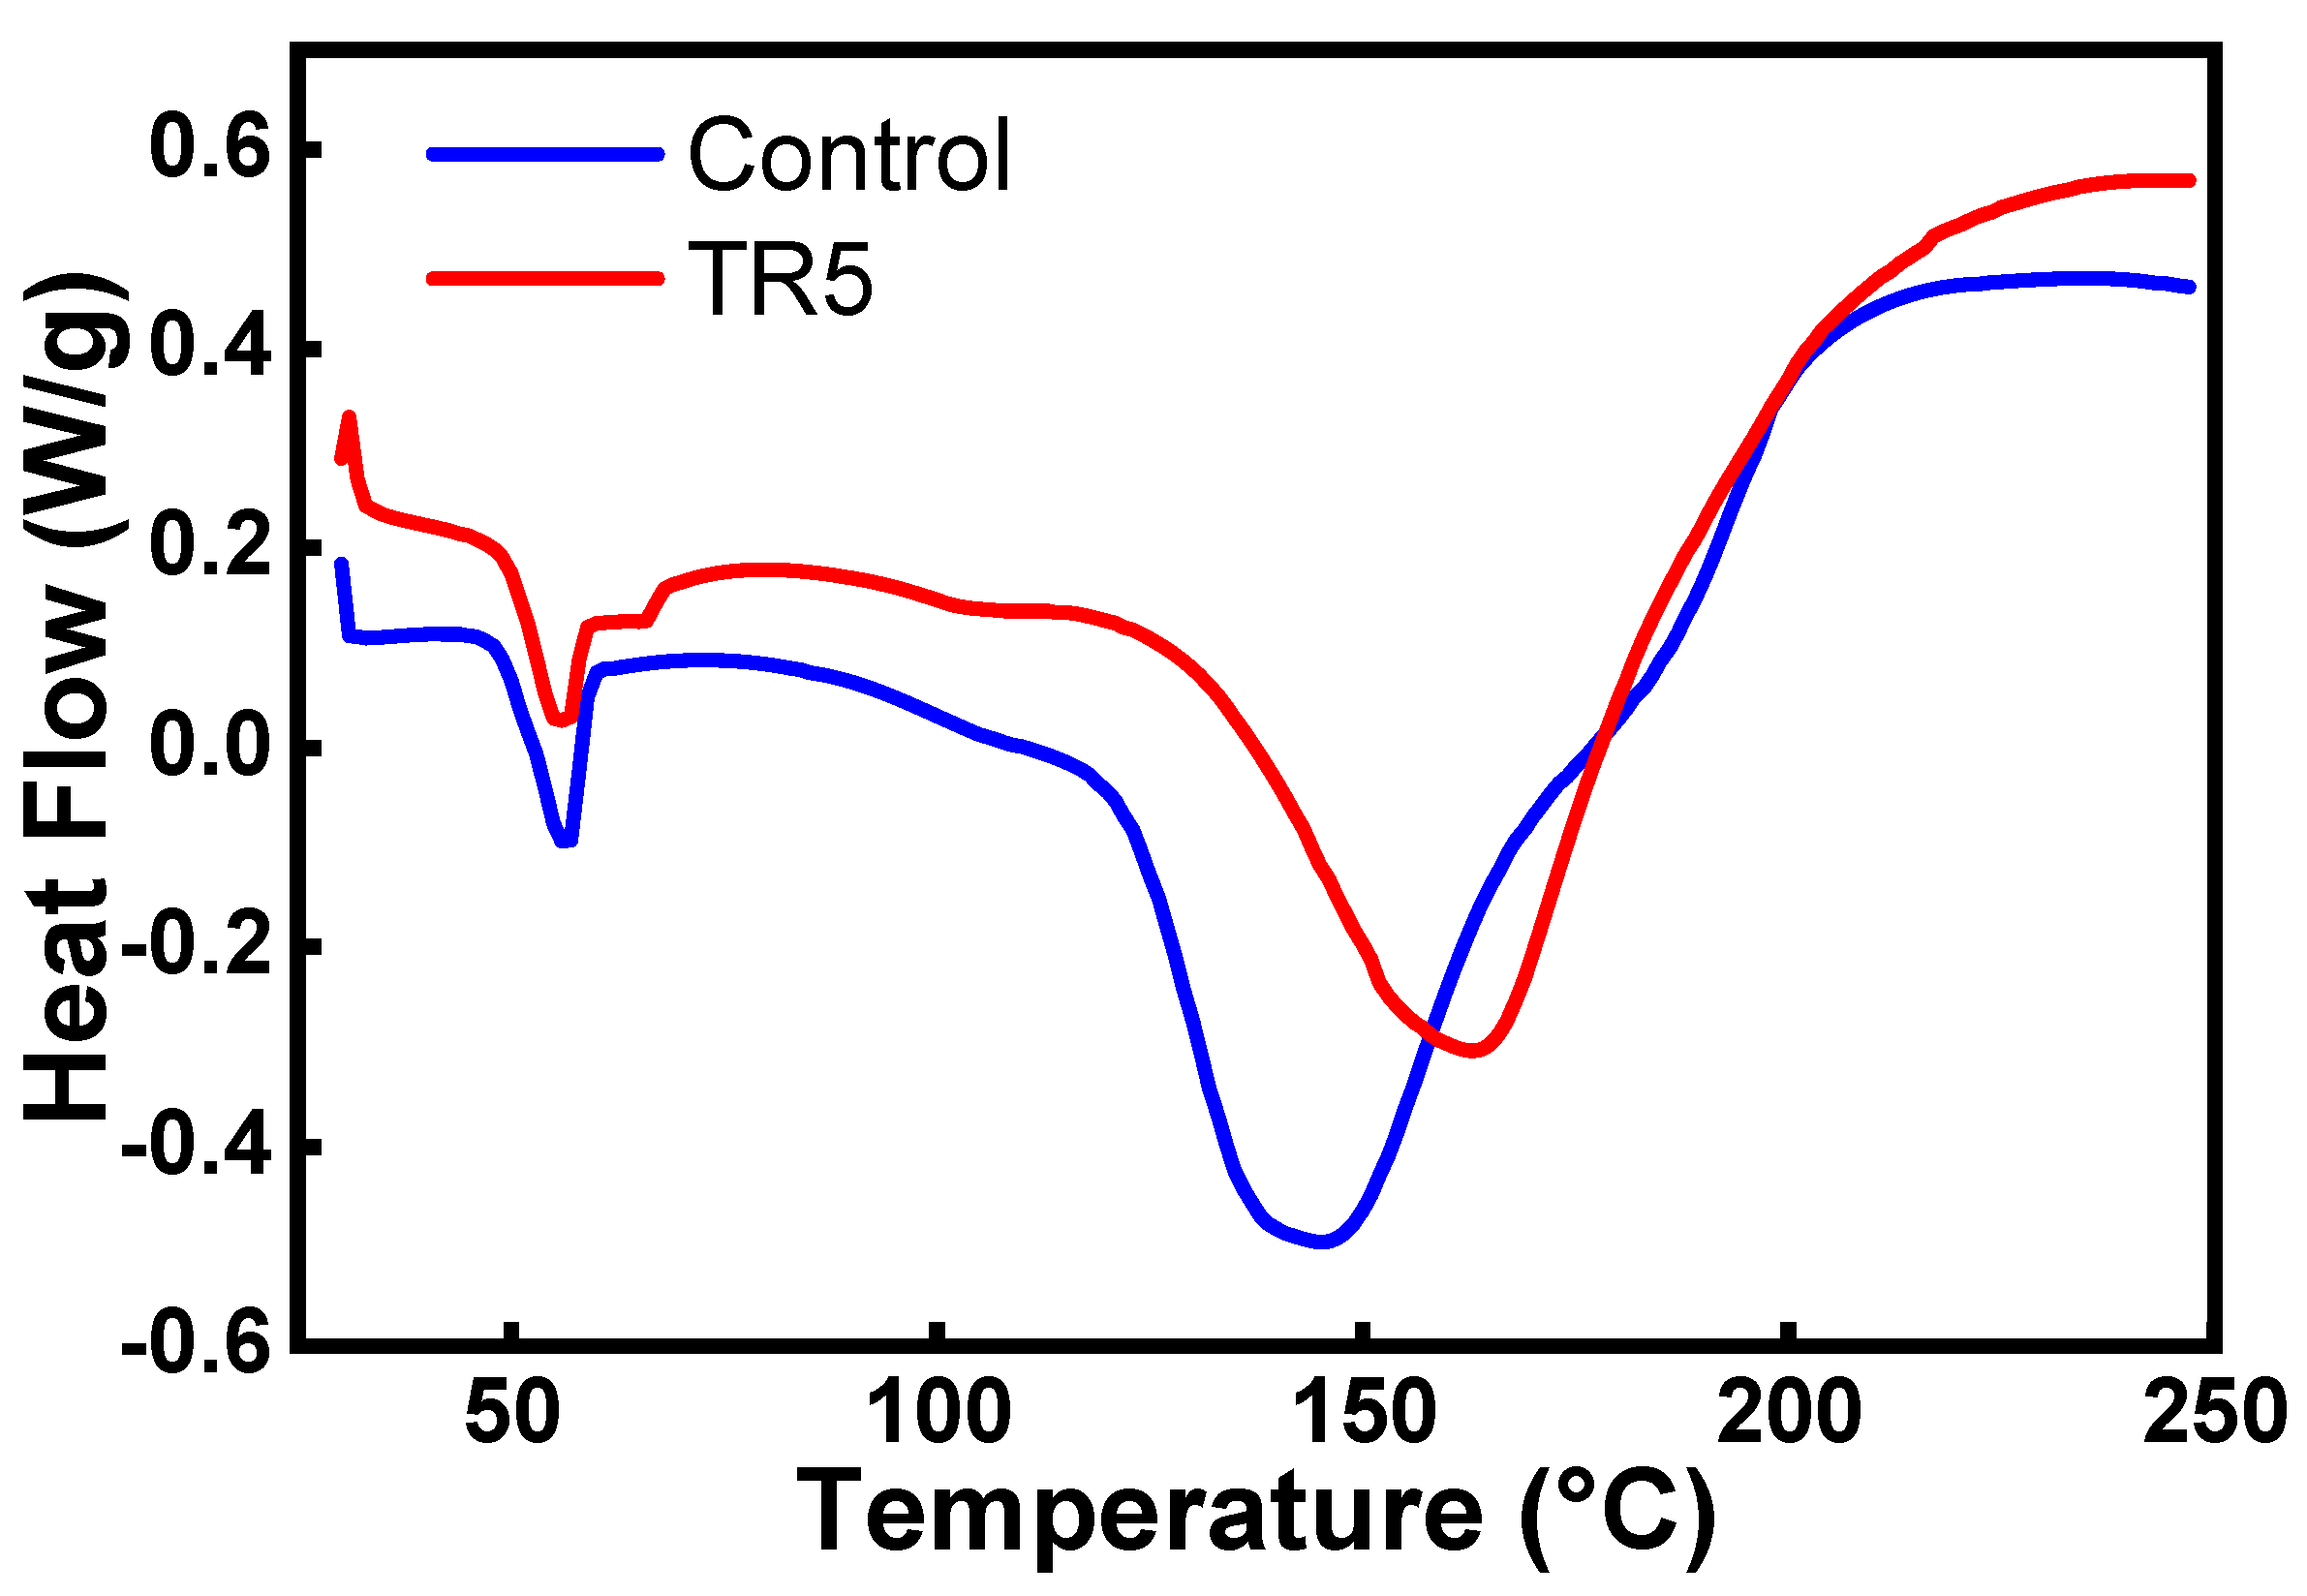
3.10. DSC
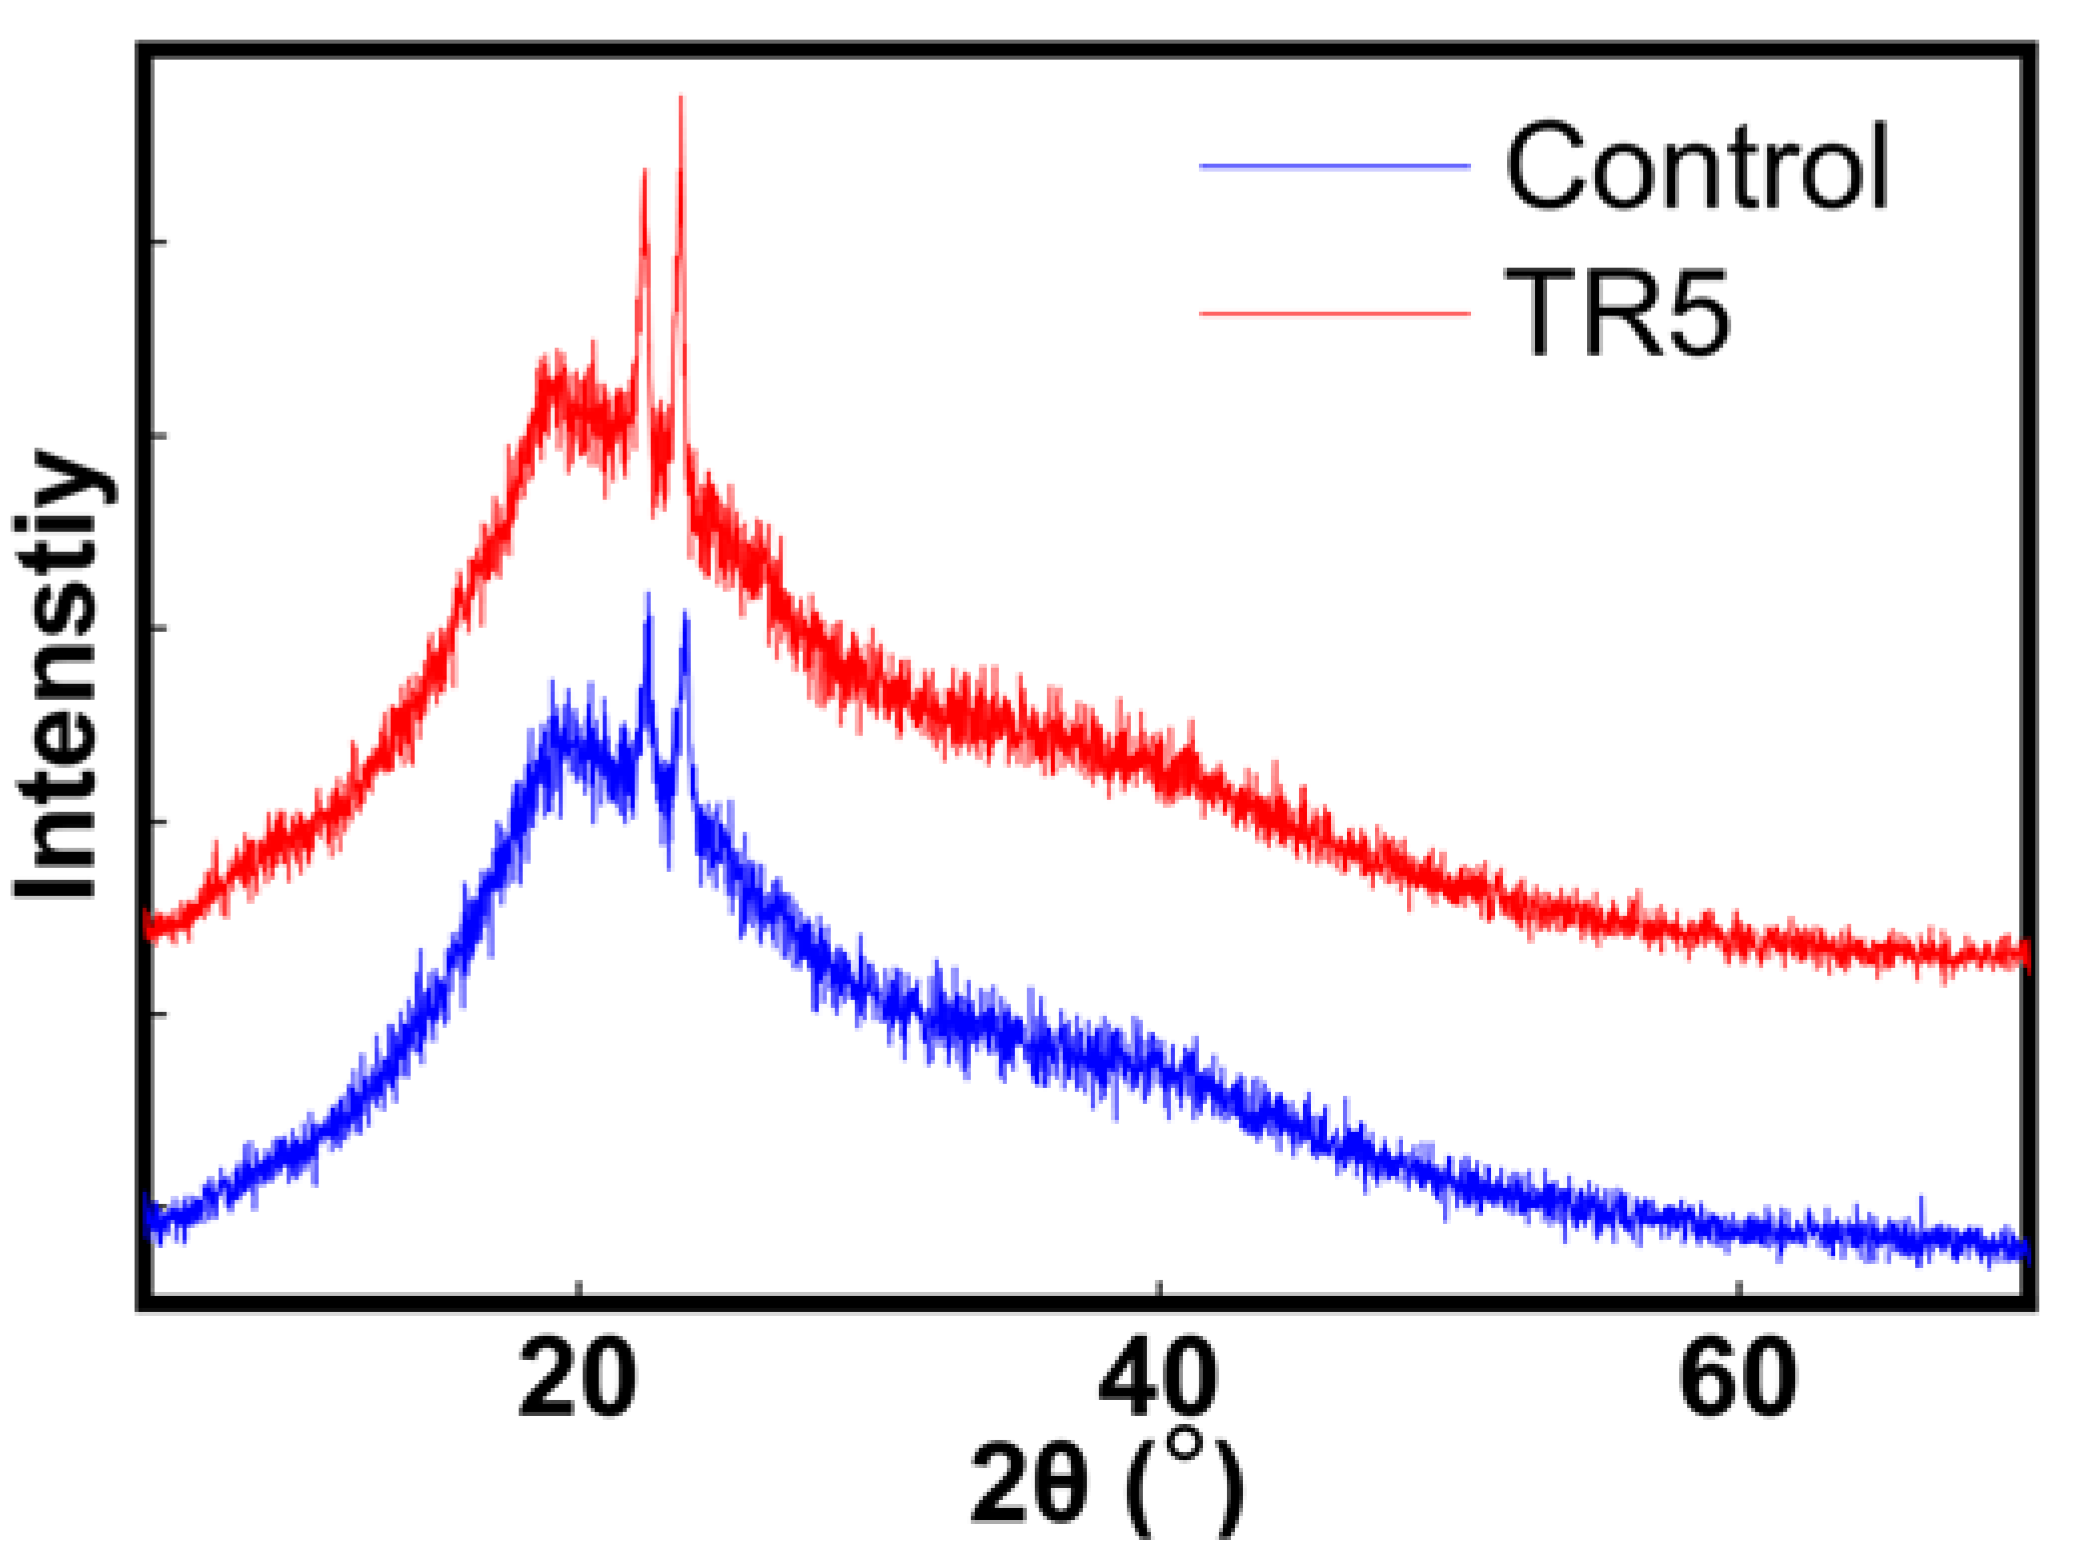
3.11. XRD
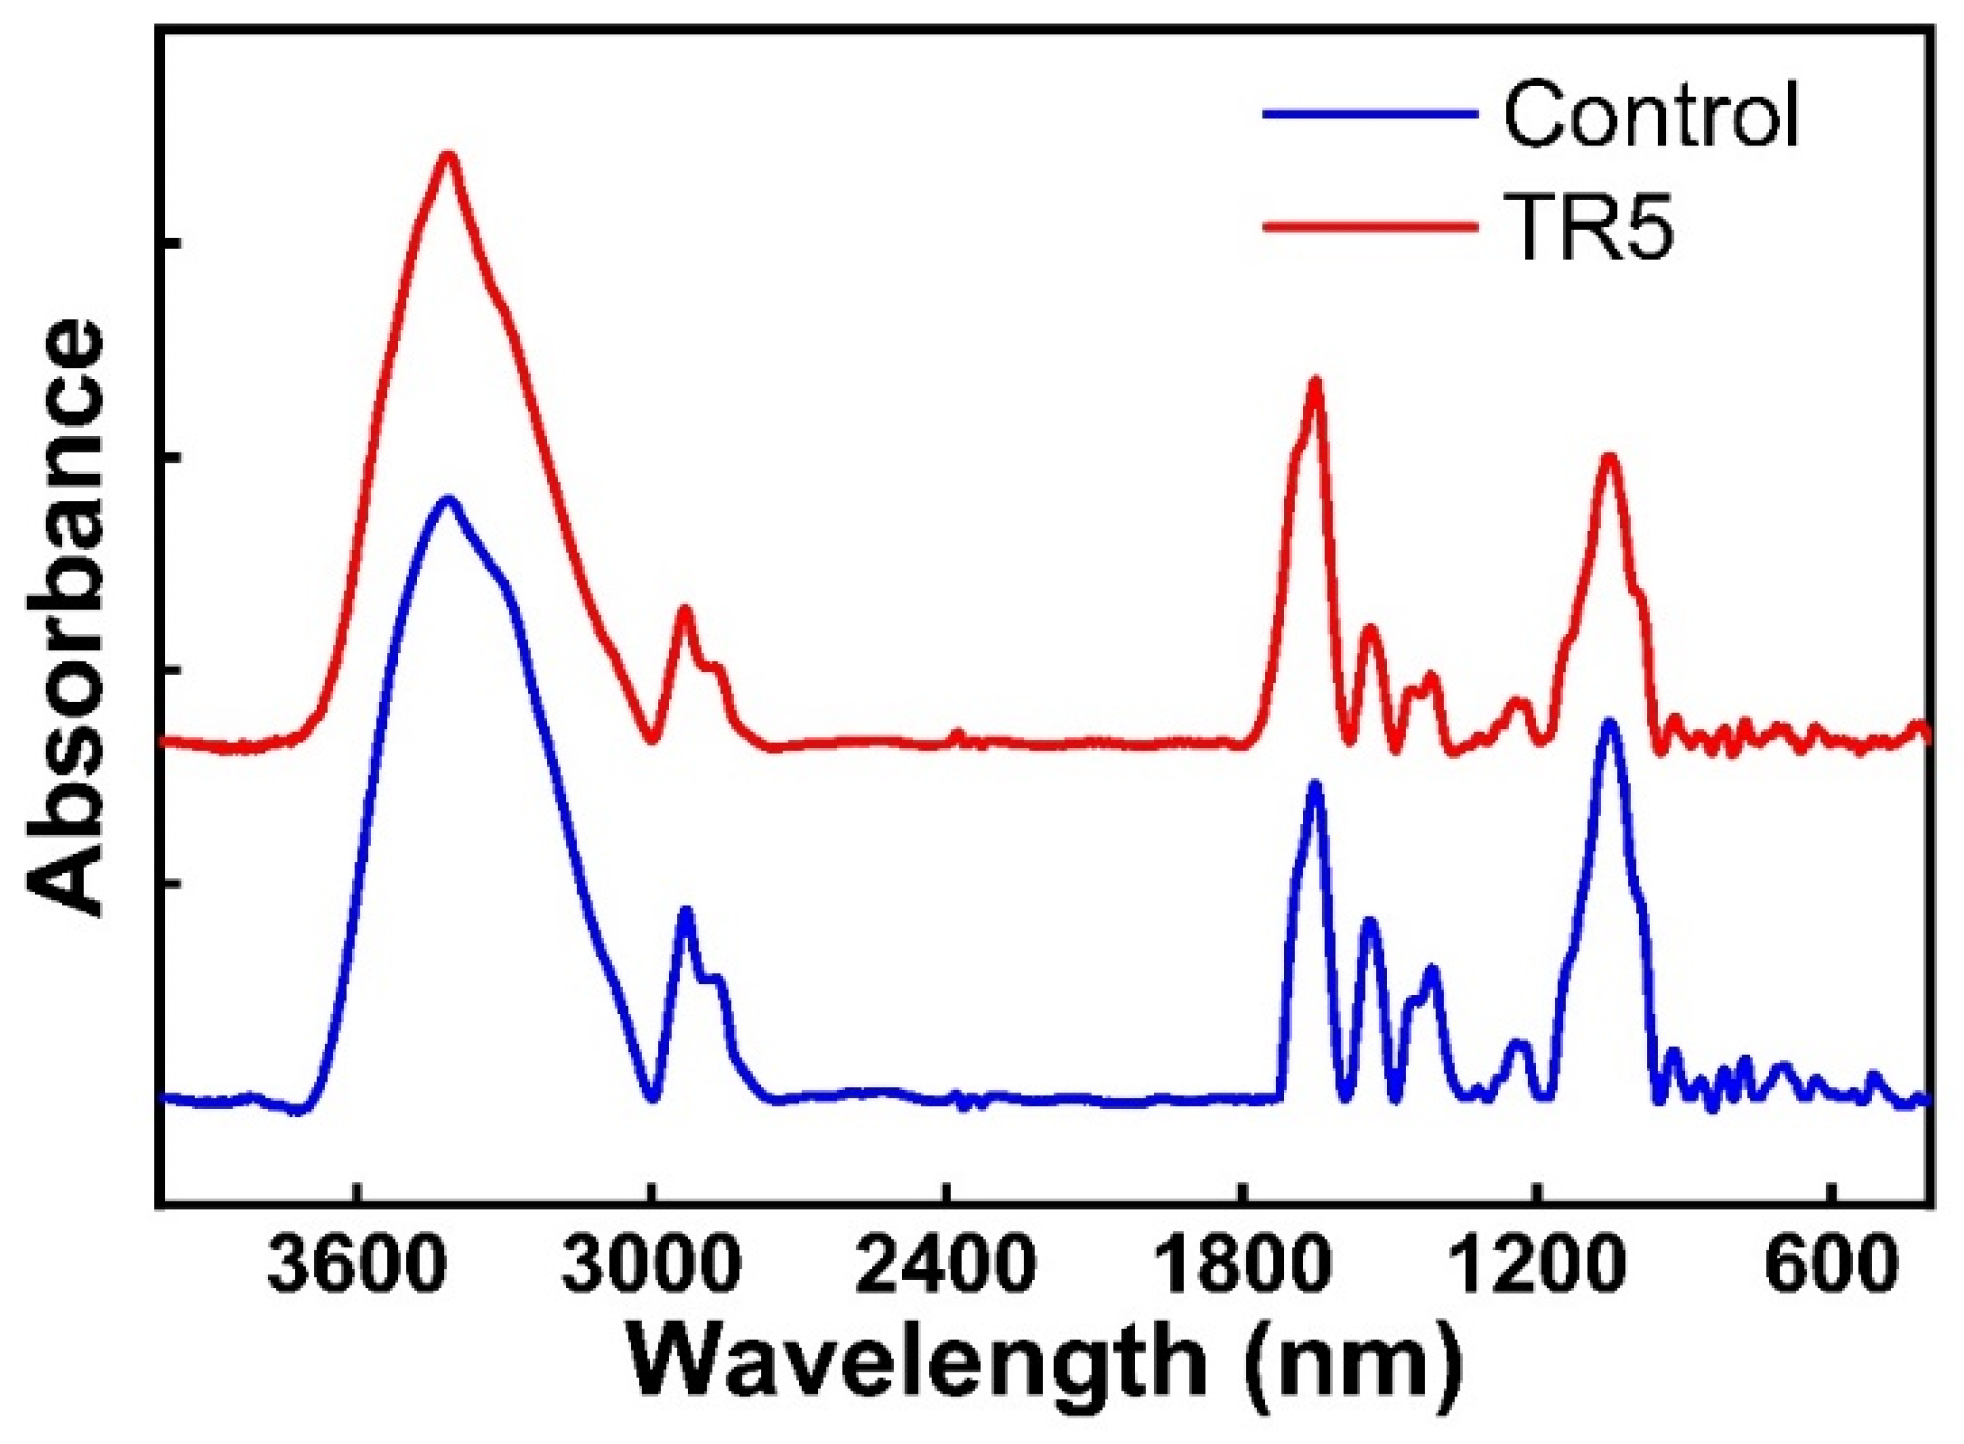
3.12. FTIR
4. Conclusions
Author Contributions
Funding
Institutional Review Board Statement
Informed Consent Statement
Data Availability Statement
Conflicts of Interest
References
- Ramanathan, A.; Nair, A.J.; Sugunan, V.S. A review on royal jelly proteins and peptides. J. Funct. Foods 2018, 44, 255–264. [Google Scholar] [CrossRef]
- Guo, J.; Wang, Z.; Chen, Y. Active components and biological functions of royal jelly. J. Funct. Foods 2021, 82, 104514. [Google Scholar] [CrossRef]
- Duong, H.A.; Vu, M.T.; Nguyen, T.D. Determination of 10-hydroxy-2-decenoic acid and free amino acids in royal jelly supplements with purpose-made capillary electrophoresis coupled with contactless conductivity detection. J. Food. Compos. Anal. 2020, 87, 103422. [Google Scholar] [CrossRef]
- Sari, E.; Mahira, K.F.; Patel, D.N.; Chua, L.S.; Pratami, D.K.; Sahlan, M. Metabolome analysis and chemical profiling of Indonesian royal jellies as the raw material for cosmetic and bio-supplement products. Heliyon 2021, 5, e06912. [Google Scholar] [CrossRef]
- Park, M.J.; Kim, B.Y.; Deng, Y.; Park, H.G.; Choi, Y.S.; Lee, K.S.; Jin, B.R. Antioxidant capacity of major royal jelly proteins of honeybee (Apis mellifera) royal jelly. J. Asia Pac. Entomol. 2020, 2, 445–448. [Google Scholar] [CrossRef]
- Mokaya, H.O.; Njeru, L.K.; Lattorff, H.M.G. African honeybee royal jelly: Phytochemical contents, free radical scavenging activity, and physicochemical properties. Food Biosci. 2020, 37, 100733. [Google Scholar] [CrossRef]
- Zhang, L.; Qiao, Y.; Wang, C.; Liao, L.; Shi, D.; An, K.; Shi, L. Influence of high hydrostatic pressure pretreatment on properties of vacuum-freeze dried strawberry slices. Food Chem. 2020, 331, 127203. [Google Scholar] [CrossRef]
- Peters, B.H.; Staels, L.; Rantanen, J.; Molnár, F.; De Beer, T.; Lehto, V.P.; Ketolainen, J. Effects of cooling rate in microscale and pilot scale freeze-drying–variations in excipient polymorphs and protein secondary structure. Eur. J. Pharm. Sci. 2016, 95, 72–81. [Google Scholar] [CrossRef]
- Song, J.G.; Lee, S.H.; Han, H.K. Biophysical evaluation of aminoclay as an effective protectant for protein stabilization during freeze-drying and storage. Int. J. Nanomed. 2016, 11, 6609. [Google Scholar] [CrossRef]
- Tu, Z.; Zhong, B.; Wang, H. Identification of glycated sites in ovalbumin under freeze-drying processing by liquid chromatography high-resolution mass spectrometry. Food Chem. 2017, 226, 1–7. [Google Scholar] [CrossRef]
- Cicerone, M.T.; Pikal, M.J.; Qian, K.K. Stabilization of proteins in solid form. Adv. Drug Deliv. Rev. 2015, 93, 14–24. [Google Scholar] [CrossRef] [PubMed]
- Franks, F.; Hatley, R.H.M.; Friedman, H.L. The thermodynamics of protein stability: Cold destabilization as a general phenomenon. Biophys. Chem. 1988, 3, 307–315. [Google Scholar] [CrossRef]
- Allison, S.D.; Dong, A.; Carpenter, J.F. Counteracting effects of thiocyanate and sucrose on chymotrypsinogen secondary structure and aggregation during freezing, drying, and rehydration. Biophys. J. 1996, 4, 2022–2032. [Google Scholar] [CrossRef]
- Barbiroli, A.; Marengo, M.; Fessas, D.; Ragg, E.; Renzetti, S.; Bonomi, F.; Iametti, S. Stabilization of beta-lactoglobulin by polyols and sugars against temperature-induced denaturation involves diverse and specific structural regions of the protein. Food Chem. 2017, 234, 155–162. [Google Scholar] [CrossRef] [PubMed]
- Wu, H.Y.; Sun, C.B.; Liu, N. Effects of different cryoprotectants on microemulsion freeze-drying. Innov. Food Sci. Emerg. Technol. 2019, 54, 28–33. [Google Scholar] [CrossRef]
- Ohtake, S.; Wang, Y.J. Trehalose: Current use and future applications. J. Pharm. Sci. 2011, 6, 2020–2053. [Google Scholar] [CrossRef] [PubMed]
- Walayat, N.; Xiong, H.; Xiong, Z. Role of cryoprotectants in surimi and factors affecting surimi gel properties: A review. Food Rev Int. 2020, 1–20. [Google Scholar] [CrossRef]
- Muhoza, B.; Xia, S.; Wang, X. The protection effect of trehalose on the multinuclear microcapsules based on gelatin and high methyl pectin coacervate during freeze-drying. Food Hydrocoll. 2020, 105, 105807. [Google Scholar] [CrossRef]
- Sakhaee, N.; Sakhaee, S.; Takallou, A.; Mobaraki, A.; Maddah, M.; Moshrefi, R. Hydrodynamic volume of trehalose and its water uptake mechanism. Biophys. Chem. 2019, 249, 106145. [Google Scholar] [CrossRef]
- Zhang, B.; Hao, G.; Cao, H.; Tang, H.; Deng, S. The cryoprotectant effect of xylooligosaccharides on denaturation of peeled shrimp (Litopenaeus vannamei) protein during frozen storage. Food Hydrocoll. 2018, 77, 228–237. [Google Scholar] [CrossRef]
- Loncaric, A.; Dugalic, K.; Mihaljevic, I.; Jakobek, L.; Pilizota, V. Effects of sugar addition on total polyphenol content and antioxidant activity of frozen and freeze-dried apple purée. J. Agric. Food Chem. 2014, 7, 1674–1682. [Google Scholar] [CrossRef] [PubMed]
- AOAC. International Official Methods of Analysis of AOAC International, 18th ed.; Association of Analytical Chemists: Arlington, VA, USA, 2006. [Google Scholar]
- Nielsen, S.S. Phenol-Sulfuric Acid Method for Total Carbohydrates; Springer: Boston, MA, USA, 2010; pp. 47–53. [Google Scholar]
- Garcia-Amoedo, L.H.; Almeida-Muradian, L.B. Determination of trans-10-hydroxy-2-decenoic acid (10-HDA) in royal jelly from São Paulo State, Brazil. LWT 2003, 23, 62–65. [Google Scholar] [CrossRef]
- Balkanska, R. Correlations of physicochemical parameters, antioxidant activity and total polyphenol content of fresh royal jelly samples. Int. J. Curr. Microbiol. Appl. Sci. 2018, 4, 3744–3750. [Google Scholar] [CrossRef]
- Thiex, N.; Novotny, L.; Crawford, A. Determination of ash in animal feed: AOAC official method 942.05 revisited. J. AOAC Int. 2012, 5, 1392–1397. [Google Scholar] [CrossRef]
- Alanazi, F.K. Utilization of date syrup as a tablet binder, comparative study. Saudi Pharm. J. 2010, 2, 81–89. [Google Scholar] [CrossRef]
- Erdem, B.G.; Kaya, S. Production and application of freeze dried biocomposite coating powders from sunflower oil and soy protein or whey protein isolates. Food Chem. 2021, 339, 127976. [Google Scholar] [CrossRef]
- Tonon, R.V.; Brabet, C.; Hubinger, M.D. Influence of process conditions on the physicochemical properties of açai (Euterpe oleraceae Mart.) powder produced by spray drying. J. Food Eng. 2008, 3, 411–418. [Google Scholar] [CrossRef]
- Liu, J.R.; Yang, Y.C.; Shi, L.S.; Peng, C.C. Antioxidant properties of royal jelly associated with larval age and time of harvest. J. Agric. Food Chem. 2008, 23, 11447–11452. [Google Scholar] [CrossRef]
- Singleton, V.L.; Orthofer, R.; Lamuela-Raventós, R.M. Analysis of total phenols and other oxidation substrates and antioxidants by means of folin-ciocalteu reagent. Method Enzymol. 1999, 299, 152–178. [Google Scholar]
- Brand-Williams, W.; Cuvelier, M.E.; Berset, C. Use of a free radical method to evaluate antioxidant activity. LWT 1995, 1, 25–30. [Google Scholar] [CrossRef]
- Butreddy, A.; Janga, K.Y.; Ajjarapu, S.; Sarabu, S.; Dudhipala, N. Instability of therapeutic proteins—An overview of stresses, stabilization mechanisms and analytical techniques involved in Lyophilized proteins. Int. J. Biol. Macromol. 2021, 167, 309–325. [Google Scholar] [CrossRef] [PubMed]
- Dissanayake, M.; Kasapis, S.; George, P.; Adhikari, B.; Palmer, M.; Meurer, B. Hydrostatic pressure effects on the structural properties of condensed whey protein/lactose systems. Food Hydrocoll. 2013, 2, 632–640. [Google Scholar] [CrossRef]
- Ding, S.; Yang, J. The effects of sugar alcohols on rheological properties, functionalities, and texture in baked products–A review. Trends Food Sci. Technol. 2021, 111, 670–679. [Google Scholar] [CrossRef]
- Allen, T. Powder Sampling and Particle Size Determination; Elsevier: Houston, TX, USA, 2003; pp. 295–358. [Google Scholar]
- Geldart, D.; Abdullah, E.C.; Hassanpour, A.; Nwoke, L.C.; Wouters, I.J.C.P. Characterization of powder flowability using measurement of angle of repose. China Particuol. 2006, 4, 104–107. [Google Scholar] [CrossRef]
- Fang, Y.; Selomulya, C.; Chen, X.D. On measurement of food powder reconstitution properties. Dry Technol. 2007, 1, 3–14. (In Chinese) [Google Scholar] [CrossRef]
- Jayasundera, M.; Adhikari, B.; Howes, T.; Aldred, P. Surface protein coverage and its implications on spray-drying of model sugar-rich foods: Solubility, powder production and characterisation. Food Chem. 2011, 4, 1003–1016. [Google Scholar] [CrossRef]
- Haque, E.; Bhandari, B.R.; Gidley, M.J.; Deeth, H.C.; Møller, S.M.; Whittaker, A.K. Protein conformational modifications and kinetics of water−protein interactions in milk protein concentrate powder upon aging: Effect on solubility. J. Agric. Food Chem. 2010, 13, 7748–7755. [Google Scholar] [CrossRef]
- Quek, S.Y.; Chok, N.K.; Swedlund, P. The physicochemical properties of spray-dried watermelon powders. Chem. Eng Process. 2007, 5, 386–392. [Google Scholar] [CrossRef]
- Tontul, I.; Topuz, A. Spray-drying of fruit and vegetable juices: Effect of drying conditions on the product yield and physical properties. Trends Food Sci. Technol. 2017, 63, 91–102. [Google Scholar] [CrossRef]
- Nurhadi, B.; Andoyo, R.; Indiarto, R. Study the properties of honey powder produced from spray drying and vacuum drying method. Food Res. Int. 2012, 3, 907. [Google Scholar]
- Ng, M.L.; Sulaiman, R. Development of beetroot (Beta vulgaris) powder using foam mat drying. LWT 2018, 88, 80–86. [Google Scholar] [CrossRef]
- Nagai, T.; Inoue, R. Preparation and the functional properties of water extract and alkaline extract of royal jelly. Food Chem. 2004, 2, 181–186. [Google Scholar] [CrossRef]
- Betoret, E.; Mannozzi, C.; Dellarosa, N.; Laghi, L.; Rocculi, P.; Dalla Rosa, M. Metabolomic studies after high pressure homogenization processed low pulp mandarin juice with trehalose addition. Functional and technological properties. J. Food Eng. 2017, 200, 22–28. [Google Scholar] [CrossRef]
- Kopjar, M.; Tiban, N.N.; Pilizota, V.; Babic, J. Stability of anthocyanins, phenols and free radical scavenging activity through sugar addition during frozen storage of blackberries. J. Food Process. Preserv. 2009, 33, 1–11. [Google Scholar] [CrossRef]
- Nurcholis, W.; Putri, D.N.S.B.; Husnawati, H.; Aisyah, S.I.; Priosoeryanto, B.P. Total flavonoid content and antioxidant activity of ethanol and ethyl acetate extracts from accessions of Amomum compactum fruits. Ann. Agric. Sci. 2021, 1, 58–62. [Google Scholar] [CrossRef]
- Kek, S.P.; Chin, N.L.; Yusof, Y.A.; Tan, S.W.; Chua, L.S. Total phenolic contents and colour intensity of Malaysian honeys from the Apis spp. and Trigona spp. bees. Agric. Agric. Sci. Procedia 2014, 2, 150–155. [Google Scholar] [CrossRef]
- Li, X.J.; Bai, W.D.; Zhao, W.H. Study on Non-enzymatic Browning Simulation System of Semi-sweet Guangdong Yellow Rice Wine in the Process of Decocting. Food Ind. 2018, 39, 91–95. [Google Scholar]
- Shenoy, P.; Viau, M.; Tammel, K.; Innings, F.; Fitzpatrick, J.; Ahrné, L. Effect of powder densities, particle size and shape on mixture quality of binary food powder mixtures. Powder Technol. 2015, 272, 165–172. [Google Scholar] [CrossRef]
- Nogueira, G.F.; Fakhouri, F.M.; de Oliveira, R.A. Incorporation of spray dried and freeze dried blackberry particles in edible films: Morphology, stability to pH, sterilization and biodegradation. Food Packag. Shelf Life 2019, 20, 100313. [Google Scholar] [CrossRef]
- Ganaie, T.A.; Masoodi, F.A.; Rather, S.A.; Gani, A. Exploiting maltodextrin and whey protein isolate macromolecules as carriers for the development of freeze dried honey powder. Carbohydr. Polym. 2021, 2, 100040. [Google Scholar] [CrossRef]
- Yang, L.; Guo, J.; Yu, Y.; An, Q.; Wang, L.; Li, S.; Qi, S. Hydrogen bonds of sodium alginate/Antarctic krill protein composite material. Carbohydr. Polym. 2016, 142, 275–281. [Google Scholar] [CrossRef] [PubMed]
- Zhang, L.; Wei, Y.; Liao, W.; Tong, Z.; Wang, Y.; Liu, J.; Gao, Y. Impact of trehalose on physicochemical stability of β-carotene high loaded microcapsules fabricated by wet-milling coupled with spray drying. Food Hydrocoll. 2021, 121, 106977. [Google Scholar] [CrossRef]


| Parameter | Control | TR 1 | TR 3 | TR 5 | TR 7 | TR 9 |
|---|---|---|---|---|---|---|
| Fresh royal jelly (g) | 10 | 10 | 10 | 10 | 10 | 10 |
| Trehalose (g) | 0 | 0.01 | 0.03 | 0.05 | 0.07 | 0.09 |
| Water (g) | 10 | 10 | 10 | 10 | 10 | 10 |
| Thickness (mm) | 6 | 6 | 6 | 6 | 6 | 6 |
| Parameter | Control | TR 1 | TR 3 | TR 5 | TR 7 | TR 9 |
|---|---|---|---|---|---|---|
| Protein (%) | 33.39 ± 0.10f | 33.72 ± 0.10d | 33.19 ± 0.10e | 34.67 ± 0.10c | 35.08 ± 0.10b | 35.60 ± 0.10a |
| Fat (%) | 15.63 ± 0.11a | 15.62 ± 0.10a | 15.63 ± 0.11a | 15.62 ± 0.10a | 15.64 ± 0.11a | 15.63 ± 0.12a |
| Total sugar (%) | 33.80 ± 0.14f | 34.13 ± 0.15e | 34.80 ± 0.17d | 35.47 ± 0.17c | 36.13 ± 0.17b | 36.80 ± 0.15a |
| Ash (%) | 3.7 ± 0.11a | 3.7 ± 0.10a | 3.7 ± 0.11a | 3.7 ± 0.12a | 3.7 ± 0.10a | 3.7 ± 0.11a |
| pH | 4.62 ± 0.09a | 4.53 ± 0.07a | 4.54 ± 0.09a | 4.58 ± 0.08a | 4.60 ± 0.10a | 4.60 ± 0.09a |
| Moisture (%) | 3.32 ± 0.06f | 3.47 ± 0.04e | 3.56 ± 0.05d | 3.71 ± 0.07c | 3.88 ± 0.07b | 4.03 ± 0.06a |
| aw | 0.235 ± 0.004a | 0.229 ± 0.003b | 0.221 ± 0.002c | 0.213 ± 0.003d | 0.210 ± 0.003d | 0.203 ± 0.004e |
| 10-HDA (%) | 5.16 ± 0.01a | 5.16 ± 0.01a | 5.17 ± 0.01a | 5.17 ± 0.01a | 5.16 ± 0.01a | 5.16 ± 0.01a |
| Parameter | Control | TR 1 | TR 3 | TR 5 | TR 7 | TR 9 |
|---|---|---|---|---|---|---|
| Bulk density (g mL−1) | 0.353 ± 0.010e | 0.384 ± 0.007d | 0.394 ± 0.017c | 0.432 ± 0.006b | 0.458 ± 0.009a | 0.458 ± 0.009a |
| Tapped density (g mL−1) | 0.592 ± 0.006f | 0.612 ± 0.006e | 0.625 ± 0.006d | 0.668 ± 0.008c | 0.704 ± 0.006b | 0.802 ± 0.007a |
| Angle of respose (°) | 62.24 ± 0.09f | 62.73 ± 0.11e | 63.77 ± 0.09d | 64.54 ± 0.11c | 65.06 ± 0.10b | 65.65 ± 0.08a |
| Sample | L* | a* | b* | ΔE* |
|---|---|---|---|---|
| Control | 89.80 ± 0.04a | −0.53 ± 0.01a | 20.54 ± 0.04e | - |
| TR 1 | 88.80 ± 0.05f | −0.52 ± 0.01a | 21.47 ± 0.06c | 1.36 ± 0.05c |
| TR 3 | 89.06 ± 0.03e | −0.55 ± 0.02a | 22.52 ± 0.08a | 2.11 ± 0.07a |
| TR 5 | 89.56 ± 0.05c | −0.53 ± 0.03a | 20.82 ± 0.02d | 0.37 ± 0.01d |
| TR 7 | 89.71 ± 0.03b | −0.54 ± 0.05a | 22.10 ± 0.07b | 1.56 ± 0.09b |
| TR 9 | 89.28 ± 0.02d | −0.52 ± 0.02a | 21.96 ± 0.05b | 1.51 ± 0.04b |
Publisher’s Note: MDPI stays neutral with regard to jurisdictional claims in published maps and institutional affiliations. |
© 2022 by the authors. Licensee MDPI, Basel, Switzerland. This article is an open access article distributed under the terms and conditions of the Creative Commons Attribution (CC BY) license (https://creativecommons.org/licenses/by/4.0/).
Share and Cite
Li, L.; Wang, P.; Xu, Y.; Wu, X.; Liu, X. Effect of Trehalose on the Physicochemical Properties of Freeze-Dried Powder of Royal Jelly of Northeastern Black Bee. Coatings 2022, 12, 173. https://doi.org/10.3390/coatings12020173
Li L, Wang P, Xu Y, Wu X, Liu X. Effect of Trehalose on the Physicochemical Properties of Freeze-Dried Powder of Royal Jelly of Northeastern Black Bee. Coatings. 2022; 12(2):173. https://doi.org/10.3390/coatings12020173
Chicago/Turabian StyleLi, Liangyu, Peiren Wang, Yanli Xu, Xiaoguang Wu, and Xuejun Liu. 2022. "Effect of Trehalose on the Physicochemical Properties of Freeze-Dried Powder of Royal Jelly of Northeastern Black Bee" Coatings 12, no. 2: 173. https://doi.org/10.3390/coatings12020173
APA StyleLi, L., Wang, P., Xu, Y., Wu, X., & Liu, X. (2022). Effect of Trehalose on the Physicochemical Properties of Freeze-Dried Powder of Royal Jelly of Northeastern Black Bee. Coatings, 12(2), 173. https://doi.org/10.3390/coatings12020173