Article

Forecast the Microhardness of Ni-TiN Nanoplatings via an Artificial Neural Network Model

School of Energy and Building Environment, Guilin University of Aerospace Technology, Guilin 541004, China
*
Authors to whom correspondence should be addressed.
Coatings 2022, 12(2), 145; https://doi.org/10.3390/coatings12020145
Submission received: 28 December 2021 / Revised: 12 January 2022 / Accepted: 21 January 2022 / Published: 26 January 2022
(This article belongs to the Special Issue State-of-the-Art on Coatings Research in Asia)

Abstract

:
This study used a backward propagation (BP) model to estimate the microhardness of Ni-TiN nanoplatings prepared using pulse electrodeposition. The influence of electroplating parameters on the microhardness of Ni-TiN nanoplatings was discussed. These parameters included the concentration of the TiN particle, pulse frequency, duty cycle, and current density. The surface morphology, microstructure, and microhardness of Ni-TiN nanoplatings were examined using white-light interfering profilometry, scanning electron microscopy, Rockwell hardness testing, and high-resolution transmission emission microscopy. The Ni-TiN thin film prepared by pulse electrodeposition had a surface roughness of about 0.122 µm, and the average size of the Ni and TiN grains on this film was 61.8 and 31.3 nm, respectively. The optimal process parameters were determined based on the maximum microhardness of the deposited Ni-TiN nanoplatings, which included an 8 g/L TiN particle concentration, a 5 A/dm2 current density, an 80 Hz pulse frequency, and a 0.7 duty cycle. It could be concluded that the BP model would accurately forecast the microhardness of Ni-TiN nanoplatings, with a maximal error of about 1.04%.

1. Introduction

As a general procedure, pulse electrodeposition is frequently employed to deposit different metal-ceramic or metal platings on base materials [1,2,3,4]. Ma et al. [5] successfully deposited Ni-SiC nanoplatings using both ultrasonic pulsed current (UPC) and direct current (DC) electrodeposition methods. The results revealed that Ni-SiC nanoplatings prepared via UPC electrodeposition had a very compact and uniform surface morphology, with an average diameter of Ni and SiC grains in the Ni-SiC nanoplatings of 63.6 and 38.5 nm, respectively. Borkar et al. [6] used the pulse electrodeposition method in a nickel Watts bath to deposit nickel coatings reinforced with carbon nanotubes (CNTs) onto a stainless-steel substrate. Sen et al. [7] produced Ni–CeO2 composite nanoplatings using pulse electrodeposition in a Watt electrolyte. Titanium nitride (TiN), a form of metal nitride material with up to 21 GPa hardness, has been extensively used as a reinforcing phase in metal or ceramic matrix materials to improve strength and toughness [8]. In general, pulse electrodeposition is a reliable, simple, and efficient process of preparing Ni-TiN nanoplatings.
During the pulse electrodeposition process, special care should be paid to the shape and properties of the produced parts, which are affected by the features of the coating deposited on the surface [9]. Different processing factors, such as current density, duty cycle, the concentration of particle, bath temperature, rate of stirring, and pH value, all had a direct effect on the properties of the prepared nanoplatings, including strength, wear, hardness, and corrosion resistance [10].
Artificial neural networks (ANN) are now extensively applied in mathematics, science, the chemical industry, mechanical engineering, and other fields [11]. The backward propagation (BP) neural network is by far the most extensively used type of ANN, and it is made up of very simple artificial neurons that are linked together to mimic some functional aspects of biological neural networks [12]. Simulated input data were multiplied by weights to construct a model of ANN. The neural output was activated by weighing and summing the input data with the help of a mathematical threshold function. As illustrated in Figure 1, a typical artificial neuron structure was presented. The usage of ANNs, which produce excellent prediction results, could greatly lower the cost of experimental tests when compared to experimental measurement.
Although many reports on the application of ANNs in material science have been published [13], there are relatively few studies on the prediction of the hardness values of Ni-TiN nanoplatings. In addition, the influence of plating parameters on microstructure, microhardness and surface roughness of the coatings was not discussed in detail. Therefore, the Ni-TiN nanoplatings on 20 steel substrates were successfully prepared using the pulse electrodeposition method in this paper. White-light interfering profilometry (WLIP), Rockwell hardness testing, high-resolution transmission emission microscopy (HRTEM), and scanning electron microscopy (SEM) were used to characterize the microhardness and surface morphology of Ni-TiN nanoplatings. Moreover, experimental data was used to build the neural network to evaluate the influence of plating parameters on the microhardness values of Ni-TiN nanoplatings using the pulse electrodeposition method and to forecast the microhardness using this ANN model.

2. Experiment

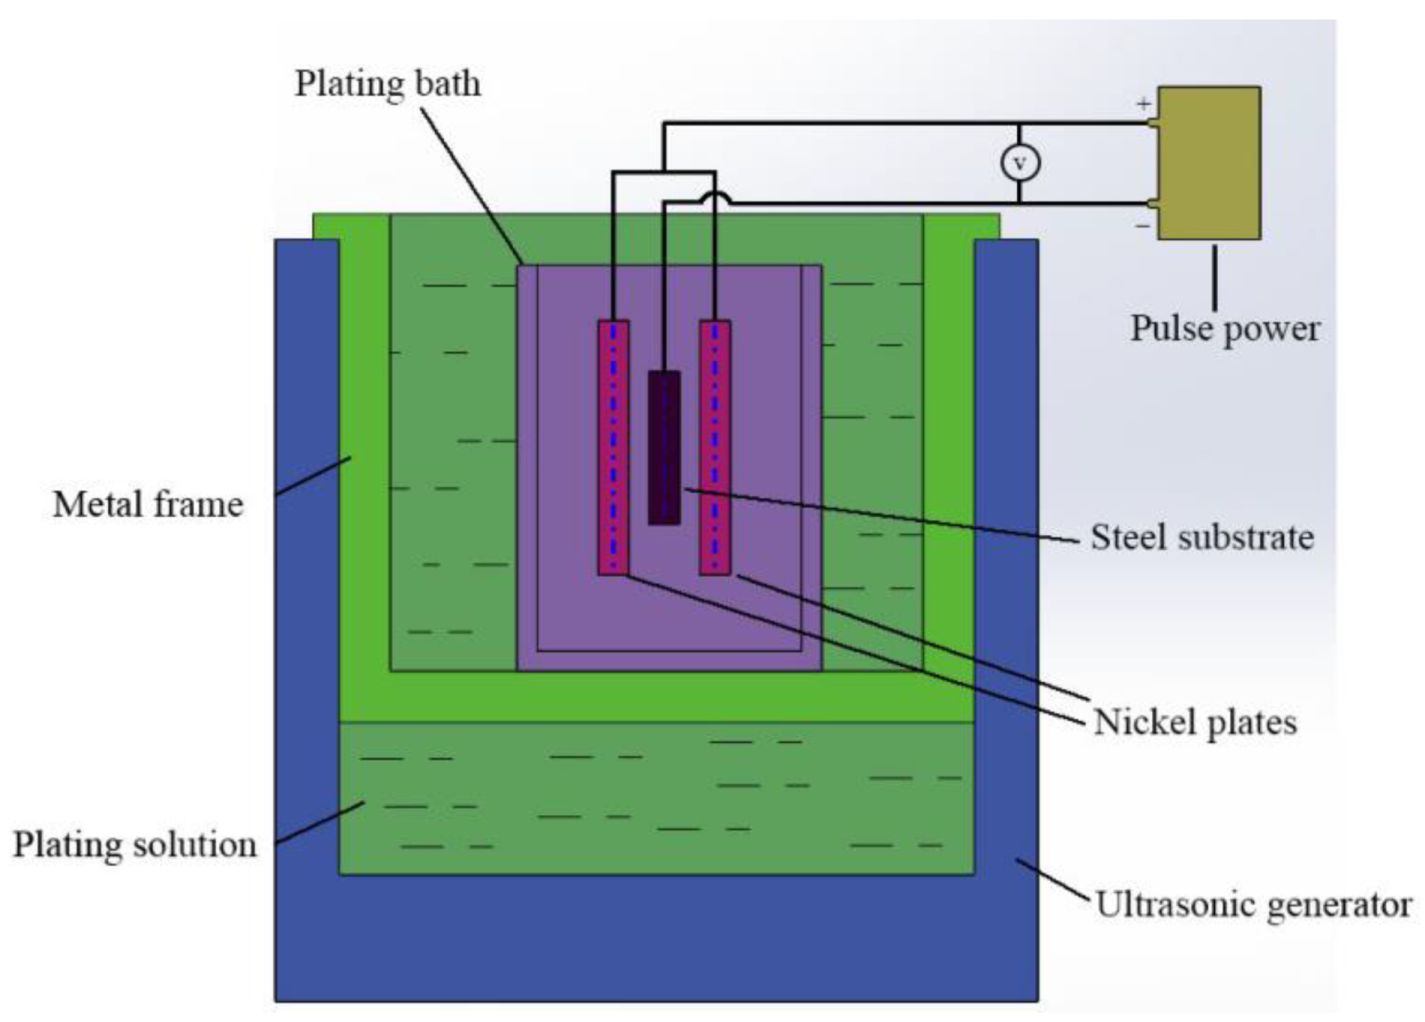
2.1. Preparation of Sample

The Ni-TiN nanoplatings with a 70 µm thickness were prepared using pulse electrodeposition on the 20 steel substrates with a size of 30 mm × 20 mm × 5 mm, which were bought from Baotou Steel Corporation (Baotou, China). The 20 steel substrates were composed of Fe (98.14%), C (0.41%), Mn (0.57%), Cr (0.25%), Cu (0.2%), Ni (0.25%) and Si (0.18%). The schematic diagram in Figure 2 depicts an essential pulsed electrodeposition cell. The 20-steel substrate was used as the cathode during the deposition process, with a surface roughness of 0.15 µm that had been mechanically polished. The anode was a 99.9% pure nickel plate of the same size purchased from Baoji Industrial Co., LTD (Baoji, China). Ni-TiN nanoplatings were prepared using a plating solution containing TiN particles (2–10 g/L) (about 30 nm), boric acid (25 g/L), nickel chloride (50 g/L), nickel sulfate (210 g/L). The electroplating solution was maintained at a temperature of 46 °C and had a pH value of 5. The electrodeposition progress parameters used to prepare Ni-TiN nanoplatings are listed in Table 1. In order to induce the effect of coating thickness on microhardness of Ni-TiN nanoplatings, we kept the thickness of the platings at ~70 µm by grinding.

2.2. Characterization of Sample

The surface topography and thickness of the Ni-TiN nanoplatings were investigated using the SEM (JSM-6460LV, JEOL, Tokyo, Japan). The surface roughness (Ra) of the nanoplating was determined by using a KLA-Tencor-1A type WLIP (KLA-Tencor, San Francisco, CA, USA). The Ra value of the surface was determined by comparing the standard deviation of each point’s height to the average height value. Additionally, the Ra parameter was used to characterize the amplitude. Each sample was analyzed for Ra, and the average value was determined in 10 distinct parts with a size of 900 μm × 700 μm. A Tecnai–G2–20–S–Twin type HRTEM (FEI, Hillsboro, OR, USA) was used to analyze the microstructure of the coatings. Prior to HRTEM observation of the nanoplatings, the samples were mechanically polished to a thickness of 100 µm, then sequentially diluted to a 90 nm thickness through an ion beam diluent, and then continuously rinsed with ethanol solution. A standard microhardness tester (HVS—2000, Shenzhen Junda Times Instrument Co., Ltd., Shenzhen, China) was used to determine the microhardness of the Ni-TiN nanoplatings. The Vickers microhardness values were measured at a specific interval of 5 mm from the plating surface to the metal substrate, which required at least five measurements at each depth. The crystal structure of the Ni-TiN nanoplatings was observed using X-ray diffraction (XRD, Philips D5000, Philips, Amsterdam, Dutch). The following were the working conditions: The working target voltage was 40 kV, the working current was 100 m, the scanning step was 0.05°, and the scans were performed in the 2θ = 10°–100° range. The following Scherer equation can be used to calculate the average grain size [14]:
D = 180 K λ π β 2 ω cos θ
where D stands for particle diameter, K for grain figure factor K = 0.89, λ for wavelength (λ = 0.15418 nm), β for half-height diffraction peak width, ω for a full-width standard at half-maximum, and θ for Bragg angle.

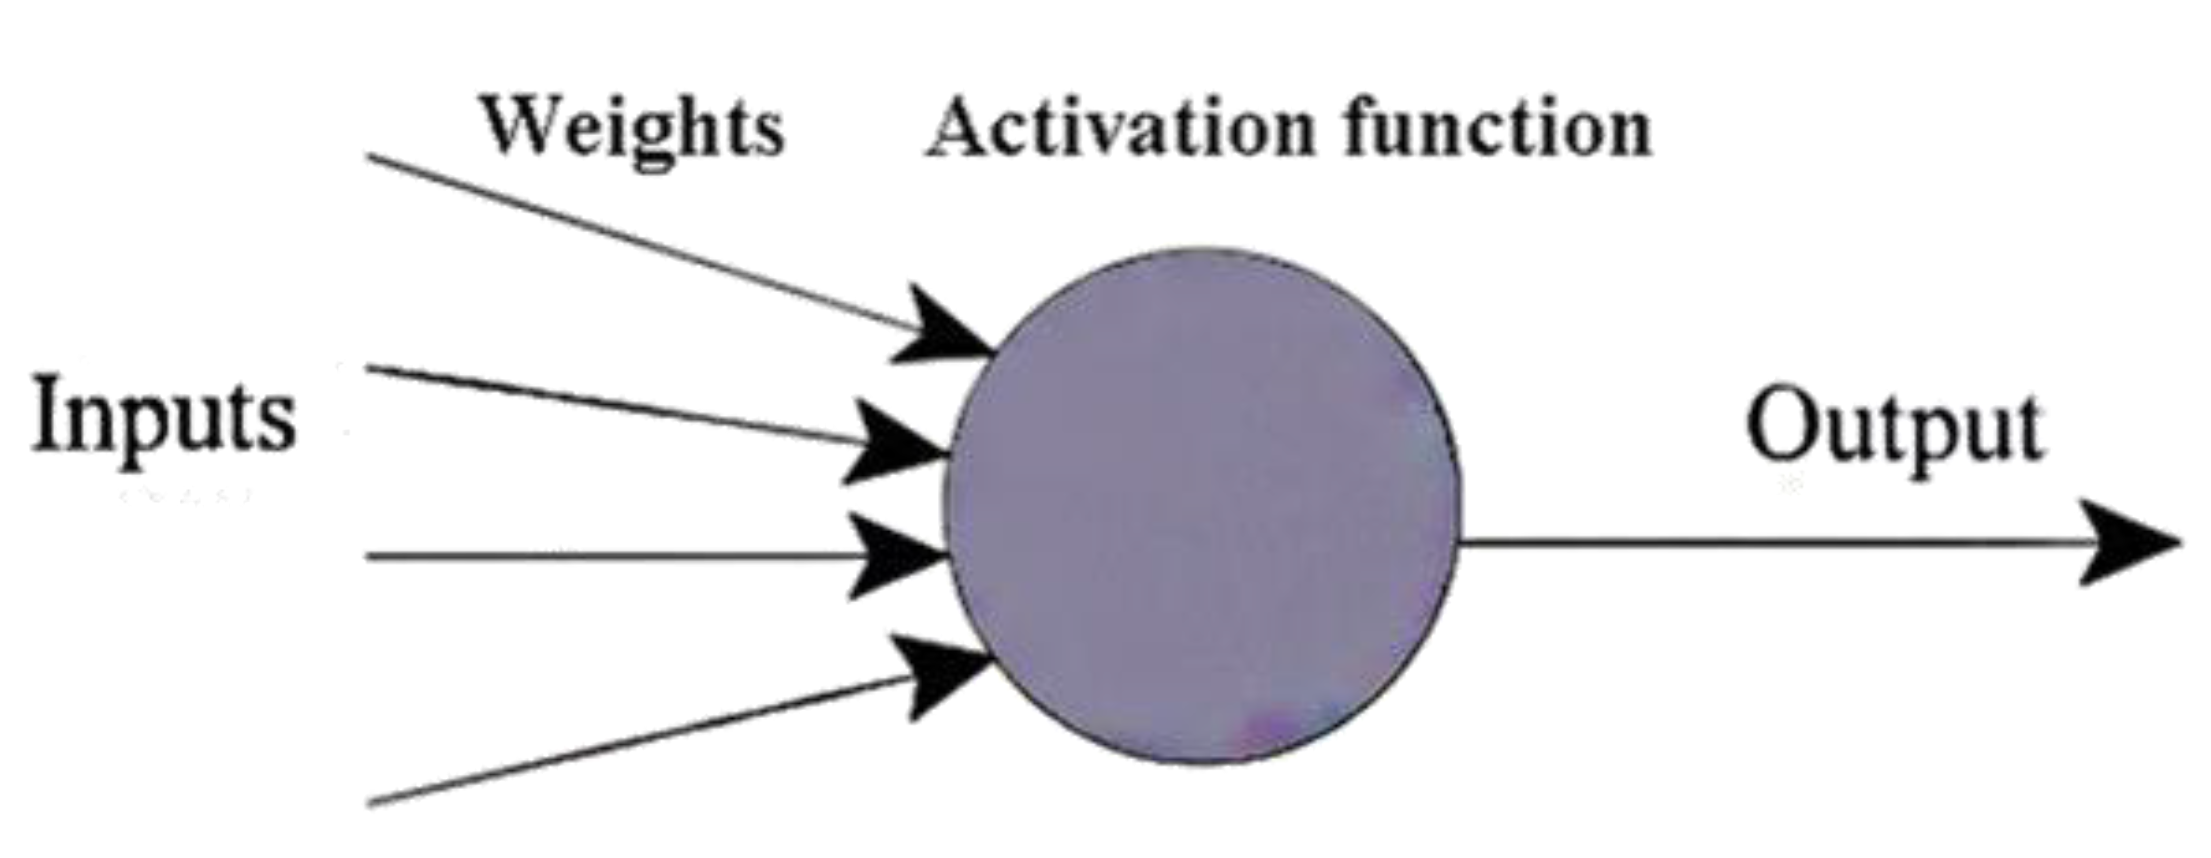
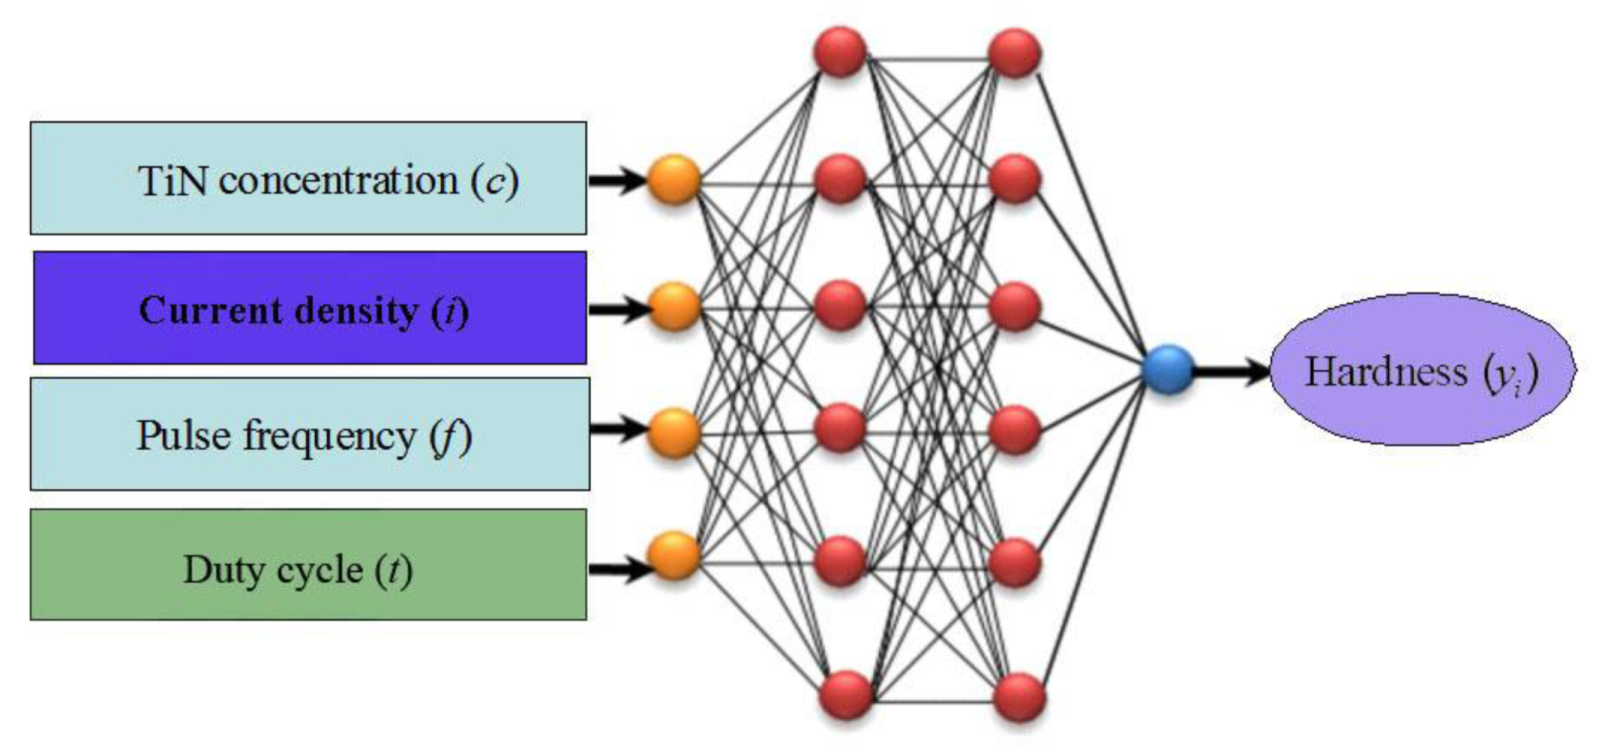
2.3. BP Model and Structure

The network model used for prediction in this study was a three-layer BP model. Figure 3 depicted the model’s framework, which contains an input, a hidden, and an output layer. Weighting factors were used to connect the neurons, which are the network’s fundamental units. The TiN concentration (c), pulse frequency (f), current density (i), and duty ratio (t) were used as input layers in this network model, and the hardness of the plating was used as the final output layer. The Sigmoid function was the nonlinear action function of this BP model. In addition, both the input and output values were normalized in the range of 0–1. In layer L, the output yi of neuron i was calculated using the following formula [15,16]:
y i = f ( j = 1 n W i j + b )
where f, n, b, Wij, i, and j represent the activation function, the element amount in layer L-1, the activation function’s bias or offset, and the weight-related with the link between layer L neuron i and layer L-1 neuron j both of which have an output of wi.
The following equation was used to express the BP model’s error [17,18]:
E r r o r = 1 N T m = 1 T n = 1 N [ x i ( m ) y i ( m ) ] 2
where T represents the training sets, N represents the outputs, xi and yi represent the desired output and predicted output, respectively.

3. Results and Discussion

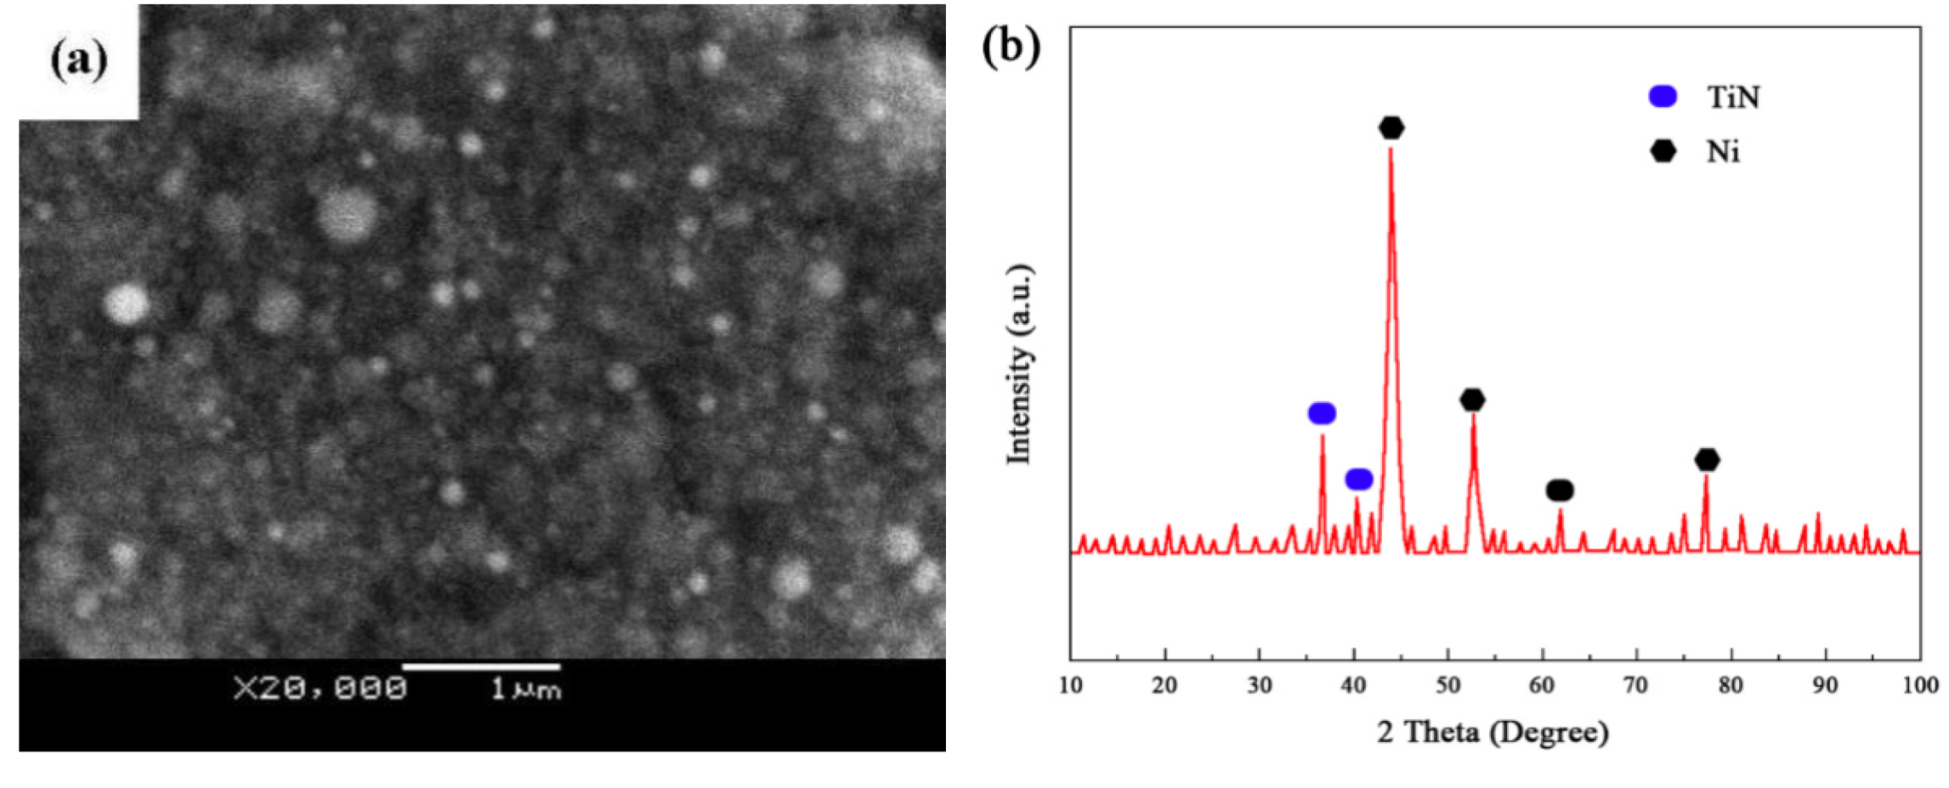
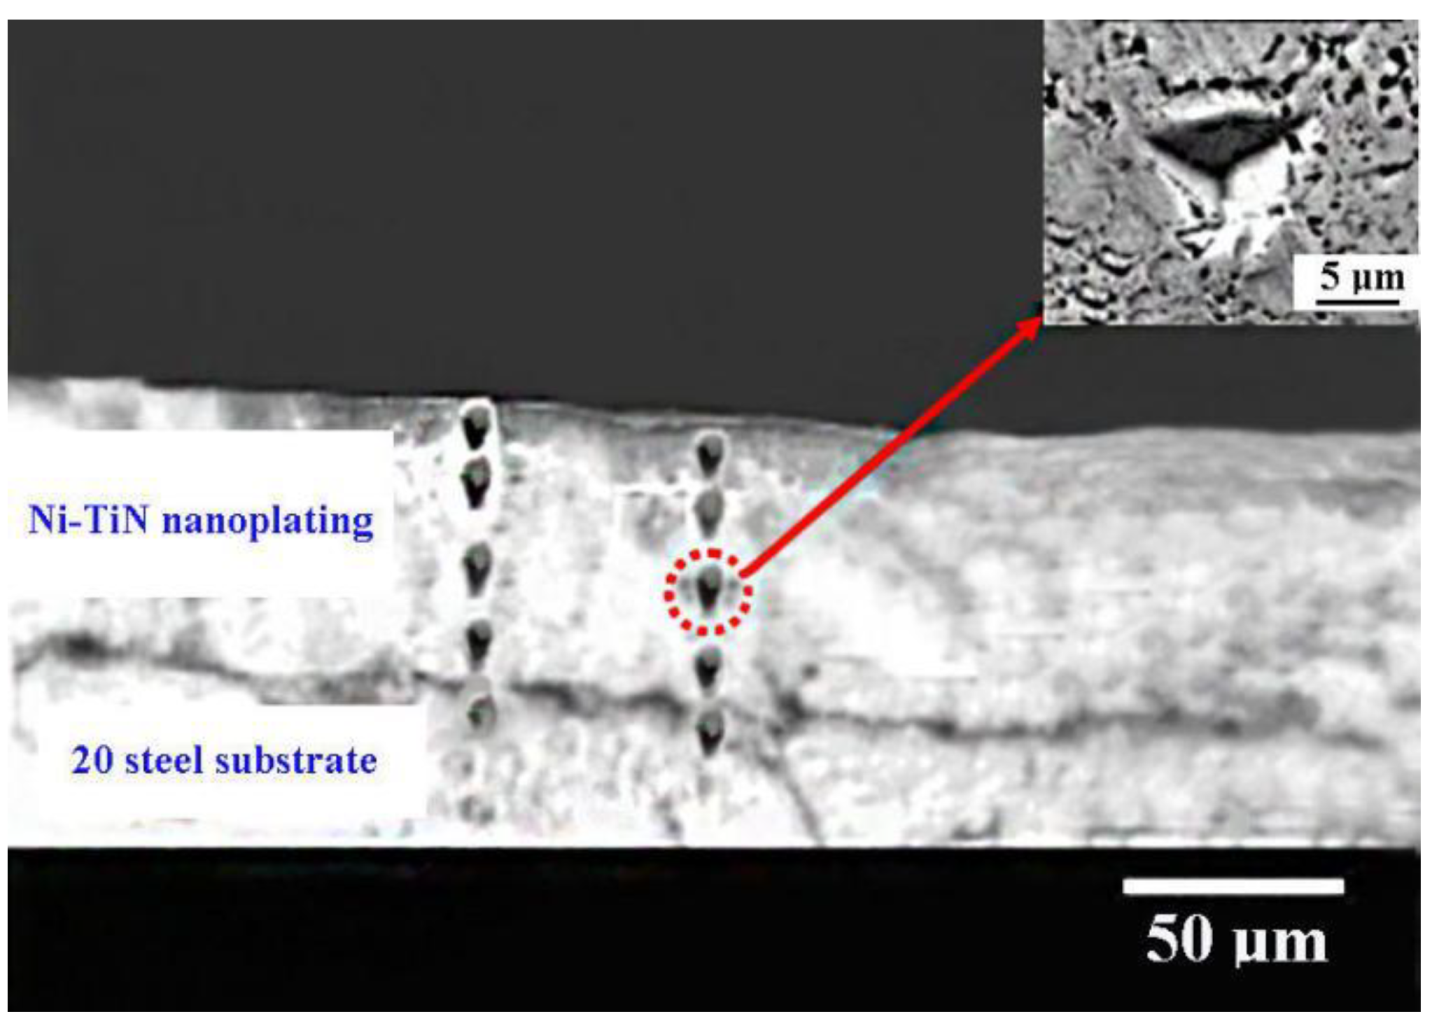
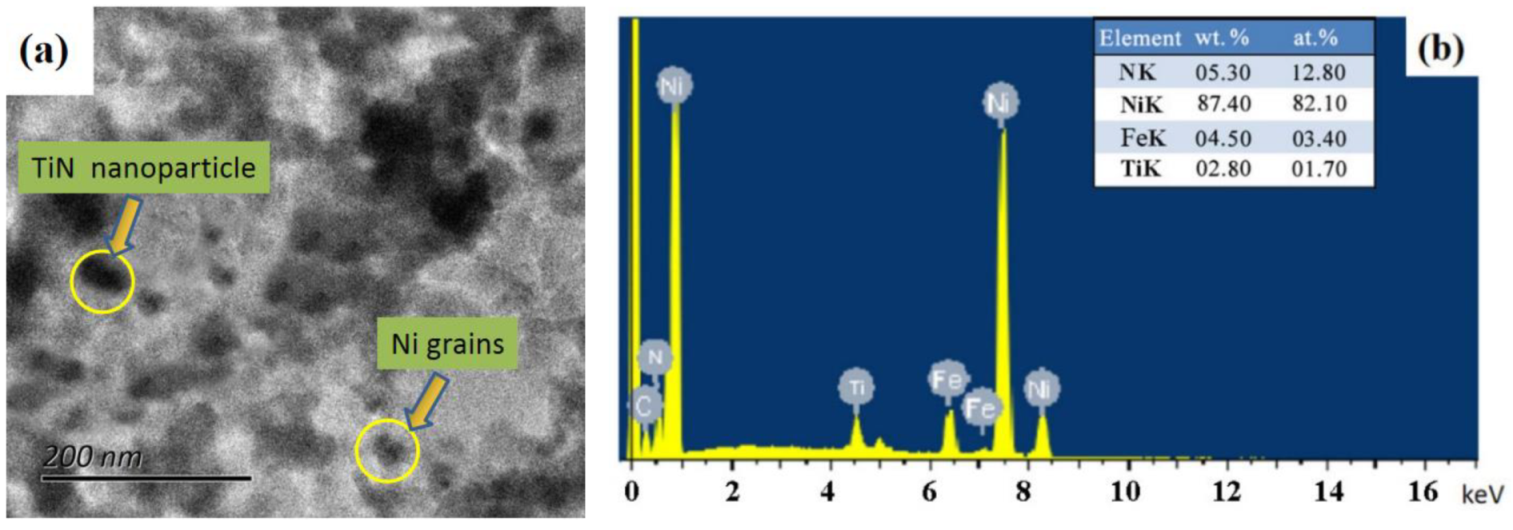
3.1. Ni-TiN Nanoplatings Microstructure Analysis

Pulsed electrodeposition was used to prepare a set of Ni-TiN nanoplating samples at i (5 A/dm2), c (8 g/L), t (0.7), and f (80 Hz). The microstructure of these samples was examined. A cross-sectional picture of Ni-TiN nanoplatings placed on a 20 steel is displayed in Figure 4. The inserted image in Figure 4 is an enlarged picture of the indentation. It was a typical of the triangular indentation. The results revealed that a dense layer of Ni-TiN nanoplating was deposited onto the substrate, with a plating thickness of approximately 69.7 µm. Furthermore, micro-indentation arrays were found at the cross-section of Ni-TiN nanoplatings.
An SEM picture of the surface of Ni-TiN nanoplatings was depicted in Figure 5a. The surface morphology of the plating was dense and smooth, as shown in the figure, and TiN ceramic particles were incorporated in the Ni-TiN nanoplatings. Ni grains were irregular in size and formed a cauliflower-like structure on the coating. The Ni–TiN nanoplatings were found to be constituted of a Ni and TiN phase, respectively, as illustrated in Figure 5b. Ni phase had three diffraction peaks at 78.1°, 52.6°, and 44.3° and which corresponded to the (2 2 0), (2 0 0), and (1 1 1) planes, respectively. Simultaneously, the three diffraction peaks of the TiN phase were 62.8°, 41.6°, and 37.3°, which corresponded to the (2 2 0), (2 0 0), and (1 1 1) planes, respectively. In addition, Equation (1) was used to calculate the average grain size of Ni and TiN was found to be around 61.3 and 30.8 nm, respectively, based on the XRD data [19].
Figure 6 depicted a WLIP picture of the deposited Ni-TiN nanoplating with a Ra value of approximately 0.122 µm. In addition, numerous fine nickel grains appeared in the Ni-TiN nanoplating, and some shallow grooves also emerged on the surface of the coating. Furthermore, HRTEM was used to examine the nanoplatings to determine the microstructure and grain size of the nanoplatings. Figure 7a depicted a two-dimensional representation of nanoplating. The TiN particles were depicted in the figure as black parts with a diameter of about 30 nm on average. The Ni grains, on the other hand, were the white part, with an average diameter of about 61.8 nm. The energy-dispersive X-ray spectroscopy (EDS) image of the Ni-TiN nanoplating was shown in Figure 7b. The inserted image in Figure 7b is a table of N, Ni, Fe, Ti contents in the nanoplating. We observed that the Ni-TiN nanoplating had more Ni grains and TiN particles. The atomic percentages of Ni grains and TiN particles were estimated to be 82.1 at.% and 14.5 at.%, respectively. In addition, the existence of a trace amount of Fe and C elements was detected in the EDS image, and this phenomenon was attributed to the fact that these elements were present in the 20 steel matrix [20].

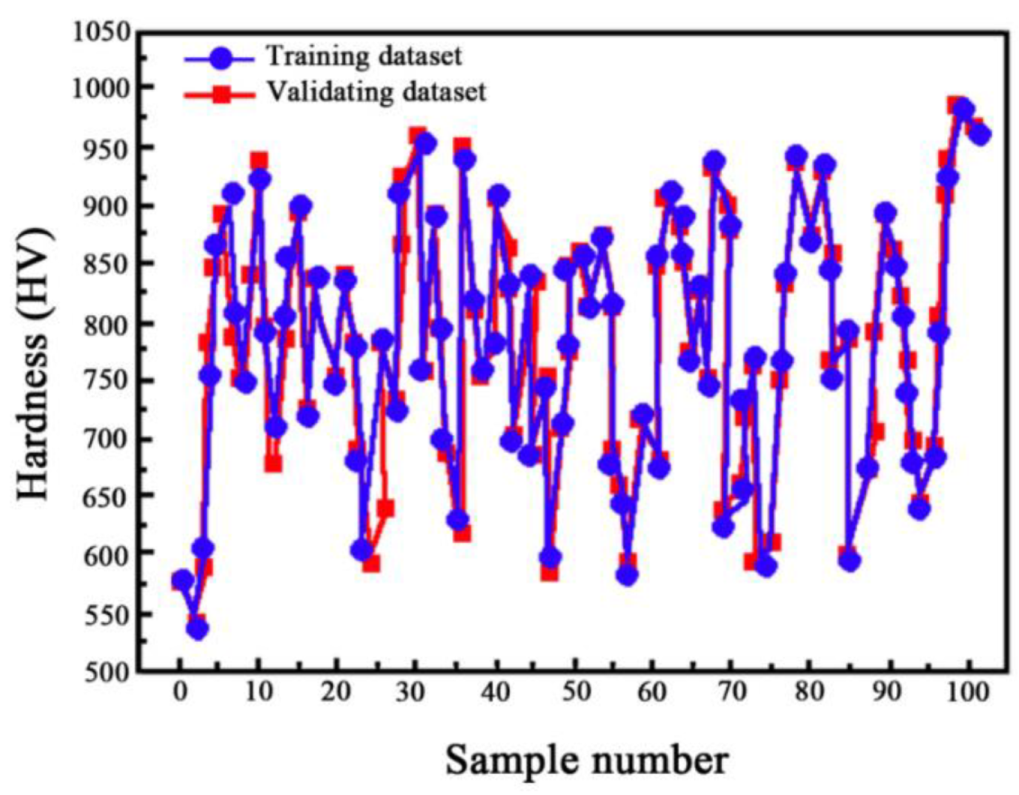
3.2. Validation and Training of the BP Model

The BP model was developed using a dataset of 100 nanoplating samples. Among those nanoplatings, 90 data points were applied for the test procedure, and the remaining 10 data points were used for the final verification. In the process of the experiment, the momentum was set to 0.90 and the learning rate was set at 0.05. The experimental data and predicted values for the Ni-TiN nanoplating microhardness were reported in Figure 8. The microhardness of the platings was determined to be between 546 and 997 HV, as shown in the figure. In addition, the microhardness values predicted by the neural network in Figure 8 were very close to the experimental results, which indicated that the BP model could well be used to predict the microhardness of nanoplating within the parameters considered.

3.3. BP Model Results

The experimental data was validated using different values of pulse current density, pulse current frequency, TiN concentration, and pulse duty cycle, to investigate the influence of different process parameters on the microhardness of the deposited Ni-TiN nanoplatings, as summarized in Table 2. The connection between BP model output and experimental values was depicted in Figure 9, and the observation and comparison results revealed that their final results were remarkably compatible. The absolute relative error was used to assess the prediction performance of the provided BP model. The BP model’s maximum absolute relative error in predicting microhardness was 1.04%, which was lower than the experimental average absolute relative error of 1.20%.
The variational relationship between the microhardness of Ni-TiN nanoplating and TiN particle concentration is illustrated in Figure 9a. The microhardness of the Ni-TiN nanoplatings increased as the TiN particle concentration increased, which was then eventually stabilized at 8 g/L of TiN particles. The microhardness of Ni-TiN nanoplatings increased with TiN particle concentration and tended to be stable at 8 g/L of TiN particle concentration. Nonetheless, increasing the concentration of TiN particles from 8 to 10 g/L resulted in a small decrease in the microhardness of the nanoplatings. Yuan et al. [21] earlier observed a similar effect. The occurrence of this phenomenon can be explained by several factors. TiN particles of appropriate concentration were added to the solution, increasing the number of TiN particles in the solution and, as a result, the amount of TiN deposited on the cathode surface, thereby improving the microhardness of the nanoplatings. On the other hand, the concentration of TiN particles was increased from 8 to 10 g/L, increasing the solution’s viscosity and thereby increasing the TiN particles resistance deposited onto the cathode surface. As a result, the number of TiN particles in the plating reduced, and the microhardness of the plating decreased.
The change of microhardness of Ni-TiN nanoplatings as affected by current density was illustrated in Figure 9b. The findings revealed that the current density had a substantial impact on the microhardness of the deposited platings. When the current density of Ni-TiN nanoplatings was increased to 5.0 A/dm2, the microhardness of the nanoplatings reached a maximum value. Moreover, there were no significant changes as the current density increased from 5.0 to 6 A/dm2. The nucleation rate rose as a result of the increased overpotential produced by the rise in current density. Additionally, the increasing current density would cause the surface morphology of Ni-TiN nanoplatings to become more exiguous, as demonstrated in the typical patterns described by Vaezi et al. [22].
The variation in pulse frequency affected the microhardness of Ni-TiN nanoplatings, as shown in Figure 9c. The maximum microhardness of 993.2 HV was achieved at an 80 Hz pulse frequency for the prepared Ni-TiN nanoplatings. This is because the number of TiN particles in the nanoplatings increased significantly when the nanoplatings were prepared under moderate frequency conditions, resulting in a higher microhardness of the nanoplatings.
As illustrated in Figure 9d, the duty cycle affects the microhardness of Ni-TiN nanoplatings. The microhardness of the platings increased when the duty cycle was increased to 0.7. The current density increased further, but there was no significant effect on microhardness. Lajevardi et al. conducted an experiment to observe this phenomenon [23].

4. Conclusions

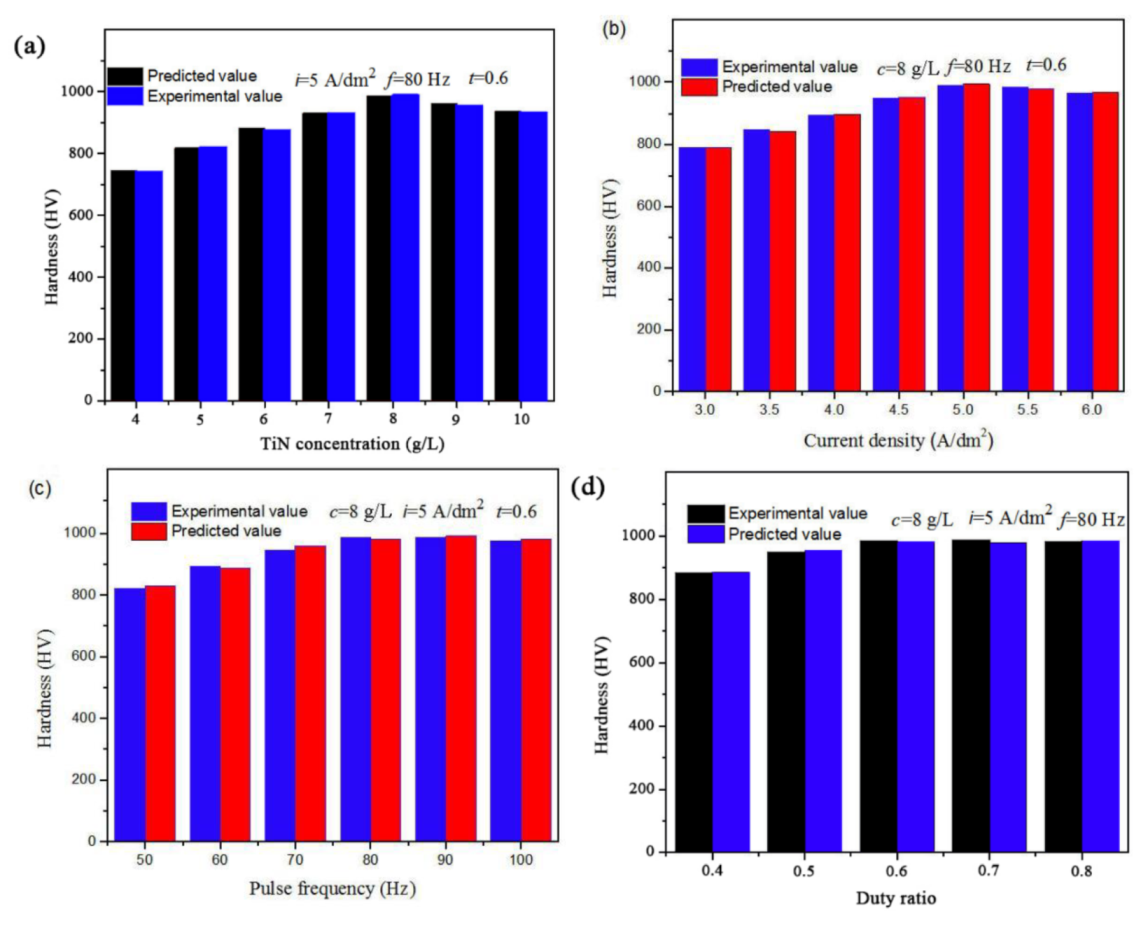
  • According to the analysis results of microhardness of Ni-TiN nanoplatings, the optimum process parameters for preparing Ni-TiN nanoplatings by pulse electrodeposition were examined as follows: 8 g/L concentration of TiN particles, 5 A/dm2 current density, 80 Hz pulse frequency, and 0.7 duty cycle.
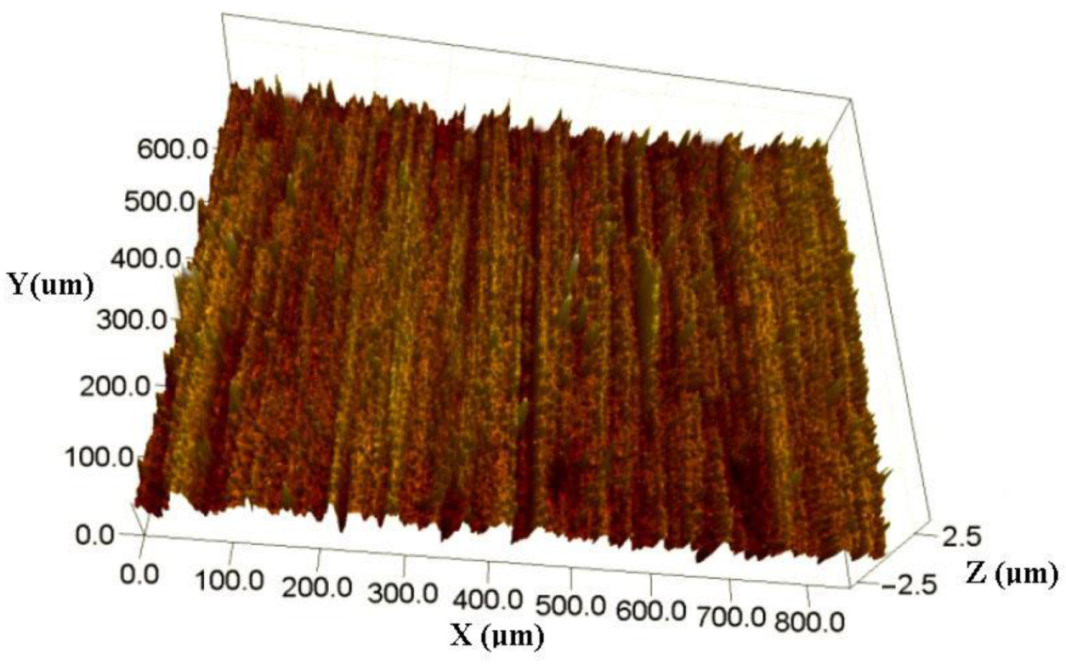
  • The results by white light interferometry showed that the Ra value of the nanoplatings was about 0.122 µm. Furthermore, the mean sizes of Ni and TiN grains were determined to be 61.8 and 31.3 nm, respectively, using XRD and HRTEM.
  • The BP model could be used as an applicable method to effectively predict the microhardness of Ni-TiN nanoplatings, with a maximum error was about 1.04%. In comparison to experimental data, the BP model successfully predicted the microhardness of Ni-TiN nanoplatings.

Author Contributions

Study design and collection of data, Y.L.; Analysis and interpretation, X.H.; Figures, study design, L.K.; writing—original draft preparation, B.W.; Data analysis, data interpretation, H.X. All authors have read and agreed to the published version of the manuscript.

Funding

This work has been supported by the National Natural Science Foundation of China (Guangxi Regional Foundation) (Granted No. 51965014) and the Guangxi Natural Science Foundation of China (Granted No. 2018GXNSFAA281306).

Institutional Review Board Statement

Not applicable.

Informed Consent Statement

Not applicable.

Data Availability Statement

Data is contained within the article.

Conflicts of Interest

The authors declare that they have no known competing financial interests or personal relationships that could have appeared to influence the work reported in this paper.

References

  1. Xia, F.; Li, C.; Ma, C.; Li, Q.; Xing, H. Effect of pulse current density on the microstructure and wear property of Ni-TiN nanocoatings deposited via pulse electrodeposition. Appl. Surf. Sci. 2021, 538, 148139. [Google Scholar] [CrossRef]
  2. Zimmerman, A.F.; Clark, D.G.; Aust, K.T.; Erb, U. Pulse electrodeposition of Ni–SiC nanocomposite. Mater. Lett. 2002, 52, 85–90. [Google Scholar] [CrossRef]
  3. Dehgahi, S.; Amini, R.; Alizadeh, M. Corrosion, passivation and wear behaviors of electrodeposited Ni-Al2O3-SiC nano-composite coatings. Surf. Coat. Technol. 2016, 304, 502–511. [Google Scholar] [CrossRef]
  4. Wu, M.; Jia, W.; Lv, P. Electrodepositing Ni-TiN nanocomposite layers with applying action of ultrasonic waves. Procedia Eng. 2017, 174, 717–723. [Google Scholar] [CrossRef]
  5. Ma, C.Y.; Liang, G.Q.; Zhu, Y.Y.; Mu, H.W.; Xia, F.F. Preparation and corrosion assessment of electrodeposited Ni-SiC composite thin films. Ceram. Int. 2014, 40, 3341–3346. [Google Scholar] [CrossRef]
  6. Borkar, T.; Harimkar, S. Microstructure and wear behaviour of pulse electrodeposited Ni-CNT composite coatings. Surf. Eng. 2011, 27, 524–530. [Google Scholar] [CrossRef]
  7. Sen, R.; Das, S.; Das, K. Effect of stirring rate on the microstructure and microhardness of Ni-CeO2 nanocomposite coating and investigation of the corrosion property. Surf. Coat. Technol. 2011, 205, 3847–3855. [Google Scholar] [CrossRef]
  8. Zhu, X.B.; Cai, C.; Zheng, G.Q.; Zhang, Z.; Li, J.F. Electrodeposition and corrosion behavior of nanostructured Ni-TiN composite films. Trans. Nonferrous Met. Soc. China 2011, 21, 2216–2224. [Google Scholar] [CrossRef]
  9. Xia, F.F.; Liu, C.; Ma, C.H.; Chu, D.Q.; Miao, L. Preparation and corrosion behavior of electrodeposited Ni-TiN composite coatings. Int. J. Refract. Met. Hard Mater. 2012, 35, 295–299. [Google Scholar] [CrossRef]
  10. Zhang, H.; Xia, F.; Wang, J.; Xu, F. Influence of duty cycle and pulse frequency on structures and performances of electrodeposited Ni-W/TiN nanocomposites on oil-gas X52 steels. Coatings 2021, 11, 1182. [Google Scholar] [CrossRef]
  11. Hattab, N.; Motelica-heino, M. Application of an inverse neural network model for the identification of optimal amendment to reduce copper toxicity in phytoremediated contaminated soils. J. Geochem. Explor. 2014, 136, 14–23. [Google Scholar] [CrossRef] [Green Version]
  12. Wang, L.; Fang, J.C.; Zhao, Z.Y.; Zeng, H.P. Application of backward propagation network for forecasting hardness and porosity of coatings by plasma spraying. Surf. Coat. Tech. 2007, 201, 5085–5089. [Google Scholar] [CrossRef]
  13. Shafyei, A.; Mousavi Anijdan, S.H.; Bahrami, A. Prediction of porosity percent in Al–Si casting alloys using ANN. Mat. Sci. Eng. A. 2006, 431, 206–210. [Google Scholar] [CrossRef]
  14. Holzwarth, U.; Gibson, N. The Scherrer equation versus the ‘Debye-Scherrer equation’. Nat. Nanotechnol. 2011, 6, 534. [Google Scholar] [CrossRef]
  15. Wang, P.; Liu, X.; Han, Z. Multi-parameter online optimization algorithm of BP neural network algorithm in Internet of Things service. Neural. Comput. Appl. 2021, 33, 505–515. [Google Scholar] [CrossRef]
  16. Ma, X.; Guan, Y.; Mao, R.; Zheng, S.; Wei, Q. Modeling of lead removal by living Scenedesmus obliquus using backpropagation (BP) neural network algorithm. Environ. Technol. Innov. 2021, 22, 101410. [Google Scholar] [CrossRef]
  17. Zhu, W.; Wang, H.; Zhang, X. Synergy evaluation model of container multimodal transport based on BP neural network. Neural Comput. Appl. 2021, 33, 1–9. [Google Scholar] [CrossRef]
  18. Yang, H.; Li, X.; Qiang, W.; Zhao, Y.; Tang, C. A network traffic forecasting method based on SA optimized ARIMA-BP neural network. Comput. Netw. 2021, 193, 108102. [Google Scholar] [CrossRef]
  19. Zhang, H.; Wang, J.; Li, Q.; Chen, S.; Ma, C. Microstructure and performance of magnetic feld assisted, pulse-electrodeposited Ni-TiN thin coatings with various TiN grain sizes. Ceram. Int. 2021, 47, 18532–18539. [Google Scholar] [CrossRef]
  20. Jiang, S.; Gao, S.; Kong, J.; Jin, X. Study on the synthesis of β-SiC nanoparticles from diamond-wire silicon cutting waste. RSC Adv. 2019, 9, 23785–23790. [Google Scholar] [CrossRef] [Green Version]
  21. Yuan, X.T.; Wang, Y.; Sun, D.B.; Yu, H.Y. Influence of pulse parameters on the microstructure and microhardness of nickel electrodeposits. Surf. Coat. Tech. 2008, 202, 1895–1903. [Google Scholar]
  22. Vaezi, M.R.; Sadrnezhaad, S.K.; Nikzad, L. Electrodeposition of Ni-SiC nano–composite coatings and evaluation of wear and corrosion resistance and electroplating characteristics. Colloids Surf. Asp. 2008, 315, 176–182. [Google Scholar] [CrossRef]
  23. Lajevardi, S.A.; Shahrabi, T. Effects of pulse electrodeposition parameters on the properties of Ni–TiO2 nanocomposite coatings. Appl. Surf. Sci. 2010, 256, 6775–6781. [Google Scholar] [CrossRef]
Figure 1. An artificial neuron.
Coatings 12 00145 g001
Figure 2. Schematic image of the pulse electrodeposition device.
Coatings 12 00145 g002
Figure 3. Schematic image of the backward propagation (BP) neural network model.
Coatings 12 00145 g003
Figure 4. Cross-section of the Ni-TiN nanoplating.
Coatings 12 00145 g004
Figure 5. SEM image (a) and XRD pattern (b) of the Ni-TiN nanoplating.
Coatings 12 00145 g005
Figure 6. WLIP picture of the Ni–TiN nanoplating.
Coatings 12 00145 g006
Figure 7. HRTEM (a) and EDS images (b) of the Ni–TiN nanoplating.
Coatings 12 00145 g007
Figure 8. Microhardness values of Ni-TiN nanoplatings predicted by the BP model.
Coatings 12 00145 g008
Figure 9. Effects of plating parameters on micohardnesses of Ni-TiN nanoplatings: (a) TiN concentration; (b) Currect density; (c) Pulse frequency; (d) Duty ratio.
Coatings 12 00145 g009
Table 1. Depositing parameters for obtaining Ni-TiN nanoplatings.
Plating ParametersContent
TiN particle concentration8 g/L
Pulse current density5 A/dm2
Pulse current frequency80 Hz
Duty cycle0.6
Electroplating time90 min
Table 2. Some typical plating parameters to validate the BP model.
Plating ParametersValues
TiN particle concentration 4, 5, 6, 7, 8, 9, 10 g/L
Pulse current density3.0, 3.5, 4.0, 4.5, 5.0, 5.5, 6.0 A/dm−2
Pulse current frequency50, 60, 70, 80, 90, 100 Hz
Duty cycle0.4, 0.5, 0.6, 0.7, 0.8
Publisher’s Note: MDPI stays neutral with regard to jurisdictional claims in published maps and institutional affiliations.

