
Microstructural and Mechanical Properties Characterization of Graphene Oxide-Reinforced Ti-Matrix Composites


Abstract
:1. Introduction
2. Experimental Procedure
3. Result Discussion
3.1. Phase Analysis
(T < 1939 K).
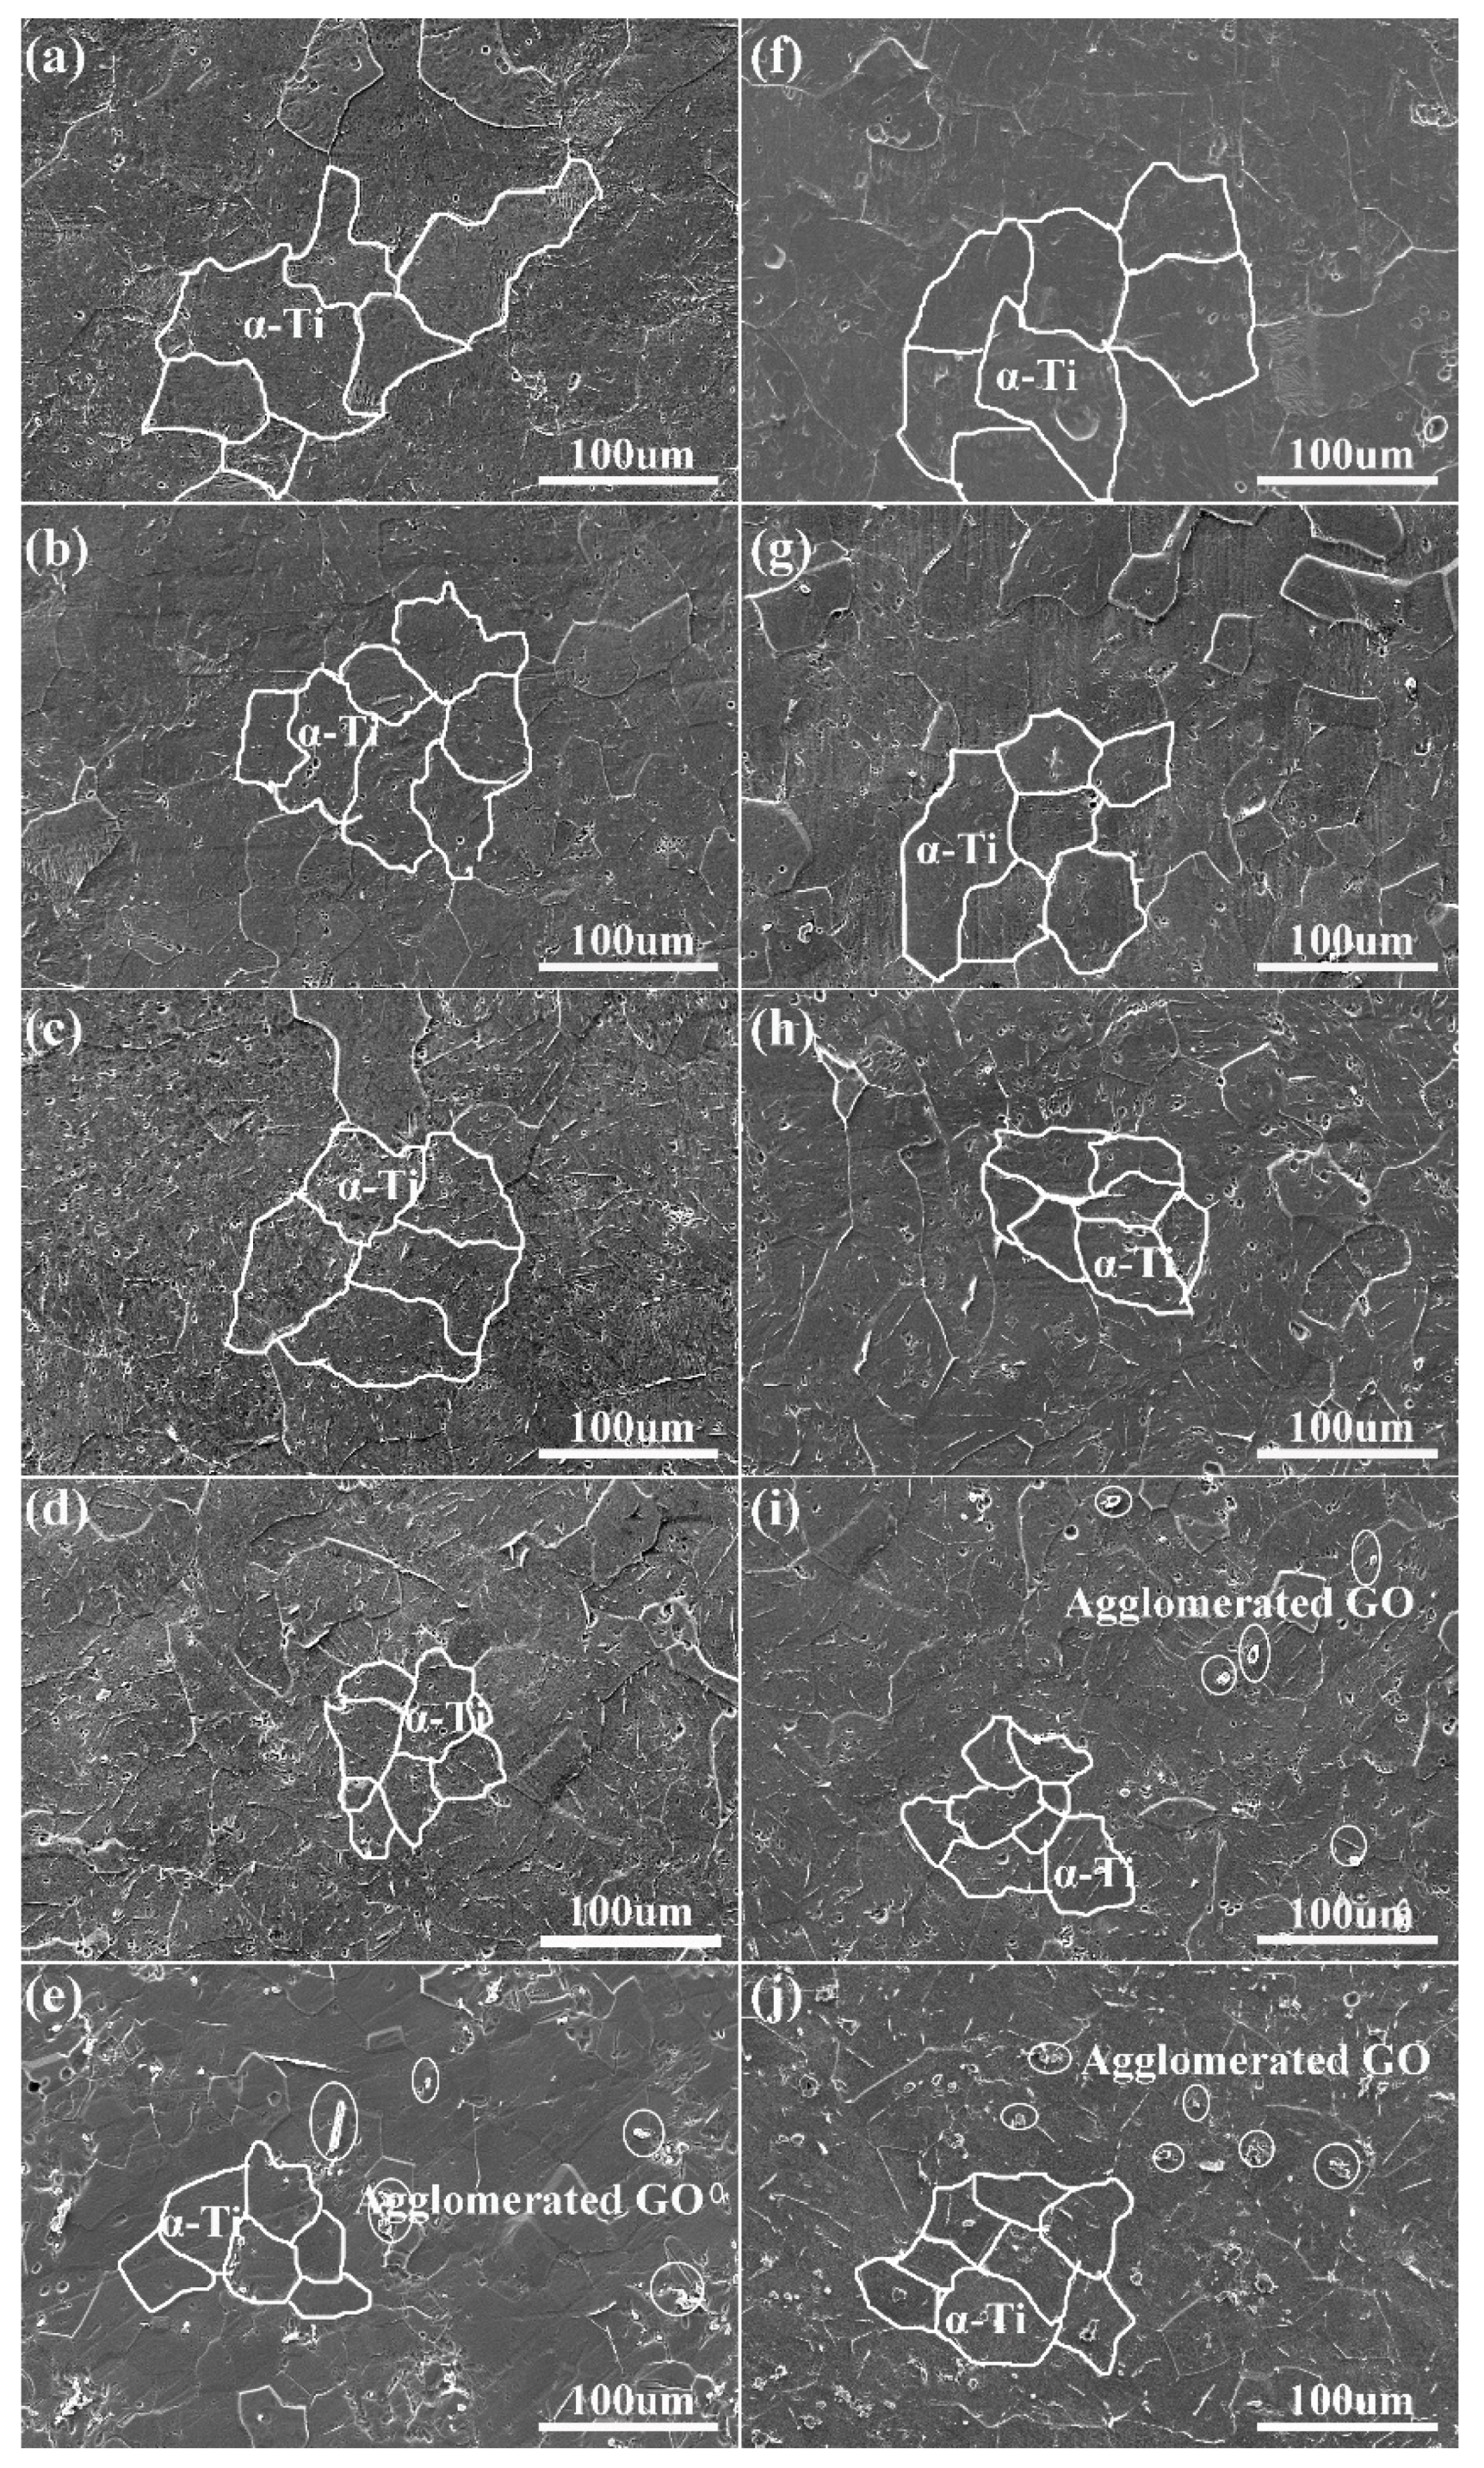
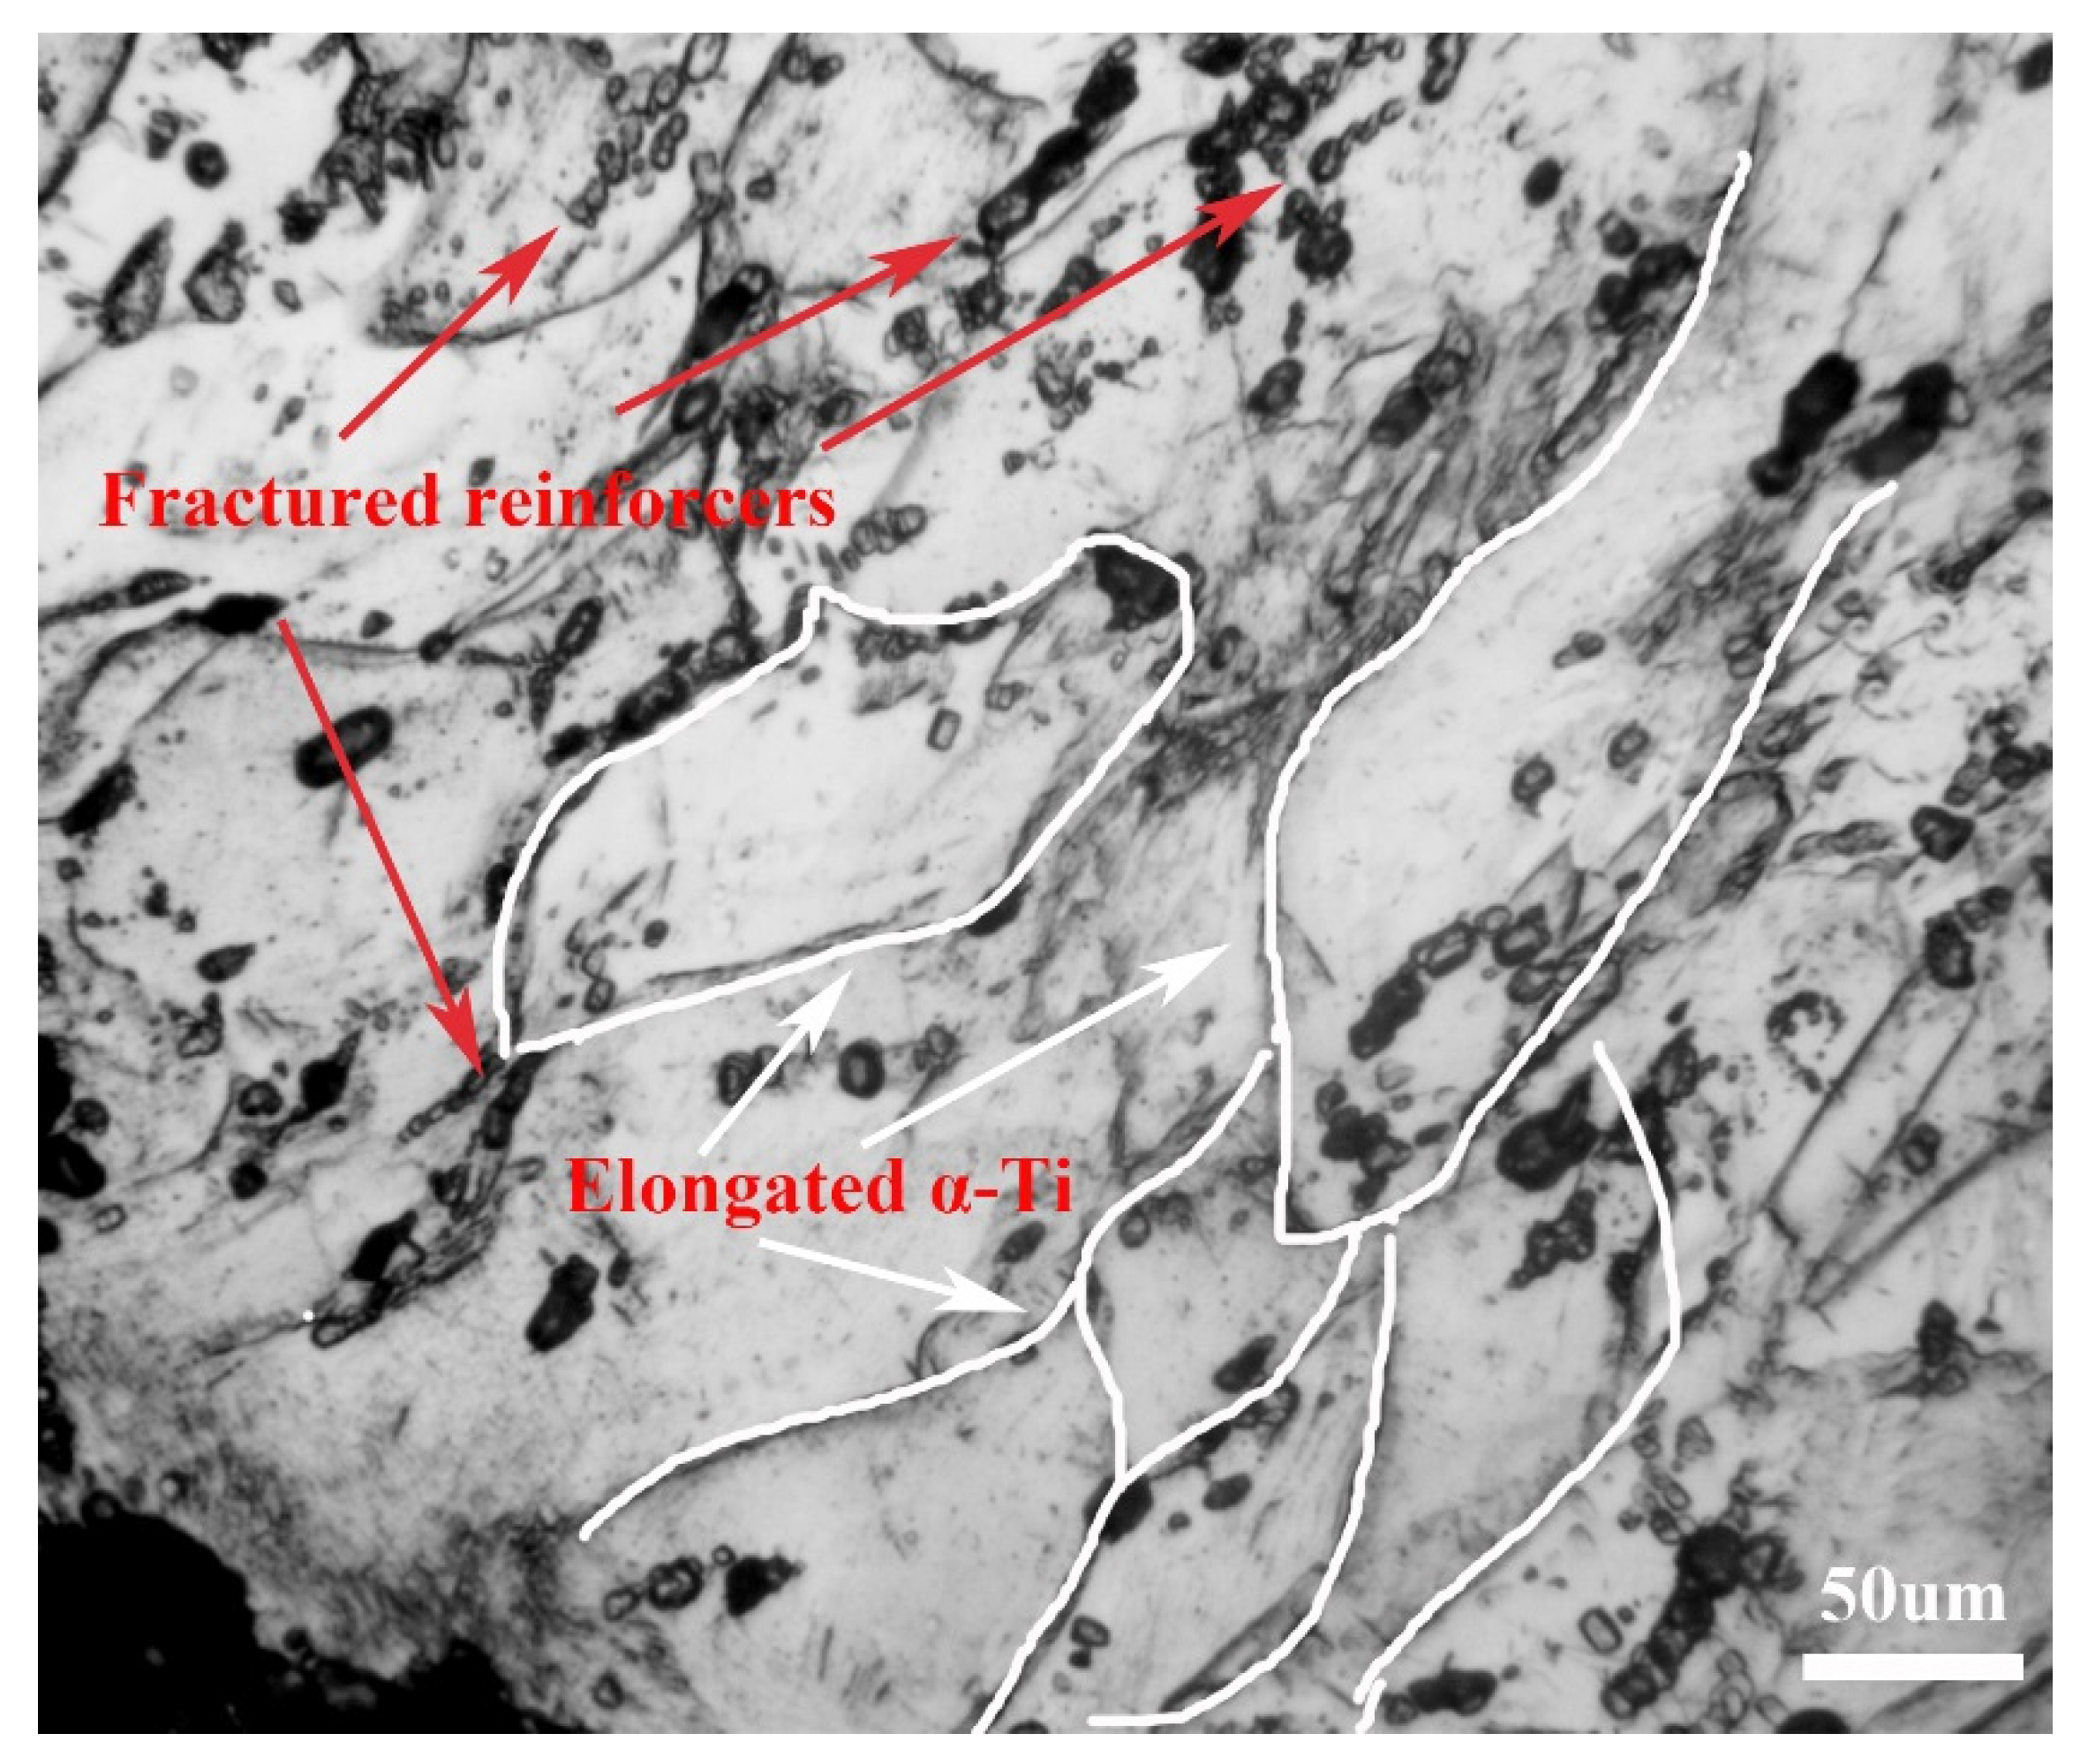
3.2. Microstructure
3.3. Properties Analysis
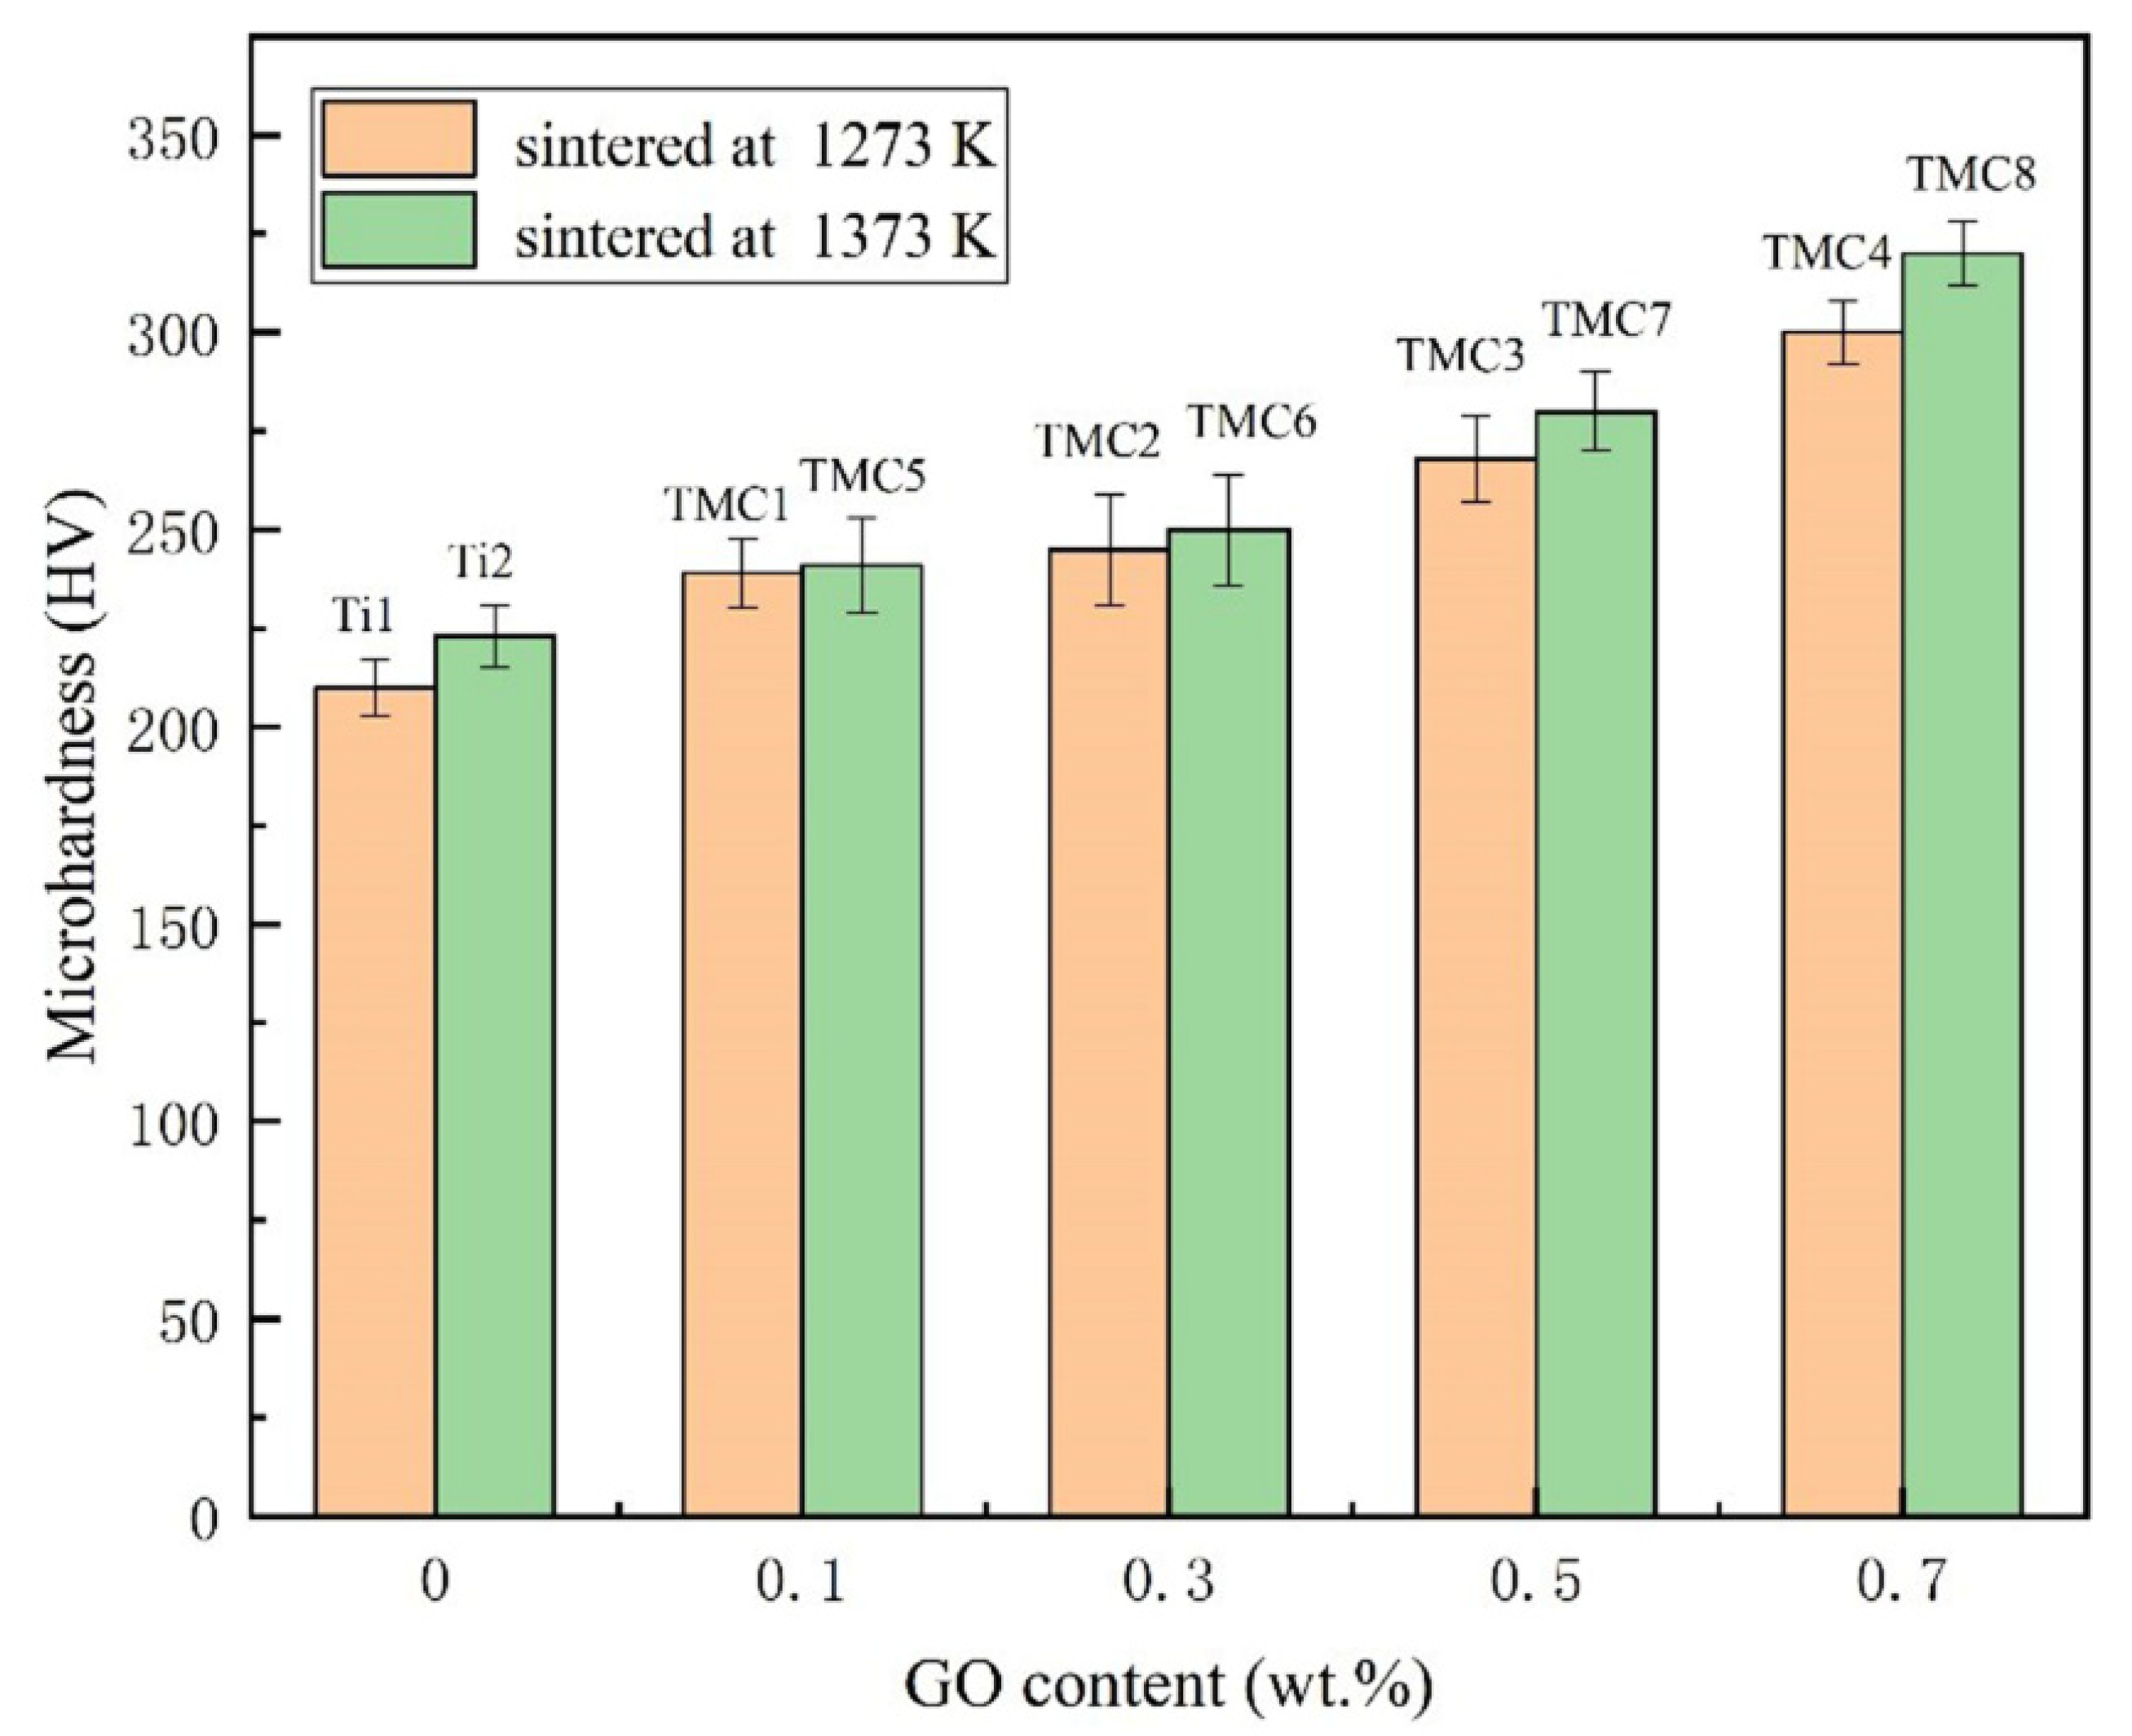
3.3.1. Hardness
3.3.2. Compression Properties
- The reinforcement GO and TiC bear part of the load during the deformation process. The shear hysteresis model is usually used to evaluate the strength of TMCs. The yield strength (σc) can be expressed as [20,33]is the yield strength of Ti matrix, is the fracture strength of reinforcement, Vr is the volume fraction of reinforcement, l is the length of reinforcement, and lc is the critical length of the reinforcement.is the shear strength of Ti matrix. A is the cross-sectional areas of reinforcement, S is Ti-reinforcement interfacial areas. A = wt, S = (w + t) l, w and t is the width and thickness of reinforcement.
- The change of yield stress can be calculated using the Hall–Petch formula [22]:where σy is the yield stress; σ0 is the friction force to be overcome by dislocation motion; k is the constant related to the material, k = 0.68 MPa·m0.5; D is the grain size. The grains of TMCs are smaller than that of pure Ti. The yield stress increases with the average grain sizes decreasing. The yield stress of TMCs are bigger than that of Ti.
3.3.3. Tribological Properties
4. Conclusions
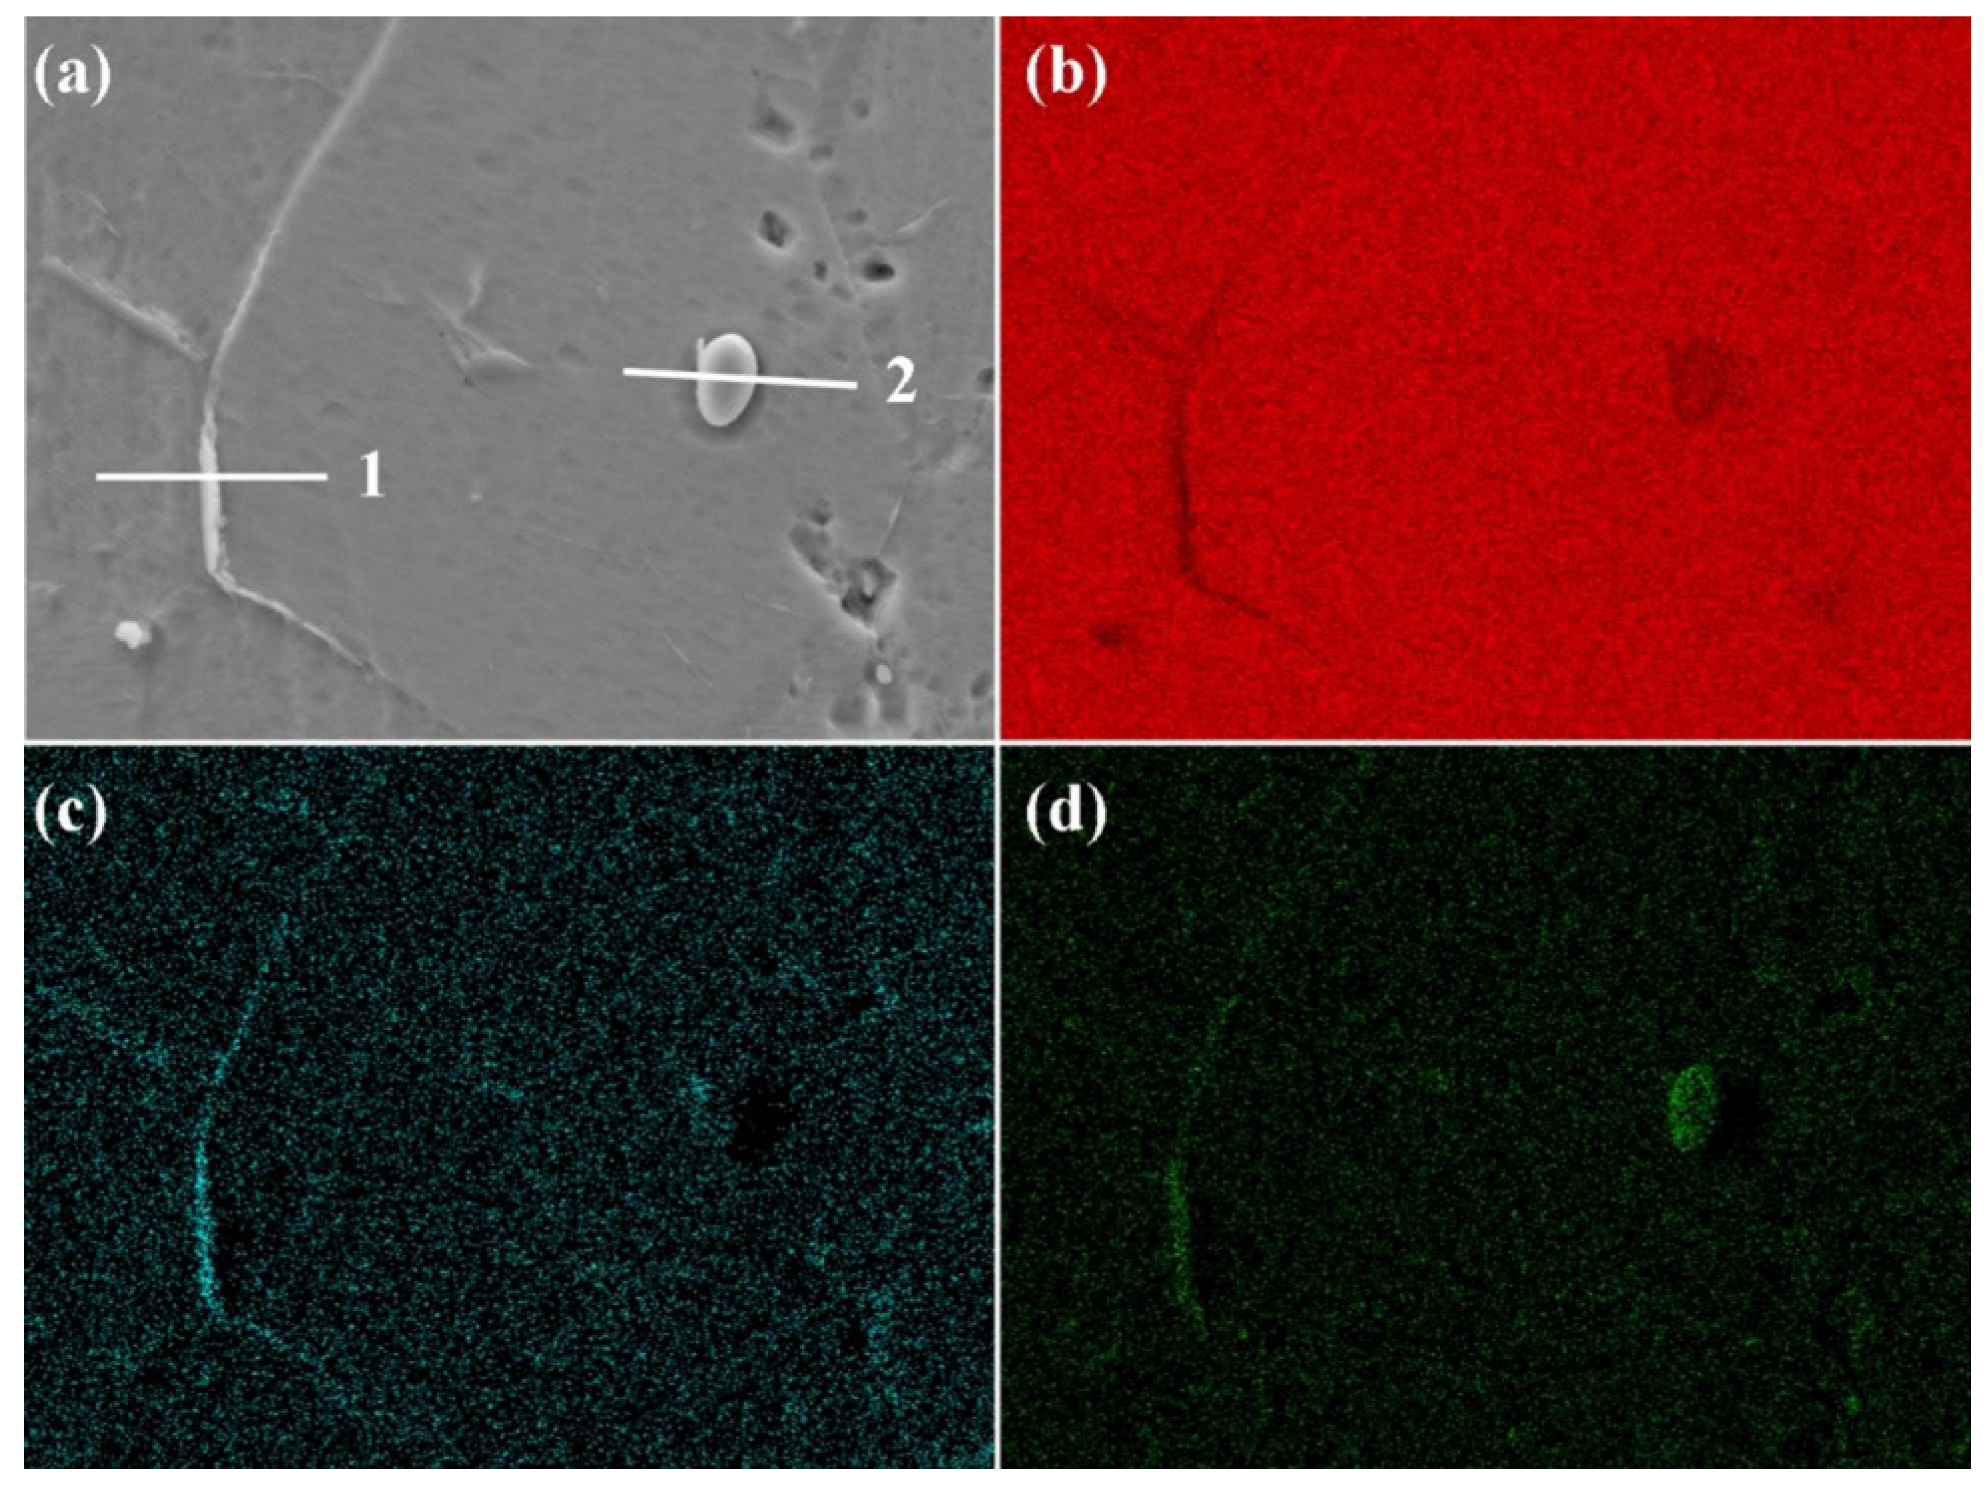
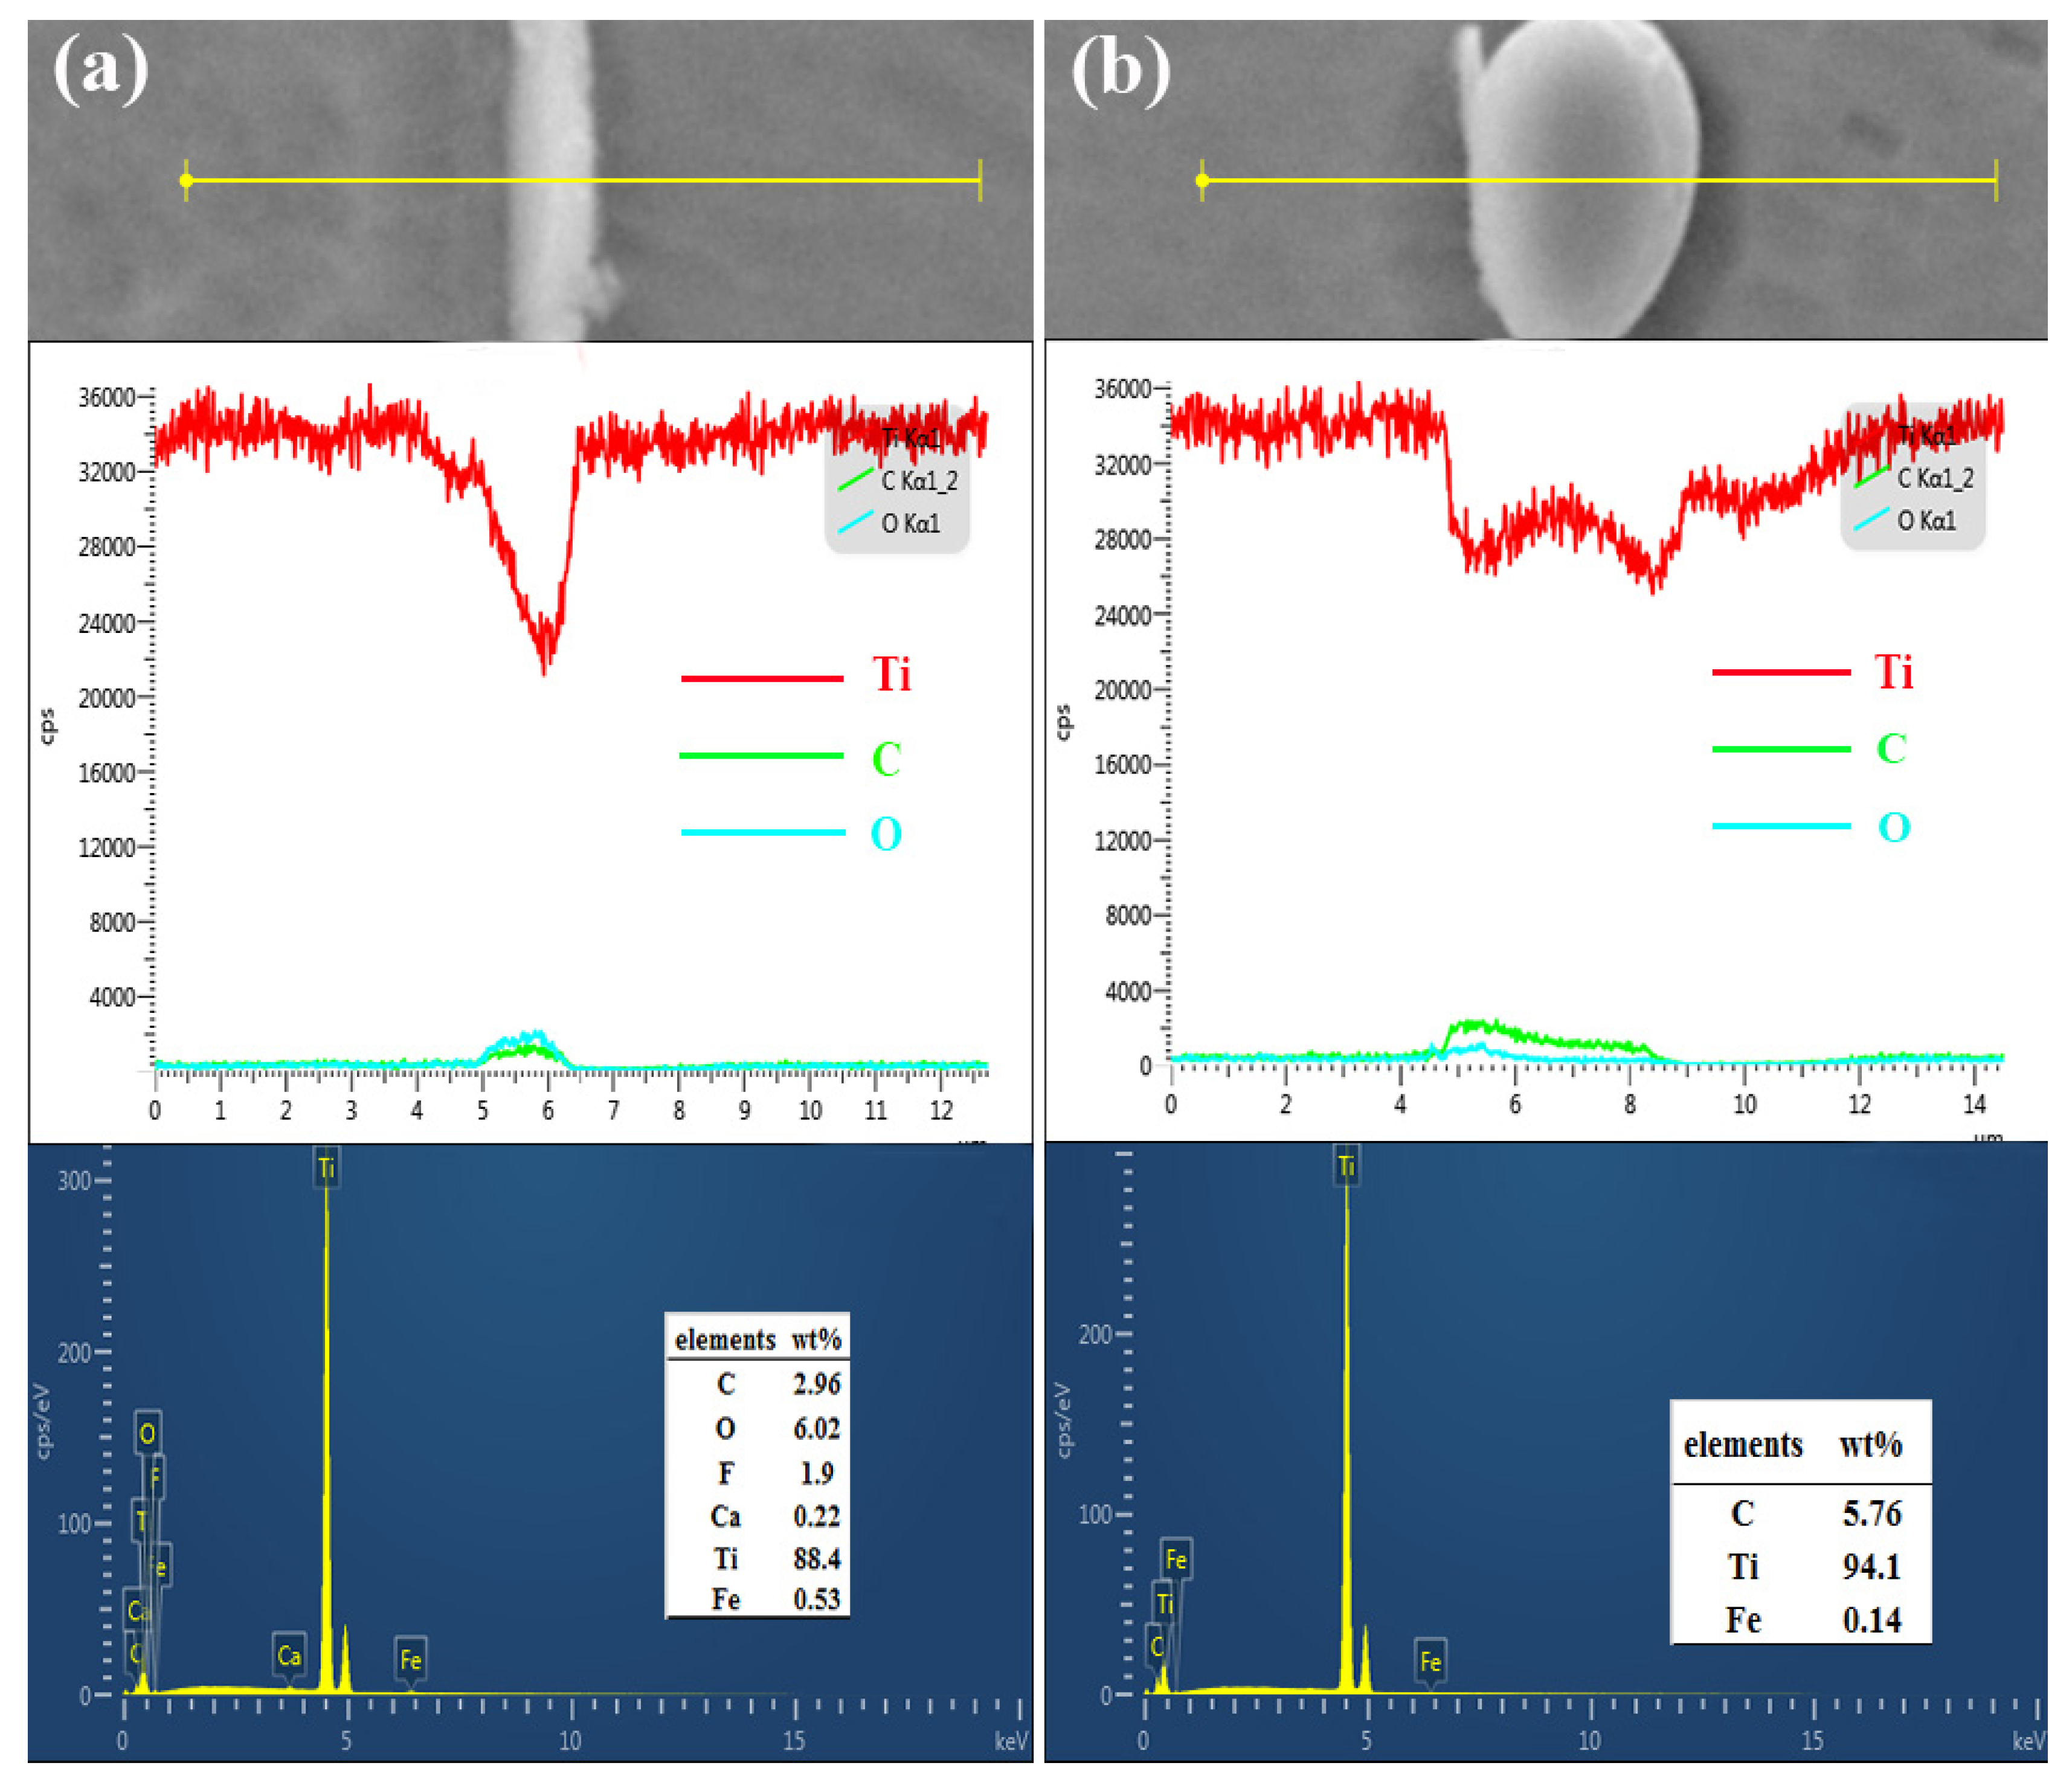
- The microstructure of Ti and TMCs is equiaxed α. The average grain size of TMCs decreases with GO increasing. GO and TiC exists in TMCs simultaneously.
- The hardness of TMCs is higher than that of pure Ti. The hardness of TMCs with 0.7 wt.% GO sintered at 1373 K is the biggest, 320 HV, which is 43% higher than that of pure Ti. The yield strength of 0.5 wt.% GO sintered at 1373 K is 1324 MPa, 77% more than pure Ti. The strengthening mechanism is that reinforcement bears the load from matrix and fine-grain strengthening.
- Compared with pure Ti under the same condition, the friction coefficient of TMCs decreases. The friction coefficient of TMCs containing 0.5 wt.% GO sintered at 1273 K and 0.3 wt.% GO sintered at 1373 K is 0.55 and 0.5, which are 0.27 and 0.2 lower than that of pure Ti. The wear mechanism is abrasive wear, adhesive wear and oxidation wear.
Author Contributions
Funding
Institutional Review Board Statement
Informed Consent Statement
Data Availability Statement
Conflicts of Interest
References
- Hua, K.; Wan, Q.; Zhang, Y.; Kou, H.; Li, J. Crystallography and microstructure of the deformation bands formed in a metastable β titanium alloy during isothermal compression. Mater. Charact. 2021, 176, 111119. [Google Scholar] [CrossRef]
- Lu, H.F.; Wang, Z.; Cai, J.; Xu, X.; Lu, J. Effects of laser shock peening on the hot corrosion behaviour of the selective laser melted Ti6Al4V titanium alloy. Corros. Sci. 2021, 188, 109558. [Google Scholar] [CrossRef]
- Yang, D.; Liu, Y.L.; Xie, F.; Wu, M. Identification and Quantitative Analysis of the Isolated and Adhesive Beta Phases in Titanium Alloy Ti-6Al-4V. Mater. Trans. 2020, 61, 1220–1229. [Google Scholar] [CrossRef]
- Fourest, T.; Bouda, P.; Fletcher, L.C.; Notta-Cuvier, D.; Markiewicz, E.; Pierron, F.; Langrand, B. Image-Based Inertial Impact Test for Characterisation of Strain Rate Dependency of Ti6Al4V Titanium Alloy. Exp. Mech. 2020, 60, 235–248. [Google Scholar] [CrossRef]
- Bansal, P.; Singh, G.; Sidhu, H.S. Plasma-Sprayed HA/Sr Reinforced Coating for Improved Corrosion Resistance and Surface Properties of Ti13Nb13Zr Titanium Alloy for Biomedical Implants. J. Mater. Res. 2021, 36, 431–442. [Google Scholar] [CrossRef]
- Wang, X.; Li, S.; Han, Y.; Huang, G.; Lu, W. Roles of reinforcements in twin nucleation and nano-α precipitation in the hybrid TiB/TiC-reinforced titanium matrix composites during high-temperature fatigue. Scr. Mater. 2021, 196, 113758. [Google Scholar] [CrossRef]
- Mcintyre, D.J.; Hirschman, R.K.; Puchades, I.; Landi, B.J. Enhanced copper–carbon nanotube hybrid conductors with titanium adhesion layer. J. Mater. Sci. 2020, 55, 6610–6622. [Google Scholar] [CrossRef]
- Li, H.; Jia, D.; Yang, Z.; Zhou, Y. Achieving near equiaxed α-Ti grains and significantly improved plasticity via heat treatment of TiB reinforced titanium matrix composite manufactured by selective laser melting. J. Alloys Compd. 2020, 836, 155344. [Google Scholar] [CrossRef]
- Li, A.; Shi, L.; Zhang, W.; Zhou, S.Q.; Sun, Y.J.; Ma, S.; Liu, M.B.; Sun, Y. A simple way to fabricate Ti6Al4V matrix composites reinforced by graphene with exceptional mechanical properties. Mater. Lett. 2019, 257, 126750. [Google Scholar] [CrossRef]
- Hu, C.L.; Sun, R.L. Microstructure of B4C/TiC/TiB2 reinforced surface titanium matrix composite produced by laser cladding. IOP Conf. Ser. Mater. Sci. Eng. 2020, 770, 012003. [Google Scholar] [CrossRef]
- Ying, W.; Peng, X.S. Graphene oxide nanoslit-confined AgBF4/ionic liquid for efficiently separating olefin from paraffin. Nanotechnology 2020, 31, 085703. [Google Scholar] [CrossRef]
- Yao, W.; Tang, L.L.; Nong, J.P.; Wang, J.; Yang, J.; Jiang, Y.D.; Shi, H.F.; Wei, X.Z. Electrically tunable graphene metamaterial with strong broadband absorption. Nanotechnology 2021, 32, 075703. [Google Scholar] [CrossRef] [PubMed]
- Wang, F.Z.; Cai, X.X. Improvement of mechanical properties and thermal conductivity of carbon fiber laminated composites through depositing graphene nanoplatelets on fibers. J. Mater. Sci. 2019, 54, 3847–3862. [Google Scholar] [CrossRef]
- Kumar, S.; Singh, K.K.; Ramkumar, J. Comparative study of the influence of graphene nanoplatelets filler on the mechanical and tribological behavior of glass fabric-reinforced epoxy composites. Polym. Compos. 2020, 41, 5403–5417. [Google Scholar] [CrossRef]
- Xavior, M.A.; Kumar, H.P. Processing and Characterization Techniques of Graphene Reinforced Metal Matrix Composites (GRMMC); A Review. Mater. Today Proc. 2017, 4, 3334–3341. [Google Scholar] [CrossRef]
- Rashad, M.; Pan, F.S.; Asif, M.; Tang, A.T. Powder metallurgy of Mg–1%Al–1%Sn alloy reinforced with low content of graphene nanoplatelets (GNPs). J. Ind. Eng. Chem. 2014, 20, 4250–4255. [Google Scholar] [CrossRef]
- Zhou, W.; Mikulova, P.; Fan, Y.C.; Kikuchi, K.; Nomura, N.; Kawasaki], A. Interfacial reaction induced efficient load transfer in few-layer graphene reinforced Al matrix composites for high-performance conductor. Compos. Part B 2019, 179, 107463. [Google Scholar] [CrossRef]
- Han, X.Q.; Yang, L.Z.; Zhao, N.Q.; He, C.N. Copper-Coated Graphene Nanoplatelets-Reinforced Al–Si Alloy Matrix Composites Fabricated by Stir Casting Method. Acta Metall. Sin. 2020, 34, 111–124. [Google Scholar] [CrossRef]
- Ali, S.; Ahmad, F.; Yusoff, P.S.M.M.; Muhamad, N.; Qnate, E.; Raza, M.R.; Malik, K. A review of graphene reinforced Cu matrix composites for thermal management of smart electronics. Compos. Part A 2021, 144, 106357. [Google Scholar] [CrossRef]
- Shin, S.E.; Choi, H.J.; Shin, J.H.; Bae, D.H. Strengthening behavior of few-layered graphene/aluminum composites. Carbon 2015, 82, 143–151. [Google Scholar] [CrossRef]
- Chen, F.Y.; Ying, J.M.; Wang, Y.F.; Du, S.Y.; Liu, Z.P.; Huang, Q. Effects of graphene content on the microstructure and properties of copper matrix composites. Carbon 2016, 96, 836–842. [Google Scholar] [CrossRef]
- Liu, J.H.; Khan, U.; Coleman, J.; Fernandez, B.; Rodriguez, P.; Naher, S.; Brabazon, D. Graphene oxide and graphene nanosheet reinforced aluminium matrix composites: Powder synthesis and prepared composite characteristics. Mater. Des. 2016, 94, 87–94. [Google Scholar] [CrossRef] [Green Version]
- Shuai, C.J.; Wang, B.; Yang, Y.W.; Peng, S.P.; Gao, C.D. 3D honeycomb nanostructure-encapsulated magnesium alloys with superior corrosion resistance and mechanical properties. Compos. Part B 2019, 162, 611–620. [Google Scholar] [CrossRef]
- Mu, X.N.; Zhang, H.M.; Cai, H.N.; Fan, Q.B.; Zhang, Z.H.; Wu, Y.; Fu, Z.J.; Yu, D.H. Microstructure evolution and superior tensile properties of low content graphene nanoplatelets reinforced pure Ti matrix composites. Mater. Sci. Eng. A 2017, 687, 164–174. [Google Scholar] [CrossRef]
- Cao, Z.; Li, J.L.; Zhang, H.P.; Li, W.B.; Wang, X.D. Mechanical and tribological properties of graphene nanoplatelets-reinforced titanium composites fabricated by powder. J. Iron Steel Res. Int. 2020, 21, 1357–1362. [Google Scholar] [CrossRef]
- Dong, L.L.; Xiao, B.; Jin, L.H.; Lu, J.W.; Liu, Y.; Fu, Y.Q.; Zhao, Y.Q.; Wu, G.H.; Zhang, Y.S. Mechanisms of simultaneously enhanced strength and ductility of titanium matrix composites reinforced with nanosheets of graphene oxides. Ceram. Int. 2019, 45, 19370–19379. [Google Scholar] [CrossRef]
- Cao, H.C.; Liang, Y.L. The microstructures and mechanical properties of graphene-reinforced titanium matrix composites. J. Alloys Compd. 2020, 812, 152057. [Google Scholar] [CrossRef]
- Liu, J.; Wu, M.X.; Yang, Y.; Yang, G.; Yan, H.X.; Jiang, K.L. Preparation and mechanical performance of graphene platelet reinforced titanium nanocomposites for high temperature applications. J. Alloys Compd. 2018, 765, 1111–1118. [Google Scholar] [CrossRef]
- Dong, L.L.; Xiao, B.; Liu, Y.; Li, Y.L.; Fu, Y.Q.; Zhao, Y.Q.; Zhang, Y.S. Sintering effect on microstructural evolution and mechanical properties of spark plasma sintered Ti matrix composites reinforced by reduced graphene oxides. Ceram. Int. 2018, 44, 17835–17844. [Google Scholar] [CrossRef]
- Chen, H.; Mi, G.B.; Li, P.J.; Huang, X.; Cao, C.X. Microstructure and Tensile Properties of Graphene-Oxide-Reinforced High-Temperature Titanium-Alloy-Matrix Composites. Materials 2020, 13, 3358. [Google Scholar] [CrossRef]
- Haghighi, M.; Shaeri, M.H.; Sedghi, A.; Djavanroodi, F. Effect of Graphene Nanosheets Content on Microstructure and Mechanical Properties of Titanium Matrix Composite Produced by Cold Pressing and Sintering. Nanomaterials 2018, 8, 1024. [Google Scholar] [CrossRef] [PubMed] [Green Version]
- Liu, J.Q.; Hu, N.; Liu, X.Y.; Liu, Y.L.; Lv, X.W.; Wei, L.X.; Zheng, S.T. Microstructure and Mechanical Properties of Graphene Oxide-Reinforced Titanium Matrix Composites Synthesized by Hot-Pressed Sintering. Nanoscale Res. Lett. 2019, 14, 114. [Google Scholar] [CrossRef] [PubMed]
- Mu, X.N.; Cai, H.N.; Zhang, H.M.; Fan, Q.B.; Wang, F.C.; Cheng, X.W.; Zhang, Z.H.; Li, J.B.; Jiao, X.L.; Ge, Y.X.; et al. Size effect of flake Ti powders on the mechanical properties in graphene nanoflakes/Ti fabricated by flake powder metallurgy. Compos. Part A 2019, 123, 86–96. [Google Scholar] [CrossRef]


| Materials | GO Content (wt.%) | Sintering Temperature (K) |
|---|---|---|
| Ti1 | 0 | 1273 |
| TMC1 | 0.1 | 1273 |
| TMC2 | 0.3 | 1273 |
| TMC3 | 0.5 | 1273 |
| TMC4 | 0.7 | 1273 |
| Ti2 | 0 | 1373 |
| TMC5 | 0.1 | 1373 |
| TMC6 | 0.3 | 1373 |
| TMC7 | 0.5 | 1373 |
| TMC8 | 0.7 | 1373 |
| Materials | Average Grain Size ( m) | Materials | Average Grain Size ( m) |
|---|---|---|---|
| Ti1 | Ti2 | ||
| TMC1 | TMC5 | ||
| TMC2 | TMC6 | ||
| TMC3 | TMC7 | ||
| TMC4 | TMC8 |
| Materials | Hardness/HV | Materials | Hardness/HV |
|---|---|---|---|
| Ti1 | Ti2 | ||
| TMC1 | TMC5 | ||
| TMC2 | TMC6 | ||
| TMC3 | TMC7 | ||
| TMC4 | TMC8 |
| Materials | Yield Strength/MPa | Materials | Yield Strength/MPa |
|---|---|---|---|
| Ti1 | 3 | Ti2 | 5 |
| TMC1 | 5 | TMC5 | 7 |
| TMC2 | 6 | TMC6 | 8 |
| TMC3 | 4 | TMC7 | 6 |
| TMC4 | 7 | TMC8 | 9 |
| Materials | Friction Coefficient | Materials | Friction Coefficient |
|---|---|---|---|
| Ti1 | Ti2 | ||
| TMC1 | TMC5 | ||
| TMC2 | TMC6 | ||
| TMC3 | TMC7 | ||
| TMC4 | TMC8 |
Publisher’s Note: MDPI stays neutral with regard to jurisdictional claims in published maps and institutional affiliations. |
© 2022 by the authors. Licensee MDPI, Basel, Switzerland. This article is an open access article distributed under the terms and conditions of the Creative Commons Attribution (CC BY) license (https://creativecommons.org/licenses/by/4.0/).
Share and Cite
Wan, Z.; Li, J.; Yang, D.; Hou, S. Microstructural and Mechanical Properties Characterization of Graphene Oxide-Reinforced Ti-Matrix Composites. Coatings 2022, 12, 120. https://doi.org/10.3390/coatings12020120
Wan Z, Li J, Yang D, Hou S. Microstructural and Mechanical Properties Characterization of Graphene Oxide-Reinforced Ti-Matrix Composites. Coatings. 2022; 12(2):120. https://doi.org/10.3390/coatings12020120
Chicago/Turabian StyleWan, Zhaomei, Jiuxiao Li, Dongye Yang, and Shuluo Hou. 2022. "Microstructural and Mechanical Properties Characterization of Graphene Oxide-Reinforced Ti-Matrix Composites" Coatings 12, no. 2: 120. https://doi.org/10.3390/coatings12020120
APA StyleWan, Z., Li, J., Yang, D., & Hou, S. (2022). Microstructural and Mechanical Properties Characterization of Graphene Oxide-Reinforced Ti-Matrix Composites. Coatings, 12(2), 120. https://doi.org/10.3390/coatings12020120