Article

Green Nanocomposite for the Adsorption of Toxic Dyes Removal from Colored Waters

1
Nano and Biomaterials Lab., Department of Chemistry, University of Agriculture, Faisalabad 38040, Pakistan
2
Institute of Nanoscience and Nanotechnology (ION2), Universiti Putra Malaysia, Serdang 43400, Selangor, Malaysia
3
Chemistry Department, College of Science, King Saud University, Riyadh 1145, Saudi Arabia
4
Department of Applied Biosciences, Kyungpook National University, Daegu 41566, Republic of Korea
*
Author to whom correspondence should be addressed.
Coatings 2022, 12(12), 1955; https://doi.org/10.3390/coatings12121955
Submission received: 10 November 2022 / Revised: 9 December 2022 / Accepted: 9 December 2022 / Published: 13 December 2022
(This article belongs to the Special Issue Adsorption Performance of Hybrid Materials and Composites)

Abstract

:
The discharge of dyes from textile industries led to a broad range of toxicological and environmental effects, posing severe health issues for humans and animals worldwide. These dyes are highly stable and, if not adequately treated, remain in the environment for extended periods. Adsorption, the most efficient and cost-effective method, offers unique advantages for using natural adsorbents, such as marble waste composites, for dye removal. The easy availability of marble waste, its low cost, its eco-friendly nature, its ease of operation, its simplicity of design, its flexibility, and its great affinity for dyes make it a suitable option for dye removal. Golden marble waste nanocomposites are prepared for dye removal. The results from the studies suggested that treated golden marble composite materials exhibit better adsorption efficiency (224.8, 299.5, and 369.2 mg/g) for adsorptive removal of dyes than untreated golden marble composite materials (114.4 mg/g). This research also used isothermic and kinetic models to evaluate the effects of numerous parameters, for example, the initial dye concentration, pH, time, temperature, and adsorbent dose. The highest removal of 369.9 mg/g was achieved during the present study for blue dye at an optimized pH of 7 and a temperature of 30 °C. It was observed that golden marble waste composites gave better R2 (0.99) values for second-order kinetics in the kinetic model. Results obtained from comparing Langmuir, Freundlich, Temkin, Dubinin, and Herkin Jura isotherms showed that the R2 values of the Langmuir isotherm for Foron red (0.97), the Temkin isotherm for Foron blue (0.98), and the Freundlich isotherm for Foron black dye (0.97) fit on adsorption for both treated and untreated composites. Characterization techniques, such as scanning electron microscopy (SEM) and Fourier transform infrared spectroscopy (FTIR), are also discussed for the structural determination of golden marble waste composites.

1. Introduction

There has been a tremendous increase in wastewater production in the last few decades because of the growing pace of industrialization. It is one of the world’s most severe issues today, owing to various industries [1]. The release of harmful chemicals has caused severe health and environmental issues. Industrial wastewater contains a wide range of toxins, including dyes and pollutants of both organic and inorganic origins. Heavy metals, hydrocarbons, microbes, endocrine disruptors, and nutrients (nitrogen and phosphorus) are the primary contaminants in wastewater. These contaminants and organic matter make it suitable for the growth of pathogenic organisms, such as bacteria, viruses, and fungi. These organisms are responsible for various waterborne diseases [2]. Moreover, most of the dyes in this wastewater are carcinogenic and toxic [3]. Water pollution also negatively impacts aquatic ecosystems, as the amount of sunlight penetrating the water is considerably reduced. Consequently, gas solubility and photosynthetic activities are decreased [4].
Water toxicity is due to various sources, including households and agricultural wastes, but the most significant source is water from industries [5]. Among major industries, the textile industry is responsible for the maximum discharge of dyes into the environment. Moreover, cosmetic production, the printing industry, and plastic manufacturing all significantly use dye as a vital ingredient in their manufacturing [6]. The textile industry is one of the oldest industries, and with the increasing demand for textile products, the discharge of harmful effluents from these industries has been increasing daily. This tremendous increase in wastewater pollutants may cause health and environmental problems. Among these pollutants, dyes have gained significant importance and are known for their adverse effects worldwide. The environmental issues related to these textile industries are primarily associated with toxic chemicals used during processing and untreated effluents discharged into water bodies.
Dyes are very stable, as they can last in the air for a long time if they are not adequately treated [7]. When discharged directly into water bodies, such as canals and rivers, these effluents pollute the aquatic environment and adversely affect flora and fauna [8]. When exposed now to these dyes, organisms can show chronic or acute effects, depending upon dye concentration and exposure time. The most complicated side effect of polluted water is the depletion of dissolved oxygen, which is highly important for the aquatic ecosystem. This also limits the self-purification potential of water. In addition to these issues caused during the dyeing process, industries also produce many effluents. These pollutants are a complex mixture of toxins, ranging from original colors (lost during dyeing) to heavy metals and pesticides. As environmental pollutants are not properly treated, they can seriously contaminate the environment and water sources [9].
Adsorption has been recognized as one of the most effective options for the decontamination of water from heavy metals, dyes, and organic compounds. It is preferred over other techniques because of its insensitivity to contaminants and water reuse terms [10]. In recent years, much research has been carried out to observe the removal efficiency of different nanoadsorbents. Different types of nanoadsorbents have been applied [11]. Nanostructured adsorbents have significantly higher efficiencies and faster adsorption rates than conventional materials because of their large surface area. For potential applications in the detoxification of drinking water, industrial effluents, surface and ground water, low-cost, environmentally friendly, and efficient nanomaterials with distinct functionalities have been suggested. The most efficient and ideal adsorbent for wastewater treatment should have high selectivity, mainly for contaminants found in low concentrations in water. Moreover, these adsorbents should be environmentally benign and demonstrate a high adsorption capacity. The pollutants that are adsorbed on its surface should be easily removed and recyclable [12].
The treatment of wastewater using indigenous rocks and different waste materials, such as marble, limestone, shell, granite, mineral zeolite, refuse concrete, refuse cement, and charcoal, has been studied [13]. According to a study, marble powder is an attractive option for dye removal from wastewater. Marble powder shows higher adsorption efficiency due to micro- and macrospores, resulting in longer contact time between dye and adsorbent [14]. Marble dust, a low-cost sorbent, is commonly available worldwide [15]. The chemical name of marble is calcium carbonate. Adsorption is the fundamental mechanism for the processing of dyeing water. Several disperse dyes, such as Foron black (FBL), Foron red (FR), Foron turquoise (FT), Foron violet (FV), and Foron brown (FB), have been used in the different studies, but there is limited literature on the decolorization of Foron dyes. Foron class of dyes usually require 1–2 h for complete color removal [16].
Marble is preferred over other adsorbents in wastewater treatment due to its suitability and cost-effectiveness. Several studies have shown that marble is a promising adsorbent for dye removal. The attractive properties of marble include its cost-effectiveness and environmental friendliness. Compared to activated carbon, the dye removal rate with marble is faster, which is one of the critical requirements for the practical application of this treatment approach [15]. Marble is a metamorphic rock created from limestone that has been subjected to extreme heat and pressure deep inside the Earth’s crust. Limestone is a sedimentary rock composed of sea corals and animal skeletons from the sea. Calcite is a mineral that is required for the formation of limestone. These calcite crystals melt and recrystallize into larger, coarser crystals that interlock and form the carbonate rock known as marble. Contamination-free limestone yields shining, clean marble [17].
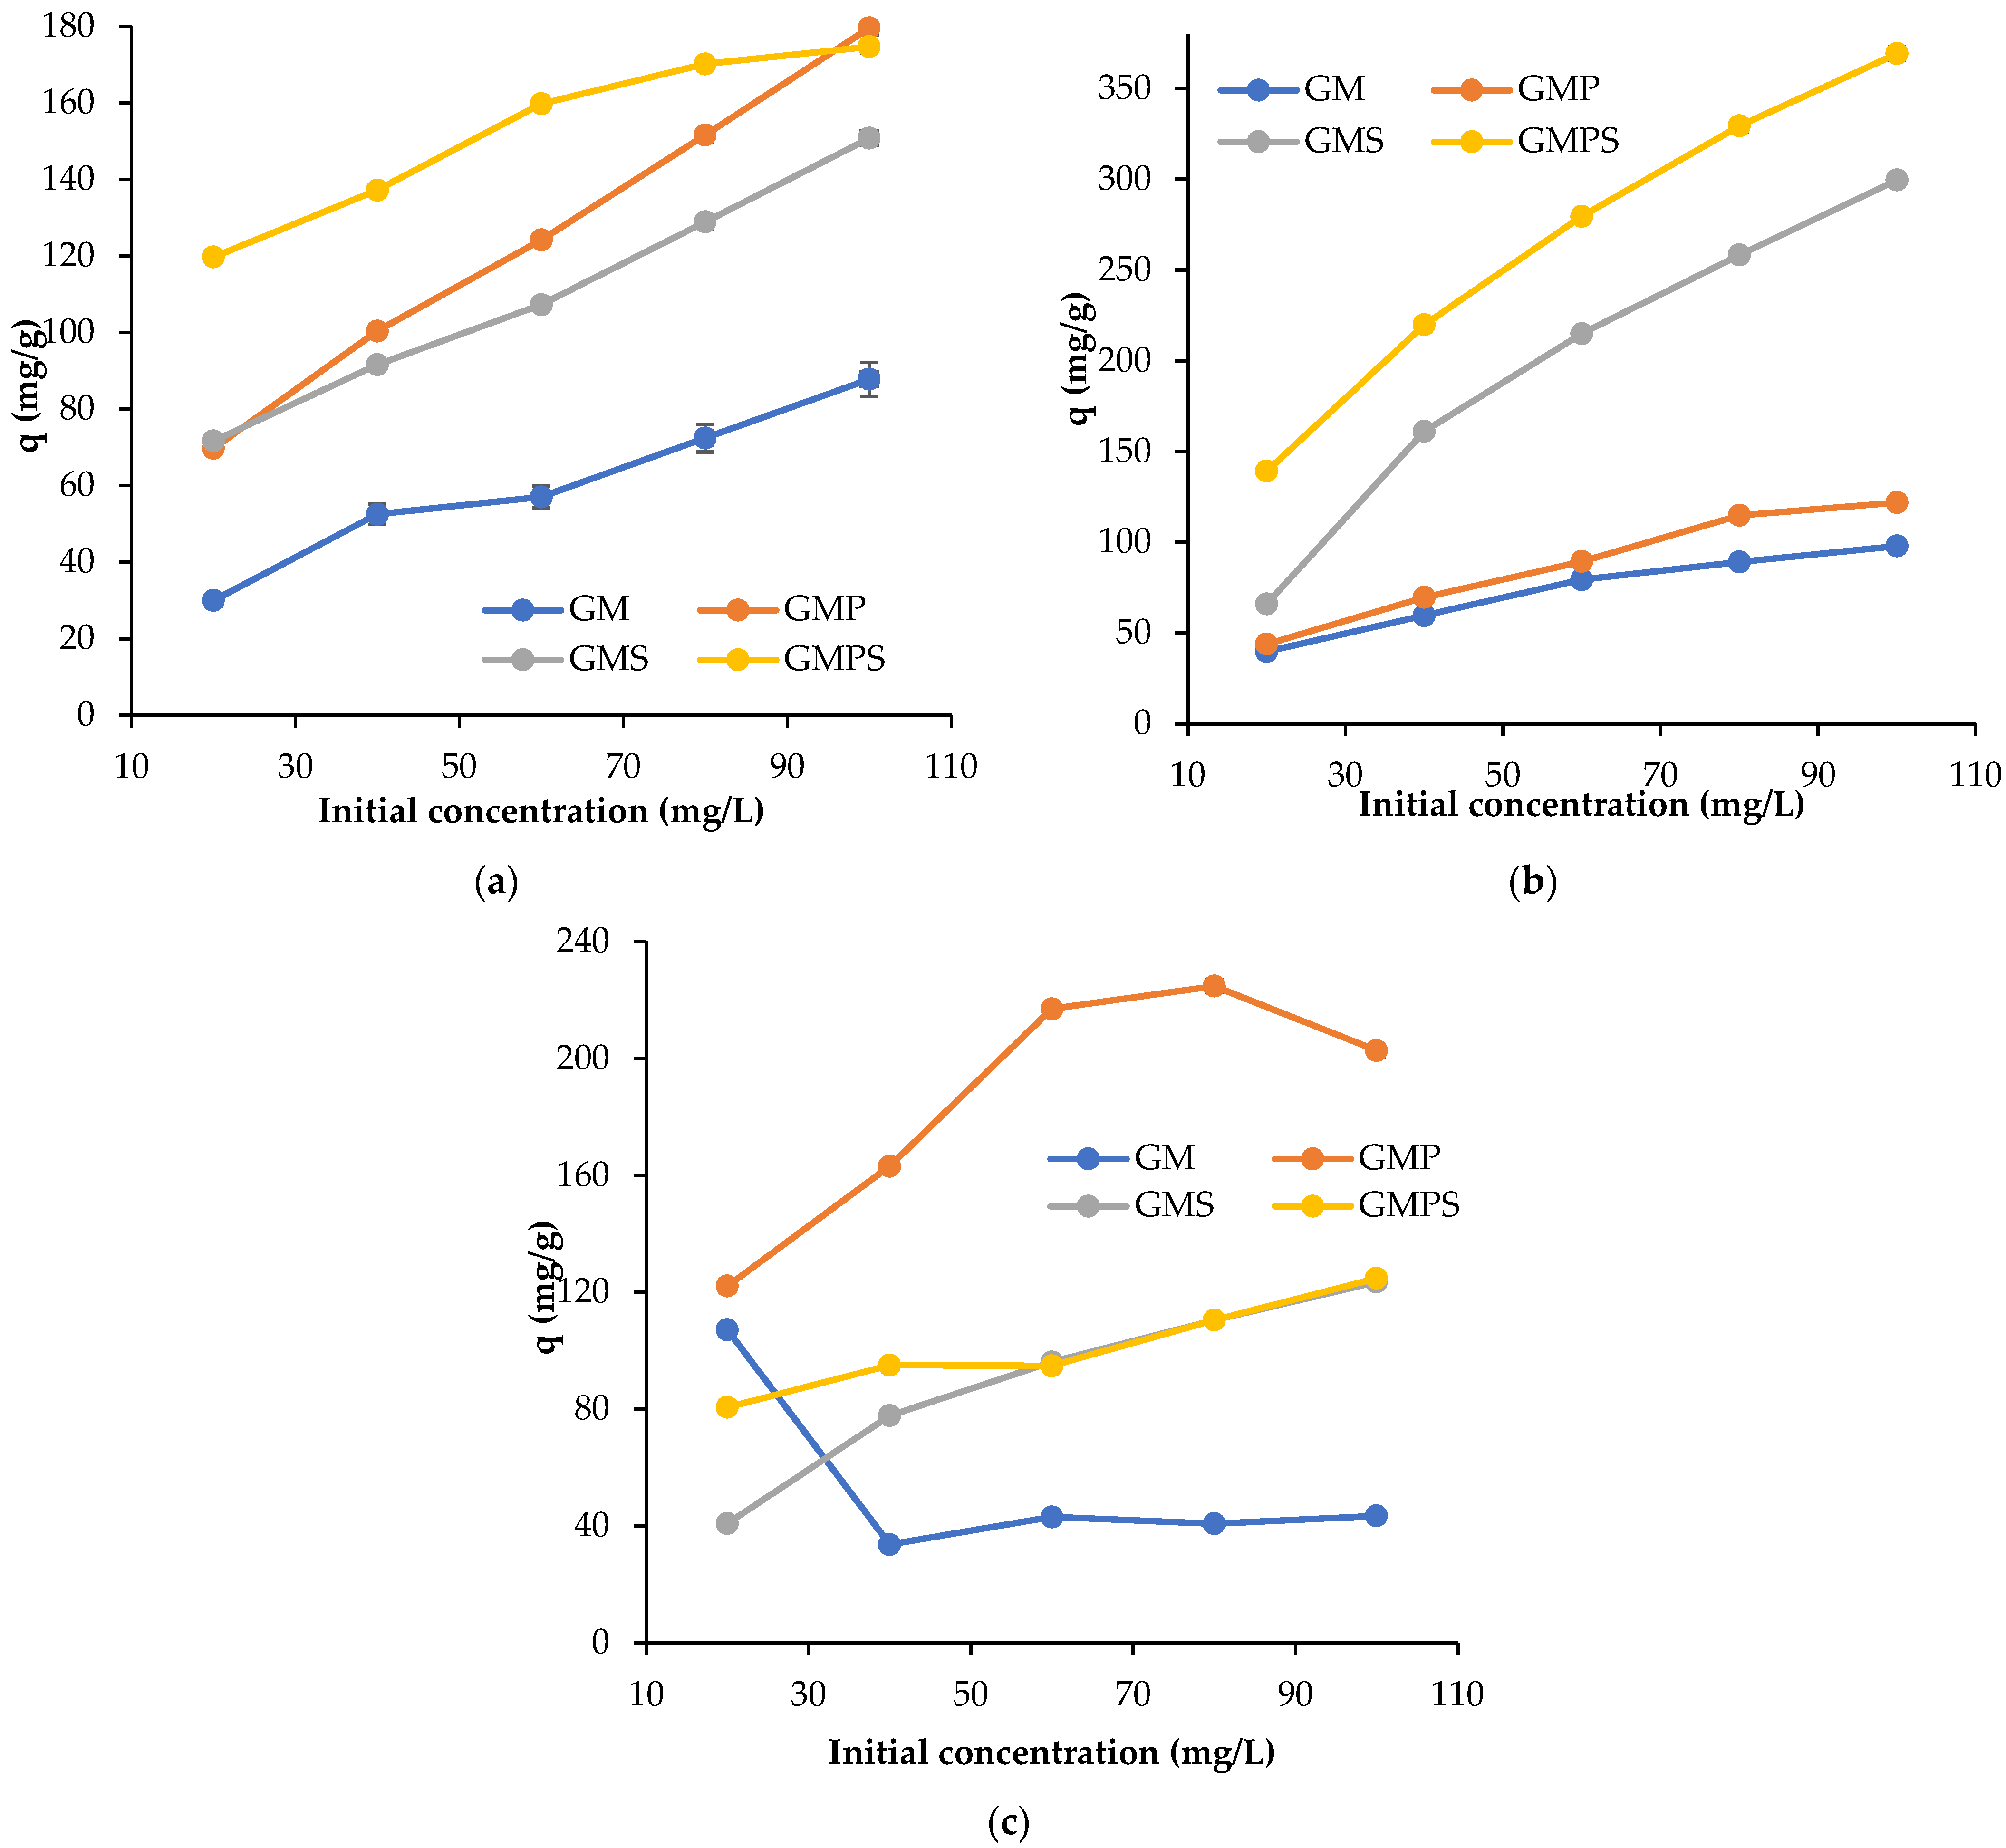
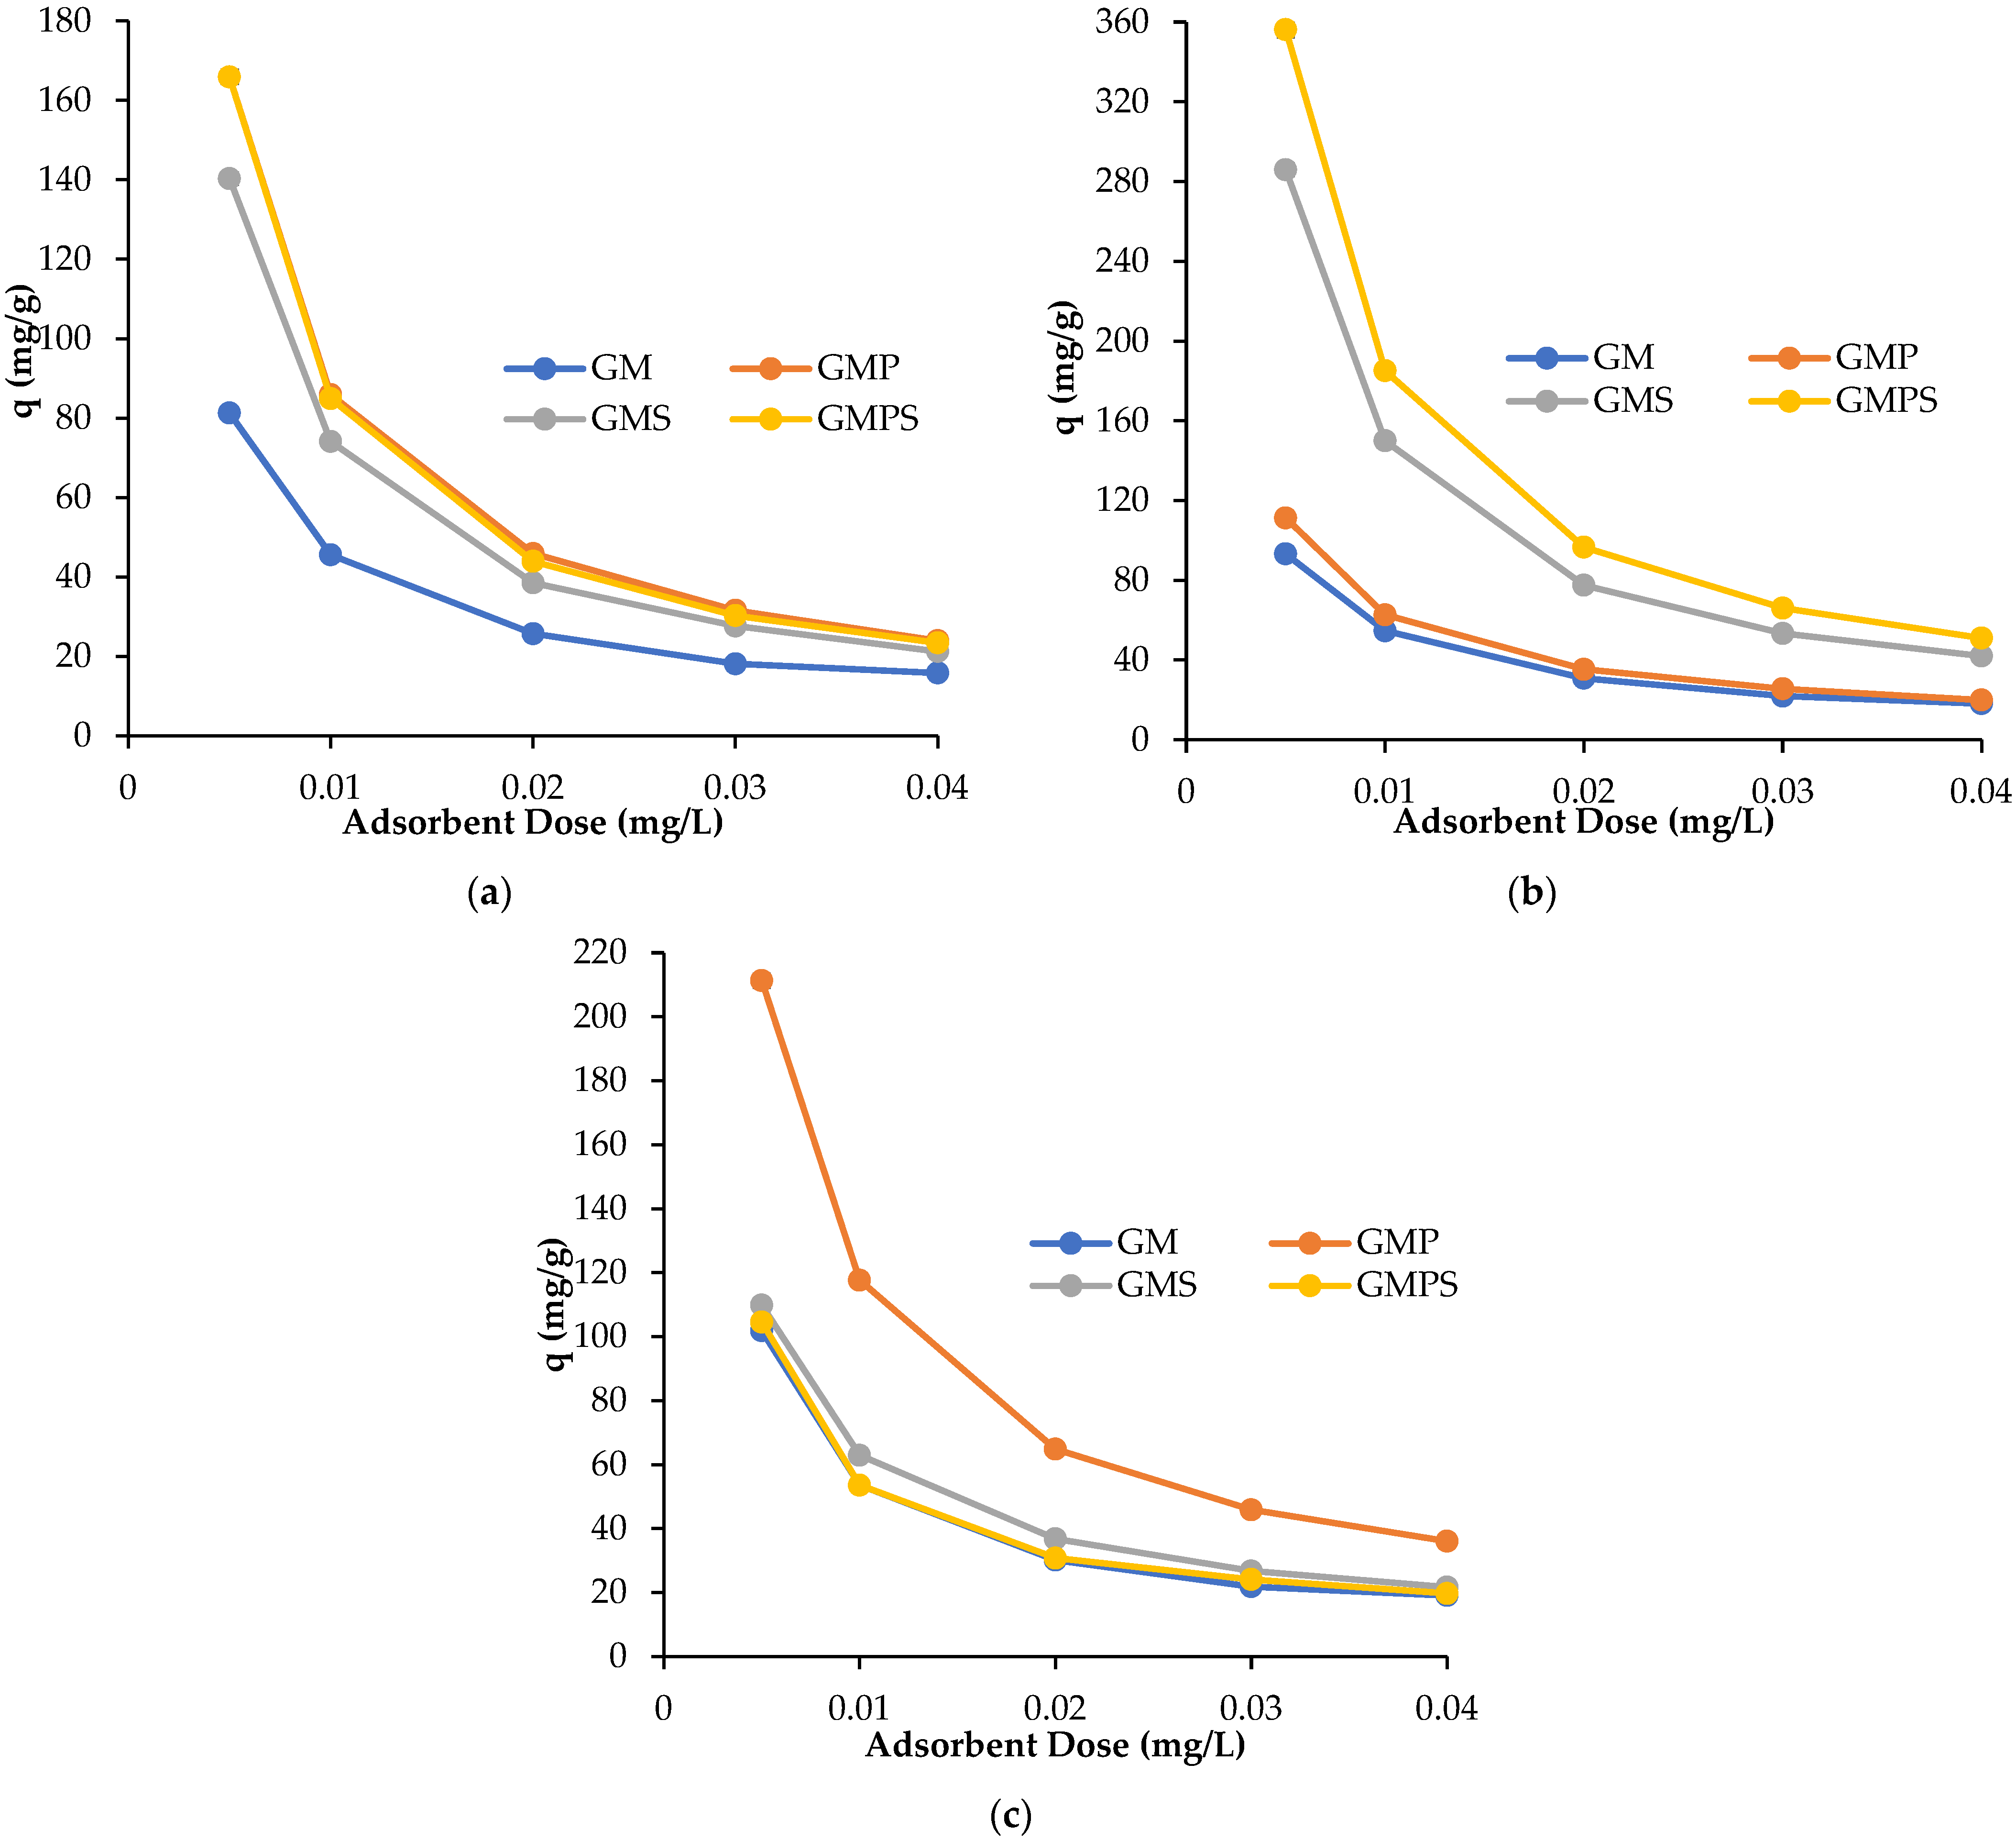
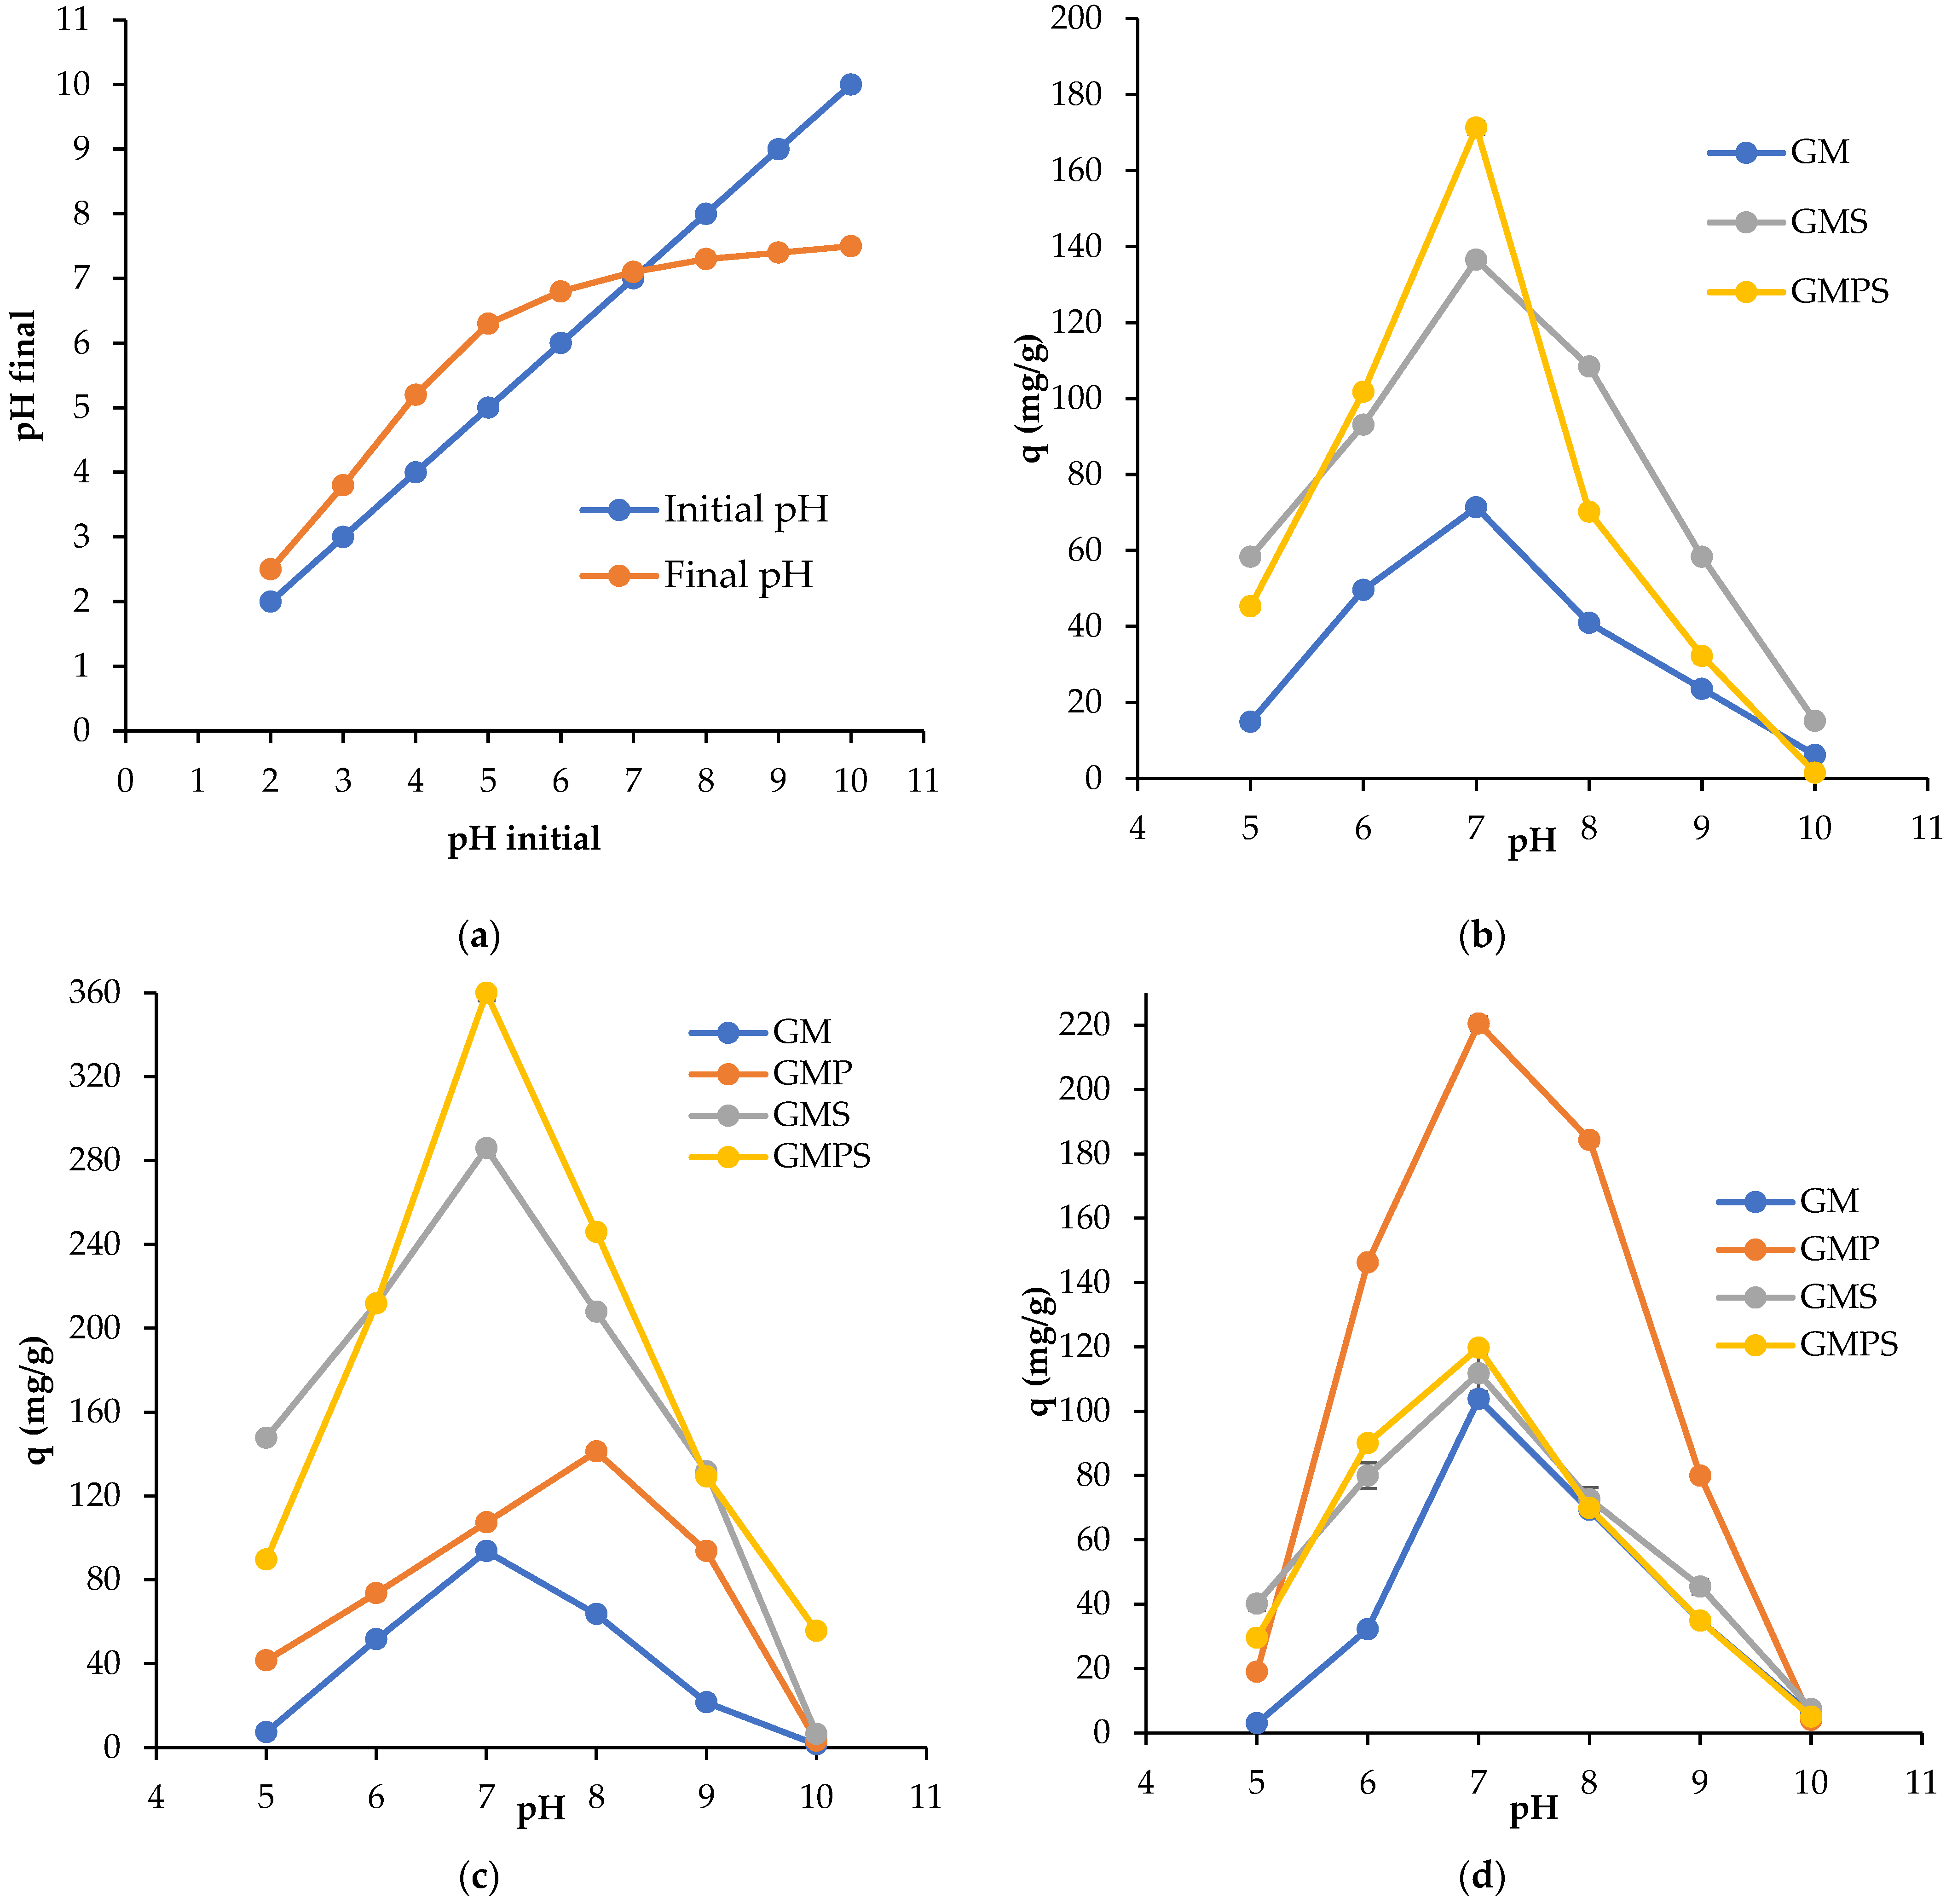
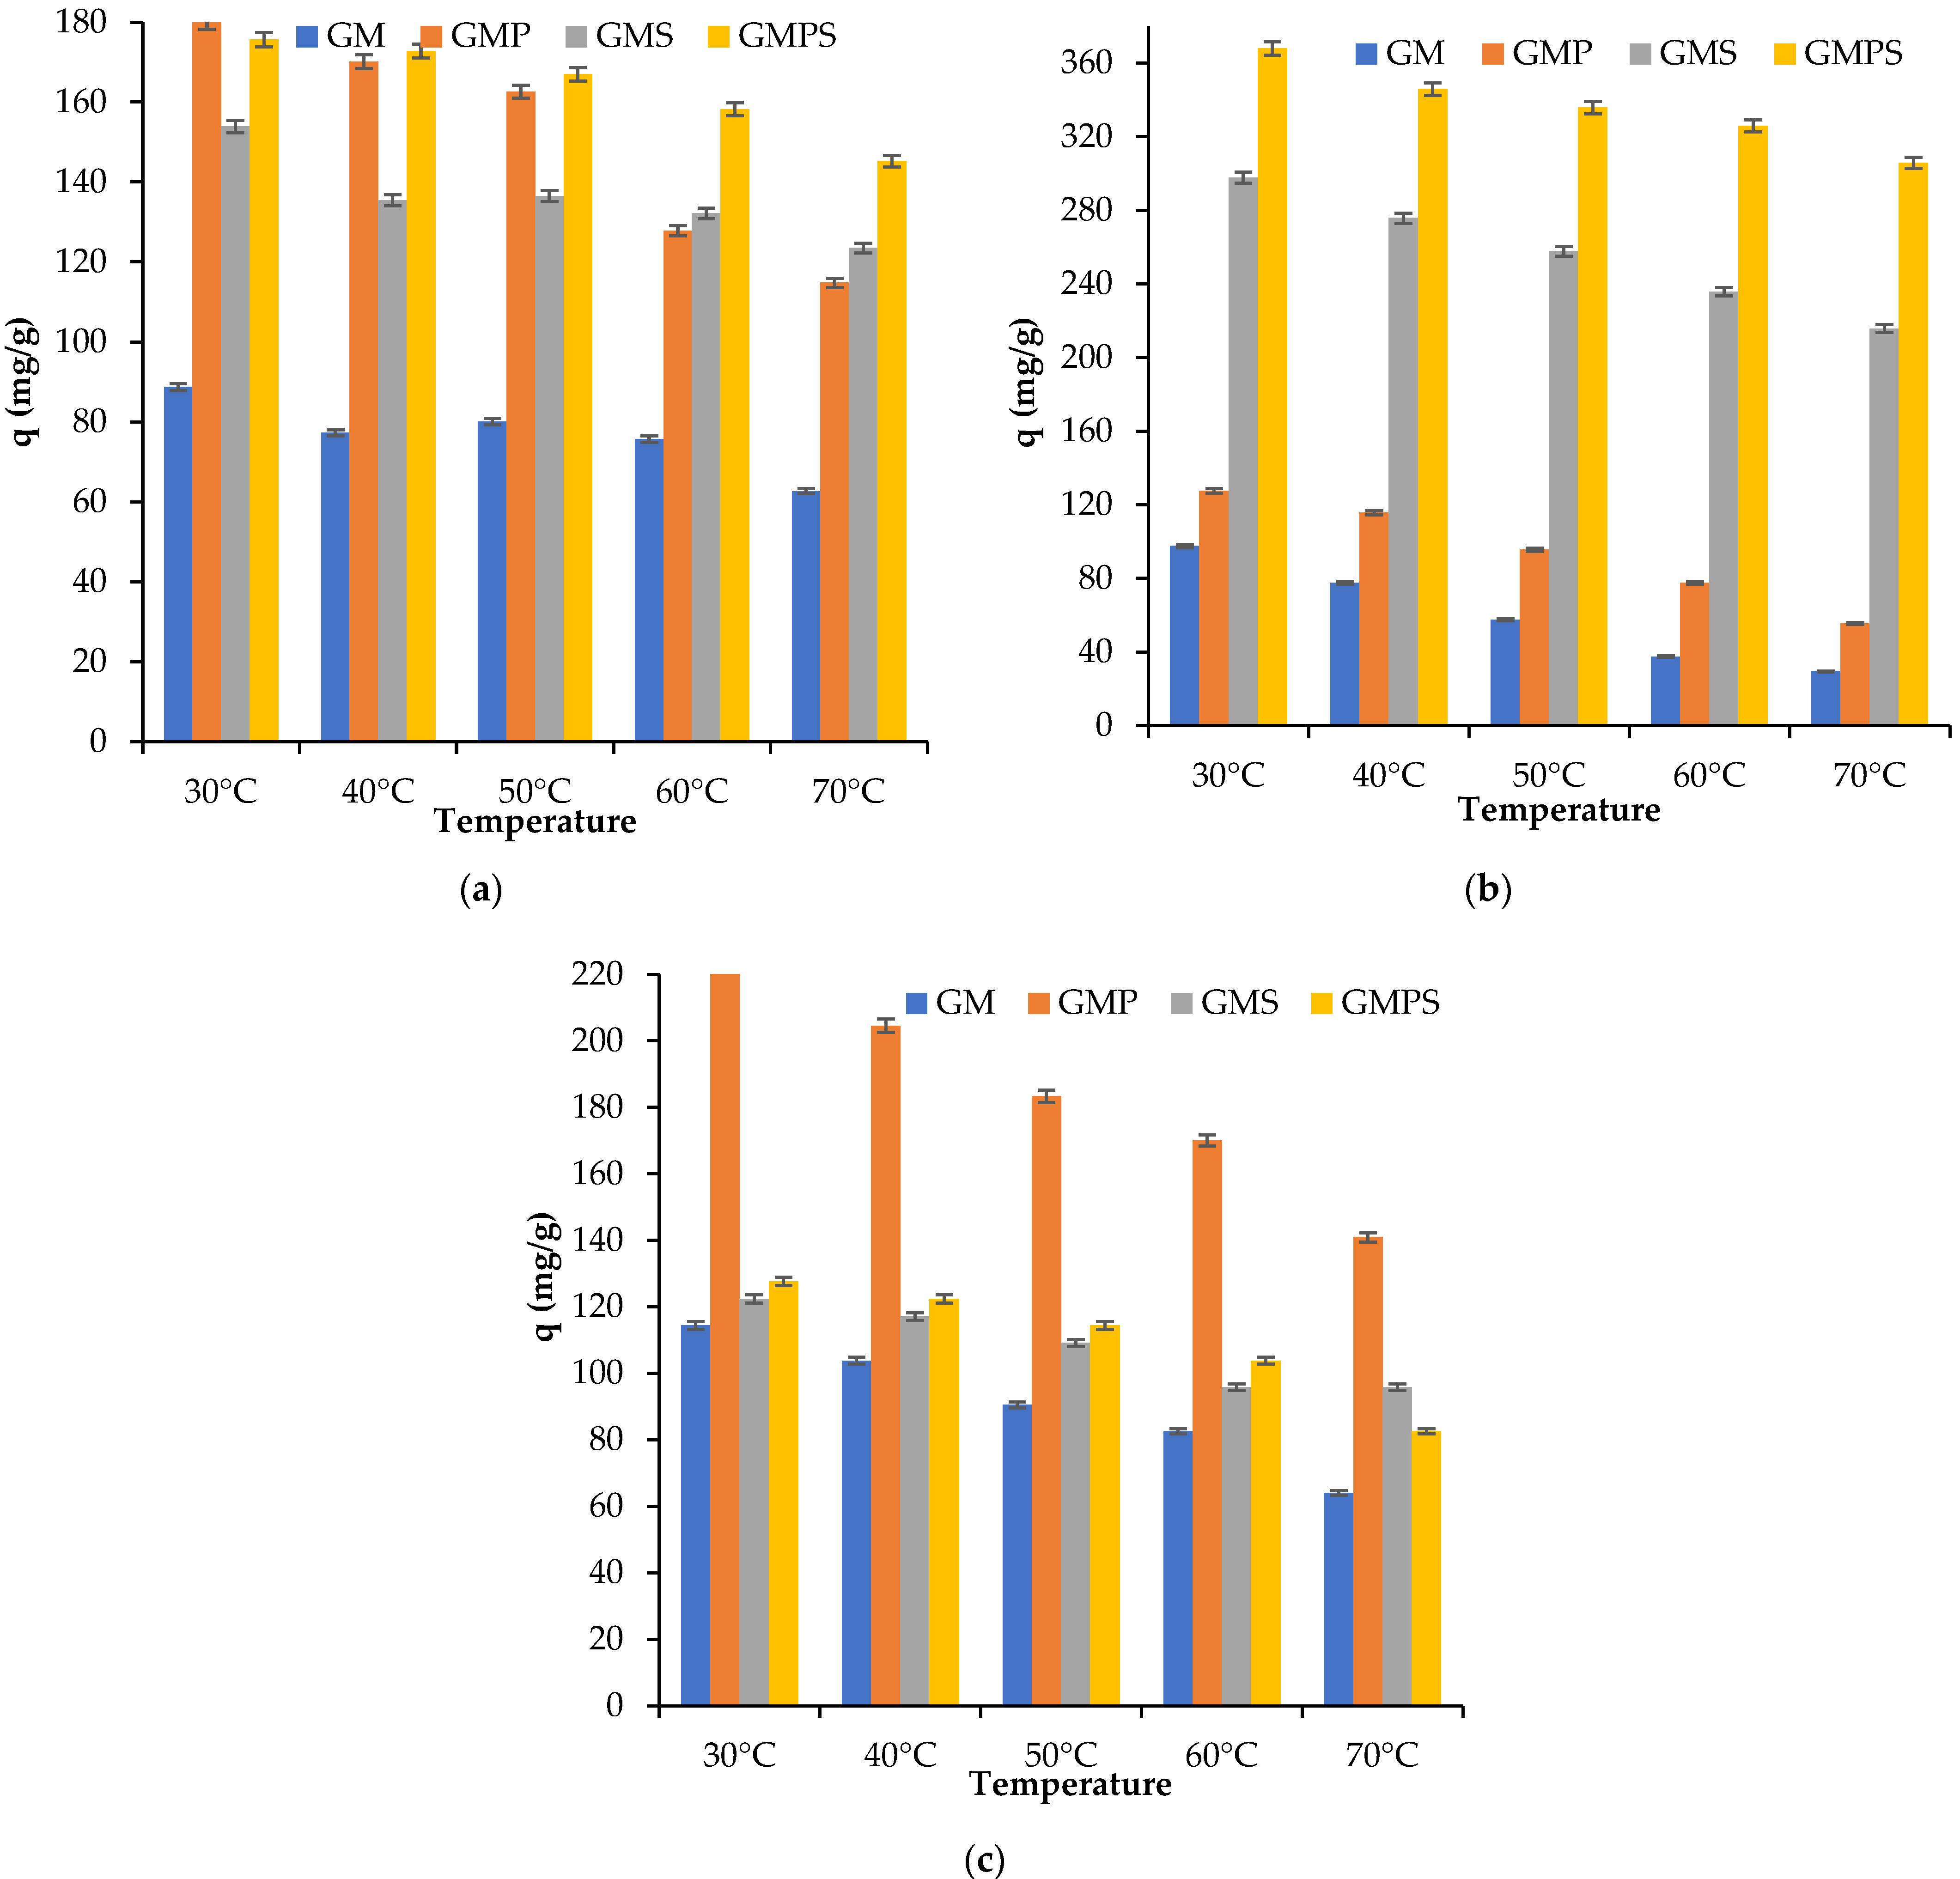
The present study has focused on removing used Foron blue, Foron black, and Foron red dyes from water using marble waste material. The effects of numerous parameters, for example, initial dye concentration, pH, time, temperature, and adsorbent dose, were optimized on dye uptake capacity. Furthermore, the obtained data were discussed in detail using isothermal and kinetic models.

2. Materials and Methods

2.1. Materials

Foron red, blue, and black dyes were obtained from the dyeing industry in Faisalabad. Golden marble stone was purchased from the local market of a nearby locality. Potassium ferricyanide and sodium metasilicate were used to modify the golden marble powder. All chemical reagents in this study, including 0.1M dil. HCl solution, 0.1M NaOH, Nitric acid, and buffer solution of a pH 7 were of analytical grade. Distilled water was used for the preparation of the required solutions.

2.2. Methods

2.2.1. Spectrophotometric Analysis

Solutions of all three dyes (Foron blue, Foron black, and Foron red) were prepared by dissolving 0.001 g of each dye in 40 mL distilled water to prepare a 25-ppm dye solution. Spectrophotometric analysis of dyes solutions was performed using a 721 D UV visible spectrophotometer (WINCOM, Hunan, China) to find the maximum wavelength λmax of each dye. Absorbance was monitored in the 380–1000 nm wavelength range for analysis.

2.2.2. Preparation of Golden Marble Powder

The golden marble used in this work was purchased in the form of stone from the local market in Faisalabad, Pakistan. Golden marble stone was then ground to attain fine powder to be used as an adsorbent for the removal of dyes from water.

2.2.3. Preparation of Composite Materials

Fifteen grams of pure golden marble powder were divided into three equal parts, each with five grams of marble powder. One part was treated with a saturated solution of potassium ferricyanide, and the second was treated with a solution of sodium metasilicate. The third part was treated with a mixture of potassium ferricyanide and sodium silicate to obtain a fine paste, which was further dried in the oven at 150 °C for approximately 2 h. All three dried samples were then washed and filtered using excess water to remove water-soluble impurities, as well as the colors of the chemicals used. The residue on the filter paper is collected and stored for further processing. After washing, the samples were dried for the second time in the oven at 150 °C. After drying, the samples were ground in a ceramic-based pestle and mortar to form a fine powder. The treated samples were stored in bottles for further studies.

2.2.4. Adsorption

The adsorption process of golden marble-based composite materials was performed by agitating the pure golden marble powder and composites with dye solutions using an orbital shaker at 120 rpm speed for 3 h. Dye solutions of Foron blue, red, and black were prepared with varying molar concentrations from 20 to 100 ppm. The pH of the dye solutions was adjusted separately using 0.1 M NaOH and 0.1 M HCl solutions. An adsorbent dosage (0.01 g) was added to each dye solution. pHPZC (point of zero charge) was determined by the pH drift method [18].

2.3. Optimization of Parameters

The effect of the initial dye concentration, adsorption dose, pH, temperature, and time by varying the dye concentration from 20 to 100 mg/L was investigated for three dyes. The time and shaking speed in the orbital shaker were 2 h for 300 rpm to remove the adsorbent and were measured at a wavelength for maximum absorbance (λ max is 570 nm for Foron blue, 572 nm for Foron black, and 475 nm for Foron red dye).

2.4. Adsorption Isotherms

The adsorption isotherm explains adsorbent and adsorbate interactions and is critical for optimizing adsorbent usage. These studies help to associate adsorption capacity (qe, mg·g−1) and adsorbate concentration (Ce, mg·L−1) in the liquid phase. Different isotherm models were applied to understand complex adsorption processes, including Langmuir, Freundlich, Dubinin Radushkevich, Temkin, and Harkin–Jura adsorption isotherms. Kinetic data were examined using pseudo-first order and pseudo-second-order kinetic models to study the effect of time on the adsorption process [19].

2.5. Characterization of Adsorbents

The surface morphology of golden marble-based composites was studied using a scanning electron microscope (SEM), (FEI Nova 450 NanoSEM, Hillsboro, USA). SEM analysis was carried out using ETD and TLD detectors, and specimens were observed in a high vacuum at a 25,000× magnification range. Fourier-transform infrared spectroscopy was employed to determine functional group differences before and after the adsorption processes. SEM analysis provides information about golden marbles by scanning them using a focused beam of electrons.

3. Results and Discussion

3.1. Effect of Initial Dye Concentration

The effect of the initial dye concentration on the dye adsorption capacity was investigated in the range of 20–100 mg/L at room temperature without changing the initial pH of the medium. The results in Figure 1 show that the percentage of dye removal increased with increasing initial dye concentrations. The actual amount of dye adsorbed per unit mass of the adsorbent increased with the increase in dye concentration, showing that the adsorption is highly dependent on the initial concentration of the dye (Figure 1). Foron red, blue, and black dyeing water was treated separately with golden marble waste composites to study the effect of initial dye concentration. Pure golden marble composites (GM) adsorbed Foron red, blue, and black dyeing wastewater more at higher dye concentrations. A similar trend was observed when the solution of Foron dyes was adsorbed with golden marble modified with potassium ferricyanide (GMP), golden marble modified with sodium metasillicate (GMS), and marble modified with a mixture of both metasillicate and potassium ferricyanide (GMPS).
The dye adsorption increased as the dye concentration increased from 20 mg/L to 40 mg/L, 60 mg/L, 80 mg/L, and then to 100 mg/L. The results show that with increased adsorption, the removal percentage increases significantly. The increase in uptake at higher concentrations resulted from an increased ratio of the initial adsorption number of moles of the dye to the available surface area. The initial dye concentration provides a significant driving force for overcoming the mass transfer resistance of the dye between the aqueous and solid phases. Therefore, at higher initial dye concentrations, the number of ions competing for the available sites on the marble surface was increased, resulting in higher Foron dye adsorption capacity [20].

3.2. Effect of Adsorbent Dose on Efficiency of Dye Removal

The solid/solution ratio is a crucial factor in determining adsorbent capacity. The effect of adsorbent dose was studied at different doses of adsorbent, ranging from 5 to 40 mg, with dye concentrations of 100 mg/L at room temperature. Figure 2 depicts the relationship between the dose and the percentage removal of adsorbents. It was seen that the percentage of adsorption decreased as the dose of adsorbents increased. This is due to increased mass transfer resistance; the increased number of adsorbents hinders the movement of dye molecules and reduces the adsorption of dyes on the surface of adsorbents, which becomes critical at high adsorbent doses.
Dye removal occurs with an increase in adsorbent dosage. This can be attributed to the increase in surface area and active sites. With further increase, there was an observed fall in the percentage removal of dye due to an increase in adsorbent dosage beyond maximum adsorption capacity, which might be because of the overlapping of the adsorption sites due to overcrowding of adsorbent particles beyond the optimum dose. The same pattern was observed for the removal efficiencies of golden marble waste composites (pure golden marble, golden marble treated with potassium ferricyanide, sodium metasilicate, and their mixtures). An increase in the amount of adsorbent should increase the adsorption rate because of an increase in the number of available sites. However, the adsorption sites remained unsaturated as the dye molecules could not get adsorbed on the surface due to resistance offered by the increased amount of adsorbent [21].

3.3. Effect of pH on Dye Adsorption

Figure 3 represents the adsorption capacity of the Foron dyes and golden marble from 5 to 10 pH at the dye concentration of 100 mg/L. The pH initial–pH final curve in Figure 3a was drawn using the measured pH initial and pH final values. The intersection of the curves and the pH initial = pH final line showed that the pHpzc of the golden stone nanostructure was estimated to be ca. 7.1. The effect of pH on the adsorption of Foron red, Foron blue, and black dyes was determined in an aqueous solution of pure golden marble and its composites. The effect of pH on the adsorption of the dye on the marble material was found to be quite distinct; the change in adsorption was regular, with an increase in pH and had a maximum at pH 7 and decreased afterwards. The degree of ionization of the adsorbent and the surface characteristics of the adsorbent are both affected by the pH of the solution, and the initial pH of the solution influences more than the final pH of the solution. The amount of Foron dyes adsorbed is more significant at neutral pH and decreases at the dye solution’s basic and acidic pH. When the pH of the dye solution increases, the surface tends to acquire a negative charge, resulting in increased dye adsorption due to increasing electrostatic attraction between positively charged sorbate and negatively charged sorbent marble, which is a fundamental substance, so an increase in pH leads to increased adsorption of dyes [22].

3.4. Effect of Contact Time and Solution Temperature

Temperature is a crucial parameter in adsorption reactions. The results in Figure 4 show that the percentage of dye removal increased with increasing temperature, depending on the nature of the adsorbent. An increase in temperature leads to an increase in dye adsorption because of an increase in the number of active sites and the kinetic energy of the molecules. The study of the kinetics of elimination of the Foron dyes by golden marble powder in an aqueous solution has shown that the temporal evolution of the quantity of Foron dyes adsorbed per gram of marble for a given concentration (from 20 to 100 mg/L) increases as temperature increases. However, the adsorption phenomenon is usually affected by many parameters, and the temperature significantly impacts the process as it determines the equilibrium position [23].

3.5. Optimization of Parameters by Theoretical Modeling

Adsorption Isothermal Modeling for Foron Black, Foron Blue and Foron Red Dyes
The adsorption isotherm describes how adsorbate interacts with an absorbent and is critical in optimizing the use of the absorbent. Adsorption equilibrium studies are conducted to correlate the adsorption capacity (qe, mg g−1) and absorbate concentration (Ce, mg L−1) in the liquid phase. The nature of adsorption was examined using Langmuir, Freundlich, Temkin, Dubinin-Radushkevich, and Harkin Jura isothermal models [24]. The results obtained from the comparison of Langmuir, Freundlich, Temkin, Dubinin, and Harkin Jura isotherms showed that the R2 values of the Langmuir isotherm for Foron red, the Temkin isotherm for Foron blue, and the Freundlich isotherm for Foron black dye are greater than 0.96 for treated and untreated composites, and the qe (mg/g) experimental value is closer to the Langmuir isotherm, Temkin isotherm, and Freundlich isotherm (Table 1, Table 2 and Table 3). The q (mg/g) values are better for treated composites as compared to untreated composites, while q (mg/g) is the value of the mass of dye adsorbed to the adsorbent at equilibrium [25].

3.6. Kinetic Studies

Pseudo-first order and pseudo-second-order kinetic models have been applied to investigate the adsorption mechanism test and the experimental data and dye adsorption kinetics onto golden marble waste composites (Table 4, Table 5 and Table 6). The model-predicted values and the experimental data can be studied by correlation coefficients (R2, values near or equal to 1). A high R2 value showed the effectiveness of the model on adsorption process kinetics. The results obtained from the comparison showed that the R2 values for pseudo-second-order kinetics are greater than those of pseudo-first-order kinetics and that the R2 values are closer to or equal to 0.96. Therefore, maximum dye adsorption was observed for pseudo-second-order kinetics. The results obtained suggested that the R2 values of the dyes were more significant than 0.96 or close to 0.96 in a pseudo-second-order reaction. The value of q (mg/g) was comparable to pseudo-second-order kinetics instead of pseudo-first-order kinetics. Therefore, the maximum adsorption removal is favored by pseudo-second-order kinetics [26].

3.7. FTIR Analysis

According to the FTIR spectra of treated and untreated golden marble waste composites, all the prepared samples have shown absorption peaks in 1794, 1395, 872, 711, and 1032 cm−1 (Figure 5). However, by comparing untreated golden marble with treated golden marble, an additional peak was observed at 2510 cm−1. Absorption bands at 2510, 1794, 1395, and 711 cm−1 were observed and assigned to calcite CaCO3. The absorption band indicates the carbonyl group at 1794 cm−1. The peak at 1032.5 cm−1 is assigned to sulfoxide. This indicates that the functional groups at these wave numbers participate in dye adsorption by sharing or exchanging electrons among sorbent and sorbate. Additionally, when the dye is adsorbed, the vibration’s peak becomes smaller, suggesting that carbonyl groups may play a crucial role in the adsorption of these dyes [27]. Thus, the addition of potassium ferricyanide increased the adsorption power of the adsorbent. Sodium metasilicate is used as the adhesive agent, and the addition of sodium metasilicate to the marble powder increased the absorbance efficiency of the marble stone powder. The golden marble waste treated with sodium metasilicate and potassium ferricyanide further enhanced the dye removal capacity of the absorbent. Since marble is the common component in all three treated samples, the FTIR spectra show almost the same peaks for these treated samples.

3.8. SEM Analysis

Scanning electron microscopy with TLD and ETD analysis was used to study the surface morphology of composites. The SEM micrographs obtained for composites at various resolutions are shown in Figure 6, Figure 7, Figure 8 and Figure 9. These micrographs suggested that the pure golden marble had shown a massive aggregated coarse morphology with a heterogenous surface. At the same time, the treated golden marble composites depict several pores with irregular shapes and rough and uneven surfaces. These pores exhibit higher contact areas and easy diffusion of pores during adsorption. Different cage-like cavities were also present. Due to the enhanced surface area, porosity, and number of cavities, the treated composites were very efficient in dye removal by providing more sites for the reaction to occur. Therefore, by comparing the micrographs of pure golden marble and its treated composites, it was observed that treated samples possess a larger surface area due to a large number of pores. These pores provide many active sites for molecules of dye to adsorb and enhanced the percentage removal of dye [15].

3.9. Comparison of Adsorbents

A comparison of the removal efficiency of golden marble and its nanocomposites with other adsorbents for dyes is listed in Table 7. It was observed that the produced composite materials showed a higher removal capacity than the reported adsorbent.

4. Conclusions

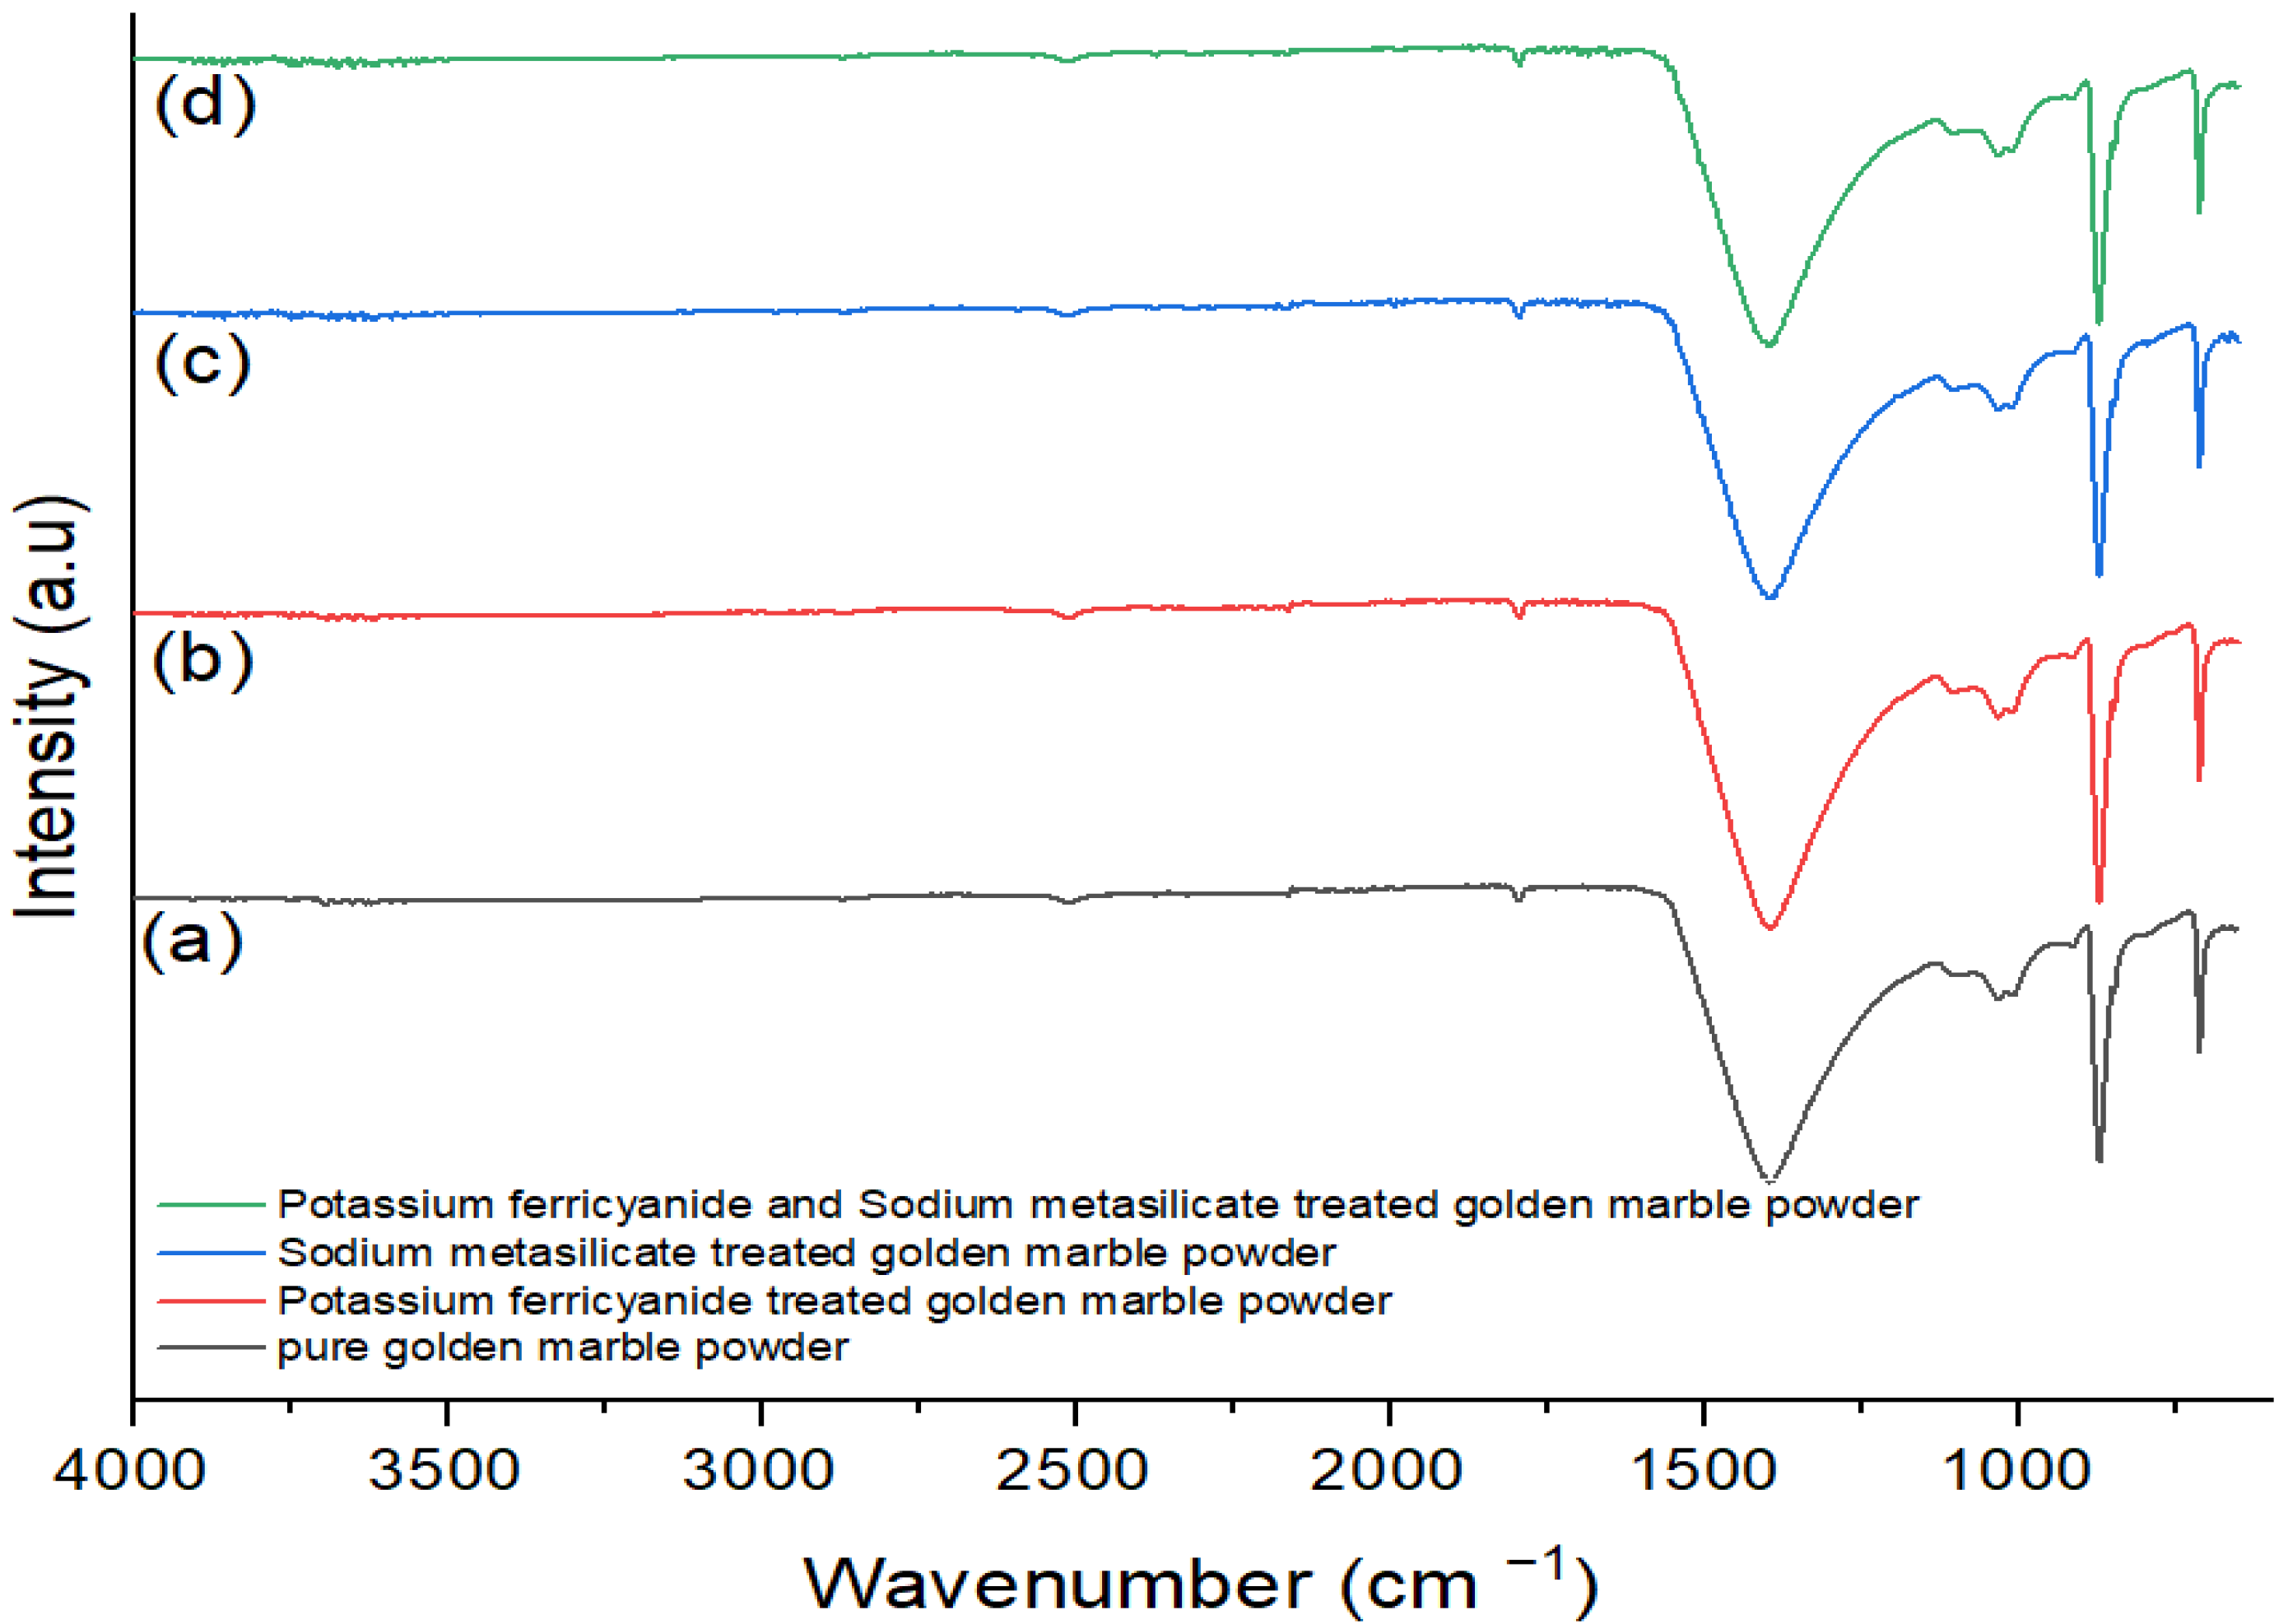
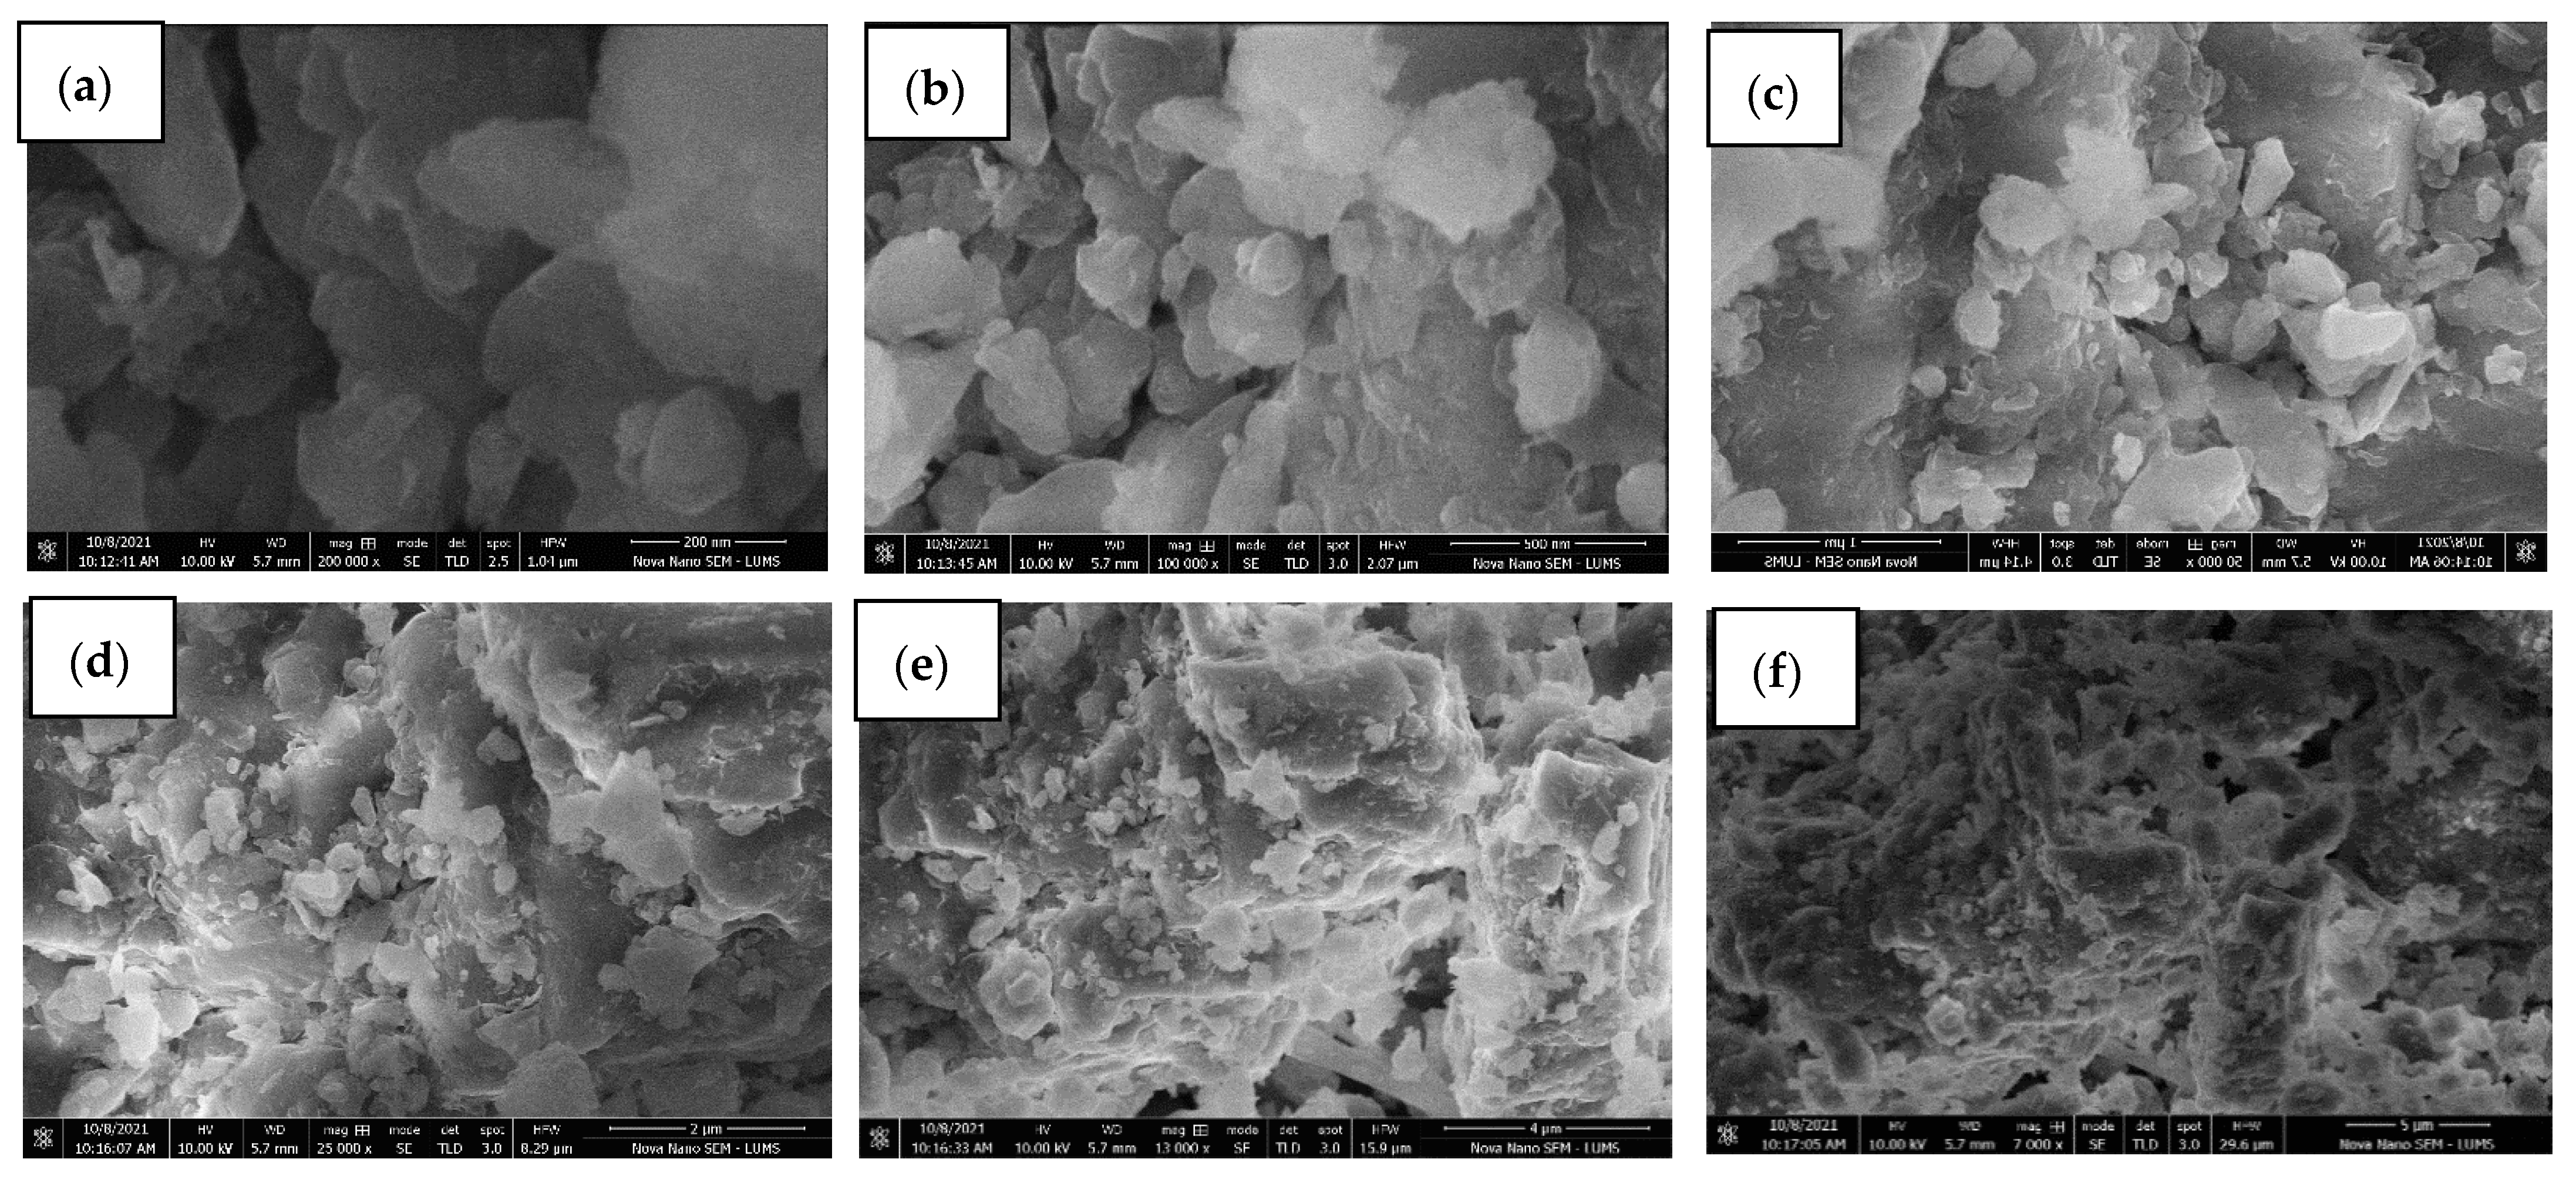
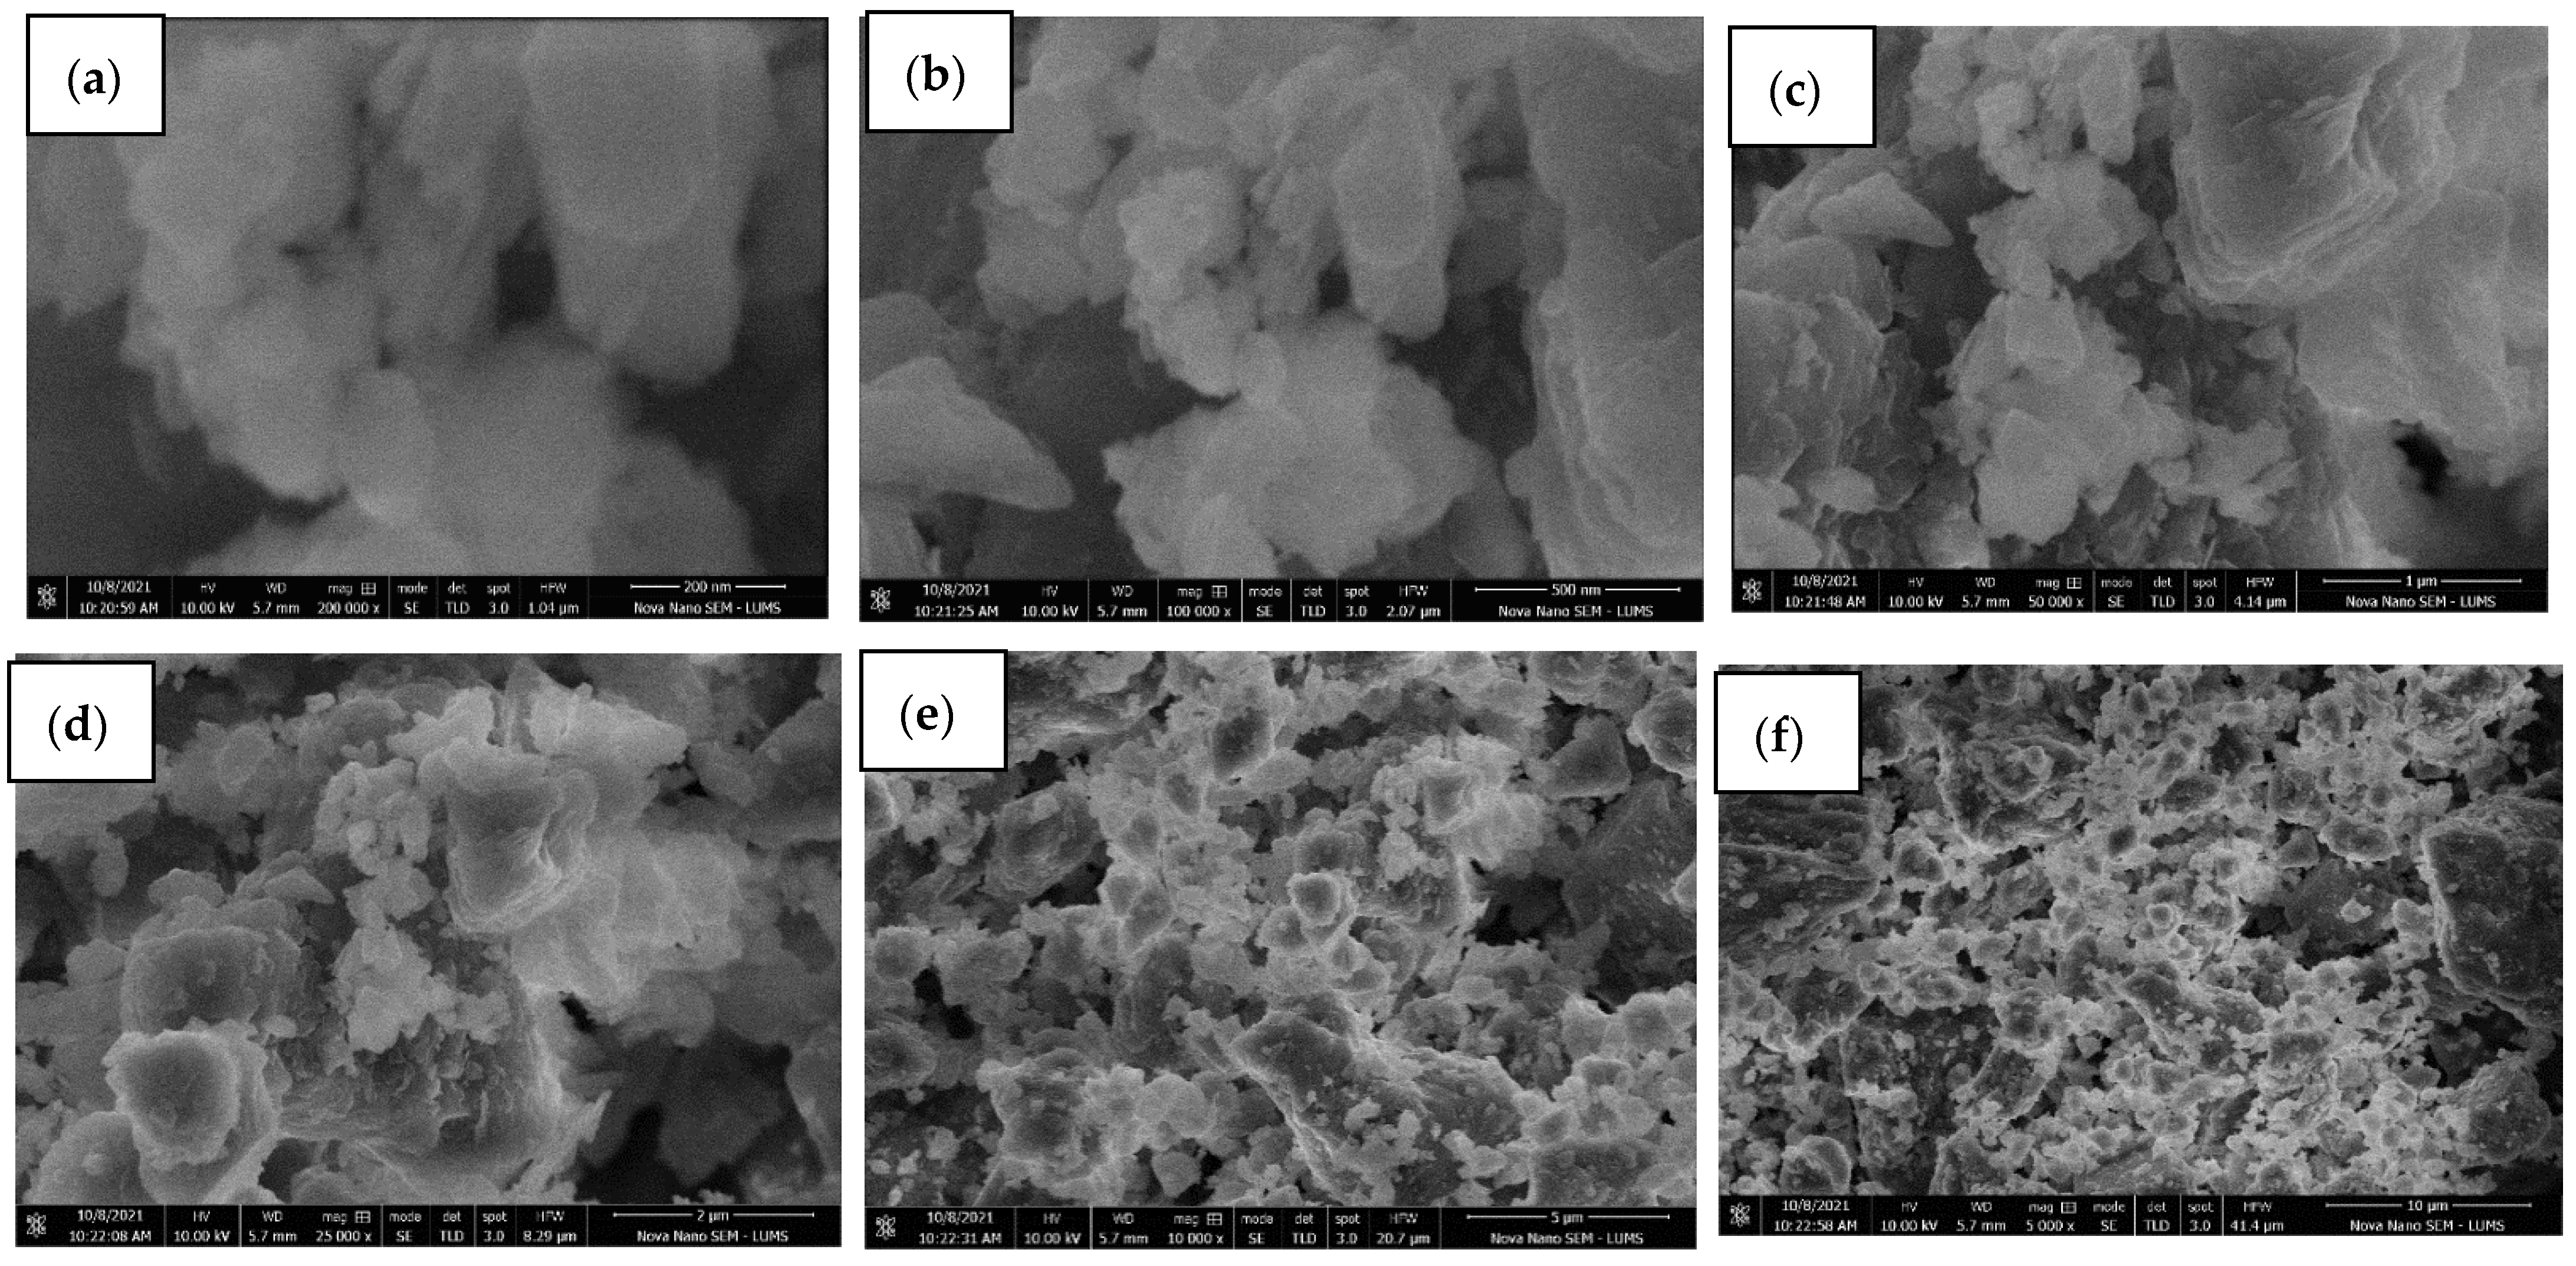
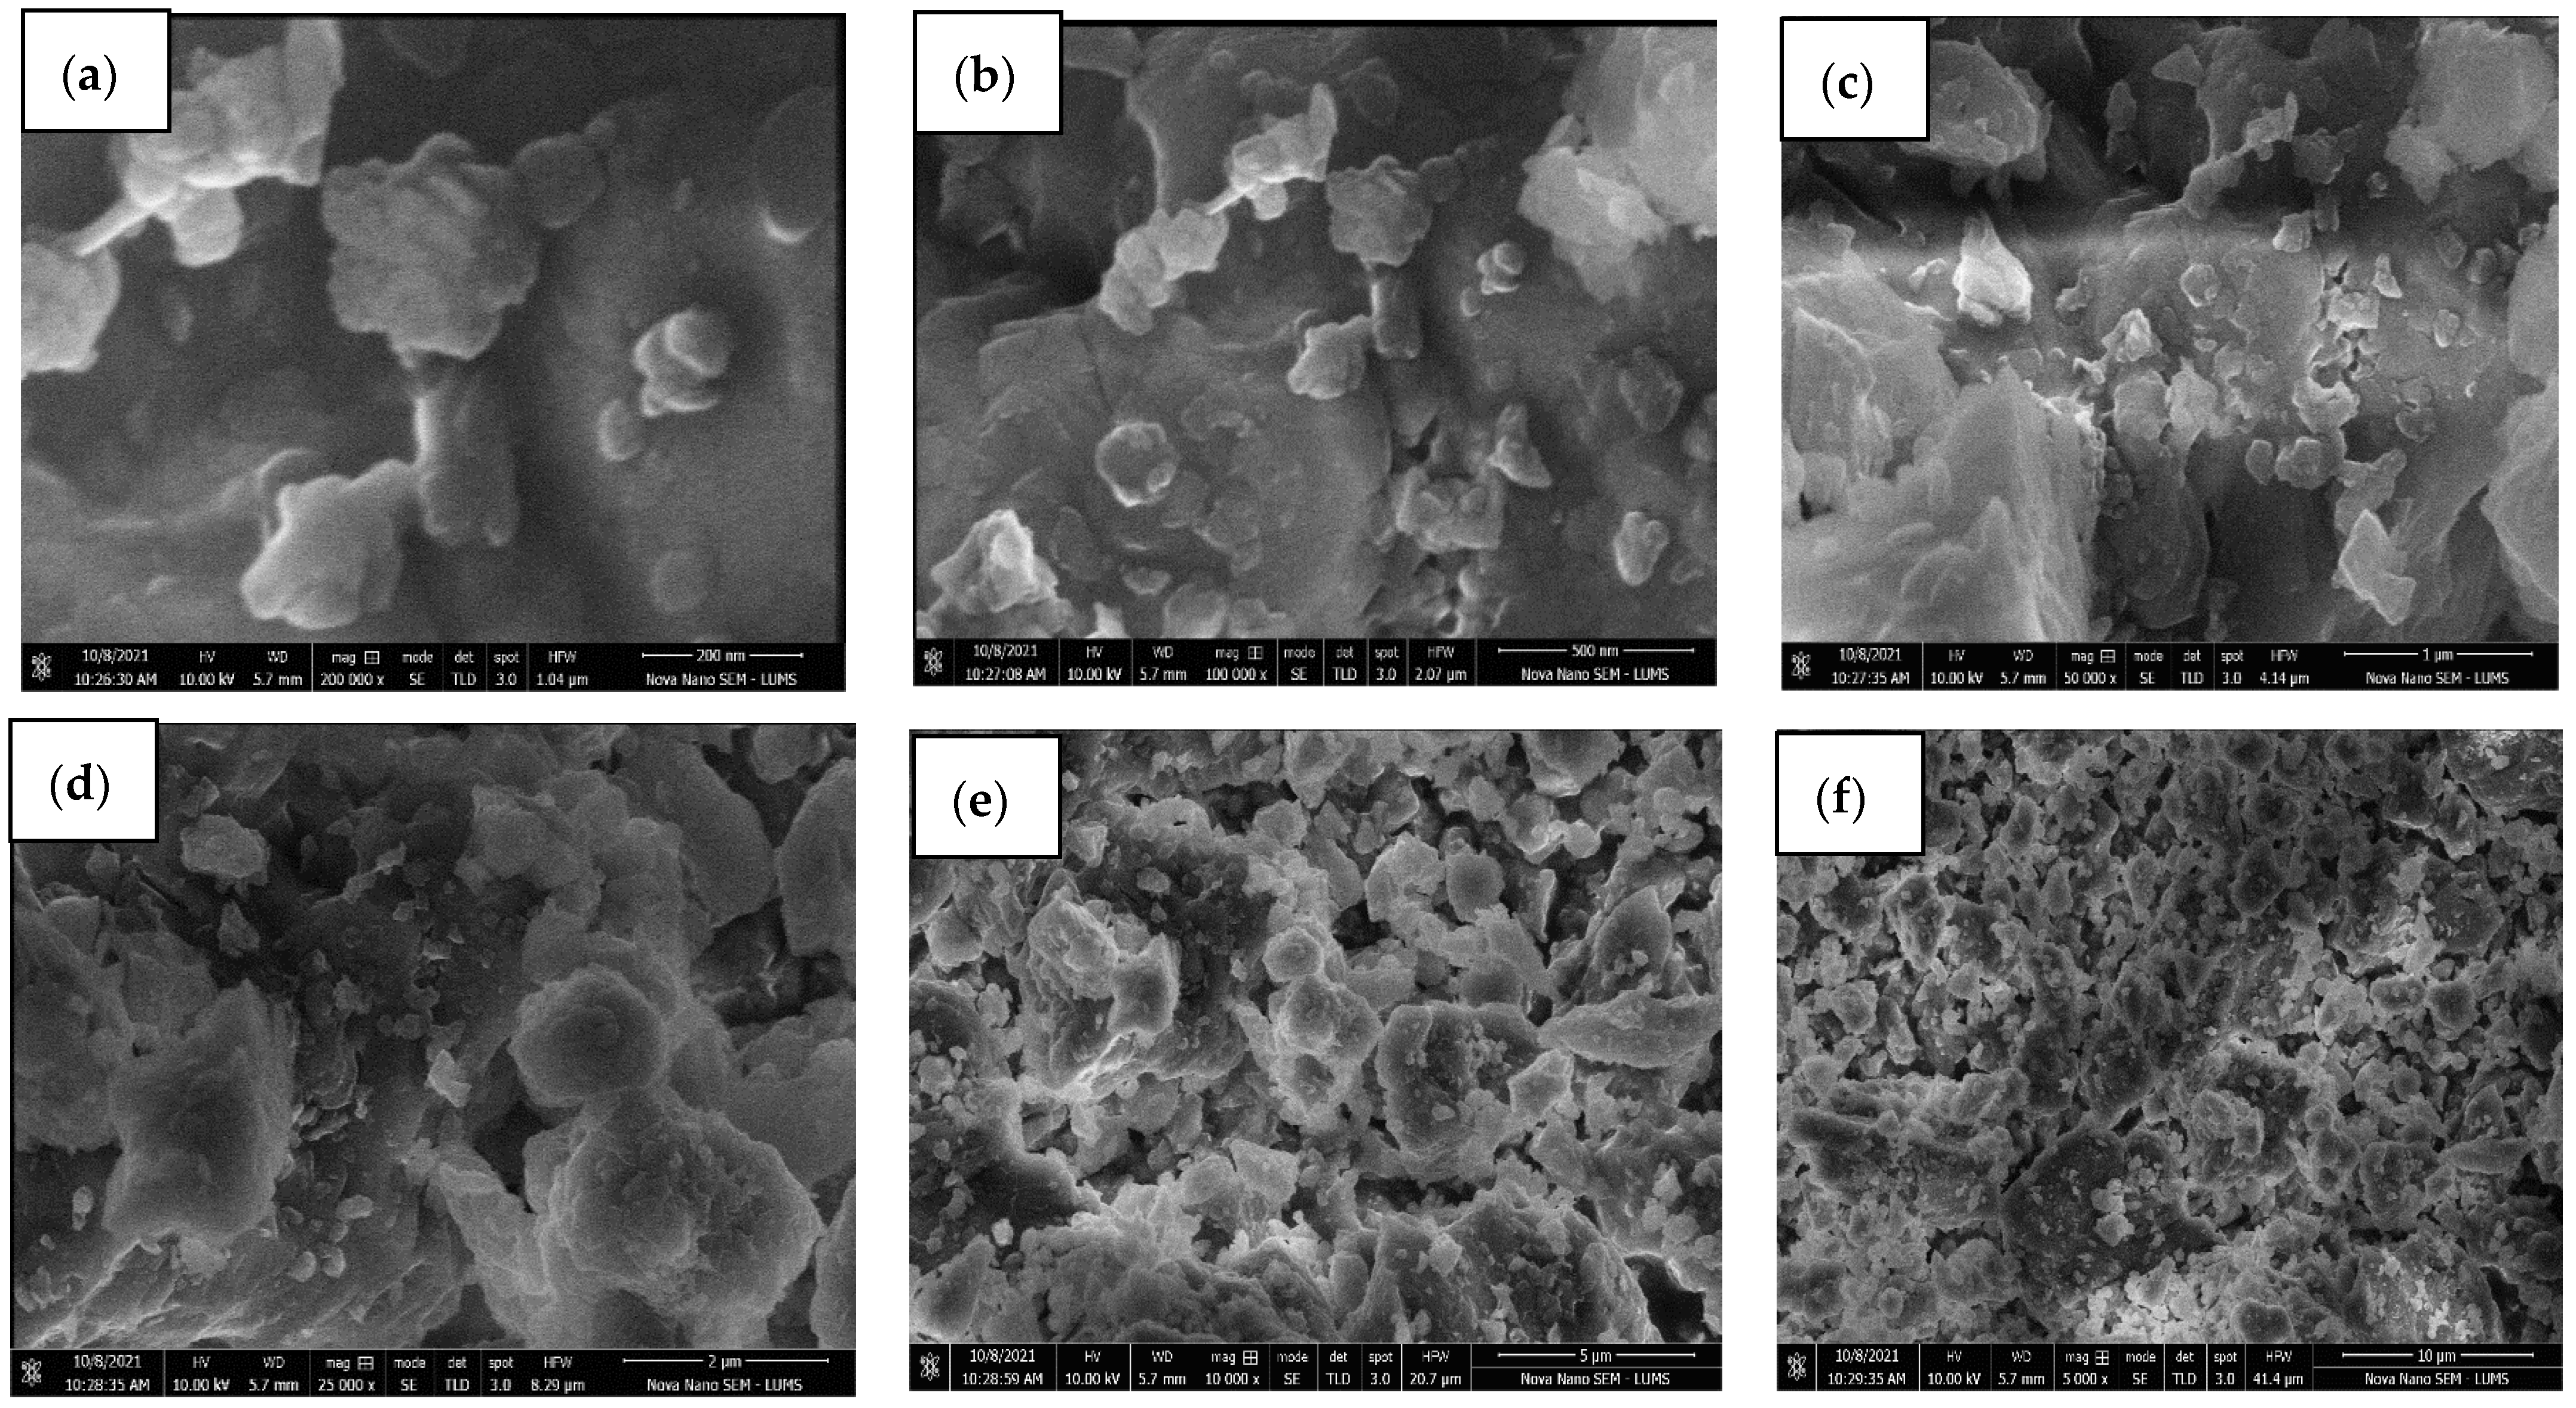
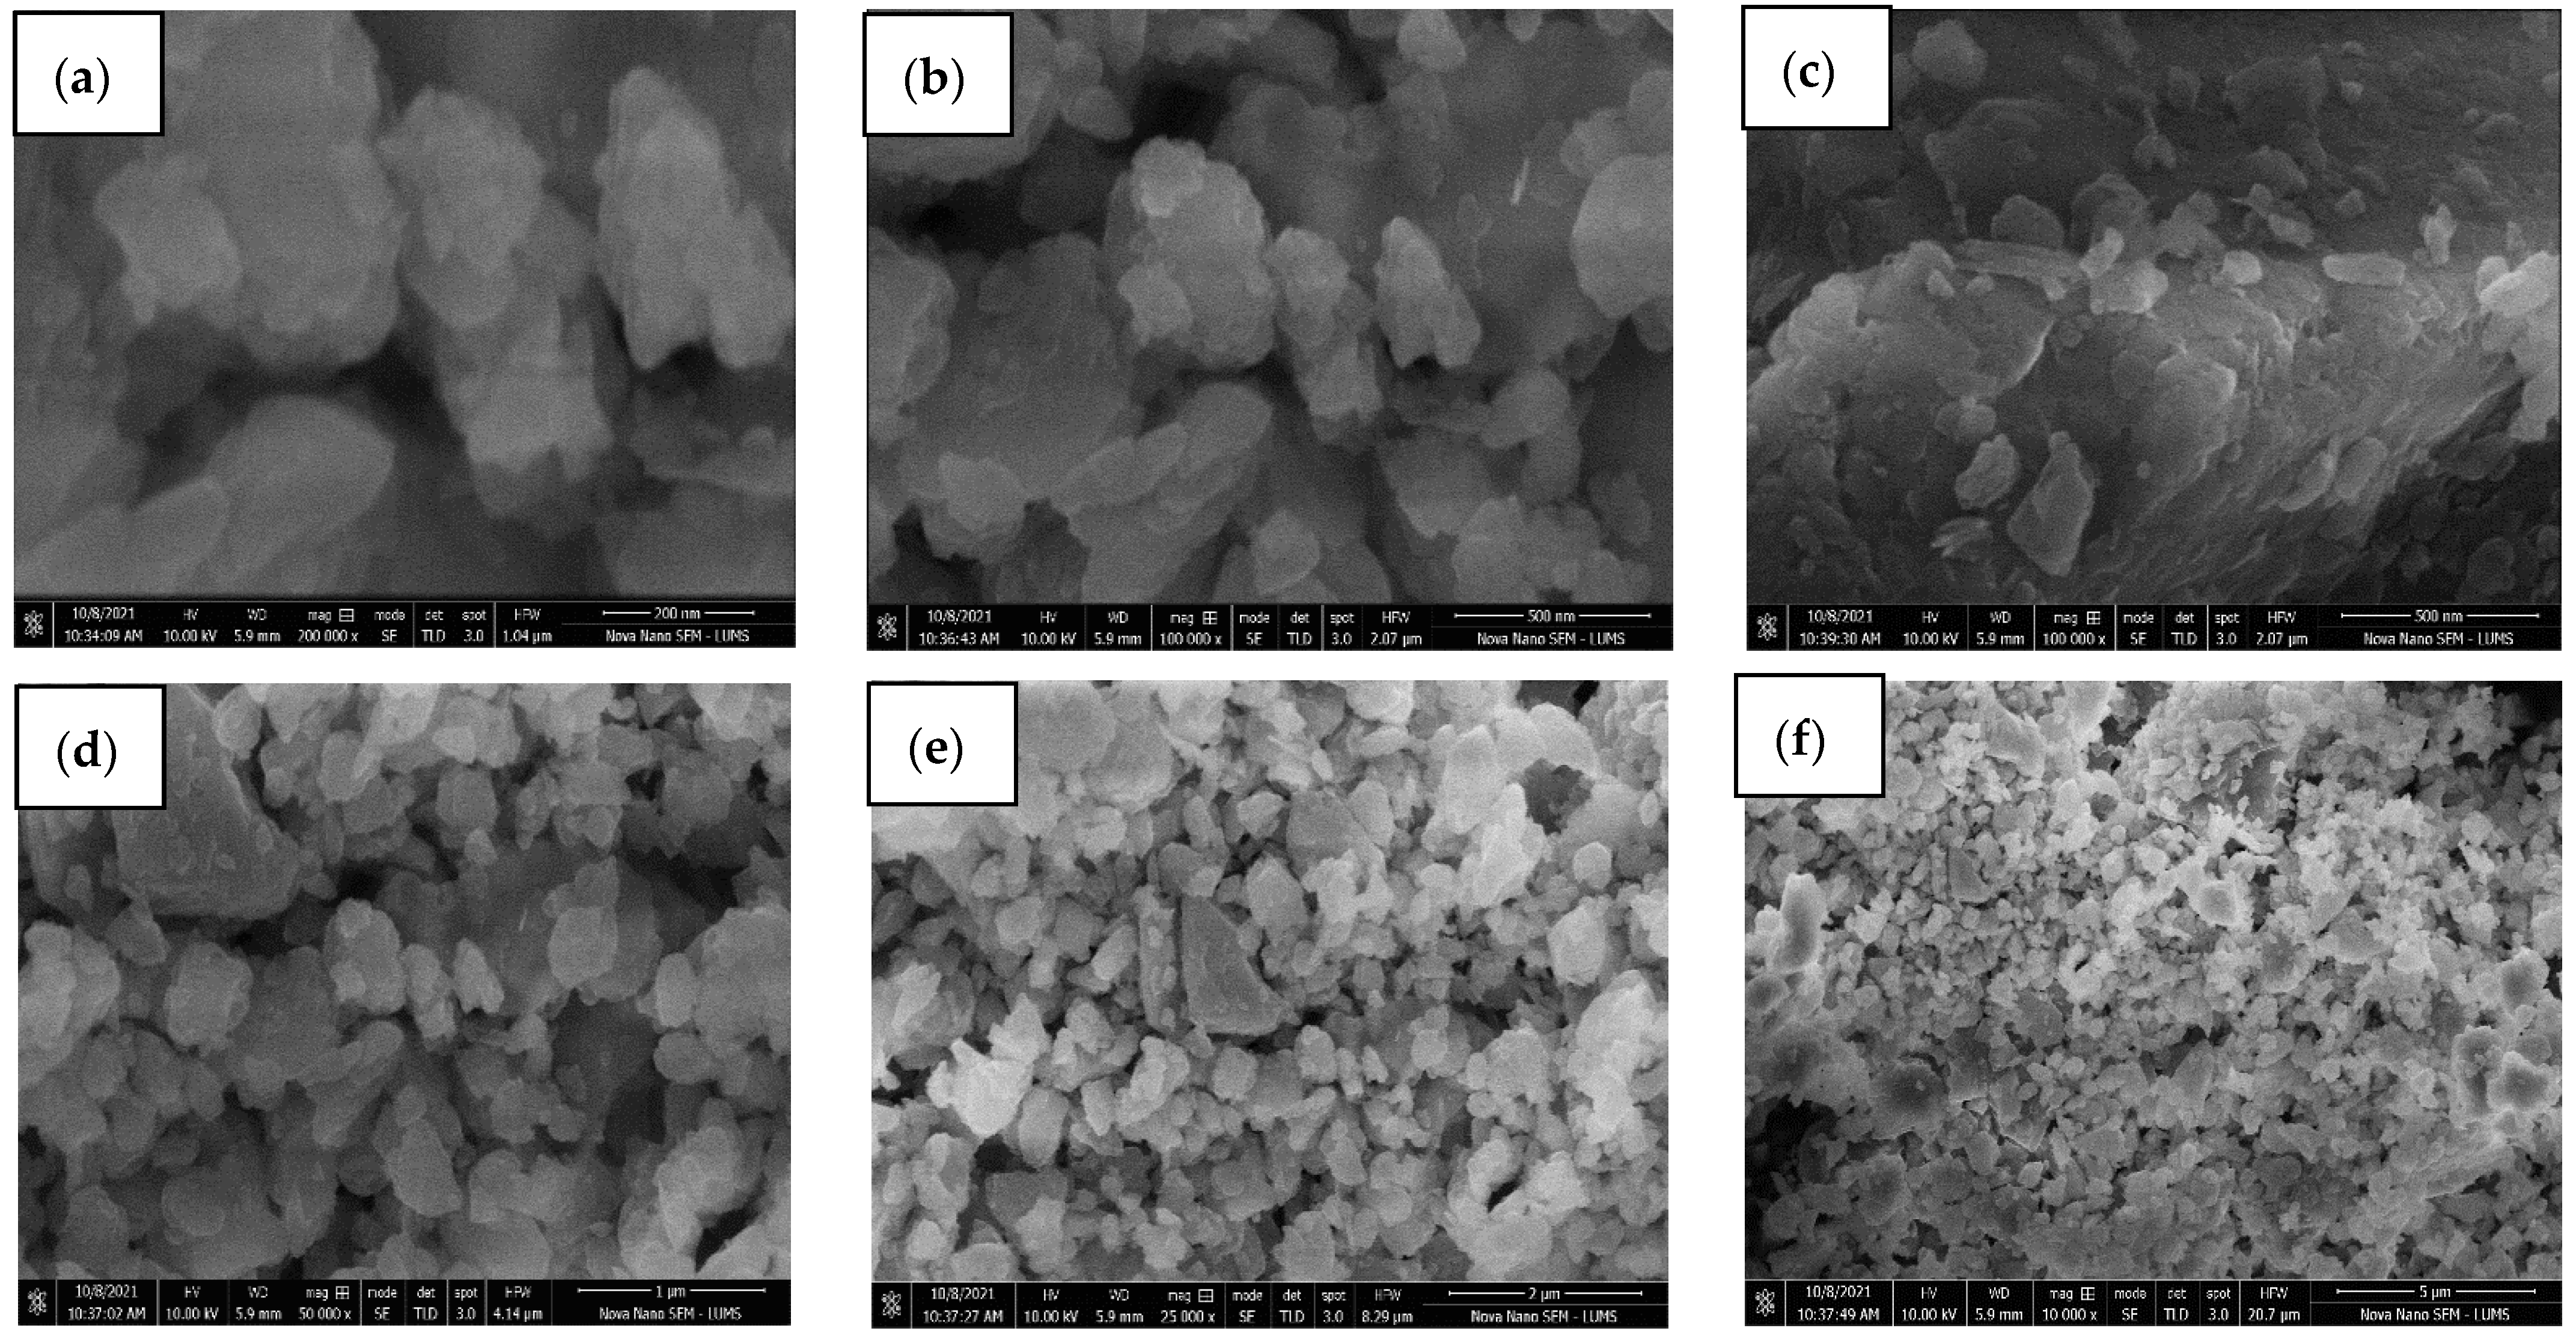
Treated golden marble waste composites have shown significant advantages over pure or untreated golden marble because of their high adsorption ability. Furthermore, nontoxic, and environmentally compatible marble composites appeared to be an excellent alternative for removing various pollutants from industrial wastewater. The adsorption method offers unique advantages owing to the use of natural adsorbents, such as marble waste composites for dye removal, due to their easy availability, low cost, eco-friendly nature, ease of operation, simplicity of design, flexibility, and great affinity for dyes. Golden marble waste nanocomposites are prepared for dye removal. Adsorption, a cheap and effective method, showed excellent results for all dyes discussed in the study without producing any waste. Removal efficiency has been significantly increased using the adsorption technique. Different factors greatly influence the adsorption capacity, such as absorbance, pH, time, temperature, concentration, and dose of the adsorbent. Spectrophotometric analysis suggested that treated golden marble composite material had better removal efficiency than pure golden marble waste composites. Optimization of a parameter, such as concentration, contact time, and temperature, was also discussed, and their results were calculated using isothermal and kinetics models. It was observed that golden marble waste composites gave better R2 values for second-order kinetics in the kinetic model. The results obtained from comparing the Langmuir, Freundlich, Temkin, Dubinin, and Harkin Jura isotherms showed that the R2 values of the Langmuir isotherm for Foron red, the Temkin isotherm for Foron blue, and the Freundlich isotherm for Foron black dye fit the adsorption for both treated and untreated composites. Characterization techniques, such as scanning electron microscopy (SEM) and Fourier transform infrared spectroscopy (FTIR), are also discussed for the structural determination of golden marble waste composites.

Author Contributions

Conceptualization, I.A., M.A.H. and U.R.; methodology, M.A.H., I.A.B. and U.R.; software, U.R.; validation, R.A.K., U.R., M.A.H. and E.A.K.; formal analysis, M.A.H. and U.R.; investigation, I.A., M.A.H. and U.R.; resources, R.A.K. and I.A.B.; data curation, I.A., M.A.H. and U.R.; writing—original draft preparation, I.A. and M.A.H.; writing—review and editing, M.A.H., U.R., I.A.B., R.A.K. and E.A.K.; visualization, M.A.H. and U.R.; supervision, M.A.H.; project administration, R.A.K. and U.R.; funding acquisition, R.A.K. and U.R. All authors have read and agreed to the published version of the manuscript.

Funding

This research received no external funding.

Institutional Review Board Statement

Not applicable.

Informed Consent Statement

Not applicable.

Data Availability Statement

Not applicable.

Acknowledgments

Authors extend their thanks to the Researchers Supporting Project (Ref: RSP-2021/400), King Saud University (Riyadh, Saudi Arabia).

Conflicts of Interest

The authors declare no conflict of interest.

References

  1. Paul, S.; Chavan, S.; Khambe, S. Studies on characterization of textile industrial waste water in Solapur city. Int. J. Chem. Sci. 2012, 10, 635–642. [Google Scholar]
  2. Akpor, O.; Otohinoyi, D.; Olaolu, D.; Aderiye, B. Pollutants in wastewater effluents: Impacts and remediation processes. Int. J. Environ. Res. Earth Sci. 2014, 3, 050–059. [Google Scholar]
  3. Yuan, H.; Chen, L.; Cao, Z.; Hong, F.F. Enhanced decolourization efficiency of textile dye Reactive Blue 19 in a horizontal rotating reactor using strips of BNC-immobilized laccase: Optimization of conditions and comparison of decolourization efficiency. Biochem. Eng. J. 2020, 156, 107501. [Google Scholar] [CrossRef]
  4. Maqbool, Z.; Hussain, S.; Ahmad, T.; Nadeem, H.; Imran, M.; Khalid, A.; Abid, M.; Martin-Laurent, F. Use of RSM modeling for optimizing decolorization of simulated textile wastewater by Pseudomonas aeruginosa strain ZM130 capable of simultaneous removal of reactive dyes and hexavalent chromium. Environ. Sci. Pollut. Res. 2016, 23, 11224–11239. [Google Scholar] [CrossRef]
  5. Anjaneyulu, Y.; Chary, N.S.; Raj, D.S.S. Decolourization of industrial effluents–available methods and emerging technologies–a review. Rev. Environ. Sci. Bio/Technol. 2005, 4, 245–273. [Google Scholar] [CrossRef]
  6. Abdi, J.; Vossoughi, M.; Mahmoodi, N.M.; Alemzadeh., I. Synthesis of metal-organic framework hybrid nanocomposites based on GO and CNT with high adsorption capacity for dye removal. Chem. Eng. J. 2017, 326, 1145–1158. [Google Scholar] [CrossRef]
  7. Hao, O.J.; Kim, H.; Chiang, P.-C. Decolorization of wastewater. Crit. Rev. Environ. Sci. Technol. 2000, 30, 449–505. [Google Scholar] [CrossRef]
  8. Shaikh, M.A. Environmental issues related with textile sector. Pak. Text. J. 2009, 10, 36–40. [Google Scholar]
  9. Üstün, G.E.; Solmaz, S.K.A.; Birgül., A. Regeneration of industrial district wastewater using a combination of Fenton process and ion exchange—A case study. Resour. Conserv. Recycl. 2007, 52, 425–440. [Google Scholar] [CrossRef]
  10. Rahman, A.; Urabe, T.; Kishimoto, N. Color removal of reactive procion dyes by clay adsorbents. Procedia Environ. Sci. 2013, 17, 270–278. [Google Scholar] [CrossRef] [Green Version]
  11. Kurniawan, T.A.; Sillanpää, M.E.; Sillanpää, M. Nanoadsorbents for remediation of aquatic environment: Local and practical solutions for global water pollution problems. Crit. Rev. Environ. Sci. Technol. 2012, 42, 1233–1295. [Google Scholar] [CrossRef]
  12. Sadegh, H.; Ali, G.A.; Gupta, V.K.; Makhlouf, A.S.H.; Shahryari-Ghoshekandi, R.; Nadagouda, M.N.; Sillanpää, M.; Megiel, E. The role of nanomaterials as effective adsorbents and their applications in wastewater treatment. J. Nanostructure Chem. 2017, 7, 1554. [Google Scholar] [CrossRef] [Green Version]
  13. Ahsan, S.; Rahman, M.A.; Kaneco, S.; Katsumata, H.; Suzuki, T.; Ohta, K. Effect of temperature on wastewater treatment with natural and waste materials. Clean Technol. Environ. Policy 2005, 7, 198–202. [Google Scholar] [CrossRef]
  14. Chamargore, J.; Bharad, J.; Madje, B.; Ubale, M. The removal of dye from aqueous solution by adsorption on low cost adsorbents. E-J. Chem. 2010, 7, 1003–1007. [Google Scholar] [CrossRef]
  15. Hamed, M.M.; Ahmed, I.; Metwally, S. Adsorptive removal of methylene blue as organic pollutant by marble dust as eco-friendly sorbent. J. Ind. Eng. Chem. 2014, 20, 2370–2377. [Google Scholar] [CrossRef]
  16. Khare, P.; Rao, N.; Kaul, S. Adsorption integrated photocatalytic degradation of Navinon and Foron class disperse dyes. SESI J. J. Sol. Energy Soc. India 2004, 14, 19. [Google Scholar]
  17. Alkaim, A.F.; Aljobree, A. White marble as an alternative surface for removal of toxic dyes (Methylene Blue) from aqueous solutions. Int. J. Adv. Sci. Technol. 2020, 29, 5470–5479. [Google Scholar]
  18. Nassar, Y.M.; Khatab, M. Cobalt ferrite nanoparticles via a template-free hydrothermal route as an efficient nano-adsorbent for potential textile dye removal. RSC Adv. 2016, 6, 79688–79705. [Google Scholar] [CrossRef]
  19. Ho, Y.; McKay, G.; Wase, D.; Forster, C. Study of the sorption of divalent metal ions on to peat. Adsorpt. Sci. Technol. 2000, 18, 639–650. [Google Scholar] [CrossRef]
  20. Quesada, H.B.; Baptista, A.T.A.; Cusioli, L.F.; Seibert, D.; de Oliveira Bezerra, C.; Bergamasco, R. Surface water pollution by pharmaceuticals and an alternative of removal by low-cost adsorbents: A review. Chemosphere 2019, 222, 766–780. [Google Scholar] [CrossRef] [PubMed]
  21. Bhadusha, N.; Ananthabaskaran, T. Kinetic, thermodynamic and equilibrium studies on uptake of Rhodamine B onto ZnCl2 activated low cost carbon. E-J. Chem. 2012, 9, 137–144. [Google Scholar] [CrossRef] [Green Version]
  22. Preethi, S.; Sivasamy, A.; Sivanesan, S.; Ramamurthi, V.; Swaminathan, G. Removal of safranin basic dye from aqueous solutions by adsorption onto corncob activated carbon. Ind. Eng. Chem. Res. 2006, 45, 7627–7632. [Google Scholar] [CrossRef]
  23. Yan, C.; Li, G.; Xue, P.; Wei, Q.; Li, Q. Competitive effect of Cu (II) and Zn (II) on the biosorption of lead (II) by Myriophyllum spicatum. J. Hazard. Mater. 2010, 179, 721–728. [Google Scholar] [CrossRef] [PubMed]
  24. Amin, M.T.; Alazba, A.A.; Shafiq, M. Adsorptive removal of reactive black 5 from wastewater using bentonite clay: Isotherms, kinetics and thermodynamics. Sustainability 2015, 7, 15302–15318. [Google Scholar] [CrossRef] [Green Version]
  25. Elhami, S.; Abrishamkar, M.; Esmaeilzadeh, L. Preparation and characterization of diethylentriamine-montmorillonite and its application for the removal of Eosin Y dye: Optimization, kinetic and isotherm studies. J. Sci. Ind. Res. 2013, 72, 461–466. [Google Scholar]
  26. Liu, Y.; Zheng, Y.; Wang, A. Enhanced adsorption of Methylene Blue from aqueous solution by chitosan-g-poly (acrylic acid)/vermiculite hydrogel composites. J. Environ. Sci. 2010, 22, 486–493. [Google Scholar] [CrossRef]
  27. Ricci, C.; Miliani, C.; Brunetti, B.G.; Sgamellotti, A. Non-invasive identification of surface materials on marble artifacts with fiber optic mid-FTIR reflectance spectroscopy. Talanta 2006, 69, 1221–1226. [Google Scholar] [CrossRef]
  28. Utara, S.; Phataib, P. Adsorption characteristics of direct violet dye by natural rubber chips. Adv. Mater. Res. 2013, 844, 391–394. [Google Scholar] [CrossRef]
  29. Ho, S. Removal of dyes from wastewater by adsorption onto activated carbon: Mini review. J. Geosci. Environ. Prot. 2020, 8, 120–131. [Google Scholar] [CrossRef]
  30. Mahmoodi, N.M.; Abdi, J.; Bastani, D. Direct dyes removal using modified magnetic ferrite nanoparticle. J. Environ. Health Sci. Eng. 2014, 12, 96. [Google Scholar] [CrossRef]
Figure 1. Effect of initial dye concentration on adsorption capacity of golden marble stone powder (a) Foron black dye, (b) Foron blue dye, and (c) Foron red dye.
Coatings 12 01955 g001
Figure 2. Effect of adsorbent dose on adsorption capacity (a) Foron black dye, (b) Foron blue dye (c), and Foron red dye.
Coatings 12 01955 g002
Figure 3. Effect of solution pH on adsorption capacity (a) pHinitial vs. pHfinal graph for pHpzc calculation, (b) Foron black dye, (c) Foron blue dye, and (d) Foron red dye.
Coatings 12 01955 g003
Figure 4. Effect of solution temperature on adsorption capacity (a) Foron black dye, (b) Foron blue dye, and (c) Foron red dye.
Coatings 12 01955 g004
Figure 5. FTIR analysis of (a) pure golden marble powder, (b) potassium ferricyanide treated golden marble powder, (c) sodium metasilicate treated golden marble powder, and (d) potassium ferricyanide and sodium metasilicate treated golden marble powder.
Coatings 12 01955 g005
Figure 6. SEM images of pure golden marble powder at various resolutions, (a) 200 nm, (b) 500 nm, (c) 1 μm, (d) 2 μm, (e) 4 μm, and (f) 5 μm.
Coatings 12 01955 g006
Figure 7. SEM images of potassium ferricyanide treated golden marble powder at various resolutions, (a) 200 nm, (b) 500 nm, (c) 1 μm, (d) 2 μm, (e) 5 μm, and (f) 10 μm.
Coatings 12 01955 g007
Figure 8. SEM images of sodium metasilicate treated golden marble powder at various resolutions, (a) 200 nm, (b) 500 nm, (c) 1 μm, (d) 2 μm, (e) 5 μm, and (f) 10 μm.
Coatings 12 01955 g008
Figure 9. SEM images of potassium ferricyanide and sodium metasilicate treated golden marble powder at various resolutions, (a) 200 nm, (b) 500 nm, (c) 500 nm, (d) 2 μm, (e) 4 μm, and (f) 5 μm.
Coatings 12 01955 g009
Table 1. Comparison of Langmuir, Fruendlich, Temkin, Dubinin-Radushkevich, and Harkin Jura isotherms for Foron black dye.
Isothermal ModelsAdsorbents
GMGMPGMSGMPS
Langmuirqmax (exp)87.80179.59150.79174.68
qcal (mg/g)144.92277.77188.67188.67
KL (L/mg)0.01460.02290.03460.1432
R20.890.930.930.99
Fruendlichqmax (exp)87.80179.59150.79174.68
qcal (mg/g)84.77171.18140.92175.07
Kf (L/mg)5.6118.6025.9582.42
R20.970.980.960.96
N1.661.982.625.85
Temkinqmax (exp)87.80179.59150.79174.68
qcal (mg/g)81.40166.5139.1173.9
B31.6557.0439.4824.75
R20.940.930.900.95
At (L/g)0.140.220.3913.66
Dubinin-Radushkevichqmax (exp)87.80179.59150.79174.68
qcal (mg/g)73.88146.62124.23162.37
R20.870.780.700.73
E (KJ/mol)−111.85−158.11−158.11−408.24
β (mol2/J2) 4 × 10 5 2 × 10 5 2 × 10 5 3 × 10 6
Harkin Juraqmax (exp)87.80179.59150.79174.68
qcal (mg/g)13.93735.74135.67375.235
R20.880.970.990.98
A−769.23−5000−5000−25,000
B−2.00−2.00−2.00−2.5
Table 2. Comparison of Langmuir, Fruendlich, Temkin, Dubinin-Radushkevich, and Harkin Jura isotherms for Foron blue dye.
Isothermal ModelsAdsorbents
GMGMPGMSGMPS
Langmuirqmax (exp)97.85121.88299.52369.2
qcal (mg/g)147.05212.761111.1454.54
KL (L/mg)0.0210.015 5 × 10 3 0.057
R20.990.960.420.98
Fruendlichqmax (exp)97.85121.88299.52369.2
qcal (mg/g)100.99126.47333.28370.91
Kf (L/mg)9.188.177.9865.45
R20.990.990.930.99
N1.871.631.132.38
Temkinqmax (exp)97.85121.88299.52369.2
qcal (mg/g)97.03120.5298.4356.2
B34.2246.77137.297.39
R20.980.970.990.98
At (L/g)0.180.150.120.61
Dubinin-Radushkevichqmax (exp)97.85121.88299.52369.2
qcal (mg/g)88.278107.93281.54308.36
R20.880.860.980.82
E (KJ/mol)−129.09−111.85−111.80−316.45
β (mol2/J2) 3 × 10 5 4 × 10 5 4 × 10 5 5 × 10 6
Harkin Juraqmax (exp)97.85121.88299.52369.2
qcal (mg/g)19.00520.55930.80981.137
R20.920.920.730.93
A−1428.5−1666.6−3333.3−25,000
B−1.99−2.00−1.66−2.00
Table 3. Comparison of Langmuir, Fruendlich, Temkin, Dubinin-Radushkevich, and Harkin Jura isotherms for Foron red dye.
Isothermal ModelsAdsorbents
GMGMPGMSGMPS
Langmuirqmax (exp)107.17224.81123.50124.83
qcal (mg/g)41.81227.27212.76135.13
KL (L/mg)8.850.1710.01610.0788
R20.970.970.980.96
Fruendlichqmax (exp)107.17224.81123.50124.83
qcal (mg/g)35.09230.18131.12116.26
Kf (L/mg)221.3474.387.58548.43
R20.670.840.960.86
N−2.473.871.565.10
Temkinqmax (exp)107.17224.81123.50124.83
qcal (mg/g)30.43225.2263.06116.0
B−28.5242.6947.5719.44
R20.750.810.990.82
At(L/g) 3.5 × 10 3 2.45−0.154.47
Dubinin-Radushkevichqmax (exp)107.17224.81123.50124.83
qcal (mg/g)38.89206.52113.87108.24
R20.920.820.950.61
E (KJ/mol)−223.6−316.2−111.7−267.2
β (mol2/J2) 1 × 10 5 5 × 10 6 4 × 10 5 7 × 10 6
Harkin Juraqmax (exp)107.17224.81123.50124.83
qcal (mg/g)−28.9871.5919.3844.98
R20.390.870.830.92
A2000−20,000−1428−10,000
B−0.4−2−1.85−3
Table 4. Comparison of pseudo-first-order kinetics and pseudo-second-order kinetics for Foron black dye using golden marble waste composites at different temperatures.
AdsorbentsPseudo-First-Order KineticsPseudo-Second-Order Kinetics
30 °C
QeK1R2QeK2R2
GM59.5788.74−0.0120.9999.0088.740.010.99
GMP101.88179.96−0.0110.98196.07179.960.010.99
GMS65.64153.89 9.4 × 10 3 0.98161.29153.890.010.99
GMPS68.81175.61−0.0140.98181.81175.610.020.99
40 °C
GM56.8477.28 6.6 × 10 3 0.9492.5977.280.010.94
GMP56.85170.10−0.0170.84175.43170.100.020.99
GMS43.27135.46−0.0140.94138.88135.460.020.99
GMPS51.89172.76−0.0110.97178.57172.760.020.99
50 °C
GM68.3280.05−0.020.9989.2880.050.020.99
GMP90.80162.58−0.010.99172.41162.580.010.99
GMS52.77136.52−0.020.98140.84136.520.021.00
GMPS67.67166.92−0.020.98172.41166.920.020.99
60 °C
GM46.0075.70−0.010.8982.6475.700.020.99
GMP45.49127.83−0.010.95131.57127.830.020.99
GMS48.37132.17−0.020.97136.98132.170.031.00
GMPS39.71158.24−0.010.99161.29158.240.020.99
70 °C
GM42.6662.67−0.010.9769.9362.670.020.99
GMP60.47114.80−0.020.99120.48114.800.020.99
GMS40.02123.49−0.010.99128.20123.490.020.99
GMPS60.08145.21−0.010.81151.51145.210.020.99
Table 5. Comparison of Pseudo-first-order kinetics and Pseudo-second-order kinetics for Foron blue dye using golden marble waste composites at different temperatures.
AdsorbentsPseudo-First-Order KineticsPseudo-Second-Order Kinetics
30 °C
QeK1R2QeK2R2
GM49.6597.58−0.010.99104.1697.580.020.99
GMP41.80127.62−0.010.99131.57127.620.020.99
GMS53.53297.84−0.010.99303.03297.840.020.99
GMPS46.33367.9−0.010.99370.37367.90.030.99
40 °C
GM34.6477.56−0.010.9981.9677.560.020.99
GMP30.95115.61−0.010.96119.04115.610.030.99
GMS35.55275.81−0.010.99277.77275.810.030.99
GMPS37.32345.90−0.010.99344.82345.900.030.99
50 °C
GM26.0457.53−0.010.9960.6057.530.030.99
GMP33.7795.58−0.010.9899.0095.580.030.99
GMS37.24257.79−0.010.99263.15257.790.030.99
GMPS34.21335.89−0.010.96333.33335.890.030.99
60 °C
GM18.3137.51−0.010.9939.8437.510.030.99
GMP26.0477.56−0.010.9980.0077.560.030.99
GMS29.86235.76−0.010.99238.09235.760.030.99
GMPS31.72325.87−0.010.98333.33325.870.030.99
70 °C
GM31.3629.50−0.010.995029.500.010.89
GMP26.0455.53−0.010.9958.8255.530.030.99
GMS38.53215.73−0.010.91217.3215.730.031.00
GMPS24.62305.85−0.010.98312.5305.850.030.99
Table 6. Comparison of pseudo-first-order kinetics and pseudo-second-order kinetics for Foron red dye using golden marble waste composites at different temperatures.
AdsorbentsPseudo-First-Order KineticsPseudo-Second-Order Kinetics
30 °C
QeK1R2QeK2R2
GM31.39114.41−0.01470.99117.64114.41 1.1 × 10 3 0.99
GMP26.01223.14−0.01010.98227.27223.14 1.2 × 10 3 0.99
GMS29.50122.37−0.01400.99125122.37 1.2 × 10 3 0.99
GMPS24.29127.67−0.01280.99129.87127.67 1.4 × 10 3 0.99
40 °C
GM19.25103.80−0.01150.99105.26103.80 1.7 × 10 3 0.99
GMP37.38204.58−0.01650.99208.33204.58 1.1 × 10 3 0.99
GMS26.04117.06−0.01350.99119.04117.06 1.4 × 10 3 0.99
GMPS28.05122.37−0.01420.99125122.37 1.3 × 10 3 0.99
50 °C
GM13.8990.54−0.01420.9991.7490.54 2.9 × 10 3 0.99
GMP29.90183.36−0.01490.99185.18183.36 1.3 × 10 3 0.99
GMS28.05109.11−0.01420.99111.11109.11 1.3 × 10 3 0.99
GMPS29.43114.41−0.01400.99117.64114.41 1.2 × 10 3 0.99
60 °C
GM24.2482.59−0.01280.9984.7482.59 1.3 × 10 3 0.99
GMP26.04170.10−0.01350.97172.41170.10 1.4 × 10 3 0.99
GMS28.0495.85−0.01420.9898.0395.85 1.2 × 10 3 0.99
GMPS29.57103.80−0.01120.97106.38103.80 1.0 × 10 3 0.99
70 °C
GM26.0464.02−0.01350.9766.6764.02 1.1 × 10 3 0.99
GMP33.04140.93−0.01240.94144.92140.93 1.0 × 10 3 0.99
GMS28.0495.85−0.01420.9898.0395.85 1.2 × 10 3 0.99
GMPS29.5782.59−0.01120.9785.4782.59 9.5 × 10 4 0.99
Table 7. Comparison of removal capacity of golden marble with other adsorbents for dyes.
AdsorbentsRemoval Capacity (mg/g)References
GM114.48This study
GMP224.81This study
GMS299.52This study
GMPS369.20This study
Natural Rubber0.0245[28]
Activated Carbon26[29]
Modified Magnetic Ferrite Nanoparticles55.5[30]
Publisher’s Note: MDPI stays neutral with regard to jurisdictional claims in published maps and institutional affiliations.

