Article

Metastable Phase Formation, Microstructure, and Dielectric Properties in Plasma-Sprayed Alumina Ceramic Coatings

1
Chair of Coatings Technology, Institute of Machine Tools and Production Technology (IWF), Faculty V Mechanical Engineering and Transport Systems, Technische Universität Berlin, Straße des 17. Juni 135, 10623 Berlin, Germany
2
Chair of High Voltage Engineering, Institute of Energy and Automation Technology, Faculty IV Electrical Engineering and Computer Science, Technische Universität Berlin, Straße des 17. Juni 135, 10623 Berlin, Germany
3
Chair of Advanced Ceramic Materials, Institute of Material Science and Technology, Faculty III Process Sciences, Technische Universität Berlin, Straße des 17. Juni 135, 10623 Berlin, Germany
4
Division Advanced Multi-Materials Processing, Bundesanstalt für Materialforschung und -prüfung (BAM), Unter den Eichen 44-46, 12203 Berlin, Germany
*
Author to whom correspondence should be addressed.
Coatings 2022, 12(12), 1847; https://doi.org/10.3390/coatings12121847
Submission received: 25 October 2022 / Revised: 17 November 2022 / Accepted: 23 November 2022 / Published: 29 November 2022
(This article belongs to the Special Issue High-Performance Dielectric Ceramic for Energy Storage Capacitors)

Abstract

:
The need for new solutions for electrical insulation is growing due to the increased electrification in numerous industrial sectors, opening the door for innovation. Plasma spraying is a fast and efficient way to deposit various ceramics as electrical insulators, which are used in conditions where polymers are not suitable. Alumina (Al 2 O 3 ) is among the most employed ceramics in the coating industry since it exhibits good dielectric properties, high hardness, and high melting point, while still being cost-effective. Various parameters (e.g., feedstock type, spray distance, plasma power) significantly influence the resulting coating in terms of microstructure, porosity, and metastable phase formation. Consequently, these parameters need to be investigated to estimate the impact on the dielectric properties of plasma-sprayed alumina coatings. In this work, alumina coatings with different spray distances have been prepared via atmospheric plasma spray (APS) on copper substrates. The microstructure, porosity, and corresponding phase formation have been analyzed with optical microscopy, X-ray diffraction (XRD), and scanning electron microscopy (SEM). Moreover, we present an in-depth analysis of the fundamental dielectric properties e.g., direct current (DC) resistance, breakdown strength, dielectric loss tangent, and permittivity. Our results show that decreasing spray distance reduces the resistivity from 6.31 × 10 9 Ω m (130 mm) to 6.33 × 10 8 Ω m (70 mm), while at the same time enhances the formation of the metastable δ -Al 2 O 3 phase. Furthermore, space charge polarization is determined as the main polarization mechanism at low frequencies.

Graphical Abstract

1. Introduction

Contemporary electrical insulation depends on high-performance polymers. However, these polymers are not useful in demanding environments (e.g., high temperature, strong abrasion) because they do not meet the technical requirements. Ceramics are considered promising candidates for protective coatings in terms of electrical, mechanical, and corrosive properties. Al 2 O 3 in particular is one of the most commonly used ceramics in the coating industry. This is due to the wide range of functional technical properties such as high dielectric strength, high-temperature stability, and high corrosion and wear resistance. Possible applications include high-temperature sensors, electrostatic chucks, and electromagnetic pumps [1,2,3]. To deposit various ceramics, atmospheric plasma spray technology is an effective process. Using plasma as a high-energy heat source, ceramic particles can be sprayed to obtain protective coatings within a very short time. Compared to other coating deposition processes such as sol-gel or dip coating, APS technology raises the potential of manufacturing ceramic coatings at high process speeds, high deposition rates, and increased levels of automation.
During plasma spraying, particles are transported by a carrier gas before being fed into the plasma jet. After injection into the hot core of the plasma jet, the particles are heated rapidly and accelerated to a high velocity. The fully or partly melted particles impact the substrate surface and form splats, which build up the final coating layer by layer. In practice, however, the coatings have defects, the most frequent being pores, crack networks, and delamination. Recently, thermally sprayed Al 2 O 3 and its dielectric properties has attracted a considerable amount of attention [4,5]. Nonetheless, many aspects are not yet fully understood, highlighting the pressing need to better understand and scrutinize the polarization and conductivity mechanisms acting within plasma-sprayed Al 2 O 3 coatings. Additionally, the processing parameters strongly influence the crystalline modifications of plasma-sprayed Al 2 O 3 . To a certain extent, the influence of the different crystal phases (e.g., γ -Al 2 O 3 ) on the dielectric properties has been studied [6]. Toma et al. reported lowered electrical resistivity values in humid environments for high-velocity oxygen fuel (HVOF) coatings containing mainly γ -Al 2 O 3 [7]. The hygroscopic nature of γ -Al 2 O 3 results in a high sensitivity towards water, or water vapor which, likely has a negative influence on the dielectric properties. However, rarely occurring polymorphs of alumina, and especially their applications as electrical insulators, remain largely unexplored. This is mainly because of technical difficulties in quantification and exact detection of the high-level structural disorder crystal structure of the polymorphs [8]. Furthermore, the rare occurrence of δ -Al 2 O 3 in plasma-sprayed coatings might be explained by the demanding conditions for phase formation, which happens at narrow temperature ranges [9].
Copper (Cu) is a crucial industrial metal used as a conducting material in many applications. The combination of excellent electrical conductivity and high mechanical strength promoted Cu to be a widely used material in various fields, such as electronics, nanotechnology, and aerospace [10,11,12]. Since Cu is extensively utilized as an electrical conductor, modern solutions are necessary to generally maintain electrical insulation performances. It is worth noting that deposition of insulating ceramic coatings on copper remains challenging. During the spray process, the substrate is usually heated up due to the impingement of hot particles. After cooling to ambient temperatures, thermal mismatch stresses arise due to differences in thermal expansion coefficients (TEC) of substrate and coating. This effect is of particular importance since the thermal expansion coefficients of Cu (16.7 × 10 6 K 1 at 300 K) is by a factor of ∼3 larger than that of Al 2 O 3 (5.2 × 10 6 K 1 at 300 K) [13,14]. Furthermore, Cu can undergo oxidation, which can significantly alter its surface structure and affect the material’s electrical and mechanical properties. Oxide formation is further increased at elevated temperatures through thermal oxidation [15]. That being the case, temperature control of the substrate is necessary to minimize or even eliminate the effects mentioned above.
The first section of this paper investigates the relationship between the spray parameters and the resulting microstructure of the final coating. In the second part, the crystalline phases of the deposits are studied. Finally, the last section discusses the dielectric properties of plasma-sprayed Al 2 O 3 coatings. All parts mentioned above have been put into context with the spray distance, which was the main parameter investigated in this study.

2. Experimental Procedure

2.1. Materials and Atmospheric Plasma Spraying (APS) Process

Oxygen-free copper (OFC) with a purity > 99.95% was chosen as the substrate material. The dimensions of the substrate plates were 70 mm × 85 mm × 4 mm for the DC resistivity and dielectric response measurements. For the breakdown tests, cubic samples with a height of 4 mm and an edge length of 15 mm have been prepared. To get a rough and oxide-free surface, the samples were prepared by grit blasting and subsequent cleaning in ethanol before the coating process. Grit blasting was carried out at a pressure of 4 bar, a blasting distance of 100 mm, and a blasting angle of 45° using corundum. For the plasma spray process, commercially available α -Al 2 O 3 powder (GTV GmbH, Luckenbach, Germany) was used as the base material (Figure 1). The particle size distribution was measured using a laser diffraction particle size analyzer (Mastersizer 3000, Malvern Instruments, Malvern, United Kingdom). The results are listed in Table 1. The true density of the powder was 3.96 g cm 3 , as determined with a He-pycnometer (AccuPyc II 1340, Micromeritics, Norcross, GA, USA). To achieve a high energy density of the plasma jet, the spray process was operated with an argon-hydrogen gas mixture (5:1). The particles were radially injected into the plasma jet with a carrier gas Ar flow rate of 5 Nlpm. The spray conditions were chosen based on preliminary experiments to produce dense alumina coatings. The main spraying parameters for the APS process are shown in Table 2. The temperature of the coating’s surface was kept below 250 °C and monitored via infrared (IR) thermometry (ThermoView Pi20, Fluke Process Instruments, Washington, WA, USA).
Dv(10), (50), and (90) are the 10th, 50th, and 90th percentiles of the volume-weighted cumulative curve and denotes the point in the particle size distribution where 10, 50, or 90 percent of the total volume of particles in the sample is less or equal to the respective value.

2.2. Characterization

After the coating process, the samples were metallographically processed including cutting, grinding, polishing, and embedding in epoxy resin (Struers EpoFix resin and hardener). The microstructures of the cross-sections were analyzed by means of SEM (Hitachi S-2700, Tokyo, Japan). The porosity was derived by converting the micrographs into binary images and measuring the ratio of dark voids in relation to the total area. Afterwards, the mean porosity and standard deviation were calculated using MATLAB software from 20 cross-section images. The porosity was determined in accordance with ASTM E2109-01(2021) [16]. Porosity data were analyzed using one-way analysis of variance (ANOVA) with a significance level of 0.05. For reliable evaluation of the thickness of the coating, at least eight measurements were performed, and the average thickness was calculated. Phase analysis of the coatings and the starting powder was conducted by X-ray diffraction with a Bruker D8 Advance (Bruker Corporation, Billerica, MA, USA) in Bragg-Brentano geometry with Cu radiation ( λ K α = 1.54056 Å) between 10 and 90 °2 θ with a step width of 0.02 °2 θ .

2.3. Dielectric Characterization

To measure the DC resistivity and the dielectric response function, a round electrode with a diameter of 40 mm was painted on the samples using conductive silver varnish. To minimize the effect of surface currents, a guard electrode was painted around it. The samples were conditioned as described above. The DC resistivity was measured using an electrometer (Keithley Instruments 6517B, Cleveland, OH, USA). The measurement was conducted in a grounded metal box under ambient conditions. The measurement voltage and duration were chosen in accordance with IEC 62631-3-1:2016 [17] to be 100 V and 100 min, respectively. The dielectric response of the samples was measured by means of a broadband dielectric analyzer (Novocontrol Alpha A. Analyzer, Montabaur, Germany) with a four-wire interface (Novocontrol ZG4, Montabaur, Germany). The measurement was carried out in the frequency band of 10 mHz to 100 kHz at a root mean square voltage of 1.5 V. As the samples used for these measurements were bigger in size and the measurements itself took a long time, only one sample per spraying distance was tested. As the volume of these samples was substantially bigger than that of the cubic samples designated for breakdown testing, and the investigated properties are integral in nature, it stands to reason that the results will be sufficiently precise.
The dielectric strength testing was performed in a converted oil tester (IOP-100A Touch, EA-Electronic GmbH, Essen, Germany) with opposing cylindrical rod electrodes at 50 Hz AC. The electrodes had a diameter of 6.4 mm with rounded edges and the upper electrode was equipped with a load force of 50 g. The tests were performed according to ASTM-D-149 [18] with an electrode of type 3. Before every measurement, the samples were dried at 120 °C for 3 h and subsequently left at ambient conditions for 12 h. The measurements were carried out under ambient conditions at a temperature of 22 °C and 22% relative humidity. Samples were placed horizontally between the electrodes and tested in air until breakdown at an effective voltage ramp of 0.5 kVs−1. In total, 48 samples have been analyzed. For each spraying distance, 12 cubic samples were tested. The breakdown tests were performed without any contact materials between the upper electrode and the coating. The dielectric strength ( E D ) was calculated according to Equation (1) with the effective voltage ( V e f f ) and the thickness (t).
E D = V e f f t
For solid insulating materials, dielectric breakdown data are expected to conform to Gumbel or Weibull distributions [19]. The results were therefore fitted to the two-parameter Weibull probability density function (Equation (2)).
P ( E D ) = m E D , 0 E D E D , 0 m 1 e E D E D , 0 m
where P ( E D ) is the breakdown probability, E D is the calculated dielectric strength, the scale parameter or characteristic strength is E D , 0 , and the shape parameter or Weibull modulus is m.

3. Results and Discussion

3.1. Microstructural Analysis

The cross-section images in Figure 2 show the typical microstructure for thermally sprayed coatings. All coatings exhibit a lamellar structure, partly unmolten particles, and pores.
At high spray distances, individual splats and the associated contact zone between splats (splat boundaries) can be identified, whereas the number of detectable splat boundaries at lower spray distances is hardly detectable. A high spray distance corresponds to a long trajectory of particles. Hence, particles have a lower temperature and spread on the surface, forming less flattened splats with a weaker intersplat bonding [20,21]. From Figure 2d, individually solidified splats with distinct splat boundaries are visible. In comparison, fewer splat boundaries are observed in Figure 2a. At low spray distances, molten particles are less prone to resolidification resulting from shorter trajectories outside of the hot core of the plasma jet. Accordingly, the surface temperature generated by impinging droplets is expected to be sufficient to promote grain growth through multiple splats [22].
Figure 2a shows vertical macro-cracks generated at a spray distance of 70 mm. This might be attributed to the residual stress originating in the high temperature gradients between the coating and substrate. Rapid cooling of particles generates quenching stress due to constrained volume change [23]. In addition, thermal stress arises from a mismatch between TEC of substrate and coating [24]. When a critical stress level is reached, it is expected that vertical cracks are formed as a relaxation mechanism [23,25]. From the optical micrographs, no oxidation layer between Cu and Al 2 O 3 is detectable. From Figure 2c, particle pull-outs can be identified from detached unmolten particles, which were generated during the grinding process of the mechanical cross sections.
We found a trend for porosity to increase with higher spray distances (Table 3). A possible explanation for our observation might be that the semi-molten particles flatten less upon impact on the substrate surface, leading to higher porosity levels [26]. In spite of our observation, the ANOVA showed no statistically significant difference in porosity between the four sample groups.
Furthermore, an increasing spray distance resulted in a decreased coating thickness, as reported in the literature [27]. The mean sample thickness ranges from 217 µm at a spray distance of 70 mm to 183 µm at a spray distance of 130 mm. The fraction of molten particles that reach the substrate declines with increasing spray distance. Resolidified particles do not adhere at the surface and thus do not contribute to the coating build-up, resulting in lower coating thickness.
The XRD patterns show a mix of several alumina phases. The starting powder consists almost entirely of α -Al 2 O 3 (JCPDS 46-1212) and traces of β -Al 2 O 3 (JCPDS 36-0154). In the coatings, the amount of α -Al 2 O 3 is reduced while γ -Al 2 O 3 (JCPDS 10-0425) emerges and predominates across all coatings (Figure 3). It is well known that thermal spraying of α -Al 2 O 3 feedstock powder leads to coatings with metastable γ -Al 2 O 3 as the dominant phase [28,29]. This effect is attributed to the lower nucleation energy required for γ -Al 2 O 3 to form from the melt. After impacting and rapid cooling of the molten particles, it is energetically more favorable to attain the metastable state. The beta phase existing in all samples, as well as the sharp reflexes of α -Al 2 O 3 , indicate high crystallinity and might be explained as un- or partly molten powder particles from the feedstock [30]. As the spray distance decreases, the intensity of the characteristic γ -Al 2 O 3 peak at 2-theta 45.96° shows a reduction, while simultaneously another peak is increasing at 2-theta (46.3°) (Figure 4). In previous studies, this peak has been identified as metastable δ -Al 2 O 3 (JCPDS 46-1215). Nevertheless, a reliable quantitative analysis is challenging due to the complexity of the coatings and the different possible crystallographic variants of δ -Al 2 O 3 , their atomic site occupancies, as well as suspected preferred orientation [31]. Alumina polymorphs such as δ / γ -Al 2 O 3 were observed in flame and plasma-sprayed alumina coatings and are considered intermediates before forming stable α -Al 2 O 3 [29]. The reported reaction path depends on the synthesis process and follows γ - → δ - → θ - → α -Al 2 O 3 [32,33]. From a crystal structure aspect, Al cations are positioned at the octahedral and tetrahedral lattice sites. To balance the Al-O ratio, the Al-sublattice consists of structural vacancies. The intermediate alumina phases show different degrees of ordering of these vacancies increasing in general from γ - to θ -Al 2 O 3 [34]. This ordering influences the dielectric properties as reported by L. Choong-Ki Lee et al., where first-principle calculations revealed that the permittivity is lowest for γ -Al 2 O 3 and increases progressively towards θ -Al 2 O 3 [35]. A shorter spraying distance produces a higher coating temperature, from both the higher temperature impact of the plasma jet, and impinging particles. Accordingly, an increased energy input at shorter spray distances favors a transition towards metastable δ -Al 2 O 3 . The nucleation from γ -Al 2 O 3 to δ -Al 2 O 3 is expected to be energetically more favorable than toward α -Al 2 O 3 , since a rearrangement of oxygen ions does not take place [29,31]. Studies regarding phase transitions in vapor-deposited alumina from A. L. Dragoo and J.J. Diamond confirm that δ -Al 2 O 3 becomes the predominant form before α -Al 2 O 3 appears [36].

3.2. DC Resistivity

Figure 5 presents the DC resistivity as a function of time. Since the resistivity keeps rising for the duration of the measurment, we considered the values after 100 min as the samples’ resistivity [37]. The values of the resistivity range from 6.33 × 10 8 Ω m (70 mm) to 6.31 × 10 9 Ω m (130 mm), showing a positive correlation between spray distance and resistivity. These results are in line with those previously reported in the literature regarding the insulating behavior of thermally sprayed Al 2 O 3 coatings ( 10 8 10 12 Ω m) [38,39,40]. One of the key factors influencing the dielectric properties lies in the microstructure of thermally sprayed coatings, and their associated defects. In a study by Beauvais et al., the influence of pores and cracks on the dielectric properties of plasma-sprayed alumina coatings was evaluated [41]. The results indicate that the crack orientation plays a crucial role in the motion of charges. It was shown that horizontal cracks act as charge barriers while vertical cracks act as pathways for charges. It might be assumed that higher thermal stress at shorter spray distances increases residual stress, further favoring vertical crack initiation. Consequently, the insulating properties of the coatings worsen at shorter spray distances. A. Ohmori et al. reported that the vertical crack density of plasma-sprayed Al 2 O 3 shows a dependency on spray distance. The number of vertical cracks per 10 µm increased from ∼1.0 to ∼1.5 when the spray distance decreased from 150 mm to 80 mm [42]. In our results, the porosity of all present coatings lies within the error range and cannot be stated as an indicator for influencing the DC resistivity (Table 3). Another factor that negatively affects the insulating capabilities of thermally sprayed Al 2 O 3 is humidity [43]. In particular, metastable γ -Al 2 O 3 is considered highly hygroscopic and easily adsorbs water, even at ambient conditions [7]. During water absorption, several H 2 O monolayers accumulate on the surface of the coating, as well as within the pores [6]. Physically and chemically adsorbed water tends to increase the electrical conductivity through protonic conduction [44]. The phase shift from γ -Al 2 O 3 to δ -Al 2 O 3 at shorter spray distances might be considered another influencing factor. The DC resistivity is at its lowest value for a spray distance of 70 mm, while the δ -Al 2 O 3 peak at 2-theta (46.5°) has its highest intensity (Figure 4 and Figure 5). Further investigations and more evidence are needed to show this correlation.

3.3. Relative Permittivity and Loss Factor

Figure 6 presents the relative permittivities of the samples. It can be observed that the permittivity decreases with increasing frequencies for all spraying distances, with the sample manufactured at the shortest spraying distance displaying a higher permittivity over the entire frequency band. This disparity is the strongest at low frequencies, with permittivities ranging from 33.4 (70 mm) to 65.2 (130 mm) at 10 mHz. At the upper end of the spectrum, at 100 kHz, the values range from 8.8 (70 mm) to 8.16 (110 mm). The trends of permittivity towards lower frequencies indicate the onset of interface polarization at around 100 Hz, also known as space charge polarization [37]. It can be observed that the rise of the permittivity towards low frequencies sets in at higher frequencies and rises more steeply for the samples with shorter spraying distances. It has been reported that the onset frequency of interfacial polarization in multi-phase systems scales with the conductivity of the most conductive phase [45]. This evidence supports our XRD and resistivity measurements. The samples sprayed at shorter distances display a higher degree and diversity of metastable phases. If the α -Al 2 O 3 in every sample has the same intrinsic conductivity, then the metastable phases must be the cause of the lower overall resistance measured for samples 70 mm and 90 mm. Therefore, the interface polarization onset frequencies for these samples are higher. Another possible explanation for the differences between the curves might be the suspected vertical cracks in the insulation. Under ambient conditions, these cavities tend to draw moisture, which in turn improves protonic conduction. Toward lower frequencies, this path becomes more conductive in comparison to the neighboring bulk alumina, reducing the effective length of the dielectric and increasing the capacity. The measurement device interprets this as a rise in bulk permittivity. These two explanations are not necessarily mutually exclusive.
At high frequencies, ohmic conduction vanishes in comparison to the capacitive one. Two possible explanations are that the moving charge carriers no longer accumulate at the internal interfaces, or that the dissipation current in the moist vertical cracks ceases. Therefore, the polarization is dominated by atomic and lattice polarization. Consequently, the respective relative permittivities of the samples all range around 8, with the 70 mm sample showing a slightly higher value, which can be accredited to the phase composition. Figure 7 shows the respective dielectric response of the samples. The curves show a trend that is similar to that of the permittivities, with the shorter spraying distances displaying a slightly higher loss. The values range from between 1.50 (70 mm) and 1.12 (130 mm) at 10 mHz to between 0.0162 (70 mm) and 0.00949 (110 mm) at 100 kHz. At high frequencies, the samples sprayed at a shorter distance show a slightly higher loss tangent. The differences markedly increase in the frequencies at which the interface polarization starts to affect the first sample. It is known that polarization mechanisms cause increasing losses during the frequencies at which the respective polarization mechanisms start to decay [37]. As the onset frequency of the interface polarization is different for each sample and so is the resulting peak in losses. The shift of these peaks may cause the curves to diverge at medium frequencies and to converge at the low end of the measured spectrum. Further investigation at lower frequencies is required to test this hypothesis.

3.4. Dielectric Strength

Table 3 shows the mean effective breakdown voltages Ṽeff and the mean dielectric strength results ED of the four different sample groups. The breakdown voltages range from 2.2 kV at 70 mm spraying distance to 2.05 kV at 110 mm. The dielectric strength is calculated with the mean of the breakdown voltage and the mean coating thickness. The mean calculated dielectric strength ranges from 10.5 kV·mm 1 to 12.9 kV·mm 1 . In Figure 8 the lines in the graph represent the Weibull density function determined as mentioned above and plotted in a double logarithmic probability grid. The dashed lines are a 95% confidence interval, and the circles represent the experimental data. The characteristic dielectric strength at 63% failure probability increases with the spraying distance. It ranges from 11 kV·mm 1 at 70 mm spraying distance to 14 kV·mm 1 at 130 mm. The Weibull modulus ranges from 11 at 130 mm distance to 21 at 110 mm spraying distance. All 12 measured values per spray distance are within the confidence interval.
The lower dielectric strength of the samples with the smaller coating distance could be related to the higher number of vertical microcracks in the coating, as discussed above for the DC resistance. Another reason for the lower dielectric strength of the thicker samples is described by Malec et al., who showed a 1/ t h i c k n e s s relation for alumina from 120 µm to 2.5 mm [46]. This can be observed in Figure 8. The characteristic strength of all tested specimens is slightly lower than the values in [43,47,48]. A possible explanation for this discrepancy is that the voltage source in our study is AC, which differs from the DC source used in the cited literature. Breakdown tests in solid materials with direct current tend to have higher DBS compared to AC [37]. The porosity in our specimens is also slightly higher than in the cited literature, which may also contribute to lower dielectric strength. Due to the thickness deviations of 5% to 8% and the small number of samples, the previously mentioned trend that different crystallographic phases affect the dielectric properties can neither be confirmed nor rejected.

4. Conclusions

Al 2 O 3 coatings were prepared by the plasma spraying process and their dielectric and structural properties were investigated. Several possibilities have been proposed which, either individually or collectively, influence the dielectric properties of plasma-sprayed Al 2 O 3 coatings. Based on our results, the following conclusions can be drawn.
  • The amount of δ -Al 2 O 3 phase in the coatings increased at shorter spray distances due to a higher thermal energy. To date, there are no studies regarding the impact of δ -Al 2 O 3 on the dielectric properties of thermally sprayed coatings. From our measurements, it might be speculated that δ -Al 2 O 3 lowers the overall dielectric properties.
  • In terms of microstructure, porosity was found to be lowest at the shortest spray distance of 70 mm. Nevertheless, the porosity of all coatings was in a similar range. The coating thickness decreased at longer spray distances due to lower deposition efficiency which results from a higher amount of cooling and deceleration of the particles.
  • The higher thermal energy at shorter spray distances is expected to influence the defect density of the deposited coatings. Therefore, reducing the DC resistivity at shorter spray distances is associated with increased vertical crack density. It is assumed that vertical cracks can serve as conductive paths and reduce the resistance of the coating. This effect may be further intensified due to the moisture sensitivity of Al 2 O 3 coatings and the subsequent protonic conductivity mechanisms.
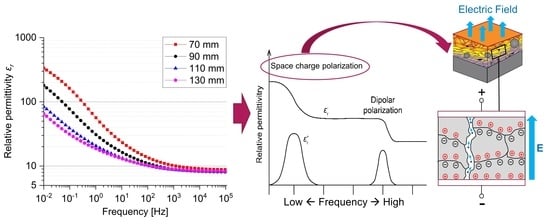
  • Relative permittivity and loss factor are found to be influenced by the microstructure and phase composition at different spray distances. At low frequencies, both permittivity and loss tangent are increased. This can be attributed to either increasing interfacial polarization, the conductive microcracks, or a combination of both.
  • Our results suggest that the dielectric strength tends to increase with larger spray distances. Previous studies have shown that increased porosity in thermally sprayed coatings decreases the dielectric strength. One possible explanation for the discrepancies we find in this trend could be due to the statistically non-significant differences in porosity, or the reduction in coating thickness at larger spray distances, which is reportedly beneficial for higher dielectric strength.
Our study suggests a spray distance of 130 mm for achieving high dielectric properties of alumina coatings. Future studies should explore polarization mechanisms at lower frequencies. Moreover, the relationship between metastable phases and the dielectric properties of plasma-sprayed Al 2 O 3 coatings is not yet fully resolved. The implementation of Rietveld refinement could provide further insight into crystal structure analysis of Al 2 O 3 coatings.

Author Contributions

Conceptualization, P.J.; methodology, P.J.; writing—review and editing, P.J., M.G., P.S., D.K., and C.R.; thermal spraying and SEM analysis, P.J.; dielectric measurements, M.G.; breakdown strength measurements, P.S.; XRD measurements, D.K. All authors have read and agreed to the published version of the manuscript.

Funding

The foundation of the described work has been developed in the scope of a project of the Werner von Siemens Centre (https://wvsc.berlin/, accessed on 25 October 2022) WvSC.EA “Electric motors 2.0” supported by the European Regional Development Fund (EFRE). We acknowledge support from the German Research Foundation and the Open Access Publication Fund of TU Berlin.

Institutional Review Board Statement

Not applicable.

Informed Consent Statement

Not applicable.

Data Availability Statement

Not applicable.

Acknowledgments

The authors would like to thank J. Nissen (TU Berlin) for SEM support. Additionally, Y. Hentschel (TU Berlin) is acknowledged for the metallographic preparation of all samples.

Conflicts of Interest

The authors declare no conflict of interest.

References

  1. Takeuchi, J.; Yamasaki, R.; Harada, Y. Development of a Low-Pressure Plasma Sprayed Ceramic Coating on Electrostatic Chucks for Semiconductor Manufacturing Equipment. In Proceedings of the International Thermal Spray Conference, Essen, Germany, 4–6 March 2002; DVS Deutscher Verband für Schweißen: Dusseldorf, Germany, 2002; pp. 960–964. [Google Scholar] [CrossRef]
  2. Gao, J.; Duan, F.L.; Yu, C.; Meng, W.; Liu, L.; Ding, G.; Zhang, C.; Wang, Y. Electrical insulation of ceramic thin film on metallic aero-engine blade for high temperature sensor applications. Ceram. Int. 2016, 42, 19269–19275. [Google Scholar] [CrossRef]
  3. Varghese, P.; Vetrivendan, E.; Krishnan, R.; Mathews, T.; Ningshen, S. Plasma sprayed alumina-yttria composite ceramic coating for electrical insulation applications. Surf. Coat. Technol. 2021, 405, 126566. [Google Scholar] [CrossRef]
  4. Bajgiran, M.M.; Rad, M.R.; McDonald, A.; Moreau, C. Microstructure, phase and dielectric strength of thermally sprayed alumina layers in coating-based heating systems. Int. J. Appl. Ceram. Technol. 2021, 18, 1641–1656. [Google Scholar] [CrossRef]
  5. Ctibor, P.; Sedláček, J.; Neufuss, K. Influence of chemical composition on dielectric properties of Al2O3 and ZrO2 plasma deposits. Ceram. Int. 2003, 29, 527–532. [Google Scholar] [CrossRef]
  6. Caldararu, M.; Postole, G.; Hornoiu, C.; Bratan, V.; Dragan, M.; Ionescu, N.I. Electrical conductivity of γ-Al2O3 at atmospheric pressure under dehydrating/hydrating conditions. Appl. Surf. Sci. 2001, 181, 255–264. [Google Scholar] [CrossRef]
  7. Toma, F.L.; Berger, L.M.; Scheitz, S.; Langner, S.; Rödel, C.; Potthoff, A.; Sauchuk, V.; Kusnezoff, M. Comparison of the microstructural characteristics and electrical properties of thermally sprayed Al2O3 coatings from aqueous suspensions and feedstock powders. J. Therm. Spray Technol. 2012, 21, 480–488. [Google Scholar] [CrossRef] [Green Version]
  8. Kovarik, L.; Bowden, M.; Andersen, A.; Jaegers, N.R.; Washton, N.; Szanyi, J. Quantification of High-Temperature Transition Al2O3 and Their Phase Transformations. Angew. Chem. Int. Ed. 2020, 59, 21719–21727. [Google Scholar] [CrossRef] [PubMed]
  9. Gao, J.; Xiong, X.; Gao, Y. The effect of the δ/γ phase on the dielectric properties of plasma sprayed Al2O3 coatings. J. Mater. Sci. Mater. Electron. 2017, 28, 12015–12020. [Google Scholar] [CrossRef]
  10. Li, Z.; Khuje, S.; Chivate, A.; Huang, Y.; Hu, Y.; An, L.; Shao, Z.; Wang, J.; Chang, S.; Ren, S. Printable Copper Sensor Electronics for High Temperature. ACS Appl. Electron. Mater. 2020, 2, 1867–1873. [Google Scholar] [CrossRef]
  11. Lührs, L.; Weissmüller, J. Nanoporous Copper-Nickel—Macroscopic bodies of a strong and deformable nanoporous base metal by dealloying. Scr. Mater. 2018, 155, 119–123. [Google Scholar] [CrossRef] [Green Version]
  12. Boccardi, S.; Ciampa, F.; Meo, M. Design and development of a heatsink for thermo-electric power harvesting in aerospace applications. Smart Mater. Struct. 2019, 28, 105057. [Google Scholar] [CrossRef]
  13. Hayashi, H.; Watanabe, M.; Inaba, H. Measurement of thermal expansion coefficient of LaCrO3. Thermochim. Acta 2000, 359, 77–85. [Google Scholar] [CrossRef]
  14. Kroeger, F.R.; Swenson, C.A. Absolute linear thermal-expansion measurements on copper and aluminum from 5 to 320 K. J. Appl. Phys. 1977, 48, 853–864. [Google Scholar] [CrossRef]
  15. Peter, R.; Petravic, M. Initial Stages of Oxide Formation on Copper Surfaces during Oxygen Bombardment at Room Temperature. J. Phys. Chem. C 2021, 125, 25290–25297. [Google Scholar] [CrossRef]
  16. ASTM E2109-01; Standard Test Methods for Determining Area Percentage Porosity in Thermal Sprayed Coatings. ASTM International: West Conshohocken, PA, USA, 2021.
  17. EN IEC 62631-3-4:2019; Dielectric and Resistive Properties of Solid Insulating Materials—Part 3–4: Determination of Resistive Properties (DC Methods). IEC International Electrotechnical Commission: Geneva, Switzerland, 2019.
  18. ASTM D149-20; Standard Test Method for Dielectric Breakdown Voltage and Dielectric Strength of Solid Electrical Insulating Materials at Commercial Power Frequencies. ASTM International: West Conshohocken, PA, USA, 2020.
  19. Dissado, L.A. Theoretical basis for the statistics of dielectric breakdown. J. Phys. D Appl. Phys. 1990, 23, 1582–1591. [Google Scholar] [CrossRef]
  20. Vardelle, M.; Vardelle, A.; Fauchais, P. Spray parameters and particle behavior relationships during plasma spraying. J. Therm. Spray Technol. 1993, 2, 79–91. [Google Scholar] [CrossRef]
  21. Di Girolamo, G.; Brentari, A.; Blasi, C.; Serra, E. Microstructure and mechanical properties of plasma sprayed alumina-based coatings. Ceram. Int. 2014, 40, 12861–12867. [Google Scholar] [CrossRef]
  22. Bengtsson, P.; Johannesson, T. Characterization of microstructural defects in plasma-sprayed thermal barrier coatings. J. Therm. Spray Technol. 1995, 4, 245–251. [Google Scholar] [CrossRef]
  23. Ghara, T.; Bandyopadhyay, P.P. Mechanical Properties and Residual Stress Depth Profiles of Plasma Sprayed Ceramic Coatings Deposited Under Comparable Particle Temperature and Velocity. J. Therm. Spray Technol. 2022, 31, 1889–1905. [Google Scholar] [CrossRef]
  24. Valarezo, A.; Shinoda, K.; Sampath, S. Effect of Deposition Rate and Deposition Temperature on Residual Stress of HVOF-Sprayed Coatings. J. Therm. Spray Technol. 2020, 29, 1322–1338. [Google Scholar] [CrossRef]
  25. Shinde, S.V.; Sampath, S. Interplay between cracking and delamination in incrementally deposited plasma sprayed coatings. Acta Mater. 2021, 215, 117074. [Google Scholar] [CrossRef]
  26. Karthikeyan, S.; Balasubramanian, V.; Rajendran, R. Developing empirical relationships to estimate porosity and microhardness of plasma-sprayed YSZ coatings. Ceram. Int. 2014, 40, 3171–3183. [Google Scholar] [CrossRef]
  27. Datta, S.; Pratihar, D.K.; Bandyopadhyay, P.P. Modeling of plasma spray coating process using statistical regression analysis. Int. J. Adv. Manuf. Technol. 2013, 65, 967–980. [Google Scholar] [CrossRef]
  28. Heintze, G.N.; Uematsu, S. Preparation and structures of plasma-sprayed γ- and α Al2O3 coatings. Surf. Coat. Technol. 1992, 50, 213–222. [Google Scholar] [CrossRef]
  29. McPherson, R. Formation of metastable phases in flame- and plasma-prepared alumina. J. Mater. Sci. 1973, 8, 851–858. [Google Scholar] [CrossRef]
  30. Stahr, C.C.; Saaro, S.; Berger, L.M.; Dubský, J.; Neufuss, K.; Herrmann, M. Dependence of the stabilization of α-Alumina on the spray process. J. Therm. Spray Technol. 2007, 16, 822–830. [Google Scholar] [CrossRef]
  31. Kovarik, L.; Bowden, M.; Genc, A.; Szanyi, J.; Peden, C.H.; Kwak, J.H. Structure of δ-alumina: Toward the atomic level understanding of transition alumina phases. J. Phys. Chem. C 2014, 118, 18051–18058. [Google Scholar] [CrossRef]
  32. Levin, I.; Brandon, D. Metastable alumina polymorphs: Crystal structures and transition sequences. J. Am. Ceram. Soc. 1998, 81, 1995–2012. [Google Scholar] [CrossRef]
  33. Penn, S.J.; Alford, N.M.N.; Templeton, A.; Wang, X.; Xu, M.; Reece, M.; Schrapel, K. Effect of porosity and grain size on the microwave dielectric properties of sintered alumina. J. Am. Ceram. Soc. 1997, 80, 1885–1888. [Google Scholar] [CrossRef]
  34. Rudolph, M.; Motylenko, M.; Rafaja, D. Structure model of γ-Al2O3 based on planar defects. IUCrJ 2019, 6, 116–127. [Google Scholar] [CrossRef] [Green Version]
  35. Lee, C.K.; Cho, E.; Lee, H.S.; Seol, K.S.; Han, S. Comparative study of electronic structures and dielectric properties of alumina polymorphs by first-principles methods. Phys. Rev. B Condens. Matter Mater. Phys. 2007, 76, 1–7. [Google Scholar] [CrossRef] [Green Version]
  36. Dragoo, A.L.; Diamond, J.J. Transitions in Vapor-Deposited Alumina from 300° to 1200 °C. J. Am. Ceram. Soc. 1967, 50, 568–574. [Google Scholar] [CrossRef]
  37. Kuechler, A. Hochspannungstechnik; Springer: Berlin/Heidelberg, Germany, 2018; ISBN 978-3-642-11992-7. [Google Scholar]
  38. Swindeman, C.; Seals, R.; White, R.; Murray, W.; Cooper, M. An Investigation of the Electrical Behavior of Thermally-Sprayed Aluminum Oxide; Oak Ridge National Lab. (ORNL): Oak Ridge, TN, USA, 1996. [Google Scholar] [CrossRef] [Green Version]
  39. Pawłowski, L. The relationship between structure and dielectric properties in plasma-sprayed alumina coatings. Surf. Coat. Technol. 1988, 35, 285–298. [Google Scholar] [CrossRef]
  40. Prudenziati, M. Development and the implementation of high-temperature reliable heaters in plasma spray technology. J. Therm. Spray Technol. 2008, 17, 234–243. [Google Scholar] [CrossRef]
  41. Beauvais, S.; Guipont, V.; Jeandin, M.; Juve, D.; Treheux, D.; Robisson, A.; Saenger, R. Influence of Defect Orientation on Electrical Insulating Properties of Plasma-Sprayed Alumina Coatings. J. Electroceram. 2005, 15, 65–74. [Google Scholar] [CrossRef]
  42. Ohmori, A.; Li, C.J.; Arata, Y. Influence of Plasma Spray Conditions on the Structure of Al2O3 Coatings (Surface Processing). Trans. JWRI 1990, 19, 259–270. [Google Scholar]
  43. Niittymäki, M.; Lahti, K.; Suhonen, T.; Metsäjoki, J. Effect of temperature and humidity on dielectric properties of thermally sprayed alumina coatings. IEEE Trans. Dielectr. Electr. Insul. 2018, 25, 908–918. [Google Scholar] [CrossRef]
  44. Fukatsu, N.; Kurita, N. Proton conduction in α-alumina and its application to hydrogen sensor for molten metals. Ionics 2007, 13, 183–194. [Google Scholar] [CrossRef]
  45. Samet, M.; Levchenko, V.; Boiteux, G.; Seytre, G.; Kallel, A.; Serghei, A. Electrode polarization vs. Maxwell-Wagner-Sillars interfacial polarization in dielectric spectra of materials: Characteristic frequencies and scaling laws. J. Chem. Phys. 2015, 142. [Google Scholar] [CrossRef]
  46. Malec, D.; Bley, V.; Talbi, F.; Lalam, F. Contribution to the understanding of the relationship between mechanical and dielectric strengths of Alumina. J. Eur. Ceram. Soc. 2010, 30, 3117–3123. [Google Scholar] [CrossRef]
  47. Niittymäki, M.; Lahti, K.; Suhonen, T.; Kanerva, U.; Metsäjoki, J. Influence of humidity and temperature on the dielectric properties of thermally sprayed ceramic MgAl2O4 coatings. In Proceedings of the 2014 IEEE Conference on Electrical Insulation and Dielectric Phenomena (CEIDP 2014), Des Moines, IA, USA, 19–22 October 2014; pp. 94–97. [Google Scholar] [CrossRef]
  48. Niittymäki, M.; Suhonen, T.; Metsäjoki, J.; Lahti, K. DC Conduction and Breakdown Behavior of Thermally Sprayed Ceramic Coatings. IEEE Trans. Dielectr. Electr. Insul. 2017, 24, 499–510. [Google Scholar] [CrossRef]
Figure 1. Scanning electron microscopy (SEM) micrograph showing the morphology of α -Al 2 O 3 powder used.
Coatings 12 01847 g001
Figure 2. SEM micrographs of the sample’s cross-section (magnification 200× and 1000×). The spray distance is depicted in the following order—(a) 70 mm; (b) 90 mm; (c) 110 mm; (d) 130 mm. A—macro-crack; B—pore; C—unmolten particle; D—splat boundary.
Coatings 12 01847 g002
Figure 3. XRD analysis of the Al 2 O 3 feedstock powder (scaling factor of x0.25) and the deposited coatings at different spray distances.
Coatings 12 01847 g003
Figure 4. Detailed excerpt from the XRD analysis of Al 2 O 3 samples showing a rising peak at 2 θ (46.3°) toward lower spray distances.
Coatings 12 01847 g004
Figure 5. DC resistivity of Al 2 O 3 coatings as a function of time.
Coatings 12 01847 g005
Figure 6. Relative permittivity of Al 2 O 3 coatings as a function of frequency.
Coatings 12 01847 g006
Figure 7. Dissipation factor of Al 2 O 3 coatings as a function of frequency.
Coatings 12 01847 g007
Figure 8. Weibull density function of Al 2 O 3 coatings at different spray distances with corresponding Weibull parameters m and E D , 0 .
Coatings 12 01847 g008
Table 1. Size distribution of α -Al 2 O 3 particles used.
Particle Size Distribution ( μ m)
Dv(10)20.5
Dv(50)33.3
Dv(90)53.3
Table 2. Main spray parameters.
Plasma Spray Parameters
Plasma power (kW)35
Primary gas Ar flow rate (Nlpm)30
Secondary gas H 2 flow rate (Nlpm)6
Robot scanning velocity (mm/s)250
Powder feed rate (g/min)40
Spray distance (mm)130, 110, 90, 70
Nozzle diameter (mm)6
Table 3. The microstructural parameters (porosity, thickness, main phase) as well as the effective breakdown voltage (Ṽeff), mean normalized dielectric strength (ED), DC resistivity, relative permittivity ( ϵ r ), and dissipation factor ( δ ) at 50 Hz.
SampleThickness (µm)Porosity (%)eff (kV)ED (kV/mm) ϵ r @ 50 Hztan δ @ 50 HzDC Resistivity ( Ω m)Main Phase
70 mm217 ± 115.4 ± 0.82.2 ± 0.210.5 ± 0.915.60.4356.3 × 10 8 α , γ , δ
90 mm199 ± 175.7 ± 0.82.2 ± 0.211.3 ± 0.812.20.3021.0 × 10 9 α , γ , δ
110 mm191 ± 126.4 ± 1.12.1 ± 0.111.2 ± 0.810.80.1964.3 × 10 9 α , γ
130 mm183 ± 146.3 ± 0.92.1 ± 0.212.9 ± 1.310.90.1666.3 × 10 9 α , γ
Publisher’s Note: MDPI stays neutral with regard to jurisdictional claims in published maps and institutional affiliations.

