Article

Growth and Optical Properties of Ga2O3 Layers of Different Crystalline Modifications

by
Andrey V. Osipov
1,*,
Shukrillo Sh. Sharofidinov
2,
Elena V. Osipova
1,
Andrey V. Kandakov
1,
Andrey Y. Ivanov
3 and
Sergey A. Kukushkin
1
1
Institute for Problems in Mechanical Engineering of the Russian Academy of Sciences, 199178 Saint-Petersburg, Russia
2
Ioffe Institute of the Russian Academy of Sciences, 194021 Saint-Petersburg, Russia
3
Department of Advanced Data Transfer Systems, ITMO University, 197101 Saint-Petersburg, Russia
*
Author to whom correspondence should be addressed.
Coatings 2022, 12(12), 1802; https://doi.org/10.3390/coatings12121802
Submission received: 29 October 2022 / Revised: 18 November 2022 / Accepted: 21 November 2022 / Published: 23 November 2022
(This article belongs to the Special Issue Perspective Coatings for Optical Materials Modifications)

Abstract

:
In the present work, a new method of growing layers of three main crystal modifications of Ga2O3, namely α-phase, ε-phase, and β-phase, with thickness of 1 µm or more was developed. The method is based on the use of two approaches, namely a combination of Ga2O3 growth using the hydride vapor-phase epitaxy (HVPE) method and the use of a silicon crystal with a buffer layer of dislocation-free silicon carbide as a substrate. As a result, Ga2O3 gallium oxide layers of three major Ga2O3 crystal modifications were grown, namely, α-phase, ε-phase, and β-phase. The substrate temperatures and precursor flux values at which it is possible to grow only α-phase, only ε-phase, or only β-phase without a mixture of these phases were established. It was found that the metastable α- and ε-phases change into the stable β-phase when heated above 900 °C. Experimentally obtained Raman and ellipsometric spectra of α-phase, ε-phase, and β-phase of Ga2O3 are presented. The theoretical study of the Raman spectra and the dependences of dielectric function on photon energy for all three phases was carried out. The vibrations of Ga2O3 atoms corresponding to the main lines of the Raman spectrum of the α-phase, ε-phase, and β-phase were simulated by density functional methods.

1. Introduction

In recent years, there has been a great interest in the growth of the so-called transparent conductors, which are often represented by metal oxides, such as zinc oxide ZnO, magnesium oxide MgO, gallium oxide Ga2O3 and some other oxides [1]. Among these materials, gallium oxide Ga2O3 excels [2]: first, it is a semiconductor with a large bandgap of ~ 5 eV; second, it has a very high breakdown voltage of ~ 8 MV   cm 1 ; third, it is easily doped, which makes it very promising for applications in micro- and optoelectronics. In addition, it is easily mixed with the Cr2O3 magnetic material, which makes it promising for spintronics. Another important feature of Ga2O3 is that it can be in several crystalline modifications. Reviews [2,3,4] indicate five phases as the main ones, namely, the stable β phase with the monoclinic structure C 2 / m , and the metastable phases: ε phase, with the orthorhombic structure P n a 2 1 ; α phase, with the rhombohedral structure R 3 ¯ c (corundum structure); δ phase, with the body-centered cubic structure l a 3 ¯ ; and γ phase, with the cubic structure F d 3 ¯ m . At present there is also great interest in modeling the properties of Ga2O3, which is related to the prospects of using Ga2O3 in various microelectronic devices [3,4,5,6,7]. In particular, the influence of point defects on the electrical and optical properties of Ga2O3 has been investigated in [8,9,10]. Despite quite a large number of metastable phases, it is extremely difficult to obtain them, because generally only the stable β phase grows. At present, a sufficiently large number of methods to grow Ga2O3 have been developed [1,2,3,4]. These are various volumetric growth technologies, molecular-beam epitaxy (MBE), chemical vapor deposition (CVD), metal-organic chemical vapor deposition (MOCVD), as well as hydride vapor-phase epitaxy (HVPE) methods [7,11]. To grow Ga2O3 layers, as a rule, different orientations of sapphire Al2O3 crystals, as well as silicon in the (100) orientation, are used as substrates [2,3,4]. Both sapphire and silicon have a number of well-known drawbacks. Sapphire is a dielectric, which substantially limits the application of the resulting layers in microelectronics; moreover, it is hard to etch out and process it. Silicon can conduct electric current, and it is much easier to etch out and process, but Ga2O3 grows significantly worse on it [2]. First, silicon badly orients the growing layers of Ga2O3; second, oxygen O2 and water H2O, which are used as reagents to obtain Ga2O3, react with silicon to form amorphous silicon dioxide SiO2, which further worsens the epitaxy of Ga2O3 [7].
In this work, it is proposed to grow Ga2O3 layers not just on silicon, but on silicon Si(111) with a dislocation-free silicon carbide SiC buffer layer grown by the method of coordinated substitution of atoms (MCSA) [12,13]. The SiC(111) buffer layer protects silicon from oxidation and significantly improves the orientation of the growing Ga2O3 layers [7]. It is very likely that one of the reasons for this is the oxide layer on Si, which is impossible to get rid of when growing Ga2O3. If a SiC layer is simply deposited on a silicon substrate, for example, by the CVD method, then it will be even worse than without SiC, because a huge number of misfit dislocations at the Si/SiC interface (lattice misfit parameter is 20%) are formed, which then sprout into Ga2O3 and degrade its quality. In a series of papers [14,15,16,17], the MCSA was developed to obtain dislocation-free layers of silicon carbide of the cubic 3C-SiC polytype on silicon by a chemical reaction of silicon with carbon monoxide CO gas. This substitution reaction replaces half of the Si atoms in the diamond-like silicon lattice with C atoms in a coordinated manner. The term “coordinated” means that the removal of the Si atom from the lattice and the incorporation of the C atom in its place by the chemical reaction occur simultaneously [13,15].
2Si (crystal) + CO (gas) = SiC (crystal) + SiO (gas) ↑
The oxygen atom plays here the role of a catalyst for the substitution reaction. A transition state of reaction (1), corresponding to the energy maximum along the reaction path, is represented by an almost equilateral triangle with Si, C, and O atoms at its vertices [15]. After overcoming this barrier with a height of 1.2 eV, the SiO molecule leaves the system. Such a mechanism of the coordinated substitution preserves the structure of the initial Si cubic lattice, which ensures the growth of the cubic 3C-SiC polytype, exclusively [12,13]. This mechanism is realized on the Si surface of any orientation, but a particularly high quality of the interface between Si and SiC is found on the (111) surface [12]. Numerous microscopic studies have shown that the 3C-SiC(111)/Si(111) interface formed by the MCSA does not contain lattice misfit dislocations [12,13], because 5 cells of 3C-SiC almost perfectly match with 4 cells of Si. Only various stacking faults are formed, in particular, twins [12], which fundamentally distinguishes the MCSA from traditional growth methods, such as the CVD, where numerous lattice misfit dislocations are formed [1]. A detailed comparison of the MCSA method with others was made in a recent review [13].
The purpose of this work is to produce high-quality Ga2O3 layers of various crystalline modifications on the 3C-SiC(111)/Si(111) hybrid substrates by the HVPE method in a wide temperature range of 500–1000 °C and to study the Raman and ellipsometric spectra (dielectric function) of the obtained phases.

2. Materials and Methods

Ga2O3 layers were grown on standard silicon 3-inch wafers oriented with a declination of 4° from the base (111) orientation towards the (110) direction. Silicon was doped with phosphorus, resistivity > 10 3   Ω   cm . First, dislocation-free 3C-SiC(111) buffer layers of 60–100 nm thickness were grown on silicon by the MCSA by chemical reaction (1). The temperature of the SiC synthesis was 1300 °C, pressure of CO gas was 100 Pa, synthesis time was 10 min. Technical details of the SiC synthesis by the MCSA method are given in reviews [12,13]. A typical X-ray diffraction (XRD) spectrum of a 3C-SiC(111)/Si(111) hybrid substrate produced this way is shown in Figure 1a.
It is clearly seen that only the peaks corresponding to the (111) orientation are presented in the spectrum; i.e., the silicon substrate completely orients the growing 3C-SiC layer obtained by the MCSA [12,13]. The Raman spectrum of a 3C-SiC(111)/Si(111) hybrid substrate obtained this way is shown in Figure 1b. It is just a combination of Si lines and two standard cubic SiC lines (798 cm−1 and 970 cm−1) [13].
An ellipsometric spectrum of the SiC-3C(111)/Si(111) hybrid substrate measured by the VUV-VASE ultraviolet rotating-analyzer ellipsometer (J.A. Woollam Co., Lincoln, Dearborn, MI, USA) in the photon energy range 0.5–9.3 eV, is shown in Figure 2. To analyze this dependence, it is sufficient to use the simplest single-layer ellipsometric model [18] consisting of a substrate containing Si, SiC, pores, and a SiC layer with roughness on its surface. This model gives a thickness of the SiC layer of ~ 80 nm.
Ga2O3 layers were grown on the 3C-SiC(111)/Si(111) hybrid substrate by HVPE by the following chemical reaction:
2 GaCl + 3 2   O 2 = Ga 2 O 3 + Cl 2
Gallium chloride was synthesized directly in the source zone of the reactor with gaseous hydrogen chloride (HCl 99.999%) passing over metallic gallium (Ga 99.9999%). The yield of the GaCl synthesis reaction was about 85%. The oxygen required for the formation of gallium oxide was supplied in a mixture with argon (20% oxygen, 80% argon). The synthesis of gallium oxide was carried out under conditions of excess oxygen flow. The ratio of the components of the VI/III groups was in the range of 3–5. The Ga2O3 deposition rate was determined by the HCl flow through the gallium source and depended on the deposition temperature, which varied over a wide range of 500–1000 °C. With a total gas flow of ~ 5 slm, the rate of Ga2O3 deposition started from approximately 0.4 0.5   μ m / min at 500 °C and ended with values of 0.8 1.0   μ m / min at 1000 °C. The deposition time was chosen to be approximately 1 2   min in order to obtain a Ga2O3 layer with a thickness of approximately ~ 1   μ m . After the end of the growth, the substrate was cooled in an argon flow to room temperature.
In order to find out the nature of oscillations corresponding to each line of the Raman spectrum, this spectrum was calculated by methods of the density-functional theory (DFT) by utilizing the Quantum Espresso code [19]. In all calculations periodic boundary conditions in all three dimensions were considered, the exchange-correlation contribution was calculated using the GGA-PBESol functional [20]. To integrate over the Brillouin zone, a grid of k-points was generated by the Monkhorst–Pack scheme so that the distance between them was no more than 0.25 Å 1 . All calculations used the norm-conserving pseudopotentials ONCVPSP v0.4.1 (stringent) (http://www.pseudo-dojo.org/ (accessed on 20 November 2022)) and the cutoff energy of plane waves of 850 eV corresponding to the highest available accuracy.

3. Results

The research has shown that different temperatures of the synthesis produce different phases of Ga2O3.

3.1. Stable β Phase with Monoclinic Structure C 2 / m

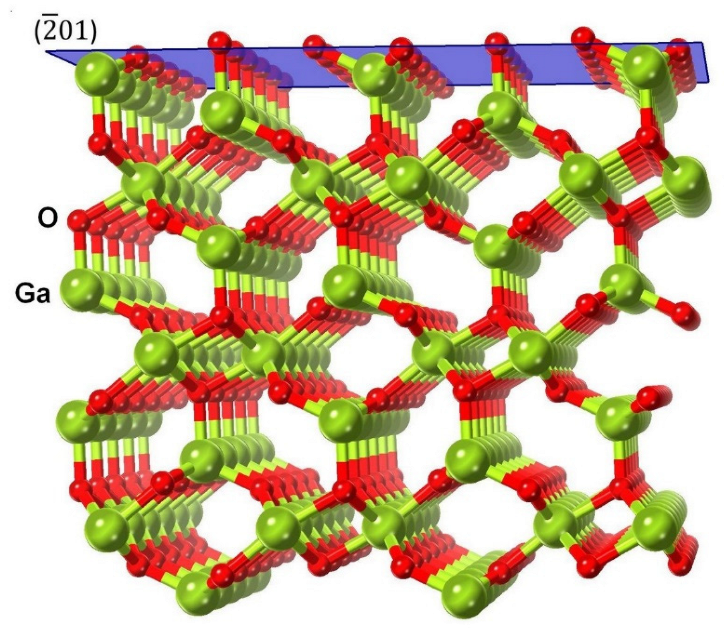
At a temperature of 800–1000 °C, the deposition of Ga2O3 resulted in the stable β phase, as in the vast majority of other experiments [2,4,21]. Figure 3 shows a typical XRD spectrum of a Ga2O3 sample grown on the 3C-SiC(111)/Si(111) hybrid substrate at 900 °C. It can be seen that there is only the β phase, and its < 2 ¯ 01 > direction is oriented upwards.
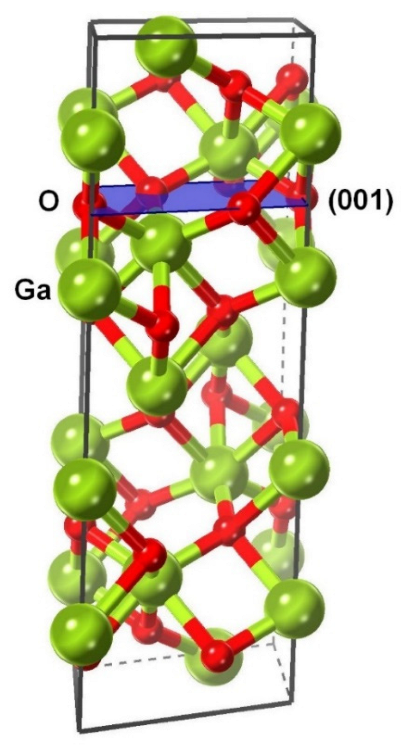
A configuration of atoms in β -Ga2O3 with the < 2 ¯ 01 > direction oriented upwards is shown in Figure 4.
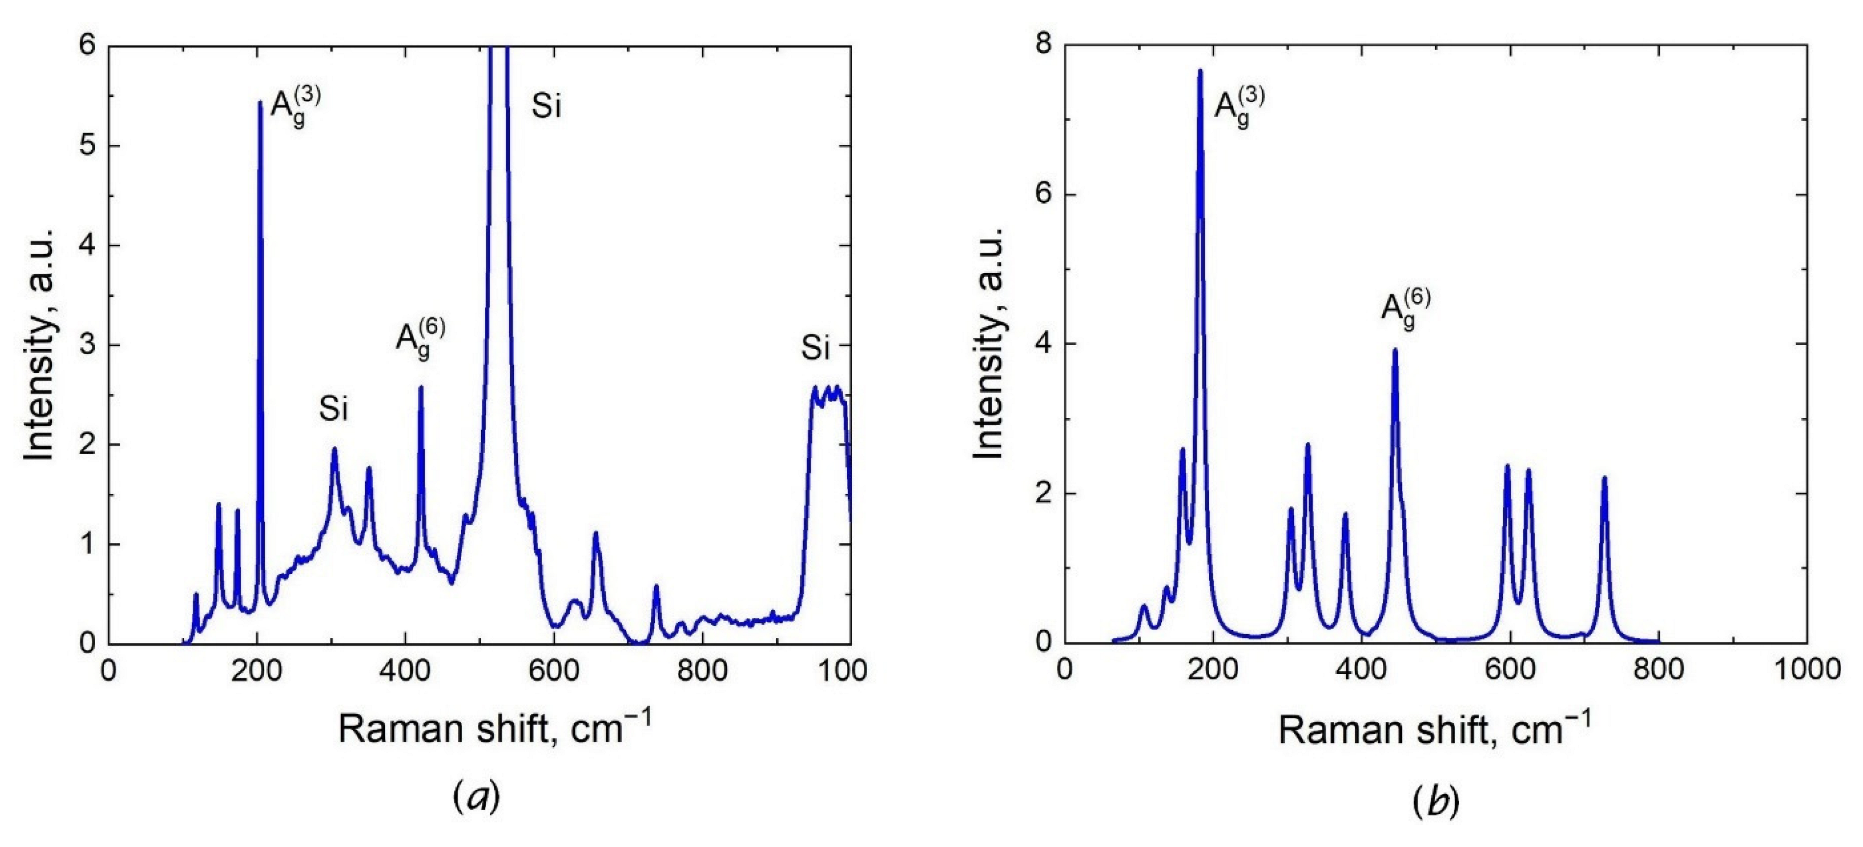
It is well known that β -Ga2O3 has birefringent monoclinic structure C 2 / m . That is why light polarization inside the crystal where scattering occurs is generally elliptical and differs from the incident and reflected polarizations. Thus, an analysis of the Raman scattering for a monoclinic structure can be quite complicated [6]. However, if the polarization of the detected signal is not changed, then the situation becomes much simpler. Figure 5a shows the Raman spectrum of this Ga2O3/SiC/Si sample, obtained in confocal geometry excluding birefringence. Three lines of this spectrum indicate silicon, the remaining lines indicate β -Ga2O3, characterized by four lines in the range of 100–200 cm 1 with A g 3 being the highest, and by the second- highest line being A g 6 at ~ 420 cm 1 (Figure 5a).
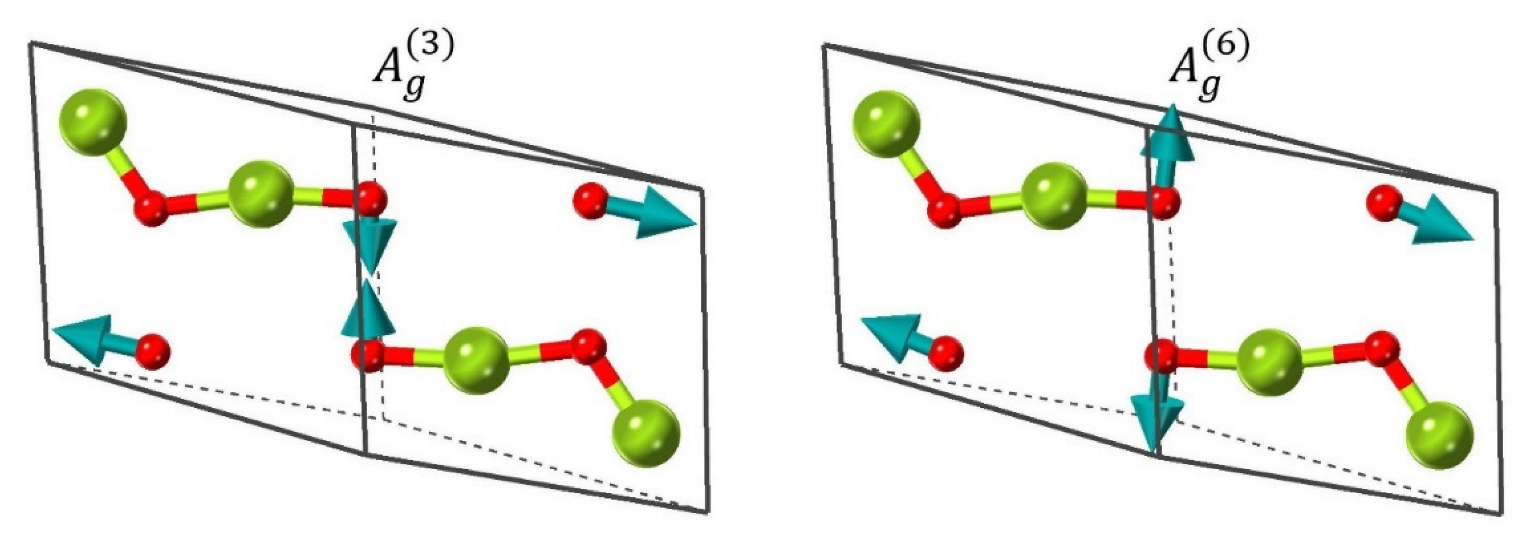
Figure 5b shows the theoretical Raman spectrum of β -Ga2O3, where each line has a thickness of 5 cm 1 . It can be seen that this spectrum agrees very well with the experimental one in Figure 5a; there is only a minor difference in the position and height of the lines, but all the characteristic lines are present. The frequencies of the main lines coincide very well with a similar result obtained with the hybrid B3LYP functional [6]; it is very difficult to compare the amplitudes because of the birefringence. The data on the main Raman lines of all three phases are given in a single table in Section 4. Figure 6 shows directions and relative amplitudes of oscillations of β -Ga2O3 atoms, as calculated by the DFT method for two main lines of the Raman spectrum. It can be seen that only four oxygen atoms oscillate in both cases, the other six atoms of the primitive cell are practically immobile.
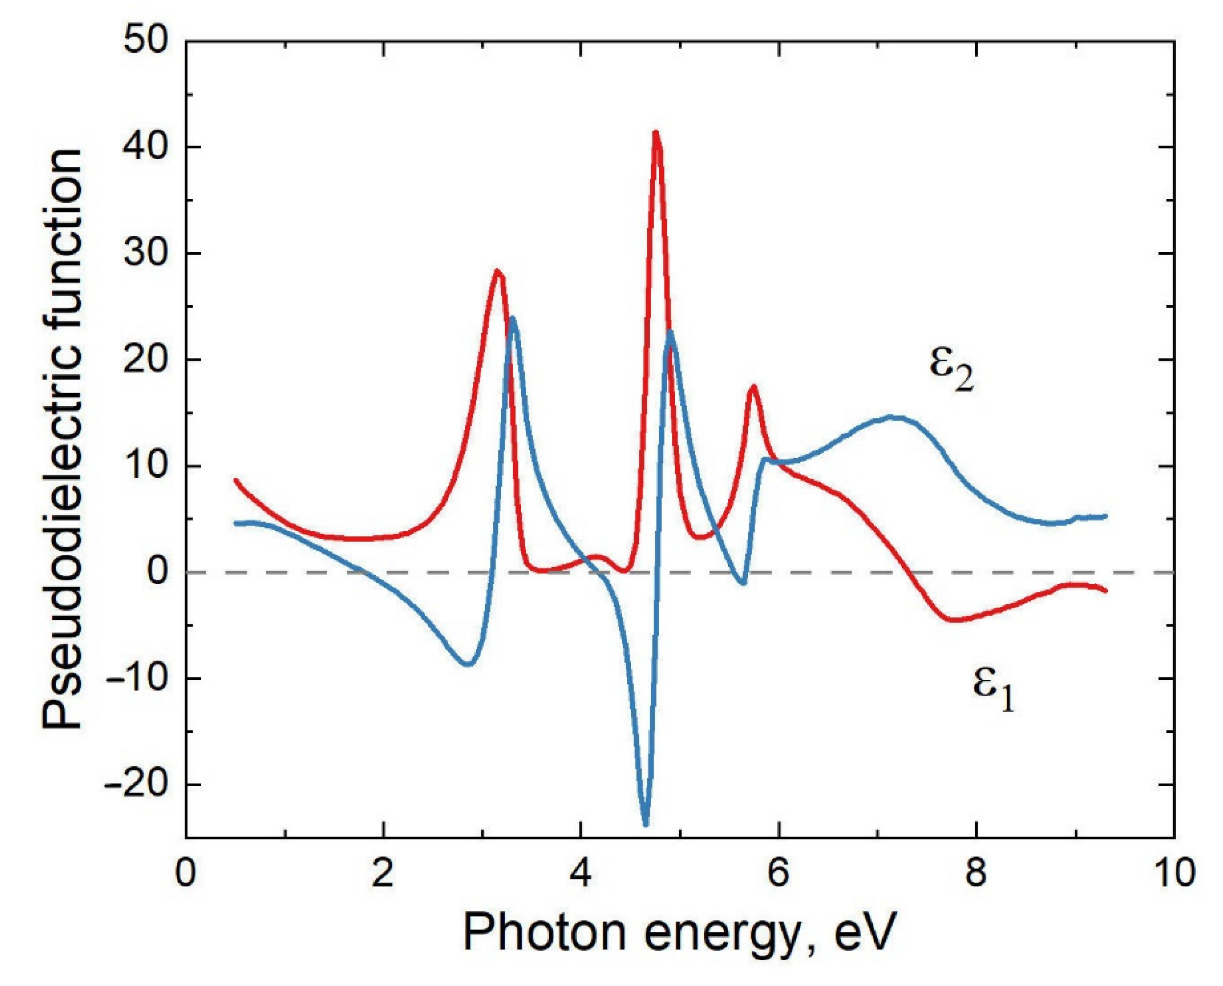
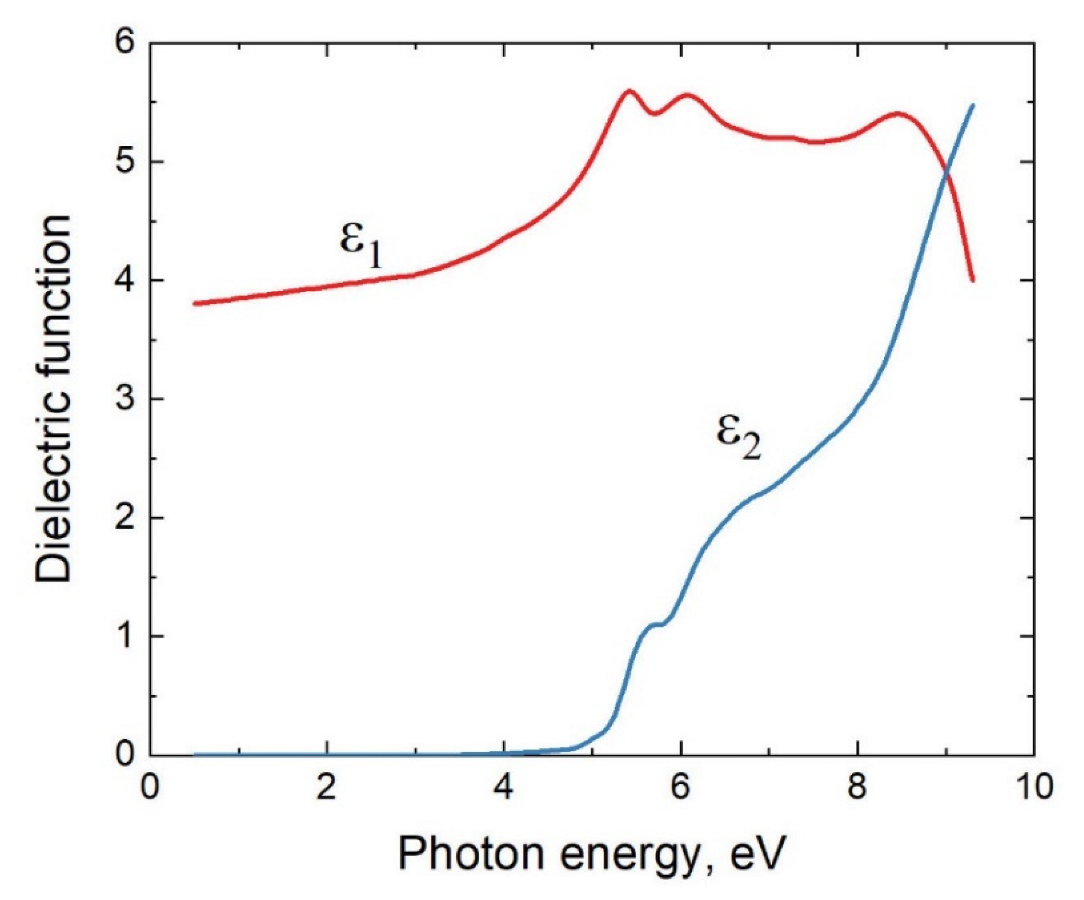
The ordinary dielectric function of the produced β -Ga2O3 sample has been measured as a function of the photon energy. For this, the M-2000D rotating-compensator ellipsometer (J.A. Woollam Co.), working in the range of 0.7–6.5 eV, was used. Due to a significant roughness of this sample, it was not possible to measure the dielectric function with the VUV-VASE ultraviolet rotating-analyzer ellipsometer (J.A. Woollam Co., Dearborn, MI, USA) operating in a wider photon energy range of 0.5–9.3 eV. Figure 7 shows the resulting dependence of the dielectric function on the photon energy, which was derived from the experimental dependence by subtracting the roughness. Anisotropy of the dielectric function [22] was not taken into account.
Comparing the theoretical dependence [5] with the obtained experimental one, we can conclude that there is a qualitative agreement between them.

3.2. Metastable ε Phase Ga2O3 with Orthorhombic Structure P n a 2 1

At a synthesis temperature of 550–600 °C, the deposition of Ga2O3 resulted in the metastable ε phase. Figure 8 shows a typical XRD spectrum of a Ga2O3 sample grown on the 3C-SiC(111)/Si(111) hybrid substrate at 570 °C. It can be seen that there is only the ε phase, which is oriented upwards mostly by the <001> direction, although there are small peaks from other planes too.
A configuration of atoms in ε -Ga2O3 with the <001> direction oriented upwards is shown in Figure 9. The metastable ε -Ga2O3 has the orthorhombic structure P n a 2 1 , so the peaks of the Raman spectrum differ from the peaks of the stable β phase.
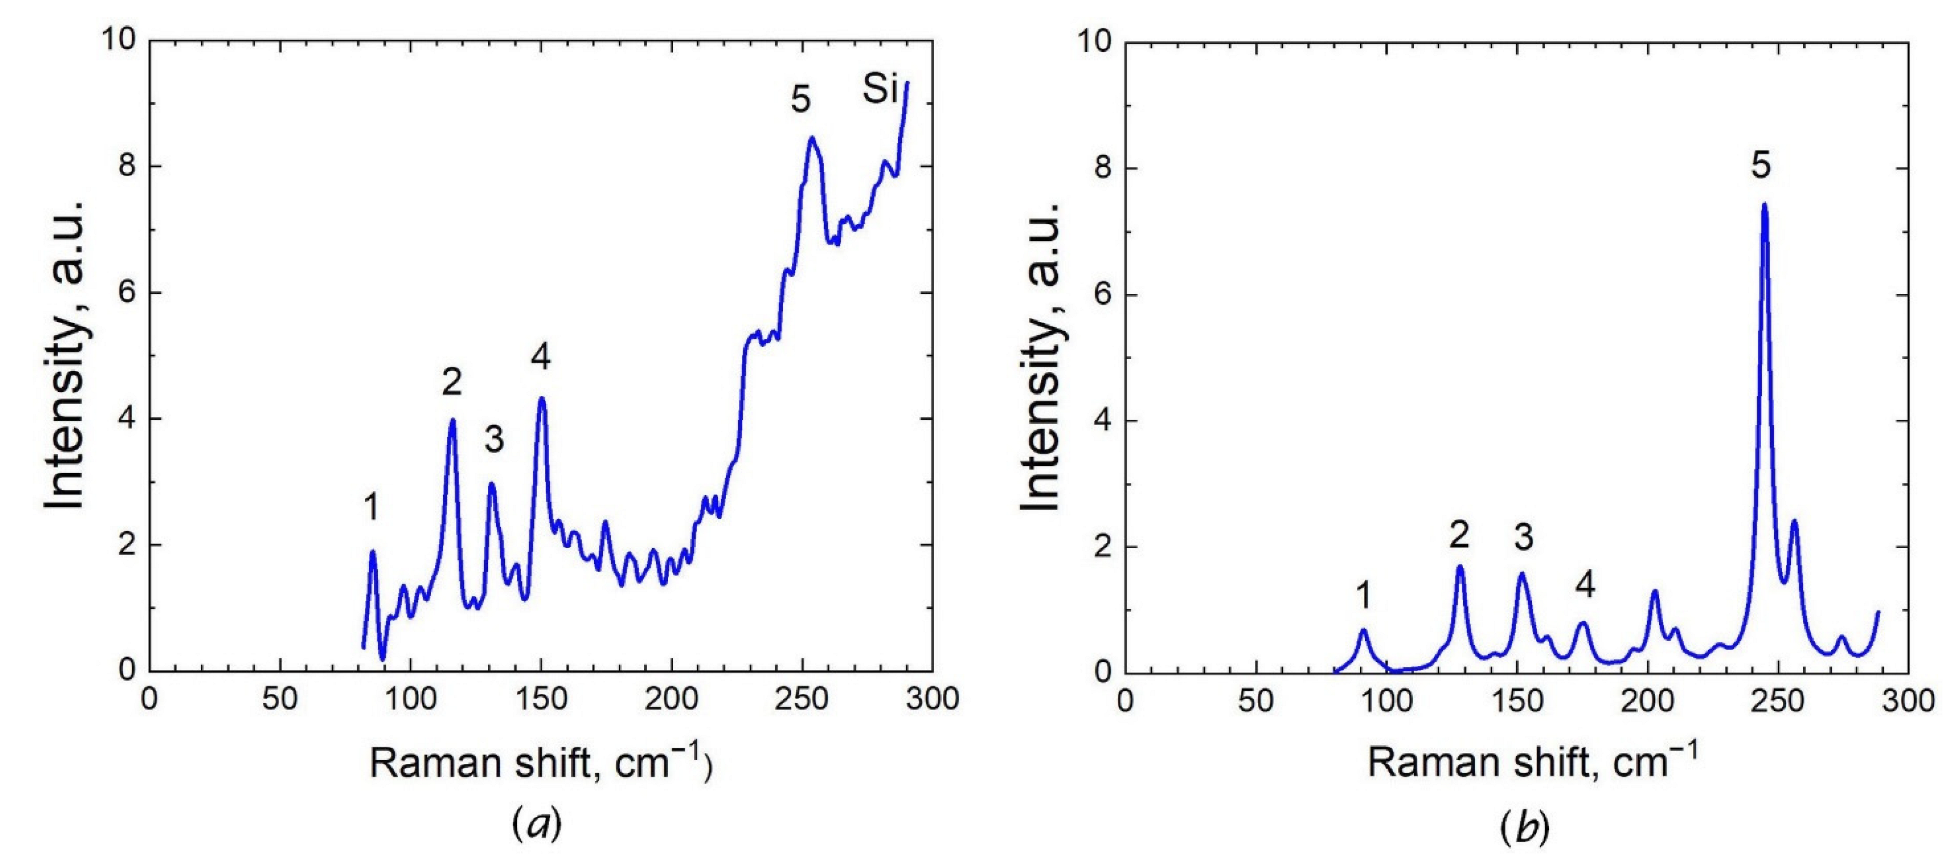
Since the P n a 2 1 symmetry is much weaker than the C 2 / m symmetry, the ε phase has many more lines of the Raman spectrum than the β phase [23]. The five highest lines of the spectrum are observed in the range of 80–260 cm 1 (there is also a high line at 685 cm 1 ), i.e., before the first silicon line corresponding to 300 cm 1 . That is why Figure 10a shows the Raman spectrum of the Ga2O3/SiC/Si sample, obtained in the confocal geometry of scattering (i.e., excluding birefringence), only in the range up to 300 cm 1 .
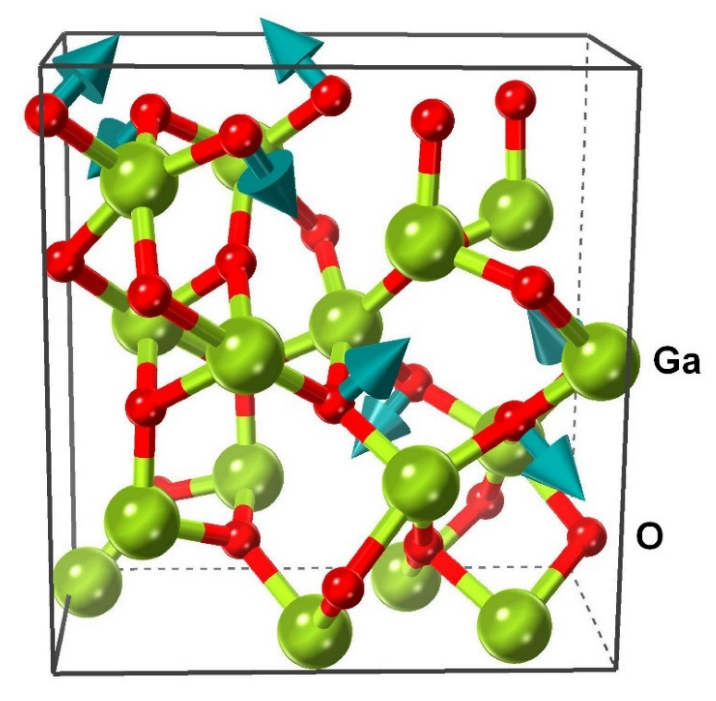
The five highest lines of the spectrum are numerated and correspond to the following frequencies: 86, 117, 131, 150, and 253 cm 1 . In order to find out the nature of oscillations corresponding to each line of the Raman spectrum, this spectrum was calculated by the DFT methods by utilizing the Quantum Espresso code [19] and the GGA-PBESol functional [20] in the same approximations as for the β phase. The resulting theoretical spectrum is shown in Figure 10b. The numbers here indicate the lines corresponding to the following frequencies: 91, 128, 152, 175, and 245 cm 1 . One can see the qualitative agreement between the theoretical and experimental data. The data on the main Raman lines of all three phases are given in a single table in Section 4. An analysis has shown that the collective motion of atoms, corresponding to the lines of the Raman spectrum, is very complex, which is obviously caused by the weakness of the P n a 2 1 symmetry [23]. The only exception is line No. 5, which is the main line of the Raman spectrum of the metastable ε -Ga2O3. Figure 11 shows directions and relative amplitudes of oscillations of ε -Ga2O3 atoms, as calculated in the DFT framework for the main line No. 5 of the Raman spectrum.
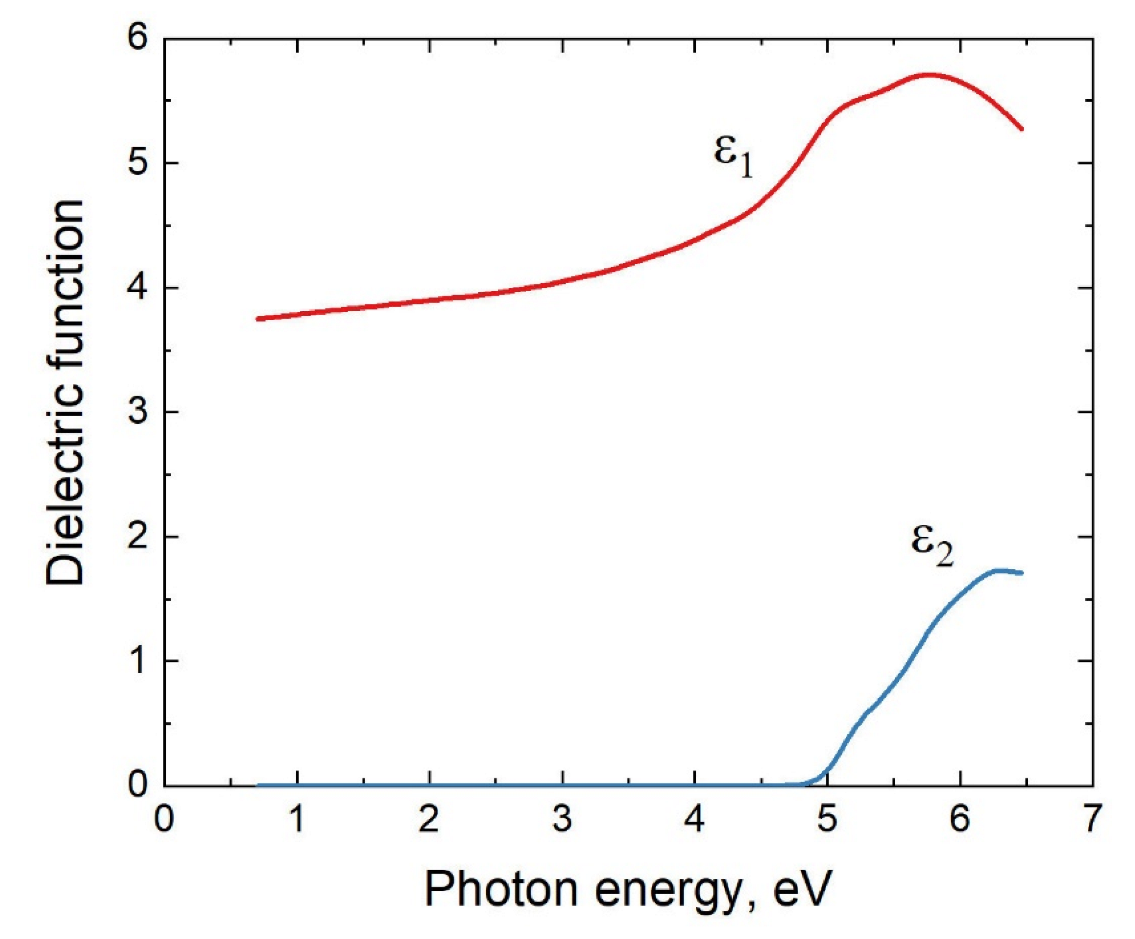
It can be seen that only eight oxygen atoms out of 40 atoms in the cell move. The dielectric function of the produced ε -Ga2O3 sample has been measured as a function of the photon energy. For this, the M-2000D rotating-compensator ellipsometer (J.A. Woollam Co., Dearborn, MI, USA) working in the range of 0.7–6.5 eV was used. Due to a significant roughness of this sample, it was not possible to measure the dielectric function with the VUV-VASE ultraviolet rotating-analyzer ellipsometer (J.A. Woollam Co.) operating in a wider photon energy range of 0.5–9.3 eV. Figure 12 shows the resulting dependence of the dielectric function on the photon energy, which was derived from the experimental dependence by subtracting the roughness.
Anisotropy of the dielectric function was not taken into account. Comparing the theoretical dependence [5] with the obtained experimental one, we can conclude that there is a qualitative agreement between them.

3.3. Metastable α Phase of Ga2O3 with Trigonal Structure R 3 ¯ c

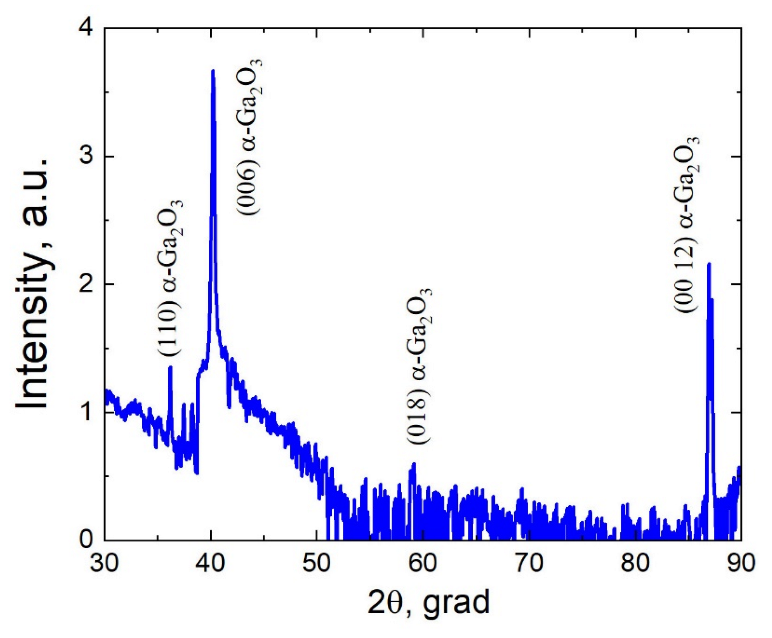
At a synthesis temperature of 500–520 °C, the deposition of Ga2O3 resulted in the metastable α phase. Figure 13 shows a typical XRD spectrum of a Ga2O3 sample grown on the hybrid substrate 3C-SiC(111)/Si(111) at 510 °C. It is seen that only the α phase is present, and its <001> direction is oriented upwards, although there are also small peaks corresponding to the (011), (018) planes. A configuration of atoms in α -Ga2O3 with the <001> direction oriented upwards is shown in Figure 14. α -Ga2O3 has a very symmetrical trigonal structure R 3 ¯ c (corundum structure).
The DFT calculations with the use of the SCAN meta-GGA functional [24] show that, among all phases of Ga2O3, the β phase is the most energetically favorable, the ε phase is less favorable by 0.084 eV per structural unit, while the α phase is less favorable than the β phase by 0.097 eV per structural unit.
The β phase has the lowest density (5.9 g / cm 3 ), then comes the ε phase (6.1 g / cm 3 ), and the α phase has the highest density (6.5 g / cm 3 ). Thus, there is nothing surprising in the fact that, as the synthesis temperature decreases, the phases proceed in the sequence β ε   α . Since α phase is the most symmetrical, the Raman spectrum of metastable α -Ga2O3 contains the smallest number of lines. Figure 15 shows that one line of silicon and six lines corresponding to α -Ga2O3 are visible (only line E g , 1 at 240 cm 1 [25] is not visible).
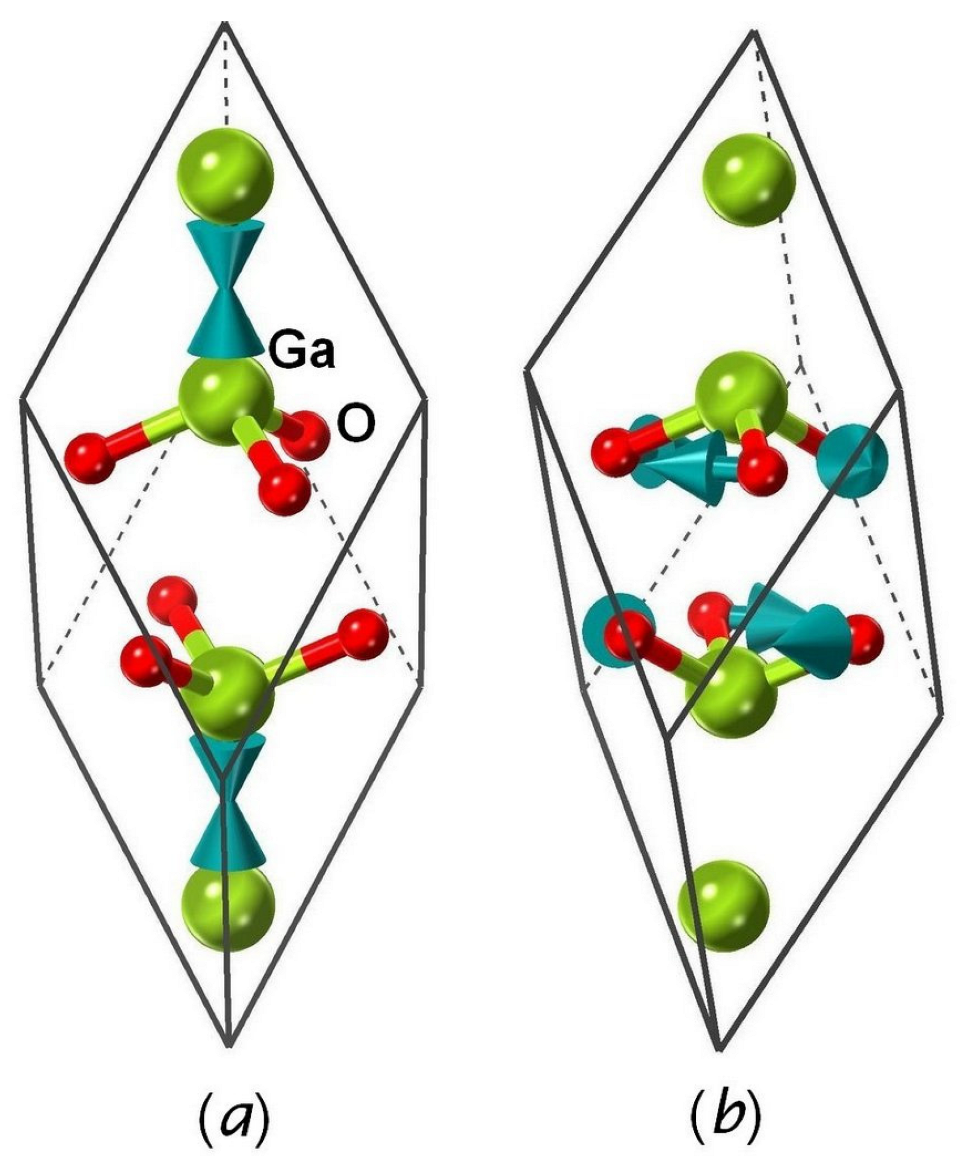
This spectrum was also calculated by the DFT methods by utilizing the Quantum Espresso code [19] and the GGA-PBESol functional [20] in the same approximations as before. The resulting theoretical spectrum is shown in Figure 15b. It can be seen that this spectrum agrees very well with the experimental one. Collective motions of atoms in α -Ga2O3, corresponding to each line of the Raman spectrum, have been also calculated by the DFT method. The most interesting are the motions of atoms, which correspond to lines A1g,1 and A1g,2; they are shown in Figure 16.
In the case of line A1g,1, only Ga atoms move, towards each other (Figure 16a). This happens very rarely, since, as a rule, mainly O atoms move, because they are lighter (Figure 6, Figure 11 and Figure 16b). In the case of line A1g,2, O atoms move in a circle in the same direction (Figure 16b). In the case of lines Eg,4, Eg,5, only O atoms move as well, but their motion is less symmetrical. Since the surface of the α -Ga2O3 sample is much smoother than that of the β - and ε -phase samples, it reflects light better, so it becomes possible to measure the ordinary dielectric function of this sample with the VUV-VASE ultraviolet rotating-analyzer ellipsometer (J.A. Woollam Co., Dearborn, MI, USA) in the photon energy range of 0.5–9.3 eV. Figure 17 shows the resulting dependence of the dielectric function on the photon energy, which was derived from the experimental dependence by subtracting the roughness. Anisotropy of the dielectric function was not taken into account.
While there are very few experimental data on the dielectric function for the β phase and the ε phase (which, apparently, can be explained by the roughness of these phases), there are such data for the α phase. In particular, in the work [26] such a spectrum was measured on the synchrotron ellipsometer in the MLS, Berlin, in the region from 0.04 to 20 eV. The agreement of the data obtained in the present work with the data [26] is very good, despite the significant difference in the growth technique of Ga2O3. The method used was ultrasonic mist chemical vapor epitaxy on (0001) α- Al2O3 substrate. Comparing the theoretical dependence [5] with the obtained experimental one, it can be concluded that there is also a good agreement between them.

4. Discussion

Hence, it has been determined that by changing the synthesis temperature, it is possible to grow, by the HVPE method, Ga2O3 layers of three crystalline modifications on the 3C-SiC(111)/Si(111) hybrid substrates. Namely, the stable and least dense ( ρ = 5.9 g / cm 3 ) β phase grows at a temperature of 800–1000 °C, the metastable ε phase with a density of ρ = 6.1 g / cm 3 grows at a temperature of 550–600 °C, the densest ( ρ = 6.5 g / cm 3 ) and most symmetrical α phase grows at a temperature of 500–520 °C. The density values have been calculated by the DFT method using the SCAN meta-GGA functional, which gives the most accurate results on the geometric configuration of atoms [24]. It should also be emphasized that the α phase grows very smoothly (the roughness is no more than 5 nm), while the ε and β phases have an order of magnitude greater roughness. At intermediate temperatures, a mixture of different phases grows. When heated to 900 °C for 10–15 min, the layers of the metastable α and ε phases completely transform into the stable β phase. This indicates that the value of the potential barrier of phase transitions in this case is small. It should be noted that the Raman spectrum of the α phase contains only seven lines, which is much less than the number of lines in the Raman spectrum of the β phase and, especially, the ε . phase. This is obviously due to the fact that the α phase is the most symmetrical and has the structure of corundum. Therefore, the band structure of the α phase is the simplest [5]. The data on the main Raman lines of all three phases are given in Table 1. It is easy to see that the Raman lines of the Ga2O3 samples grown on SiC/Si are shifted on average by 3.5 cm−1 upwards (except for the Eg,5 of α phase line). The most likely explanation for this result is that all Ga2O3 phases grown on SiC/Si are compressed compared to free Ga2O3. The compression value can be estimated as 0.1 GPa. This once again proves the ordering effect of SiC on Ga2O3. Measurements of the dielectric function have shown that the α phase is the most transparent, which is clearly due to the fact that the bandgap of the α phase is larger than that of the other phases. Estimates that have been made using the DFT methods show that the bandgap of the α phase is 0.4 eV larger than that of the β phase. All this, along with the high mobility of charge carriers, makes α -Ga2O3 a very promising material for microelectronics, especially as a transparent conductor. Until now, it was believed that the metastable α phase grows very badly, but in this work it has been shown that, at low temperatures of 500–520 °C, it grows very steadily on the 3C-SiC(111)/Si(111) hybrid substrates. At temperatures below 550 °C, the α phase does not transform into any other phase.

5. Conclusions

In this work, a technique to grow three different phases of Ga2O3 on the hybrid 3C-SiC(111)/Si(111) substrates has been developed. The layers thicker than 1 μm have been grown by the HVPE method. It has been found that the type of crystal structure in this case depends on the temperature of Ga2O3 synthesis. At low temperatures, the most symmetric α phase of the corundum structure grows, which has been successfully obtained only on rare occasions until now. As the temperature rises, the growth of the α phase is transformed into the growth of the ε phase, which is the least symmetric of all. With a further increase in temperature, the growth switches to the growth of the stable β phase, which then remains steady. The Raman and ellipsometric spectra of all three phases have been studied, which makes it now easy to identify the phase by the Raman spectroscopy. Oscillations of atoms in Ga2O3, corresponding to the main lines of the Raman spectra of all three phases, have been modeled by the DFT methods.

Author Contributions

Conceptualization, A.V.O., S.S.S. and S.A.K.; methodology, A.V.O., S.S.S. and S.A.K.; investigation, A.V.O., S.S.S., E.V.O., A.V.K. and A.Y.I.; writing, A.V.O.; supervision, S.A.K. All authors have read and agreed to the published version of the manuscript.

Funding

This research was supported by a state order to the Institute of Problems in Mechanical Engineering of the Russian Academy of Sciences, project No. FFNF-2021-0001).

Institutional Review Board Statement

Not applicable.

Informed Consent Statement

Not applicable.

Data Availability Statement

Data is contained within the article.

Acknowledgments

The growth of SiC layers and the study of their properties have been carried out using a unique scientific setup “Physics, Chemistry, and Mechanics of Crystals and Thin Films” (IPME RAS, St.-Petersburg).

Conflicts of Interest

The authors declare no conflict of interest.

References

  1. Tsao, J.Y.; Chowdhury, S.; Hollis, M.A.; Jena, D.; Johnson, N.M.; Jones, K.A.; Kaplar, R.J.; Rajan, S.; Van de Walle, C.G.; Bellotti, E.; et al. Ultrawide-bandgap semiconductors: Research opportunities and challenges. Adv. Electron. Mater. 2018, 4, 1600501. [Google Scholar] [CrossRef] [Green Version]
  2. Stepanov, S.I.; Nikolaev, V.; Bougrov, V.E.; Romanov, A. Gallium oxide: Properties and applications—A review. Rev. Adv. Mater. Sci. 2016, 44, 63–86. [Google Scholar]
  3. Jamwal, N.S.; Kiani, A. Gallium oxide nanostructures: A review of synthesis, properties and applications. Nanomaterials 2022, 12, 2061. [Google Scholar] [CrossRef] [PubMed]
  4. Pearton, S.J.; Yang, J.; Cary, P.H.; Ren, F.; Kim, J.; Tadjer, M.J.; Mastro, M.A. A review of Ga2O3 materials, processing, and devices. Appl. Phys. Rev. 2018, 5, 011301. [Google Scholar] [CrossRef] [Green Version]
  5. Furthmüller, J.; Bechstedt, F. Quasiparticle bands and spectra of Ga2O3 polymorphs. Phys. Rev. B 2016, 93, 115204. [Google Scholar] [CrossRef]
  6. Kranert, C.; Sturm, C.; Schmidt-Grund, R.; Grundmann, M. Raman tensor elements of β-Ga2O3. Sci. Rep. 2016, 6, 35964. [Google Scholar] [CrossRef] [Green Version]
  7. Osipov, A.V.; Grashchenko, A.S.; Kukushkin, S.A.; Nikolaev, V.I.; Osipova, E.V.; Pechnikov, A.I.; Soshnikov, I.P. Structural and elastoplastic properties of β—Ga2O3 films grown on hybrid SiC/Si substrates. Contin. Mech. Thermodyn. 2018, 30, 1059–1068. [Google Scholar] [CrossRef]
  8. Tse, G. Evaluation of structural, electronic, optical, elastic, and mechanical properties of triclinic Sn-doped Ga2O3 using density functional theory. Comput. Condens. Matter 2022, 30, e00641. [Google Scholar] [CrossRef]
  9. Usseinov, A.; Koishybayeva, Z.; Platonenko, A.; Pankratov, V.; Suchikova, Y.; Akilbekov, A.; Zdorovets, M.; Purans, J.; Popov, A.I. Vacancy defects in Ga2O3: First-principles calculations of electronic structure. Materials 2021, 14, 7384. [Google Scholar] [CrossRef]
  10. Usseinov, A.; Platonenko, A.; Koishybayeva, Z.; Akilbekov, A.; Zdorovets, M.; Popov, A.I. Pair vacancy defects in β-Ga2O3 crystal: Ab initio study. Opt. Mater. X 2022, 16, 100200. [Google Scholar] [CrossRef]
  11. Nomura, K.; Goto, K.; Togashi, R.; Murakami, H.; Kumagai, Y.; Kuramata, A.; Yamakoshi, S.; Koukitu, A. Thermodynamic study of β-Ga2O3 growth by halide vapor phase epitaxy. J. Cryst. Growth 2014, 405, 19–22. [Google Scholar] [CrossRef]
  12. Kukushkin, S.A.; Osipov, A.V. Theory and practice of SiC growth on Si and its applications to wide-gap semiconductor films. J. Phys. D Appl. Phys. 2014, 47, 313001. [Google Scholar] [CrossRef]
  13. Kukushkin, S.A.; Osipov, A.V. Epitaxial silicon carbide on silicon. method of coordinated substitution of atoms (a review). Russ. J. Gen. Chem. 2022, 92, 584–610. [Google Scholar] [CrossRef]
  14. Kukushkin, S.; Osipov, A. Dielectric function and magnetic moment of silicon carbide containing silicon vacancies. Materials 2022, 15, 4653. [Google Scholar] [CrossRef]
  15. Kukushkin, S.A.; Osipov, A.V. Quantum mechanical theory of epitaxial transformation of silicon to silicon carbide. J. Phys. D Appl. Phys. 2017, 50, 464006. [Google Scholar] [CrossRef] [Green Version]
  16. Kukushkin, S.A.; Osipov, A.V. Drift mechanism of mass transfer on heterogeneous reaction in crystalline silicon substrate. Phys. B Condens. Matter 2017, 512, 26–31. [Google Scholar] [CrossRef] [Green Version]
  17. Kukushkin, S.A.; Osipov, A.V. Spin polarization and magnetic moment in silicon carbide grown by the method of coordinated substitution of atoms. Materials 2021, 14, 5579. [Google Scholar] [CrossRef]
  18. Fujiwara, H.; Collins, R.W. Spectroscopic Ellipsometry for Photovoltaics; Springer: Berlin/Heidelberg, Germany, 2018; Volume 1. [Google Scholar]
  19. Giannozzi, P.; Andreussi, O.; Brumme, T.; Bunau, O.; Buongiorno Nardelli, M.; Calandra, M.; Car, R.; Cavazzoni, C.; Ceresoli, D.; Cococcioni, M.; et al. Advanced capabilities for materials modelling with Quantum ESPRESSO. J. Phys. Condens. Matter 2017, 29, 465901. [Google Scholar] [CrossRef] [Green Version]
  20. Perdew, J.P.; Ruzsinszky, A.; Csonka, G.I.; Vydrov, O.A.; Scuseria, G.E.; Constantin, L.A.; Zhou, X.; Burke, K. Restoring the density-gradient expansion for exchange in solids and surfaces. Phys. Rev. Lett. 2008, 100, 136406. [Google Scholar] [CrossRef] [Green Version]
  21. Fiedler, A.; Schewski, R.; Galazka, Z.; Irmscher, K. Static dielectric constant of β-Ga2O3 perpendicular to the principal planes (100), (010), and (001). ECS J. Solid State Sci. Technol. 2019, 8, Q3083. [Google Scholar] [CrossRef]
  22. Schubert, M.; Korlacki, R.; Knight, S.; Hofmann, T.; Schöche, S.; Darakchieva, V.; Janzén, E.; Monemar, B.; Gogova, D.; Thieu, Q.T.; et al. Anisotropy, phonon modes, and free charge carrier parameters in monoclinic β-gallium oxide single crystals. Phys. Rev. B 2016, 93, 125209. [Google Scholar] [CrossRef]
  23. Janzen, B.M.; Mazzolini, P.; Gillen, R.; Peltason, V.F.S.; Grote, L.P.; Maultzsch, J.; Fornari, R.; Bierwagen, O.; Wagner, M.R. Comprehensive Raman study of orthorhombic κ/ε-Ga2O3 and the impact of rotational domains. J. Mater. Chem. C 2021, 9, 14175–14189. [Google Scholar] [CrossRef]
  24. Bartók, A.P.; Yates, J.R. Regularized SCAN functional. J. Chem. Phys. 2019, 150, 161101. [Google Scholar] [CrossRef]
  25. Grümbel, J.; Goldhahn, R.; Jeon, D.-W.; Feneberg, M. Anharmonicity of lattice vibrations in thin film α-Ga2O3 investigated by temperature dependent Raman spectroscopy. Appl. Phys. Lett. 2022, 120, 022104. [Google Scholar] [CrossRef]
  26. Feneberg, M.; Nixdorf, J.; Neumann, M.D.; Esser, N.; Artús, L.; Cuscó, R.; Yamaguchi, T.; Goldhahn, R. Ordinary dielectric function of corundumlike alpha-Ga2O3 from 40 meV to 20 eV. Phys. Rev. Mater. 2018, 2, 044601. [Google Scholar] [CrossRef]
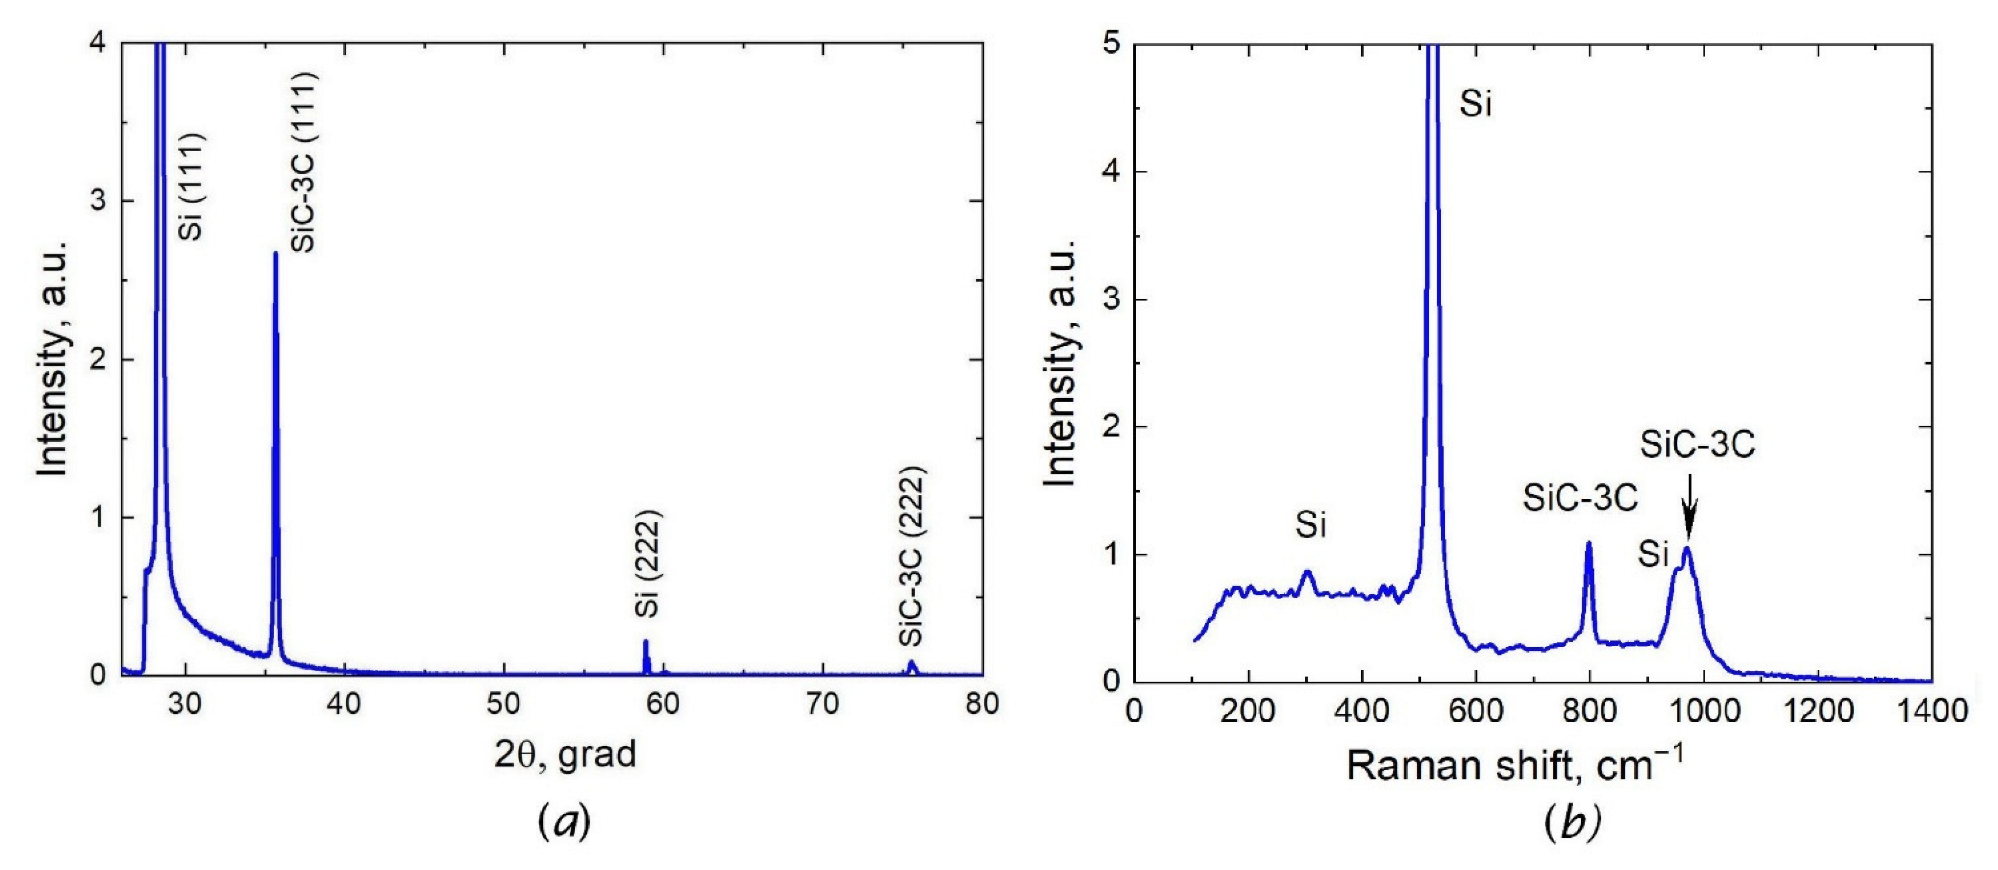
Figure 1. XRD spectrum of a 3C-SiC(111)/Si(111) hybrid substrate grown by the MCSA (a) and Raman spectrum of the same sample (b).
Coatings 12 01802 g001
Figure 2. Pseudo-dielectric function of a 3C-SiC(111)/Si(111) hybrid substrate grown by the MCSA, measured by the VUV-VASE ellipsometer.
Coatings 12 01802 g002
Figure 3. XRD spectrum of a β -Ga2O3 sample grown on the 3C-SiC(111)/Si(111) hybrid substrate at 900 °C.
Coatings 12 01802 g003
Figure 4. Configuration of atoms in β -Ga2O3. The < 2 ¯ 01 > direction is oriented upwards. Large green balls represent Ga atoms; small red balls represent O atoms.
Coatings 12 01802 g004
Figure 5. (a) The Raman spectrum of β -Ga2O3/SiC/Si in confocal geometry excluding birefringence. Three lines of silicon and two highest lines of β -Ga2O3, namely A g 3 and A g 6 , are indicated. (b) The theoretical Raman spectrum of β -Ga2O3. The two main lines of the spectrum are marked as A g 3 and A g 6 .
Coatings 12 01802 g005
Figure 6. Directions and relative amplitudes of oscillations of β -Ga2O3 atoms, as calculated in the DFT framework for the two main lines, A g 3 and A g 6 , of the Raman spectrum. Only one primitive cell is shown; z-axis is up.
Coatings 12 01802 g006
Figure 7. Dependence of the ordinary dielectric function of β -Ga2O3 on the photon energy. ε 1 is the real part of the dielectric function; ε 2 is its imaginary part.
Coatings 12 01802 g007
Figure 8. XRD spectrum of an ε -Ga2O3 sample grown on the 3C-SiC(111)/Si(111) hybrid substrate at 570 °C.
Coatings 12 01802 g008
Figure 9. Configuration of atoms in ε -Ga2O3. The <001> axis is directed upwards. Large green balls represent Ga atoms; small red balls represent O atoms.
Coatings 12 01802 g009
Figure 10. The Raman spectrum of the ε -Ga2O3/SiC/Si sample in confocal geometry excluding birefringence (a). The theoretical Raman spectrum of ε -Ga2O3 calculated by the DFT method in the range up to 300 cm 1 , excluding birefringence (b).
Coatings 12 01802 g010
Figure 11. Directions and relative amplitudes of oscillations of atoms in ε -Ga2O3, as calculated in the DFT framework for the main line No. 5 of the Raman spectrum (Figure 10a,b). Only one cell having the P n a 2 1 symmetry is shown; z-axis is directed upwards.
Coatings 12 01802 g011
Figure 12. Dependence of the ordinary dielectric function of ε -Ga2O3 on the photon energy. ε 1 is the real part of the dielectric function, ε 2 is its imaginary part.
Coatings 12 01802 g012
Figure 13. XRD spectrum of an α -Ga2O3 sample grown on the 3C-SiC(111)/Si(111) hybrid substrate at 510 °C.
Coatings 12 01802 g013
Figure 14. Configuration of atoms in α -Ga2O3 of the corundum structure. The <001> axis is directed upwards. Large green balls represent Ga atoms; small red balls represent O atoms.
Coatings 12 01802 g014
Figure 15. The Raman spectrum of the α -Ga2O3/SiC/Si sample, in confocal geometry, excluding birefringence (a). The theoretical Raman spectrum of α -Ga2O3, excluding birefringence, as calculated by the DFT method (b).
Coatings 12 01802 g015
Figure 16. Directions and relative amplitudes of oscillation of atoms in α -Ga2O3, as calculated within the DFT framework for lines of the Raman spectrum A1g,1 (a) and A1g,2 (b). Only one primitive cell is shown; z-axis is oriented upwards. Large green balls represent Ga atoms; small red balls represent O atoms.
Coatings 12 01802 g016
Figure 17. Dependence of the ordinary dielectric function of α -Ga2O3 on the photon energy. ε 1 is the real part of the dielectric function, ε 2 is its imaginary part.
Coatings 12 01802 g017
Table 1. The values of the frequencies of the main Raman peaks of all three phases, by which they can be identified.
Phase of Ga2O3PeaksFreq., cm−1, Exp., This WorkFreq., cm−1, Theor., This WorkFreq., cm−1, Exp., [6,23,25]
α -phaseA1g,1221216217
Eg,2289291285
Eg,3332319327
Eg,4435449430
A1g,2576577570
Eg,5691695688
β -phase B g 1 117108115
B g 2 149137145
A g 2 174159170
A g 3 205182200
A g 6 421445416
ε -phase1869182
2117128113
3131152128
4150175147
5253245249
Publisher’s Note: MDPI stays neutral with regard to jurisdictional claims in published maps and institutional affiliations.