Article

Correlation between Soil Structural Parameters and Soil Adhesion Based on Water Film Theory

1
School of Civil Engineering, Institute of Cold Regions Science and Engineering, Permafrost Institute, Northeast Forestry University, Harbin 150040, China
2
Northeast-China Observatory and Research-Station of Permafrost Geo-Environment of the Ministry of Education, Collaborative Innovation Centre for Permafrost Environment and Road Construction and Maintenance in Northeast China, Northeast Forestry University, Harbin 150040, China
3
Heilongjiang Transportation Investment Group Co., Ltd., Harbin 150040, China
4
Heilongjiang Provincial Investment Group Co., Ltd., Harbin 150090, China
*
Author to whom correspondence should be addressed.
Coatings 2022, 12(11), 1743; https://doi.org/10.3390/coatings12111743
Submission received: 1 September 2022 / Revised: 20 October 2022 / Accepted: 8 November 2022 / Published: 14 November 2022

Abstract

:
The ability of soil particles to adhere to an external medium after acting with water is called soil adhesion, and the strength of soil adhesion is defined by the adhesive force. Soil adhesion is closely related to the material of the external medium and the soil type. In this study, a small-scale model was used to measure adhesive force. In order to study the effects of different particle sizes on soil adhesion, six soil samples from China (Lanzhou loess, Songling soil, Tahe soil, Harbin clay, loam, and Genhe red clay) were selected as research objects. The correlation between soil adhesion and parameters was analyzed by calculating the fractal dimension. It was confirmed that, with increases in moisture level, the fractal dimension was positively correlated with soil moisture content when the adhesive force was maximum. The fractal dimension had an impact on the peak value of the adhesive force and moisture. Soil clay content played a key role in soil adhesion.

1. Introduction

Soil adhesion, which is the ability of soil to adhere to external materials, is one of the basic physical properties of soil. The adhesive force is generated when the soil separates from an exterior medium [1]. This study focused on the influence of soil physical parameters and properties on soil adhesion, and the research results are of great significance for engineering construction and transportation.
In actual transportation, the adhesive force is frequently classified as a frictional force [2], and measures such as vibration induction and lubrication cannot explain the energy-consuming effects caused by adhesive force. The reason for the production of adhesive force is different from that for frictional force. Frictional force is the force of two connected objects that have relative motion or relative motion trends, while adhesive force is determined by soil moisture content [3]. Accordingly, the contact between soil and an exterior medium is divided into three main stages [3]: (1) When the moisture is low, friction and intermolecular gravitational forces play a dominant role, which is called the friction stage. (2) With increments in moisture content, the area of the water layer between the soil and the external medium increases, resulting in a water ring. The soil adhesion increases and it becomes the main force. This stage is called the adhesion stage. (3) With the continuous increase in moisture content, the water film on the contact surface becomes free water, and the high soil moisture content leads to a reduction in the adhesive force. This is the lubrication stage. Soil adhesion is influenced by many factors, including soil properties, moisture, and external media characteristics. There is currently no research on the effect of soil particle size on adhesive force. It is thus important to explore the influence of soil particle size on adhesion in order to reduce the energy consumption caused by adhesive force [4].
Burbaum et al. [5] investigated the effects of soil properties on adhesive force and found that soil adhesive force is correlated with soil permeability and that water film thickness also affects adhesion. Saeed et al. [6] used transverse measurement of the soil friction coefficient and a tangential adhesion device to study the influence of various external media on adhesion force. The two aforementioned scholars chose to determine the friction force transversely and to determine the adhesive force with the help of a uniaxial press device, respectively, and they did not unify the test devices. The transverse device was unable to ensure a flat soil surface due to the rheological nature of the soil when measuring adhesion, and the uniaxial press had disadvantages such as long working cycles and inconvenient soil replacement.
The present study investigated the correlation between particle gradation and soil adhesion by optimizing an experimental setup with the results from various scholars. Under the external load of 500 g, six kinds of soil with different particle gradations were selected for study. The change law for adhesive force, soil particle size distribution, and the correlation between soil properties and adhesive force were analyzed in order to provide a reference for subsequent adhesion experiments and estimation of adhesive force in actual transportation process.

2. Soil Sample and Experiment Design

2.1. Soil Sample

Six kinds of silt and clay soil samples with different particle gradations were selected for the research, and their geographical distribution is shown in Figure 1.
The soil samples were named in the order a–f. The names, latitude and longitude, and distribution areas of the soils are listed in Table 1. The Lanzhou loess samples were collected from the vicinity of Lanshan in Lanzhou city; the Songling soil samples were collected from the vicinity of Huli mountain in the southern part of Daxinganling; the Tahe soil samples were collected from the area of Tahe County in the northern part of Daxinganling; the Harbin clay samples were collected from the low-liquid-limit clay around Harbin; the loam samples were collected from the vicinity of the northern foothill river of the Qinghai–Tibet Plateau; and the Genhe red clay samples were collected from the vicinity of Genhe city in the northern part of Hulunbeier city. The selected soil particle gradations exhibited differences that represented the geological conditions of the area. Each soil sample was fully ground and sifted with a 2 mm screen before testing. The particle size composition of the soil samples was determined with a fully automated laser particle size analyzer produced by Omec Company, model number LS-909. The particle gradation curves are shown in Figure 2.

2.2. Experiment Device

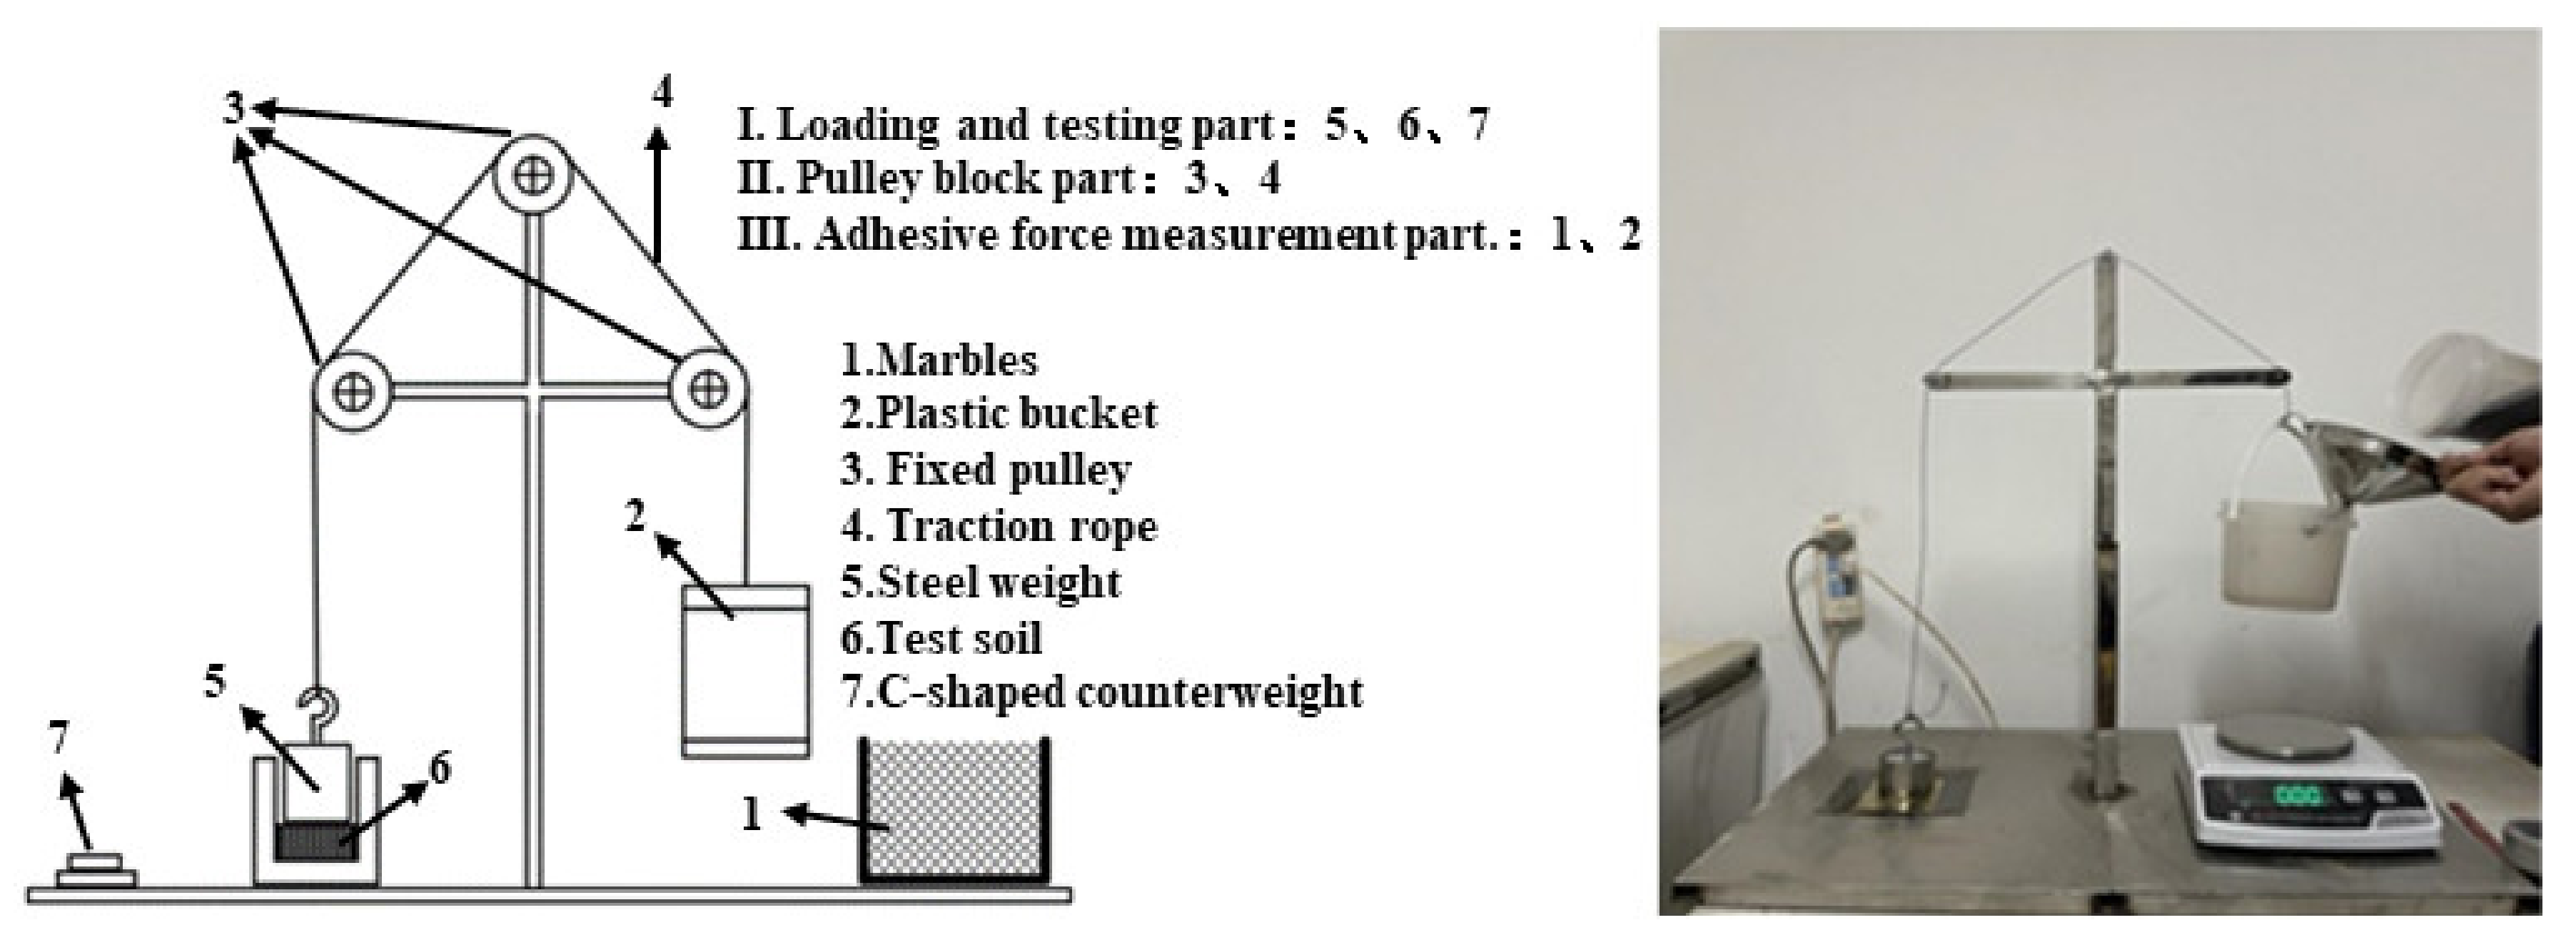
In this study, the test device in this study was inspired by the design by W. B. Haines et al. [2,7] and modified according to the patent “roller type soil adhesion tester ZL201120445003.8”. The experimental device eliminated the error caused by rheological changes in the soil when measuring adhesion laterally, shortened the test cycle, and facilitated testing. Figure 3 shows that the experiment device consisted of three parts: (1) the loading and test part, (2) the pulley block part, and (3) the adhesive force measurement part.
In the first part, a 500 g steel weight (5) was used to simulate transport mechanics and the adhesive force on the test soil was measured (6); a C-shaped counterweight (7) was used to adjust the load. The pulley set in the second part consisted of three fixed pulleys and a traction rope, which were the main elements used to transmit the adhesive force. The fixed pulley (3) had a diameter of 15 mm and wheel groove width of 6 mm. The traction rope (4) was a 1.2 mm diameter stainless steel wire system utilizing soft rope. The fixed pulley and traction rope contacts were evenly coated with lubricant to reduce the impact of friction on the test. In the third part, marbles of diameter 1 mm (1) were used for weighing measurements in order to facilitate the control of the loading speed and reduce the error caused by too fast a loading speed.

2.3. Experiment Program

In the adhesive force test, the soil samples were individually measured with a load of 500 g. The soil samples were cylinders with a diameter of 50 mm and a height of 40 mm. The soil moisture content was gradually increased during the test, and the test was stopped when adhesion characteristics appeared.
The specific experiment steps were as follows:
  • The test soil was formulated with water and soil in a certain proportion, mixed well, and placed in an aluminum box. Then, the test sample was covered with plastic wrap and stored for 12 h to ensure that the soil moisture content was uniform;
  • The test soil was compacted in an experimental container, and the external medium was placed above the test soil and allowed to stand for 30 s. Then, marbles were added to the plastic bucket, and the marbles were removed when the weight at the surface of the soil sample was isolated. The adhesive force was calculated according to the mass sum of the bucket and marbles;
  • The test soil was dried in a blast dryer at 105 °C and removed after 8 h to calculate the moisture;
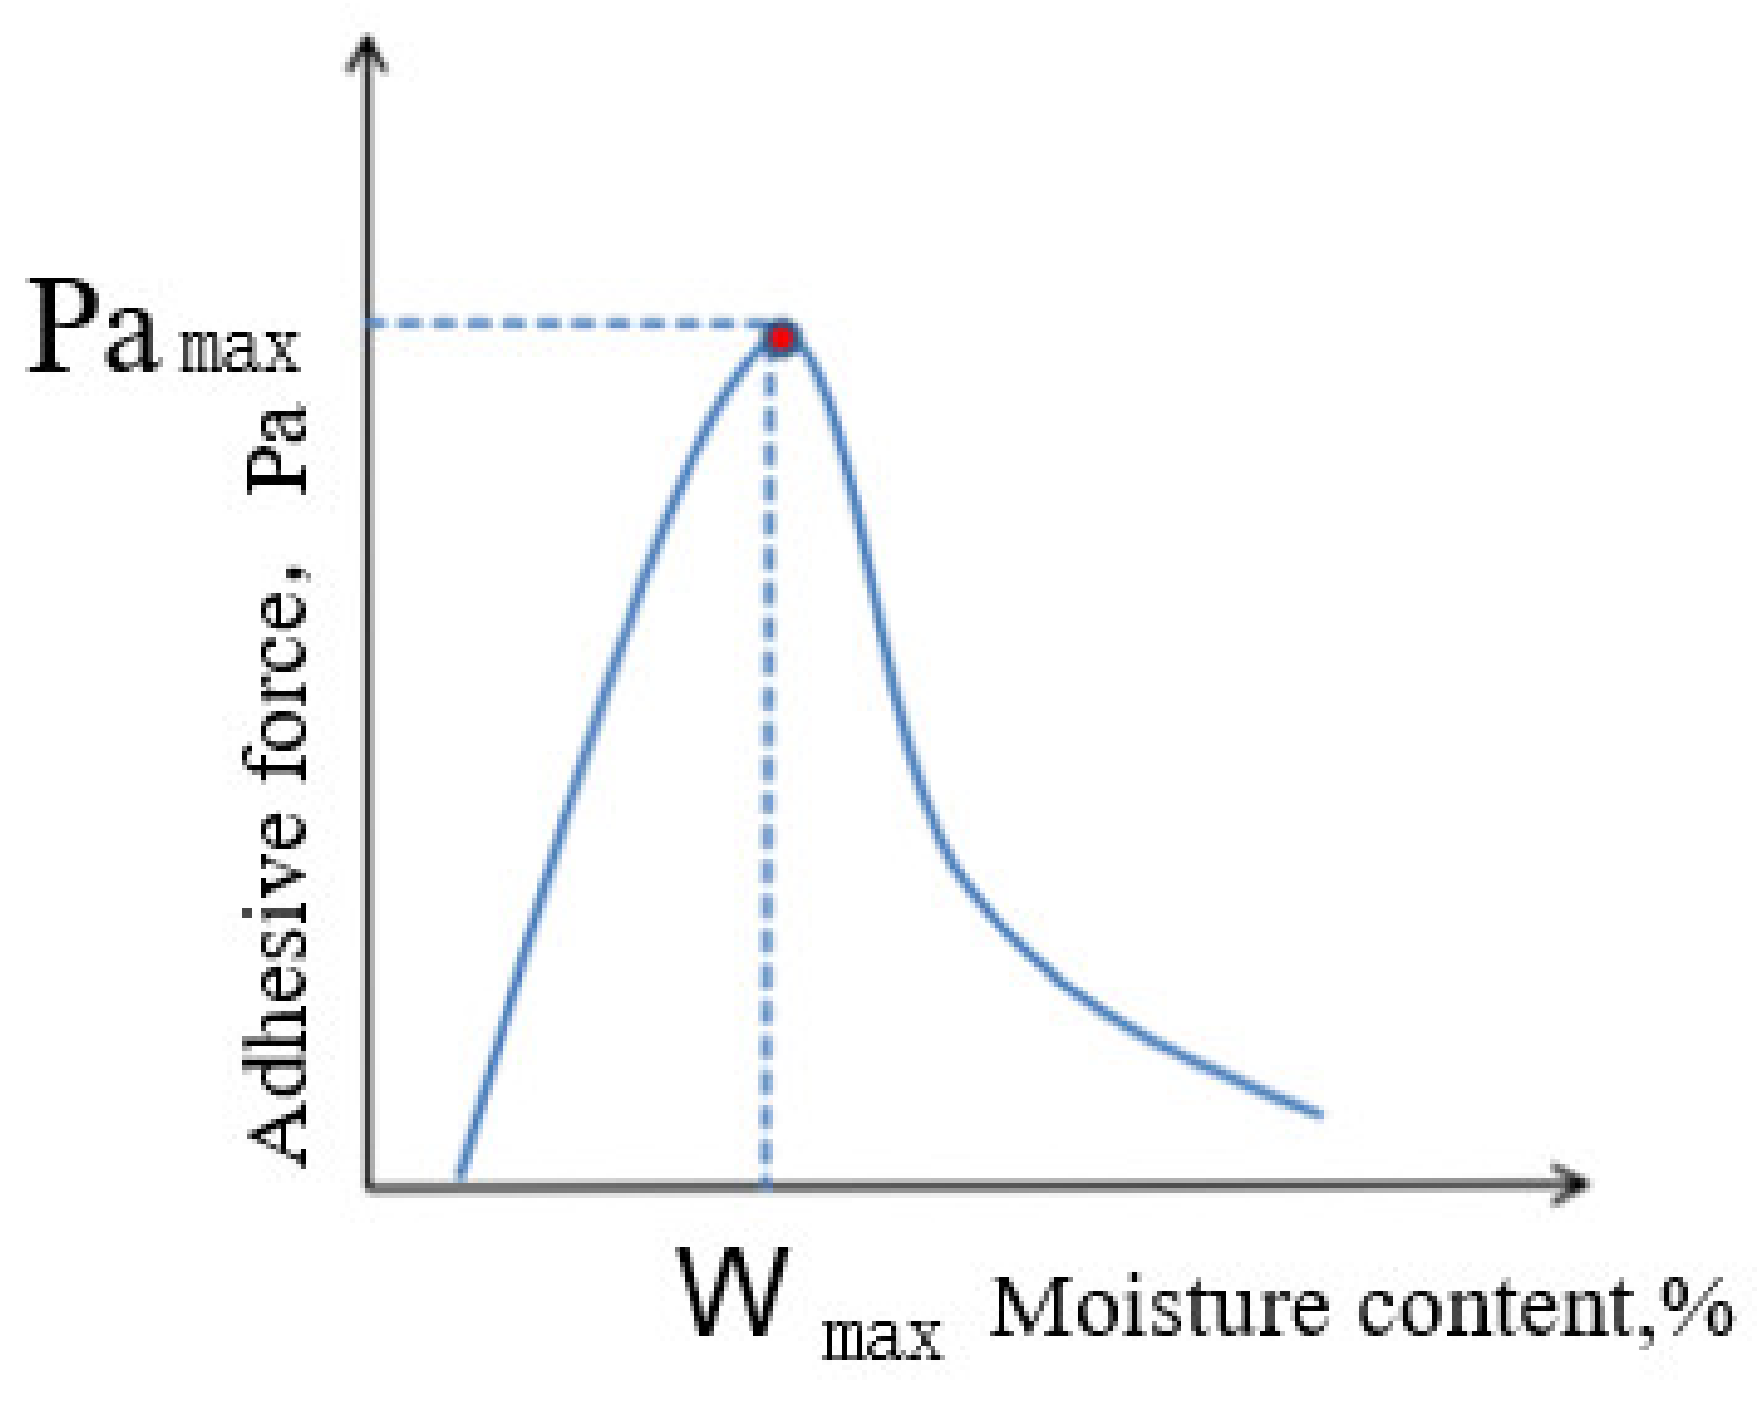
The general relationship between the soil adhesive force for metal surfaces and the soil moisture content is shown in Figure 4. The corresponding relationship curve was drawn using moisture as the abscissa and adhesive force as the ordinate. Since soil adhesive force is the ratio of the force value to the area under force, the test results in this paper were expressed in terms of equivalent pressure, and the unit was Pa;
Tyler [8] established a volume fractal dimension model in three-dimensional space according to the particle fractal characteristic model in two-dimensional space proposed by Mandelbrot, and the following equation (Equation (1)) is obtained after development [8]:
V ( r > R ) = C V [ 1 ( R λ V ) 3 D ]
where V is the volume of particles larger than a given particle size; r is the measured scale; R is a specific particle size; CV and λv are constants describing the shape and scale; and D is the fractal dimension.
CV and λv were, respectively, assigned to the upper limit value of the total volume and the soil particle size [9], and Equation (1) was transformed into:
lg V R V T = ( 3 D ) lg ( R R max )
The linear regression model was produced using the least squares method with the left side as the horizontal coordinate and the right side as the vertical coordinate, in accordance with Equation (2). The slope of the line had the value of (3−D) in the equation. The experimental data related to particle size were processed according to fractal theory, and a weight analysis of the soil adhesion and relevant factors was performed. In the process of fitting, curve estimation in SPSS software was used, and the curve with the best pairwise correlation among the fitted models of the scatter plot was selected.

2.4. Selection of Soil Moisture Content Measuring Points

In order to study the influence of soil parameters on adhesion characteristics, the first experiment for each soil was carried out after natural air drying, and then the amount of watering for each group was gradually increased by equal amounts while keeping the soil mass and the specimen size unchanged.

3. Analysis of Experiment Results

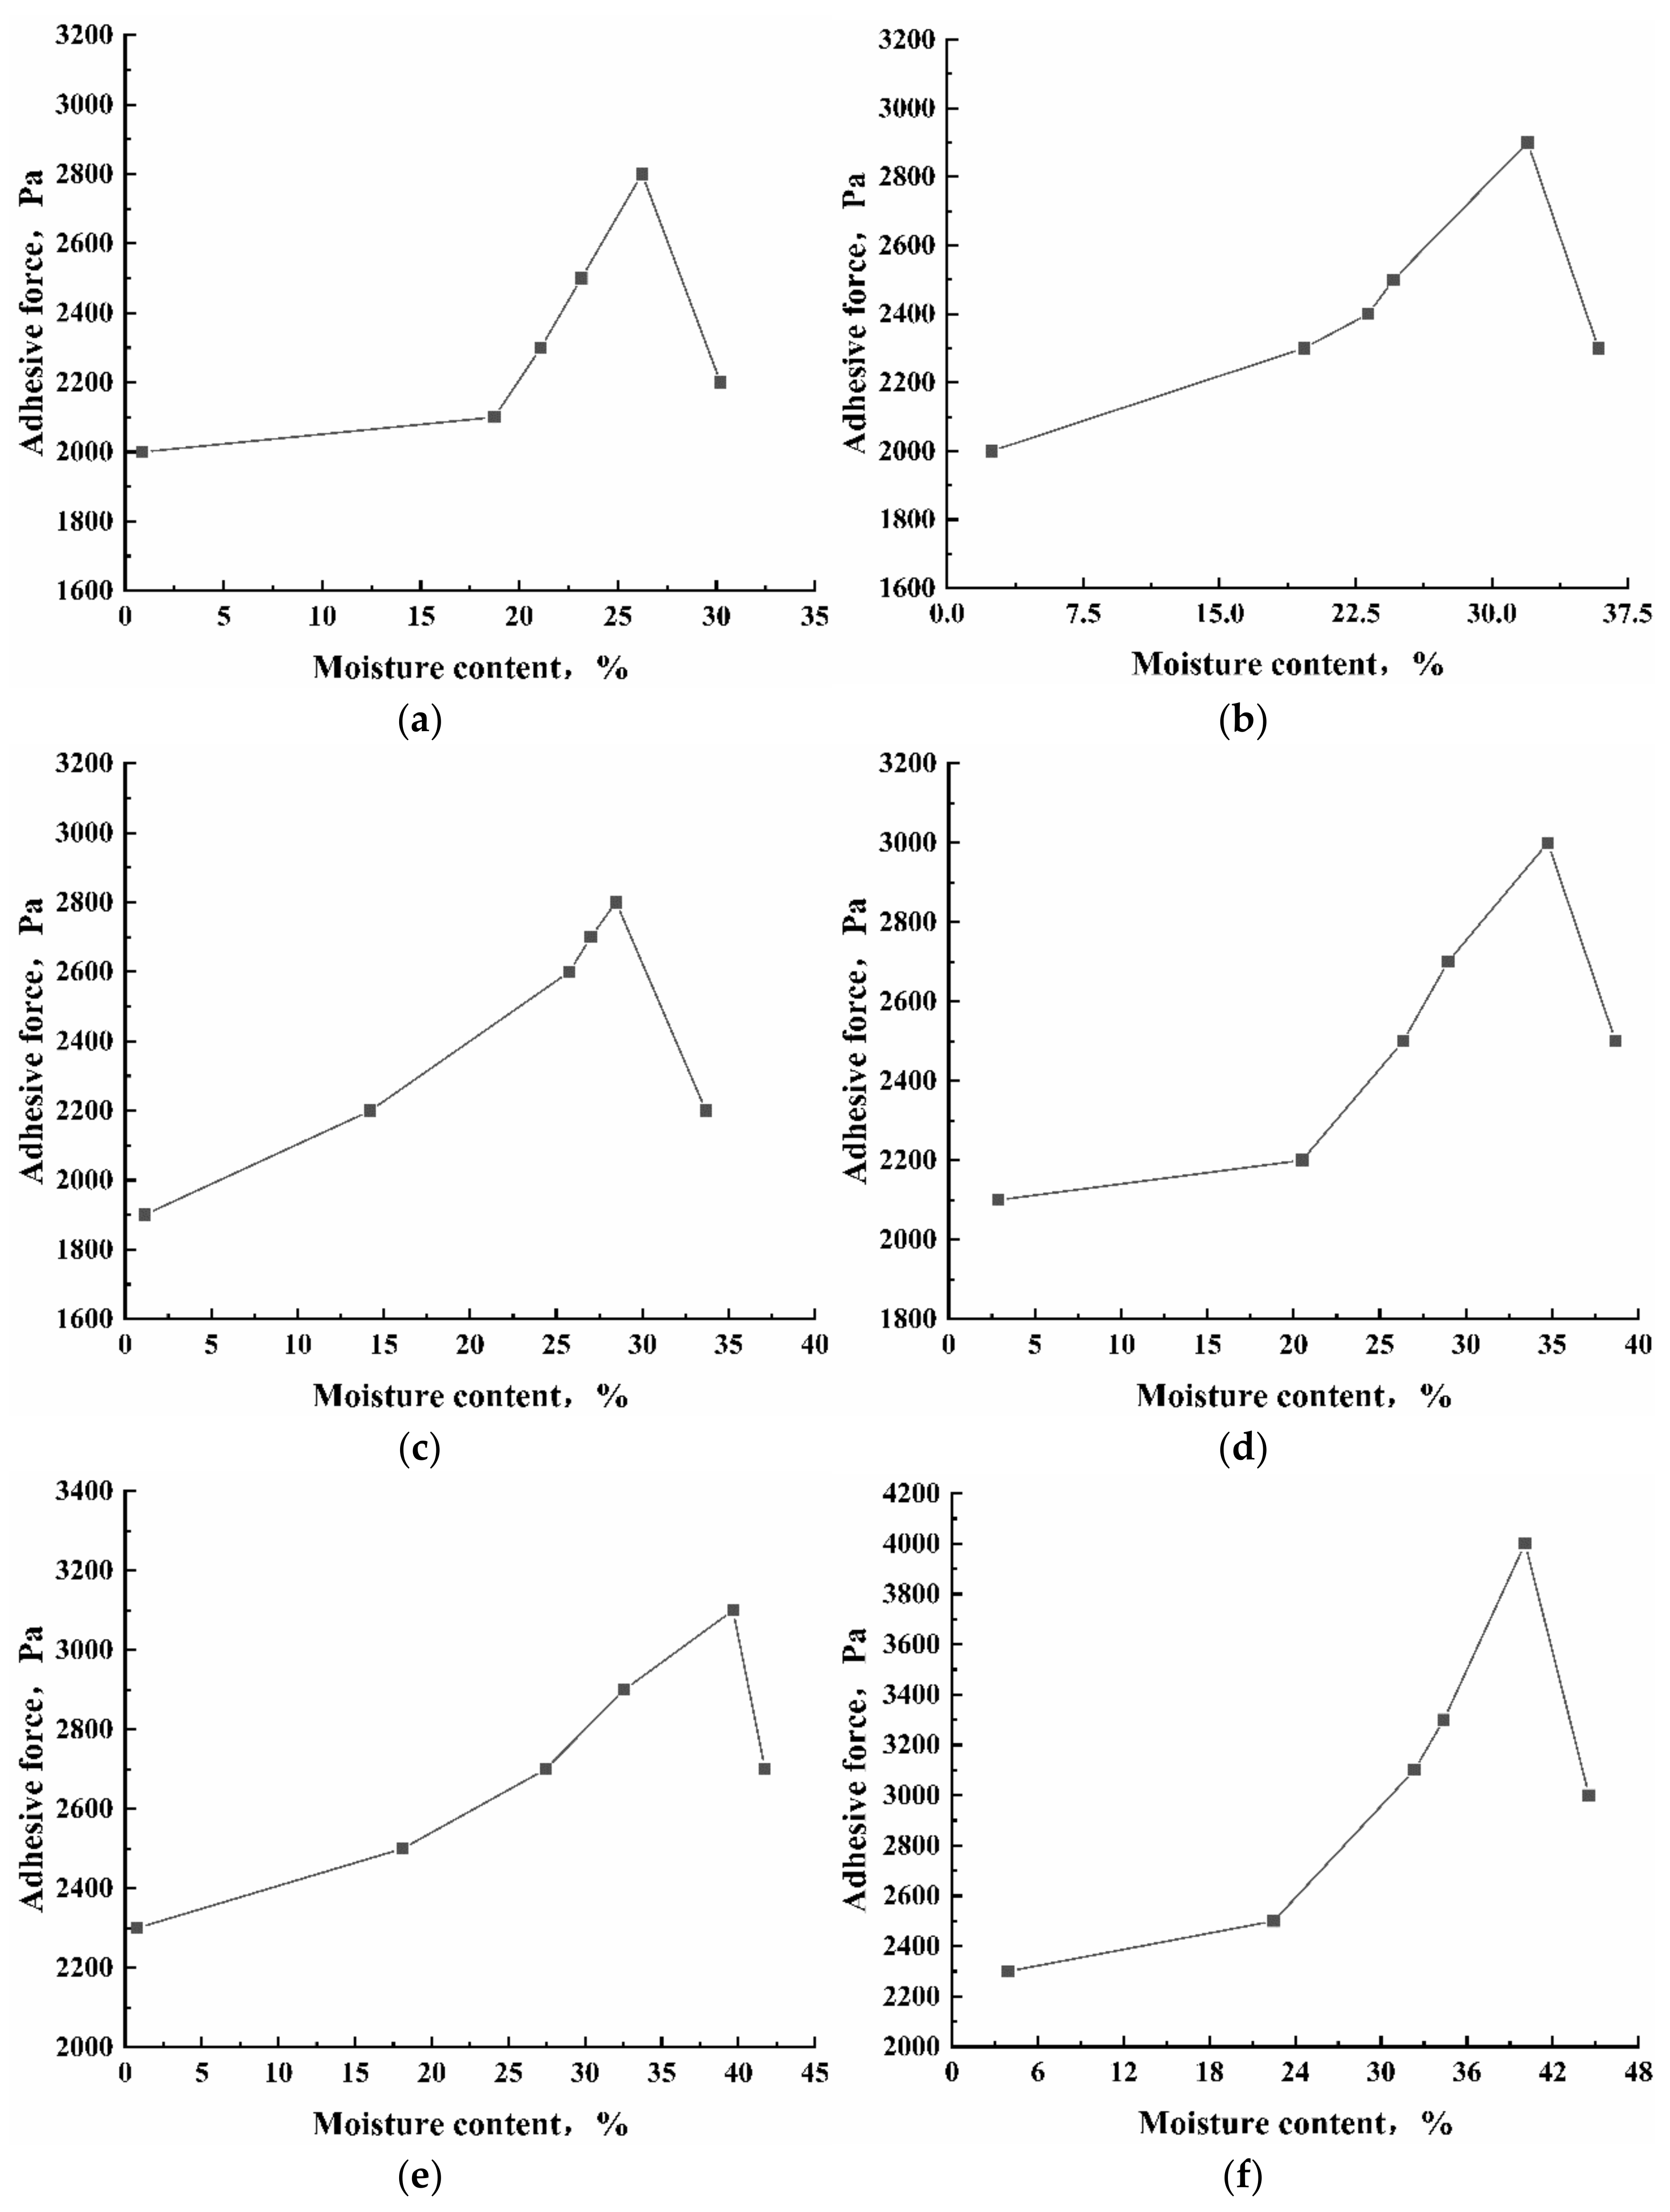
The experimental results were determined by the influence of soil type and soil moisture content on the adhesive force characteristics [10]. As shown in Figure 5, the amount of soil moisture necessary to reach the peak adhesive force varied for different soil textures. However, they showed the same trend.
The change in water content in the silt and clay soil had a great influence on soil adhesion, and a gravimetric device was used to measure soil water content. The characteristic curves for adhesive force for the different soil samples are summarized in Figure 6. The moisture required for the maximum adhesive force in the six soils increased gradually, and the individual values were 26.22%, 28.46%, 31.97%, 34.74%, 39.65%, and 40.07%. The clay content of the six soils gradually increased from a–f; this was because the different properties of soil determine the moisture required for the formation of a water film on the surface [1].

4. Discussion

Particle size composition is an important factor determining soil quality, and soil properties and structure are also determined by particle size composition [11,12]. Soil is a porous medium composed of irregular particles with different sizes that has certain fractal characteristics [13,14]. Correlation analysis showed that soil particle size was the key factor affecting soil adhesion. The development of fractal theory and analysis techniques has opened up new avenues of research, freeing us from the limitations of qualitative analysis. Therefore, based on fractal theory, this study dealt with experimental data for soil particle gradation and analyzed the weight of the influence of each related factor on soil adhesion.

4.1. Fractal Characteristics of Soil Particle

Many scholars have conducted research on soil fractal characteristics [14,15,16], but the volume percentages of soil particles could not be obtained due to technical limitations, so the calculation of fractal dimension has usually been performed using the mass percentage instead. With the development of technology, the method for calculating the fractal dimension using the mass percentage has been questioned. Laser particle size measurement technology can accurately calculate the soil particle size and volume fractal dimension.
Figure 7 shows the results of the analysis of the soil samples’ particles fitted in double logarithmic coordinates. The fitting correlation coefficients of each soil shown in the figure were all around 0.9, which indicated that the fractal structure of each soil existed objectively. The larger the fractal dimension is, the greater the mixing of the different graded particles, indicating a well-graded soil [17]. The fractal dimension Dg was between 2.3 and 2.6, indicating that the distribution of the soil fractal dimension was dispersed and the correlation and accuracy of the obtained fitting results were serviceable.

4.2. Relationship between Fractal Dimension and Soil Moisture Content

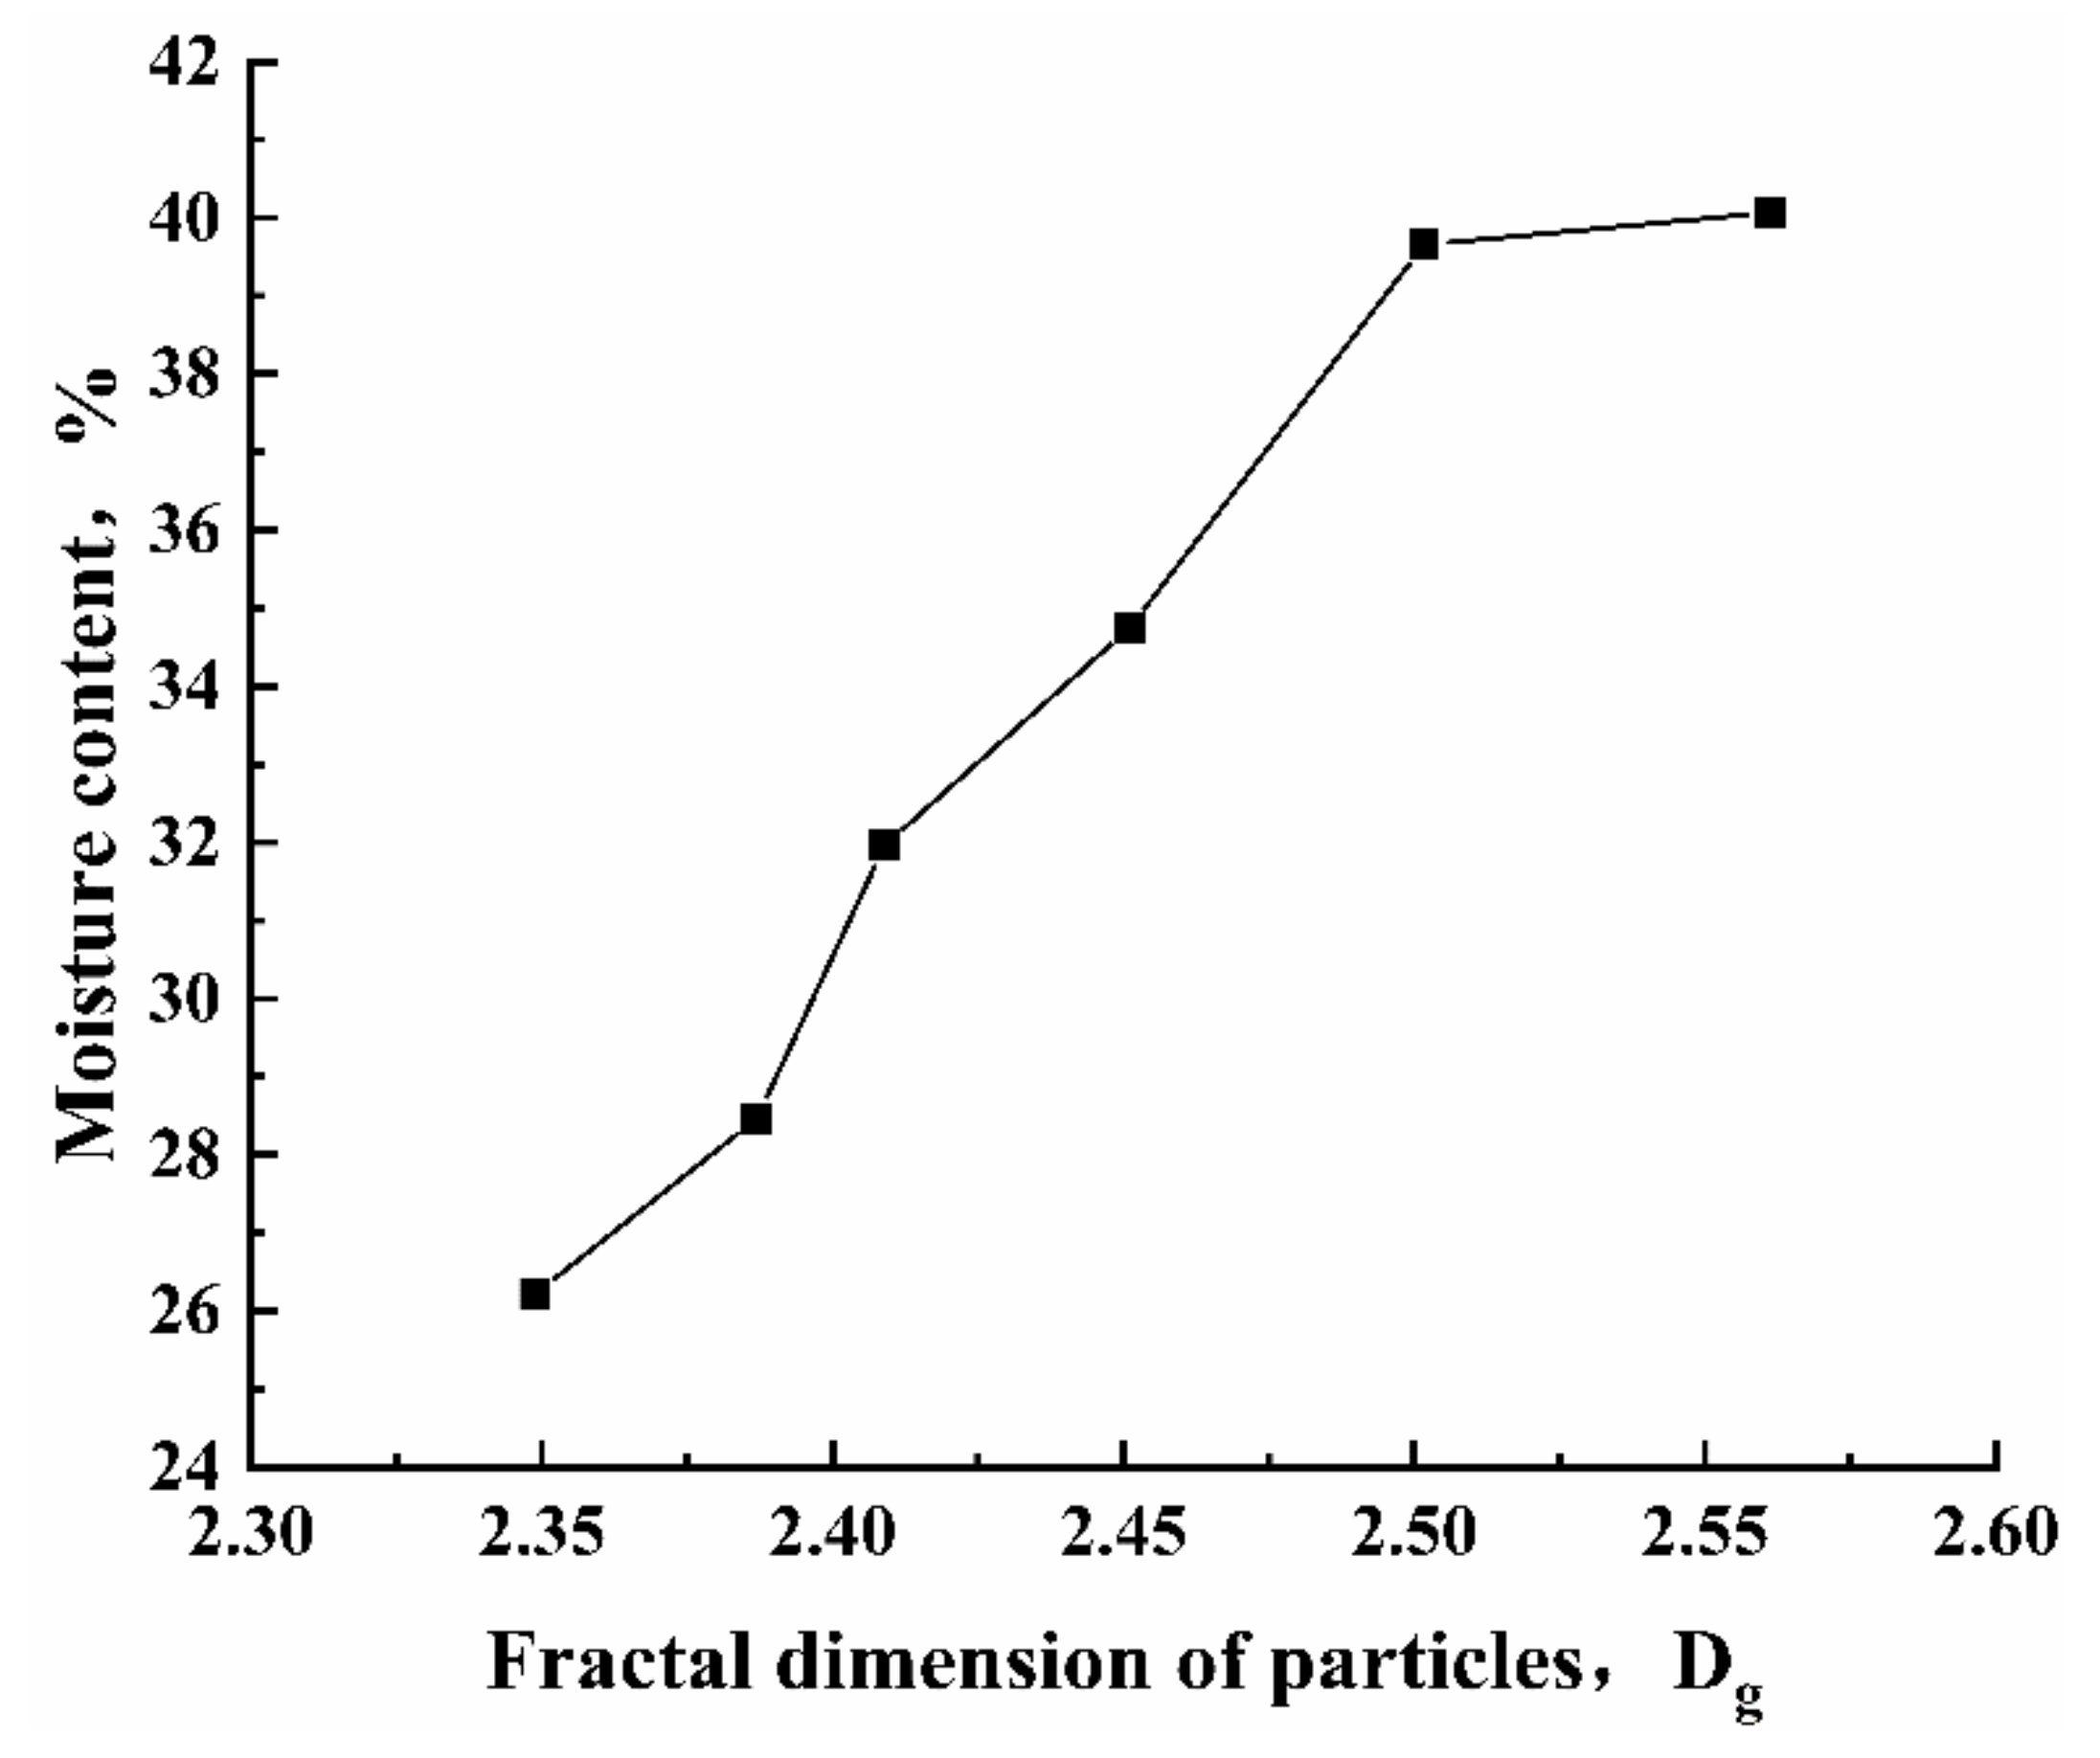
As can be seen in Figure 6, the moisture required to reach the peak adhesion strength for each soil was different, ranging from 26.22% to 40.07%. Figure 8 shows the results from fitting the scatter plot of the fractal dimension and moisture content of each soil. It can be seen that the soil moisture content increased gradually with the increase in the fractal dimension. The growth span of the fractal dimension was small, but it had a great influence on water content. Soil texture was the key factor controlling soil moisture content, which indicates that the soil fractal dimension can be used as a key index to describe soil texture.

4.3. Correlation between Fractal Dimension and Adhesive Force

In correlation studies, the correlation coefficient R is used to indicate the degree of correlation between variables, and the closer the absolute value of R is to 1, the higher the degree of correlation [18,19]. In statistics, the p value is usually used to reflect the occurrence probability of an event. Statistical results with p value less than 0.05 are usually selected, representing statistical differences with probabilities greater than 95% [20]. Based on the above, the correlation between the fractal dimension and soil adhesion was analyzed.
IBM SPSS Statistics was used to conduct regression analysis of the fractal dimension of particles and the adhesive force of each soil. As observed in Figure 9, adhesive force increased with the increase in fractal dimension, the p value was 0.011 less than 0.05, and the correlation R was 0.950, confirming that the relationship between the fractal dimension and soil adhesion was a very significant positive correlation. According to Equation (1), the fractal dimension is related to the particle size distribution, so it is necessary to study the relationship between the fractal dimension and soil adhesion.

4.4. Correlation between Particle Composition and Adhesive Force

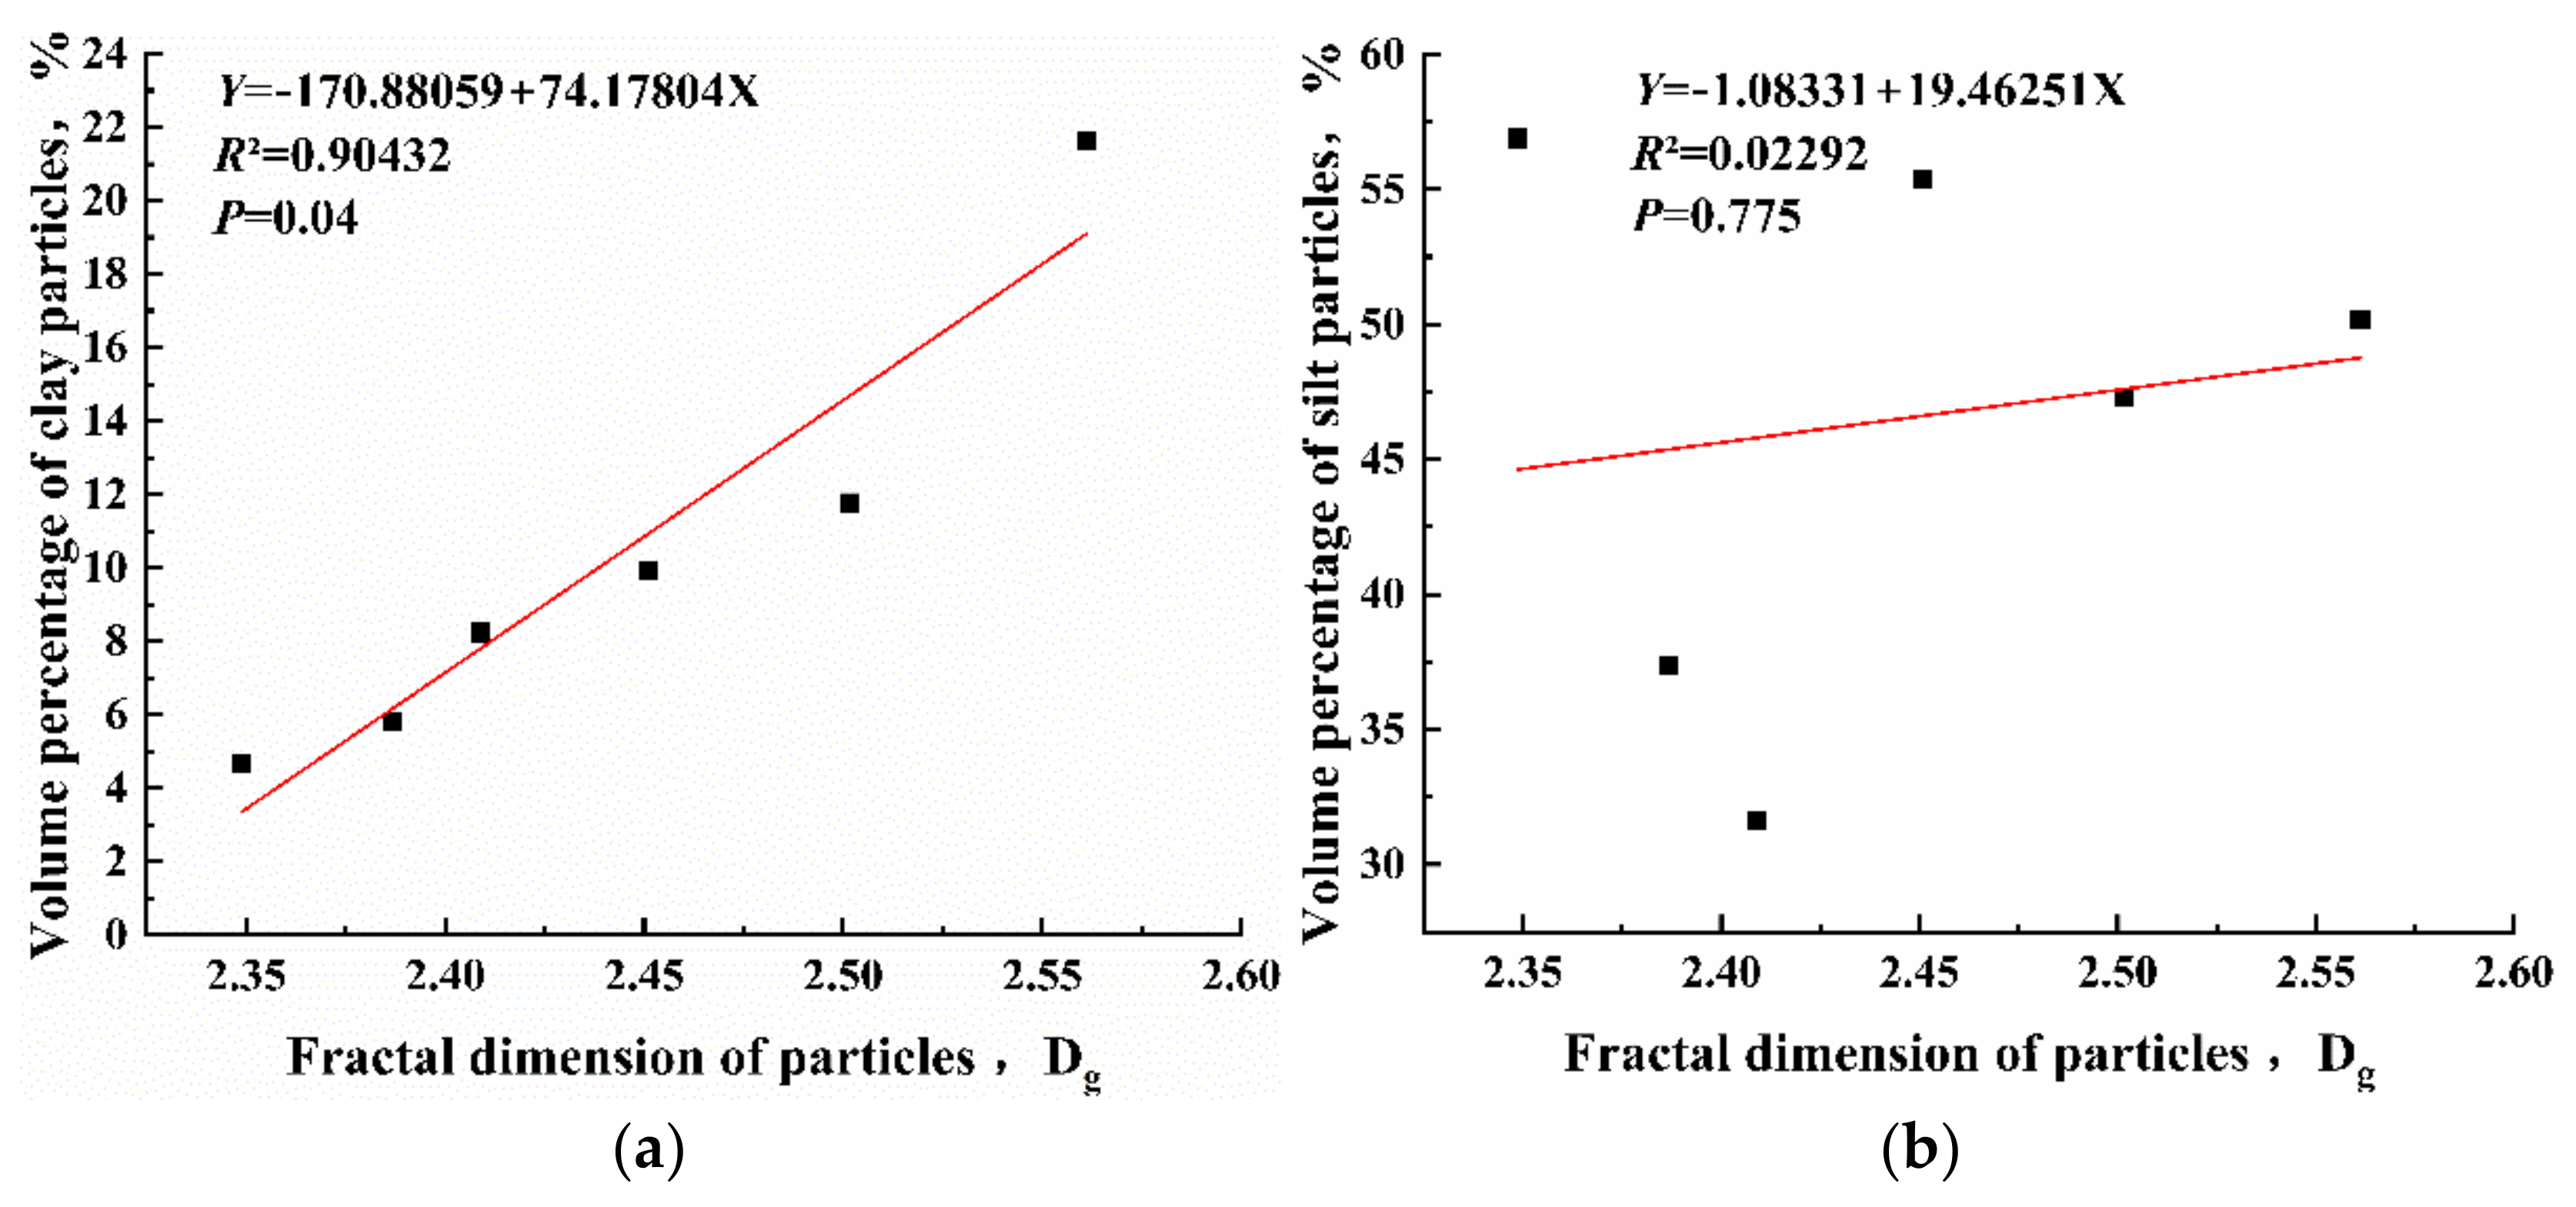
Soil adhesion is affected by the volume percentage of soil particles [3]. To further reveal the correlation, scatter plots of the fractal dimension Dg and the volume percentage of each soil particle were drawn and analyzed.
As presented in Figure 10, the fractal dimension of particles was highly significantly correlated (R = 0.951) with the volume percentage of clay particles (<0.005 mm) and the value of p was less than 0.05. The fractal dimension was slightly positively correlated (R = 0.151) with the volume percentage of silt particles (0.005–0.05 mm), and it was significantly negatively correlated (R = −0.580) with the volume percentage of sand particles (0.05–2 mm). Therefore, the volume percentage of clay particles played a decisive role in the fractal dimension, and the greater the soil clay content, the larger the fractal dimension of the particles.
Based on the results of the analysis of soil particle content versus the fractal dimension shown in Figure 10, the highly correlated soil particle content was fitted to the adhesive force for further determination (Figure 11). The soil clay content played a key role in soil adhesion, with a highly significant positive correlation at R2 > 0.95, under 500 g external load. The adhesive force increased with the increment in the clay particle content volume percentage.

4.5. Effect of Soil Particle Size on Soil Water-Holding Capacity

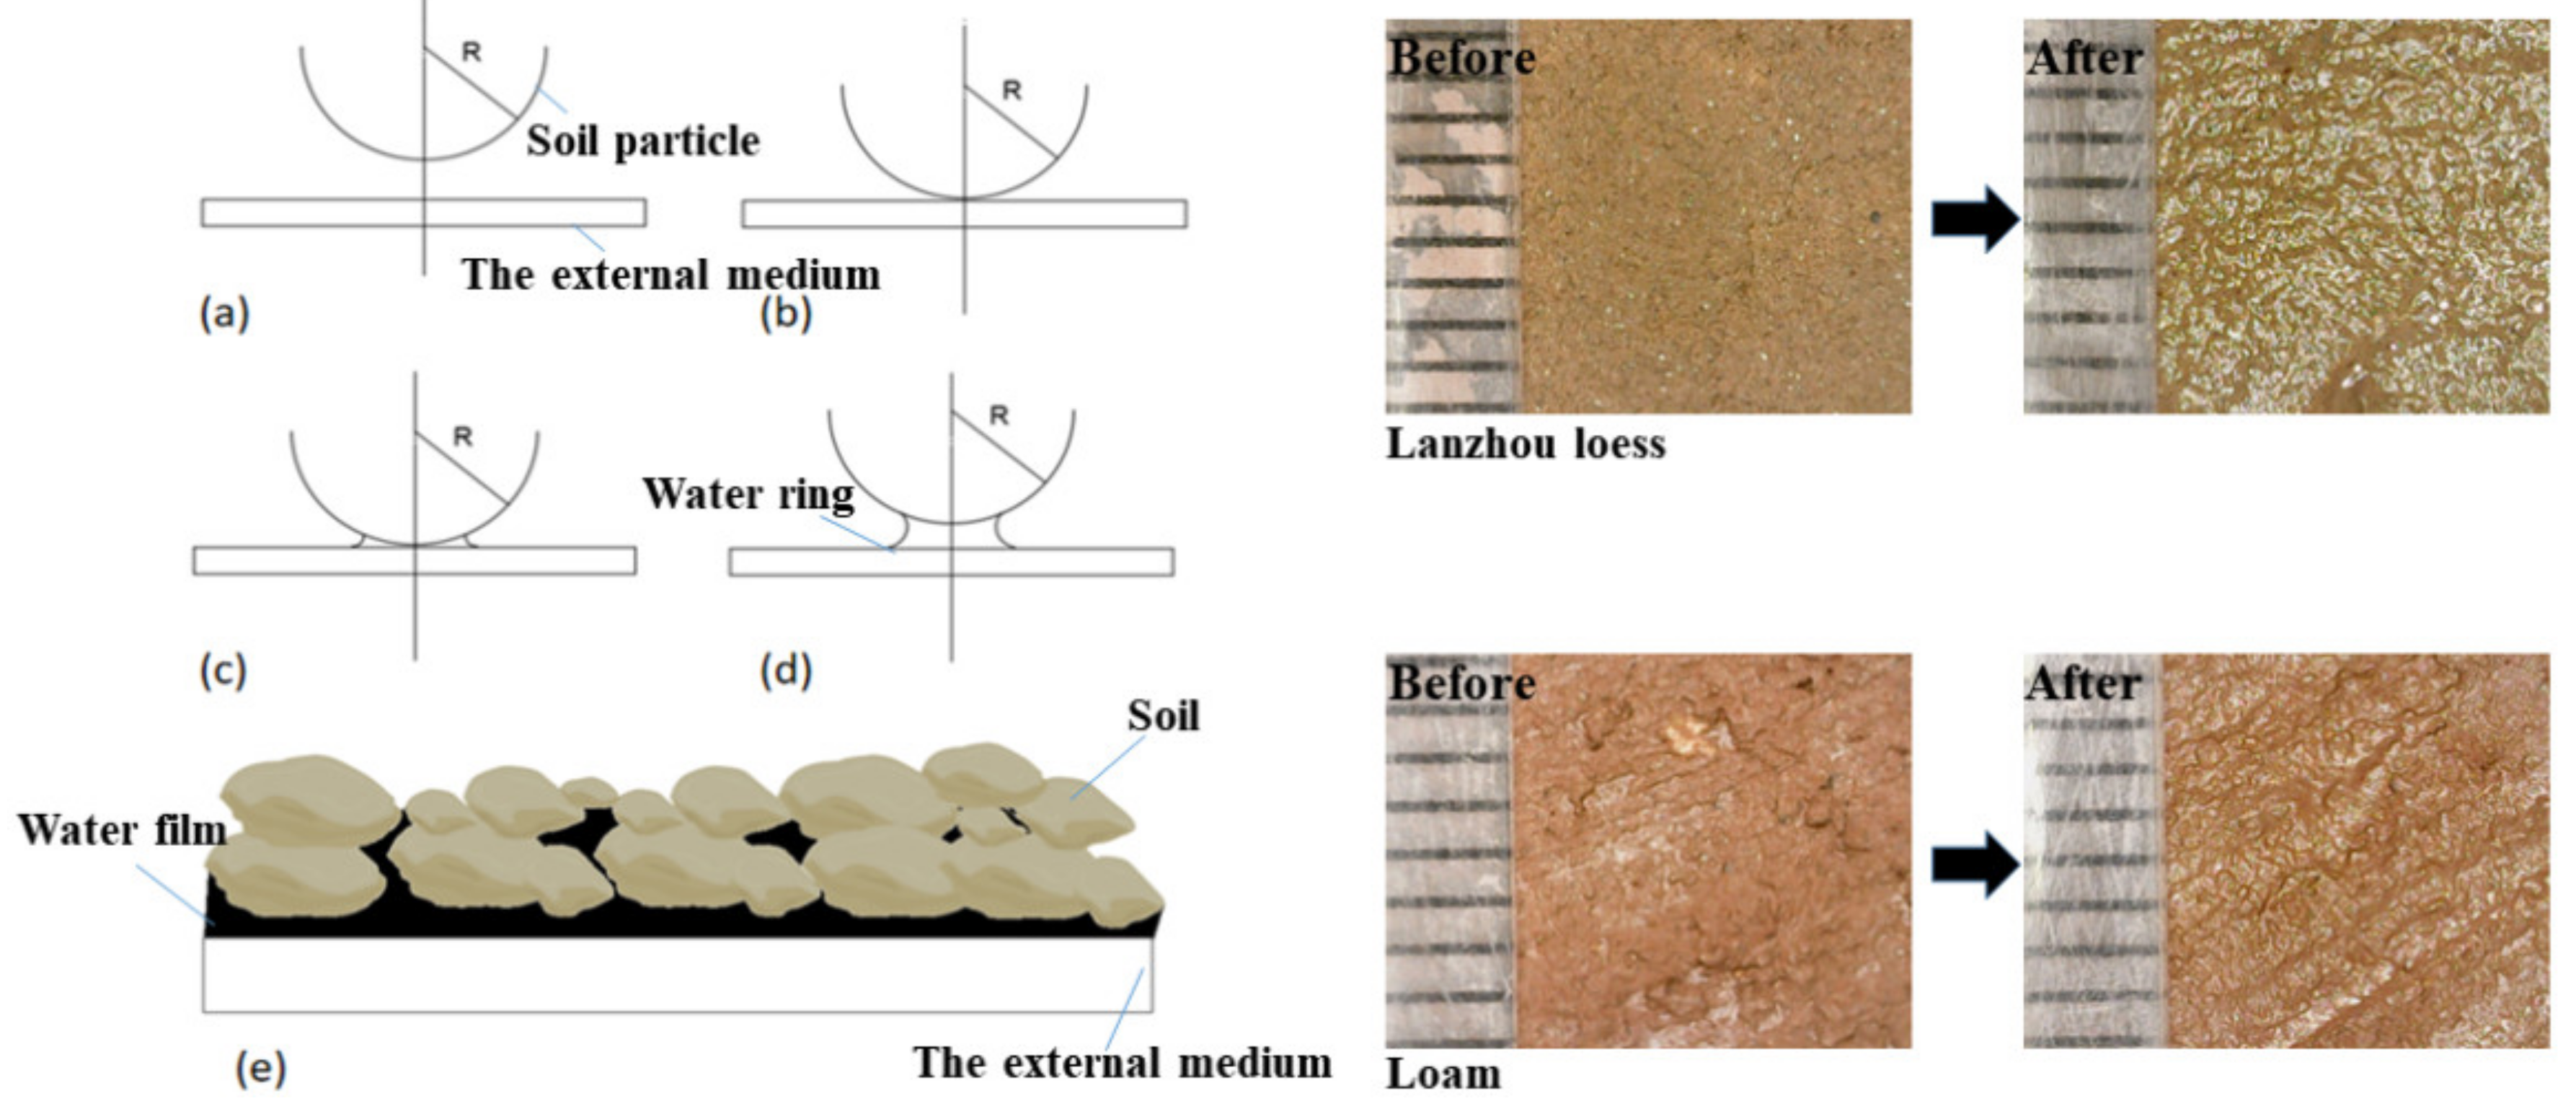
As shown in Figure 12, the effect of particle size on soil water-holding capacity was analyzed with the water ring–water film model [21] and using microscopic images of the soil before and after contact with external media. When the steel weight was in contact with the soil, water rings were formed between the soil particles and the steel weight. As the moisture increased, some of the water rings connected to form a water film that produced soil adhesion [5]. As shown in Figure 5, the addition of water to each soil was the same, but the actual soil moisture content was different. These findings explained why the soil moisture content was not only controlled by the amount of water added but by the water-holding capacity of the soil itself. The soil water-holding capacity was determined by the proportion of the soil clay content, which had a large specific surface area and strong surface activity. The effect of clay content on soil properties was more important than the effects of sand and silt, and the clay content affected soil adhesion by affecting water absorption capacity. For example, the changes in the soil surface layer before and after the separation of Lanzhou loess and loam were compared. It was found that the Lanzhou loess samples had less soil clay content, and the moisture migrated from the inside to the surface of the soil after the contact with external media, which was the reason why the soil water content expanded to the level of free water on the soil–metal surface; the influence of soil adhesion was thus reduced. The loam samples had high soil clay content, and less water precipitated from the surface after the contact with external media, leading to a higher adhesive force. Therefore, the greater the soil clay content was, the stronger the soil adhesion.

5. Conclusions

In this study, a test of adhesive force was carried out by changing soil type. The compositions of six kinds of test soil samples were described quantitatively using fractal theory. The correlation between the soil fractal dimension and soil adhesion was analyzed, and the degree of influence of each parameter on soil adhesion was determined. Further analysis led to the following conclusions:
  • The soil adhesion changed in the same way, but the moisture required for reaching the final limit of the soil adhesion was different. In all soil types, there were significant effects of the fractal dimension and soil particle composition on the coefficient of soil adhesion at the probability level of 0.5%–1%. The larger the fractal dimension was, the more moisture required for the adhesive force to reach a peak, indicating a positive correlation;
  • The analysis of the correlation between soil parameters and soil adhesive force showed that the correlation between the fractal dimension of particles and adhesive force were highly significant. The greater the fractal dimension of particles was, the higher the soil adhesion. The clay content in the soil was highly significant and positively correlated with adhesive force. The soil clay content had a decisive influence on the fractal dimension and was also a key factor affecting soil adhesion. Therefore, it is feasible to determine and analyze the adhesive force based on the changes in the fractal dimension and the percentage of clay content in soil samples.

Author Contributions

H.L. (Hang Li): Implementation of the experiment, Data curation, Writing—original draft. Z.Z.: Project administration, Conceptualization, Experimental design, Writing—review and editing, Supervision. J.Z.: Supervision, Writing—review and editing. L.Y.: Software, Resources. H.L. (Haichao Long): Investigation, Validation. All authors have read and agreed to the published version of the manuscript.

Funding

The authors greatly appreciate the support from the following research grants: (a) Heilongjiang Transportation Investment Group Co., Ltd. (JT-100000-ZC-FW-2021-0129); (b) the National Natural Science Foundation of China (NSFC) (42011530083); (c) the Russian Foundation for Basic Research: RFBR-NSFC project (20-55-53006).

Institutional Review Board Statement

Not applicable.

Informed Consent Statement

Not applicable.

Data Availability Statement

Not applicable.

Conflicts of Interest

The authors declare no conflict of interest.

References

  1. Ren, L.; Tong, J.; Li, J.; Chen, B. SW-Soil and Water: Soil Adhesion and Biomimetics of Soil-engaging Components: A Review. J. Agric. Eng. Res. 2001, 79, 239–263. [Google Scholar] [CrossRef] [Green Version]
  2. Abbaspour-Gilandeh, Y.; Hasankhani-Ghavam, F.; Shahgoli, G.; Shrabian, V.R.; Abbaspour-Gilandeh, M. Investigation of the Effect of Soil Moisture Content, Contact Surface Material and Soil Texture on Soil Friction and Soil Adhesion Coefficients. ACTA Technol. Agric. 2018, 21, 44–50. [Google Scholar] [CrossRef] [Green Version]
  3. Jia, X. Theoretical Analysis of the Adhesion Force of Soil to Solid Materials. Biosyst. Eng. 2004, 87, 489–493. [Google Scholar] [CrossRef]
  4. Tong, J.; Ren, L.; Chen, B.; Qaisrani, A.R. Characteristics of adhesion between soil and solid surfaces. J. Terramech. 1994, 31, 93–105. [Google Scholar] [CrossRef]
  5. Burbaum, U.; Sass, I. Physics of adhesion of soils to solid surfaces. Bull. Eng. Geol. Environ. 2017, 76, 1097–1105. [Google Scholar] [CrossRef]
  6. Marani, S.M.; Shahgholi, G.; Moinfar, A. Effect of nano coating materials on reduction of soil adhesion and external friction. Soil Till. Res. 2019, 193, 42–49. [Google Scholar] [CrossRef]
  7. Haines, W.B. Studies in the physical properties of soil. I. Mechanical properties concerned in cultivation. J. Agric. Sci. 1925, 15, 178–200. [Google Scholar] [CrossRef]
  8. Tyler, S.W.; Wheatcraft, S.W. Fractal scaling of soil particle-size distribution: Analysis and limitations. Soil Sci. Soc. Am. J. 1992, 56, 362–369. [Google Scholar] [CrossRef]
  9. Perfect, E.; Kay, B.D. Applications of fractals in soil and tillage research: A review. Soil Till. Res. 1995, 36, 1–20. [Google Scholar] [CrossRef]
  10. Fountaine, E.R. Investigations into the mechanism of soil adhesion. Eur. J. Soil Sci. 1954, 5, 251–263. [Google Scholar] [CrossRef]
  11. Konishchev, V.N. Cryogenic weathering. In Proceedings of the Tr. Inter. Conferences on Permafrost studies, Yakutsk, Russia, September 1973. [Google Scholar]
  12. Sergeev, E.M.; Minervin, A.V. New Data for Solving the Loess Problem. Izv. USSR Acad. Sci. Ser. Geol. 1964, 9, 53–64. [Google Scholar]
  13. Tyler, S.W.; Wheatcraft, S.W. Application of fractal mathematics to soil water retention estimation. Soil Sci. Soc. Am. J. 1989, 53, 987–996. [Google Scholar] [CrossRef]
  14. Anderson, A.N.; McBratney, A.B.; Crawford, J.W. Applications of Fractals to Soil Studies. Adv. Agron. 1997, 63, 1–76. [Google Scholar] [CrossRef]
  15. Arya, L.M.; Paris, J.F. A physicoempirical model to predict the soil moisture characteristic from particle-size distribution and bulk density data. Soil Sci. Soc. Am. J. 1981, 45, 1023–1030. [Google Scholar] [CrossRef]
  16. Turcotte, D.L. Fractals and fragmentation. J. Geophys. Res. 1986, 91, 1921–1926. [Google Scholar] [CrossRef]
  17. Ghanbarian, B.; Daigle, H. Fractal dimension of soil fragment mass-size distribution: A critical analysis. Geoderma 2015, 245-246, 98–103. [Google Scholar] [CrossRef]
  18. Ratner, B. The correlation coefficient: Its values range between +1/−1, or do they? J. Target. Meas. Anal. Mark. 2009, 17, 139–142. [Google Scholar] [CrossRef] [Green Version]
  19. Schober, P.; Boer, C.; Schwarte, L.A. Correlation Coefficients: Appropriate Use and Interpretation. Anesth. Analg. 2018, 126, 1763–1768. [Google Scholar] [CrossRef] [PubMed]
  20. Hryniewicz, O. Statistical properties of the fuzzy p-value. Int. J. Approx. Reason. 2018, 93, 544–560. [Google Scholar] [CrossRef]
  21. McFarlane, J.S.; Tabor, D. Adhesion of Solids and the Effect of Surface Films. Proc. R. Soc. London. Ser. A Math. Phys. Sci. 1950, 202, 224–243. [Google Scholar] [CrossRef]
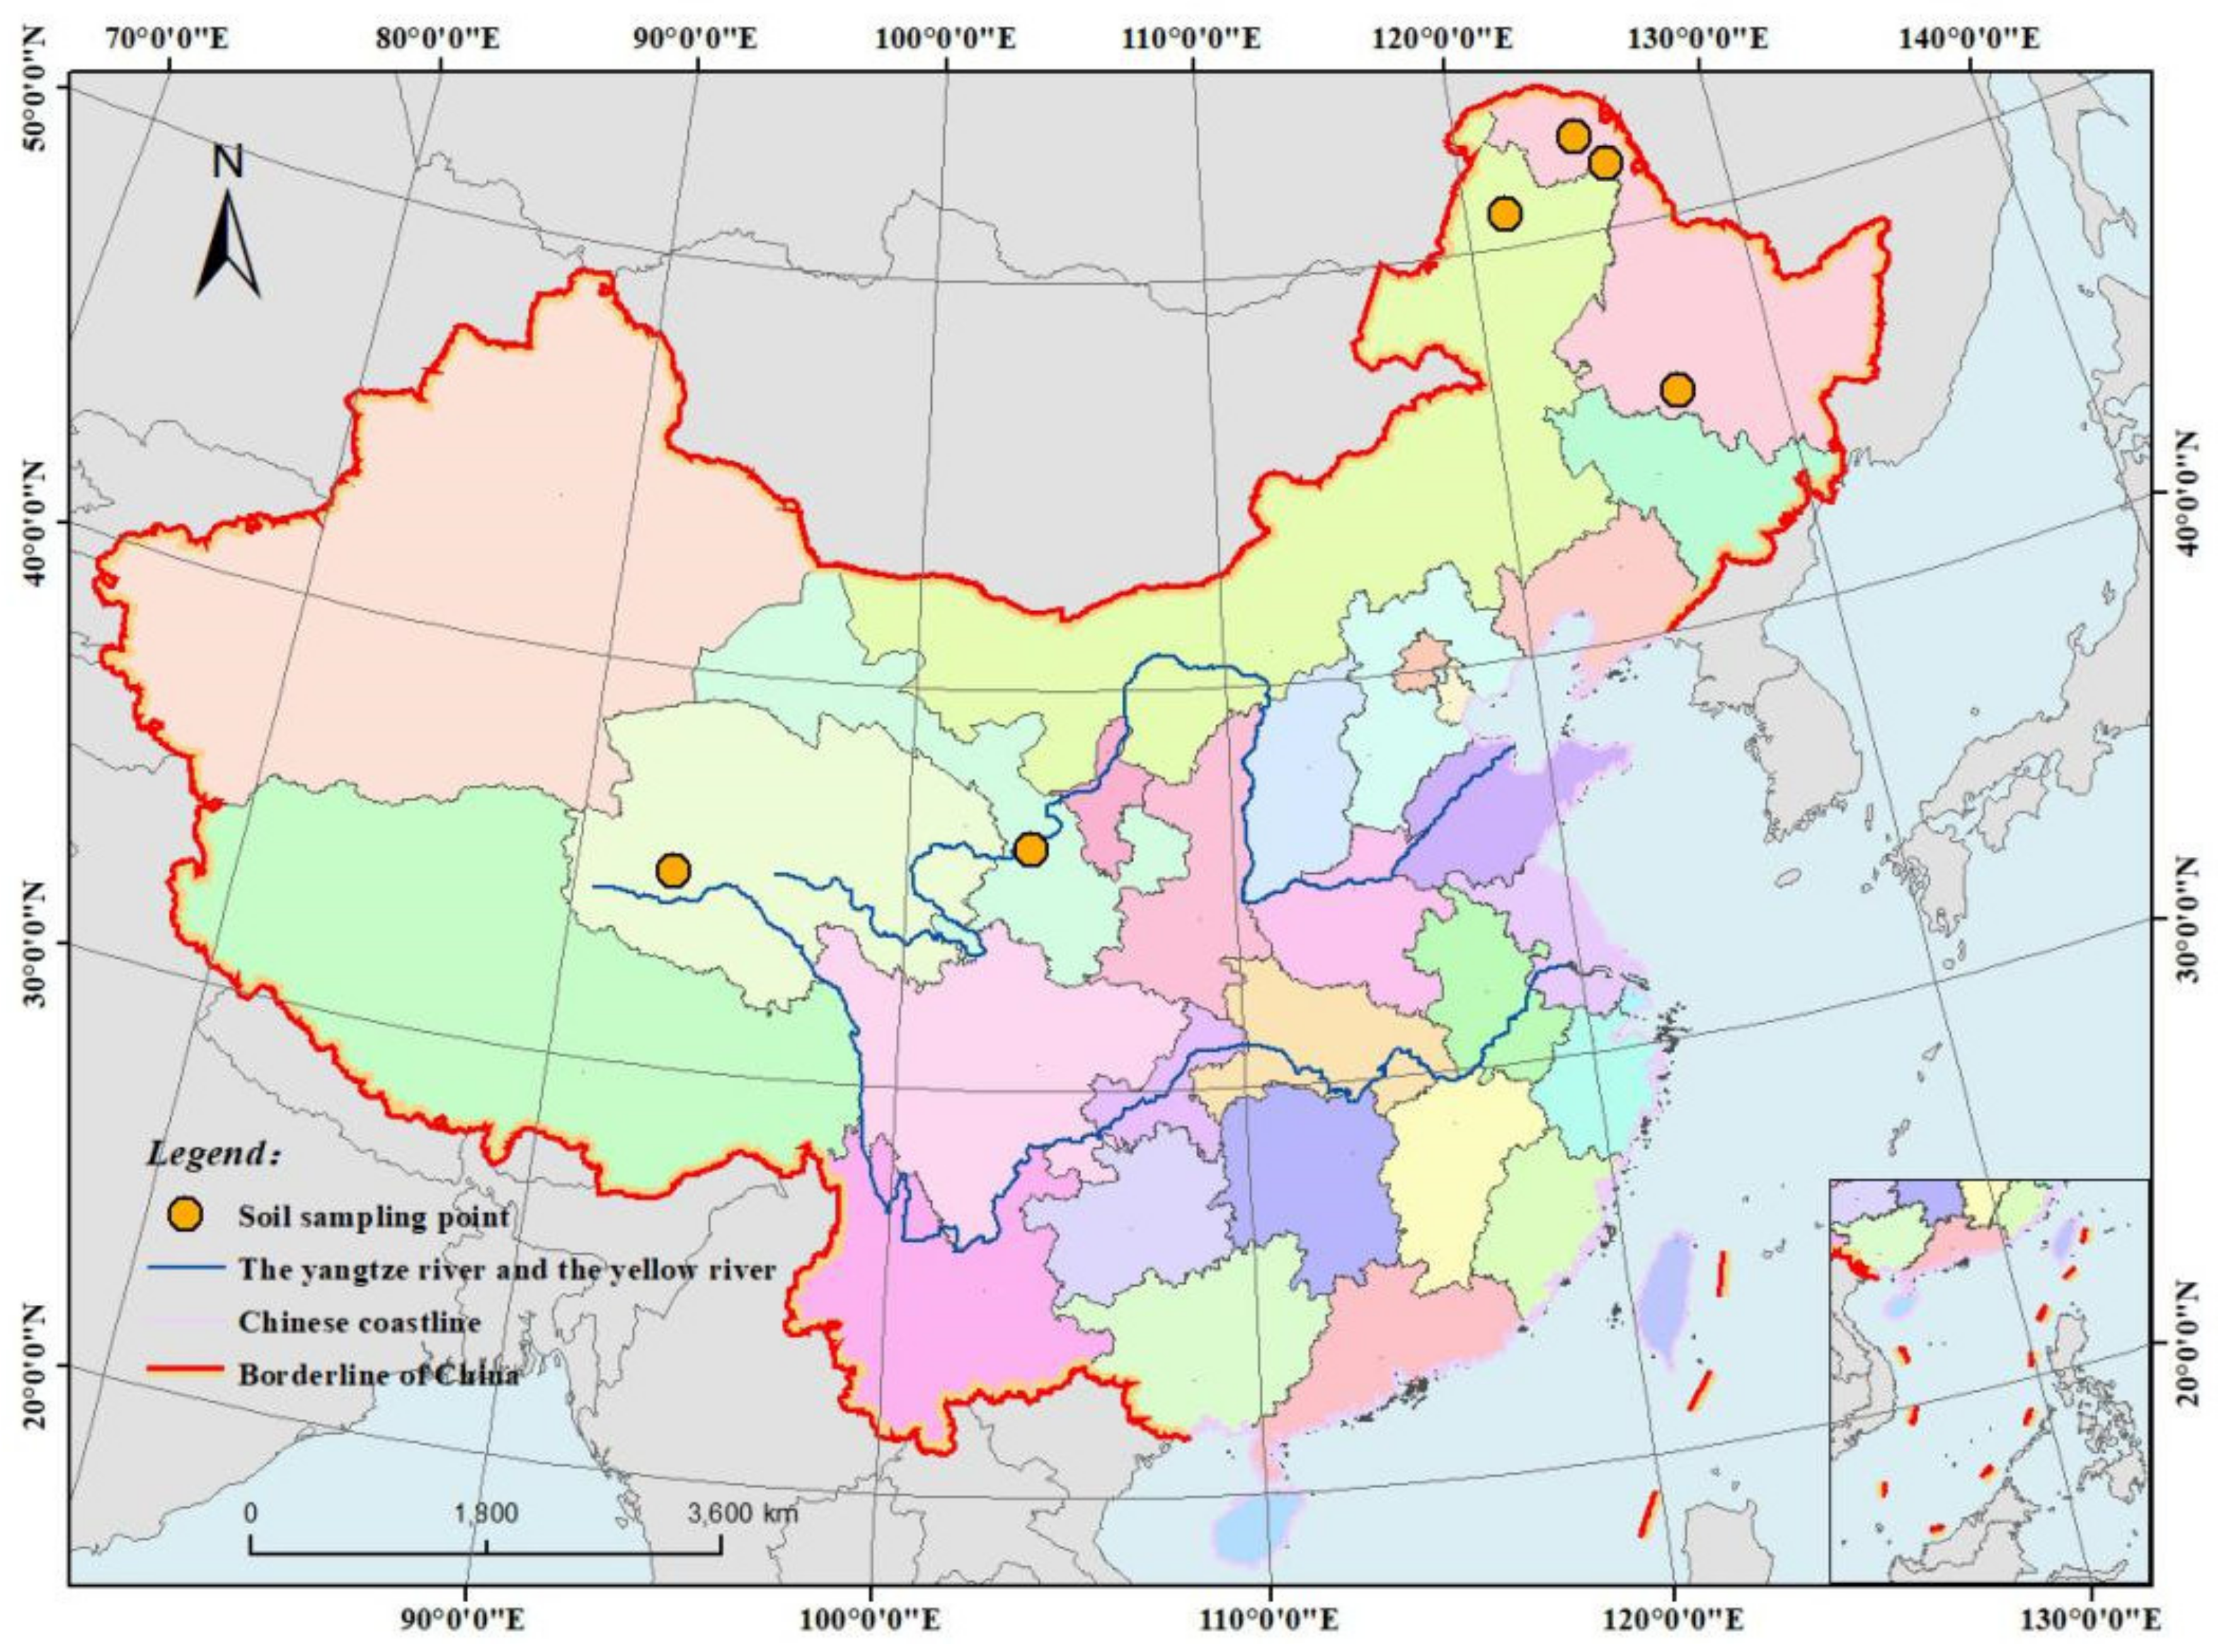
Figure 1. Geographical distribution of experiment soils.
Coatings 12 01743 g001
Figure 2. Semilogarithmic curve of particle gradation: (a) Lanzhou loess, (b) Songling soil, (c) Tahe soil, (d) Harbin clay, (e) loam, (f) Genhe red clay.
Coatings 12 01743 g002aCoatings 12 01743 g002b
Figure 3. Diagram of device for adhesive force measurement.
Coatings 12 01743 g003
Figure 4. Correspondence curve for soil moisture content and adhesive force.
Coatings 12 01743 g004
Figure 5. Characteristic curves for adhesive force: (a) Lanzhou loess, (b) Songling soil, (c) Tahe soil, (d) Harbin clay, (e) loam, (f) Genhe red clay.
Coatings 12 01743 g005
Figure 6. Summary of adhesive force curves for each tested soil.
Coatings 12 01743 g006
Figure 7. Calculation results for fractal dimension of soil volume: (a) Lanzhou loess; (b) Songling soil; (c) Tahe soil; (d) Harbin clay; (e) Loam; (f) Genhe red clay.
Coatings 12 01743 g007
Figure 8. Relationship between fractal dimension and soil moisture content.
Coatings 12 01743 g008
Figure 9. Analysis of the correlation between the fractal dimension and adhesive force.
Coatings 12 01743 g009
Figure 10. Correlation between volume percentage of soil different particles and fractal dimension of par-ticles: (a) Clay particles; (b) Silt particle; (c) Sand particles.
Coatings 12 01743 g010aCoatings 12 01743 g010b
Figure 11. Correlation analysis for soil clay percentage and adhesion.
Coatings 12 01743 g011
Figure 12. Water ring–water film model and soil micro-variation diagram. (a,b)Water ring was not formed; (c,d) formation of the water ring; (e) continuous water film state.
Coatings 12 01743 g012
Table 1. Information and number of six soils.
Serial NumberSoil NameLatitude and LongitudeAreaSoil Clay Content (%)
aLanzhou loess103.84592, 36.03645Lanshan, Lanzhou city4.66
bSongling soil125.67321, 51.53148Huli mountain, Greater Khingan range5.83
cTahe soil124.71008, 52.33428Tahe county, Greater Hinggan mountains8.24
dHarbin clay126.48067, 45.79857Harbin9.93
eLoam92.944079, 34.891631Beilu river in Qinghai–Tibet Plateau11.77
fGenhe red clay121.538076, 50.778943Genhe city21.62
Publisher’s Note: MDPI stays neutral with regard to jurisdictional claims in published maps and institutional affiliations.