Abstract
During the service process of the mechanized fishing boat, its low carbon steel hull and parts are extremely susceptible to Cl− erosion and seawater scouring, which cause a decrease in strength and lead to failure. To increase its service life and reduce maintenance costs, coating protection technology is widely used. In order to solve the problem of poor adhesion between paint coating and substrate and low strength of metal coating, NiCrMo-WC coatings with different WC contents (0 wt.%, 5 wt.%, 10 wt.%, 15 wt.%, 20 wt.%) were prepared on the surface of Q235 substrate by plasma cladding technology. The coatings were characterized by X-ray diffractometer (XRD), scanning electron microscope (SEM), energy spectrum analysis (EDS), etc. Its phase formation rule, microstructure and element distribution were studied. Microhardness test and electrochemical corrosion test were carried out. The study found that the 20 WC coating has the highest average hardness (563.1 HV). It is about 3.25 times of the Q235 substrate. It has the lowest friction, wear rate and lower friction coefficient, showing the best wear resistance. The 15 WC coating has the lowest self-corrosion current density (3.4934 × 10⁻⁷ A/cm2) and the lowest corrosion rate (0.0041 mm/a), which is only 3.7% of the corrosion rate of Q235 steel.
1. Introduction
As an important part of the Earth’s ecosystem, the ocean provides necessary and valuable resources for human survival and development. However, due to the particularity and complexity of the marine ecosystem, seawater is highly corrosive. The ocean is rich in Cl−, which has a small radius and high activity, it is easy to damage the oxide film of steel components and cause the material to fail [1,2]. Low carbon steel is widely used in hull manufacturing due to its high comprehensive performance and low engineering cost. In India, there are 199,141 boats used for fishing. Most fishing boats are composed of 6 mm thick mild steel plates. However, the strength of these materials is easily reduced by erosion and corroded by seawater. At present, the most widely used mild steel hull protection method is paint protection. Marine paint coatings not only protect ships from corrosion and biofouling, but also enhance the appearance of ships and provide the necessary safety for crew activities. However, its shortcomings are fatal. The biggest influence on the coating is the temperature difference, especially the severe temperature fluctuation. Due to the difference in the thermal expansion coefficient between the film and the substrate layer, the film is prone to shrinkage and expansion. Excessive temperature difference can cause the paint layer of the ship to fall off directly, which in turn leads to sub-film corrosion on the metal surface [3,4].
In order to overcome a series of problems caused by paint coatings, improve the service life of low carbon steel and reduce the manufacturing cost, many metal coating and composite coating technologies have been developed on the surface of low carbon steel hull and parts. Commonly used high-efficiency protection methods for low carbon steel include electroplating, thermal spraying, laser cladding and plasma cladding [5,6,7].
Ndiithi et al. used high-speed arc spraying method to prepare FeCrAl/Al composite coating on Q235 steel substrate with FeCrAl wire as anode and aluminum wire as cathode. The composite coating had better corrosion resistance than traditional FeCrAl coating [8]. Yang et al. used alloy wire thermal spraying technology to prepare AlZnSi coating with lamellar structure on the surface of Q235 steel plate. In seawater corrosion experiments, it was found that the corrosion products were mainly zinc–aluminum–carbonate–sodium hydroxide hydrate, which blocked the pores and caused self-sealing behavior, hindering further corrosion [9]. In addition, Mosayebi et al. prepared Ni-Mo coatings by electroplating. The study found that the addition of Mo element improved its surface structure and greatly improved its seawater corrosion resistance [10]. Ahmadiyeh et al. chose different concentrations of tungsten carbide nanoparticles to deposit Ni-W-B/WC coatings in electrolyte, and studied the effect of WC content on the coating properties. The study found that WC can help to improve its seawater corrosion resistance within a certain range [11]. Wang et al. prepared a Hastelloy C22 coating on the surface of Q235 by laser cladding technology, and found that the C22 coating can significantly improve the hardness and corrosion resistance of the steel substrate, but there were a few defects in the coating. Galvanic corrosion was prone to occur in seawater [12].
Plasma cladding has the characteristics of high energy, low dilution rate, metallurgical bond between coating and substrate, and the ability to select suitable cladding metal powders according to the performance requirements of components. Plasma cladding powder is the most important factor affecting the coating. By changing the powder composition and its ratio, the hardness, friction performance and corrosion resistance of the coating can be greatly improved. Ni-based alloys have high strength and excellent oxidation corrosion resistance, and their powders are also widely used in the preparation of plasma cladding coatings. Zhou et al. used the plasma cladding method to prepare NiCrBSi coating on the surface of gray cast iron, and found that the microhardness, elastic modulus and tensile strength of Ni-based cladding layer were significantly better than those of gray cast iron [13]. Its excellent performance stemmed from Grain boundary strengthening, solid solution strengthening, Orowan strengthening and dislocation strengthening. In addition to the study of metal components, some ceramic particles (WC, TiC, SiC, TiN, BN, SiO2, TiO2, Al2O3, etc.) have also been introduced into the plasma cladding layer due to their high hardness and excellent wear resistance. Chen et al. prepared TiC-enhanced Ni-based composite coatings on the surface of ordinary carbon steel by PTA technology [14]. The coating structure consists of γ-(Fe, Ni) matrix and agglomerated TiC. The wear resistance of the coating is nearly 20 times higher than that of ordinary carbon steel. At present, there are many studies on the application of NiCrMo coating in highly corrosive environment, but there are few reports on the enhancement effect of WC on NiCrMo coating. The focus of this paper is to improve the mechanical strength and corrosion resistance rate, thereby reducing the maintenance cost of the hull, and improving the life structure. Through the plasma cladding technology, the excellent adhesion of NiCrMo powder and the enhancement effect of the WC ceramic phase are used to prepare coatings with excellent performance.
2. Materials and Methods
2.1. Materials
The base material is low carbon steel Q235, which is provided by Tianjin Haisheng Iron and Steel Company (Tianjin, China). The chemical composition is shown in Table 1. The powder is provided by Beijing Hi-Tech New Material Technology Co., Ltd. (Beijing, China). The deposited powder NiCrMo-WC is divided into five groups according to WC content. The specific composition is shown in Table 2, and the particle size of Ni, Cr, Mo and WC are 100–300 mesh. The electrochemical etching solution is 3.5 wt.% NaCl solution.

Table 1.
Chemical composition of Q235 substrate (wt.%).
Table 2.
Chemical composition of the powder (wt.%).
2.2. Methods
2.2.1. Coating Preparation
The size of the Q235 steel plate is 100 mm × 100 mm × 10 mm. The oxide layer and rust on the surface were removed by grinding with a grinder. After grinding with 800 grit sandpaper until smooth, placed in an alcohol solution for ultrasonic cleaning for 30 min to remove oil and impurities on the surface, and then placed in a 65 °C dryer for 1 h. The treated Q235 steel plate was placed on the heat dissipation metal of the plasma cladding console to prevent the steel plate from being welded through due to overheating.
The Ni, Cr, Mo and WC powders were sieved with 100 and 300 mesh sieves, respectively. The powders with particle diameters between 100–300 mesh were retained. In this experiment, the powder mixing method was manually stirred. Weighing a certain proportion of the powders into a beaker and stirring with a glass rod for 30 min until the powders of different densities and colors were mixed evenly, and no obvious layering was observed. The uniformly mixed powder was dried in a 70 °C dryer for 5 h and stored. PTA-BX-400A high energy plasma arc was used to prepare coatings. Plasma gas flow rate and powder feeding gas flow rate were set to 3 l min−1, powder feeding rate was 40–60 g min−1, surfacing current was 170 A, and surfacing speed was 300 mm min−1.
2.2.2. Characterization Method
The coatings were characterized by Optical microscope (MX6R, Shanghai Puhe Optoelectronic Technology Co., Ltd., Shanghai, China), X-ray diffractometer (SmartLab, Nihon Nihon Co., Ltd., Tokyo, Japan), scanning electron microscope (MIRA3 LMH, TESCAN, Brno, Czech), energy spectrum analysis (Aztec Energy X-Max20, TESCAN, Brno, Czech), etc. Its phase formation rule, microstructure and element distribution were studied. Microhardness test and electrochemical corrosion test were carried out to analyze the effect of WC on the hardness and corrosion resistance of NiCrMo coatings.
The electrochemical corrosion test used CS310H (Wuhan Kesite Instrument Co., Ltd., Wuhan, China) electrochemical workstation, and the electrochemical impedance and AC curve tests were carried out on the top of the coating in 3.5 wt.% NaCl solution. This workstation is a three-electrode system, consisting of a reference electrode (Calomel electrode), a working electrode (The sample to be tested) and an auxiliary electrode (Counter electrode). Immersed the sample in 3.5 wt.% NaCl solution for 20 min at room temperature and measured its open circuit potential. Its fluctuation range should be less than 50 mV. The impedance-frequency sweep method was used for the AC impedance spectrum test, the sweep range was 10−2–105 Hz, and the voltage disturbance was 10 mV. The polarization curve test adopted the potentiodynamic scan method. The scanning potential was set from −1 V to 1 V, and the scanning speed was 0.5 mV/s. Electrochemical data fitting was performed using the analysis module that comes with the CS310H.
The wear resistance test was carried out using MS-T3001 (Lanzhou Huaren Instrument Technology Co., Ltd., Lanzhou, China) ball-disk friction and wear tester. The grinding balls were made of Si3N4 ceramic balls with a diameter of 3 mm, a load of 2 N as applied, the rotational speed of the grinding disc was 200 r/min and the friction time was 30 min. After the test, an annular groove appeared on the surface of the sample.
3. Results and Discussion
3.1. Phase Composition of the Coating
Figure 1 shows the XRD patterns on the top of the coatings with different WC contents. The main diffraction peak positions have nothing to do with the WC content, and the diffraction intensity is obvious, indicating that the crystallization effect on the top of the coating is good. The intensity of the (111) diffraction peak is significantly higher than the other two peaks. In addition, with the increase in WC content, the intensity of the (111), (200) and (220) diffraction peaks decrease significantly, and the other diffraction peaks have a relatively obvious increase, indicating that the addition of WC will inhibit the growth of grains in the (111), (200) and (220) directions.
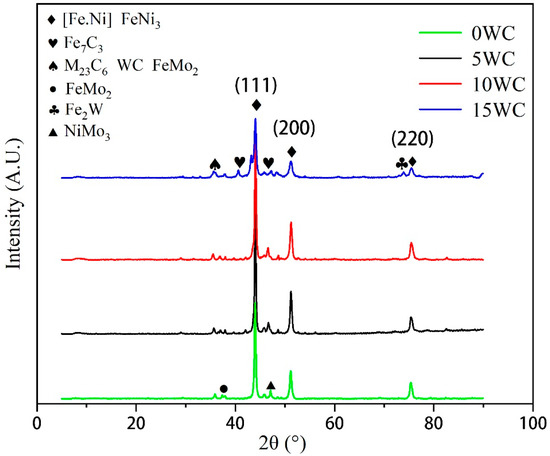
Figure 1.
XRD analysis of different coatings.
The phase composition of the coatings shows that in addition to [Fe.Ni] solid solution and austenite phases containing Mo and Cr, there are also some phases such as M23C6, Fe7C3, FeNi3 and WC in the coating. The addition of WC inhibits the formation of [Fe.Ni] solid solution. It is beneficial to the formation of intermetallic compounds such as Fe2W. The content of WC has basically no effect on the phase composition of the coating, but the phase content is slightly different.
3.2. Morphology Observation and Composition Analysis of Coatings
Figure 2 shows the OM diagram near the fusion line of the coatings with different WC contents. It can be seen that WC particles are deposited near the fusion line. With the increase in WC content, the deposition particles increase significantly. A bright white plane crystal fusion line can be seen at the junction of the coating and the substrate. The fusion line is smooth and flat without defects such as pores, cracks or inclusions, which proves that a good metallurgical bond is formed between the coating and the substrate. During the melting process of the molten pool, more undissolved WC particles are deposited at the bottom due to the higher density of WC. Because near the substrate, the temperature is low, the heat dissipation rate is fast and the degree of subcooling is large, so the molten pool solidifies faster, and the undissolved WC particles are deposited near the fusion line and will not contact the substrate.
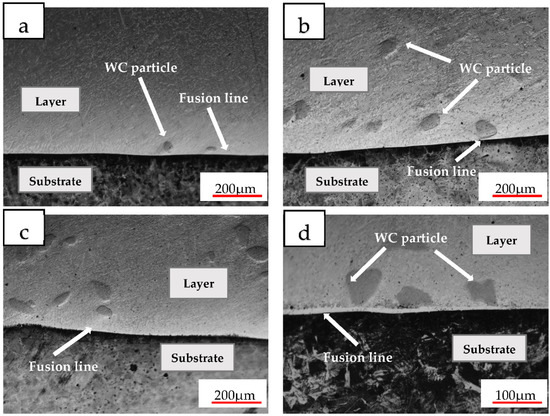
Figure 2.
OM diagram of the different coatings (a) 5 WC; (b) 10 WC; (c) 15 WC; (d) 20 WC.
Figure 3 shows the element distribution map of the surface scan in the 10 WC coating. Ni, Cr, W and Mo did not diffuse into the matrix, and a small amount of Fe diffused into the coating without obvious segregation. Ni and Cr elements are uniformly dispersed in the coatings, and the dark stripe precipitates are enriched phases of Cr. Except for the undissolved Mo and WC particles in the field of view, the distribution of W, Mo and C are relatively uniform, and the atomic diffusion is relatively sufficient.
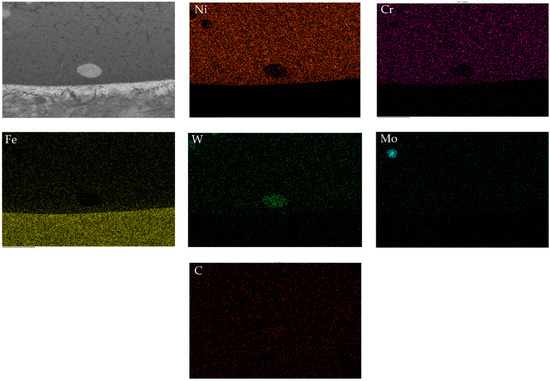
Figure 3.
EDS of the 10 WC coating.
Figure 4 shows the SEM images of the coatings with different WC contents. The results of micro-area element distribution detection in different areas are shown in Table 3. No white granular precipitate is observed in Figure 4a. With the increase in WC content (Figure 4b,c), spherical or elliptical white particles and a small amount of white columnar tissue arranged in an orderly manner appeared, surrounded by light-colored dendritic tissue and dark-colored dendritic tissue. During the solidification process of the molten pool, the white granular structure is the first to solidify as a nucleation particle because of the highest melting point. The white columnar structure is coarse dendrite, and a secondary structure with a lower melting point gradually precipitates around it. The 15 WC coating has more granular precipitates with smaller particle size and more uniform distribution. When the mass fraction of WC was 20% (Figure 4d), the originally dispersed particles gradually aggregated, and the morphology of the precipitates changed from spherical and punctate (10–20 μm in diameter) to petals (20–30 μm in diameter) and columnar (50 μm in length). During the melting process of the molten pool, some WC particles were melted. Because C element has strong bonding force with Mo and Cr, it is easy to form carbides such as Mo2C, MoC and Cr3C2 that are insoluble in austenite. Carbides will hinder the growth of austenite, thereby refining the structure. When the WC content is too high, carbides with higher melting points will be formed, and undissolved WC particles will increase. During the solidification of the molten pool, the microstructure first nucleates and grows around the undissolved WC particles. Because the high melting point carbide has higher heat absorption and heat release during melting and solidification, which increases the cooling time of the coating, so the phenomenon of tissue coarsening occurs.
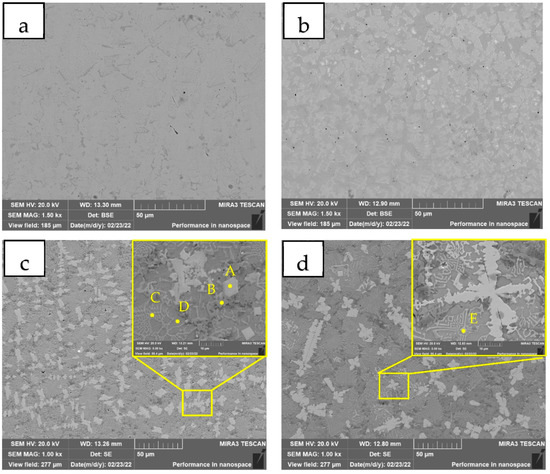
Figure 4.
SEM image of the different coatings (a) 0 WC; (b) 5 WC; (c) 15 WC; (d) 20 WC. A—M7C3 type carbide hard phase, B—Cr-rich carbide hard phase, C—Secondary dendritic structure, D—Substrate structure, E—High melting point particle.
Table 3.
EDS analysis of the coatings (wt.%).
The bright white A area has higher content of Ni, Cr, W and C elements, which is M7C3 type carbide hard phase. The dark B area has higher Cr content, and the carbon content is similar to the A area, which is the Cr-rich carbide hard phase. The C region is a secondary dendritic structure with high Ni and Fe contents, but Mo and W contents below 4%. The D region is the substrate structure, and the existence of C element can hardly be found. It is a new matrix phase after W element strengthens NiFe solid solution and NiCr solid solution during plasma cladding. The content of Cr, W and C in the E region is higher. It is surrounded by fine secondary dendrites. High melting point carbides such as (Cr,W)C are heterogeneous nucleation particles to promote the formation of dendritic precipitates.
Figure 5 is the SEM image of the undissolved WC particles in the coating, and the micro-area element distribution is shown in Table 4. The white particles in area A are WC particles that are not completely melted, and area B is the melting area of WC particles. The Mo content here is higher compared to other regions. Because the electronegativity and atomic radius of Mo are not much different from W, and it has a strong binding ability to C atoms, so the molten zone takes the lead to form (Mo, W) solid solution and carbides such as (Mo, W) C. The contents of W and C in the C and D regions rapidly decreased, and the atomic diffusion was insufficient.
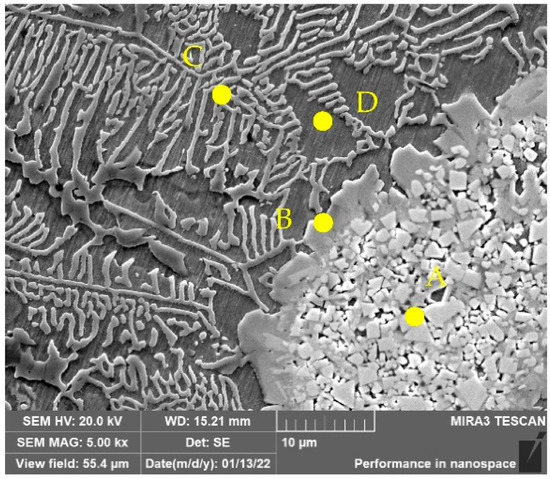
Figure 5.
SEM image of the undissolved WC particles in the 5 WC coating. A—WC particles, B—The melting area of WC particles, C—Dendritic structure, D—Substrate structure.
Table 4.
EDS analysis of undissolved WC particles (wt.%).
3.3. Hardness Test and Friction Performance
Hardness tests were carried out, and the results are shown in Figure 6a. The average hardness is shown in it. The hardness of the coatings is in the form of “low in the middle and high at both ends”. On the one hand, due to the high density of WC particles, more incompletely melted WC particles are deposited at the bottom of the coating, resulting in high hardness at the bottom of the coating. On the other hand, during the solidification process of the molten pool, the bottom is in contact with the matrix with faster heat dissipation, and the top is in direct contact with the air. The degree of subcooling is large, the cooling rate is fast, and the grains have no time to grow and coarsen. It is similar to the strengthening effect of “quenched martensite”, so the hardness is high. In addition, the hardness of the coatings fluctuates greatly. Because plasma cladding is a rapid cooling and rapid heating process, it is inevitable that the segregation of the tissue or components will occur. The C content in the surrounding area of WC melting is higher, and the hardness is often higher than that of the substrate area. The microhardness of the coatings improves with the increase in WC content. The 20 WC coating has the highest average hardness (563.1 HV), which is about 3.25 times that of the Q235 substrate. The increase in coatings hardness is mainly the result of the comprehensive effect of fine carbide dispersion strengthening, solid solution strengthening, hard phase strengthening and interface strengthening between the hard phase and the matrix generated by the diffusion of C atoms.
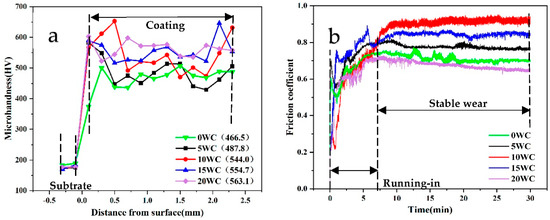
Figure 6.
(a) Microhardness distribution in different coatings; (b) Friction coefficient of different coatings.
The friction and wear test was carried out on the top of the coatings, and the friction coefficient of the coatings was obtained as shown in Figure 6b. The results of calculating the average friction coefficient and wear volume loss are shown in Table 5. The 20 WC coating has the lowest friction coefficient and the lowest volume loss rate, which proves that its wear resistance is the best. This is because with the increase in the hardness of the coating, under the same load conditions, the shallower the depth of the grinding ball embedded in the coating, the smaller the contact area between the grinding ball and the coating during the friction process. So, friction coefficient and volume loss rate are smaller. The 10 WC coating shows the highest friction coefficient, because its friction coefficient curve has the largest fluctuation range, indicating that the distribution of carbide particles or undissolved WC particles on the top of the coating is not uniform, and the grinding ball is strongly hindered by the hard phase during the friction process. As the surface hardness of the 10 WC coating is higher than that of the 5 WC coating, and the grinding ball embedded in the coating is shallower during friction. While exhibiting a higher coefficient of friction, the volume loss is lower.
Table 5.
Friction coefficient and volume loss of different coatings.
Figure 7 shows the SEM images of the coatings with different WC contents after friction. The results of EDS in different areas in the figure are shown in Table 6. It can be seen from Figure 7a that the 0 WC coating retains more dark oxide layer, showing typical abrasive wear morphology. The area A at the spalling pit is the enriched area of Fe and Ni, which is not oxidized. The area B is the oxidized area, and the oxide layers such as NiO and Fe2O3 generated play a lubricating role. The original oxide protective layer above the A area is peeled off under the action of cyclic stress, exposing the original structure. Although the oxide layer is more complete, its hardness is lower and the magic ball is embedded deeper in the coating, so the wear is larger. A large number of furrows and spalling pits are observed in the 5 WC coating (Figure 7b) Some oxides formed during the wear test. As shown in Figure 7c, the area of the dark gray C increases, and denser oxide films are formed on the worn surface. In addition, the bright white D area appears in the figure, where the oxygen content is extremely high, which is the fatigue wear area of the oxide layer under the action of cyclic stress [15]. In Figure 7d, it can be seen that a dense oxide layer is formed on the surface of the coating. Under the action of cyclic stress, the oxide layer peels off due to fatigue hardening, leaving visible pits in the field of view. The C content of the E region after the oxide layer is peeled off is much higher than that of the F region. Therefore, it is speculated that the peeling of the oxide layer caused by fatigue wear is more likely to occur in the carbide accumulation region. In addition, densely distributed fine cracks appear on the surface of the oxide layer. At this time, the coating is mainly fatigue wear. Due to the high hardness and brittleness of the oxide layer, it is easy to produce work hardening and plastic deformation under the action of cyclic stress. Eventually it peels off in the form of lumpy thin shells. Because the oxide layer formed on the surface of the 20 WC coating is the densest, it plays a certain lubricating role in the friction process, so its friction coefficient and volume loss rate are the smallest, and it shows the best friction resistance performance.
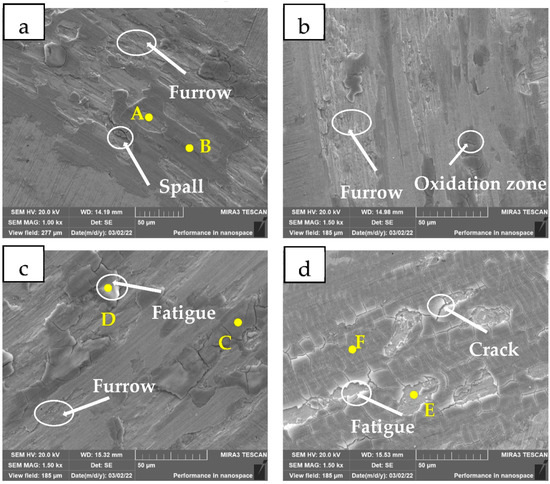
Figure 7.
SEM images of different coatings after wear (a) 0 WC; (b) 5 WC; (c) 15 WC; (d) 20 WC. A—The spalling pit, B, C—The oxidized area, D—The fatigue wear area, E—Oxidation layer peeling pit, F—Crack.
Table 6.
EDS of the friction zone of the coatings (wt.%).
3.4. Electrochemical Corrosion Results
Figure 8a is a schematic diagram of the polarization curves. The fitting results are shown in Table 7. Among the five coatings, the voltages from the cathode polarized region to the anodic polarized region are −0.2899 V, −0.3592 V, −0.3041 V, −0.2925 V and −0.2842 V, respectively. As the applied voltage continues to increase, the anodic oxidation reaction produces Fe2+, Cr3+, Ni2+ and other metal cations. Ni, Fe, Cr, Mo and other metal elements in the coating are easily adsorbed with O2 in the solution in the form of active cations, thereby generating relatively stable oxides such as NiO and Cr2O3 [16,17]. With the further increase in the anode potential, the oxide formation rate is gradually higher than the metal dissolution rate [18], resulting in a significant decrease in the metal anode dissolution rate, and the corrosion current is basically stable in a very small variation range, so the reaction enters the passivation zone. The passivation phenomenon of 5 WC and 10 WC coatings is more obvious. Then, the potential continued to rise, and the current density continued to increase with the progress of the anodization reaction.
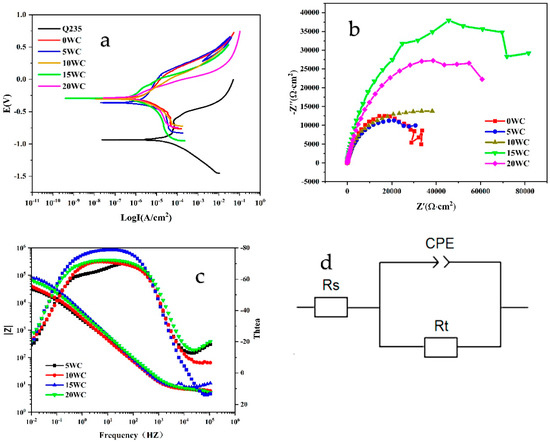
Figure 8.
(a) Polarization curve; (b) AC impedance; (c) Bode diagram; (d) AC impedance equivalent circuit diagram.
Table 7.
Polarization curve fitting parameters of different coatings.
With the increase in WC content, the self-corrosion potential (Ecorr) of the coating moves positively. The self-corrosion corrosion current density (Icorr) shows a trend of first decreasing and then increasing. The self-corrosion potential characterizes the thermodynamic trend of electrochemical corrosion, and the positive shift of the potential indicates that the coating is less prone to corrosion [19]. The self-corrosion current density directly reflects the corrosion rate of the coating. It can be seen that the 15 WC coating has the lowest self-corrosion current density (3.4934 × 10⁻⁷ A/cm2) and the lowest corrosion rate (0.0041 mm/a). Because of the melting of WC in the molten pool, the diffusion of C atoms and other metal elements in the molten pool form a variety of carbides. On the one hand, the carbides have strong corrosion resistance. On the other hand, the dispersed carbides act as nucleation particles to refine the crystal. When the WC content 15%, the degree of grain refinement increased and the number of pores decreased, so the corrosion rate decreased, showing the best corrosion resistance. When the WC content reaches 20%, the undissolved WC particles and the formation of carbides increase. Compared with the matrix phase, the carbides have a higher potential and more carbide-metal micro battery reactions are formed on the metal anode, thereby accelerating the corrosion of the metal anode. The higher the WC content, the increased formation of undissolved WC particles and carbides.
Figure 8b is the Nyquist diagram of the coatings with different WC contents. Different samples all show relatively uniform capacitive arc. Except for the 5 WC coating, the capacitance arc radius of the other coatings is larger than that of the 0 WC coating, which proves that WC is beneficial to reduce the charge transfer resistance during the electrochemical corrosion reaction, and is less prone to surface corrosion. Among them, the 15 WC coating has the largest capacitive arc radii. Rt is the surface charge transfer resistance, which is the equivalent polarization resistance. Its Rt value is 86,797 Ω·cm2, indicating that its corrosion resistance to NaCl solution is the best, which is consistent with the result of the polarization curve. Continued addition of WC will reduce the Rt value of the coating, indicating that excess WC will lead to a decrease in the equivalent polarization resistance value, thereby affecting its corrosion resistance in 3.5 wt.% NaCl solution, which is also consistent with the results shown by the polarization curve.
Figure 8c shows the Bode diagram of the coatings with different WC contents. Except for the 05 WC coating, the phase angle curves of the three coatings all show a single peak feature, which is a typical uniform corrosion feature, and the peak appears in the low frequency region [20]. In addition, two slightly raised peaks in the low frequency region can be seen in the phase angle diagram of the Bode diagram of the 05 WC coating, indicating that two times constants appear during the electrochemical corrosion process. Combined with the Nyquist diagram analysis, it is concluded that the phase angle peak of the Bode diagram with a higher frequency corresponds to the corrosion behavior of the electric double layer at the original reaction interface of the coating substrate, and the phase angle peak of the Bode diagram with a lower frequency corresponds to the corrosion behavior of the electrode surface [21]. For a more accurate fit, a constant phase element (CPE) is used instead of the capacitor. Due to the inhomogeneity of the coating surface, and when diffusion or adsorption processes occurs on the surface, it is often necessary to fit the data using CPE to mitigate the effects of surface inhomogeneity.
In Formula (1), Y0 represents the time constant parameter (s−α Ω−1 cm−2), ω represents the angular frequency of the AC signal (ω = 2πf, f is the disturbance frequency), and α is the CPE index. For the coatings, the best fit to the experimental data was achieved with the equivalent circuit shown in Figure 8d. In the model, CPE represents the dielectric properties of the thin corrosion product formed on the coating surface, and Rs corresponds to the resistance of a 3.5 wt.% NaCl solution. Rt represents the surface charge transfer resistance, that is, the equivalent polarization resistance. The fitting results are shown in Table 8. The 15 WC coating has the largest Rt value, which is 86,797 Ω·cm2, and has the best resistance to salt solution corrosion. Continued addition of WC will reduce the Rt value of the cladding layer, indicating that excess WC will lead to a decrease in the equivalent polarization resistance value, thereby affecting its corrosion resistance in 3.5 wt.% NaCl solution, which is consistent with the results shown by the polarization curve.
Table 8.
AC impedance fitting parameters of different coatings.
4. Conclusions
The NiCrMo coatings with different WC contents have excellent forming effect and form a good metallurgical bond with the substrate. In addition to [Fe.Ni] solid solution, there are also some phases of M23C6, Cr2C3, Fe7C3, FeNi3, WC and other phases in the coating. The addition of WC inhibits the formation of [Fe.Ni] solid solution and promotes the formation of intermetallic compounds such as Fe2W.
The microhardness of the coating increases with the increase in WC content. The 20WC coating has the highest average hardness (563.1 HV), which is about 3.25 times that of the Q235 substrate. It has the lowest friction and wear rate and low friction coefficient, showing the best wear resistance.
WC is beneficial to the positive shift of the coating self-corrosion potential. The 15WC coating has the lowest self-corrosion current density (3.4934 × 10⁻⁷) and the lowest corrosion rate (0.0041 mm/a), which is only 3.7% of the corrosion rate of Q235 steel.
Limitations and Suggestions
The study found that the Ni-15Cr-5Mo-15WC coating has the most excellent comprehensive properties, but there are still the following shortcomings that can be improved in the follow-up work:
(1) Use automatic plasma cladding technology to eliminate the influence of manual operation errors on the structure and properties of the sample, optimize the best process parameters of plasma cladding, reduce the content of Fe in the cladding layer and further optimize the structure and properties of the coating.
(2) Optimize the powder composition ratio, reduce the coating porosity and reduce the structure and composition segregation.
(3) Heat treatment of the coating to promote the homogenization of the composition and structure, and explore the effect of heat treatment on the structure and properties of the coating.
Author Contributions
Formal analysis, H.Y.; Investigation, Q.L.; Methodology, W.S., G.Z. and Y.Y.; Resources, W.S. and J.Z.; Supervision, C.Y.; Writing—original draft, H.Y. All authors have read and agreed to the published version of the manuscript.
Funding
The authors thank the financial supports from the National Key Research and Development Program of China (2021YFB3700804, 2021YFB3700803), Scientific Research and Technology Development Project of CNPC (2021DJ2703) and Natural Science Foundation of Shaanxi Provincial (2021JM-607).
Institutional Review Board Statement
Not applicable.
Informed Consent Statement
Not applicable.
Data Availability Statement
Data sharing is not applicable to this article.
Conflicts of Interest
The authors declare no conflict of interest.
References
- Drach, A.; Tsukrov, I.; DeCew, J.; Aufrecht, J.; Grohbauer, A.; Hofmann, U. Field studies of corrosion behaviour of copper alloys in natural seawater. Corros. Sci. 2013, 76, 453–464. [Google Scholar] [CrossRef]
- Gao, X.; Guo, L.Z.; Xiong, J.B. Corrosion protection technology of steel structure in marine environment. Appl. Mech. Mater. 2015, 744, 29–32. [Google Scholar] [CrossRef]
- Benea, L.; Simionescu, N.; Mardare, L. The effect of polymeric protective layers and the immersion time on the corrosion behavior of naval steel in natural seawater. J. Mater. Res. Technol. 2020, 9, 13174–13184. [Google Scholar] [CrossRef]
- Hamulić, D.; Rodič, P.; Milošev, I. The influence of length of alkyl chain on the chemical structure and corrosion resistance of silica-polyacrylic hybrid coatings on structural steel. Prog. Org. Coat. 2021, 150, 105982. [Google Scholar] [CrossRef]
- Azar, M.M.K.; Gugtapeh, H.S.; Rezaei, M. Evaluation of corrosion protection performance of electroplated zinc and zinc-graphene oxide nanocomposite coatings in air saturated 3.5 wt.% NaCl solution. Colloids Surf. A Physicochem. Eng. Asp. 2020, 601, 125051. [Google Scholar] [CrossRef]
- Zhang, Z.; Kovacevic, R. Laser cladding of iron-based erosion resistant metal matrix composites. J. Manuf. Process. 2019, 38, 63–75. [Google Scholar] [CrossRef]
- Gorbach, D.; Bochkarev, V.P.; Nazaruk, V.K. Manufacture and repair of propeller shafts and rotating parts using plasma technology. Weld. Int. 2000, 14, 71–74. [Google Scholar] [CrossRef]
- Ndiithi, N.J.; Kang, M.; Zhu, J.; Lin, J.; Nyambura, S.M.; Liu, Y.; Huang, F. Microstructural and corrosion behavior of high velocity arc sprayed FeCrAl/Al composite coating on Q235 steel substrate. Coatings 2019, 9, 542–553. [Google Scholar]
- Yang, H.Q.; Yao, Z.J.; Wei, D.B.; Zhou, W.B.; Yin, G.X.; Feng, L.X. Anticorrosion of thermal sprayed Al–Zn–Si coating in simulated marine environments. Surf. Eng. 2014, 30, 801–805. [Google Scholar] [CrossRef]
- Mosayebi, S.; Rezaei, M.; Mahidashti, Z. Comparing corrosion behavior of Ni and Ni-Mo electroplated coatings in chloride mediums. Colloids Surf. A Physicochem. Eng. Asp. 2020, 594, 124654. [Google Scholar] [CrossRef]
- Ahmadiyeh, S.; Rasooli, A.; Hosseini, M.G. Corrosion and wear study of Ni–W–B/WC composite coatings electroplated by pulse plating. Adv. Eng. Mater. 2020, 22, 2000426. [Google Scholar] [CrossRef]
- Wang, Q.Y.; Zhang, Y.F.; Bai, S.L.; Liu, Z.D. Microstructures, mechanical properties and corrosion resistance of Hastelloy C22 coating produced by laser cladding. J. Alloys Compd. 2013, 553, 253–258. [Google Scholar] [CrossRef]
- Zhou, Y.X.; Zhang, J.; Xing, Z.G.; Wang, H.D.; Lv, Z.L. Microstructure and properties of NiCrBSi coating by plasma cladding on gray cast iron. Surf. Coat. Technol. 2019, 361, 270–279. [Google Scholar] [CrossRef]
- Chen, D.; Liu, D.; Liu, Y.; Wang, H.; Huang, Z. Microstructure and fretting wear resistance of γ/TiC composite coating in situ fabricated by plasma transferred arc cladding. Surf. Coat. Technol. 2014, 239, 28–33. [Google Scholar] [CrossRef]
- He, T.; Shao, R.; Du, S.; Cai, H. Effect of WC content on the friction and wear properties of Ni-WC coatings on 6082-T6 aluminum alloy. Mater. Res. Express 2020, 7, 066530. [Google Scholar] [CrossRef]
- Zhang, S.; Han, B.; Li, M.; Zhang, Q.; Hu, C.; Jia, C.; Li, Y.; Wang, Y. Microstructure and high temperature erosion behavior of laser cladded CoCrFeNiSi high entropy alloy coating. Surf. Coat. Technol. 2021, 417, 127218. [Google Scholar] [CrossRef]
- Saeedi, R.; Razavi, R.S.; Bakhshi, S.R.; Erfanmanesh, M.; Bani, A.A. Optimization and characterization of laser cladding of NiCr and NiCr–TiC composite coatings on AISI 420 stainless steel. Ceram. Int. 2021, 47, 4097–4110. [Google Scholar] [CrossRef]
- Sandu, A.V.; Baltatu, M.S.; Nabialek, M.; Savin, A.; Vizureanu, P. Characterization and mechanical proprieties of new TiMo alloys used for medical applications. Materials 2019, 12, 2973. [Google Scholar] [CrossRef]
- Zhou, S.; Zhao, Y.; Wang, X.; Li, W.; Chen, D.; Sercombe, T.B. Enhanced corrosion resistance of Ti-5 wt.% TiN composite compared to commercial pure Ti produced by selective laser melting in HCl solution. J. Alloys Compd. 2020, 820, 153422. [Google Scholar] [CrossRef]
- Bejinariu, C.; Burduhos-Nergis, D.P.; Cimpoesu, N. Immersion behavior of carbon steel, phosphate carbon steel and phosphate and painted carbon steel in saltwater. Materials 2021, 14, 188. [Google Scholar] [CrossRef]
- Akbarinezhad, E.; Rezaei, F.; Neshati, J. Evaluation of a high resistance paint coating with EIS measurements: Effect of high AC perturbations. Prog. Org. Coat. 2008, 61, 45–52. [Google Scholar] [CrossRef]
Publisher’s Note: MDPI stays neutral with regard to jurisdictional claims in published maps and institutional affiliations. |
© 2022 by the authors. Licensee MDPI, Basel, Switzerland. This article is an open access article distributed under the terms and conditions of the Creative Commons Attribution (CC BY) license (https://creativecommons.org/licenses/by/4.0/).