Article

Influence of the Current Regime during Electrodeposition in a Cr(III)-Containing Fe-Cr-Ni Electrolyte on the Near-Surface pH, Alloy Composition, and Microcrack Behavior

Materials and Surface Engineering Group, Institute of Materials Science and Engineering, Faculty of Mechanical Engineering, Chemnitz University of Technology, D-09107 Chemnitz, Germany
*
Author to whom correspondence should be addressed.
Coatings 2022, 12(10), 1569; https://doi.org/10.3390/coatings12101569
Submission received: 28 September 2022 / Revised: 10 October 2022 / Accepted: 14 October 2022 / Published: 17 October 2022

Abstract

:
This study shows the electrodeposition of Fe-Cr-Ni alloys using the advantages of a stepped direct-current deposition in a Cr(III)-containing electrolyte, and its influence on the pH value. The resulting coatings are uniform and free of microcracks, with a Cr content around 30% and thicknesses above 10 µm. The influence of the current mode (direct current, stepped direct current, pulsed current) on pH development is investigated and correlated with the arising microstructure and alloy composition. Considering the current flow, it can be stated that pauses interrupt high overvoltage and restrain the pH increase at the cathode. The associated formation of chromium hydrides and their deposition onto the chromium layer, leading to cracking, is thus reduced. In this work, direct evidence for this theory and a suggestion for near-surface pH measurement during electrodeposition are presented.

Graphical Abstract

1. Introduction

Savings in the consumption of globally limited raw materials are one of the challenges facing modern society and the economy with regard to the energy transition. Current research is focused on the development and optimization of technical solutions to increase sustainability, reduce energy costs, and conserve resources. The substitution of hard chrome and stainless steel plays a central role in this. By using less expensive materials such as low-alloyed steel, components with thin metallic coatings can be enhanced with a thin Fe-Cr-Ni layer made from an environmentally friendly Cr(III) electrolyte. This offers the advantages of a stainless-steel surface without having to manufacture the entire component from expensive stainless steel. Furthermore, in addition to stainless-steel-like properties such as high chemical resistance, these alloy coatings offer an alternative to hard chrome coatings, which are deposited from the Registration, Evaluation, Authorisation and Restriction of Chemicals (REACh) regulated Cr(VI) electrolytes, and bright-chrome plating [1,2,3]. The advantages of hard chrome coatings are their silvery appearance, high hardness, and good wear and corrosion resistance [1,2]. As a result, these coatings cover a wide range of products and applications [4]. To date, bright-chrome layers can be deposited from REACh-compliant Cr(III)-containing electrolytes. However, their properties are not comparable with those of hard chrome coatings. The advantage of Fe-Cr-Ni coatings over bright-chrome deposits is that, due to the direct application of thick and crack-free Fe-Cr-Ni coatings, no intermediate layers of expensive copper and nickel are required. This can enormously increase the effectiveness and efficiency of the electroplating process chain for producing corrosion-resistant layers.
So far, it is known that complexes readily hydrolyze in simple aqueous Cr(III), especially near the cathode surface [5]. This hydrolysis and olation can proceed unhindered and is shown in the following [5]:
[Cr(H2O)6]3+ ⇌ [Cr(H2O)5OH]2+ + H+
[Cr(H2O)6]3+ + [Cr(H2O)5OH]2+ → [(Cr(H2O)5)2(μ-OH)]5+ + H2O
Electrolytes based on chromium(III) salts contain relatively high concentrations of organic ligands, ammonium and chloride/sulfate ions, which are known to form complex ions with chromium(III). These reactions displace the oxidation reactions. Complexation and olation take place, depending on the complexation ability and concentration of the ligands used. In the literature, it is reported that glycine has a great complexing power and penetrates basic chromium(III)-sulfate molecules much faster than any other ligand and prevents oxidation reactions [6]. Nevertheless the electrodeposition from Cr(III) electrolytes is not yet completely understood. Therefore, it is important that methods are developed to allow scientific acquisition of the mechanisms involved in the deposition process for the application of Fe-Cr-Ni coatings from a Cr(III) electrolyte. So far, we assumed that the deposition parameters have an influence on the behavior of the bath additives during electrodeposition. Furthermore, it is supposed that the electrodeposition of chromium alloys leads to high overvoltage, which result in an increase of the pH value at the cathode and the formation of chromium hydrides. These incorporated chromium hydrides are hexagonally close packed (hcp) and unstable. During the deposition process and shortly thereafter, they decompose into metallic chromium that is body-centered cubic (bcc). During this phase transition, the chromium volume shrinks by about 15%, leading to the formation of cracks in the layer [7]. Furthermore, we assume that fragments of the organics contained in the electrolyte are co-deposited, causing high residual stresses due to lattice distortions, which in turn lead to microcracks in the coatings. A reduction of the contained residues of the organic compounds can reduce or even avoid microcracks. Furthermore, this co-deposition causes grain refinement. The result are nanocrystalline layers with a crystallite size of less than 2 nm [8,9]. In such a nanocrystalline structure, the inverse Hall–Petch effect occurs, which is documented in the literature for crystallite sizes smaller than 20 µm [10]. In addition, nanocrystalline coatings are known for their strong formation of microcracks. Thus, a reduction in organics could lead to harder, crack-free, and more wear- and corrosion-resistant coatings, with the resistance approaching that of hard chromium coatings via crystal growth. A 1992 study on the electrodeposition of Ni-Cr on steel using pulse current showed that increasing pulse–pause times toff could significantly reduce the crack density [11]. Likewise, a 2022 study on crack-free deposition of chromium layers from chromium(III) electrolytes found an optimum pulse–current ratio of pulse time ton = 1 s and toff = 5 s [12]. In another recent study on the influence of current shape during electrodeposition on the microcracking of applied Fe-Cr-Ni coatings, it was shown that under direct current, highly microcracked coatings were produced under various conditions [13]. A somewhat reduced crack pattern is shown with a deposition from pulse current [13,14]. However, the layer thicknesses that can be applied for the same deposition time and current density are significantly lower, and the chromium content in the layers is 10% lower than that of the layers deposited under direct current. A clear advantage is offered here by a deposition from a stepped direct current, in which a pause of 5 s follows a 10 s long direct current. The resulting coatings are uniform and free of microcracks with a chromium content of around 25% and a coating thickness of around 20 µm [13]. The pauses periodically interrupt the high overvoltage and limit the pH rise at the cathode by readjusting the electrolyte near the cathode to the bulk electrolyte. The associated formation of chromium hydrides and their deposition in the chromium layers, which lead to cracking, is reduced. In this study, the influence of the current mode on the cathode-surface pH value of the Cr(III) electrolyte during electrodeposition of Fe-Cr-Ni alloy will be investigated. Direct evidence for this theory and a method for near-surface pH measurement according to Leimbach et al. [15] during electrodeposition is shown. Based on the previous study [13], the influence of current mode (direct current, stepped direct current, pulsed current) during deposition on the pH development is investigated and related to the microstructure and alloy composition.

2. Materials and Methods

2.1. Substrate Preparation, Electrodepostion and In Situ pH Measurement

The electrolyte listed in Table 1 was used to deposit Fe-Cr-Ni coatings. For electrodeposition, highly polished copper Hull-cell plates from Mercanta GmbH (Dinslaken, Germany) were used as substrates with a size of 2 cm × 2 cm. The substrates were cleansed in an ultrasonic bath with ethanol and then rinsed with deionized water. The copper substrates were further coated wet-on-wet directly after this pretreatment.
The electrolyte was prepared in two steps according to the method of Hasegawa et al. [9]. The glycine was dissolved together with the chromium(III) chloride in deionized water, heated to 80 °C, and kept at this temperature with continuous stirring for 30 min. After that, the electrolyte was cooled down to room temperature overnight. At the same time, all further components were dissolved and mixed together in deionized water at room temperature. For homogenization of the metal complexes, it is important that both of these solutions are agitated continuously. This procedure serves to utterly dissolve the bath components and form stable complexes. Finally, the two solutions were combined and homogenized for another 30 min with continuous stirring before using the electrolyte. The pH was adjusted to 1.1 with hydrochloric acid.
To investigate the influence of the current mode on the pH change of the electrolyte on the sample surface during the electrodeposition process, an in situ pH measurement was used. The experimental setup and the components, which were used as cathode for the in situ pH measurement, can be seen in Figure 1. The cathode was designed as caps with lamellae at the bottom, which were placed directly over the pH sensor. The InLab® Surface Pro-ISM surface pH electrode (METTLER TOLEDO, Columbus, OH, USA) was used as the pH sensor. The coated area of the lamellae was 0.02 dm2. The rest of the cathode cap was appropriately covered with plating tape to prevent galvanic coating. For contacting the cathode caps, a specific contact pin was constructed that protrudes from the electrolyte and ensures uniform current distribution across the sample. The cathode caps were made of polyamide (PA) by additive manufacturing and then degreased in ethanol under ultrasound for 15 min. Subsequently, the PA caps were germinated with palladium chloride under ultrasound for 15 min, rinsed in deionized water, and activated with sodium hypophosphite under ultrasound for 15min. After that, they were electroless nickel-plated wet on wet for 45 min using a Ni435E (MacDermidEnthone) electrolyte. This was followed by the electroplating with copper at a voltage of 1.5 V for 60 min. Cuprostar 1600 (MacDermidEnthone) was used as the copper electrolyte. To facilitate the exit of the hydrogen bubbles formed during the deposition, the anode and cathode were arranged obliquely and parallel to each other.
For the deposition of the pulse current (PC) and stepped direct current (stepped DC) tests, the POWER-PULS pe86CB-40-10-50-S/GD pulse–current source (plating electronic GmbH, Sexau, Germany) was used.
The following current modes were used and investigated for depositions:
  • DC: 6 A/dm2 (DC_6), 12 A/dm2 (DC_12), 18 A/dm2 (DC_18)
  • Stepped DC at 12 A/dm2:
  • ton = 10 s, toff = 10 s (Step_10/10)
  • ton = 10 s, toff = 5 s (Step_10/5)
  • ton = 5 s, toff = 2 s (Step_5/2)
  • ton = 2 s, toff = 1 s (Step_2/1)
  • PC at 12 A/dm2: ton = toff = 10 ms, f = 50 Hz, on/off ratio 1:1 (PC)
  • For the alloy composition and microcracking behavior studies, the effective coating time for each sample was 120 min. For each current mode, three test samples (No. 1–3) were electrodeposited successively in the same electrolyte for two hours effective coating time each to investigate possible electrolyte aging and its influences on the composition and layer thickness of the alloy. For the studies of samples DC_12, Step_10/5, and PC, samples from the previous study were used, which were also manufactured under the exact conditions mentioned in [13].
The near-surface in situ pH measurement of the electrolyte were recorded for 30 min. To determine the influence of electrolyte aging on the near-surface pH value, the experiment was repeated in the same electrolyte bath after a 15 min break. For all depositions, an insoluble titanium platinum mesh anode was used. Table 2 lists the common coating parameters of all experiments. The parameters were adopted and extended from the previous study [13]. They correspond to the findings of El-Sharif et al. [6] on the deposition of thick chromium layers from a chromium(III) glycine electrolyte. Here, a small anode-to-cathode distance of 20 mm and low bath agitation have previously been shown to be particularly advantageous for glossy and thick films, which is consistent with the results of El-Sharif et al. [6].
For scanning electron microscopy studies, all coatings were cold embedded in epoxy resin. Subsequently, the cross-sections were ground, polished, and thoroughly cleansed with acetone and isopropanol under the influence of ultrasound. Cold embedding was performed to minimize preparation-related effects such as the generation of residual stresses by heating. The final processed transverse sections were vapor deposited with carbon to ensure electrical conductivity of the samples.
Based on the observation made in preliminary tests that a permanent bath movement of the electrolyte is necessary for a good deposition result, even when not in use, an experiment was carried out to investigate the influence of the bath movement on the pH value and consequently on the metal complexes during storage. Assumptions can be made that metal complexation changes the pH of an electrolyte. The change in pH over a period can therefore be used to determine whether metal complexation in the electrolyte has been completed and a stable chemical equilibrium is present in the electrolyte. For this purpose, two experiments were carried out, in each of which 100 mL of electrolyte was taken from the bulk electrolyte, and the pH was measured at the beginning of the rest period, after 15 min, 30 min, 1 h, 4 h, 1 day, and 2 days. The first experiment started after the two electrolyte components were combined and homogenized by stirring for 15 min. The second experiment was performed after 48 h homogenization of the electrolyte.

2.2. Layer Characterization

The layer thicknesses and the crack densities were measured by optical microscopy using an Inverted Metallurgical Microscope GX51 (OLYMPUS, Shinjuku, Japan). The microcrack density was determined for each coating over the cross-section of the Fe-Cr-Ni coatings for a distance of 1000 µm.
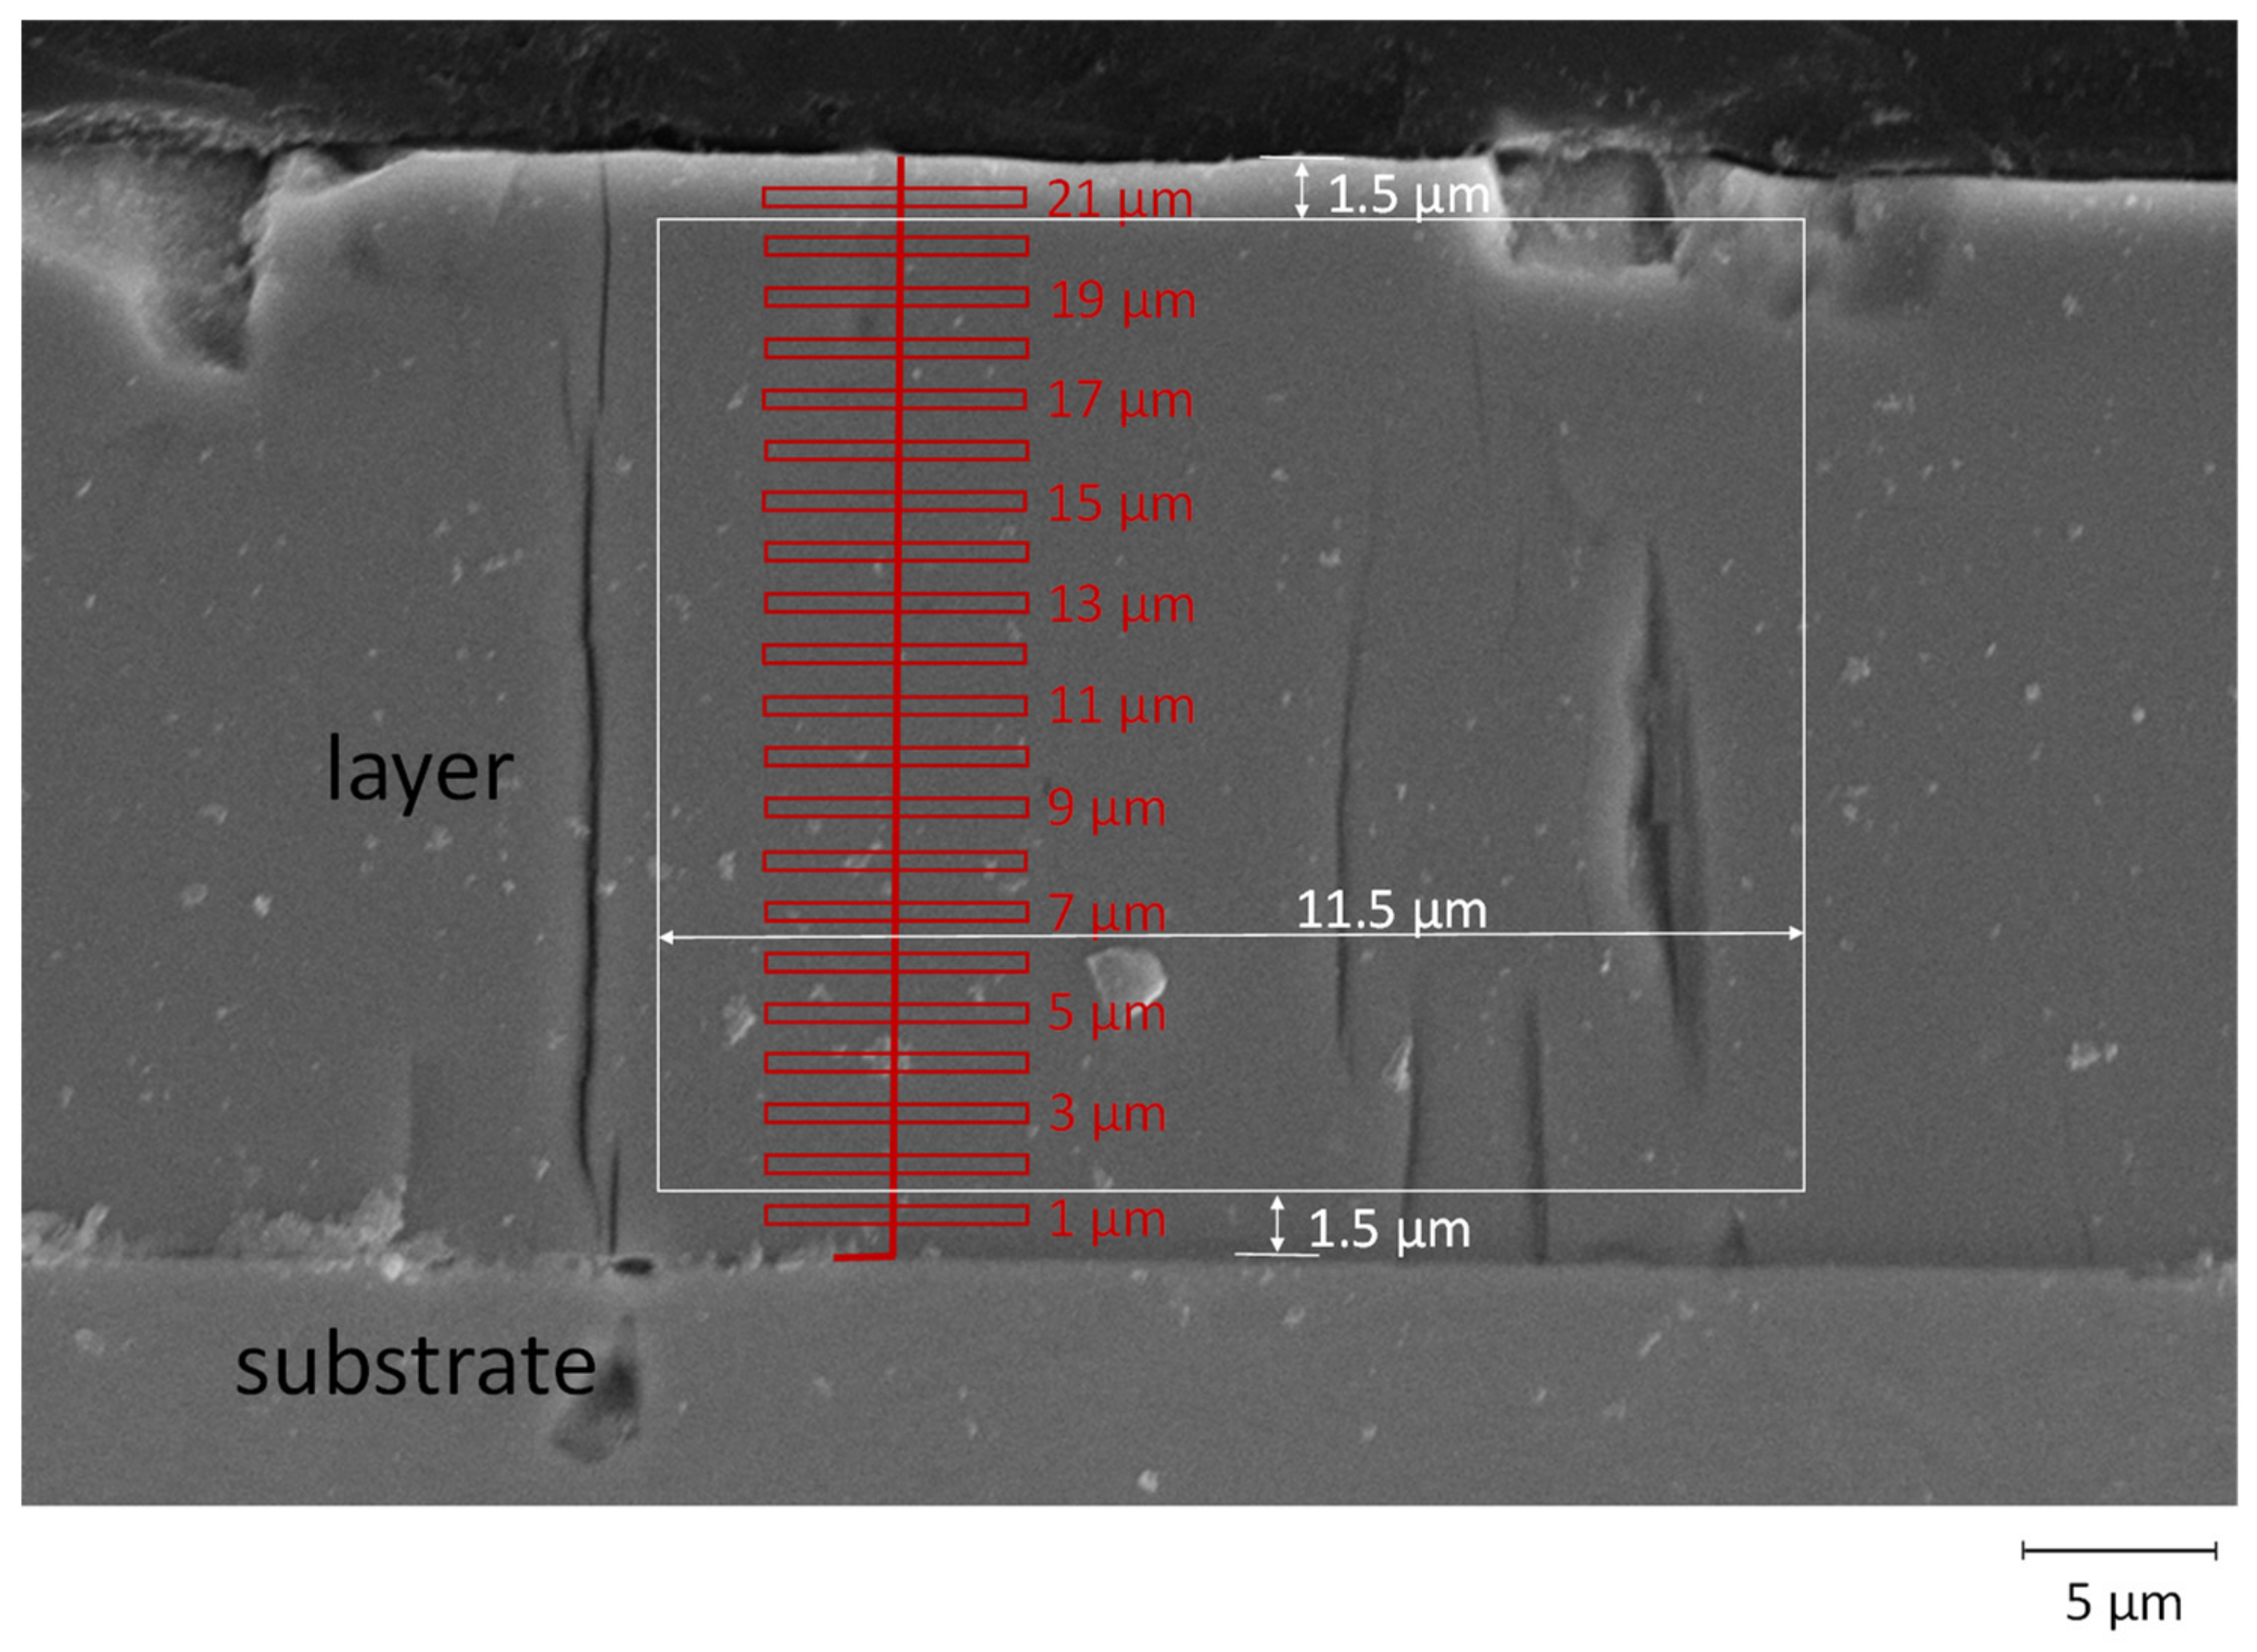
The alloy composition of the Fe-Cr-Ni layers was determined via cross-sections. This allows conclusions to be drawn about electrolyte aging via the determination of the alloy composition with rising distance from the substrate in the cross-sections. The elements were measured using an EDAX GENESIS spectrometer for energy-dispersive X-ray spectroscopy (EDXS) on a LEO1455VP (Zeiss, Oberkochen, Germany) scanning electron microscope. The integration time per element analysis was two minutes at an acceleration voltage of 25 kV. Figure 2 represents how the elements were determined by area and point analyses. For the point analyses, small fields with a height of 0.4 μm and a width of 5.5 μm were set as a function of depth below the surface. In addition, scanning electron microscopy (SEM) images were taken to investigate microcracks in the layers.

3. Results

3.1. Electrolyte Lifetime

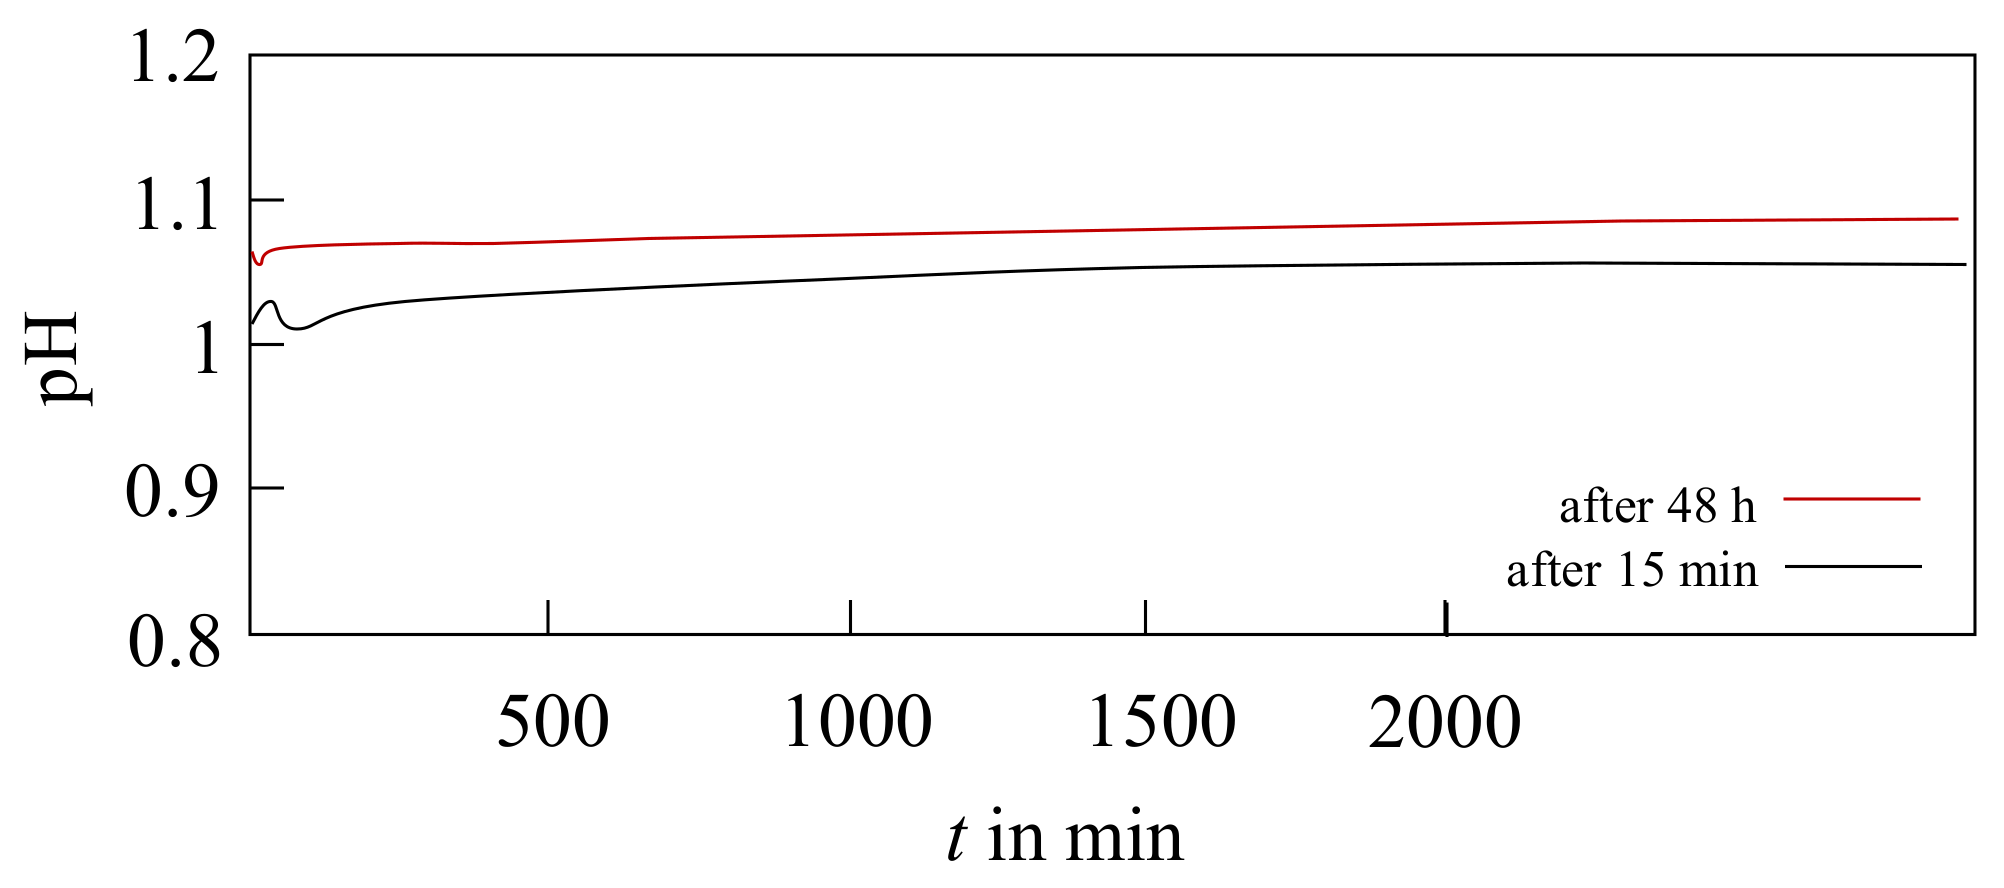
Experiments for monitoring the thermodynamic changes in the electrolyte over time show that after continuous homogenization of the electrolyte by stirring for 48 h or longer after preparation, the pH value remains stable even when the electrolyte is at rest, i.e., the bath agitation is switched off (Figure 3). A stirring time of only 15 min after combining all bath components provides a stable pH value, even if the electrolyte rests for several days. The difference between the two pH curves is only 0.04, which is within the repeatability limit of the pH electrode. Therefore, it can be concluded that the metal complexation is completely finished at this time and remains stable. Longer storage of the electrolytes is possible.

3.2. Near-Surface pH In Situ Curves during Electrodeposition

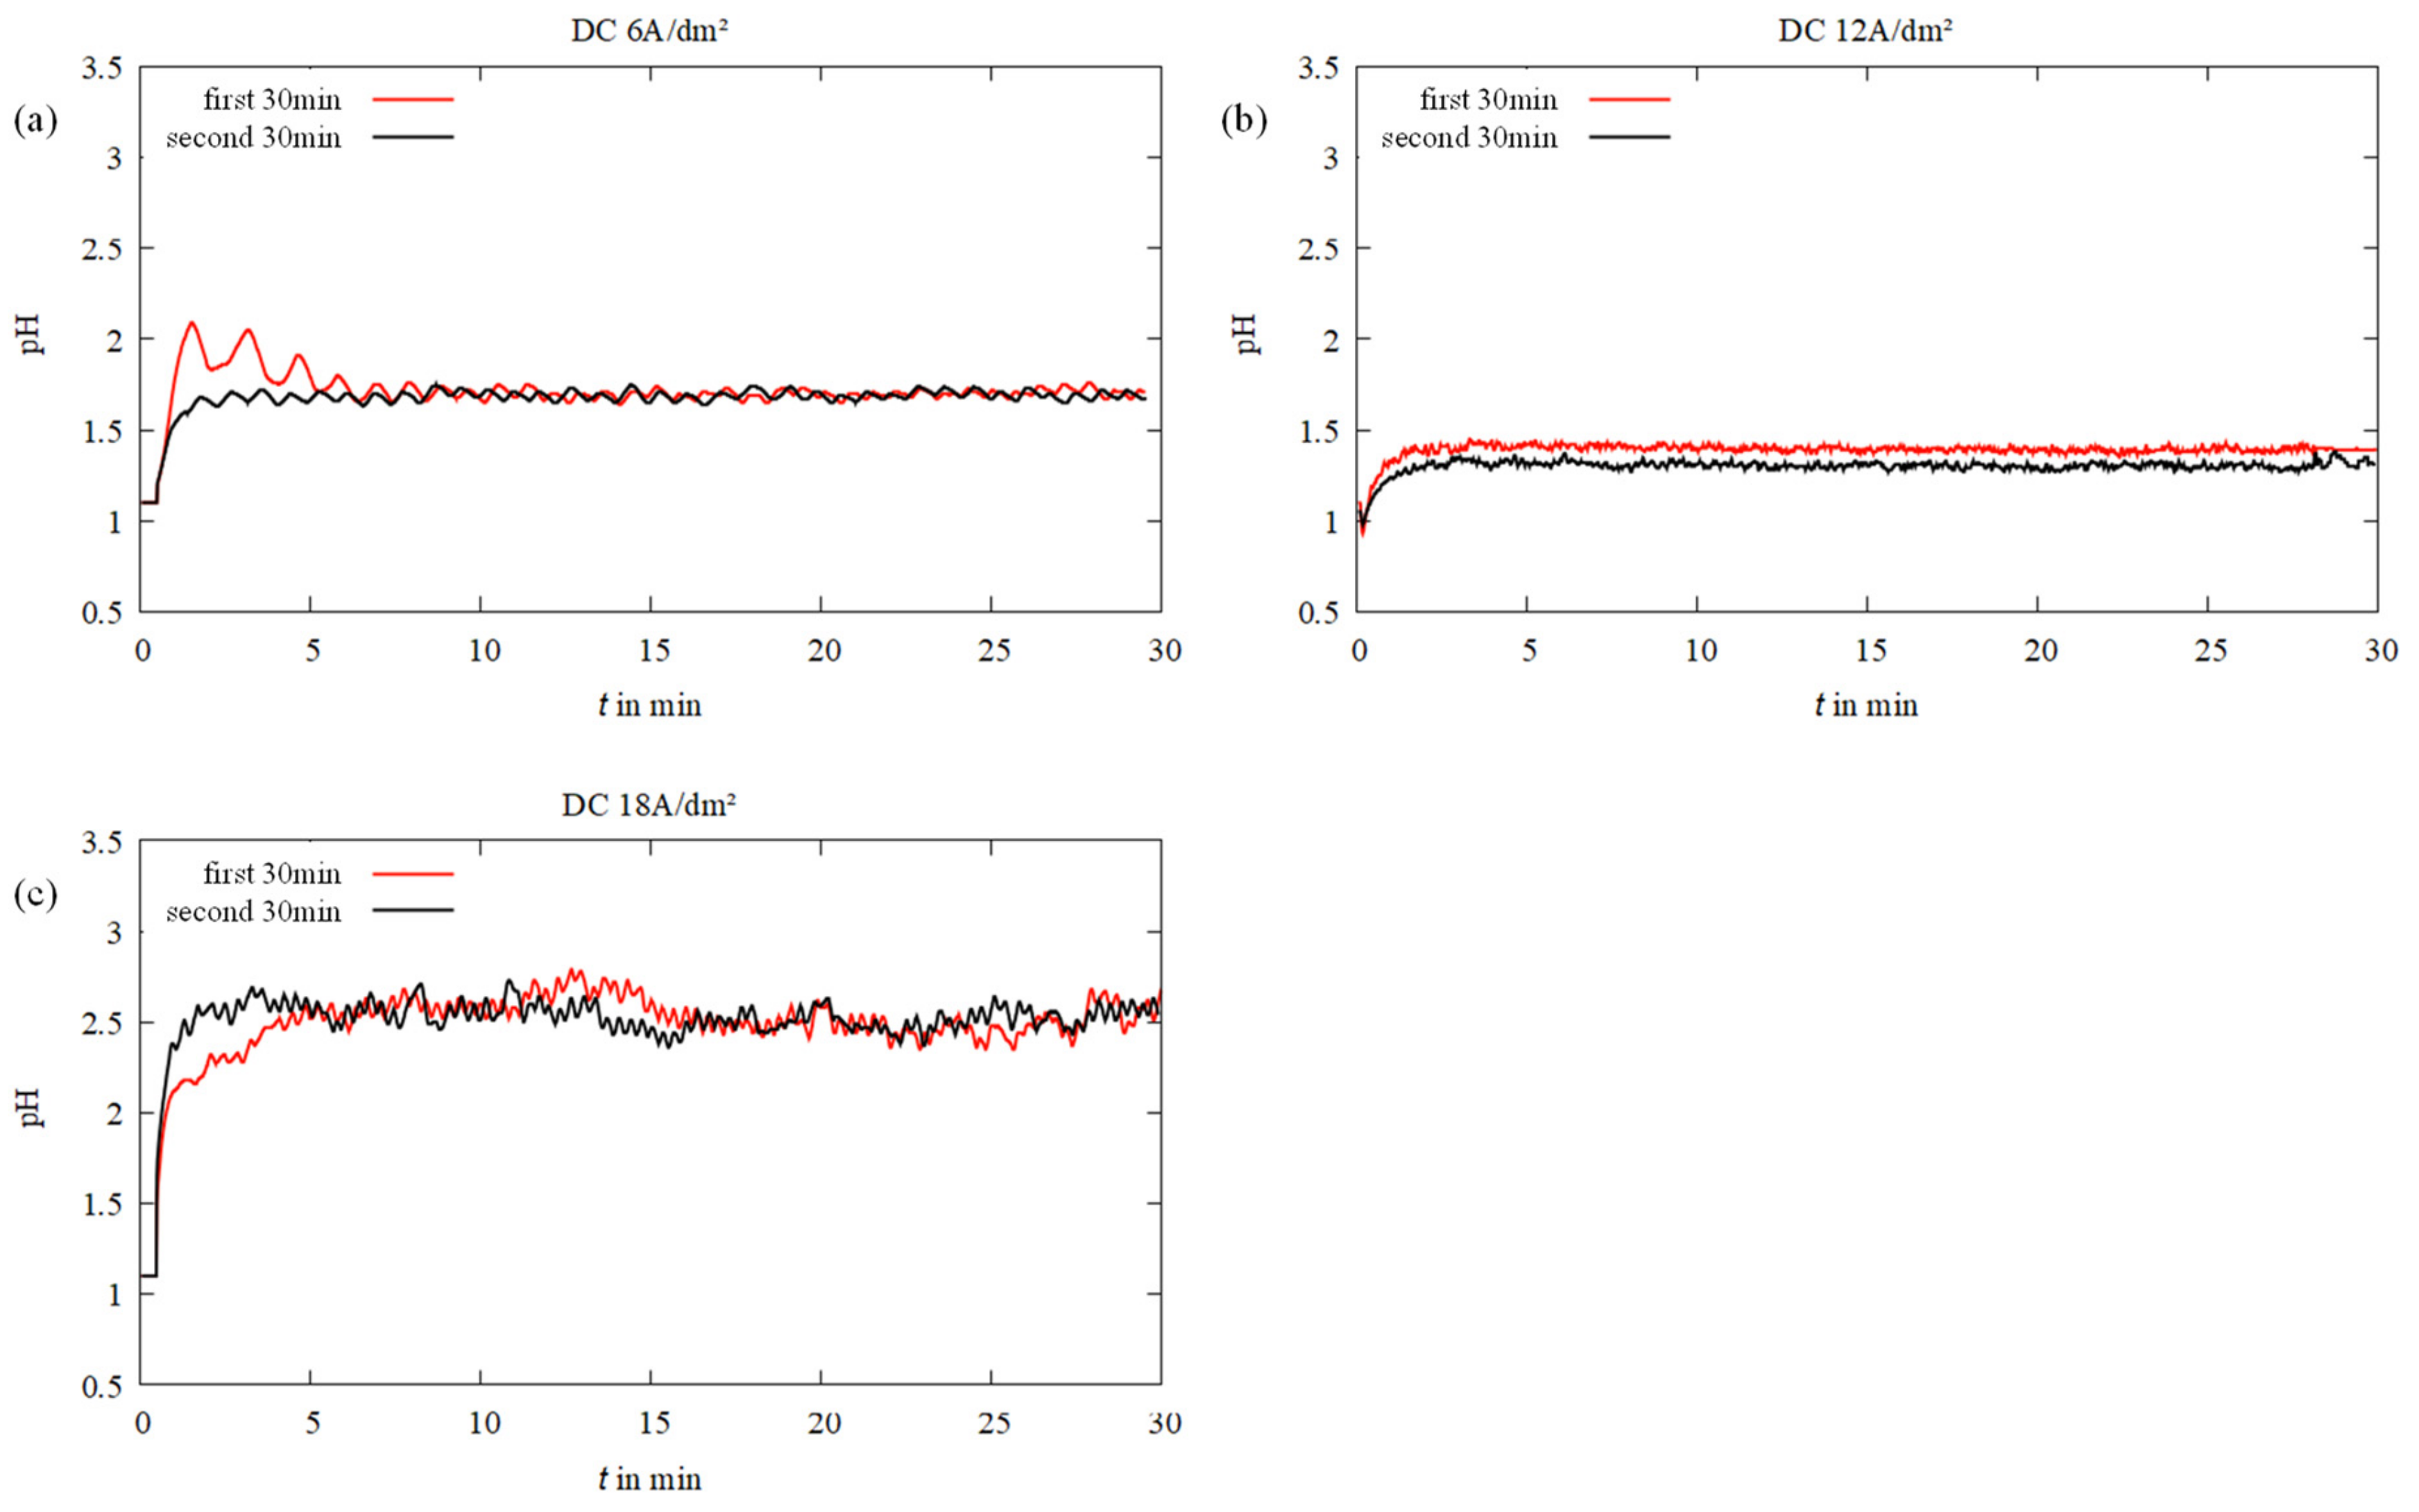
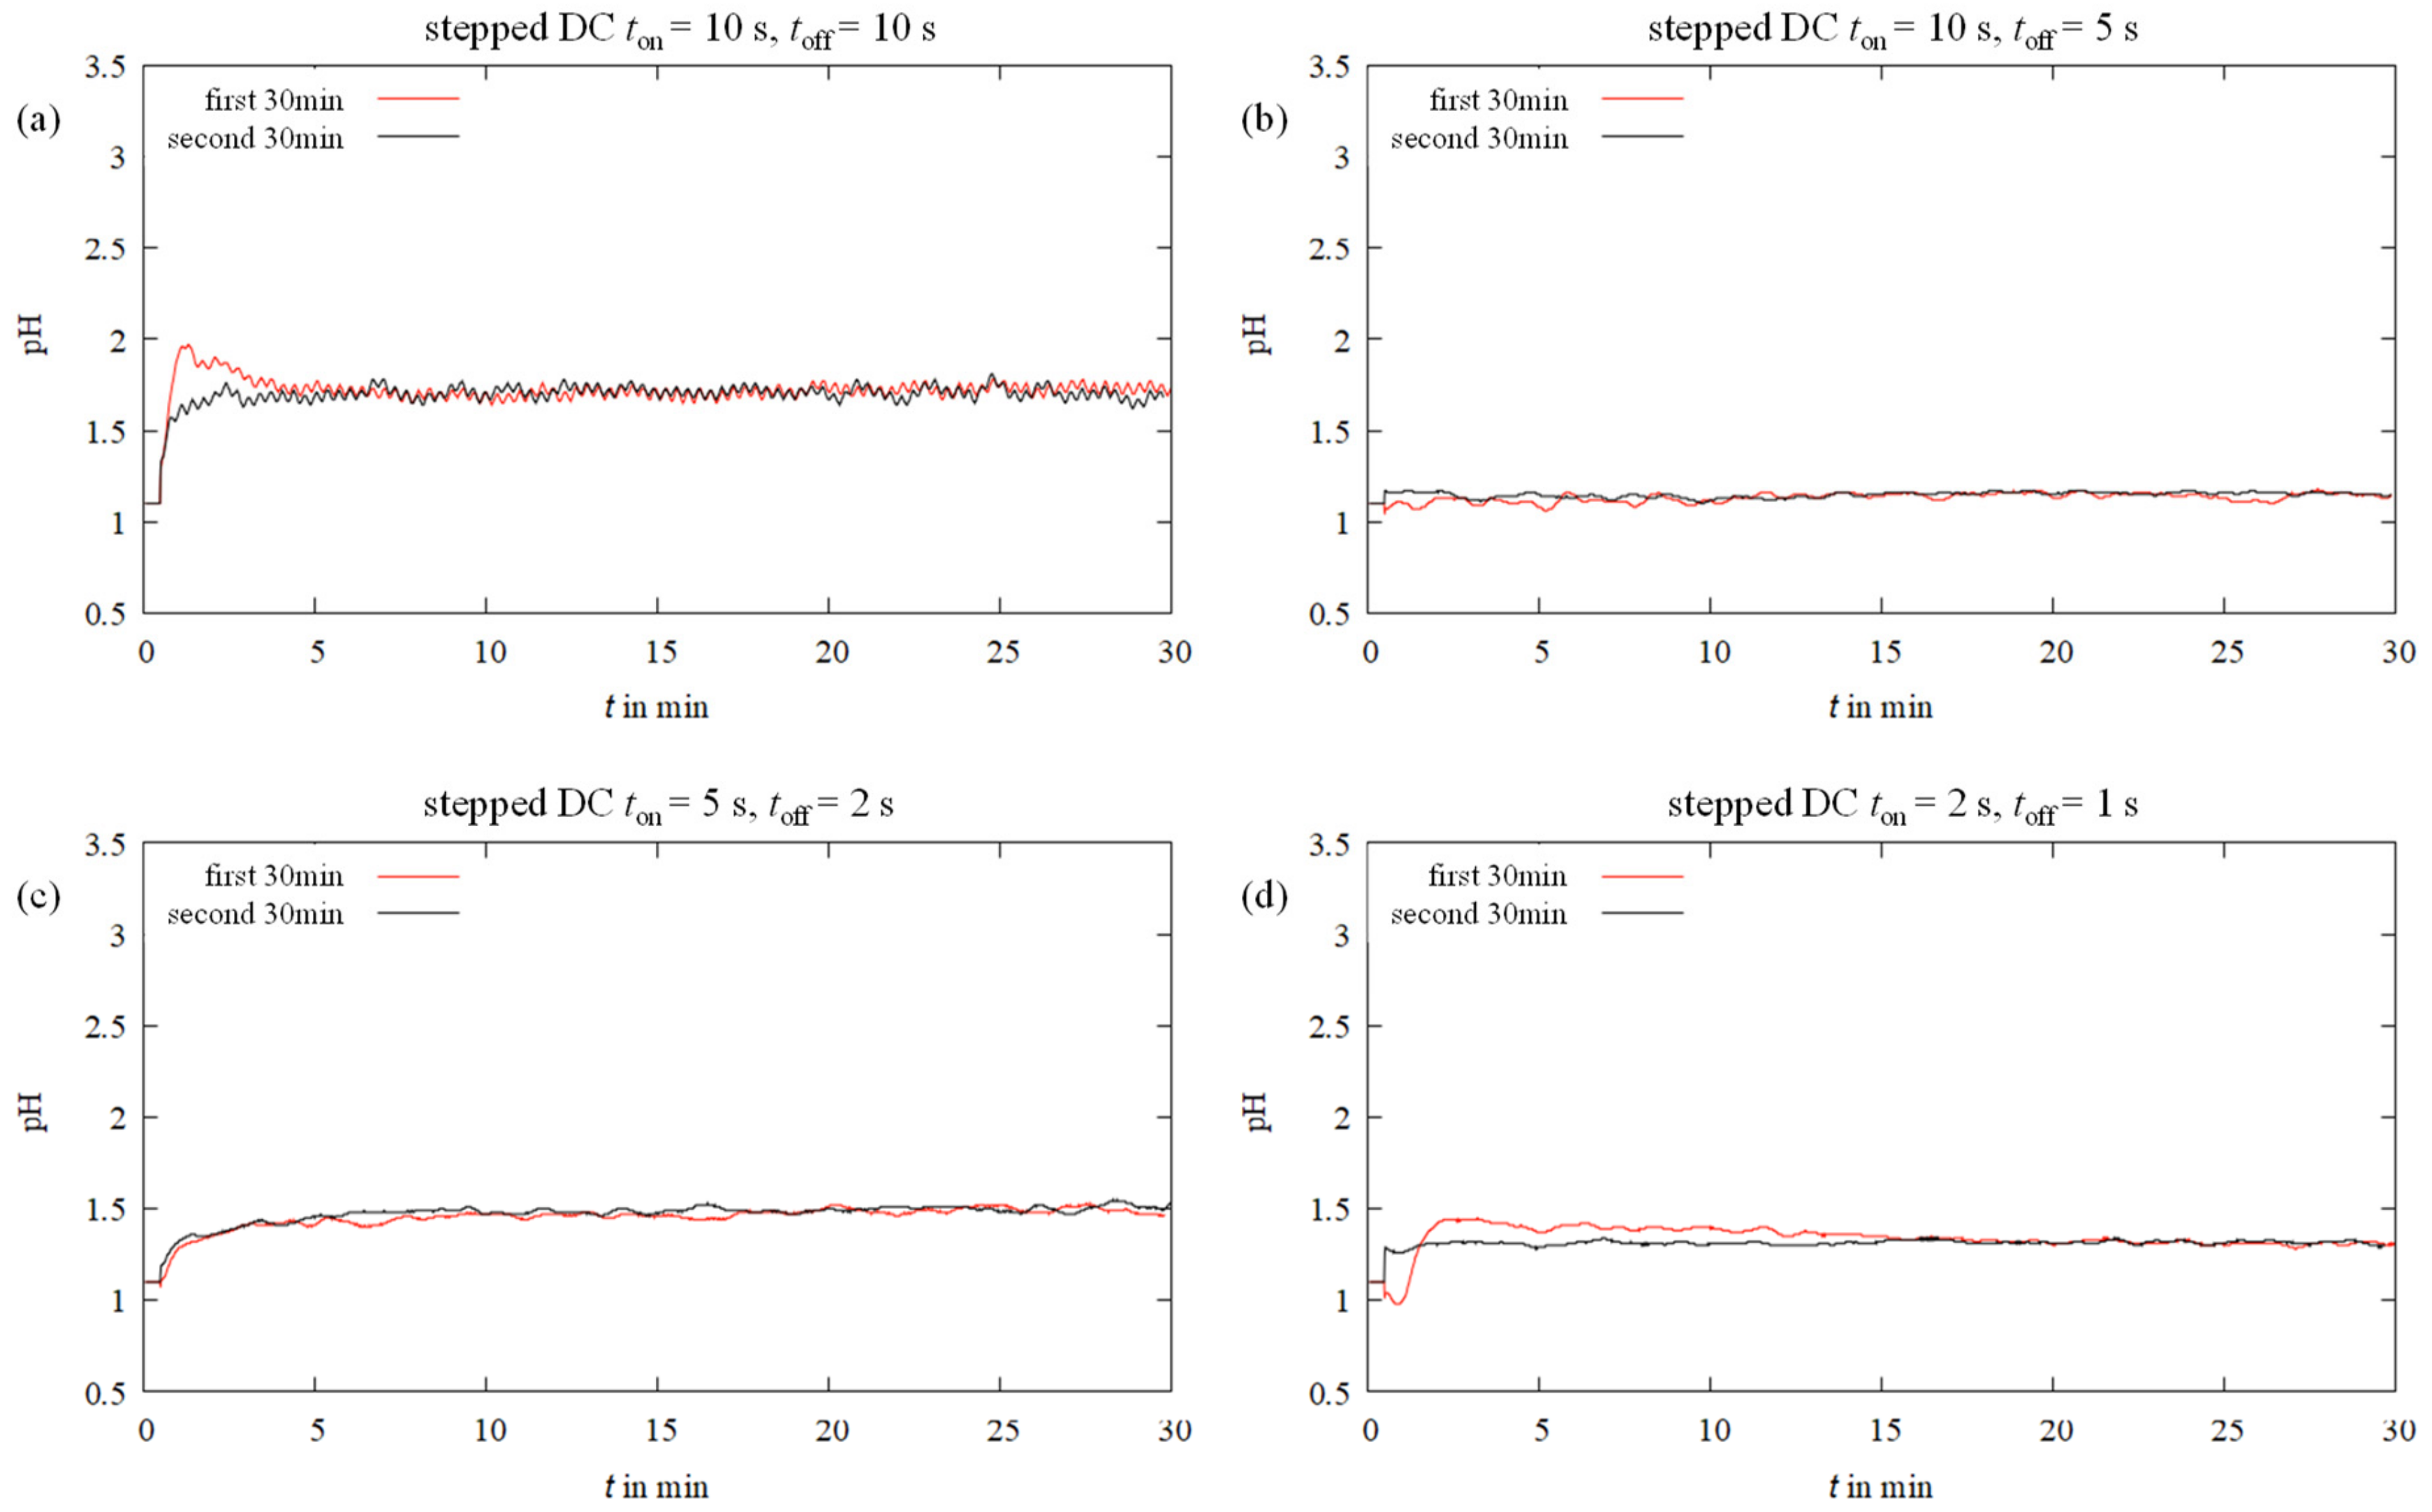
For a better understanding of the influence of the current mode, near-surface pH measurements on the cathode were conducted. Figure 4 and Figure 5 show the recorded pH curves for a period of 30 min.
When the current is switched on, a steep rise in the pH value can be observed in the first 30 s. This increase can be attributed to proton consumption by hydrogen evolution. As already described by Leimbach et al., the pH remains nearly constant thereafter throughout the electrodeposition process [15]. The minimal fluctuations can be considered as noise, which may be caused by the evolution of hydrogen bubbles. Figure 4 shows that the pH value increases from 1.1 to about 1.6 at a current density of 6 A/dm2 and to about 2.5 at 18 A/dm2. At a current density of 12 A/dm2, the pH value increases by only about 0.3. Thus, a low hydrogen formation can be expected at this current density. With these coatings, see sample DC_12 in Table 3, the lowest crack density of all DC coatings can be observed microscopically. Based on this observation and the knowledge gained in the previous study on crack-free Fe-Cr-Ni coatings, the stepped current tests were performed at a current density of 12 A/dm2 [13]. At the same time, the coating deposited at 18 A/dm2 has the highest film thickness, but also the highest crack density. In general, it can be seen that with increasing layer thickness, the crack density also increases. It can be observed that the coating thickness achievable at a current density of 6 A/dm2 increases with electrolyte aging. The thicknesses of the first layers deposited from a fresh electrolyte are significantly lower than those of the subsequent layers from the already used electrolyte. Furthermore, the achievable layer thicknesses vary greatly with the duration of electrolyte use. For DC_6, the maximum difference between the three coatings is in the range of 13 µm, for DC_12 it is 20 µm and for DC_18 approximately 7 µm.
For the stepped DC depositions, the noise in the pH value curves (Figure 5) is somewhat lower. The reason for this could be that the hydrogen bubble formation mitigated by the pauses or that the formation of hydrogen bubbles is repeatedly interrupted. Furthermore, it can be seen that the pH remains below the value of 1.5 for all step ratios except ton = 10 s and toff = 5 s. The ratio of ton = 10 s and toff = 5 s has proven to be the most favorable among the investigated ratios. With those stepped-DC depositions, no pH increase can be observed over the entire coating time while maintaining very low noise. The pH value remains constant at the value of 1.1 set in the electrolyte. As shown in Table 4, these coatings also exhibit a relatively low crack density of 25 cracks per 1000 µm layer length on average. It was even possible to observe a completely crack-free coating. A further extension of the pause time, on the other hand, again leads to layers with more cracks with an average crack density of 36 cracks per 1000 µm at lower layer thicknesses. The reason for this could be the highly acidic bulk electrolyte. During the long pause time of 10 s, not only can the pH at the cathode surface adapt to the bulk electrolyte, but also the time is long enough for a re-dissolution process to take place on the already deposited layer. A short pickling process is also an explanation for the overall rougher and more matte appearance (and thus a layer with a higher surface roughness) of all these Fe-Cr-Ni coatings compared to the other stepped deposited DC and PC coatings. A further reduction in both coating and pause times results in a more uniform deposition rate with a relatively low overall crack density compared to the Step_10/5 and Step_10/10 stepped coatings. Overall, the layer thicknesses of all coatings deposited with stepped DC are between 12 and 23 µm. Even with prolonged use of the electrolyte, the layer thickness remains comparably stable. In particular, the differences are noticeably smaller than for the pure DC coatings. Additionally, the observation that at current densities of 12 A/dm2 or lower, the applicable film thickness can be increased for a certain period of time with the use of the electrolyte can only be confirmed for a pause time of more than 5 s.
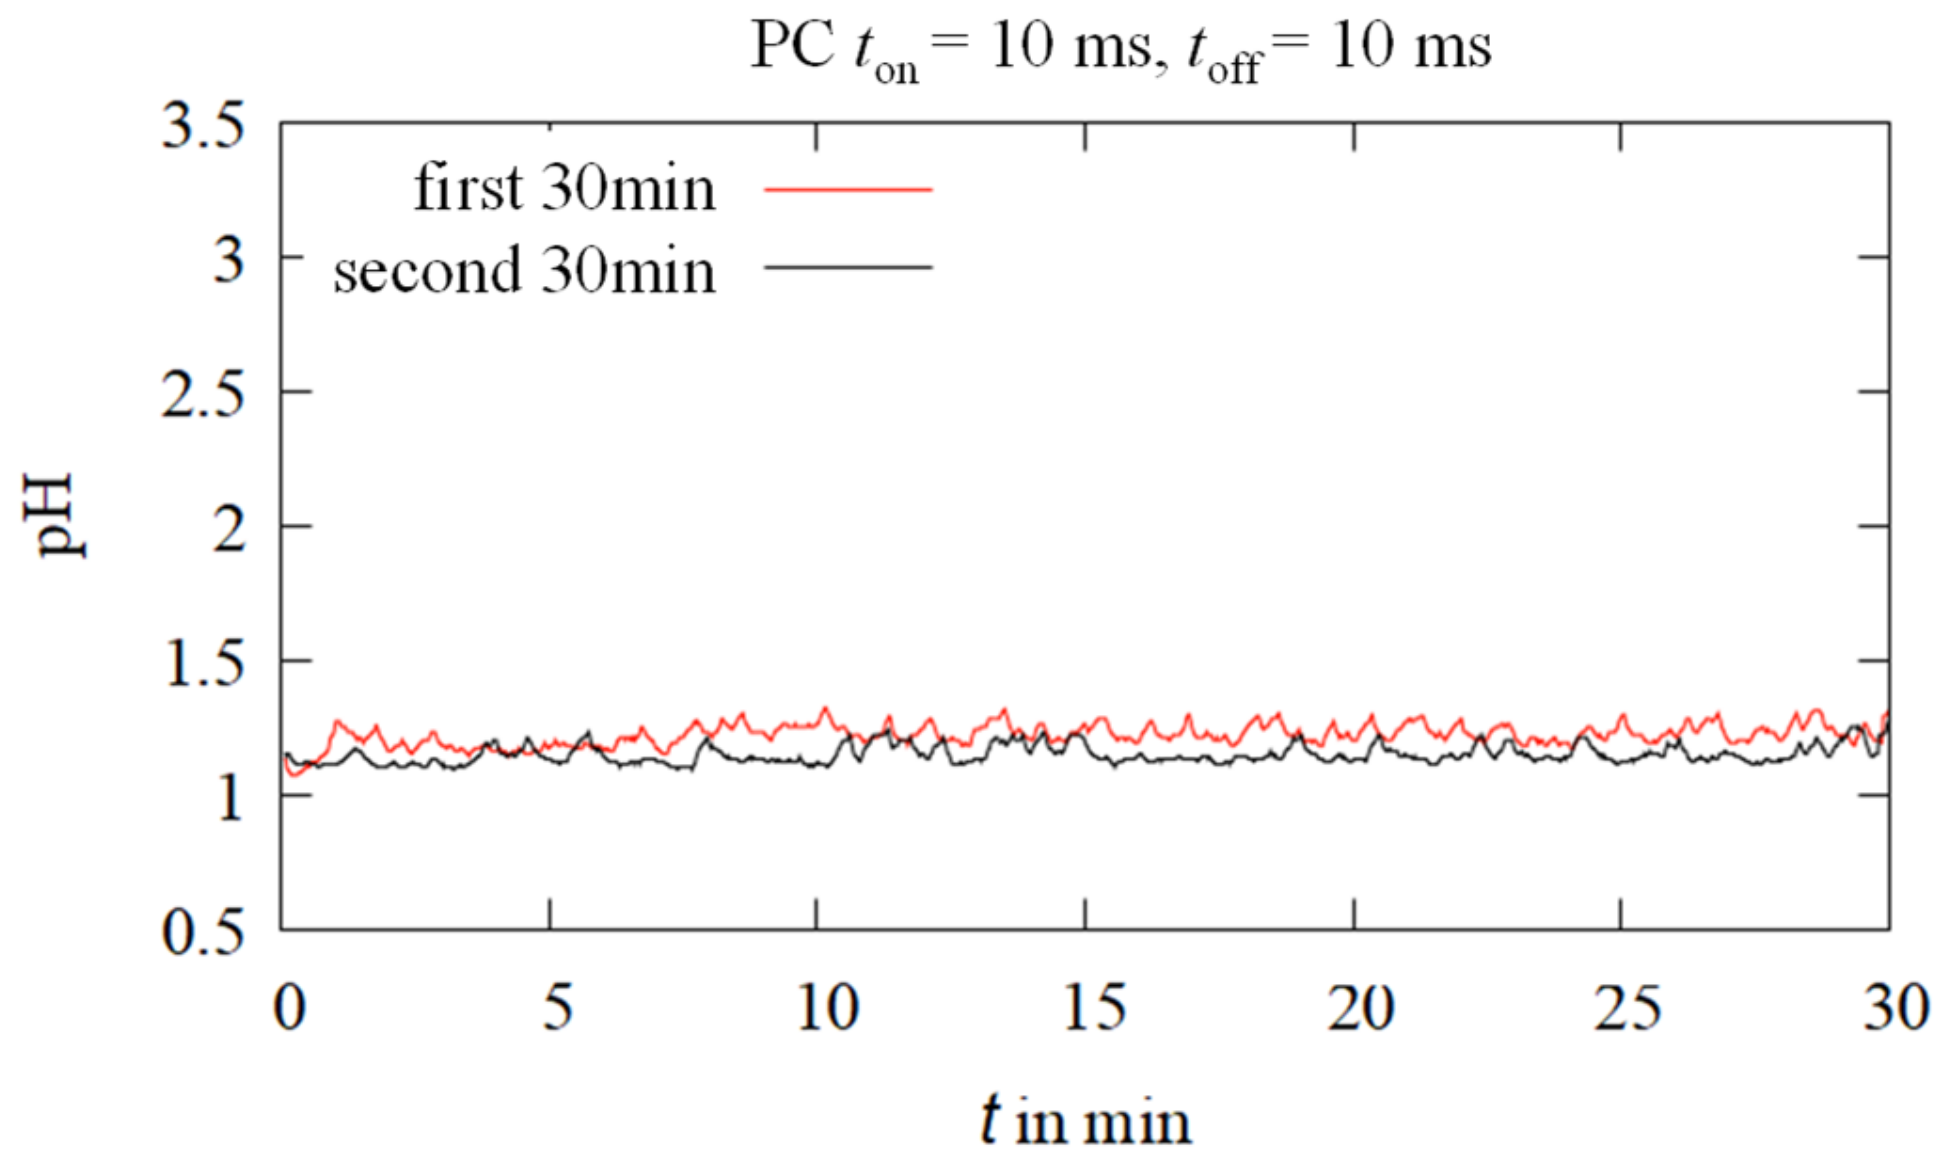
The pH curve for PC deposition is, on average, at a level of 1.2 to a maximum of 1.3, and thus somewhat lower than those of the stepped DC depositions Step_10/10, Step_5/2, and Step_2/1, which are at a level of approximately 1.4. Compared to the near-surface pH curves during the stepped DC depositions, the one in Figure 6 shows a strong noise similar to those during the DC depositions. The reason for this may be the too-short pulse and pause times of 10 ms, which do not completely allow the cathode electrolyte to equalize with the bulk electrolyte and slow down the formation of hydrogen bubbles. This also explains why the crack density is not different from that of stepped DC depositions (Table 5). In addition, the deposition rate is lower when pulse current is used.

3.3. Microstructure and Element Composition of the Coatings

For the following SEM studies, the DC samples, where all film thicknesses exceeded 5 µm, were selected. The stepped DC depositions were selected based on the lowest film thickness and a low microcrack density as well. Thus, the samples DC_12, DC_18, Step_10/5, Step_5/2 and PC were selected.
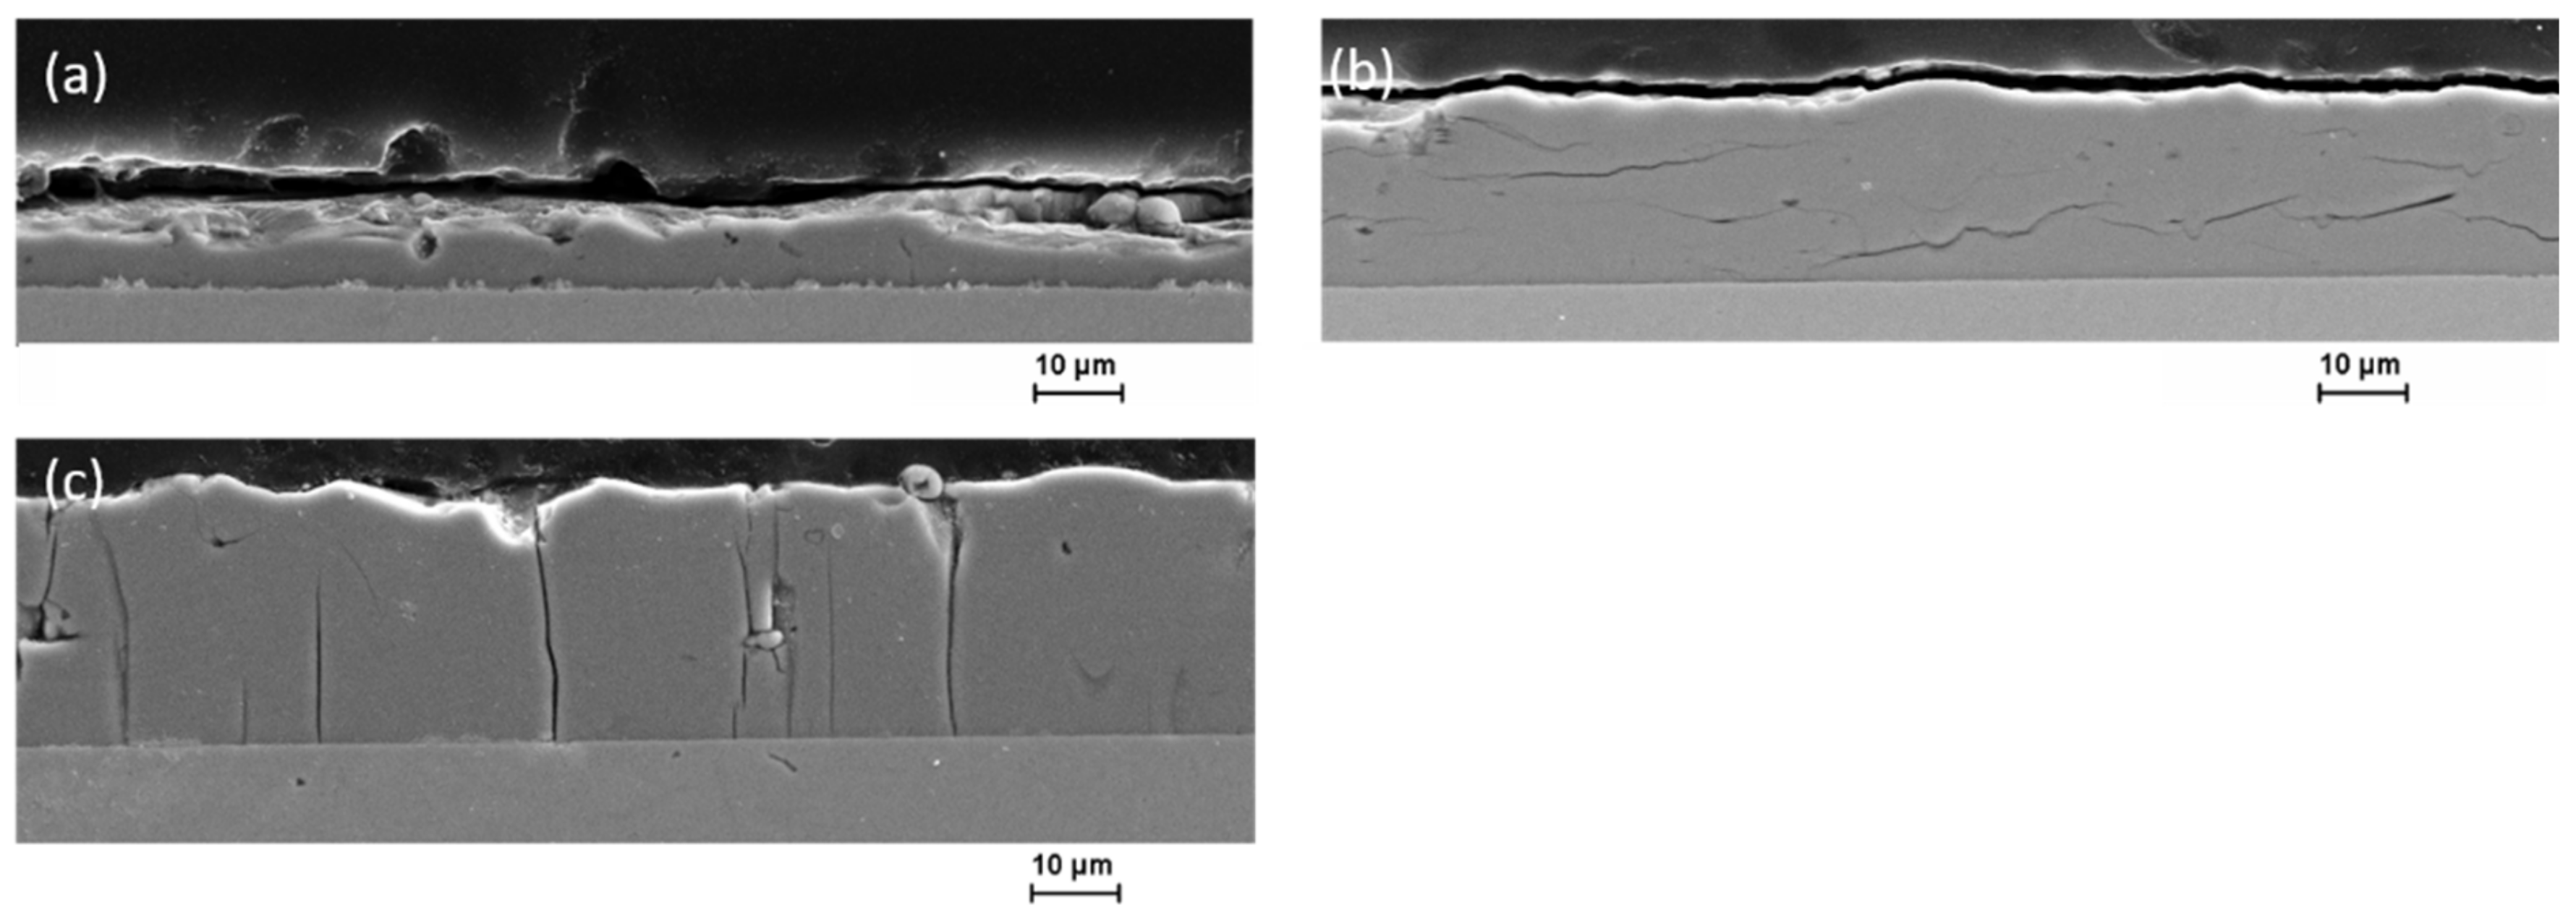
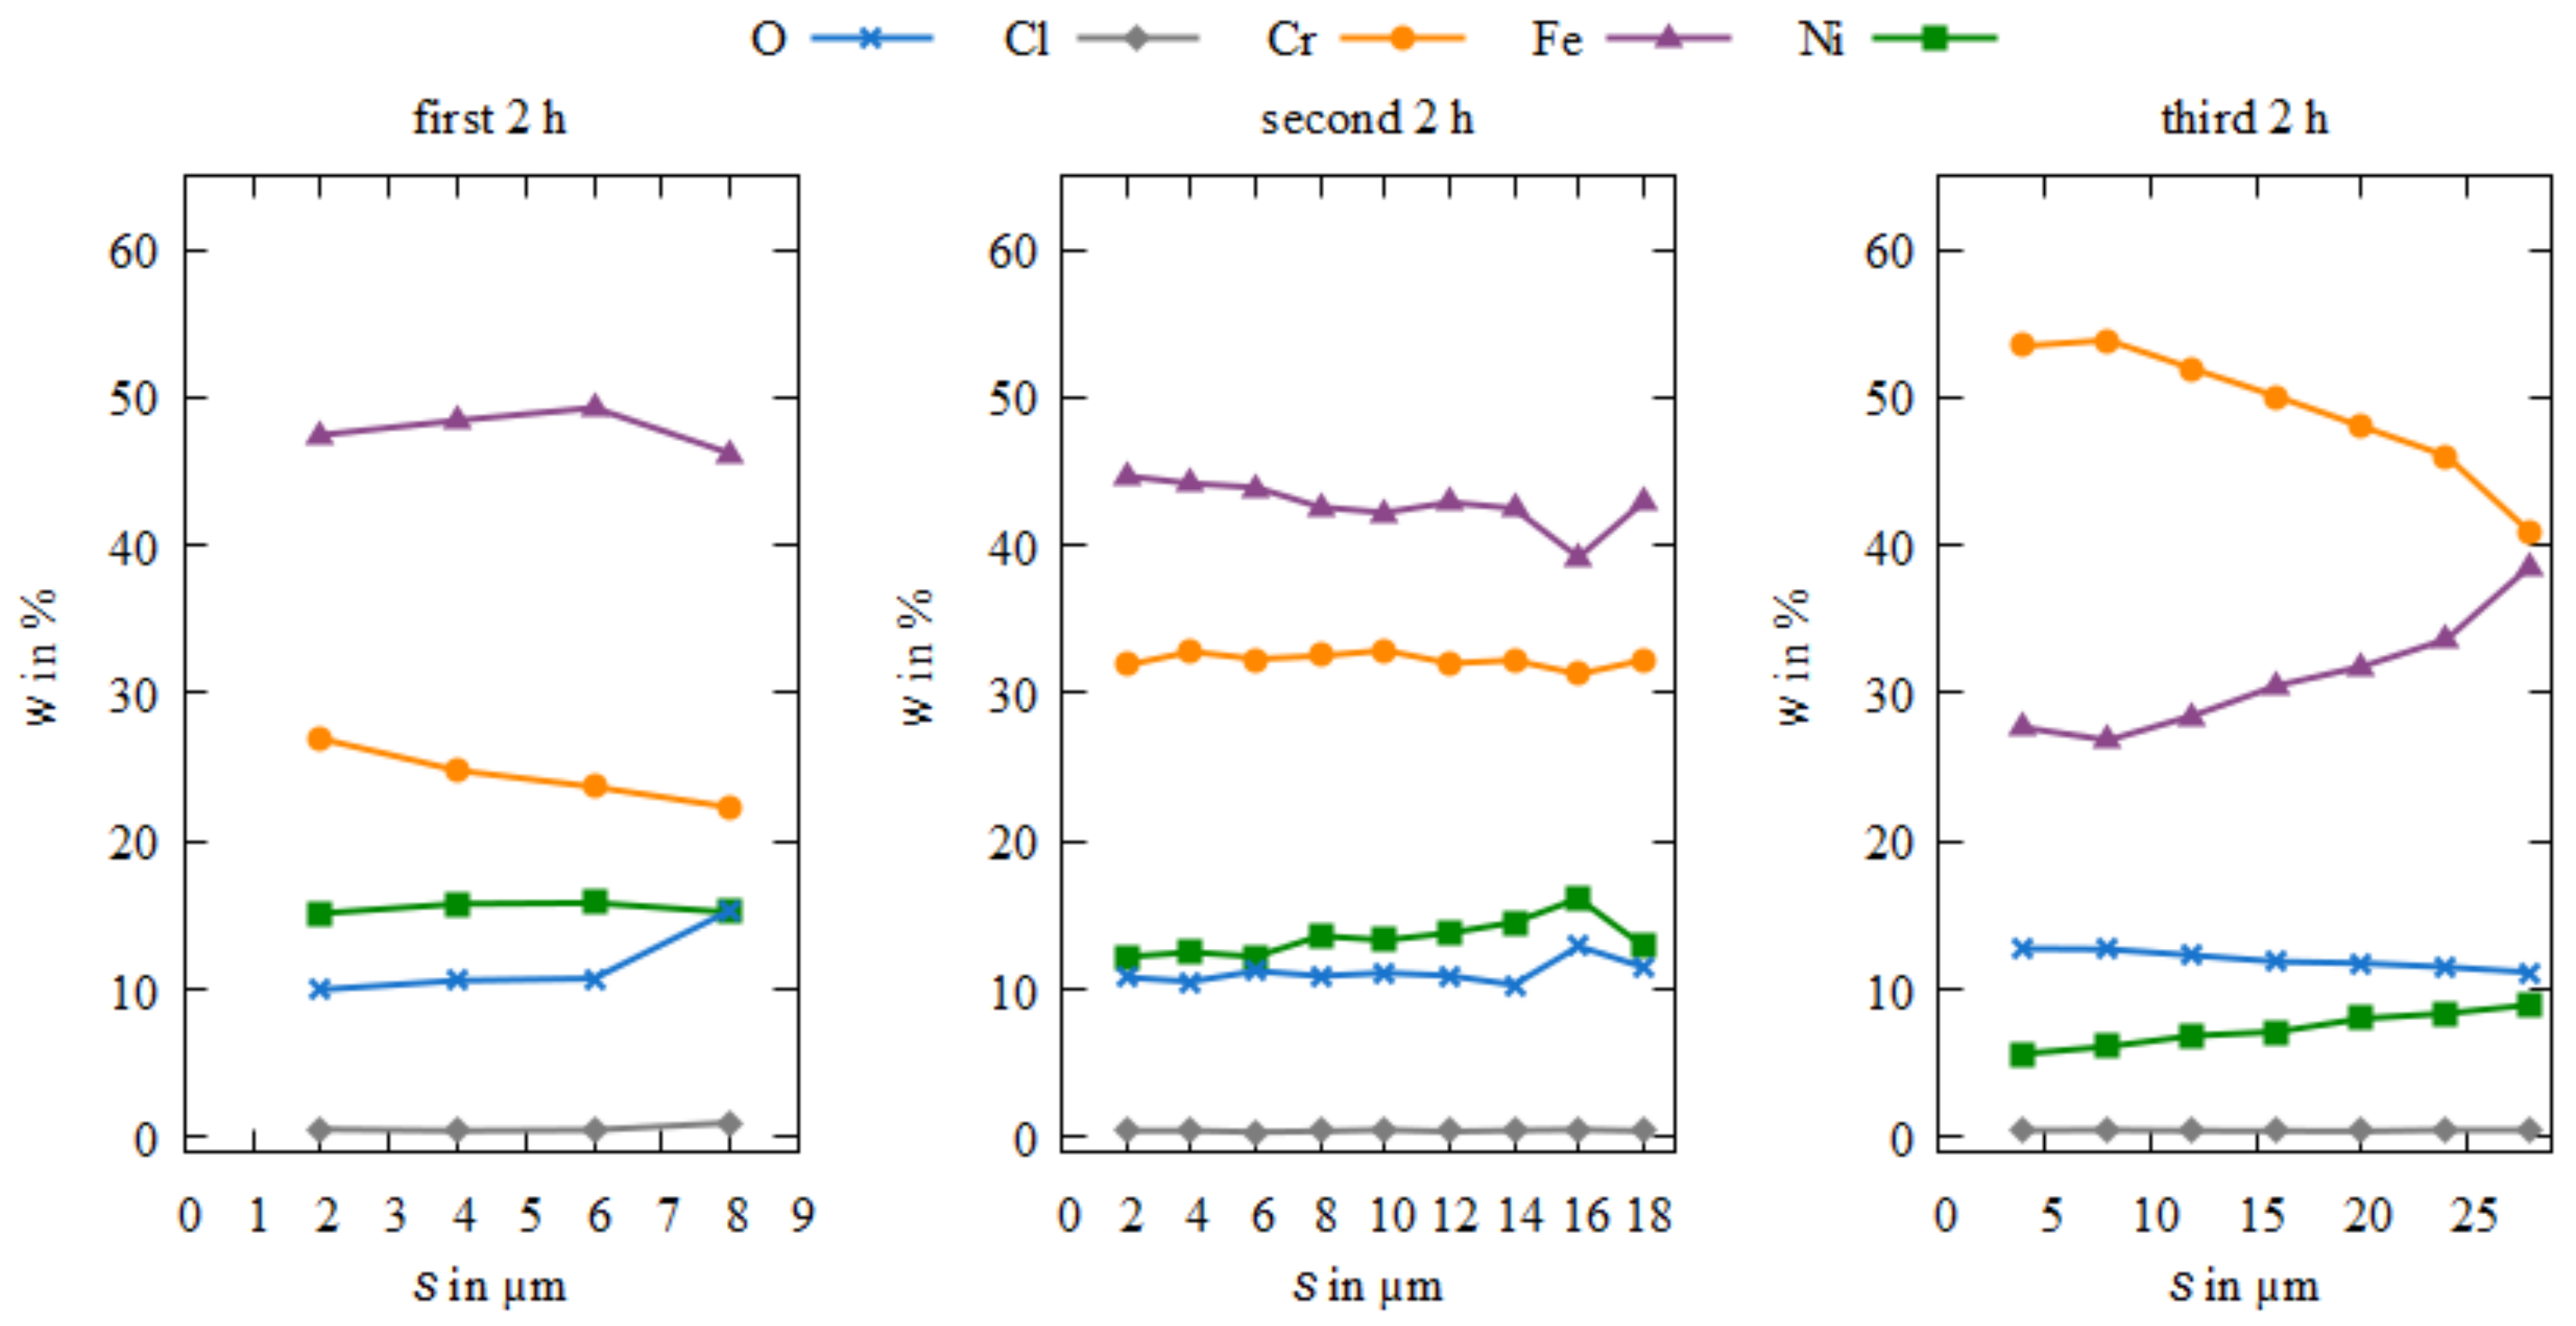
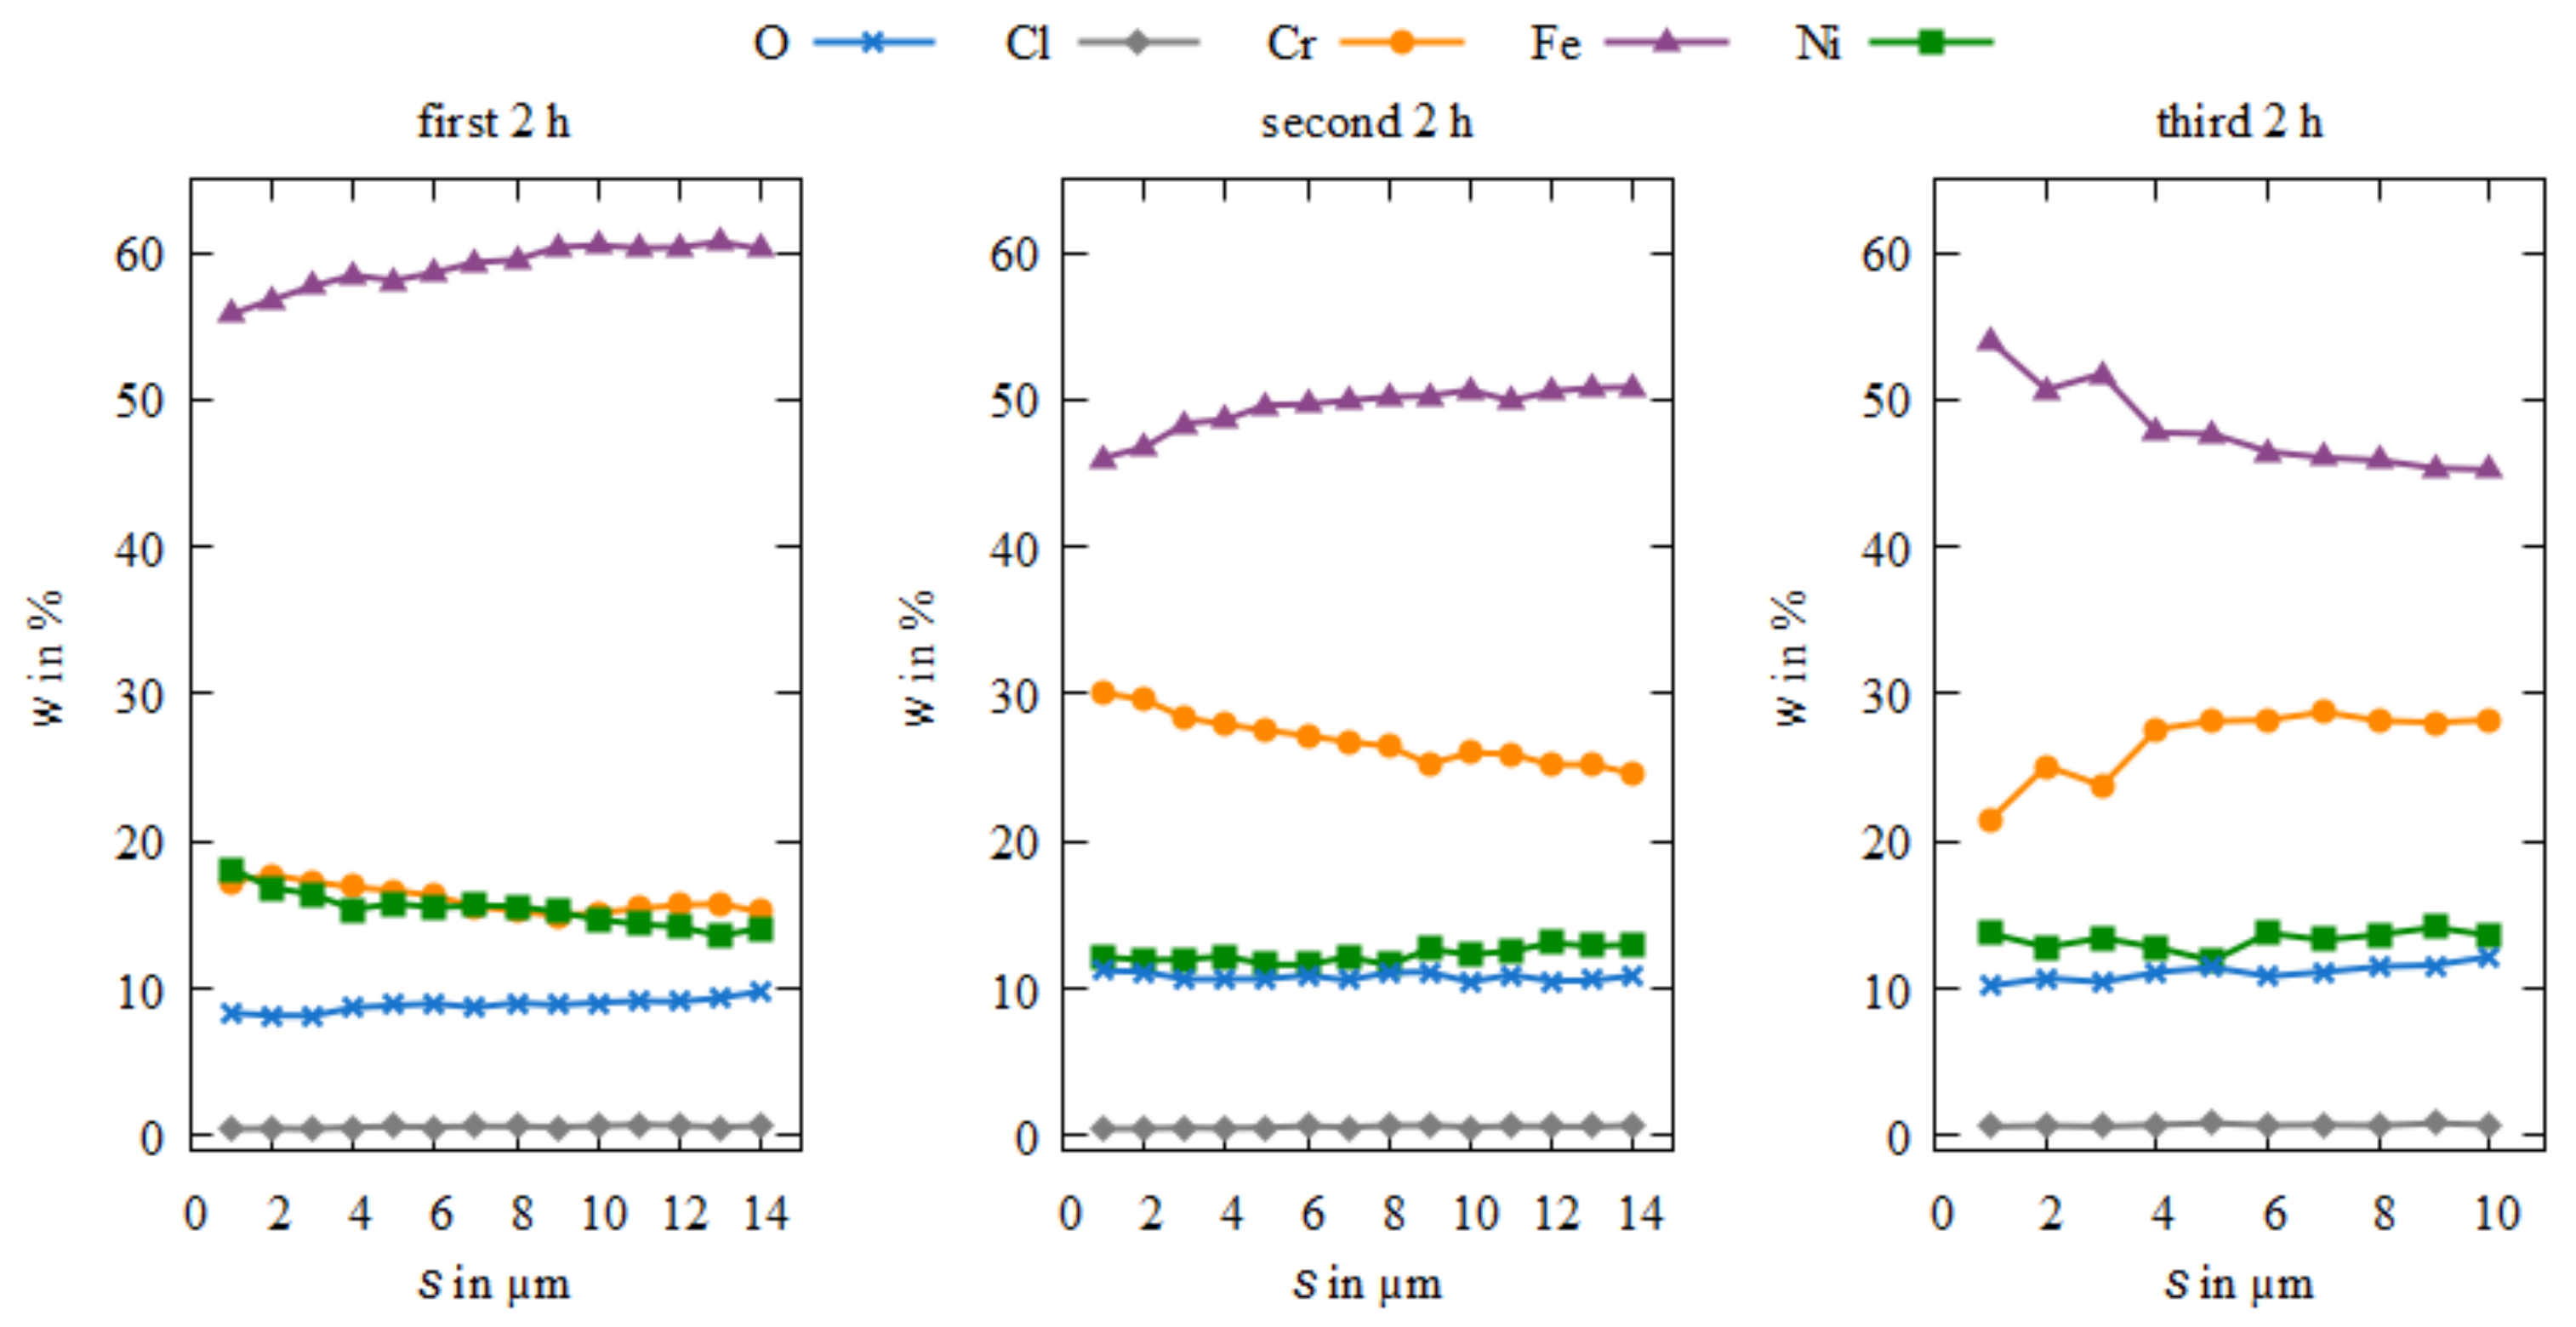
Figure 7 shows the scanning electron micrographs of the DC_12 coatings. It is noticeable that with increasing duration of electrolyte use, the coating thickness increases. Thus, the deposition rate is about 5 µm/h when using a fresh electrolyte, about 8 µm/h after only two hours of use, and 15 µm/h by the third ongoing deposition. With each bath use, the achievable film thickness can be almost doubled. An examination of the cross-sections in Figure 7a shows clear material chipping. As can be seen in Figure 8 (first 2 h), the reason for this could be the slightly elevated contents of oxygen and chlorine near the surface. Increased metal oxide formation could cause embrittlement in this area. The microcracks, which are typical for chromium coatings, can almost not be seen on this specimen. Due to the severe material chipping in Figure 7a, it is not possible to determine whether these layers have horizontal microcracking. In Figure 7b, thin horizontal microcracks are present. Overall, the elemental distribution plots in Figure 8 showed that the alloy composition across the thickness of the DC_12 specimens is similar for the first and second depositions but strongly different for the third deposition. As it can be seen in Figure 7c, the thickest layer shows a distinct crack pattern extending from the surface through the entire layer to the substrate, which is typical of hard chromium coatings. By relating this result in the EDX data plot from Figure 8, it is clearly visible that the chromium content is significantly higher and the iron content significantly lower than in the first and second deposits. Furthermore, the local distribution of the chemical elements varies strongly: the chromium content starts at wCr = 55% on the substrate and decreases over the film thickness to 40%, while the iron content increases from wFe = 29% to 39%. This strongly suggests that after 4 h of DC deposition time, the equilibrium ratios of the metal ion complexes in the electrolyte begin to change. As deposition and film thickness progress, the films show a dull and rough surface with significant material chipping at the edges of the sample.
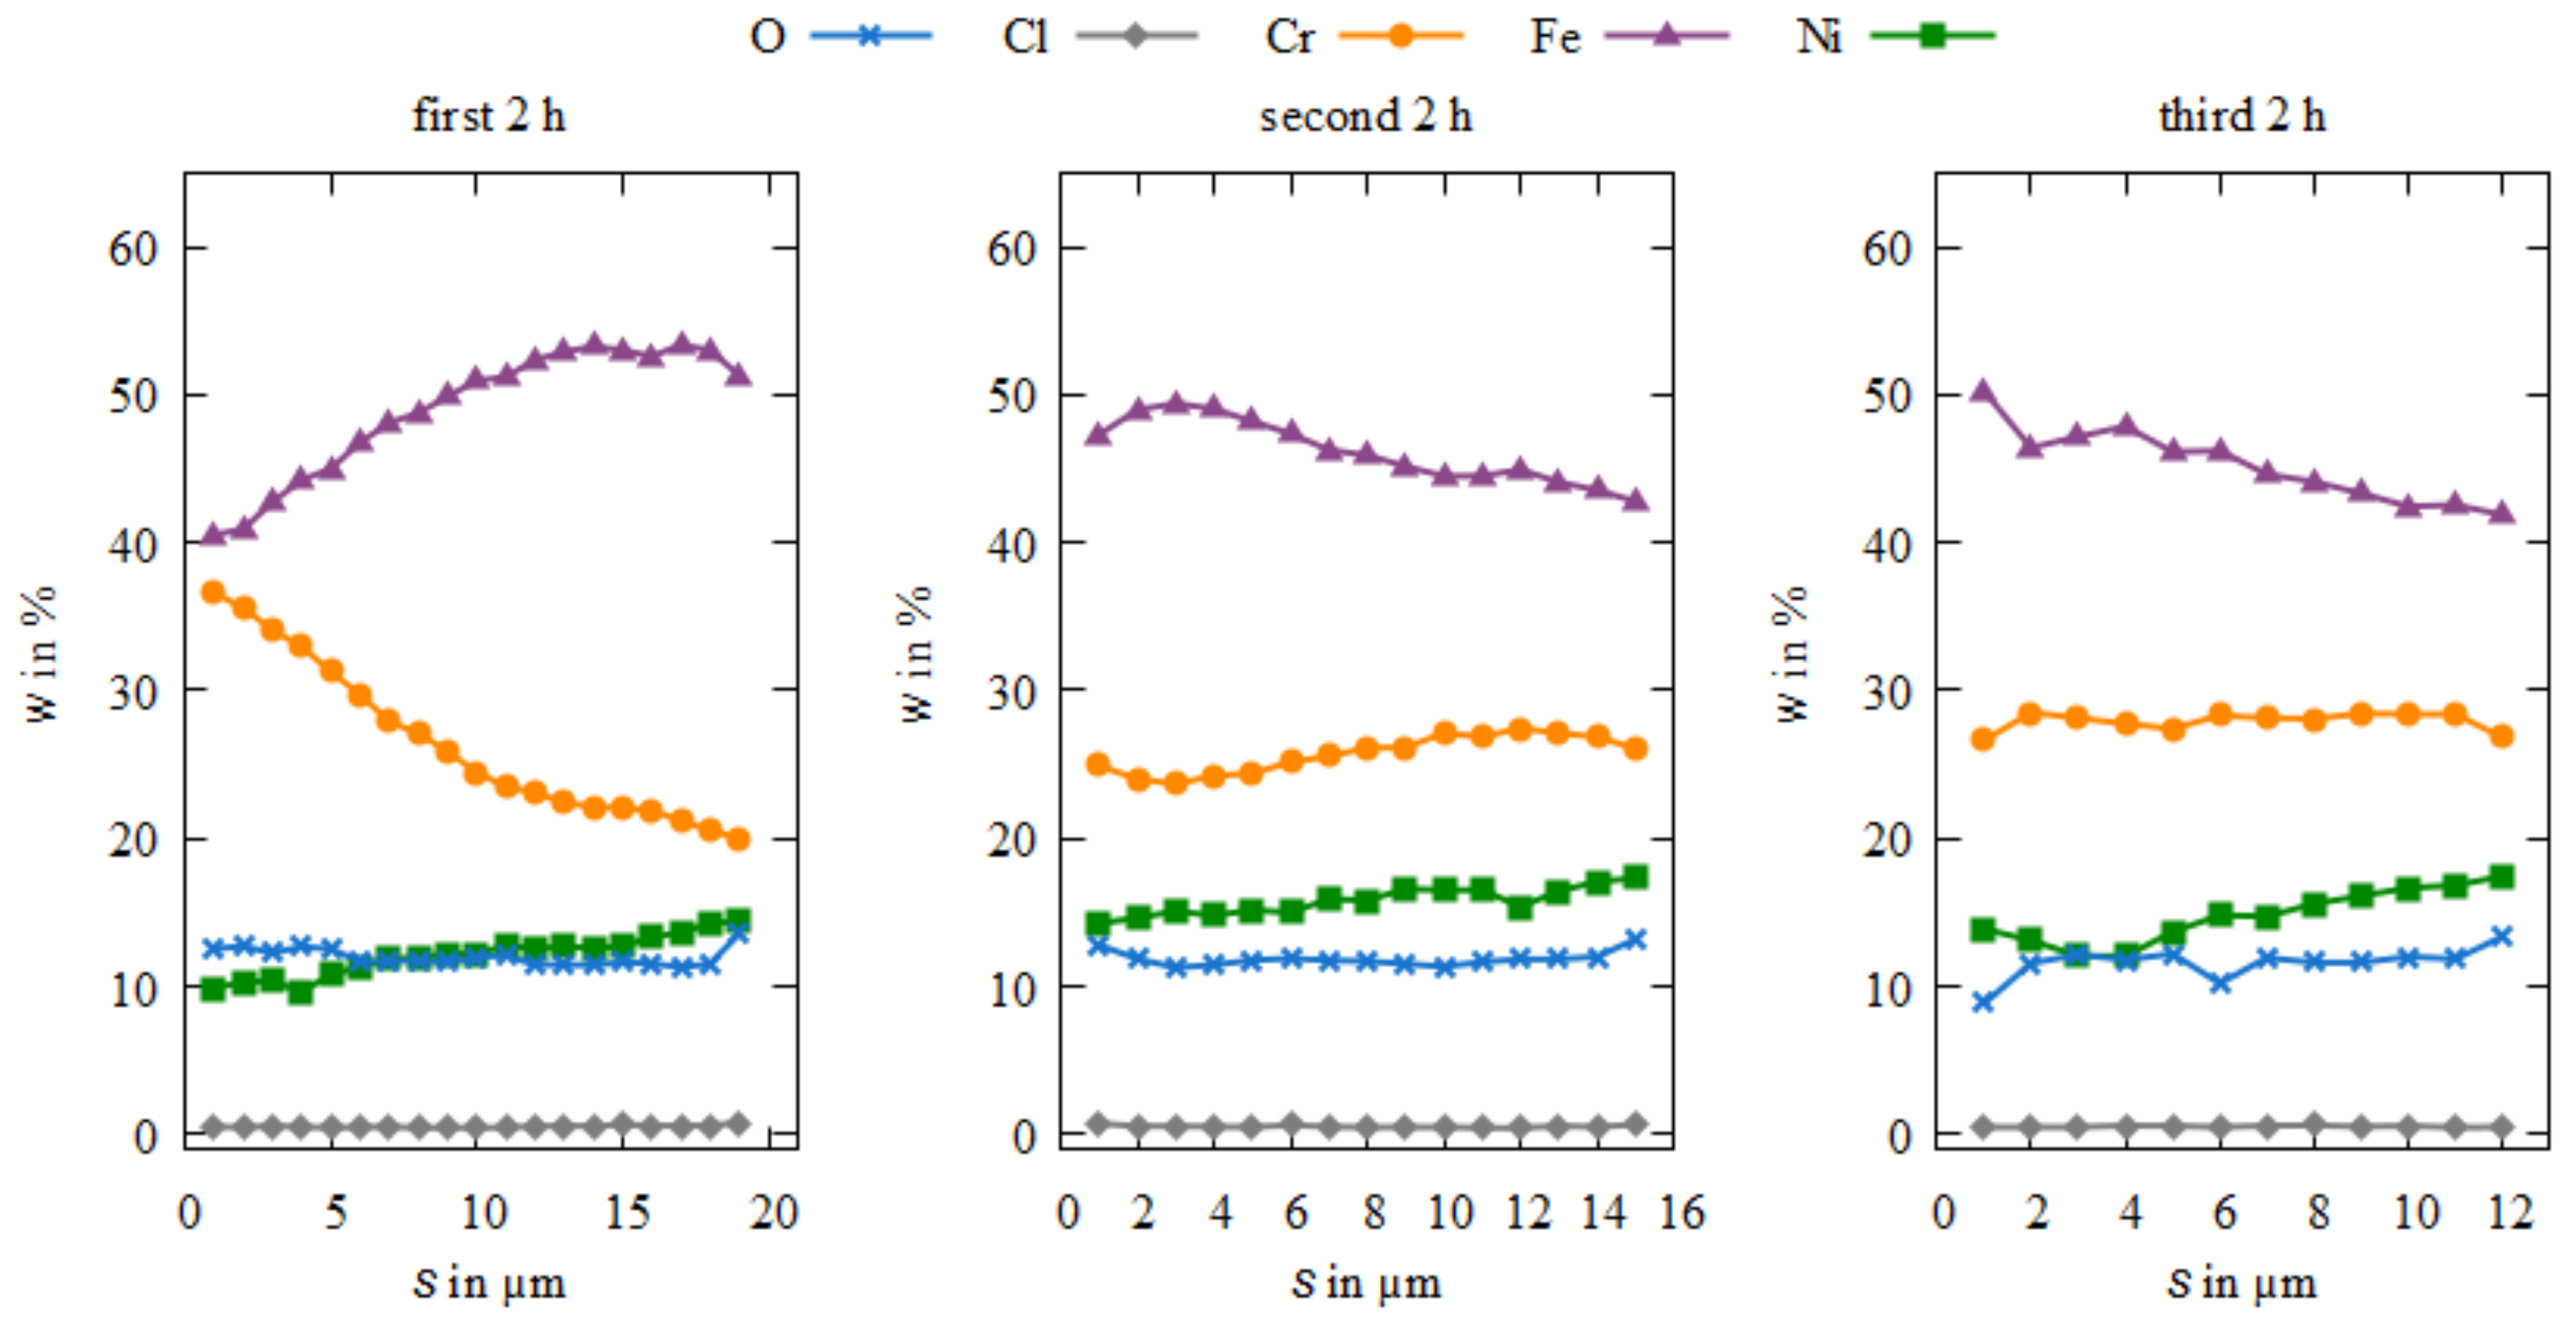
The Fe-Cr-Ni coatings deposited at a higher current density of 18 A/dm2 in Figure 9a,b show typical vertical cracks for the first two deposits with an approximately equal alloy composition and coating thickness. In Figure 10, the wavelike progressions of the iron and chromium contents over the layer are remarkable, while the nickel, oxygen, and chlorine contents are almost constant for all layers and correspond to those at a current density of 12 A/dm2. The variation of chromium over the thickness is 16.1% in the first layer and 14.4% in the second one. For iron, the difference is 14.0% for the first layer and 11.5% for the second one. From a coating thickness of about 10 µm, the chromium content drops sharply, while the iron content increases. It can be deduced from this that the consumption phenomena of chromium take place in the electrolyte thereafter. Once the Cr complexes are consumed, Fe can be deposited more easily. After the third bath use, it is visible in the plot in Figure 10 and the SEM image in Figure 9c that a layer with a more homogeneous alloy composition of wCr = 30% and wFe = 42%–48% can be produced, as well as one with thin vertical cracks. At such a high current density, the electrolyte is therefore consumed much more unevenly than at current densities around 12 A/dm2. Based on the observations on the DC_12 and DC_18 coatings, it can therefore be deduced that a distribution of the elements iron and chromium as homogeneous as possible over the entire coating leads to a reduction in typical vertical microcracks and favors the expression of thin horizontal microcracks.
A very uniform appearance with few microcracks is shown by the layers with a stepped deposition of ton = 5 s, toff = 2 s in Figure 11. The first two layers show few but clearly visible vertical microcracks running through the entire layer. The last deposition also exhibits such microcracks, but they are very narrow, making them difficult to detect even at high resolutions. It was observed that after 4 h of electrolyte use, the deposition rate decreased. The chromium content of the first deposition under this current form is about 10% lower and the iron content about 10% higher than that of the two subsequent coatings (Figure 12). One reason for this could be that, due to the pause times, the electrolyte requires a longer run-in time until a more uniform alloy composition of wFe = 50%, wCr = 25%–30% and wNi = 13% is established, which is also reflected in the low-microcrack cross-sections. The outer appearance of the coatings is glossy and metallic.
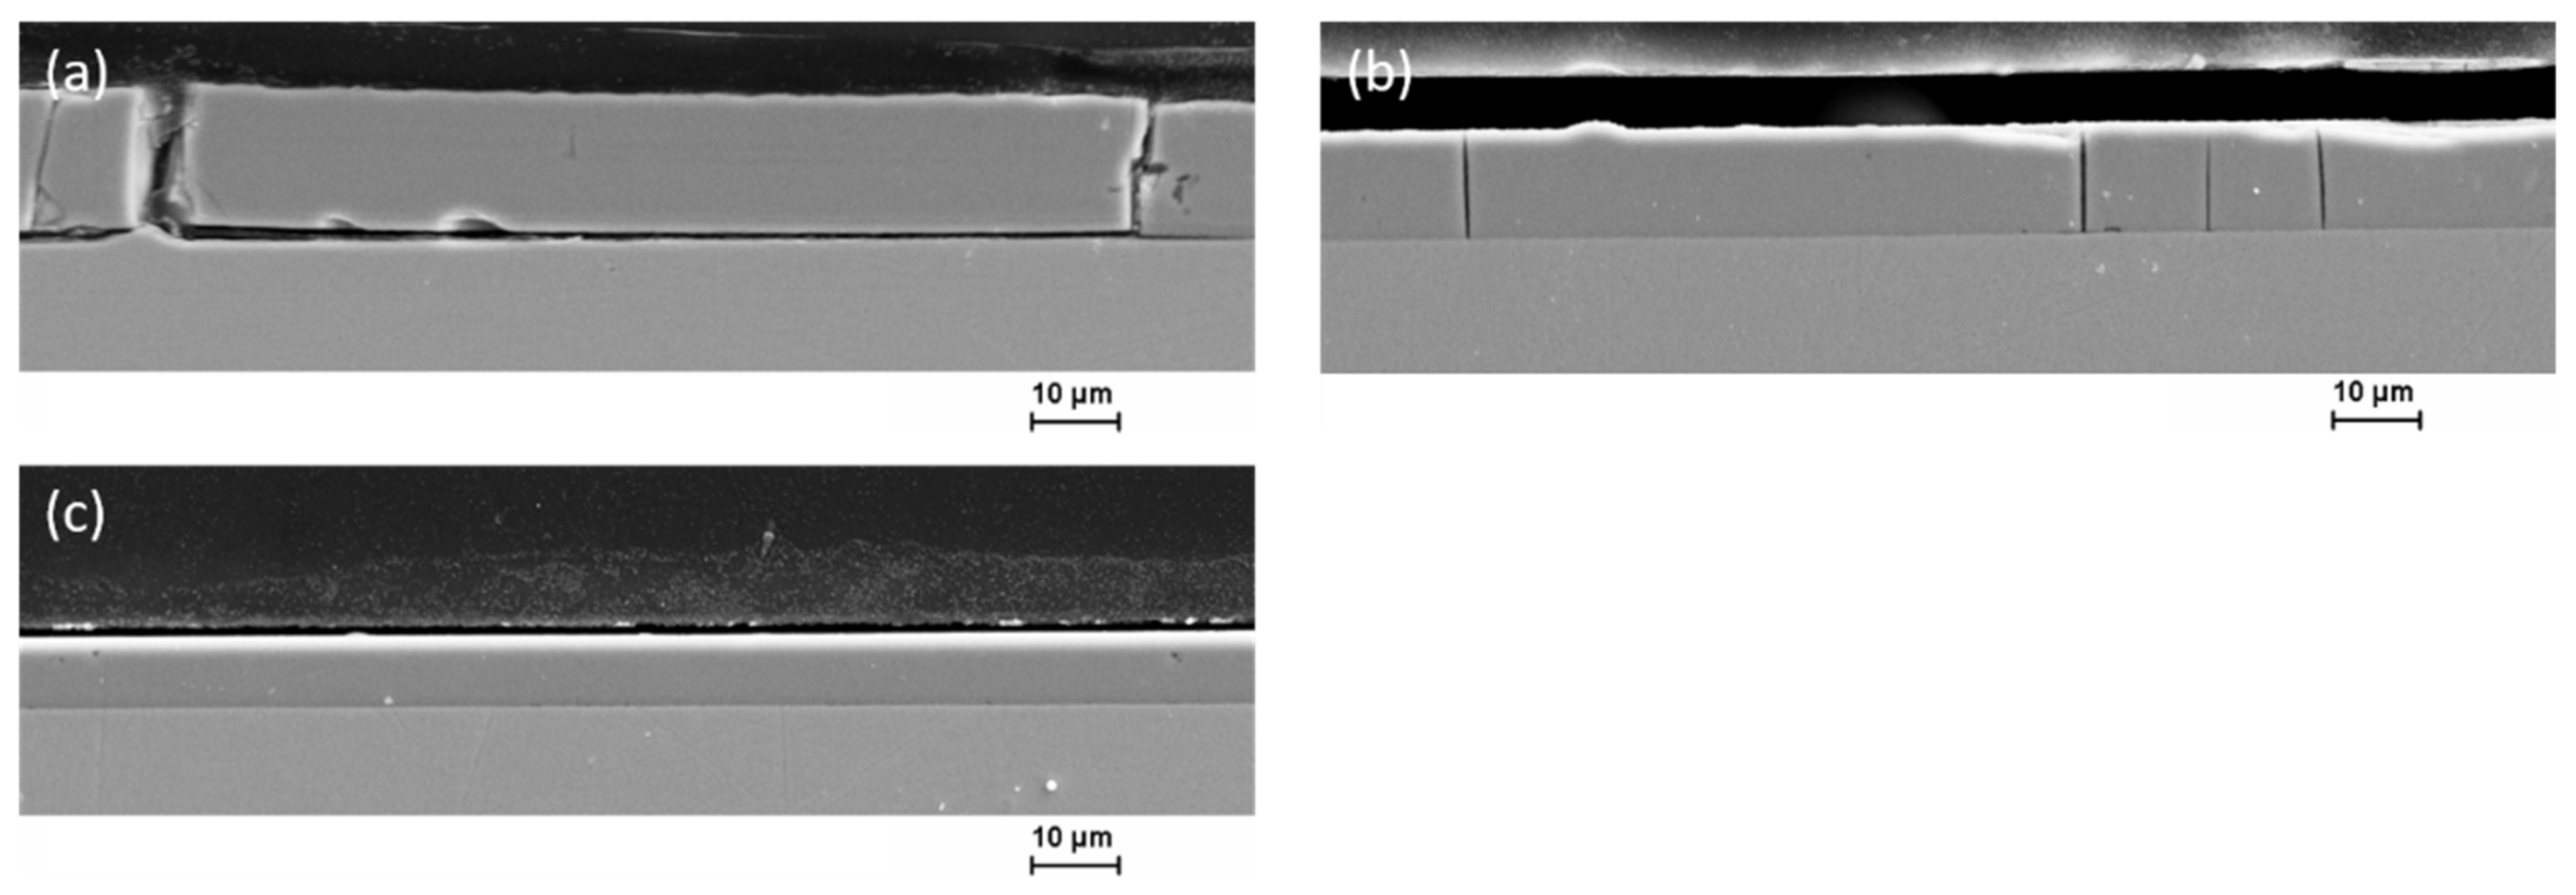
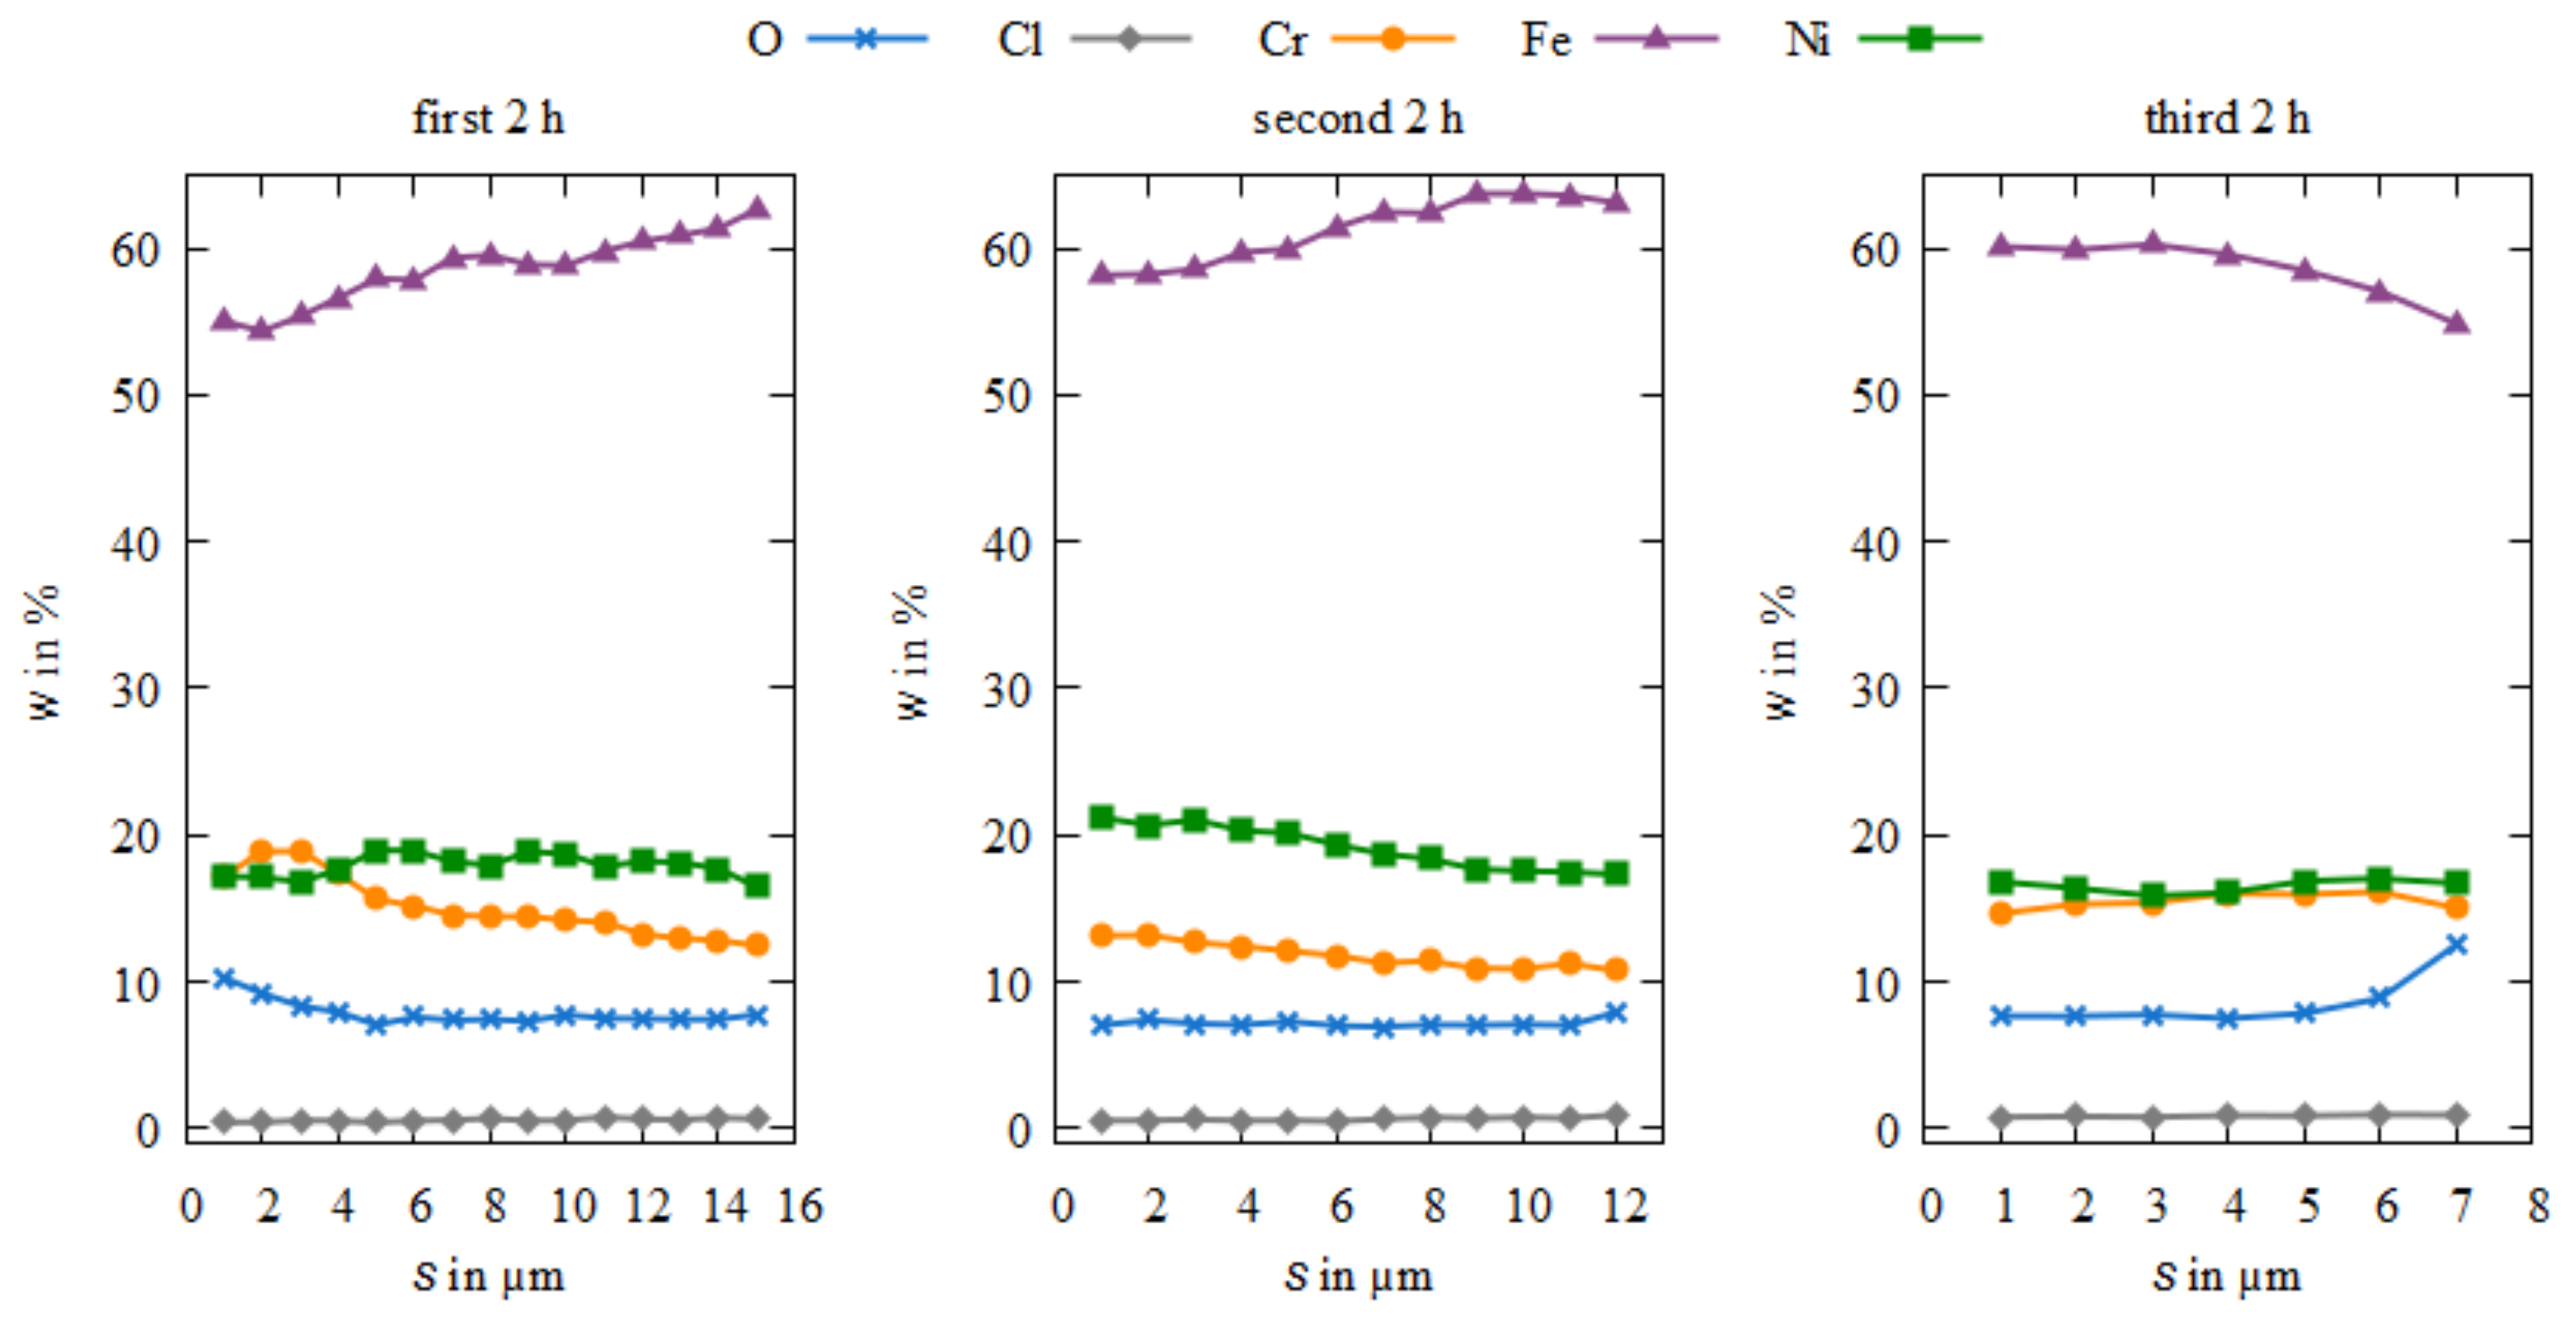
Figure 13 clearly shows how the applicable coating thickness decreases with increasing duration of electrolyte use. This effect is stronger for ton = 10 s, toff = 5 s than for ton = 5 s, toff = 2 s and decreases from 25 µm for the first coating to 16 µm for the second and third coating. In addition, with the coarser stepping, slightly higher coating thicknesses can be obtained for the same time period. The first layer deposited under these conditions shows few distinct microcracks with locally highly variable iron and chromium contents (see Figure 14). Over the entire thickness, the chromium content drops from wCr ≈ 38% to approximately 20%, while the iron content increases from wFe = 40% to 50%. From this, it can be deduced that the electrolyte requires a run-in period until a constant coating thickness and alloy composition of wFe = 45%, wCr = 25%–30% and wNi = 15% is achieved for the second and third coatings. The second cross-section in Figure 13b shows no microcracks at a coating thickness of about 15 µm. For the third deposition, no microcracks can be documented either, but the coating shows material spalling and, in contrast to the first two coatings, has a rougher and more matte surface. Compared to the coating deposited under DC conditions, all Fe-Cr-Ni coatings deposited under stepped DC show fewer edge effects and the associated detachment of the coating from the copper substrate.
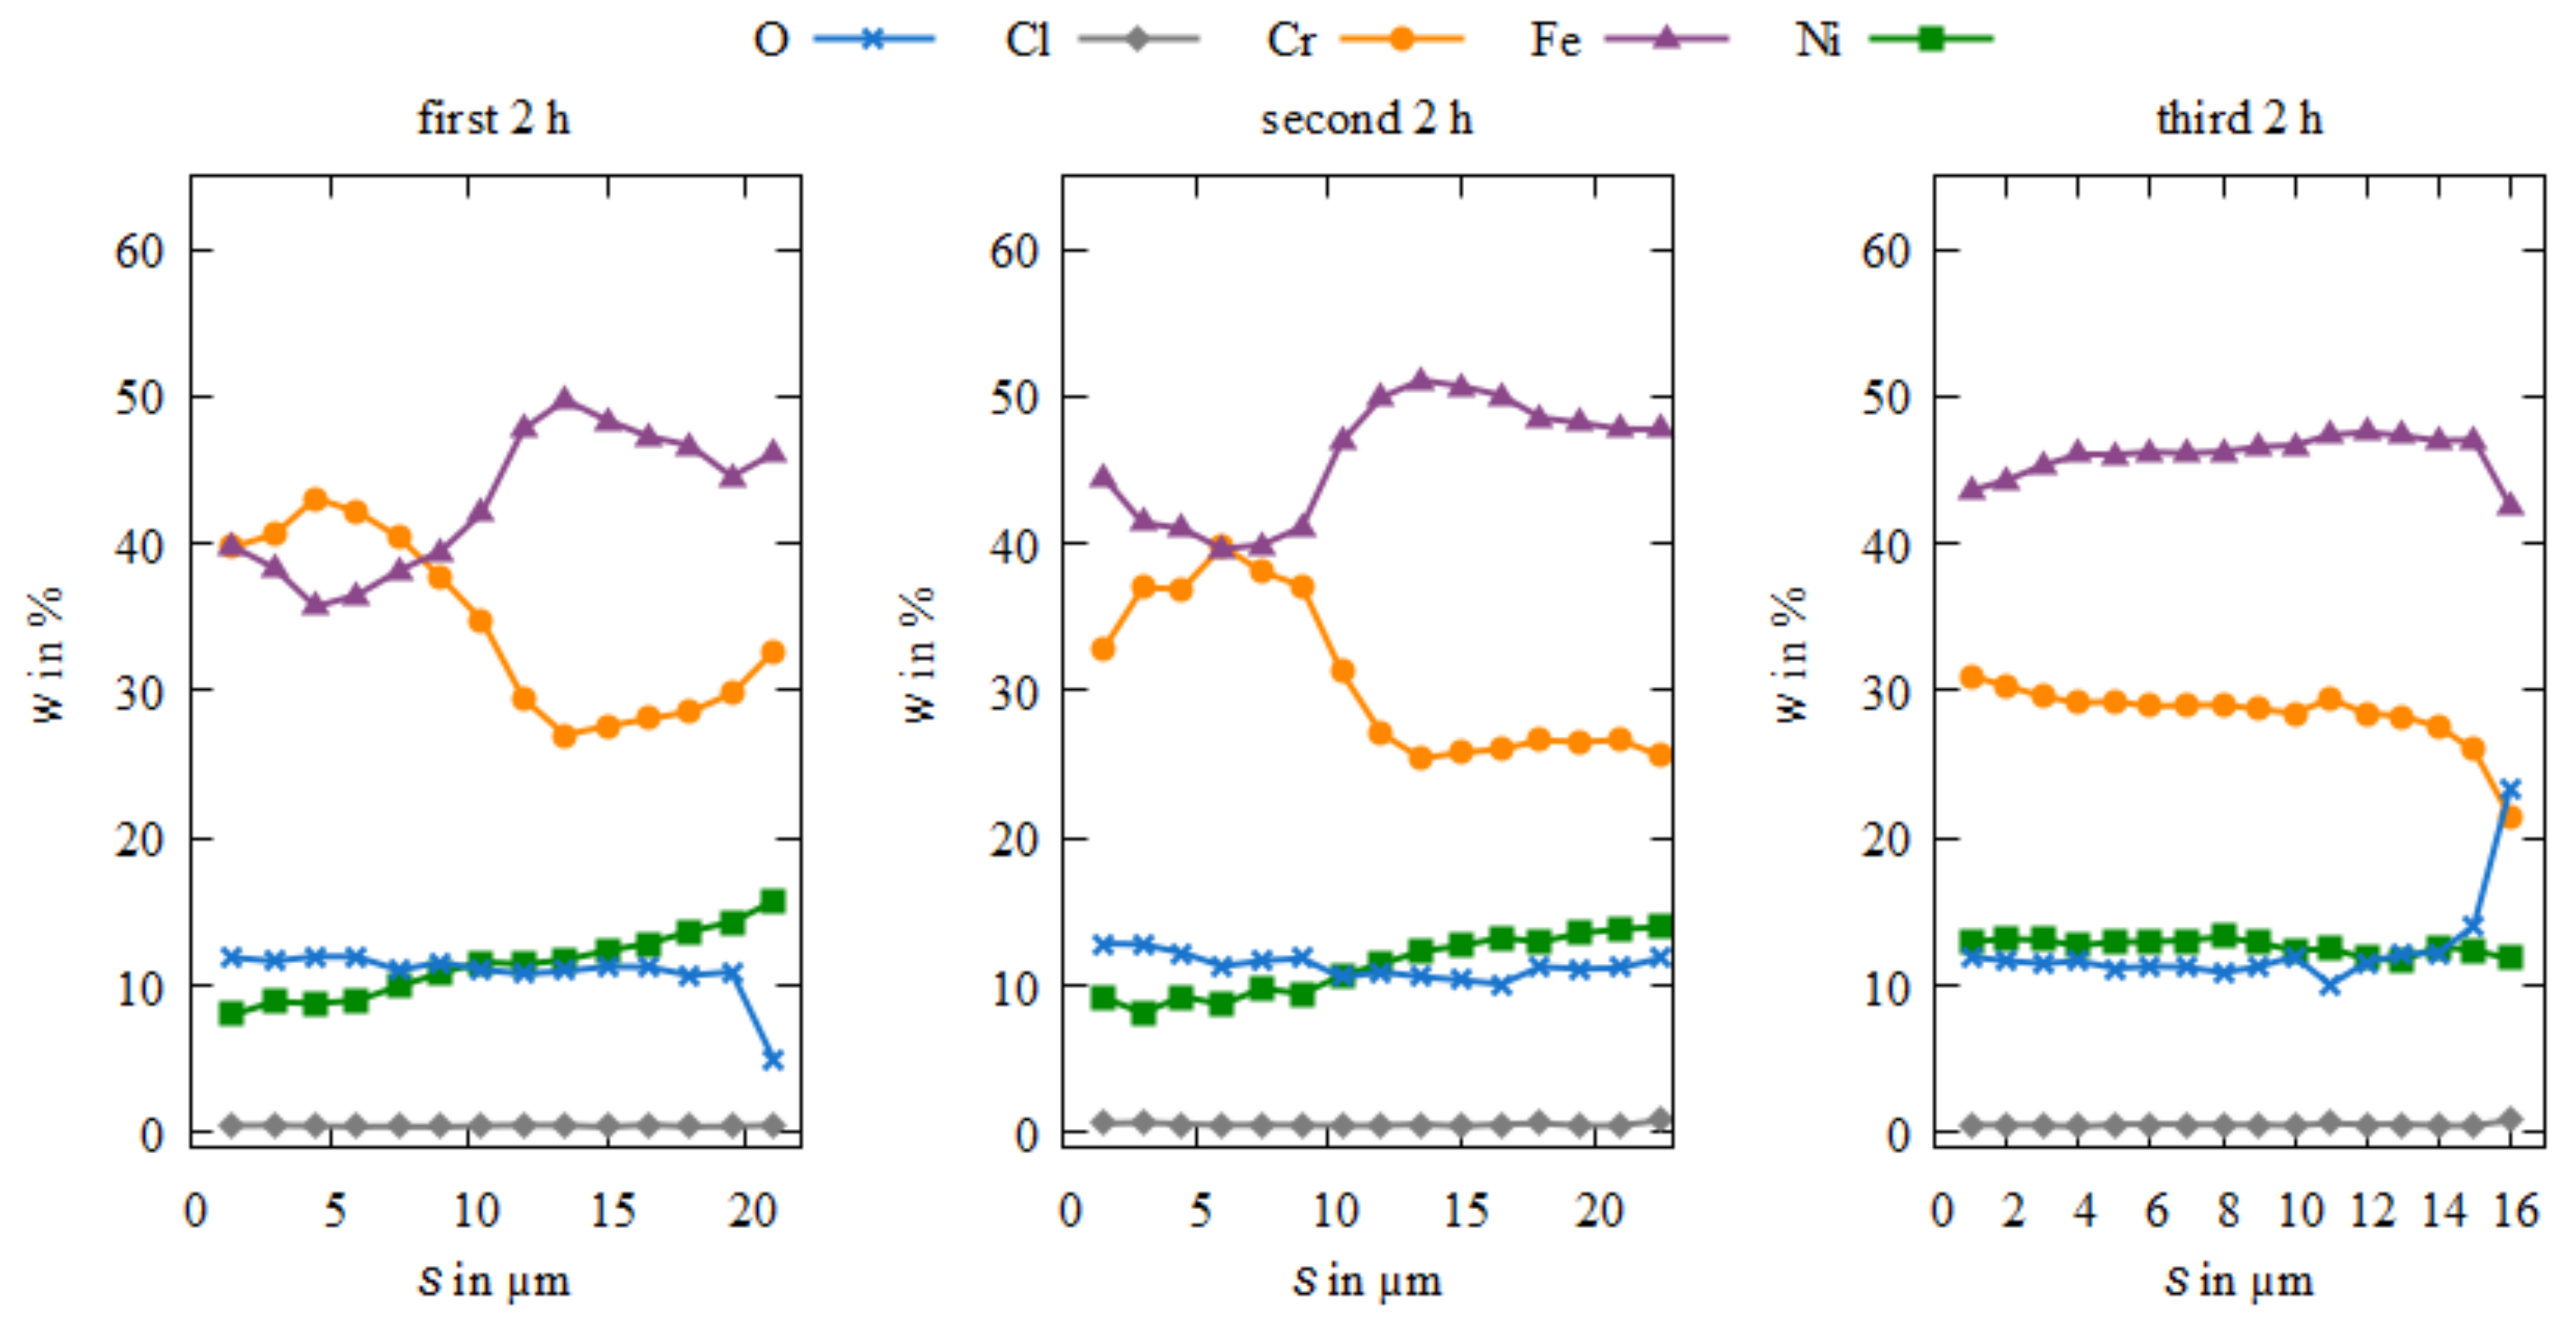
Figure 15 shows a reduction in the deposition rate for the Fe-Cr-Ni coatings deposited under pulsed current over the duration of electrolyte use. While a layer thickness of around 15 µm can still be achieved with the first deposition, it is only 6 µm with the third. The deposition rate has therefore more than halved due to electrolyte aging. At the same time, the crack pattern is refined. The layer shown in Figure 15c with a thickness of only 6 µm is crack-free over the entire cross-section. An explanation for this is provided by the element contents shown in plots of Figure 16. The chromium content is 10% lower in the pulsed-deposited coatings compared with the stepped or conventionally produced coatings. In addition, the low coating thickness leads to low residual stresses, which are below the crack-inducing value. Pulsed deposition apparently hinders the deposition of chromium, while it favors that of iron. The oxygen, and chlorine contents are at the same levels as for the coatings discussed previously (10%, and 1% respectively). The Ni content is somewhat higher at about wNi = 20%. It can be concluded that these contents in the Fe-Cr-Ni layers are independent of both the duration of 6 h of electrolyte use and the selected current mode.
The chemical compositions measured here correspond on average to those from the studies by Hasegawa et al. and Bertero et al. [9,16,17,18]. Only the chromium content of the coatings deposited under pulsed current was lower but with values similar to the ones in the study by Adelkhani et al. [19]. However, it should be noted that Adelkhani et al. used a different electrolyte than in the present study.

4. Discussion

During the electrodeposition of chromium (III) alloys, Gabe assumed that high overvoltage occurs, leading to an increase in pH value at the cathode and to the formation of chromium hydrides [7]. These chromium hydrides are co-deposited in the layers during the electroplating process. Due to their hexagonal close-packed lattice structure (hcp) and instability, they rapidly decompose during the deposition process to metallic chromium, which has a body-centered cubic lattice structure (bcc). During this phase transition, the phase volume shrinks by about 15%, which leads to high residual stresses and consequently to the formation of cracks in the layer [7]. It is also conceivable that the chromium hydrides decompose again on the cathode surface during the pause times in the stepped DC depositions and that residual stresses that have already arisen during deposition are relieved.
The comparison of the DC pH curves with those of the stepped DC shows that a regular interruption of the deposition process keeps the pH value at the surface lower. This ensures that during the pauses, the pH at the cathode approaches that of the electrolyte. Since at the beginning of the deposition with DC, the pH rises steeply for 30 s, whereas with stepped DC, this high pH level is not reached, and the electrolyte equilibrium is kept constant in which the metal species that must be reduced for deposition do not accumulate in the double layer. Thus, thick and less cracked layers can be produced. Another negative effect in the electrodeposition of chromium from chromium (III) electrolytes is the decrease in the deposition rate at high current densities. In a 2018 study, the pH change at the cathode surface was measured at different current densities [15]. In the experiments conducted there, the near-surface pH ranged from about 3.8 at a current density of 1 A/dm2 to 6.8 at 12 A/dm2. After the current was turned off, the pH at the surface decreased and approached that of the bulk electrolyte of 3.2. At a current density of 4 A/dm2 and above, a pH value of 5 is present at the cathode surface. The critical pH value at which most of the chromium (III) is present as chromium hydroxide is nearly 5. Chromium hydroxide cannot be reduced to chromium metal. The higher the current density, the higher the pH value and the fewer chromium (III) ions are available in the electrolyte [15]. This chromium hydroxide precipitates in the electrolyte. Since in the experiments with the electrolyte used in this study the near-surface pH value rose to a maximum of 2.6, an increase in the deposition rate with increasing current density and no precipitate was observed in the electrolyte bath, the formation of chromium hydroxide can be safely excluded here. Therefore, it can be concluded that a very low initial pH of the bulk electrolyte is well suited to avoid chromium hydroxide even at very high current densities.
Scanning electron micrographs of the coatings show that with an increasing duration of electrolyte use, the coating thickness changes. An examination of the cross-sections shows various visual appearances of the alloy layer, depending on the used current mode and current density. The depositions show changed types of cracking (vertical, horizontal and chipping). In ordinary Cr coatings, vertical cracks are typical and decisive. Exclusively vertical cracks are rather uncommon; therefore, their formation and effects are still insufficiently understood and therefore part of future research. However, it is clearly recognizable that microcracks, which are typical for chromium coatings, cannot be seen on different specimens depending on the selected current mode and electrolyte age. A very uniform appearance with few microcracks is shown by the layers with a stepped DC deposition of ton = 10 s, toff = 5 s and ton = 5 s, toff = 2 s. The simultaneous observation of a constant pH at the cathode surface in these layers suggests reduced chromium hydride formation. Especially for the crack-free Fe-Cr-Ni layers, no increase in pH could be measured at all. It remained at the value of 1.1 previously set in the bulk electrolyte. The pH at the stepped DC deposition (ton = 5 s, toff = 2 s) increased from 1.1 to about 1.5, probably allowing for the formation of chromium hydrides, as indicated by a slightly higher crack density. The pH in a PC deposition also shows no increase on average, but strong fluctuations that could allow chromium hydride formation. The pH electrode is most likely too slow to measure these fast pH changes accurately. Presumably, the pause times are too short to keep the pH value constant, which would explain the cracking despite the lower chromium content in the layers.
Based on the oxygen and chlorine contents, a reduced co-deposition of fragments of the organic additives in the layers due to stepped DC deposition cannot be deduced. Therefore, only a minor influence of the two elements on the cracking of the Fe-Cr-Ni coatings must be assumed.

5. Conclusions

Near-surface in situ pH measurements on the cathode during electrodeposition of a Cr(III)-based Fe-Cr-Ni electrolyte for various current modes were performed. The aim of the study was to analyze the amount of pH increase and identify its influence on the microstructure of the deposited layers. Furthermore, the influence of the current mode on the alloy composition was investigated.
The work shows that it was possible to avoid a near-cathode surface rise in pH by stepped DC deposition using ton = 10 s, toff = 5 s. The films produced under this stepped DC are thick and with very few cracks up to completely crack-free Fe-Cr-Ni alloy coatings with a largely uniform alloy composition. Additionally, stepped DC depositions with ton = 5 s, toff = 2 s show a very homogeneous alloy composition and crack-free coatings with a shiny metallic gray color surfaces. In comparison, the near-cathode surface measurements show a significant increase in pH using direct current. As expected, the pH increased with the current density used. The coatings formed under direct current showed a pronounced cracking pattern with an inhomogeneous alloy composition. The results prove that by stepped DC deposition, it is possible to successfully regulate the pH at the cathode surface and thus limit chromium hydride formation. This can lead to a reduction of residual stresses in the layers and thus to a reduction in crack formation.

Author Contributions

Conceptualization, V.M.; methodology, V.M. and D.H.; validation, V.M. and D.H.; formal analysis, V.M., D.H., and T.M.; investigation, V.M. and D.H.; writing—original draft preparation, V.M.; writing—review and editing, D.H., T.M., and T.L.; supervision, T.M. and T.L.; project administration, V.M., D.H., T.M., and T.L. All authors have read and agreed to the published version of the manuscript.

Funding

Funded by the Deutsche Forschungsgemeinschaft (DFG, German Research Foundation) project number 491193532 and the Chemnitz University of Technology.

Institutional Review Board Statement

Not applicable.

Informed Consent Statement

Not applicable.

Data Availability Statement

The data presented in this study are available on request from the corresponding author.

Acknowledgments

The authors acknowledge the support from the Institute of Materials Science and Engineering at the Chemnitz University of Technology.

Conflicts of Interest

The authors declare no conflict of interest.

References

  1. Simão, J.; Aspinwall, D.K. Hard chromium plating of EDT mill work rolls. J. Mater. Process. Technol. 1999, 92–93, 281–287. [Google Scholar] [CrossRef]
  2. Podgornik, B.; Massler, O.; Kafexhiu, F.; Sedlacek, M. Crack density and tribological performance of hard-chrome coatings. Tribol. Int. 2018, 121, 333–340. [Google Scholar] [CrossRef]
  3. Regulation (EC) No 1907/2006 of the European Parliament and of the Council of 18 December 2006 concerning the Registration, Evaluation, Authorisation and Restriction of Chemicals (REACh), Establishing a European Chemicals Agency, Amending Directive 1999/4. 2017, 10, 1–21. Available online: http://data.europa.eu/eli/reg/2006/1907/2021-10-01 (accessed on 18 September 2022).
  4. Pfeiffer, W.; Koplin, C.; Reisacher, E.; Wenzel, J. Residual stresses and strength of hard chromium coatings. Mater. Sci. Forum 2011, 681, 133–138. [Google Scholar] [CrossRef]
  5. Thompson, M.; Connick, R.E. Hydrolytic polymerization of chromium(III). 1. Two dimic specis. Inorg. Chem. 1981, 1443, 2279–2285. [Google Scholar] [CrossRef]
  6. El-Sharif, M.; McDougall, J.; Chisholm, C.U. Electrodeposition of thick chromium coatings from an environmentally acceptable chromium (III)-glycine complex. Trans. Inst. Met. Finish. 1999, 77, 139–144. [Google Scholar] [CrossRef]
  7. Gabe, D.R. The role of hydrogen in metal electrodeposition processes. J. Appl. Electrochem. 1997, 27, 908–915. [Google Scholar] [CrossRef]
  8. Meinhold, V.; Höhlich, D.; Dittes, A.; Mehner, T.; Lampke, T. Electrodeposition of FeCrNi and FeCr alloys and influence of heat treatment on microstructure and composition. IOP Conf. Ser. Mater. Sci. Eng. 2021, 1147, 012003. [Google Scholar] [CrossRef]
  9. Hasegawa, M.; Yoon, S.; Guillonneau, G.; Zhang, Y.; Frantz, C.; Niederberger, C.; Weidenkaff, A.; Michler, J.; Philippe, L. The electrodeposition of FeCrNi stainless steel: Microstructural changes induced by anode reactions. Phys. Chem. Chem. Phys. 2014, 16, 26375–26384. [Google Scholar] [CrossRef] [PubMed]
  10. El-Sherik, A.; Erb, U.; Palumbo, G.; Aust, K. Deviations from hall-petch behaviour in as-prepared nanocrystalline nickel. Scr. Metall. Mater. 1992, 27, 1185–1188. [Google Scholar] [CrossRef]
  11. Lin, K.L.; Hsu, C.J.; Hsu, I.M.; Chang, J.T. Electroplating of Ni-Cr on steel with pulse plating. J. Mater. Eng. Perform. 1992, 1, 359–361. [Google Scholar] [CrossRef]
  12. Ahmadi, K.; Dole, N.; Karadavut, O.; Hernandez, F.R.; Hall, T.D.; Taylor, E.J.; Brankovic, S.R. Crack free Cr coatings from Cr3+ electrolyte. J. Electrochem. Soc. 2022, 169, 012504. [Google Scholar] [CrossRef]
  13. Meinhold, V.; Höhlich, D.; Mehner, T.; Lampke, T. Electrodeposition of thick and crack-free Fe-Cr-Ni coatings from a Cr (III) electrolyte. Coatings 2022, 12, 56. [Google Scholar] [CrossRef]
  14. Danilov, F.I.; Protsenko, V.S.; Butyrina, T.E.; Krasinskii, V.A.; Baskevich, A.S.; Kwon, S.C.; Lee, J.Y. Electrodeposition of nanocrystalline chromium coatings from cr(iii)-based electrolyte using pulsed current. Prot. Met. Phys. Chem. Surf. 2011, 47, 598–605. [Google Scholar] [CrossRef]
  15. Leimbach, M.; Tschaar, C.; Schmidt, U.; Bund, A. Electrochemical characterization of chromium deposition from trivalent solutions for decorative applications by EQCM and near-surface pH measurements. Electrochim. Acta 2018, 270, 104–109. [Google Scholar] [CrossRef]
  16. Bertero, E.; Hasegawa, M.; Staubli, S.; Pellicer, E.; Herrmann, I.K.; Sort, J.; Michler, J.; Philippe, L. Electrodeposition of amorphous Fe-Cr-Ni stainless steel alloy with high corrosion resistance, low cytotoxicity and soft magnetic properties. Surf. Coat. Technol. 2018, 349, 745–751. [Google Scholar] [CrossRef]
  17. Bertero, E.; Manzano, C.V.; Pellicer, E.; Sort, J.; Ulfig, R.M.; Mischler, S.; Michler, J.; Philippe, L. “Green” Cr(III)-glycine electrolyte for the production of FeCrNi coatings: Electrodeposition mechanisms and role of by-products in terms of coating composition and microstructure. RSC Adv. 2019, 9, 25762–25775. [Google Scholar] [CrossRef] [PubMed] [Green Version]
  18. Bertero, E.; Manzano, C.V.; Bürki, G.; Philippe, L. Stainless steel-like FeCrNi nanostructures via electrodeposition into AAO templates using a mixed-solvent Cr(III)-based electrolyte. Mater. Des. 2020, 190, 108559. [Google Scholar] [CrossRef]
  19. Adelkhani, H.; Arshadi, M.R. Properties of Fe-Ni-Cr alloy coatings by using direct and pulse current electrodeposition. J. Alloys Compd. 2009, 476, 234–237. [Google Scholar] [CrossRef]
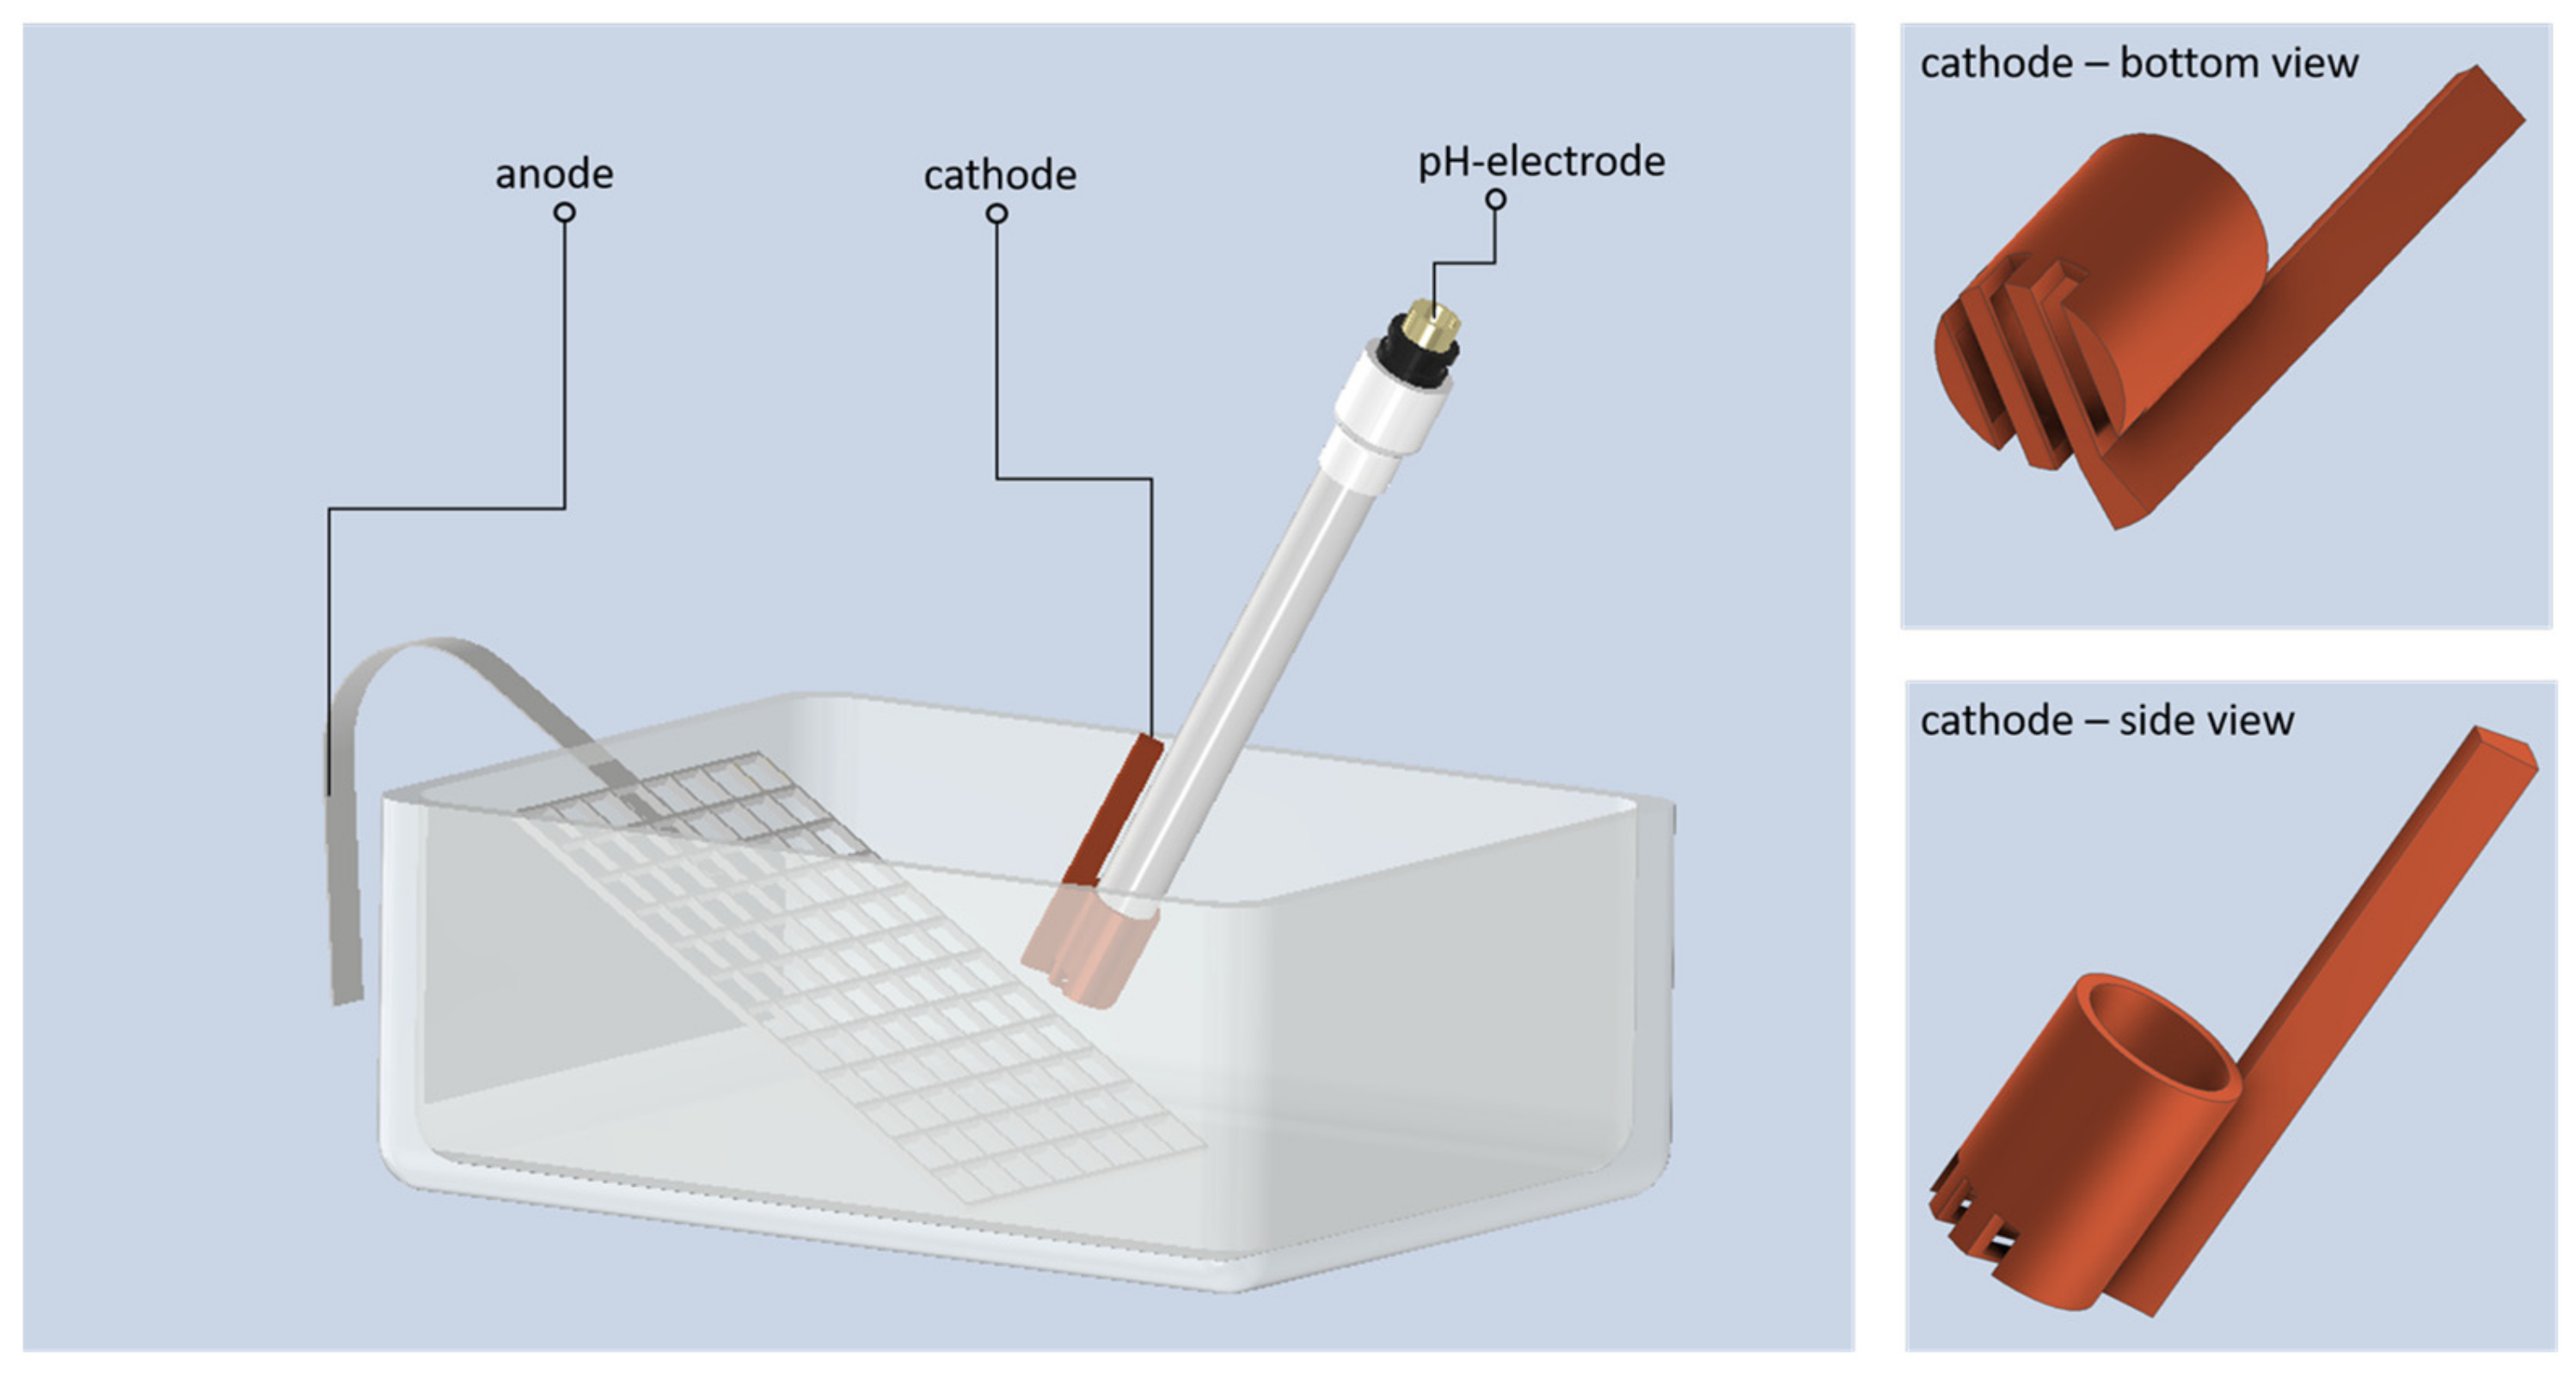
Figure 1. Experimental setup and sample geometry of the in situ pH measurement during the electrodeposition process.
Coatings 12 01569 g001
Figure 2. Method of area analysis (white) and method of point-like analyses (red) of EDXS measurements.
Coatings 12 01569 g002
Figure 3. Change in pH value of electrolyte at rest over time, 15 min after preparation and after stirring for 48 h.
Coatings 12 01569 g003
Figure 4. Near-surface pH in Fe-Cr-Ni electrolyte (fresh: first 30 min, used: second 30 min) over a period of 30 min for different DC densities. (a) depositions with DC 6 A/dm2; (b) depositions with DC 12 A/dm2; (c) depositions with DC 18 A/dm2.
Coatings 12 01569 g004
Figure 5. Near-surface pH in Fe-Cr-Ni electrolyte (fresh: first 30 min, used: second 30 min) over a period of 30 min for different DC current steps at 12 A/dm2. (a) depositions with stepped DC ton = 10 s, toff = 10 s; (b) depositions with stepped DC ton = 10 s, toff = 5 s; (c) depositions with stepped DC ton = 5 s, toff = 2 s; (d) depositions with stepped DC ton = 2 s, toff = 1 s.
Coatings 12 01569 g005
Figure 6. Near-surface pH in Fe-Cr-Ni electrolyte (fresh: first 30 min, used: second 30 min) over a period of 30 min for PC at 12 A/dm2.
Coatings 12 01569 g006
Figure 7. SEM micrographs of cross-sections of electrodeposited Fe-Cr-Ni coatings under DC 12 A/dm2 conditions for three depositions (a) first deposition (2 h of electrolyte use) with clear material chipping; (b) second deposition (4 h of electrolyte use) with horizontal microcracks; and (c) third deposition (6 h of electrolyte use) with clear vertical microcracks.
Coatings 12 01569 g007
Figure 8. EDXS measurement of alloy compositions (mass fractions w) over the entire layer thickness (s—distance from the substrate) of the DC 12 A/dm2 samples depending on the electrolyte aging.
Coatings 12 01569 g008
Figure 9. SEM micrographs of cross-sections of electrodeposited Fe-Cr-Ni coatings under DC 18 A/dm2 conditions for three depositions (a) first deposition (2 h of electrolyte use) with microcracks; (b) second deposition (4 h of electrolyte use) with microcracks; and (c) third deposition (6 h of electrolyte use) with horizontal microcracks.
Coatings 12 01569 g009
Figure 10. EDXS measurement of alloy compositions over the entire layer thickness of the DC 18 A/dm2 samples depending on the electrolyte aging.
Coatings 12 01569 g010
Figure 11. SEM micrographs of cross-sections of electrodeposited Fe-Cr-Ni coatings under stepped DC ton = 5 s, toff = 2 s conditions for three depositions: (a) first deposition (2 h of electrolyte use) with several narrow microcracks; (b) second deposition (4 h of electrolyte use) with several microcracks; and (c) third deposition (6 h of electrolyte use) with a several very narrow microcracks.
Coatings 12 01569 g011
Figure 12. EDXS measurement of alloy compositions over the entire layer thickness of the stepped DC ton = 5 s, toff = 2 s samples depending on the electrolyte aging.
Coatings 12 01569 g012
Figure 13. SEM micrographs of cross-sections of electrodeposited Fe-Cr-Ni coatings under stepped DC ton = 10 s, toff = 5 s conditions for three depositions: (a) first deposition (2 h of electrolyte use) with microcracks; (b) second deposition (4 h of electrolyte use) without any microcracks; and (c) third deposition (6 h of electrolyte use) with some material chipping.
Coatings 12 01569 g013
Figure 14. EDXS measurement of alloy compositions over the entire layer thickness of the stepped DC ton = 10 s, toff = 5 s samples depending on the electrolyte aging.
Coatings 12 01569 g014
Figure 15. Scanning electron microscopy micrographs of cross-sections of electrodeposited Fe-Cr-Ni coatings under PC conditions for three depositions: (a) first deposition (2 h of electrolyte use) with clear microcracks; (b) second deposition (4 h of electrolyte use) with several microcracks; and (c) third deposition (6 h of electrolyte use) with only a small layer thickness but without any microcracks.
Coatings 12 01569 g015
Figure 16. EDXS measurement of alloy compositions over the entire layer thickness of the PC samples depending on the electrolyte aging.
Coatings 12 01569 g016
Table 1. Electrolyte composition.
ChemicalsFormulaConcentration
(mol/L)(g/L)
Iron(II) chlorideFeCl2·4H2O0.035.96
Chromium(III) chlorideCrCl3·6H2O0.40106.58
Nickel(II) chlorideNiCl2·6H2O0.2033.28
GlycineC2H5NO20.4030.03
Ammonium chlorideNH4Cl0.5026.75
Boric acidH3BO30.159.27
Sodium chlorideNaCl0.5029.22
Table 2. Coating parameters.
ParametersValue
Effective coating time (min)120
Temperature (°C)23
Anode-cathode distance (mm)20
Area ratio anode: cathode6:1
Bath volume (mL)250
Bath movement (rpm)150
pH1.1
Table 3. Layer thicknesses d and microcrack density Md (counted number of cracks per 1000 µm) of DC coatings determined by optical microscopy.
SamplesLayer Thickness
Microcrack Density
Coating 1Coating 2Coating 3
DC_6d (µm)1.8 ± 0.515.1 ± 2.812.5 ± 2.8
Mdnot measurable2659
DC_12d (µm)10.2 ± 1.215.4 ± 2.330 ± 5
Md312850
DC_18d (µm)27 ± 526.6 ± 2.320 ± 4
Md527178
Table 4. Layer thicknesses d and microcrack density Md (number of cracks per 1000 µm) of stepped DC coatings determined by optical microscopy.
SamplesLayer Thickness
Microcrack Density
Coating 1Coating 2Coating 3
Step_2/1d (µm)18.1 ± 1.817.9 ± 1.312.5 ± 2.0
Md422116
Step_5/2d (µm)16.5 ± 1.517.8 ± 2.614 ± 4
Md283126
Step_10/5d (µm)22.5 ± 1.414.1 ± 2.116.2 ± 1.9
Md56022
Step_10/10d (µm)13.1 ± 0.513 ± 422.8 ± 1.3
Md362147
Table 5. Layer thicknesses d and microcrack density Md (number of cracks per 1000 µm) of PC coatings determined by optical microscopy.
SamplesLayer Thickness
Microcrack Density
Coating 1Coating 2Coating 3
PCd (µm)15.3 ± 1.212.5 ± 1.16.7 ± 1.2
Md24260
Publisher’s Note: MDPI stays neutral with regard to jurisdictional claims in published maps and institutional affiliations.