Abstract
The dynamic response of complex equipment under mixed-mode loading is significant for structural design. Bolted joints are the primary connection mode of subsystem assembly, and the degradation of bolted joints may reduce the safety and reliability of the equipment. The Iwan model is widely used to describe the degradation of bolted joints, which has been continuously revised and experimentally verified. The classic Iwan model is a static model that lacks predictive ability. The latest dynamic Iwan model can predict the softening process and reveal the physical mechanism of degradation. However, the function of dynamic pressure distribution needs to be determined for the model solution. We analyzed the contact boundary and pressure distribution under mixed-mode loading with the finite element method (FEM) and proposed the dynamic functions. Secondly, we put forward two correction methods to compensate for the loss of preload caused by simplification and to achieve consistency between the pressure distribution function and the contact boundary function. Finally, the influence of discrete order on the correction of pressure distribution was analyzed. The results show that the constraint method is more suitable for the modification of the pressure distribution. The research results can be applied to the solution of the dynamic Iwan model.
1. Introduction
Bolted joints are indispensable elements in mechanical systems, as shown in Figure 1a. The stiffness of bolted joints depends on the amplitude of oscillatory displacements, and the energy dissipation caused by the friction mechanism dominates the structural damping, reaching 90% of the total damping [1,2]. Due to the presence of friction at joint interfaces, the dynamic behavior of joint structures is nonlinear and shows stiffness softening and energy dissipation [3]. The tangential stiffness softening is accompanied by the evolution of contact conditions. The evolution of contact states can be divided into four stages [4]: sticking, microslip, macroslip, and pinning by bolt shank. The relationship between stiffness softening and evolution is shown in Figure 1b, and the stiffness degradation occurs in the microslip. In addition, the evolution of the contact conditions may result in the instability of mechanical systems [5,6,7]. Therefore, a constitutive model is required to describe and predict the softening process to reduce the impact of the stiffness degradation of bolted joints in the design.

Figure 1.
The stiffness degradation of bolted joints: (a) bolted joints; (b) the stiffness degradation.
In the past decades, scholars have conducted a great deal of research on joints under different loadings [8,9,10,11], and several dynamic friction models have been developed to represent the nonlinear degradation of the bolted joint. The Iwan model was first proposed by S. P. Timoshenko to characterize the elastic–plastic behavior of materials and was later extended by Iwan to describe the nonlinear degradation behavior of bolted joints [12]. The Dahl model [13] is designed based on the dynamic friction experiments of the servo systems to simulate a symmetrical hysteresis loop. The Bristle model [14] assumes contact as two rigid bodies contacted by elastic bristles, namely elastic bristles and rigid bristles. Haessig and Friedland developed a bristle model to characterize random behavior and a reset-integral model to describe bristle aggregation behavior [15]. Based on the Dahl and the Bristle models, the LuGre model [16,17] was developed to characterize the static friction force and the Stribeck phenomenon. The Valanis model [18] can describe the evolution of the micro- and macro-slip and reproduce the response under mixed-mode loadings, which is widely used in plasticity.
The Iwan model is widely used in joint dynamics for its ability to reproduce the elastoplastic features in the stiffness softening and has been developed continuously. The core of the Iwan model is the elastic–plastic elements consisting of springs and sliders. The theoretical degradation curve of the joint can be derived by solving the density function of the critical yield force of the elements. Therefore, the core of the Iwan model is the density function of the yield force, and its parameters are identified by fitting the experimental results in the classical Iwan model. In recent years, the Iwan model and its density function (DF) have been revised. Song [19] proposed a modified Iwan model with an individual linear spring to characterize the residual stiffness in microslip. Segalman [20] designed the BMD experimental device to study the power–law relationship between energy dissipation and load amplitude and proposed the truncated power law density function to describe the power–law feature in energy dissipation. Li et al. [21] improved the truncated DF of the Segalman model and proposed a six-parameter DF that can reproduce the energy dissipation and residual stiffness characteristic. The earlier studies have advanced the development of the Iwan model, but in general, they all lack predictive ability and physical mechanisms.
Among the latest research, a new method for establishing the Iwan model is proposed, which improves the prediction ability and physical mechanism. Li et al. first proposed a technique of identifying the DF by Coulomb friction theory [3,22,23]. Zhao et al. [24] applied this method and performed a verification experiment.
However, the basic assumption of this method is that the pressure distribution remains constant under mixed-mode loading. Wang et al. [25] found that the assumption was not tenable and proposed a new approach to solve the DF by discretizing the dynamic contact region. This method provides a technique to solve the DF under mixed-mode loading without the assumption of constant pressure. However, one of the prerequisites is to establish a function to describe the dynamic pressure distribution under mixed-mode loading. The key point of the new model is the function describing the dynamic pressure distribution.
Many scholars have studied the pressure distribution on the inter-plate surface of bolted joints. Ito et al. [26] applied the ultrasonic to the pressure distribution of the flange and reached two conclusions: the pressure distribution is related to the surface roughness, and the contact area is larger than the theoretical analysis results. Mantelli et al. [27] applied a pressure-sensitive film to measure the pressure distribution of bolted joints and analyzed the applicability of various theoretical models. The non-invasive feature of the ultrasonic method has attracted many researchers. Many scholars have also conducted research using this method. Many studies based on ultrasonic methods have been carried out [28,29,30]. However, the ultrasonic method also has certain limitations, and the pressure measurement will be seriously interfered with by the nut-plate surface. Thus, the bolted joints are usually redesigned before measurement. In addition, there is currently no experimental protocol for measuring the pressure distribution of bolted joints under mixed-mode loading conditions. Therefore, the finite element method is widely used in the pressure distribution of bolted joints [19,31,32,33].
This paper aims to study the law of contact pressure under mixed-mode loading and establish the dynamic pressure distribution function. We analyzed the variation law of the contact boundary and the pressure amplitude with the load, respectively. Two functions are proposed to describe the contact boundary and pressure distribution, and the correction methods unifying the two functions are proposed and analyzed. The functions and methods in this paper can provide a basis for the DF solution of the dynamic Iwan model.
2. Dynamic Density Function Modeling Technique
The classic Iwan model is composed of
Jenkins elements, as shown in Figure 2a [25]. The Jenkins element is composed of a spring with stiffness
and a friction resistor with critical sliding force
in series. The Jenkins element is an ideal piecewise unit that can reproduce either slip or stick [3]. In the dynamic DF modelling technique, the yield force of each Jenkins element is related to the contact pressure by Coulomb friction law, as shown in Figure 2b.
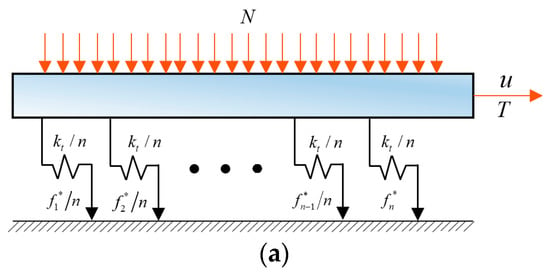
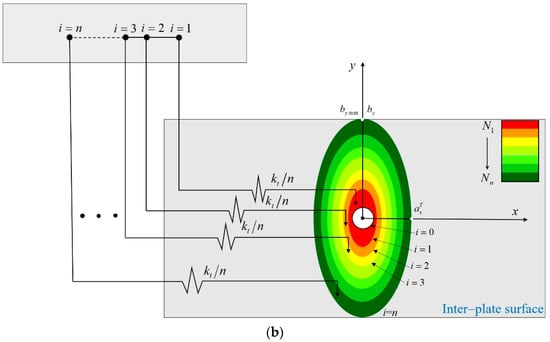
Figure 2.
The dynamic Iwan modelling technique: (a) the constitutive model of the Iwan model; (b) the relationship between Jenkins elements and contact pressure. ( is the semi-minor axis of the outermost elliptical contact boundary; is the semi-major axis in microslip).
The function of contact boundary in microslip is [25]:
The ellipticity of the
ellipse is
linearly increasing from 1 to with the increase of
from 0 to
. Therefore, the
can be expressed as:
The semi-minor axis
and semi-major axis
of the
ellipse is:
Then, the area of the
sliding area is:
The elliptic discrete method sacrifices part of the preload, and the pressure needs to be corrected based on the bolt preload. The corrected pressure distribution is:
where
is the angle with the x-axis, and is the pressure distribution before correction at angle
.
The normal load of the sliding area is:
Thus, the friction shear stress
of the
sliding area is:
When
tends to infinite, the DF of friction shear stress
can be deduced by normalization and derivation. Additionally, the DF of the yield force in Iwan model can be obtained through the mapping relationship as:
where is the mapping parameter.
In the dynamic DF solution, it is necessary to determine the dynamic function expressions of the contact pressure. In this paper, the relationship between the contact pressure and the tangential force is studied based on the modeling method in the Ref. [25].
3. Functional Representation
3.1. Functional Representation of Contact Boundary
The contact boundary function is:
where
and
are the coordinates as shown in Figure 2b.
The semi-minor axis decreases nonlinearly and the semi-major axis increases linearly as:
where
,
,
,
and
are parameters to be identified,
, and
is the maximum of
.
The total contact area
is:
where
is the radius of screw hole.
When the bolt preload is 1000 N and the friction coefficient is 0.6, the relationship between the tangential load and the contact boundary parameters is shown in Figure 3. It can be concluded from Figure 3a,b that Equation (10) has a good description for the variation law of the contact boundary. The correlation between the total contact area
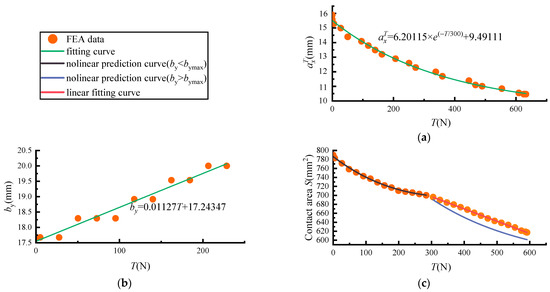
Figure 3.
Theoretical curve and calculation data: (a) relationship between and ; (b) relationship between and ; (c) relationship between and .
and the finite element calculation results is shown in Figure 3c. Before the maximum of
is reached, the total contact area
is basically consistent with the FEA data. After
reaches its maximum
, the theoretical value is slightly lower than the FEA data due to the truncation area near the semi-major axis.
3.2. Functional Representation of Contact Pressure Distribution
The research in Ref. [34] shows that the relationship between the interface pressure
and radius
is Fernlund distributed as:
where
,
,
,
and
are the polynomial coefficients and
is the distance from the edge of the screw hole to the location where the pressure is zero, as shown in Figure 4.
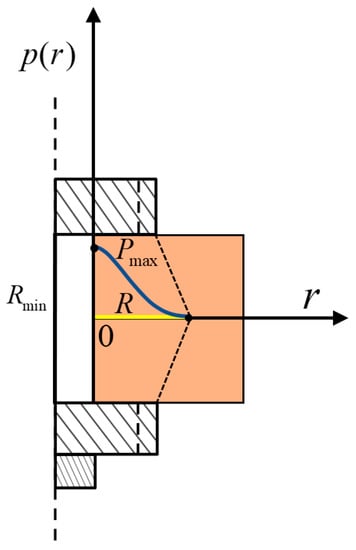
Figure 4.
Schematic diagram of Fernlund pressure distribution.
However, the Fernlund distribution only works for the no-mixed-mode loading case. In the mixed-mode condition, the pressure distribution at different angle θ is different. Therefore, it is necessary to study the relationship between the dynamic pressure distribution
,
and
.
A hypothesis was made that the distribution of contact pressure is centrosymmetric. The pressure distributions at angles of
,
,
, and
were calculated, as shown in Figure 5. Results show that the dynamic pressure distribution follows the Fernlund distribution characteristics at a fixed angle.

Figure 5.
Relationship between pressure and tangential load at different angle. (CPREE is the contact pressure on the inter-plate surface). (a) ; (b) ; (c) ; (d) .
According to Figure 5a, when
, the maximum contact pressure increases linearly, and
decreases nonlinearly. Consequently, the dynamic pressure distribution at
is:
where
is a linear function and
is a nonlinear function.
Based on Equation (10),
is:
The linear function
is:
Submitting Equations (14) and (15) into Equation (13), the dynamic pressure distribution can be obtained as:
When
or
, the peak appears at the edge of the hole and increases linearly with the increase of
.
When
, with the increase of
, the contact pressure at the geometric boundary is no longer zero. This is the main loss of preload in contact boundary theory that needs to be compensated.
The peak value of the contact pressure variation as a function of the included angle
are shown in Figure 6a. There is a linear relationship between the maximum pressure and tangential load, and the slope
decreases as
increases, as shown in Figure 6b.
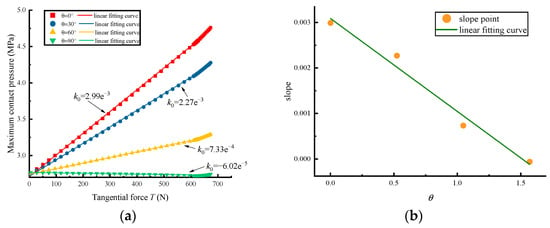
Figure 6.
Variation of the peak pressure: (a) relationship between maximum pressure and tangential force; (b) relationship between k0 and θ.
4. Function Consistency and Preload Compensation
Through the above analysis, the pressure distribution presents different rules at different angles. The pressure and boundary functions have increased the difficulty of solving the DF of the Iwan model. Essentially, the boundary function is an expression for the location at zero pressure. Therefore, the pressure function needs to be reconciled with the boundary function. In addition, since the boundary function is assumed to be elliptical, the preload loss needs to be compensated by modifying the dynamic pressure function.
In conclusion, there are two points that need to be corrected:
- (1)
- Correction of the preload: enforce total normal force equal to bolt preload .
- (2)
- Correction of the initial pressure distribution function at : make the pressure function boundary equal to .
The valid interval of is . There are two correction methods: translation method and constraint method.
4.1. Translation Method
In the translation method, the consistency of the boundary function and pressure function is satisfied by shifting the initial function . The first corrected function is:
According to Equation (17), the second corrected dynamic function is:
Based on Equation (18), the pressure in the sliding area is:
The normal force of the area is , and the total normal force is . Then, the compensation parameter is:
The final dynamic pressure function and normal load of area is:
The parameters of pressure distribution are identified by the finite element calculation, as shown in Table 1.

Table 1.
Parameter identification.
The influence of different discrete orders on the correction results of translation method was analyzed. According to Equation (17) and Table 1, the contact pressure distribution function was obtained. Based on Table 1, the parameters of the discrete regions can be derived, as shown in Table 2.

Table 2.
Parameters of discrete regions ( = 3).
Based on Table 2 and , can be deduced. When tangential force , the curves of and coincide. can be obtained by correcting the normal force. The normal forces of discrete areas before and after correction are shown in Table 3.

Table 3.
Normal forces of discrete areas of translation method , .
Figure 7 shows the pre- and post-corrected distribution curves. The final corrected curve under the dispersion of the third order is very different from the curve of , which means that the compensated pre-tightening force is large.
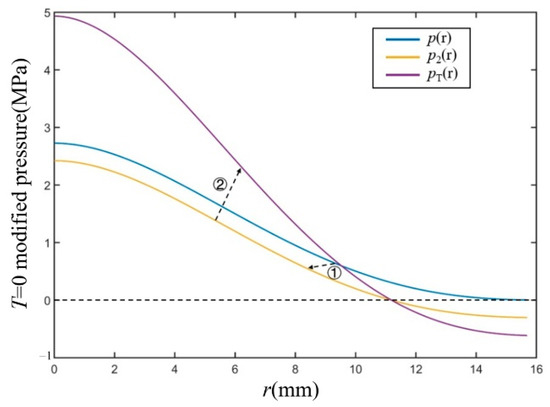
Figure 7.
Pressure distribution curves (, ). ① represents the correction for consistency; ② represents the correction for preload.
Through finite element calculation, microslip occurs when . Therefore, is the solution interval of the dynamic Iwan model. Taking as an example, the semi-major axis, the semi-minor axis and the corresponding area of the discrete area can be deduced, as shown in Table 4.

Table 4.
Geometric parameters of discrete areas (, ).
When , the correction results of normal forces are as shown in Table 5.

Table 5.
Normal forces of discrete areas of translation method (, ).
The corrected curves are shown in Figure 8. The amplitude of the correction is large in the 3rd discrete, and the maximum pressure is raised by about four times.
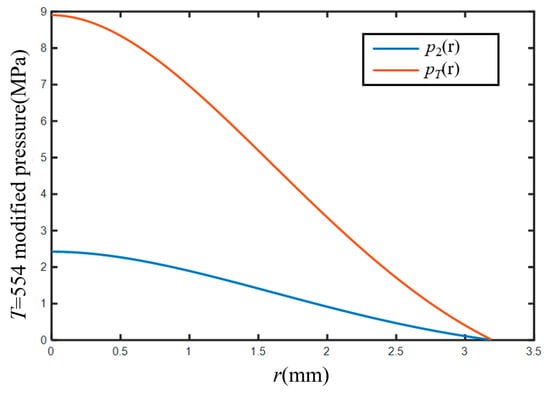
Figure 8.
Pressure distribution curves ( , ).
The influence of discrete order on pressure correction was calculated in two cases of and . The contact pressure curves of higher discrete orders such as 5th, 8th and 100th were calculated, respectively, as shown in Figure 9. It can be seen that for different tangential loads, the higher the discrete order, the smaller the correction amplitude. The pressure curves of the 100th discrete and 1000th discrete were basically the same. That is, the pressure correction curve is stable when the discrete order is high.
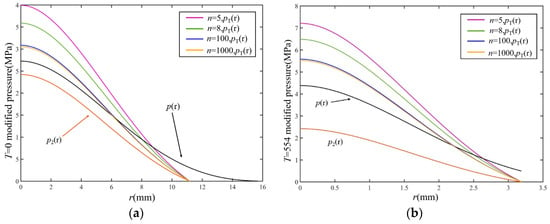
Figure 9.
High-order discrete contact pressure correction curves: (a) ; (b) .
4.2. Constraint Method
In the constraint method, consistency can be achieved by the constraint of parameter identification as . Under the constraint, the initial pressure distribution function is consistent with . The corrected pressure distribution with constraint method is:
Then, the pressure in the discrete region is:
The contact pressure in the region is , and the total contact pressure is . The compensation parameter is:
The dynamic contact pressure distribution and discrete area contact pressure of constraint method are:
The parameters of the constraint method are identified based on FEM results, as shown in Table 6.

Table 6.
Parameters of constraint method.
According to Table 6, the curves of the pre- and post-constrained are plotted in Figure 10. The amplitude of the correction is small, and the nonlinearity of the contact pressure is preserved. Because the quadratic gradient of the Fernlund distribution is equal to 0 at the boundary, the reduction rate of pressure at the end is slow, which is an important source of deviation.
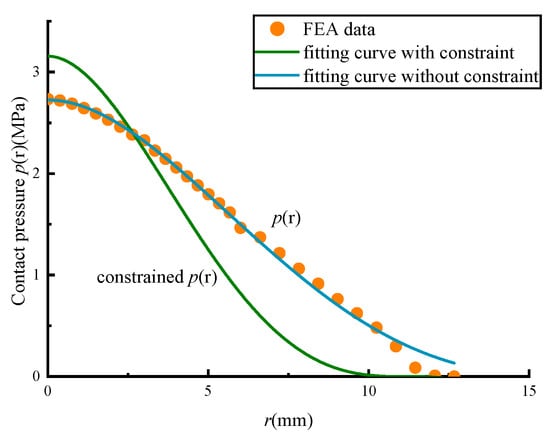
Figure 10.
Corrected pressure distribution with constraint method.
After the preload correction, the total normal force is modified to satisfy the preload, as shown in Table 7. The compensation parameter can be obtained.

Table 7.
Normal forces of discrete areas of constraint method (, ).
The distribution curve before and after the preload correction is shown in Figure 11, where is 2.610.
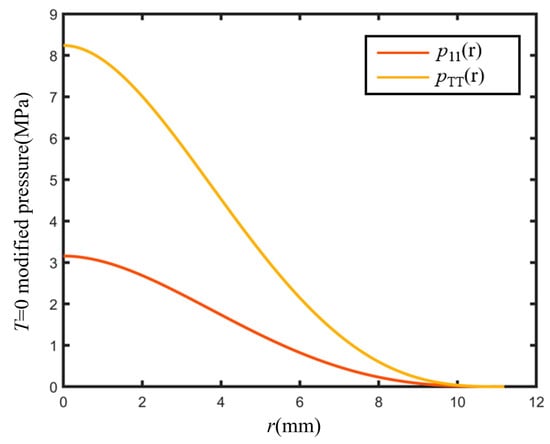
Figure 11.
Third discrete pressure correction curve (, ).
When , the normal force in the discrete area before and after preload correction can be obtained, as shown in Table 8, where is 4.813.

Table 8.
Normal forces of discrete areas of constraint method (, ).
The corrected pressure curves are shown in Figure 12. The correction amplitude is large, and there is obvious deviation.

Figure 12.
Third discrete pressure correction curve (, ).
For the constraint method, the 3rd discretization requires more compensation of contact pressure. The discrete contact pressure curves of higher orders such as 5th, 8th, 100th and 500th order, under a tangential load of and , were calculated. With the increase of , the amplitude of the second correction decreases obviously, and the correction amplitude is basically fixed when the order increases to 100, as shown in Figure 13.
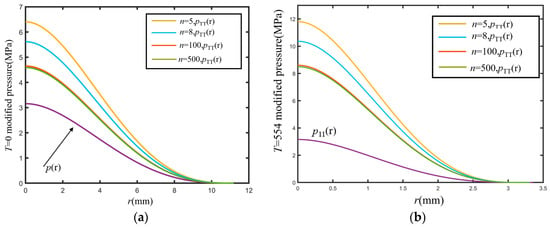
Figure 13.
High-order discrete pressure correction: (a) ; (b) .
5. Discussion
In this paper, dynamic functions of the contact boundary and pressure changing with tangential force have been proposed and verified. The finite element calculation results show that the contact boundary function and the pressure function can well characterize the dynamic characteristics of pressure distribution. However, the elliptical boundary causes the loss of preload which needs to be compensated. Besides, the consistency of the two functions can not be reached due to the different parameter identification, which blocks the solution of the DF of the Iwan model. Therefore, two correction methods are proposed to solve the inconsistency and preload loss. The translation method is to modify the functions obtained by the independent parameter identification. The constraint method is to add the parameter constraints of the boundary function in the parameter identification of the pressure distribution function. Both can solve the inconsistency, and with the increase of the discrete order, the correction results of the two methods tend to be stable. For example, the corrected distribution function of the 100th-order discrete and the 1000th-order discrete are similar, which means that the discrete solution method is a good way to reduce the complexity of solving the dynamic Iwan model.
Through the analysis of the two correction methods, the nonlinear pressure distribution of the constraint method is constrained by the gradient of 0 at both ends, causing the partial preload around the contact boundary to be very low. Therefore, more preload needs to be compensated in the constraint method. The constraint method is more suitable for solving the complex dynamic Iwan model, considering the more concise correction process and the retained nonlinear distribution characteristics of the constraint method.
6. Conclusions
Through the study of this paper, the following conclusions can be drawn as follows:
- (1)
- The assumption of invariant pressure distribution is not suitable for the solution of the Iwan model under mixed-mode loading.
- (2)
- The contact boundary of the bolt joint can be represented by a dynamic ellipse function.
- (3)
- The pressure distribution still presents the Fernlund characteristic. As the tangential load increases, the maximum value increases, and the distribution radius decreases.
- (4)
- The constraint method is an ideal technique to solve the inconsistency of the functions and can compensate for the loss of preload. The discrete analysis shows that this method can be applied to the discrete calculation of the Iwan model.
The present analysis results can be used to solve the dynamic DF of the Iwan model. However, the dynamic pressure distribution increases the complexity of the solution. In the future, the technique of solving the dynamic DF according to the dynamic pressure function and the method to deduce the backbone and hysteresis curves need to be studied.
Author Contributions
Conceptualization, S.W. and M.Z.; methodology, H.C.; software, X.X.; validation, B.L. and M.G.; formal analysis, H.L.; investigation, Z.X.; resources, J.T.; data curation, D.M.; writing—original draft preparation, S.W.; writing—review and editing, M.Z.; visualization, X.X.; supervision, B.L. All authors have read and agreed to the published version of the manuscript.
Funding
This research received no external funding.
Institutional Review Board Statement
Not applicable.
Informed Consent Statement
Not applicable.
Data Availability Statement
Not applicable.
Conflicts of Interest
The authors declare no conflict of interest.
Nomenclature
| tangential force | Relative displacement | ||
| normal load | number of Jenkins elements | ||
| critical sliding force | tangential contact stiffness | ||
| semi-minor axis of the contact boundary | radius of the hole | ||
| semi-minor axis of the ellipse | semi-major of the ellipse | ||
| ellipticity of the ith ellipse | pressure under mixed-mode loading at θ | ||
| corrected pressure under mixed-mode loading | sliding area | ||
| contact pressure | semi-major axis of the contact boundary | ||
| corrected pressure for consistency in transition method | dynamic corrected pressure in transition method | ||
| dynamic corrected pressure for preload in transition method | dynamic corrected pressure for consistency in constraint method | ||
| dynamic corrected pressure for preload in constraint method | distance from the hole to the boundary | ||
| DF | density function |
References
- de Benedetti, M.; Garofalo, G.; Zumpano, M.; Barboni, R. On the damping effect due to bolted junctions in space structures subjected to pyro-shock. Acta Astronaut. 2007, 60, 947–956. [Google Scholar] [CrossRef]
- Gaul, L.; Nackenhorst, U.; Willner, K.; Lenz, J. Nonlinear Vibration Damping of Structures with Bolted Joints. In Proceedings of the SPIE-The International Society for Optical Engineering, Honolulu, HI, USA, March 1994; pp. 875–881. [Google Scholar]
- Li, D.; Botto, D.; Xu, C.; Gola, M. A new approach for the determination of the Iwan density function in modeling friction contact. Int. J. Mech. Sci. 2020, 180, 105671. [Google Scholar] [CrossRef]
- Robert, B.M. The Mechanics of Jointed Structures; Spring Nature Press: Cham, Switzerland, 2016. [Google Scholar]
- Yan, Y.; Xu, J.; Wiercigroch, M. Modelling of regenerative and frictional cutting dynamics. Int. J. Mech. Sci. 2019, 156, 86–93. [Google Scholar] [CrossRef]
- Saha, A.; Wiercigroch, M.; Jankowski, K.; Wahi, P.; Stefański, A. Investigation of two different friction models from the perspective of friction-induced vibrations. Tribol. Int. 2015, 90, 185–197. [Google Scholar] [CrossRef]
- Vaziri, V.; Kapitaniak, M.; Wiercigroch, M. Suppression of drill-string stick–slip vibration by sliding mode control: Numerical and experimental studies. Eur. J. Appl. Math. 2018, 29, 805–825. [Google Scholar] [CrossRef]
- Nassiraei, H.; Rezadoost, P. Static capacity of tubular X-joints reinforced with fiber reinforced polymer subjected to compressive load. Eng. Struct. 2021, 236, 112041. [Google Scholar] [CrossRef]
- Nassiraei, H.; Rezadoost, P. Local joint flexibility of tubular T/Y-joints retrofitted with GFRP under in-plane bending moment. Mar. Struct. 2021, 77, 102936. [Google Scholar] [CrossRef]
- Nassiraei, H.; Rezadoost, P. Stress concentration factors in tubular T/Y-joints strengthened with FRP subjected to compressive load in offshore structures. Int. J. Fatigue 2020, 140, 105719. [Google Scholar] [CrossRef]
- Nassiraei, H.; Rezadoost, P. SCFs in tubular X-connections retrofitted with FRP under in-plane bending load. Compos. Struct. 2021, 274, 114314. [Google Scholar] [CrossRef]
- Iwan, W.D. A Distributed-Element Model for Hysteresis and Its Steady-State Dynamic Response. J. Appl. Mech. 1966, 33, 893–900. [Google Scholar] [CrossRef]
- Dahl, P. Solid friction damping of spacecraft oscillations. In Guidance and Control Conference; American Institute of Aeronautics and Astronautics: Boston, MA, USA, 1975. [Google Scholar] [CrossRef]
- Wit, C.C.D.; Olsson, H.; Astrom, K.J.; Lischinsky, P. A new model for control of systems with friction. IEEE Trans. Autom. Control 1995, 40, 419–425. [Google Scholar] [CrossRef]
- Haessig, D.A.; Friedland, B. On the Modeling and Simulation of Friction. In Proceedings of the 1990 American Control Conference, San Diego, CA, USA, 23–25 May 1990; pp. 1256–1261. [Google Scholar]
- Dahl, P.R. Solid Friction Damping of Mechanical Vibrations. AIAA J. 1976, 14, 1675–1682. [Google Scholar] [CrossRef]
- Abad, J.; Medel, F.J.; Franco, J.M. Determination of Valanis model parameters in a bolted lap joint: Experimental and numerical analyses of frictional dissipation. Int. J. Mech. Sci. 2014, 89, 289–298. [Google Scholar] [CrossRef]
- Valanis, K. Fundamental Consequences of a New Intrinsic Time Measure. Plasticity as a Limit of the Endochronic Theory. Arch. Mech. 1978, 32, 68. [Google Scholar]
- Song, Y.; Hartwigsen, C.J.; McFarland, D.M.; Vakakis, A.F.; Bergman, L.A. Simulation of dynamics of beam structures with bolted joints using adjusted Iwan beam elements. J. Sound Vib. 2004, 273, 249–276. [Google Scholar] [CrossRef]
- Segalman, D.J.; Gregory, D.L.; Starr, M.J. Handbook on Dynamics of Jointed Structure; Sandia Laboratory: Albuquerque, NM, USA, 2009.
- Li, Y.; Hao, Z. A six-parameter Iwan model and its application. Mech. Syst. Signal Process. 2016, 68–69, 354–365. [Google Scholar] [CrossRef]
- Li, D.; Botto, D.; Xu, C.; Liu, T.; Gola, M. A micro-slip friction modeling approach and its application in underplatform damper kinematics. Int. J. Mech. Sci. 2019, 161–162, 105029. [Google Scholar] [CrossRef]
- Li, D.; Xu, C.; Botto, D.; Zhang, Z.; Gola, M. A fretting test apparatus for measuring friction hysteresis of bolted joints. Tribol. Int. 2020, 151, 106431. [Google Scholar] [CrossRef]
- Zhao, B.; Wu, F.; Sun, K.; Mu, X.; Zhang, Y.; Sun, Q. Study on tangential stiffness nonlinear softening of bolted joint in friction-sliding process. Tribol. Int. 2021, 156, 106856. [Google Scholar] [CrossRef]
- Wang, S.-A.; Zhu, M.; Xie, X.; Li, B.; Liang, T.-X.; Shao, Z.-Q.; Liu, Y.-L. Finite Element Analysis of Elastoplastic Elements in the Iwan Model of Bolted Joints. Materials 2022, 15, 5817. [Google Scholar] [CrossRef] [PubMed]
- Ito, Y. A Contribution to the Effective Range of the Preload on a Bolted Joint. In Proceedings of the Fourteenth International Machine Tool Design and Research Conference; Koenigsberger, F., Tobias, S.A., Eds.; Macmillan Education: London, UK, 1974; pp. 503–507. [Google Scholar] [CrossRef]
- Mantelli, M.; Milanez, F.; Pereira, E.; Fletcher, L. Statistical Model for Pressure Distribution of Bolted Joints. J. Thermophys. Heat Transf. 2010, 24, 432–437. [Google Scholar] [CrossRef]
- Marshall, M.B.; Lewis, R.; Drinkwater, B.W.; Dwyer-Joyce, R.S. An ultrasonic approach for contact stress mapping in machine joints and concentrated contacts. J. Strain Anal. Eng. Des. 2004, 39, 339–350. [Google Scholar] [CrossRef]
- Marshall, M.B.; Lewis, R.; Dwyer-Joyce, R.S. Characterisation of Contact Pressure Distribution in Bolted Joints. Strain 2006, 42, 31–43. [Google Scholar] [CrossRef]
- Hodgson, K.; Dwyer-Joyce, R.S.; Drinkwater, B.W. Ultrasound as an experimental tool for investigating engineering contacts. In Proceedings of the 9th Nordic Symposium on Tribology, Porvoo, Finland, 11–14 June 2000. [Google Scholar]
- Lobitz, D.; Gregory, D.; Smallwood, D. Comparison of Finite Element Predictions to Measurements from the Sandia Microslip Experiment; Sandia National Lab.: Albuquerque, NM, USA, 2000; Volume 2.
- Gong, H.; Liu, J.; Ding, X. Thorough understanding on the mechanism of vibration-induced loosening of threaded fasteners based on modified Iwan model. J. Sound Vib. 2020, 473, 115238. [Google Scholar] [CrossRef]
- Chen, W.; Deng, X. Structural damping caused by micro-slip along frictional interfaces. Int. J. Mech. Sci. 2005, 47, 1191–1211. [Google Scholar] [CrossRef]
- Motosh, N. Determination of Joint Stiffness in Bolted Connections. J. Eng. Ind. 1976, 98, 858–861. [Google Scholar] [CrossRef]
Publisher’s Note: MDPI stays neutral with regard to jurisdictional claims in published maps and institutional affiliations. |
© 2022 by the authors. Licensee MDPI, Basel, Switzerland. This article is an open access article distributed under the terms and conditions of the Creative Commons Attribution (CC BY) license (https://creativecommons.org/licenses/by/4.0/).