Article

Preparation of ZnFe2O4@TiO2 Novel Core-Shell Photocatalyst by Ultrasonic Method and Its Photocatalytic Degradation Activity

School of Environmental and Municipal Engineering, Lanzhou Jiaotong University, Lanzhou 730070, China
*
Author to whom correspondence should be addressed.
Coatings 2022, 12(10), 1407; https://doi.org/10.3390/coatings12101407
Submission received: 9 September 2022 / Revised: 22 September 2022 / Accepted: 23 September 2022 / Published: 27 September 2022

Abstract

:
ZnFe2O4 microspheres were prepared by solvothermal method, and a novel ZnFe2O4@TiO2 core-shell composite photocatalyst was prepared by ultrasonic (denoted as ZT-x) and mechanical stirring (denoted as ZTM-1.2). The morphology, structure, magnetic, and optoelectronic properties of the catalyst were investigated comprehensively, and the degradation performance of the catalyst was explored through the photocatalytic degradation of Rhodamine B (RhB) under UV light. The concentration of RhB was 10 mg/L, and the catalyst concentration was 0.3 g/L. ZT-1.2 showed the best photocatalytic degradation activity, and the degradation rate of RhB reached 97.3% within 60 min. The degradation ability of the catalyst was further evaluated by Methylene blue (MB), Methyl orange (MO), Phenol, and Ofloxacin (OFX). ZT-1.2 also exhibited excellent stability. The improved catalyst degradation performance was attributed to constructing a Z-type heterojunction. Moreover, the low-efficiency degradation of ZTM-1.2 was caused by catalyst agglomeration and low TiO2 loading, confirming the superiority of the ultrasonic method and providing a new method for the preparation of magnetically recoverable TiO2-based core-shell photocatalyst.

1. Introduction

The many organic dyes in industrial wastewater from textile, clothing, and paper industries have become one of the primary sources of environmental pollution due to their carcinogenicity, refractory degradation, and colored pollution [1]. At the same time, more and more antibiotics are used in human therapy, aquaculture, animal husbandry, and agricultural production, resulting in some stubborn antibiotic residues flowing into the ecosystem. It causes water pollution and the proliferation of drug-resistant bacteria, endangering human health [2]. Therefore, developing an efficient degradation method for organic pollutants such as dyes, phenols, and antibiotics is essential.
Traditional physical methods (such as adsorption and flocculation) can only extract pollutants from wastewater. However, they may cause secondary pollution. Chemical methods can selectively degrade target pollutants, but their reaction process is single, inefficient, and expensive [3]. Photocatalysis is a kind of advanced oxidation process (AOPs), which has been shown to have a broad prospect in the field of environmental remediation because of its high efficiency, environmental friendliness, simple process, good circulation, and the ability to mineralize organic pollutants into non-toxic carbon dioxide completely [4,5].
The semiconductor photocatalyst is the core of the photocatalytic system. Since TiO2 was found to be useful for photocatalytic hydrogen production in 1972 [6], and Carey successfully used TiO2 to degrade polychlorinated biphenyls in 1976 [7], TiO2 has become one of the most popular photocatalysts due to its advantages such as structural stability, non-toxicity, high catalytic activity, and low cost [8]. However, the rapid recombination of electrons and holes affects the catalyst’s performance [9]. Charge separation can be achieved by coupling the semiconductor with TiO2 to construct a heterojunction to further enhance the photocatalytic degradation of pollutants by the catalyst [10].
The reuse of catalysts is also a problem that needs to be solved. Anchoring catalysts on larger supports such as glass or metal foil [11], nonwovens, or carbon fiber cloth can facilitate the recovery of catalysts [12], but this method may reduce the catalytic effect of catalysts. By immobilizing the catalyst on a magnetic semiconductor, it can be quickly recovered just by an external magnetic field. Fe3O4 is one of the most widely used magnetic carriers, but Fe2O3 is formed when Fe3O4 is calcined at a high temperature [13]. As a kind of spinel ferrite, the ZnFe2O4 semiconductor has visible light-response ability, thermal stability, and specific photocatalytic activity [14]. Therefore, it is often used as a carrier for magnetically recoverable photocatalysts [15,16,17]. However, a ZnFe2O4@TiO2 core-shell photocatalyst has not been reported before.
Here, a method for ultrasonically preparing ZnFe2O4@TiO2 core-shell microspheres is proposed, as shown in Scheme 1. ZnFe2O4 nanospheres were prepared by the solvothermal method, then TiO2 was deposited on the surface of the magnetic core in an ultrasonic environment, and calcined at high temperature to obtain anatase ZnFe2O4@TiO2, which has significantly improved catalytic performance compared with monomers. In addition, the core-shell structure of the magnetic photocatalysts is beneficial for reducing the loss of magnetism, which can effectively stabilize the catalytic activity of the catalyst. Meanwhile, compared with the previously reported TiO2-based magnetically recyclable core-shell photocatalysts, the ultrasonic method is simple and efficient, providing a reference for preparing TiO2-based core-shell composite photocatalysts. After five experiments, the catalyst had a good photocatalytic degradation effect on the RhB and maintained excellent catalytic activity. Meanwhile, it also showed a strong decomposition ability for MO, MB, Phenol, and OFX.

2. Experimental Section

2.1. Materials

FeCl3·6H2O,ethylene glycol, tetrabutyl titanate(TBOT), NH3·H2O,CH3COONa, Ofloxacin (OFX) (analytical pure, Shanghai Aladdin Biochemical Technology Co., Ltd., Shanghai, China), ZnCl2 (analytical pure, Shanghai McLean Biochemical Technology Co., Ltd.), polyethylene glycol (PEG-2000) (analytical grade, Saen Chemical Technology (Shanghai) Co., Ltd., Shanghai, China), absolute alcohol, acetonitrile (analytical pure, Guangdong Guanghua Technology Co., Ltd., Shenzhen, China), Rhodamine B (RhB) (analytical pure, Zhengzhou Dezhong Chemical Reagent Factory, Zhengzhou, China), Methyl orange (MO) (analytical pure, Tianjin Tianxin Fine Chemical Development Center, Tianjin, China), Methylene blue (MB), Phenol (analytical pure, Tianjin Aoran Institute of Fine Chemicals, Tianjin, China).

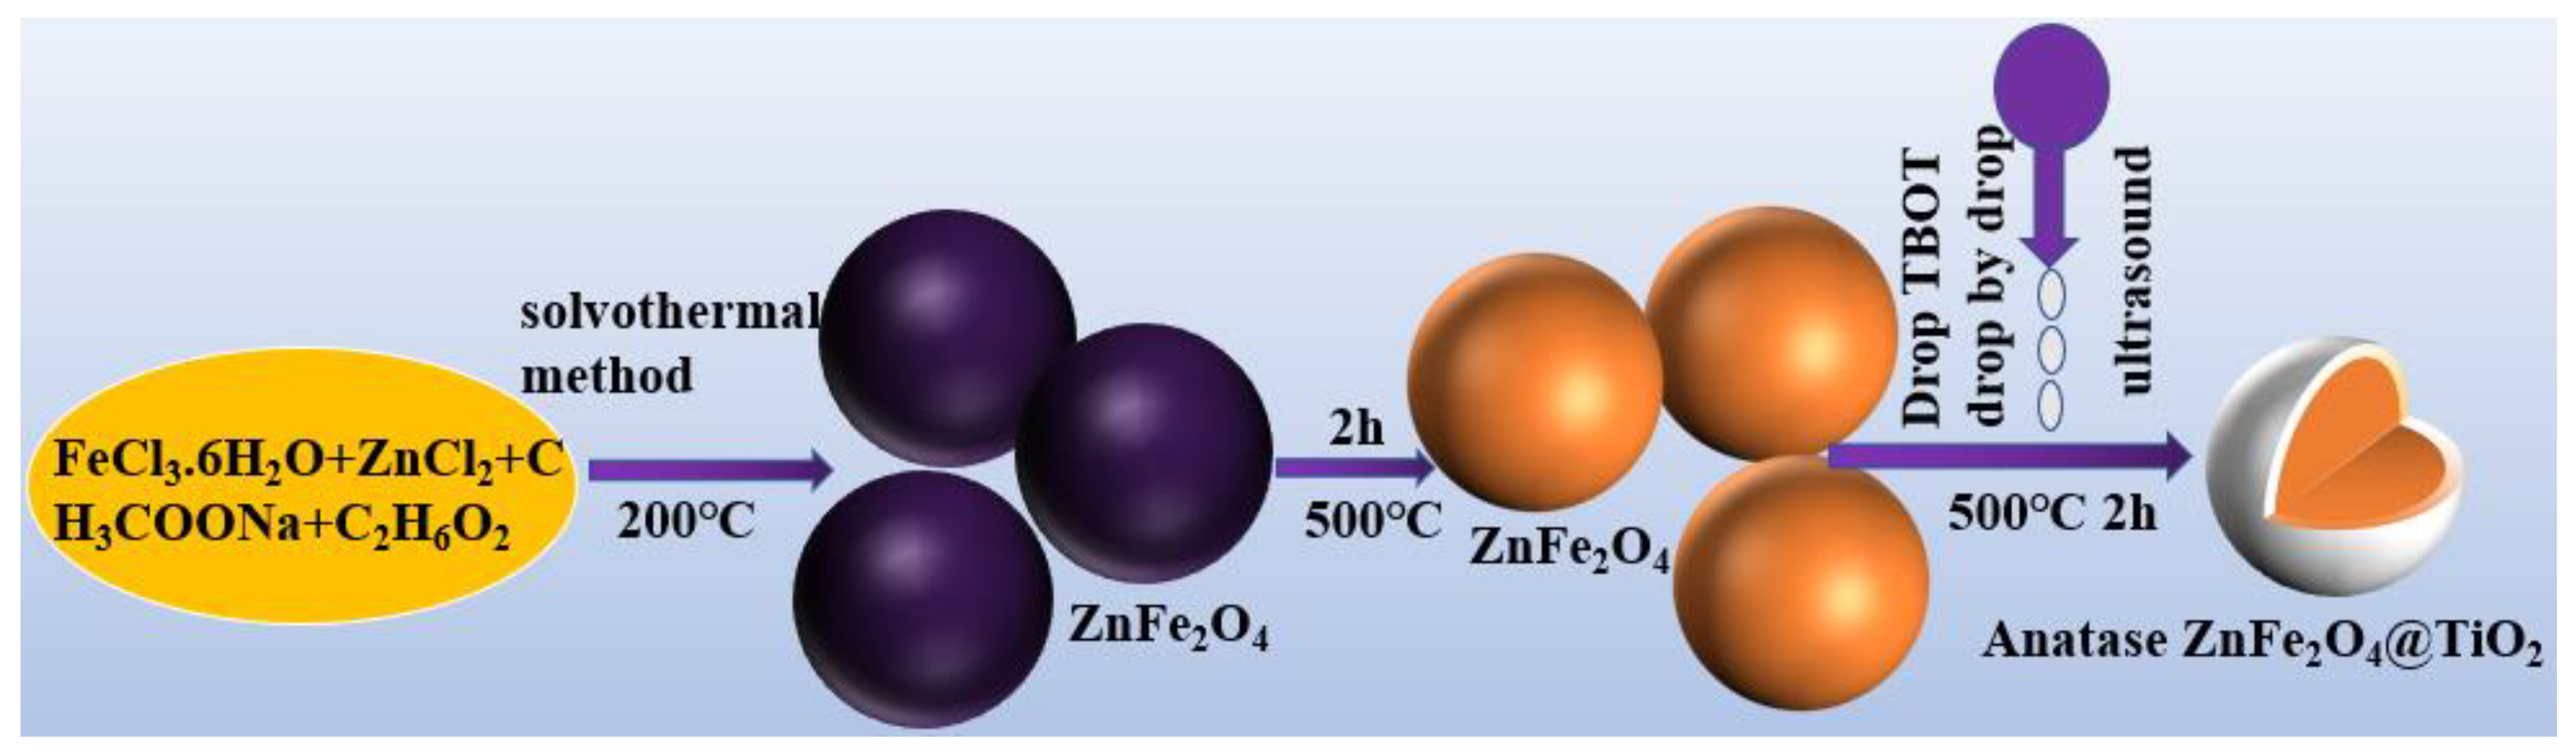
2.2. Preparation of ZnFe2O4@TiO2 Core-Shell Microspheres

ZnFe2O4 microspheres were prepared by solvothermal method [18]. First, 80 mL of ethylene glycol was placed in a 120 mL hydrothermal reactor with a PTFE. Then, 2.703 g FeCl3·6H2O and 0.681g ZnCl2 were added to the solvent and stirred at room temperature for 1 h until fully dissolved. Next, 2.0 g PEG-2000 was added to the reaction solution. The solution was transferred to a 50 °C water bath, stirred for 1 h, combined with 7.2 g CH3COONa, and stirred for 1 h. The lining was put into the outer lining of the hydrothermal reactor and reacted at 200 °C. After 15 h, it was cooled to room temperature, and the solid products were washed three times with deionized water and absolute ethanol each and dried under vacuum at 70 °C for 10 h.
The ZnFe2O4@TiO2 microspheres were prepared by ultrasonic loading method. In total, 90 mL of absolute alcohol, 30 mL of acetonitrile, and 0.5 mL of NH3·H2O were loaded to a 250 mL beaker and mixed by sonication evenly, then 0.05 g of ZnFe2O4 was added. After 10 minutes of ultrasonication, a certain amount of TBOT was added dropwise, and the solution was further ultrasonicated for 1.5 h. The product was collected magnetically, washed thrice with deionized water and absolute ethanol, and dried at 60 °C. The amount of TBOT was controlled to be 0.6, 0.8, 1.0, 1.2, and 1.4 mL, and the composite photocatalysts were recorded as ZT-0.6, ZT-0.8, ZT-1.0, ZT-1.2, and ZT-1.4, respectively. The catalyst prepared by mechanical agitation was named ZTM-1.2 (the dropwise amount of TBOT was 1.2 mL).

2.3. Photocatalytic Performance Evaluation

RhB, MB, MO, Phenol, and OFX were used as the target pollutants, and the concentration of the pollutant solution was 10 mg/L. The concentration of catalyst was kept at 0.3 g/L. The reaction suspension was stirred in the dark for 30 min to reach adsorption equilibrium, and then the degradation reaction was carried out under UV light. The lamp source was a 500 W mercury lamp. RhB, MB, and MO were determined by direct colorimetry. Absorbance values were measured at 554 nm, 664 nm, and 463 nm, respectively. Phenol was determined by 4-amino-antipyrine spectrophotometry with a wavelength of 510 nm, and OFX was determined by UV-vis spectrophotometry with a wavelength of 293 nm.
The degradation rates of RhB, MB, MO, Phenol, and OFX were calculated using the following formula:
η = [(A0 − A)/A0] × 100% = [(C0 − C)/C0] × 100%
In the formula, η is the photocatalytic degradation rate; A0 is the absorbance of the pollutant solution before the reaction; A is the absorbance of the pollutant solution after the reaction; C0 is the concentration of the pollutant solution before the reaction; C is the concentration of the pollutant solution after the reaction. Then, the kinetic constants of photocatalytic degradation were calculated by using the following formula:
ln(C0/C) = kt

2.4. Characterization

The morphology and internal structure of the samples were characterized by scanning electron microscope (SEM) (JSM-6710F, Tokyo, Japan) and transmission electron microscopy (TEM) (TECNAI G2 TF20, Waltham, MA, USA). X-ray diffractometer (XRD) (D/max-2400, Tokyo, Japan) was used to analyze its phase structure. The specific surface area and pore size distribution of the samples were tested by N2 adsorption–desorption isotherms (BET) (KUBO-X1000, Shanghai, China). The element valence states and valence bond structures of the samples were revealed by X-ray photoelectron spectroscopy (XPS) (EscaLab 250Xi, Waltham, MA, USA). The Vibrating Sample Magnetometer (VSM) (Quantum Design PPMS DynaCool, Waltham, MA, USA) indicates the magnetic strength of the photocatalyst. Fourier-Transform Infrared Spectrometer (FTIR) (IRprestige-21, Tokyo, Japan) was used to determine the functional group composition of the samples, while ultraviolet–visible diffuse reflectance spectroscopy (DRS) (UV-3600 UV-VIS-NIR, Tokyo, Japan) was used to determine the optical properties of the catalysts. Transient photocurrent (I-t), electrochemical impedance (EIS) (Chenhua 660e, Shanghai,, China), and steady-state fluorescence spectroscopy (PL) (HITACHI F7000, Shanghai, China) were used to test the carrier separation efficiency of the catalysts.

3. Results and Discussion

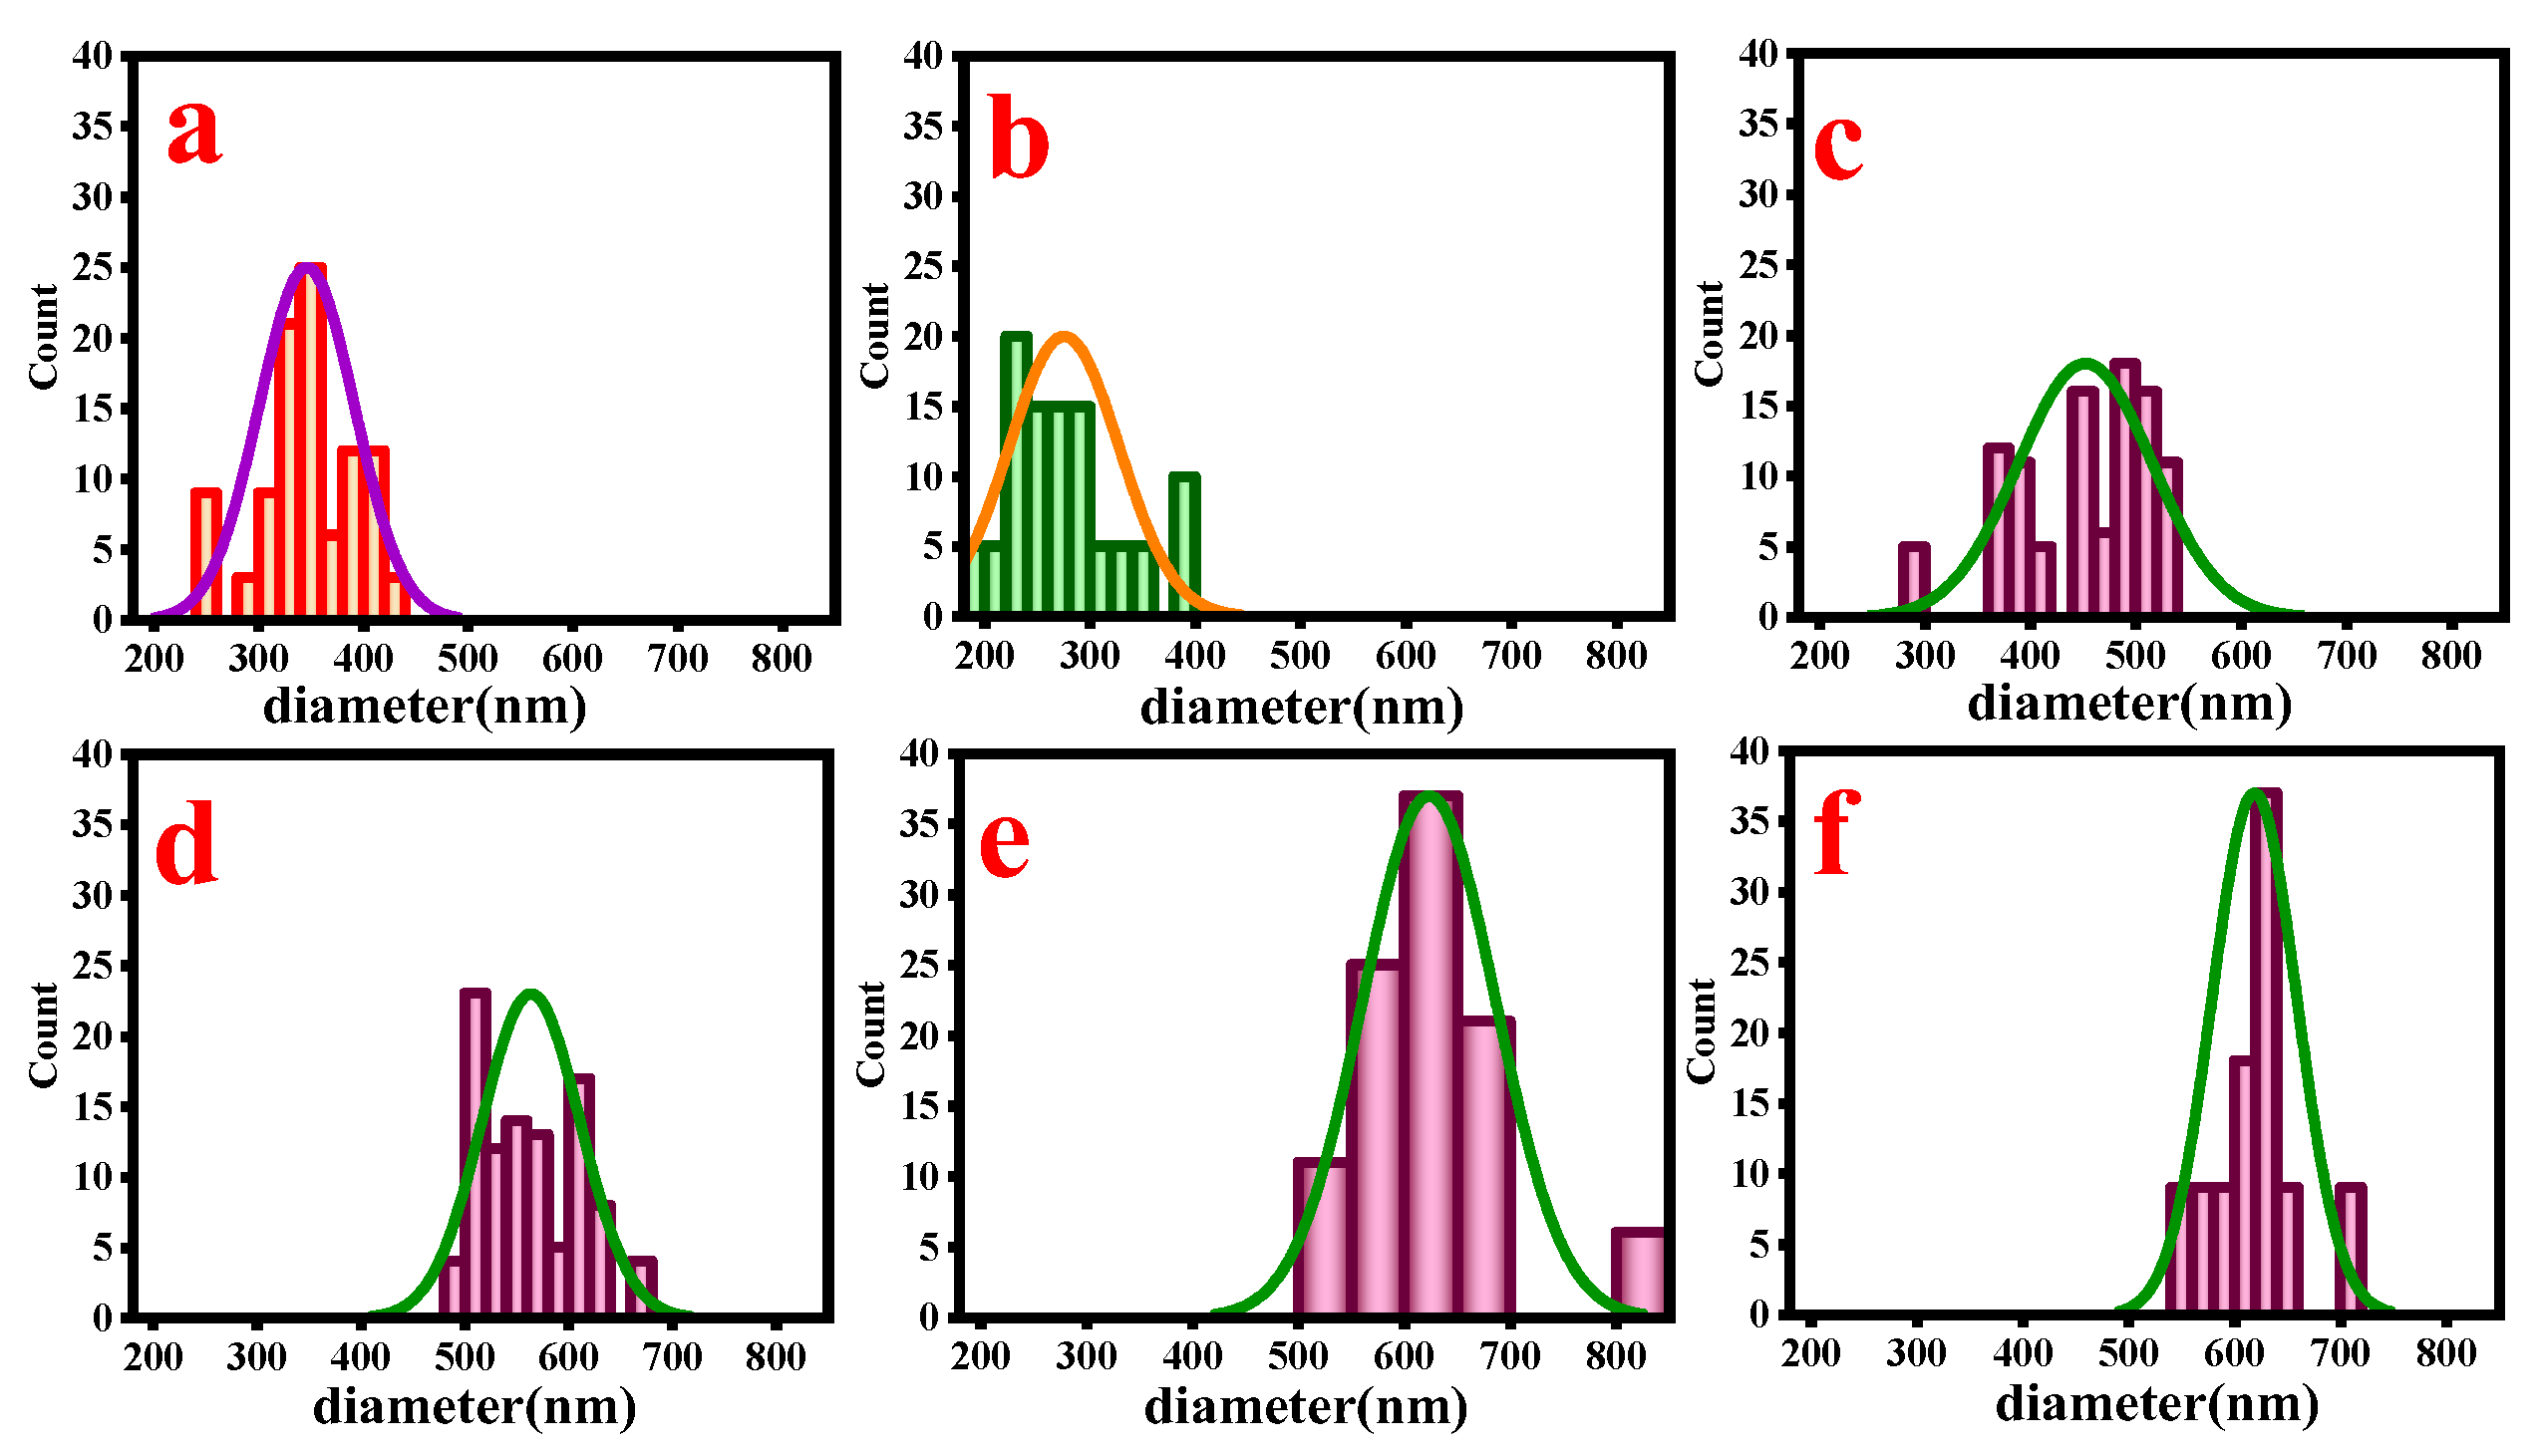
3.1. Morphology Analysis

Figure 1 shows the SEM image of the photocatalyst. The surface morphology characteristics of the catalyst can be observed by scanning an electron microscope. ZnFe2O4 microspheres (Figure 1a) have a spherical structure with good dispersion, a particle size of about 300–420 nm, and a rough surface showing a mesoporous structure of calcination at high temperature. After calcination at 500 °C, the crystal form of the magnetic core becomes more stable, and the rough surface structure benefits from the loading of TiO2 onto its surface. Pure TiO2 (Figure 1b) also has a dispersed spherical structure, and the diameter range is mainly 200–300 nm. Figure 1c–g are ZnFe2O4@TiO2 microspheres. It was observed from the electron microscope photos that the diameter of the composite microspheres was significantly larger than that of ZnFe2O4, indicating that TiO2 is successfully loaded onto the surface of the magnetic core. The thickness of the TiO2 shell increases with the increase in TBOT dosage. When the amount of TBOT added reached 1.2 mL, the TiO2 layer no longer thickened and reached the loading limit, but agglomeration appeared, as shown in Figure 1g, consistent with the phenomenon documented in the study by Wang et al. [19].
Figure 2 is a histogram of the particle size distribution of the catalyst. ImageJ software was used to measure the particle size of the catalyst in the SEM image, and all the catalyst microspheres conform to the normal distribution. With the addition of TBOT, the particle size of the catalyst microspheres increases sharply, the diameter of ZnFe2O4 is mainly distributed between 300 and 420 nm, the diameter of TiO2 is mainly 200–300 nm, and the particle size distribution ranges of ZT-0.6, ZT-1.0, ZT-1.2, and ZT-1.4 are 350–550 nm, 500–640 nm, 500–700 nm, and 540–660 nm, respectively.
As shown in Figure 3, to further explore the catalysts’ structural composition, ZT-1.2 and ZT-1.4 were analyzed by transmission electron microscopy (TEM), and the lattice fringes were measured by the transmission images at high magnification (HRTEM). Figure 3a,b shows that the samples are all core-shell structures, and ZT-1.4 has apparent agglomeration, while ZT-1.2 has a better dispersion. It is because when the added amount of TBOT is 1.2 mL, the load saturation has been reached. If TBOT were continued to be added, free TiO2 would be attached to the microspheres, resulting in agglomeration. It matches the particle size distribution. The TiO2 shell is composed of nanocrystals, whose size is about 5–7 nm (Figure 3c). Figure 3d presents an HRTEM picture of ZT-1.2. There are apparent lattice stripes in the picture. The stripe width measured by digital micrograph software is 0.351 nm, entirely consistent with the (101) crystal plane in the TiO2 standard card (PDF#71-1166), confirming the successful preparation of high-purity anatase TiO2.

3.2. EDS Study

To further confirm the elemental composition of the catalyst, EDS analysis was performed on the sample ZT-1.2. The element distribution energy spectrum and element distribution characteristics were obtained by surface scanning, as shown in Figure 4. The catalyst contains C, O, Ti, Fe, and Zn elements, among which Ti element is from TiO2, Fe and Zn elements are from ZnFe2O4, and O element is from TiO2 and ZnFe2O4. The peak of a small amount of Au element appears in the spectrogram because of gold spraying in the sample preparation process. In contrast, the C element is the cause of conductive adhesive in the sample stage (Figure 4a). The element distribution was observed to be uniform (Figure 4b–g), verifying the successful uniform load of TiO2.

3.3. Crystal Analysis
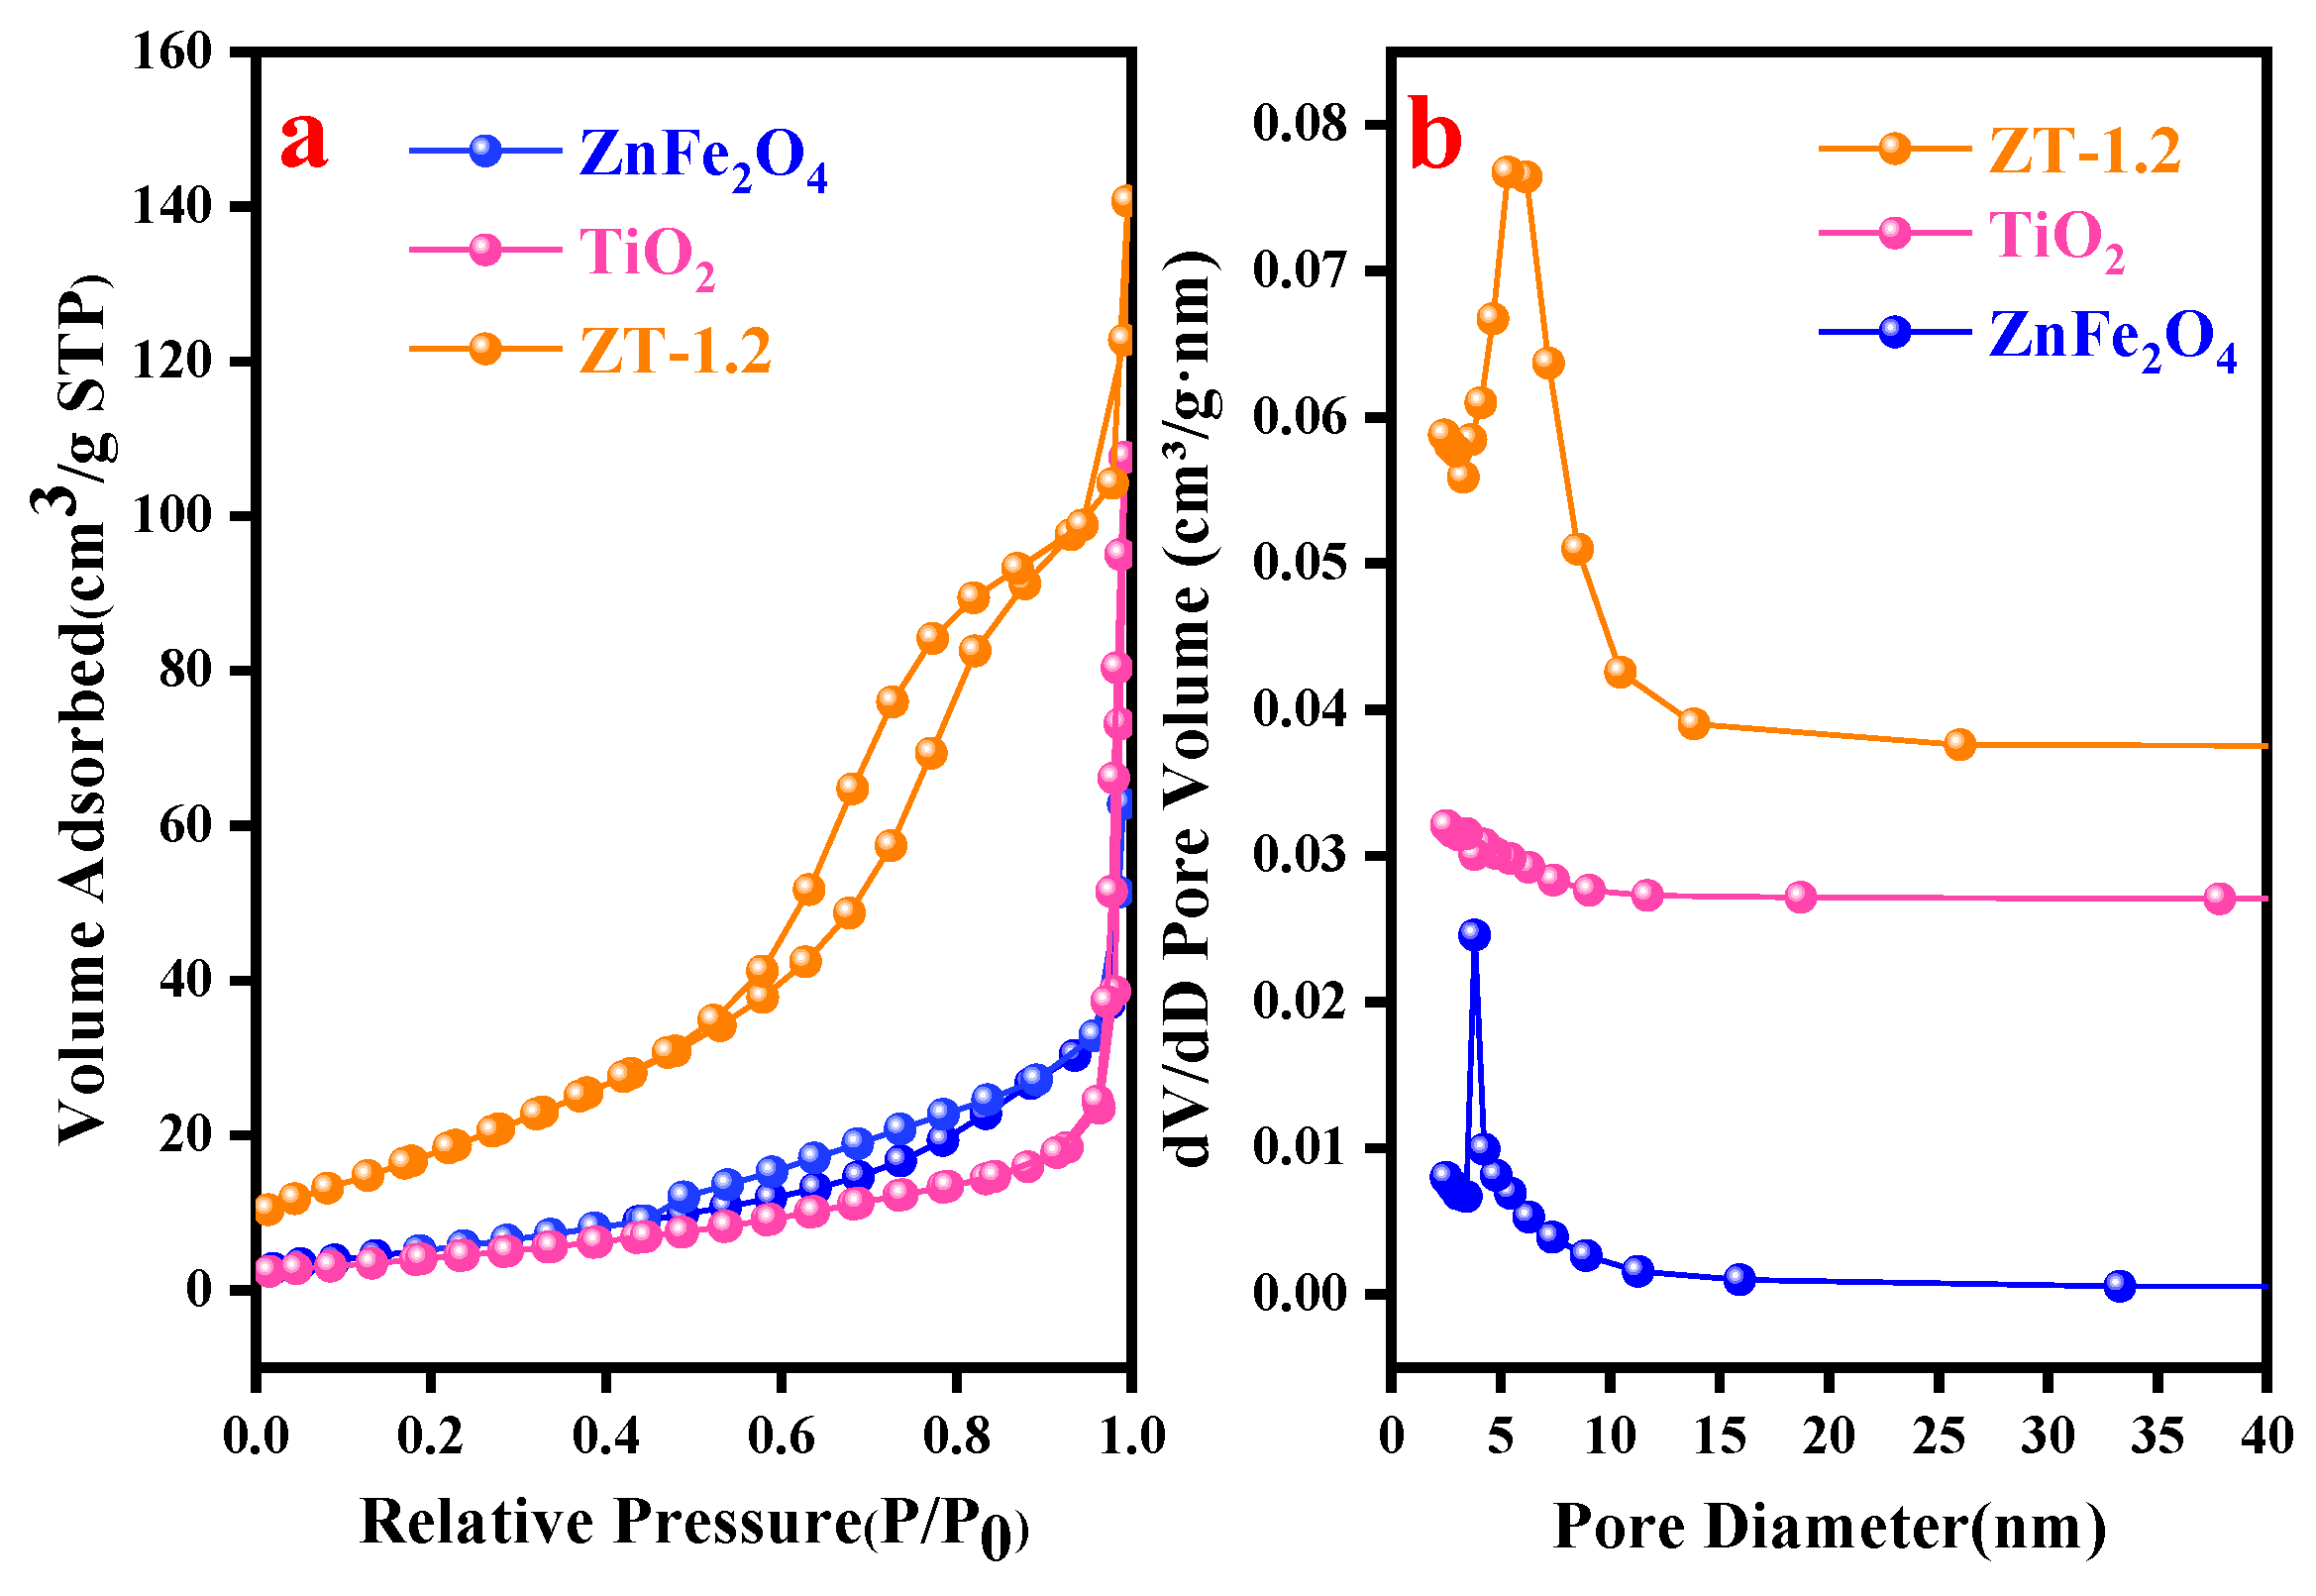
Figure 5 shows the XRD pattern of the catalysts, and the crystal phase structure of the material can also be observed. Figure 5a shows the XRD patterns of ZnFe2O4, TiO2, and ZT-1.2 catalysts. The diffraction peaks of ZnFe2O4 are consistent with the crystal plane positions of the standard card (PDF # 79-1150), corresponding to the (220), (311), (400), (511), and (440) crystal planes of ZnFe2O4 at 30.00°, 35.32°, 42.99°, 56.87°, and 62.44°, respectively. The peak position of TiO2 can be entirely consistent with the standard card of anatase TiO2 (PDF#71-1166), indicating that the TiO2 calcined at a high temperature of 500 °C in the air is a high-purity anatase phase, in which the main peak position is (101) crystal at 25.3°, and the diffraction peaks at 37.88°, 48.08°, 53.98°, 55.12°, and 62.74° correspond to the (004), (200), (105), (211), and (204) crystal planes of anatase TiO2, respectively. After coupling ZnFe2O4 with TiO2, the position of the characteristic peak did not change. However, the diffraction peaks of each crystal plane of TiO2 were weakened to a certain extent. It might be because the addition of ZnFe2O4 reduced the crystallinity of TiO2, and the composite material did not appear in other miscellaneous peaks, indicating that the catalyst still maintains a good crystal structure under high-temperature calcination. Figure 5b shows the XRD patterns of ZT-0.6, ZT-0.8, ZT-1.0, ZT-1.2, and ZT-1.4. With the increase of TBOT addition, the corresponding characteristic peaks of TiO2 gradually strengthened. When TBOT addition was 1.0 ml, the characteristic peak intensity did not change significantly, indicating that the loading amount of TiO2 was close to saturation, consistent with the SEM image.

3.4. BET Test

Usually, the specific surface area and pore size of the catalyst are the key factors affecting the photocatalytic performance. Therefore, in this study, the BET method was used to test the specific surface area of ZnFe2O4, TiO2, and ZT-1.2, and the BJH method was used to analyze the pore size [20]. Figure 6a shows that ZnFe2O4 and ZT-1.2 belong to the H3 hysteresis loop of the type IV isotherm and belong to the mesoporous structure. However, there is no hysteresis loop in TiO2, indicating that there are no pores on the surface of pure TiO2 synthesized by ultrasonic, which is caused by self-assembly in the ultrasonic environment. The mesopores on the surface of ZnFe2O4 are more conducive to the loading of TiO2 onto its surface, and the porous structure of TiO2 nanocrystals appears after the surface is loaded, indicating that ultrasound is beneficial to the preparation of this core-shell structure catalyst, because it is more conducive to the generation of active sites. The specific surface areas of ZnFe2O4, TiO2, and ZT-1.2 are 16.6782, 12.7257, and 54.8083 m2/g, respectively, and the pore size distribution ranges of ZnFe2O4 and ZT-1.2 are 3–10 nm and 3–7 nm, respectively, which are consistent with the results of specific surface area. In addition, the improvement of the specific surface area of ZT-1.2 also contributed to the catalysis experiments, which was consistent with the trend of the degradation curve.

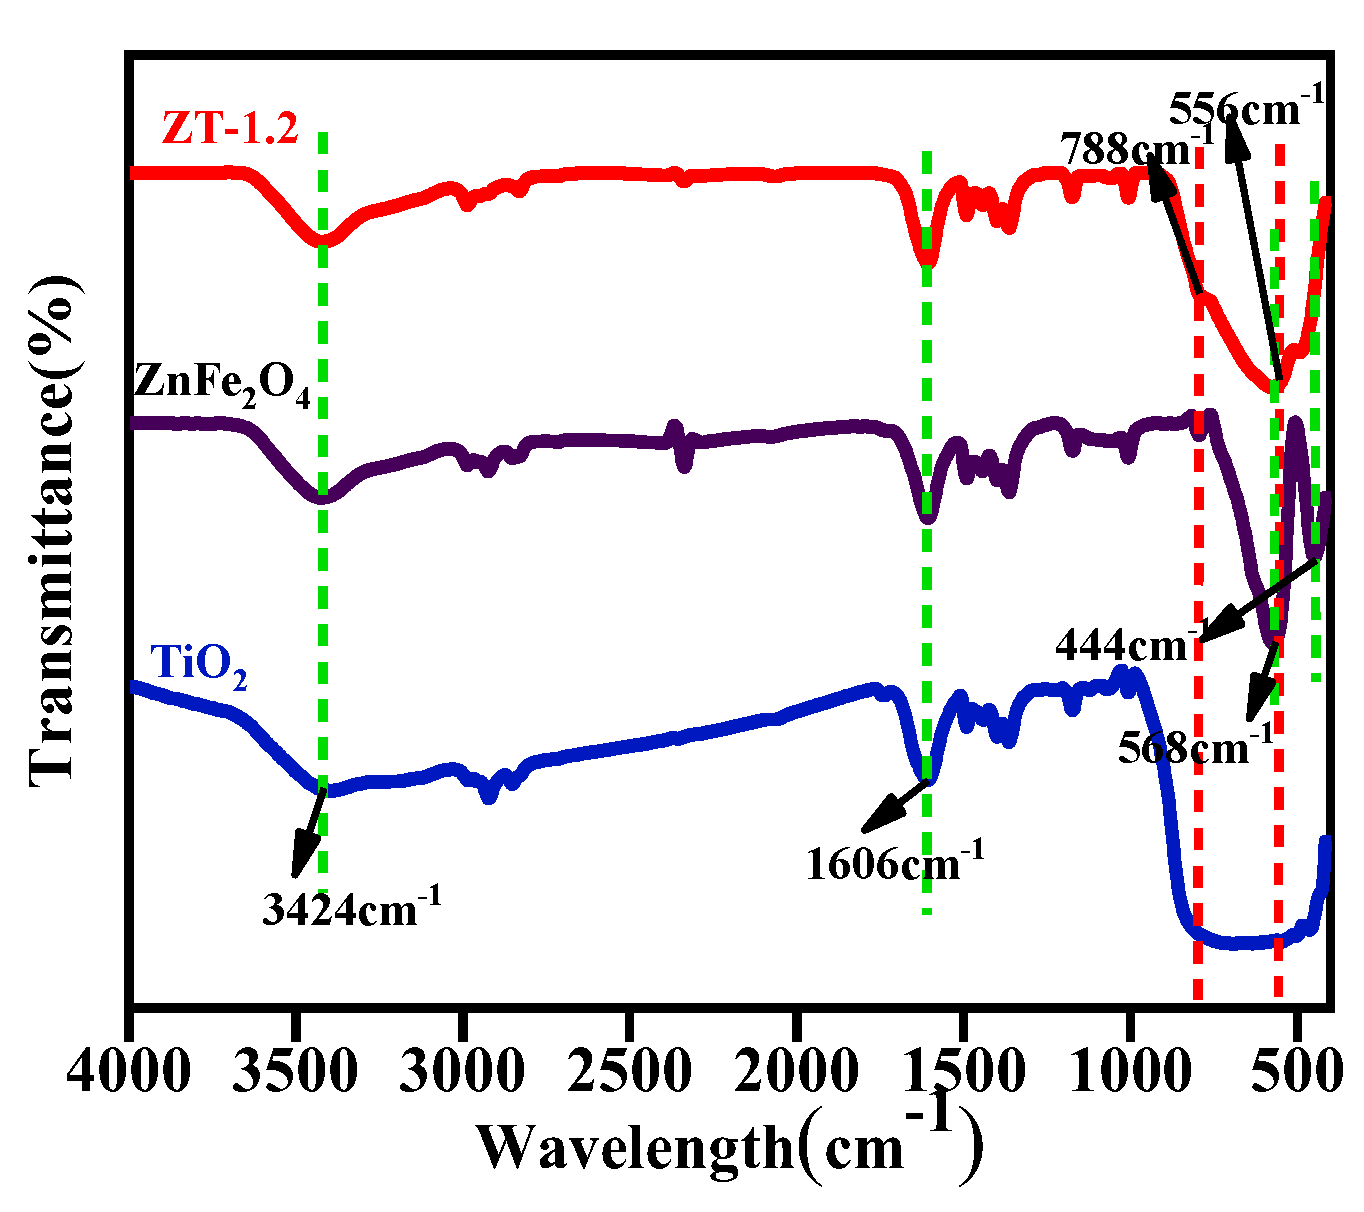
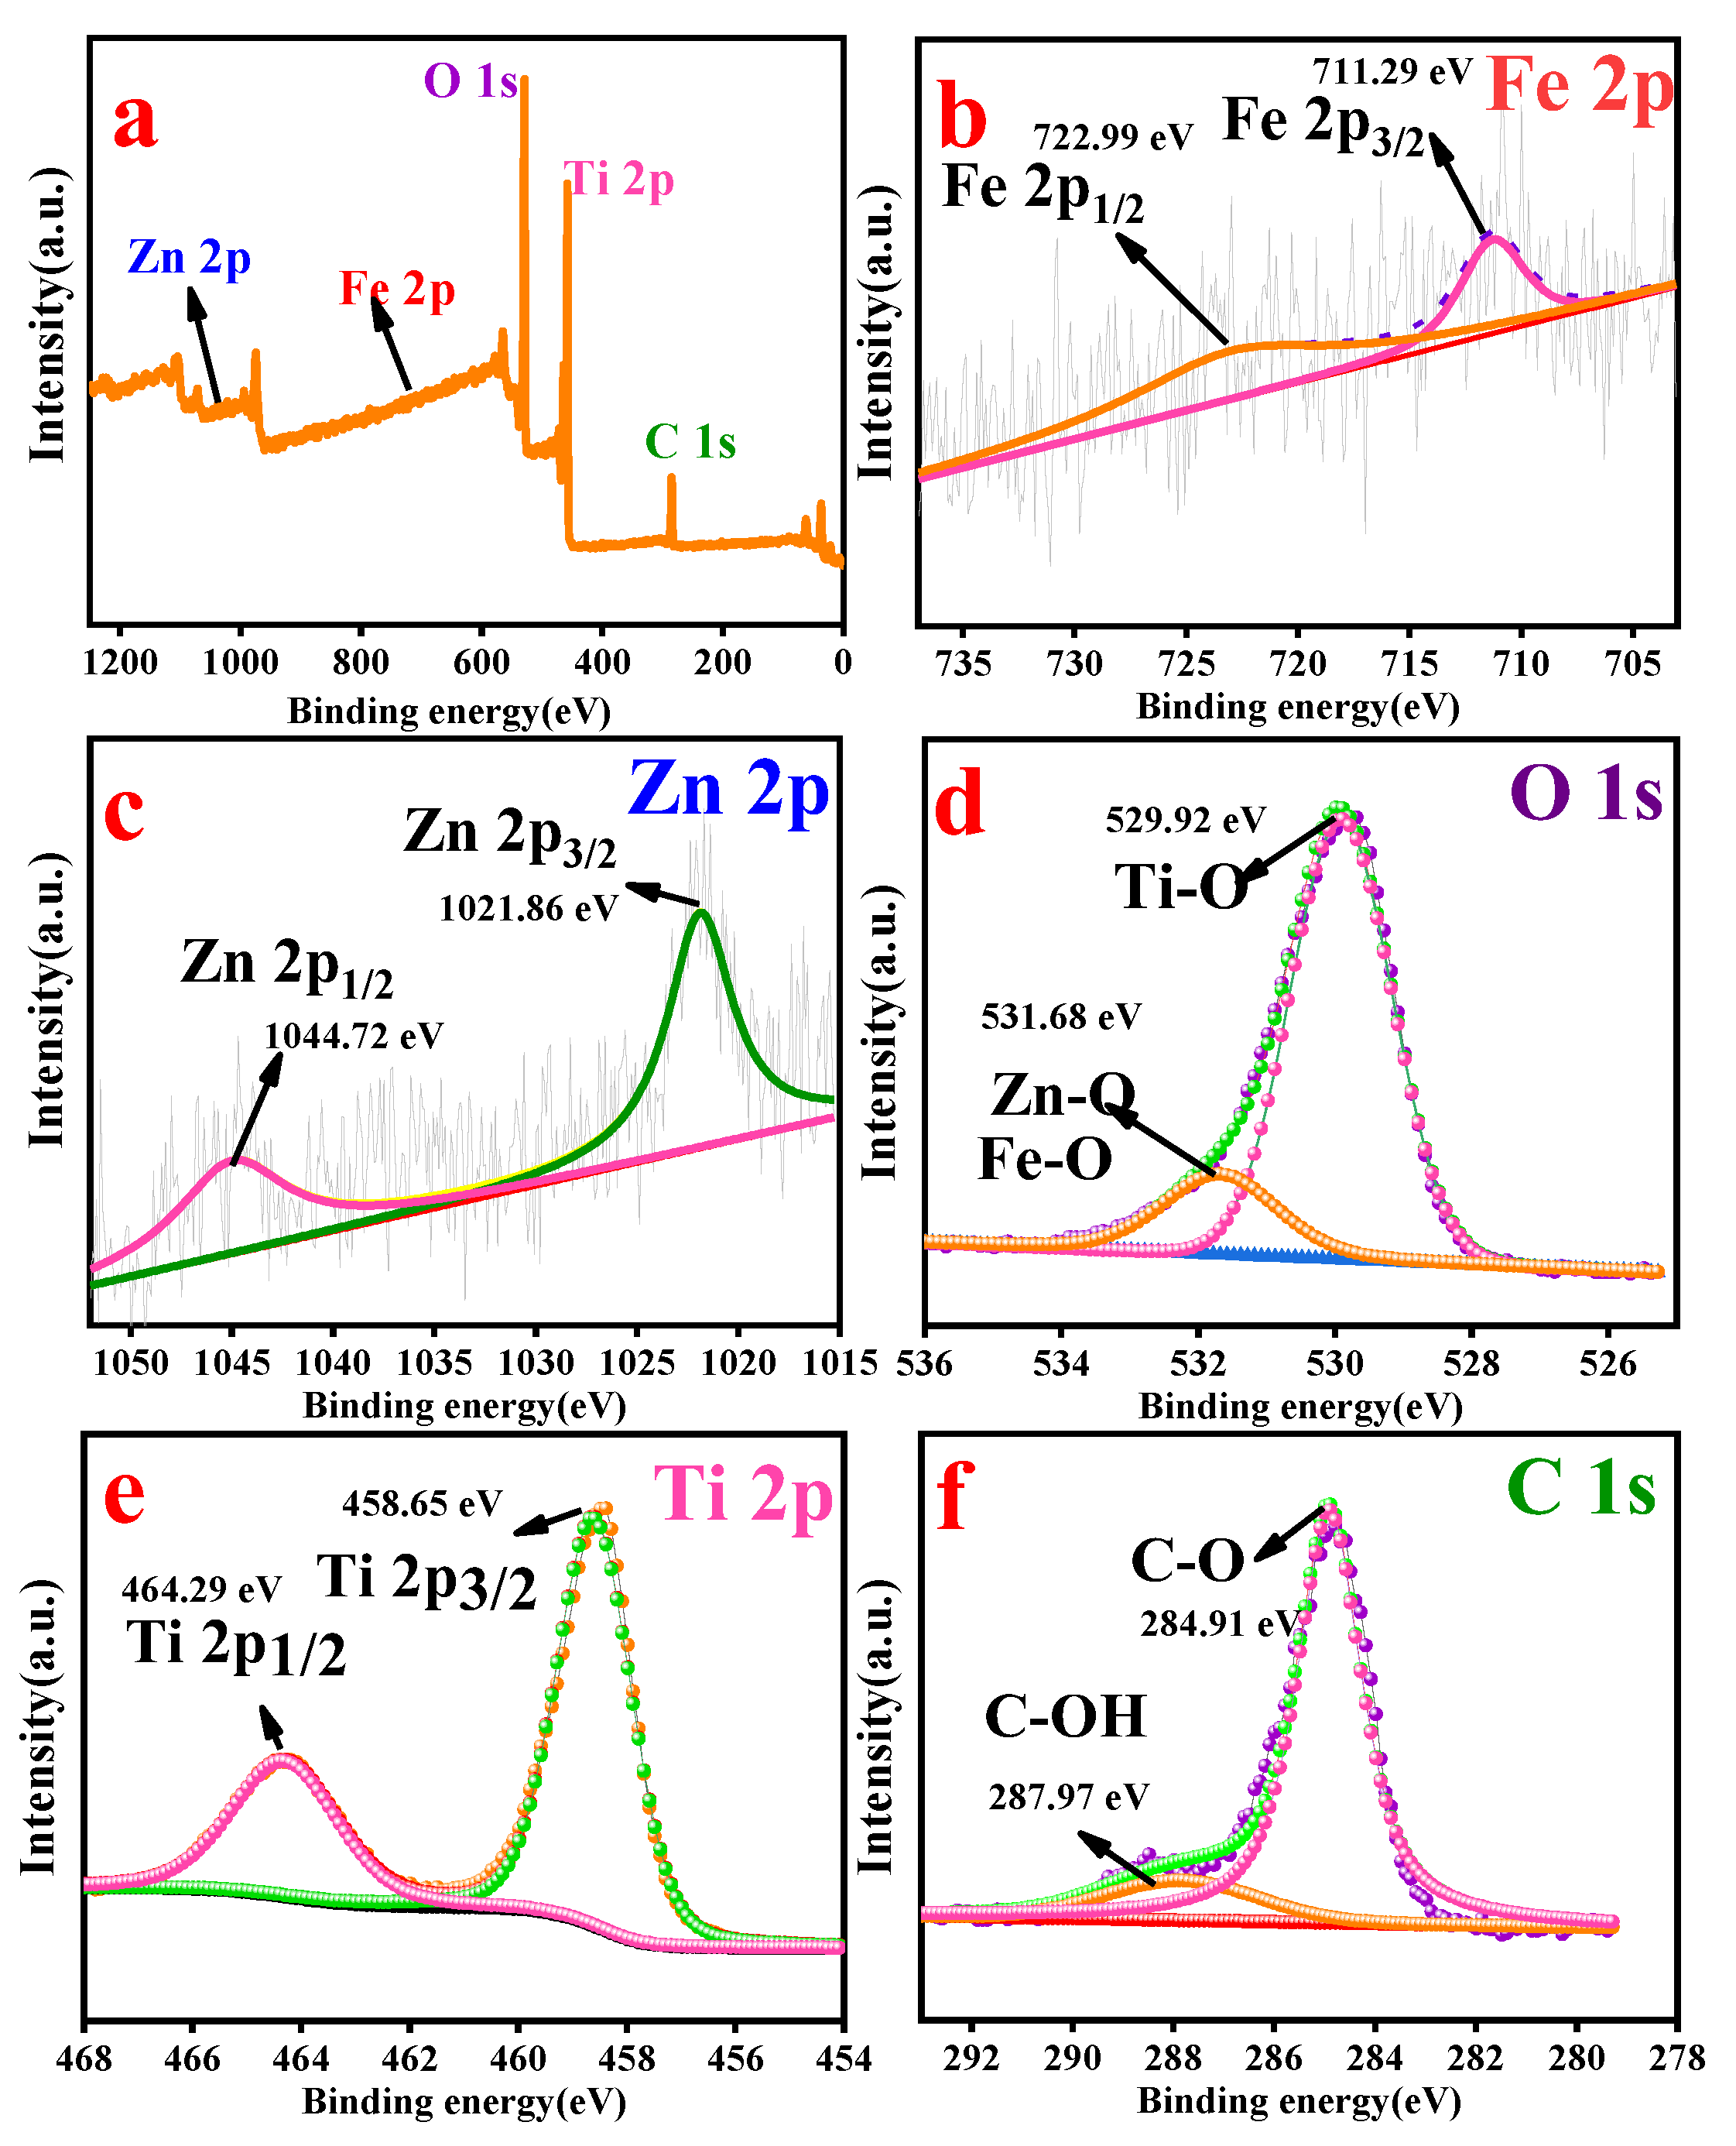
3.5. Chemical State Analysis

To further confirm the catalysts’ chemical bonds and functional groups, ZnFe2O4, TiO2, and ZT-1.2 were analyzed by infrared spectroscopy in the wavenumber range of 400–4000 cm−1. Figure 7 shows the infrared spectrum of the sample calcined at 500 °C for 2 h. The three catalysts have obvious absorption peaks at 3424 cm−1 and 1606 cm−1, which is caused by the stretching of the O–H bond, indicating that the sample may contain hydroxyl functional groups or residual moisture [21]. For the ZnFe2O4 monomer, the absorption peaks of the metal–oxygen bond at 444 cm−1 and 568 cm−1 correspond to the Fe–O functional group and the Zn–O functional group, respectively [22]. For the TiO2 monomer, the absorption band from 556 cm−1 to 788 cm−1 is due to the tensile vibration of Ti–O–Ti [23]. In the composite material ZT-1.2, these characteristic peaks all exist. The difference is that the surface of the absorption band becomes wider and smoother, while the absorption peak of pure ZnFe2O4 is relatively sharp. It is the result of the successful coupling between ZnFe2O4 and TiO2, further illustrating the successful loading of TiO2 onto ZnFe2O4. The position of the characteristic peak did not change, indicating that the chemical bond of the composite was not damaged in any way.
XPS characterization analysis was performed on sample ZT-1.2 to explore the composition of the composite catalyst and the valence state of the elements (Figure 8). As shown in the survey scope of ZT-1.2 (Figure 8a), the sample contains Fe, Zn, O, Ti, and C elements, where C element may be caused by sample contamination or the instrument itself, consistent with the results of EDS. These results can roughly prove the successful preparation of composite materials. At the same time, each element of the sample was qualitatively analyzed by high-resolution XPS. Figure 8b shows the high-resolution XPS spectrum of Fe 2p, which corresponds to Fe 2p3/2 and Fe 2p1/2 at a binding energy of 711.29 eV and 722.99 eV, respectively, indicating that the Fe element exists in the form of +3 valence [24]. Figure 8c is the XPS spectrum of Zn 2p, corresponding to the binding energy of Zn 2p3/2 at 1021.86 eV and Zn 2p1/2 at 1044.72 eV. The spectrum shows a noise peak with the presence of Zn2+ in the sample. The result might be due to the low content of ZnFe2O4 in the composite and the insignificant absorption peak [22]. Figure 8d shows the characteristic peak of O 1s, which is a typical metal–oxygen bond peak. The absorption peak at 529.92 eV can be attributed to the existence of the Ti–O bond, while the corresponding characteristic peak at 531.68 eV is caused by the existence of the Zn–O bond and Fe–O bond [25]. The binding energy of Ti 2p in Figure 8e shows that Ti2p3/2 and Ti 2p1/2 correspond at 458.65 eV and 464.29 eV, respectively, indicating that the material contains Ti element and exists in the form of Ti4+. It proves the successful generation of anatase TiO2 on the surface of ZnFe2O4 [26]. The binding energy of C 1s at 284.91 eV is attributed to the existence of the C–O bond, while the binding energy at 287.97 eV is the reason for the binding between C and hydroxyl oxygen (Figure 8f). It might be caused by the adsorption of water by C element [23].

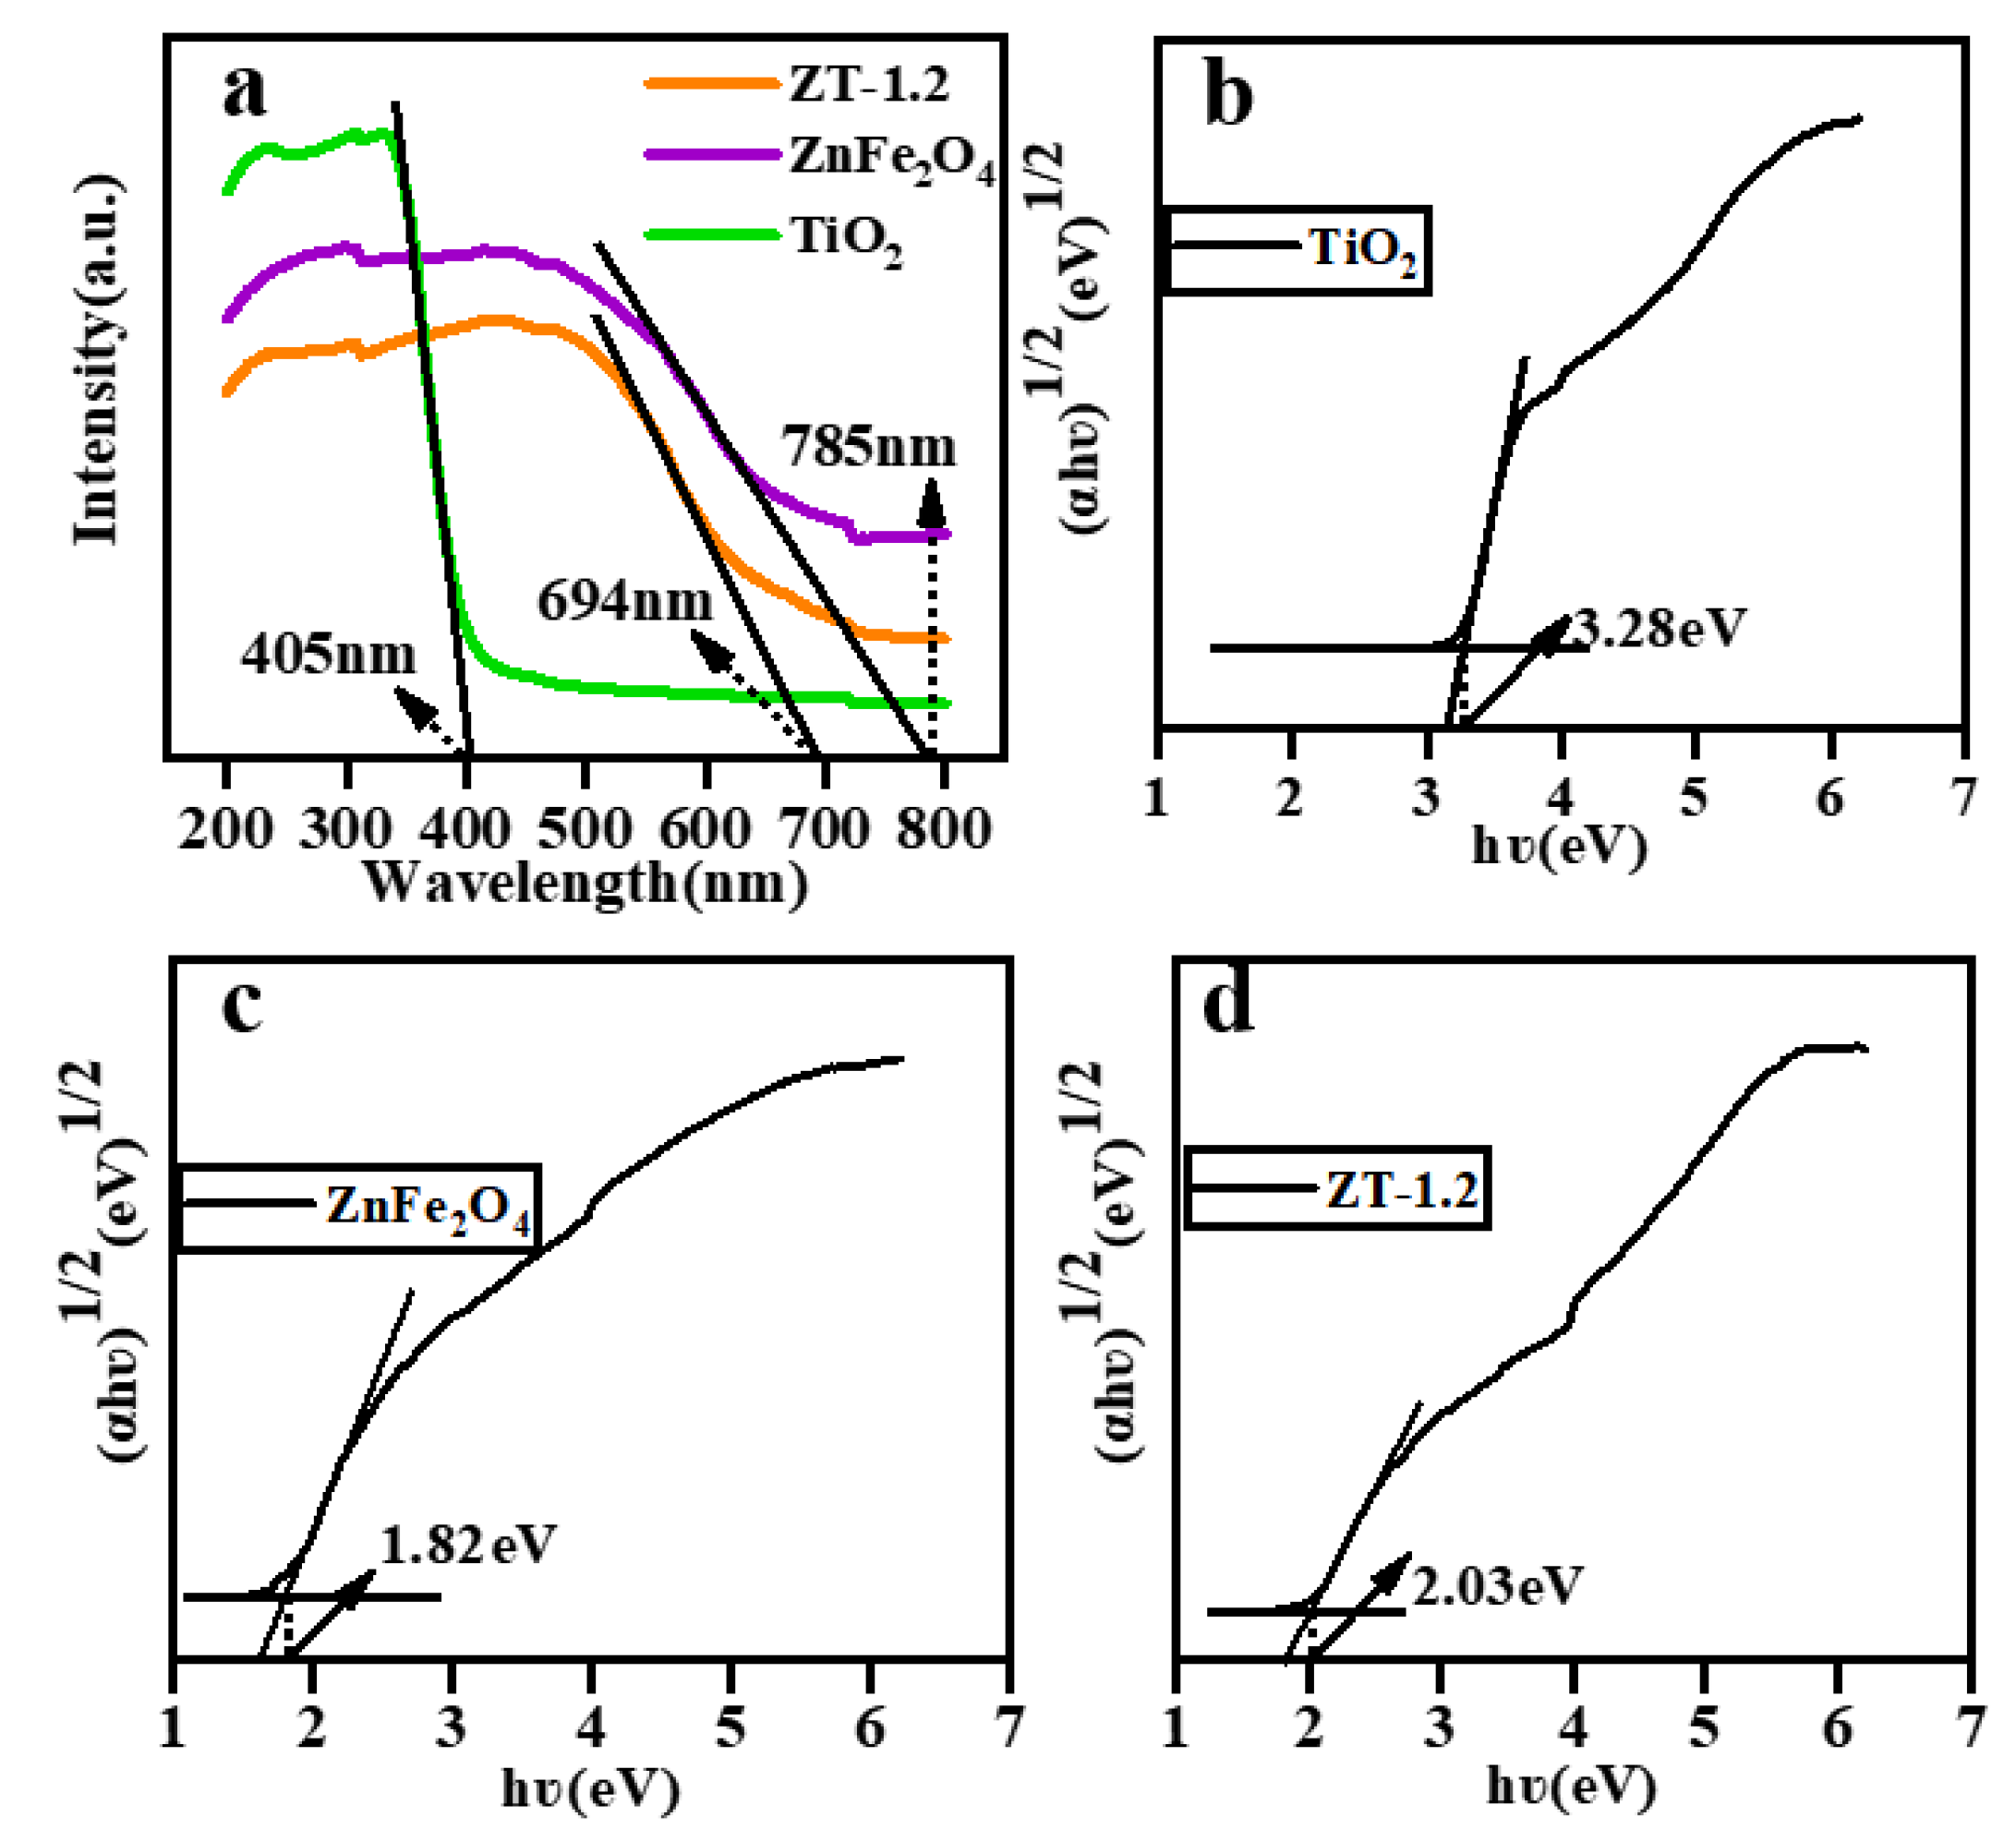
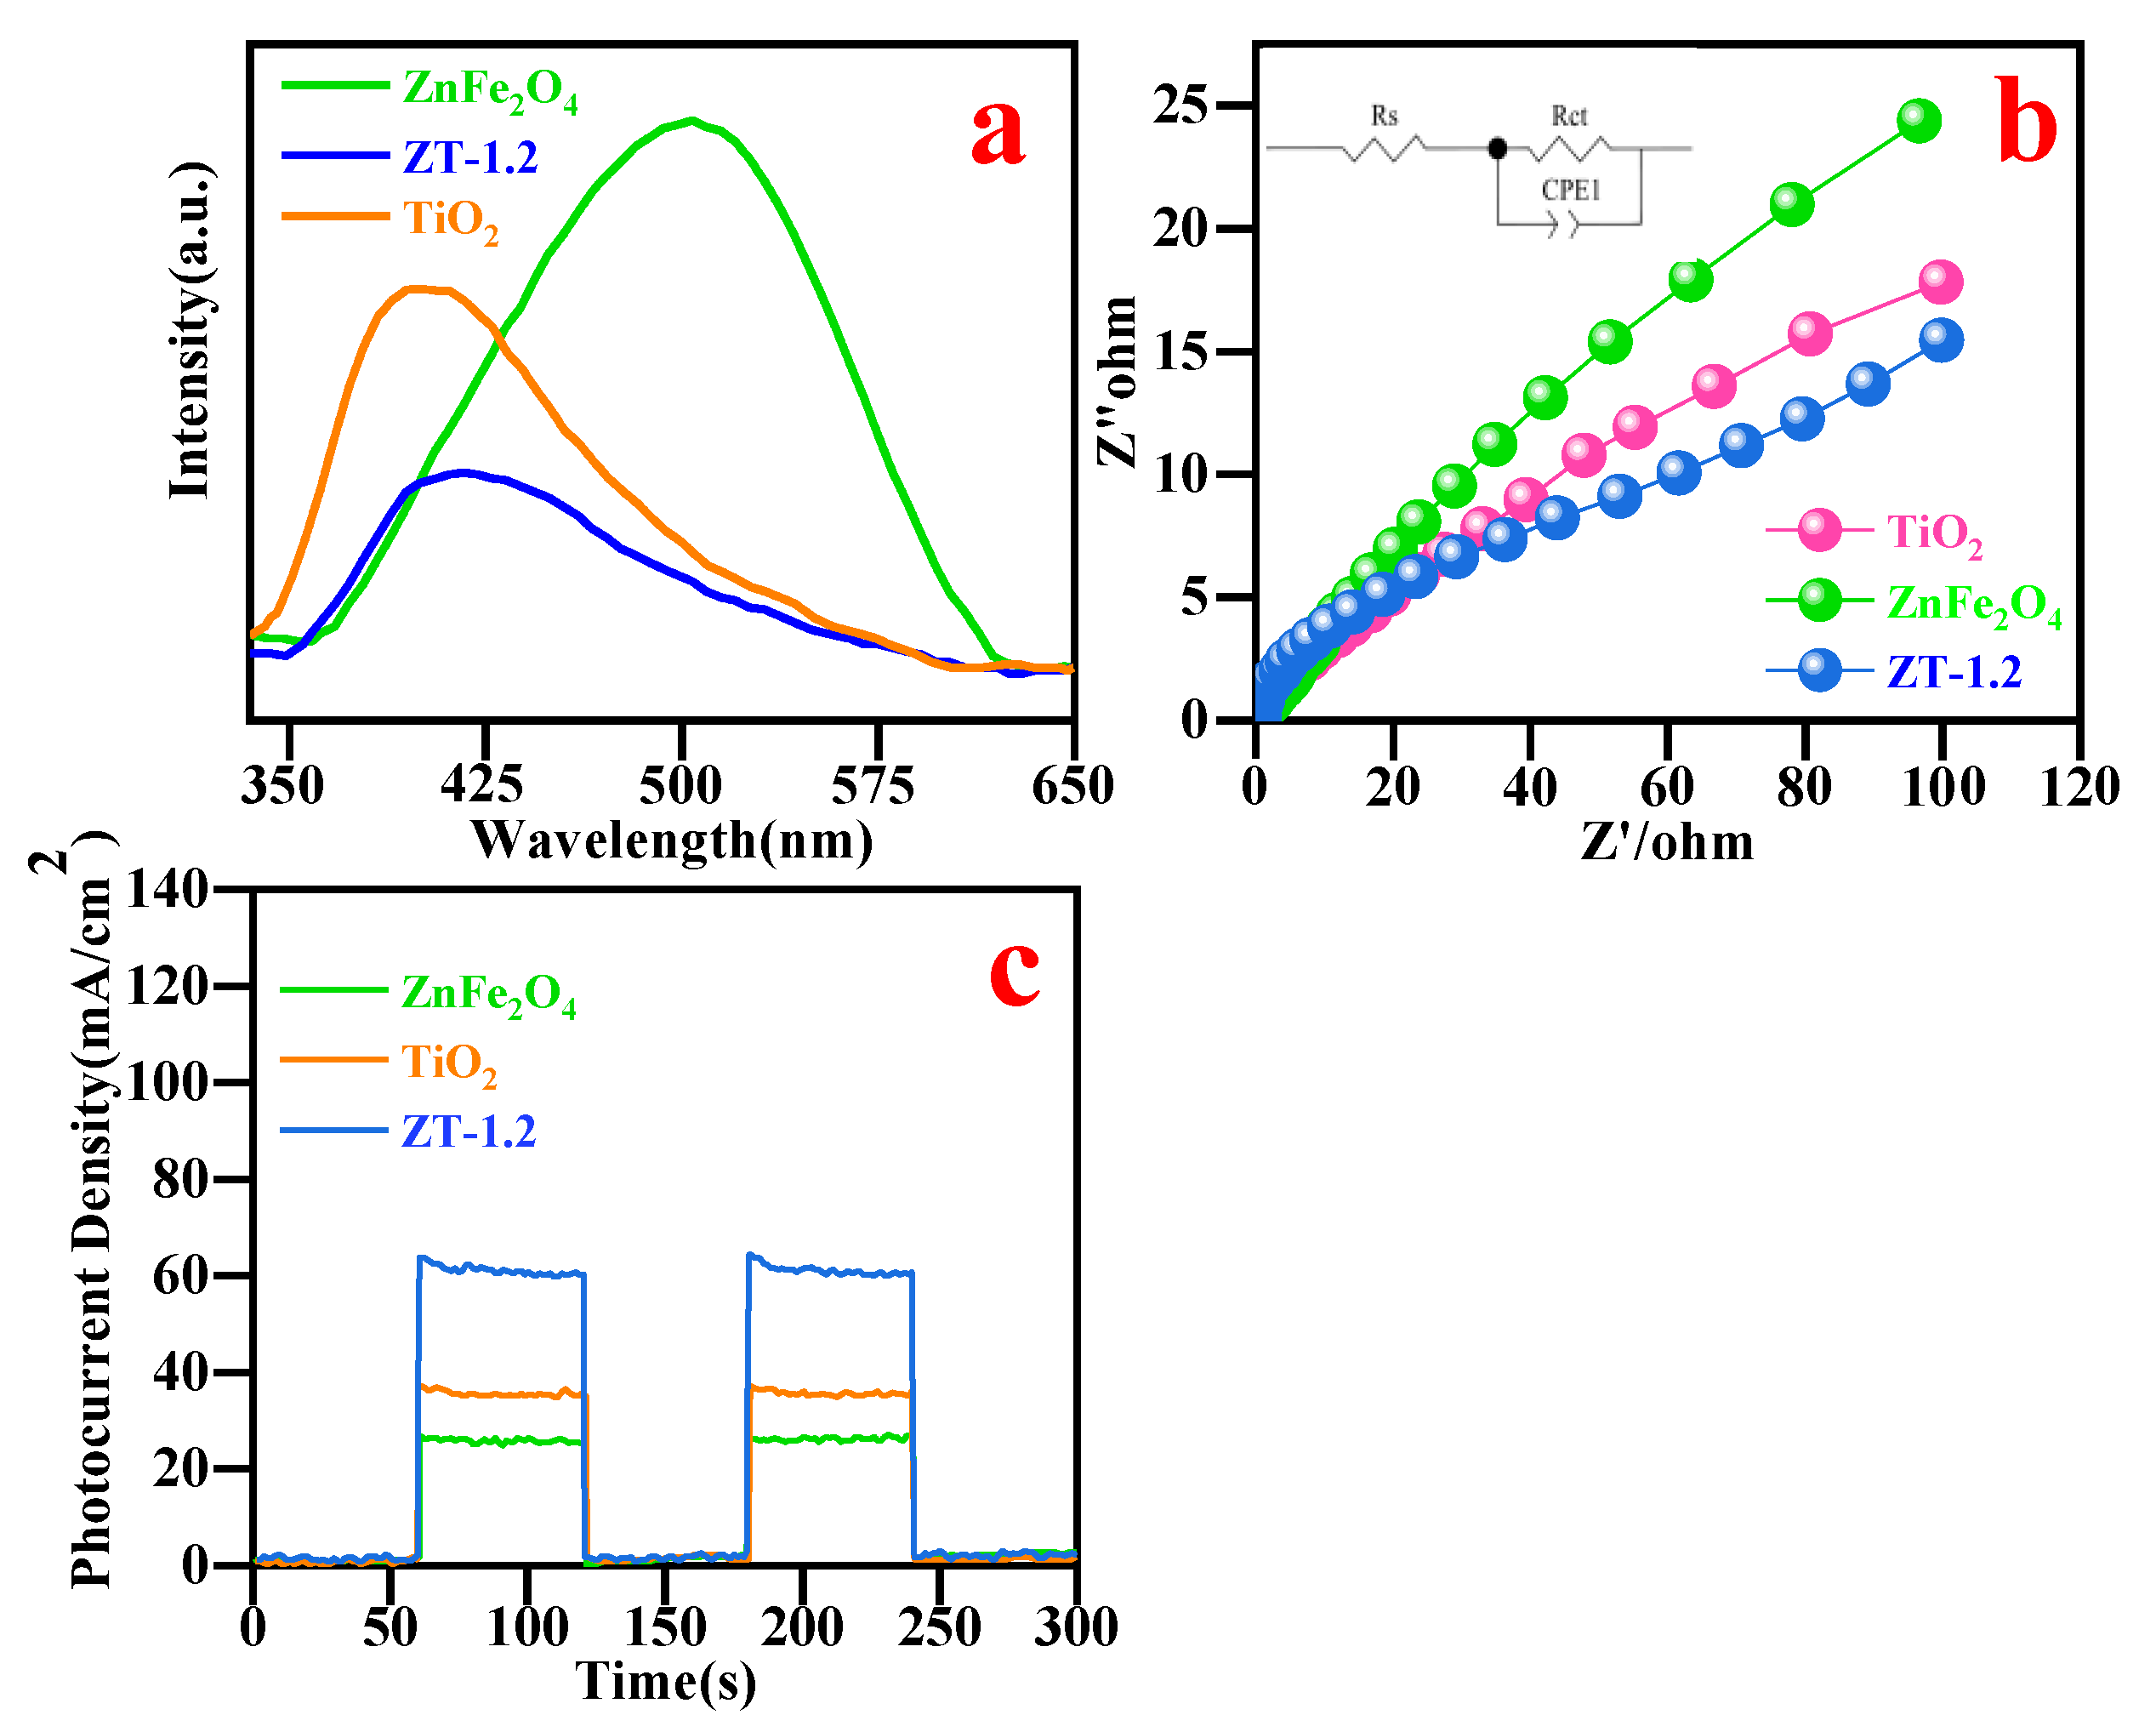
3.6. Optical Performance Analysis

The samples were analyzed by UV-vis diffuse reflectance spectroscopy to investigate the optical absorption properties of different photocatalysts and calculate the band gap width (Figure 9).
The absorption band of pure TiO2 is in the ultraviolet region, with strong light absorption at wavelengths below about 405 nm, which is attributed to the octahedral coordination of titanium in anatase TiO2 [27]; the absorption edges of ZnFe2O4 and ZT-1.2 are at 785 nm and 694 nm (Figure 9a), respectively. The addition of ZnFe2O4 makes the light absorption band of the composite material between pure TiO2 and ZnFe2O4, which broadens the light absorption range of TiO2. At the same time, the following formula is used to calculate the band gap width [28]:
(αhυ) = A(hυ − Eg) n/2
where α, h, υ, A, and Eg are the material’s absorption coefficient, Planck constant, optical frequency, constant, and band gap, respectively. For a direct bandgap semiconductor, n = 1; for an indirect bandgap semiconductor, n = 4. As shown in Figure 9b–d, the forbidden band widths of ZnFe2O4, TiO2, and ZT-1.2 are 1.82 eV, 3.28 eV, and 2.03 eV, respectively.

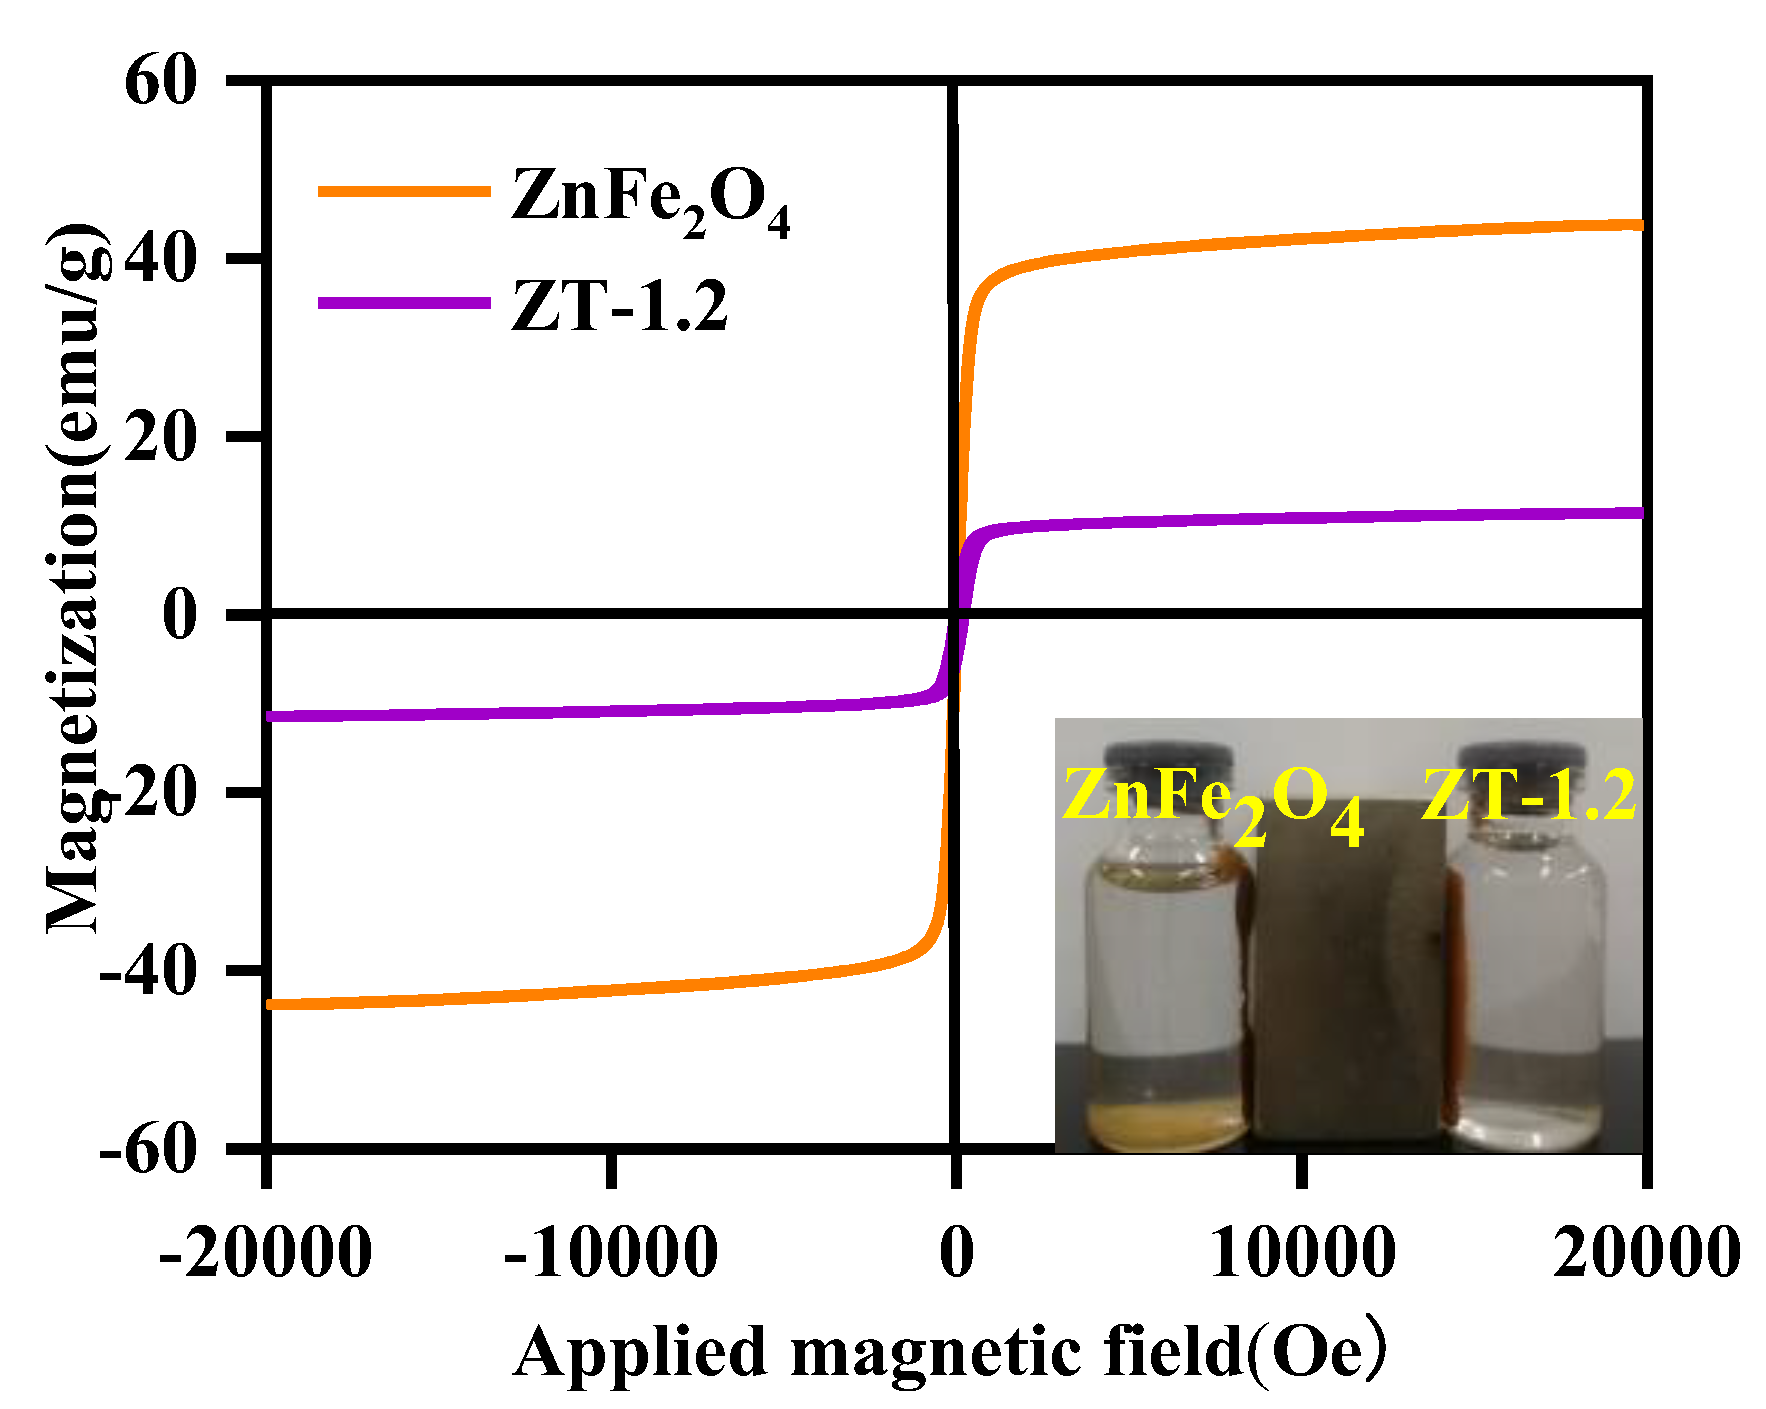
3.7. Magnetic Evaluation

The magnetic strength of the ZnFe2O4 and ZT-1.2 was measured with a VSM magnetometer to verify the catalyst’s magnetic recyclability. The test results are shown in Figure 10. ZnFe2O4 and ZT-1.2 exhibited superparamagnetic properties, and the saturation magnetization of ZnFe2O4 reached 44 emu/g. When TiO2 was loaded, the magnetism of the sample ZT-1.2 decreased, and the saturation magnetization became 11 emu/g. However, as shown in the figure, Catalysts can be collected by magnetic forces.

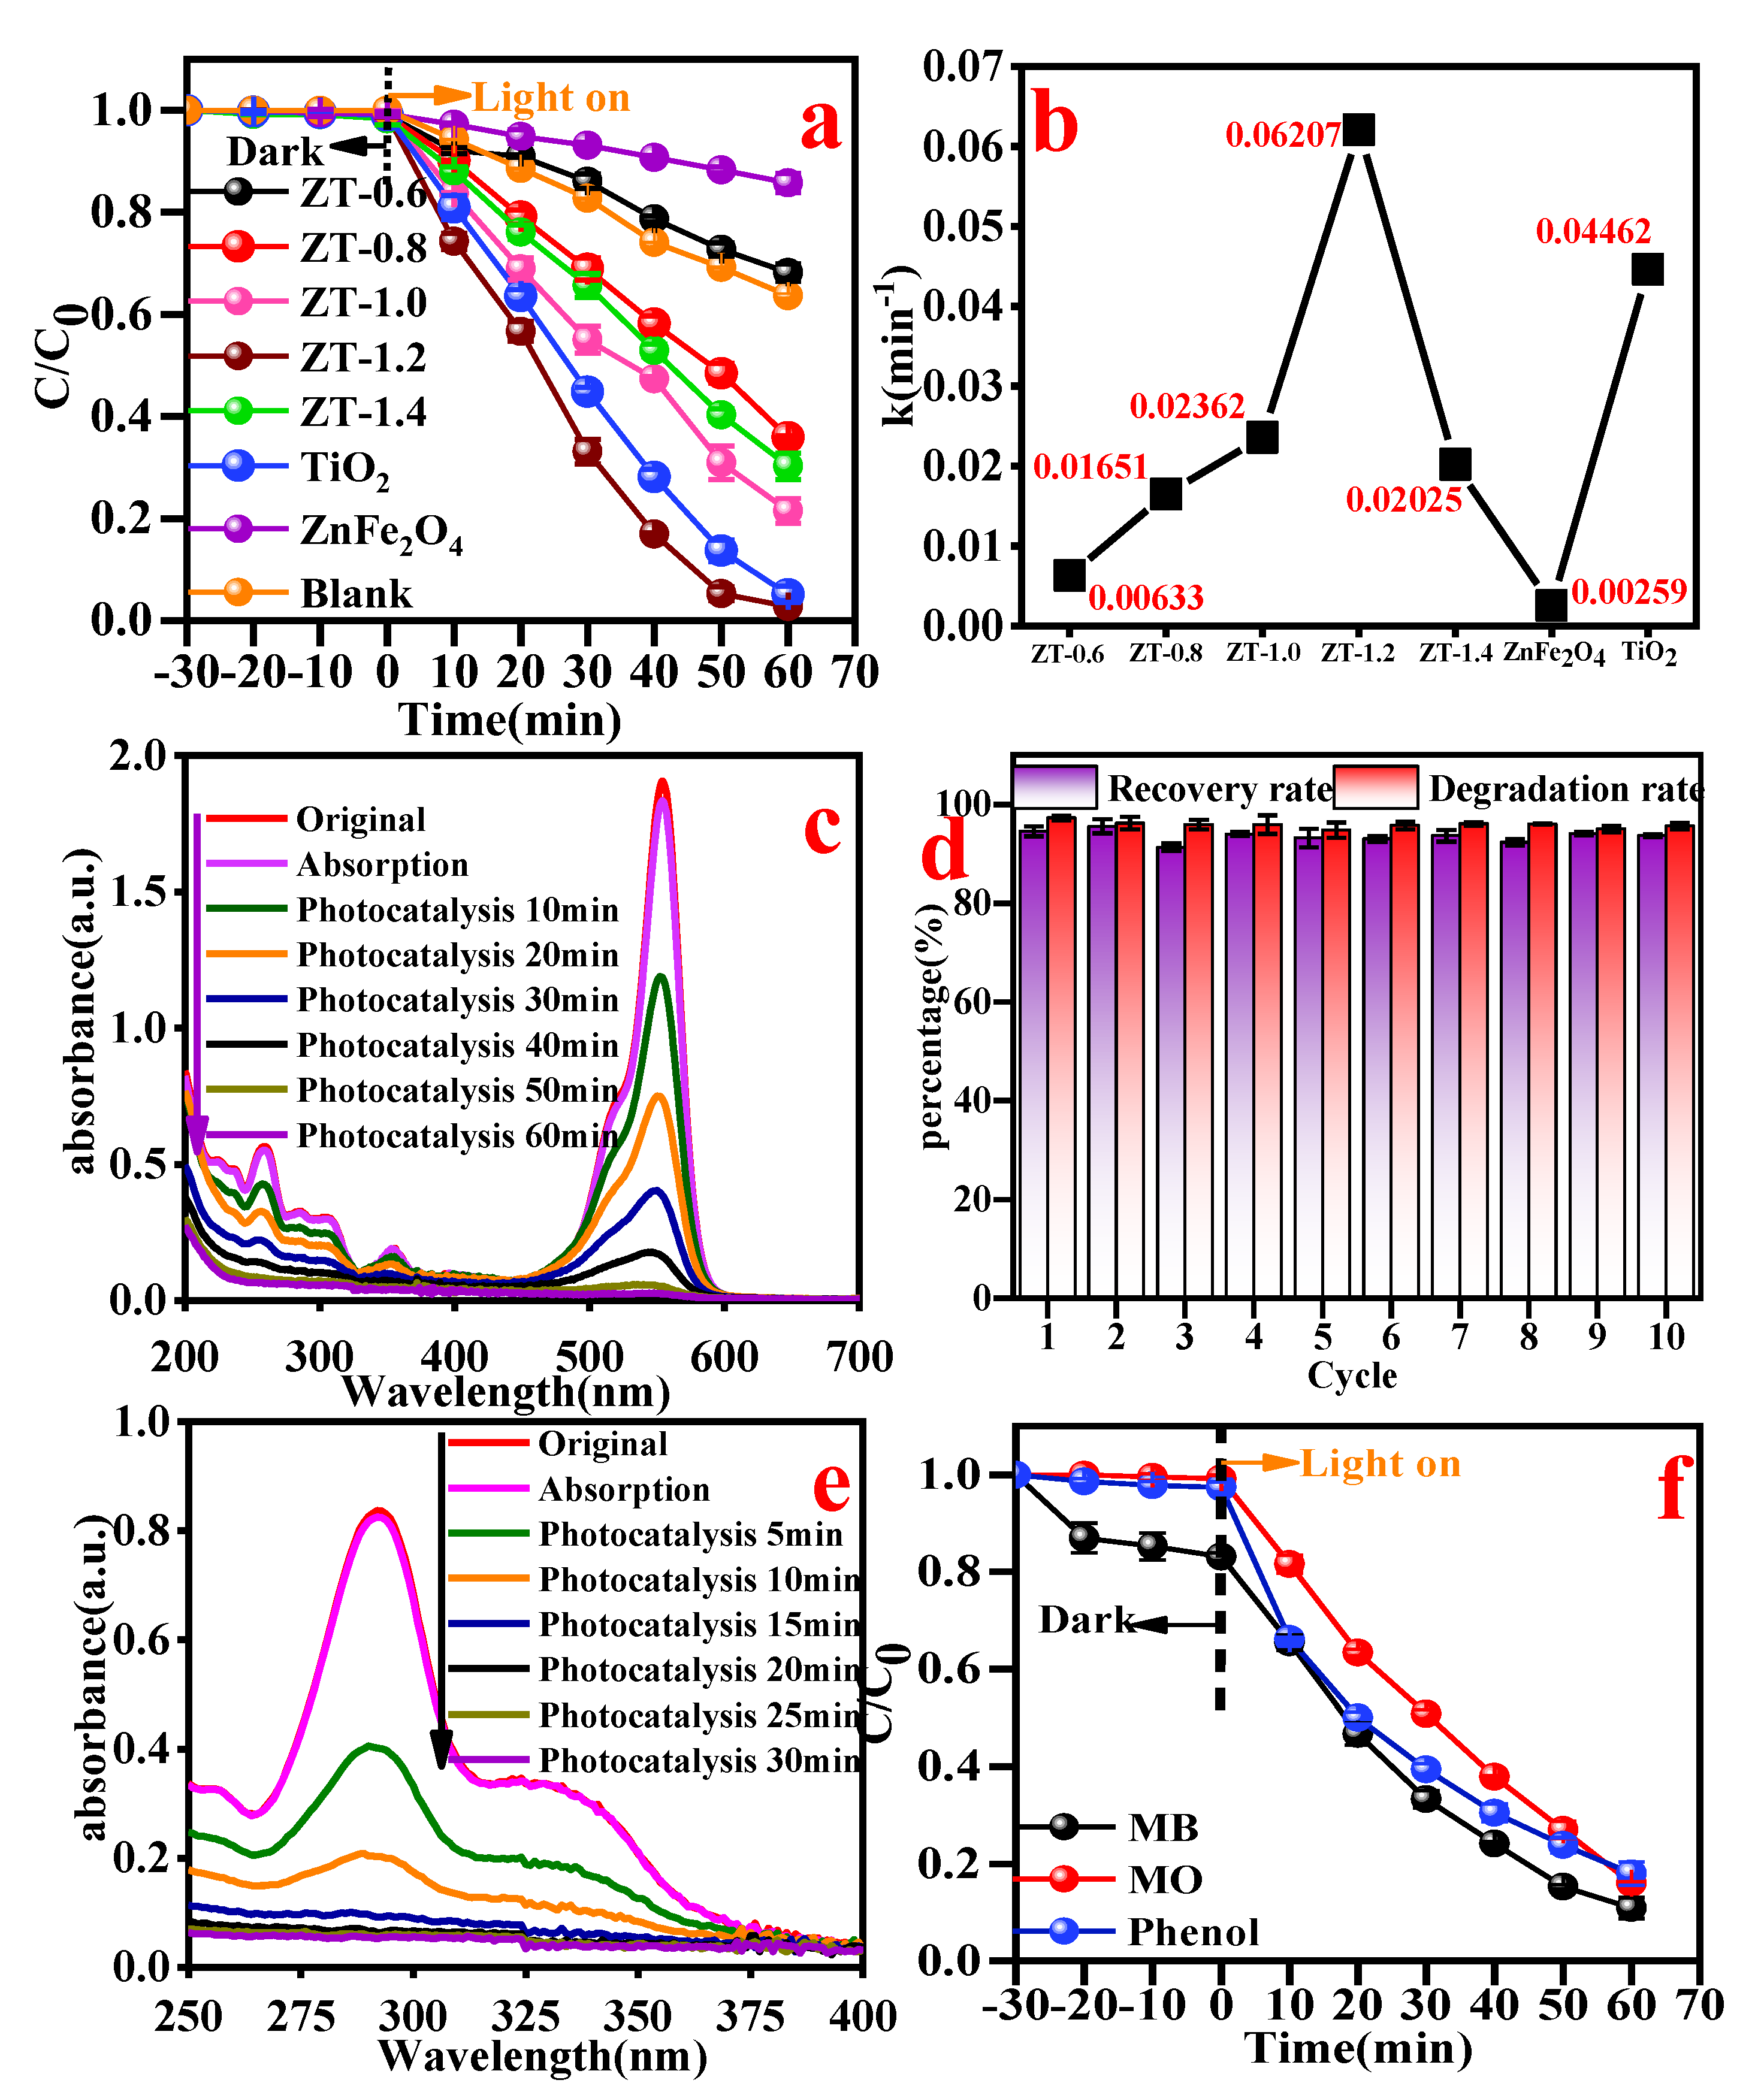
3.8. Photocatalytic Performance

The photocatalytic performance of the catalyst was investigated under UV irradiation, RhB was selected to find the optimal amount of TBOT, and the photocatalytic activity of the catalyst was further investigated by simulated pollutants, including MB, MO, Phenol, and OFX. The degradation rates of RhB by ZnFe2O4, TiO2, ZT-0.6, ZT-0.8, ZT-1.0, ZT-1.2, and ZT-1.4 were 14.2%, 94.9%, 31.8%, 64.1%, 78.5%, 97.3%, and 69.8% within 60 min, respectively (Figure 11a). The improvement of the degradation ability of ZT-1.2 was due to the formation of a heterojunction, while the decrease in the catalytic performance of ZT-1.4 might be caused by the agglomeration of the samples. The photolysis rate of the RhB solution was higher than that of ZnFe2O4 and ZT-0.6, which could be explained by the shading effect of the catalyst. The first-order kinetic reaction constant k of ZT-1.2 is 0.06207 min−1, 1.39 times that of TiO2 (Figure 11b). The gradual decrease in the absorption peak intensity at 554 nm in Figure 11c signifies the efficient degradation of RhB.
To explore the recovery efficiency of the catalyst and the degradation rate of the cycling experiment, the catalyst after the photocatalytic reaction was recovered by a magnet, washed with deionized water and anhydrous ethanol alternately three times, and dried in a blast drying oven at 60 °C for the next experiment. The recycling experiment was conducted 10 times. The recovery rate of the catalyst remained between 91.3% and 95.5%. In comparison, the degradation effect remained at 95.6% after 10 cycles, showing excellent stability (Figure 11d). The dissolution of Fe ions in the reaction process was measured by flame atomic absorption spectrophotometry, and the test results were all lower than the national standard detection limit of 0.03 mg/L, which could be regarded as not detected [29]. It shows that the TiO2 shell plays a protective role on the magnetic core ZnFe2O4, which confirms the stability of the core–shell structure. The absence of magnetic bleed is one of the main factors maintaining the stability of the catalyst. The photocatalytic performance of ZnFe2O4/TiO2 hybrid materials has been studied in the literature, but the cycling effect is not ideal, indicating that the core–shell structure can effectively improve the stability of the catalyst [30,31]. This study provides a reference for applying magnetic recovery catalysts to environmental sewage treatment. In addition, the degradation rate of OFX by ZT-1.2 was 93.0% within 30 min (Figure 11e), and the degradation rates of MB, MO, and Phenol reached 90.6%, 83.8%, and 80.3%, respectively, within 60 min (Figure 11f).

3.9. Photoelectric Properties

In order to explore the separation efficiency of photogenerated electron-hole pairs of the catalyst, steady-state fluorescence emission spectroscopy (PL), electrochemical impedance spectroscopy (EIS), and transient photocurrent measurements (I-t) were performed on the samples, as shown in Figure 12. ZT-1.2 had the lowest fluorescence peak intensity, indicating that the recombination of ZnFe2O4 and TiO2 inhibits the recombination of photogenerated carriers (Figure 12a) [32]. To further explore the state of internal charge transport during the reaction, EIS impedance spectroscopy was performed on the samples [33]. Figure 12b is the Nyquist curve, from which it can be clearly seen that the EIS curve has a semicircular arc. For EIS, the larger the radius of circular arc curvature, the greater the charge transfer impedance, that is, the more difficult the ionic reaction diffusion in the solution. Zview software was used to fit the experimental data. The attached figure in Figure 12b shows the equivalent fitting circuit, where Rs represents the resistance corresponding to the solid electrode (catalyst), including the electrode itself and the ionic resistance of the electrolyte, and RCT represents the resistance from the solid/liquid interface (the resistance of the sample and solution), C is the constant phase angle element, and the capacitance of the electrical layer is mathematically modeled to express non-ideal behavior due to the roughness of the electrode surface. The charge transfer resistance RCT reflects the difficulty of charge crossing the two-phase interface between the solution and the sample surface during the reaction, and the transfer rate of ions in the electrolyte can be seen visually. For the three groups of samples measured, ZnFe2O4 has the largest radius of curvature, followed by TiO2, and the smallest is ZF1.2, that is, the ZF1.2 sample has smaller reaction resistance for electron-hole transport to reach the surface, and better charge transport ability, which avoids the recombination problem caused by the delayed separation of electron holes, and is conducive to the photocatalytic reaction. In addition, the distribution characteristics of effective carriers of the catalyst were characterized by I-t spectra (Figure 12c). Higher photocurrent means more photo-generated carriers are enriched [34], ZT-1.2 had the highest photo-current intensity, indicating that the formation of a heterojunction inhibited the recombination of photo-generated electron-hole pairs, which was consistent with PL and EIS characterization results. In conclusion, compared with ZnFe2O4 and TiO2, ZT-1.2 could achieve efficient charge separation, which was attributed to the construction of the heterojunction.

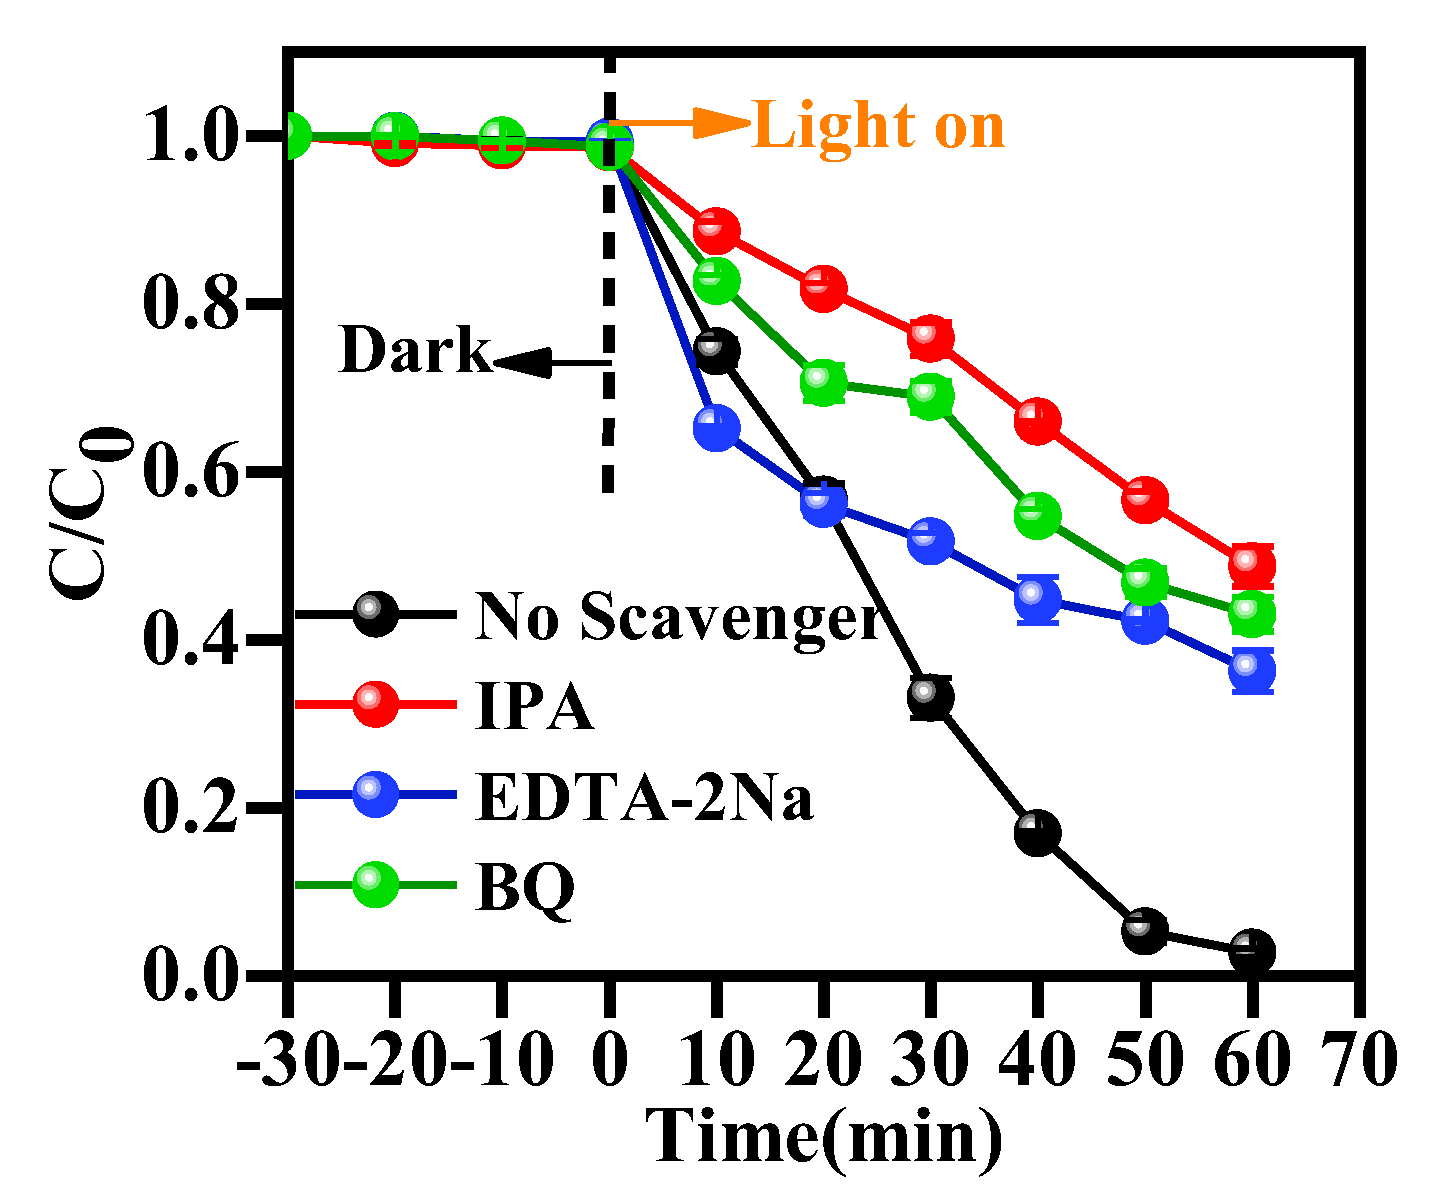
3.10. Photocatalytic Mechanism Study

ZT-1.2 was selected for active species trapping experiments to explore the photocatalytic mechanism. Isopropanol (IPA), p-benzoquinone (BQ), and disodium ethylene diamine tetraacetate (EDTA-2Na) were selected as trapping agents for ·OH, O2, and h+, respectively. The dosage of IPA was 0.03 mL, and the dosage of BQ and EDTA-2NA was 0.03 g. After the addition of IPA, BQ, and EDTA-2NA, the degradation rates of RhB by ZT-1.2 were 51.3%, 56.9%, and 63.7% (Figure 13), respectively, which showed a significant decrease compared with the control group, indicating that the three active species all played a certain role in photocatalytic degradation, and the central role was played by · OH. However, after adding EDTA-2Na, the catalytic effect was enhanced within 10 min. This might be due to the inactivation of part of h+, which prevented the recombination of e and h+. As the reaction continued, the degradation of RhB was inhibited.
To further clarify the charge transfer mechanism of the catalyst during the photoreaction process, the following formula was used to calculate the band position [35]:
ECB = χ − E0 − 0.5Eg
EVB = ECB + Eg
where χ represents the electronegativity of semiconductor materials, in which the electronegativity of TiO2 and ZnFe2O4 is 5.81 eV and 5.045 eV, respectively [36], and E0 represents the energy of free electrons of the hydrogen atom, which is a constant with a value of 4.5 eV. The results show that the ECB and EVB of ZnFe2O4 and TiO2 are −0.37/1.46 eV and −0.33/2.95 eV, respectively.
Assuming that the heterojunction forms a type II heterojunction, following the principle of e and h+ transfer from high to low, the e on the CB of ZnFe2O4 will be transferred to the CB of TiO2 by photoexcitation. However, the h+ on the VB of TiO2 will be transferred to the VB of ZnFe2O4. However, this transfer mechanism is inconsistent with the results of the active species capture experiment, because the potential of O2/O2 is −0.33 eV (vs. NHE) [37], which means that the position of CB can only generate O2 if the position is more negative than −0.33 eV. On the other hand, the VB position of ZnFe2O4 was lower than the redox potential of OH/OH (1.99 eV vs. NHE) [38]. This result indicates that the h+ on the VB of TiO2 is not transferred to the ZnFe2O4. Therefore, the compound semiconductor does not constitute a type II heterojunction.
Assuming that a Z-type heterojunction is formed, the e on the CB of TiO2 is transferred to the VB of ZnFe2O4. However, the e on the CB of ZnFe2O4 is retained and reacts with O2 to generate O2. At the same time, part of h+ on VB of TiO2 directly oxidizes pollutants, but the others react with OH (OH/OH = 1.99 eV) [39] or H2O (H2O/OH = 2.40 eV) [40] to produce ·OH. Therefore, h+, ·OH, and O2·- as active species promote the degradation of RhB, consistent with the active species capture experiment. Thus, the photocatalytic enhancement mechanism should be that the composite material constitutes the Z-type heterojunction, as shown in Figure 14.

3.11. Advantages of Ultrasonic Method

The catalyst prepared by mechanical agitation was named ZTM-1.2, and the degradation rate of RhB by ZTM-1.2 was 36.8% within 60 min (Figure 15a). The inefficient degradation rate was caused by the agglomeration phenomenon of ZTM-1.2 (Figure 15b) and the low TiO2 loading (Figure 15c) experiments have verified the time-saving and efficient characteristics of the ultrasonic loading method. The preparation methods of partial TiO2-based core–shell photocatalysts are listed in Table 1. Compared with the ultrasonic method, the mechanical agitation method has strict ambient temperature and reaction time requirements, and the preparation process is more complicated and time-consuming. On the contrary, the ultrasonic method is more time-saving and efficient, providing a new approach to preparing a core–shell structure photocatalyst.

4. Conclusions

A method for ultrasonically preparing a novel ZnFe2O4@TiO2 core–shell photocatalyst was proposed, and the successful preparation of the composite was demonstrated using characterization. SEM, TEM, and EDS were used to characterize the morphology of the samples, XRD was used to analyze the crystal phase of the samples, FTIR and XPS were used to analyze the chemical state of the samples, and DRS was used to analyze the optical properties of the catalyst, and the band gap and energy band position were calculated. VSM was used to test the magnetic strength of the catalyst. All kinds of characterization results confirmed the successful preparation of the ZnFe2O4@TiO2 core–shell photocatalyst. ZT-1.2 exhibited the best photocatalytic effect on RhB, with a degradation rate of 97.3% within 60 min under UV irradiation, and the degradation rates of MB, MO, and Phenol were 90.6%, 83.8%, and 80.3%, respectively. ZT-1.2 also has excellent stability and maintains a degradation rate of 95.6% for RhB after 10 cycles, which may be the protective effect of the TiO2 shell on ZnFe2O4. In the active species capture experiment, h+, ·OH, and O2·- were all involved in the degradation of RhB, indicating that the excellent performance of ZT-1.2 was due to the charge transfer mechanism of the Z-type heterojunction, and the mechanism of enhancing photocatalytic performance of ZT-1.2 was also analyzed by photoelectric characteristics. In addition, the superiority of the ultrasonic method compared to the mechanical method is also proved in this paper, providing a new insight into preparing magnetically recoverable TiO2 core–shell photocatalysis.

Author Contributions

R.C., S.D. and B.W.: Methodology, Formal analysis. X.R.: Supervision, Writing—review and editing. All authors have read and agreed to the published version of the manuscript.

Funding

This research received no external funding.

Institutional Review Board Statement

Not applicable.

Informed Consent Statement

Not applicable.

Data Availability Statement

Data sharing is not applicable to this article.

Conflicts of Interest

The authors declare no conflict of interest.

References

  1. Nemiwal, M.; Zhang, T.C.; Kumar, D. Recent progress in g-C3N4, TiO2 and ZnO based photocatalysts for dye degradation: Strategies to improve photocatalytic activity. Sci. Total Environ. 2021, 767, 144896. [Google Scholar] [CrossRef]
  2. Roy, N.; Alex, S.A.; Chandrasekaran, N.; Mukherjee, A.; Kannabiran, K. A comprehensive update on antibiotics as an emerging water pollutant and their removal using nano-structured photocatalysts. J. Environ. Chem. Eng. 2021, 9, 104796. [Google Scholar] [CrossRef]
  3. Yang, X.; Chen, Z.; Zhao, W.; Liu, C.; Qian, X.; Zhang, M.; Wei, G.; Khan, E.; Hau Ng, Y.; Sik Ok, Y. Recent advances in photodegradation of antibiotic residues in water. Chem. Eng. J. 2021, 405, 126806. [Google Scholar] [CrossRef] [PubMed]
  4. Asim Jilani, A.A.M. MoS2-Cu/CuO@graphene Heterogeneous Photocatalysis for Enhanced Photocatalytic Degradation of MB from Water. Polymers 2022, 14, 3259. [Google Scholar] [CrossRef] [PubMed]
  5. Zhu, D.; Zhou, Q. Action and mechanism of semiconductor photocatalysis on degradation of organic pollutants in water treatment: A review. Environ. Nanotechnol. Monit. Manag. 2019, 12, 100255. [Google Scholar] [CrossRef]
  6. Fujishima, A.; Honda, K. Electrochemical photolysis of water at a semiconductor electrode. Nature 1972, 238, 37–38. [Google Scholar] [CrossRef]
  7. Carey, J.H.; Lawrence, J.; Tosine, H.M. Photodechlorination of PCB’s in the presence of titanium dioxide in aqueous suspensions. Bull. Environ. Contam. Toxicol. 1976, 16, 697–701. [Google Scholar] [CrossRef]
  8. Guo, Q.; Zhou, C.; Ma, Z.; Yang, X. Fundamentals of TiO2 Photocatalysis: Concepts, Mechanisms, and Challenges. Adv. Mater. 2019, 31, 1901997. [Google Scholar] [CrossRef]
  9. Kusiak-Nejman, E.; Morawski, A.W. TiO2/graphene-based nanocomposites for water treatment: A brief overview of charge carrier transfer, antimicrobial and photocatalytic performance. Appl. Catal. B Environ. 2019, 253, 179–186. [Google Scholar] [CrossRef]
  10. Kumar, A.; Khan, M.; He, J.; Lo, I.M.C. Recent developments and challenges in practical application of visible–light–driven TiO2–based heterojunctions for PPCP degradation: A critical review. Water Res. 2020, 170, 115356. [Google Scholar] [CrossRef]
  11. Ratova, M.; Redfern, J.; Verran, J.; Kelly, P.J. Highly efficient photocatalytic bismuth oxide coatings and their antimicrobial properties under visible light irradiation. Appl. Catal. B Environ. 2018, 239, 223–232. [Google Scholar] [CrossRef]
  12. Zhang, Y.; Duoerkun, G.; Shi, Z.; Cao, W.; Liu, T.; Liu, J.; Zhang, L.; Li, M.; Chen, Z. Construction of TiO2/Ag3PO4 nanojunctions on carbon fiber cloth for photocatalytically removing various organic pollutants in static or flowing wastewater. J. Colloid Interface Sci. 2020, 571, 213–221. [Google Scholar] [CrossRef]
  13. Feizpoor, S.; Habibi-Yangjeh, A. Ternary TiO2/Fe3O4/CoWO4 nanocomposites: Novel magnetic visible-light-driven photocatalysts with substantially enhanced activity through p-n heterojunction. J. Colloid Interface Sci. 2018, 524, 325–336. [Google Scholar] [CrossRef]
  14. Ayyappan, S.; Paneerselvam, G.; Antony, M.P.; Philip, J. Structural stability of ZnFe2O4 nanoparticles under different annealing conditions. Mater. Chem. Phys. 2011, 128, 400–404. [Google Scholar] [CrossRef]
  15. Janani, B.; Syed, A.; Sruthi, L.; Sivaranjani, P.R.; Elgorban, A.M.; Bahkali, A.H.; Zaghloul, N.S.S.; Badawy, M.M.; Das, A.; Khan, S.S. Visible light driven photocatalytic activity and efficient antibacterial activity of ZnFe2O4 decorated CdO nanohybrid heterostructures synthesized by ultrasonic-assisted method. Colloids Surf. A Physicochem. Eng. Asp. 2021, 628, 127307. [Google Scholar] [CrossRef]
  16. Zhang, X.; Lin, B.; Li, X.; Wang, X.; Huang, K.; Chen, Z. MOF-derived magnetically recoverable Z-scheme ZnFe2O4/Fe2O3 perforated nanotube for efficient photocatalytic ciprofloxacin removal. Chem. Eng. J. 2022, 430, 132728. [Google Scholar] [CrossRef]
  17. Choudhary, S.; Bisht, A.; Mohapatra, S. Microwave-assisted synthesis of α-Fe2O3/ZnFe2O4/ZnO ternary hybrid nanostructures for photocatalytic applications. Ceram. Int. 2021, 47, 3833–3841. [Google Scholar] [CrossRef]
  18. Huang, Y.; Xing, W.; Fan, J.; Dai, J.; Liu, Q.; Hu, F.; Xu, G. Preparation and microwave absorption properties of the hollow ZnFe2O4@C composites with core-shell structure. J. Magn. Magn. Mater. 2020, 502, 166543. [Google Scholar] [CrossRef]
  19. Wang, D.; Yang, J.; Li, X.; Zhai, H.; Lang, J.; Song, H. Preparation of magnetic Fe3O4@SiO2@mTiO2–Au spheres with well-designed microstructure and superior photocatalytic activity. J. Mater. Sci. 2016, 51, 9602–9612. [Google Scholar] [CrossRef]
  20. Hou, L.; Li, W.; Wu, Z.; Wei, Q.; Yang, H.; Jiang, Y.; Wang, T.; Wang, Y.; He, Q. Embedding ZnCdS@ZnIn2S4 into thiazole-modified g-C3N4 by electrostatic self-assembly to build dual Z-scheme heterojunction with spatially separated active centers for photocatalytic H2 evolution and ofloxacin degradation. Sep. Purif. Technol. 2022, 290, 120858. [Google Scholar] [CrossRef]
  21. Xu, Q.; Feng, J.; Li, L.; Xiao, Q.; Wang, J. Hollow ZnFe2O4/TiO2 composites: High-performance and recyclable visible-light photocatalyst. J. Alloys Compd. 2015, 641, 110–118. [Google Scholar] [CrossRef]
  22. Li, J.; Huang, Y.; Su, M.; Xie, Y.; Chen, D. Dual light-driven p-ZnFe2O4/n-TiO2 catalyst: Benzene-breaking reaction for malachite green. Environ. Res. 2022, 207, 112081. [Google Scholar] [CrossRef]
  23. Lu, Y.; Feng, Y.; Wang, F.; Zou, X.; Chen, Z.F.; Chen, P.; Liu, H.; Su, Y.; Zhang, Q.; Liu, G. Facile hydrothermal synthesis of carbon dots (CDs) doped ZnFe2O4/TiO2 hybrid materials with high photocatalytic activity. J. Photochem. Photobiol. A Chem. 2018, 353, 10–18. [Google Scholar] [CrossRef]
  24. Liu, H.; Chen, Y.; Li, H.; Jiang, H.; Tian, G. Achieving cadmium selenide-decorated zinc ferrite@titanium dioxide hollow core/shell nanospheres with improved light trapping and charge generation for photocatalytic hydrogen generation. J. Colloid Interface Sci. 2020, 575, 158–167. [Google Scholar] [CrossRef]
  25. Zeng, D.; Wang, J.; Xie, Y.; Ling, Y.; Zhao, J.; Ye, H.; Chen, T. TiO2@ZnFe2O4 heterojunctions for effecicent photocatalytic degradation of persistent pollutants and hydrogen evolution. Mater. Chem. Phys. 2022, 277, 125462. [Google Scholar] [CrossRef]
  26. Fu, N.; Ren, X.C.; Wan, J.X. Preparation of ag-coated SiO2@TiO2 core-shell nanocomposites and their photocatalytic applications towards phenol and methylene blue degradation. J. Nanomater. 2019, 2019, 1–8. [Google Scholar] [CrossRef]
  27. Pan, Y.; Zhang, Y.; Huang, Y.; Jia, Y.; Chen, L.; Cui, H. Synergistic effect of adsorptive photocatalytic oxidation and degradation mechanism of cyanides and Cu/Zn complexes over TiO2/ZSM-5 in real wastewater. J. Hazard. Mater. 2021, 416, 125802. [Google Scholar] [CrossRef]
  28. Wang, X.; Dai, Y.; Tian, C.; Zhang, H.; Li, X.; Liu, W.; Li, W.; Kuang, S.; Tong, H. Boosted photocatalytic removal of Cr(VI) using MoS2 modified g-C3N4/ZnFe2O4 magnetic heterojunction composites. Process Saf. Environ. Prot. 2022, 162, 72–82. [Google Scholar] [CrossRef]
  29. GB11911-89; Ministry of Environmental Protection of the People’s Republic of China. China Environmental Monitoring Station. Water Quality Determination of Fe and Mn Flame Atomic Absorption Spectrophotometry. China Standard Press: Beijing, China, 1990.
  30. Ahmadpour, N.; Sayadi, M.H.; Sobhani, S.; Hajiani, M. Photocatalytic degradation of model pharmaceutical pollutant by novel magnetic TiO2@ZnFe2O4/Pd nanocomposite with enhanced photocatalytic activity and stability under solar light irradiation. J. Environ. Manag. 2020, 271, 110964. [Google Scholar] [CrossRef]
  31. Ahmadpour, N.; Sayadi, M.H.; Sobhani, S.; Hajiani, M. A potential natural solar light active photocatalyst using magnetic ZnFe2O4@TiO2/Cu nanocomposite as a high performance and recyclable platform for degradation of naproxen from aqueous solution. J. Clean. Prod. 2020, 268, 122023. [Google Scholar] [CrossRef]
  32. Chen, J.; Gao, J.; Liu, X.; Wang, P.; Yu, X.; Zhao, F.; Sun, Y.; Feng, W.; Wang, Q. Controllable Phase Transformation and Enhanced Photocatalytic Performance of Nano-TiO2 by Using Oxalic Acid. Nanomaterials 2022, 12, 3019. [Google Scholar] [CrossRef] [PubMed]
  33. Hoang, T.V.A. The Growth of Extended Melem Units on g-C3N4 by Hydrothermal Treatment and Its Effect on Photocatalytic Activity of g-C3N4 for Photodegradation of Tetracycline Hydrochloride under Visible Light Irradiation. Nanomaterials 2022, 12, 2945. [Google Scholar] [CrossRef] [PubMed]
  34. Aihemaiti, X.; Wang, X.; Wang, Z.; Bai, Y.; Qi, K.; Ma, Y.; Tao, K.; Simayi, M.; Kuerban, N. Effective prevention of charge trapping in red phosphorus with nanosized CdS modification for superior photocatalysis. J. Environ. Chem. Eng. 2021, 9, 106479. [Google Scholar] [CrossRef]
  35. Kobkeatthawin, T.; Chaveanghong, S.; Trakulmututa, J.; Amornsakchai, T.; Kajitvichyanukul, P.; Smith, S.M. Photocatalytic Activity of TiO2/g-C3N4 Nanocomposites for Removal of Monochlorophenols from Water. Nanomaterials 2022, 12, 2852. [Google Scholar] [CrossRef] [PubMed]
  36. Sun, Y.; Lei, J.; Wang, Y.; Tang, Q.; Kang, C. Fabrication of a magnetic ternary ZnFe2O4/TiO2/RGO Z-scheme system with efficient photocatalytic activity and easy recyclability. RSC Adv. 2020, 10, 17293–17301. [Google Scholar] [CrossRef] [PubMed]
  37. Shi, W.; Liu, C.; Li, M.; Lin, X.; Guo, F.; Shi, J. Fabrication of ternary Ag3PO4/Co3(PO4)2/g-C3N4 heterostructure with following Type II and Z-Scheme dual pathways for enhanced visible-light photocatalytic activity. J. Hazard. Mater. 2020, 389, 121907. [Google Scholar] [CrossRef] [PubMed]
  38. Zhou, G.; Meng, L.; Ning, X.; Yin, W.; Hou, J.; Xu, Q.; Yi, J.; Wang, S.; Wang, X. Switching charge transfer of g-C3N4/BiVO4 heterojunction from type II to Z-scheme via interfacial vacancy engineering for improved photocatalysis. Int. J. Hydrogen Energy 2022, 47, 8749–8760. [Google Scholar] [CrossRef]
  39. Li, X.; Zhang, H.; Luo, J.; Feng, Z.; Huang, J. Hydrothermal synthesized novel nanoporous g-C3N4/MnTiO3 heterojunction with direct Z-scheme mechanism. Electrochim. Acta 2017, 258, 998–1007. [Google Scholar] [CrossRef]
  40. Kumar, A.; Khan, M.; Zeng, X.; Lo, I.M.C. Development of g-C3N4/TiO2/Fe3O4@SiO2 heterojunction via sol-gel route: A magnetically recyclable direct contact Z-scheme nanophotocatalyst for enhanced photocatalytic removal of ibuprofen from real sewage effluent under visible light. Chem. Eng. J. 2018, 353, 645–656. [Google Scholar] [CrossRef]
  41. Ding, M.; Miao, X.; Cao, L.; Zhang, C.; Ping, Y. Core-shell nanostructured SiO2@a-TiO2@Ag composite with high capacity and safety for Li-ion battery anode. Mater. Lett. 2022, 308, 131276. [Google Scholar] [CrossRef]
  42. Ahmed Alshehri, N.; Assaifan, A.K.; Albalawi, A.A.; Alghamdi, E.H.; Niu, Y.; Pleydell-Pearce, C.; Pavloudis, T.; Kioseoglou, J.; Alsawat, M.; Maffeis, T.T.G. Fabrication and characterisation of ZnO@TiO2 core/shell nanowires using a versatile kinetics-controlled coating growth method. Appl. Surf. Sci. 2022, 594, 153463. [Google Scholar] [CrossRef]
  43. Eskandari, P.; Zand, Z.; Kazemi, F.; Ramdar, M. Enhanced catalytic activity of one-dimensional CdS @TiO2 core-shell nanocomposites for selective organic transformations under visible LED irradiation. J. Photochem. Photobiol. A Chem. 2021, 418, 113404. [Google Scholar] [CrossRef]
  44. Zhang, Q.; Yu, L.; Xu, C.; Zhang, W.; Chen, M.; Xu, Q.; Diao, G. A novel method for facile preparation of recoverable Fe3O4@TiO2 core-shell nanospheres and their advanced photocatalytic application. Chem. Phys. Lett. 2020, 761, 138073. [Google Scholar] [CrossRef]
  45. Fu, H.; Sun, S.; Yang, X.; Li, W.; An, X.; Zhang, H.; Dong, Y.; Jiang, X.; Yu, A. A facile coating method to construct uniform porous α-Fe2O3@TiO2 core-shell nanostructures with enhanced solar light photocatalytic activity. Powder Technol. 2018, 328, 389–396. [Google Scholar] [CrossRef]
  46. Chi, Y.; Yuan, Q.; Li, Y.; Zhao, L.; Li, N.; Li, X.; Yan, W. Magnetically separable Fe3O4@SiO2@TiO2-Ag microspheres with well-designed nanostructure and enhanced photocatalytic activity. J. Hazard. Mater. 2013, 262, 404–411. [Google Scholar] [CrossRef]
Scheme 1. Synthesis of ZnFe2O4@TiO2 core-shell microspheres.
Coatings 12 01407 sch001
Figure 1. SEM images of photocatalysts: (a) ZnFe2O4, (b) TiO2, (c) ZT-0.6, (d) ZT-0.8, (e) ZT-1.0, (f) ZT-1.2, (g) ZT-1.4.
Coatings 12 01407 g001
Figure 2. Particle size distribution of different photocatalysts: (a) ZnFe2O4, (b) TiO2, (c) ZT-0.6, (d) ZT-1.0, (e) ZT-1.2, (f) ZT-1.4.
Coatings 12 01407 g002
Figure 3. TEM images of catalysts: (a,c) ZT-1.2, (b) ZT-1.4, (d) ZT-1.2 lattice fringe measurements.
Coatings 12 01407 g003
Figure 4. EDS spectrum (a) and element distribution (b) of ZT-1.2; (c) oxygen; (d) titanium; (e) zinc; (f) iron; (g) carbon.
Coatings 12 01407 g004
Figure 5. XRD patterns of ZnFe2O4, TiO2, and ZT-1.2 (a) and ZT-0.6, ZT-0.8, ZT-1.0, ZT-1.2, and ZT-1.4 (b).
Coatings 12 01407 g005
Figure 6. N2 adsorption–desorption isotherms (a) and pore size distributions (b) of ZnFe2O4, TiO2, and ZT-1.2.
Coatings 12 01407 g006
Figure 7. FTIR spectra of ZnFe2O4, TiO2, and ZT-1.2.
Coatings 12 01407 g007
Figure 8. XPS spectra of ZT-1.2: (a) survey, (b) Fe 2p, (c) Zn 2p, (d) O 1s, (e) Ti 2p, (f) C 1s.
Coatings 12 01407 g008
Figure 9. (a) UV-visible absorption spectra (DRS) of various catalysts, (bd) forbidden band widths of ZnFe2O4, TiO2, ZT-1.2.
Coatings 12 01407 g009
Figure 10. Magnetic hysteresis loops of ZnFe2O4 and ZT-1.2. The inset shows the magnetic separation process of the samples.
Coatings 12 01407 g010
Figure 11. (a) Photocatalytic degradation curve of RhB, (b) First-order kinetic equation of RhB degradation, (c) UV-vis absorption spectrum of RhB degradation by ZT-1.2, (d) Cyclic experiment and magnetic recovery of ZT-1.2, (e) UV-vis absorption spectra of OFX degradation by ZT-1.2, and (f) photocatalytic degradation curves of MB, MO, and Phenol by ZT-1.2.
Coatings 12 01407 g011
Figure 12. PL spectrum (a); EIS impedance spectrum (b) and I-t spectrum (c) of ZnFe2O4, TiO2, and ZT-1.2.
Coatings 12 01407 g012
Figure 13. Photocatalytic degradation of RhB by ZT-1.2 under different inactivators.
Coatings 12 01407 g013
Figure 14. Schematic diagram of the photocatalytic mechanism.
Coatings 12 01407 g014
Figure 15. (a) photocatalytic degradation of RhB by ZT-1.2 and ZTM-1.2, (b) SEM image of ZTM-1.2, (c) element percentage of ZT-1.2 and ZT-1.2.
Coatings 12 01407 g015
Table 1. Preparation of different TiO2-based core–shell photocatalysts.
PhotocatalystsPreparation MethodAmbient TemperatureReaction TimeCitations
ZnFe2O4@TiO2/CdSeMechanical agitation45 °C24 h[24]
SiO2@a-TiO2@AgMechanical agitation80 °C2 h[41]
ZnO@TiO2Mechanical agitation35 °C6 h[42]
CdS@TiO2Mechanical agitationRoom temperature4 h[43]
Fe3O4@TiO2Mechanical agitationRoom temperature3 h[44]
α-Fe2O3@TiO2Mechanical agitationRoom temperature9 h[45]
Fe3O4@SiO2@TiO2-AgMechanical agitation85 °C1.5 h[46]
ZnFe2O4@TiO2Ultrasonic methodRoom temperature1.5 hThis work
Publisher’s Note: MDPI stays neutral with regard to jurisdictional claims in published maps and institutional affiliations.

