Article

Understanding Corrosion Degradation Processes of a Multi-Component CoNiCrAlY-Coating System

by
Akbar Niaz
1,*,
Abdulrahman Fahad Al Fuhaid
1,2 and
Muhammad Iftikhar Faraz
3
1
Materials Engineering Department, College of Engineering, King Faisal University, Al Hofuf 31982, Saudi Arabia
2
Civil Engineering Department, College of Engineering, King Faisal University, Al Hofuf 31982, Saudi Arabia
3
Mechanical Engineering Department, College of Engineering, King Faisal University, Al Hofuf 31982, Saudi Arabia
*
Author to whom correspondence should be addressed.
Coatings 2022, 12(10), 1396; https://doi.org/10.3390/coatings12101396
Submission received: 27 August 2022 / Revised: 16 September 2022 / Accepted: 21 September 2022 / Published: 25 September 2022
(This article belongs to the Section Corrosion, Wear and Erosion)

Abstract

:
The thermal insulation and integrity of the thermal barrier coating is hampered by the formation of mixed oxide at intermediate bond coat. The existing reported work correlates growth of mixed oxide to the microstructural and phase changes. The track mostly used to study these changes is scanning electron microscopy, X-ray diffraction, and electrochemical testing. Oxide growth is principally an electrochemical process; hence a thirst exists to study this aspect by using advanced electrochemical techniques. In this study scanning electrochemical microscopy is used to reveal the electrochemical activity in the closest vicinity of the surface. A raster scan of 500 µm area was carried out by microelectrode in an electrolyte at a distance of 5 µm above the surface to record the current profile. The activity at the surface was confirmed by current distance curves. The tip of the microelectrode was approached from 60 µm height to 2 µm above the surface. The current–distance curves for the coating without heat-treatment show an active surface while the heat-treated one show non active surface. The average coating electrochemical response was further studied by polarization curves impedance spectroscopy. The X-ray photoelectron spectroscopy results show that oxidation and formation of the mixed oxide increase with polarization.

1. Introduction

To maintain thermal insulation and integrity at very high temperatures, thermal barrier coatings are made from multiple materials [1,2,3,4]. This multiple-component system provides unique insulation properties but also causes corrosion degradation problems. If these corrosion problems get worse with time, they severely hamper the integrity of coatings [5,6]. Coatings for high-temperature applications consist of a heat-insulating top ceramic coat and an intermediate bond coat of MCrAlY. The bond coat improves the adherence with the substrate on one side, while improving the bond with the insulating top coat on the other side [7,8]. A number of experimental sequences are reported to study coating microstructure, composition, and corrosion degradation properties. Among the reported work, researchers used electron microscopy, X-ray diffraction, phases/composition analysis, and electrochemical testing techniques [8,9,10,11]. A detailed standalone electrochemical aspect of the corrosion degradation is missing. In this study, we will use traditionally reported electrochemical testing techniques alongside advanced scanning electrochemical microscopy to study the corrosion process in the closest vicinity of the coating surface. The air-grown and voltage-assisted passive layer is studied by X-ray photoelectron spectroscopy to find the types of oxides formed with the severity of the environment. Although different aspects of coatings have been studied by researchers in the past, only the most relevant work will be presented here.
M.S. Ali et al. studied thermally grown oxide (TGO) on thermal barrier coatings as a function of temperature [12]. An intermediate bond coat of NiCrAlY was deposited on a high nickel–chromium superalloy. The coated samples were heated from 700 °C to 1200 °C for a period from 1 h to 1000 h. The samples were studied by scanning electron microscope (SEM), X-ray diffraction (XRD), and electrochemical impedance spectroscopy (EIS) to record microstructural and electrical properties changes. Their results showed the rise of impedance and capacitance up to 100 h of thermal cycles. After thermal cycling beyond 100 h, they found a fall in the impedance values. They attributed the initial rise in the impedance to the thin Al2O3 growth, while later impedance drop to the mixed oxide growth [12]. The low number of thermal cycles grows an adherent oxide which blocks/slows down the electronic and ionic mobility across the Al2O3. At a higher number of cycles, cobalt, chromium, and nickel get oxidized and mixed with already present Al2O3 [12]. The adherent oxide transfer to a porous spinel oxide causes increased thickness and decreases the impedance and capacitance of the coatings. The XRD and microstructure results also support the presentence of multicomponent oxides at higher thermal cycles.
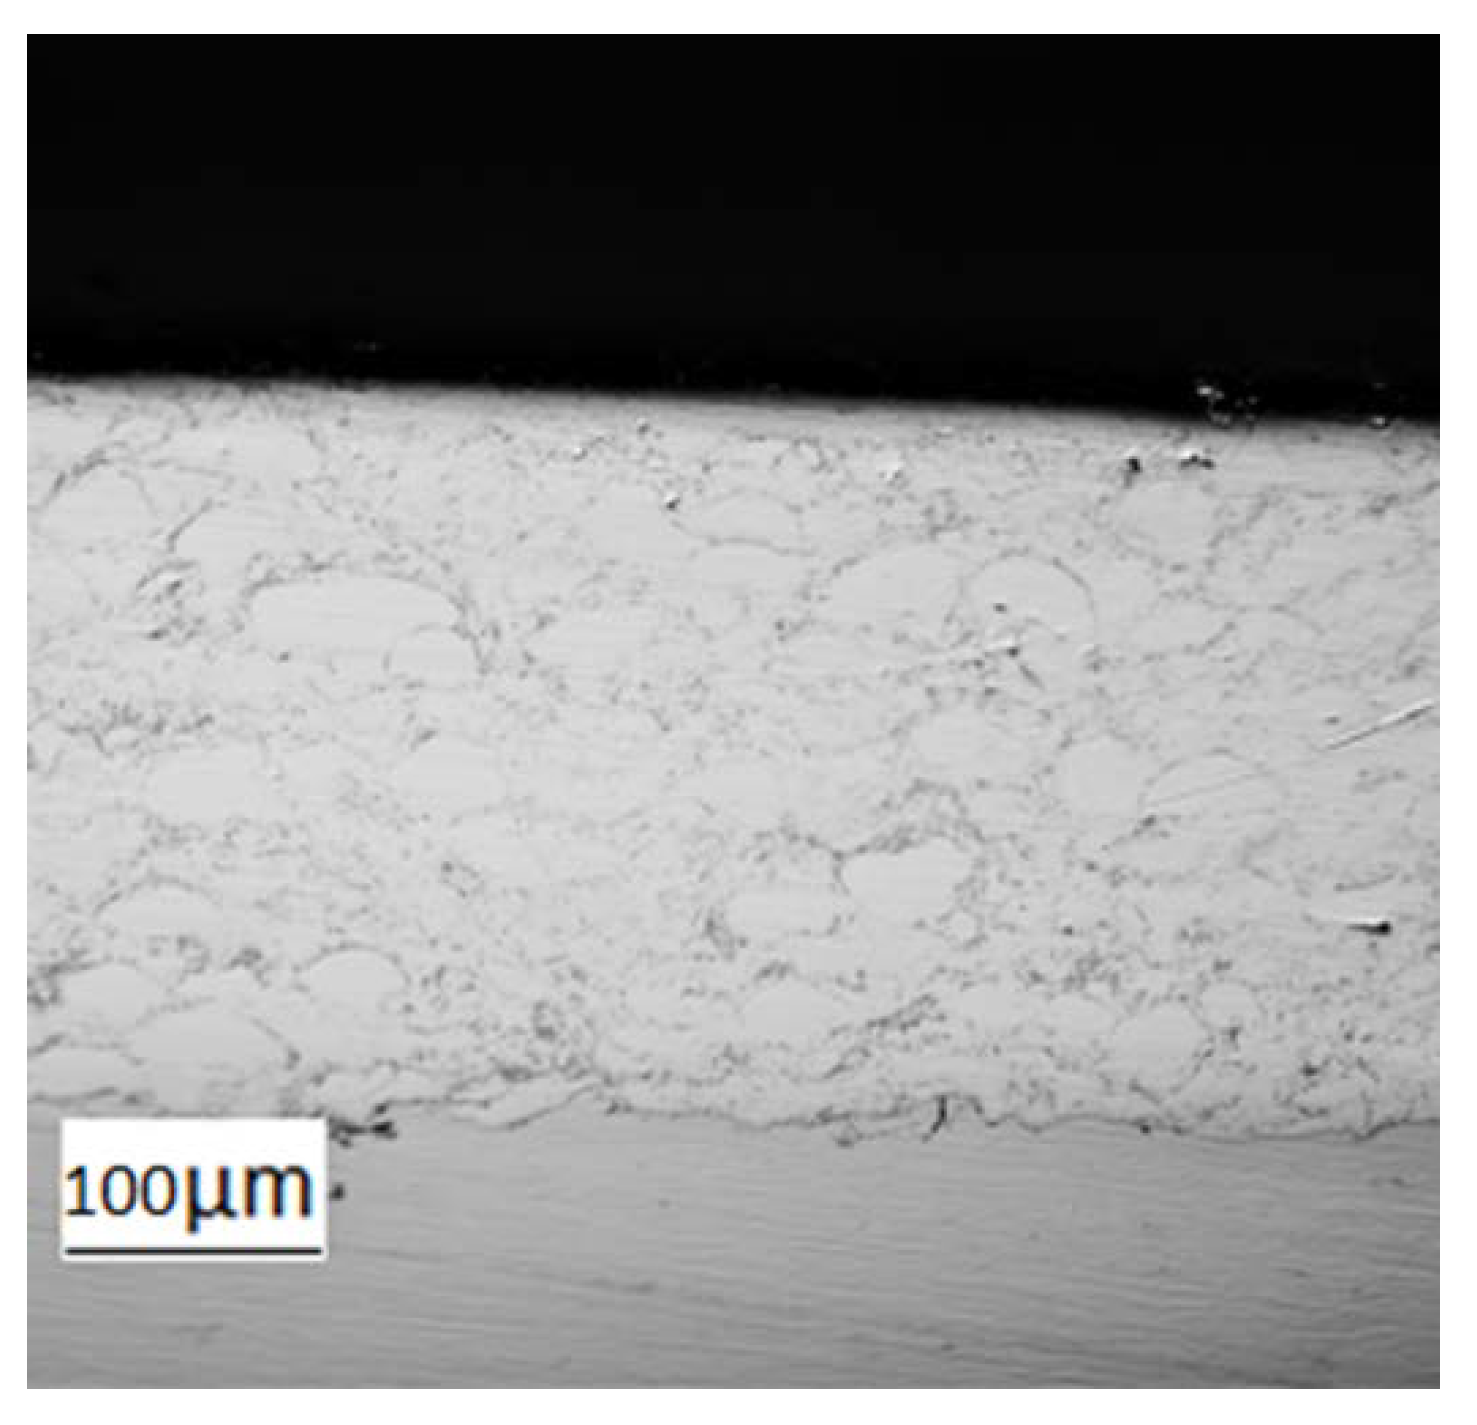
The formation of the adherent alumina layer also depends on the amount of aluminum present in the coatings. The low percentage of aluminum in the coating does not allow the formation of a uniform layer. F. Tang et al. added 2% of finely divided (≤40 µm) powder to the commercially available CoNiCrAlY powder [13]. A 100 µm coating layer was produced on mild steel samples. Thermal cycling was carried out on polished and unpolished samples at 1000 °C for a period of 1 h to 24 h. The polished surface formed an alumina layer all over the surface while the unpolished surface formed a mixed oxide layer. They suggested that oxide concentration in the coating, as well as surface roughness, also contribute to forming a uniform oxide layer [14]. The rough surface predominantly forms a mixed oxide at high temperatures. The formation of mixed spinal oxide can be related to the rough surface which allows other coating constituents to be exposed to the air and form their oxides.
In a separate study, F. Tang et al. also studied the effect of coating process parameters on the formation of the oxide [13,14]. Low oxygen to fuel ratio formed an enriched alumina dense oxide layer while high oxygen to fuel ratio formed a spinel mixed oxide layer. The higher oxygen concentration allows oxidation of all coating powder constituents rather than a highly oxidizing element [13]. The process of formation of spinel oxide during the coating process increases multi-oxide growth during thermal cycling. The porous structure of coatings also promotes oxidation and oxygen can seep easily through the coating surface.
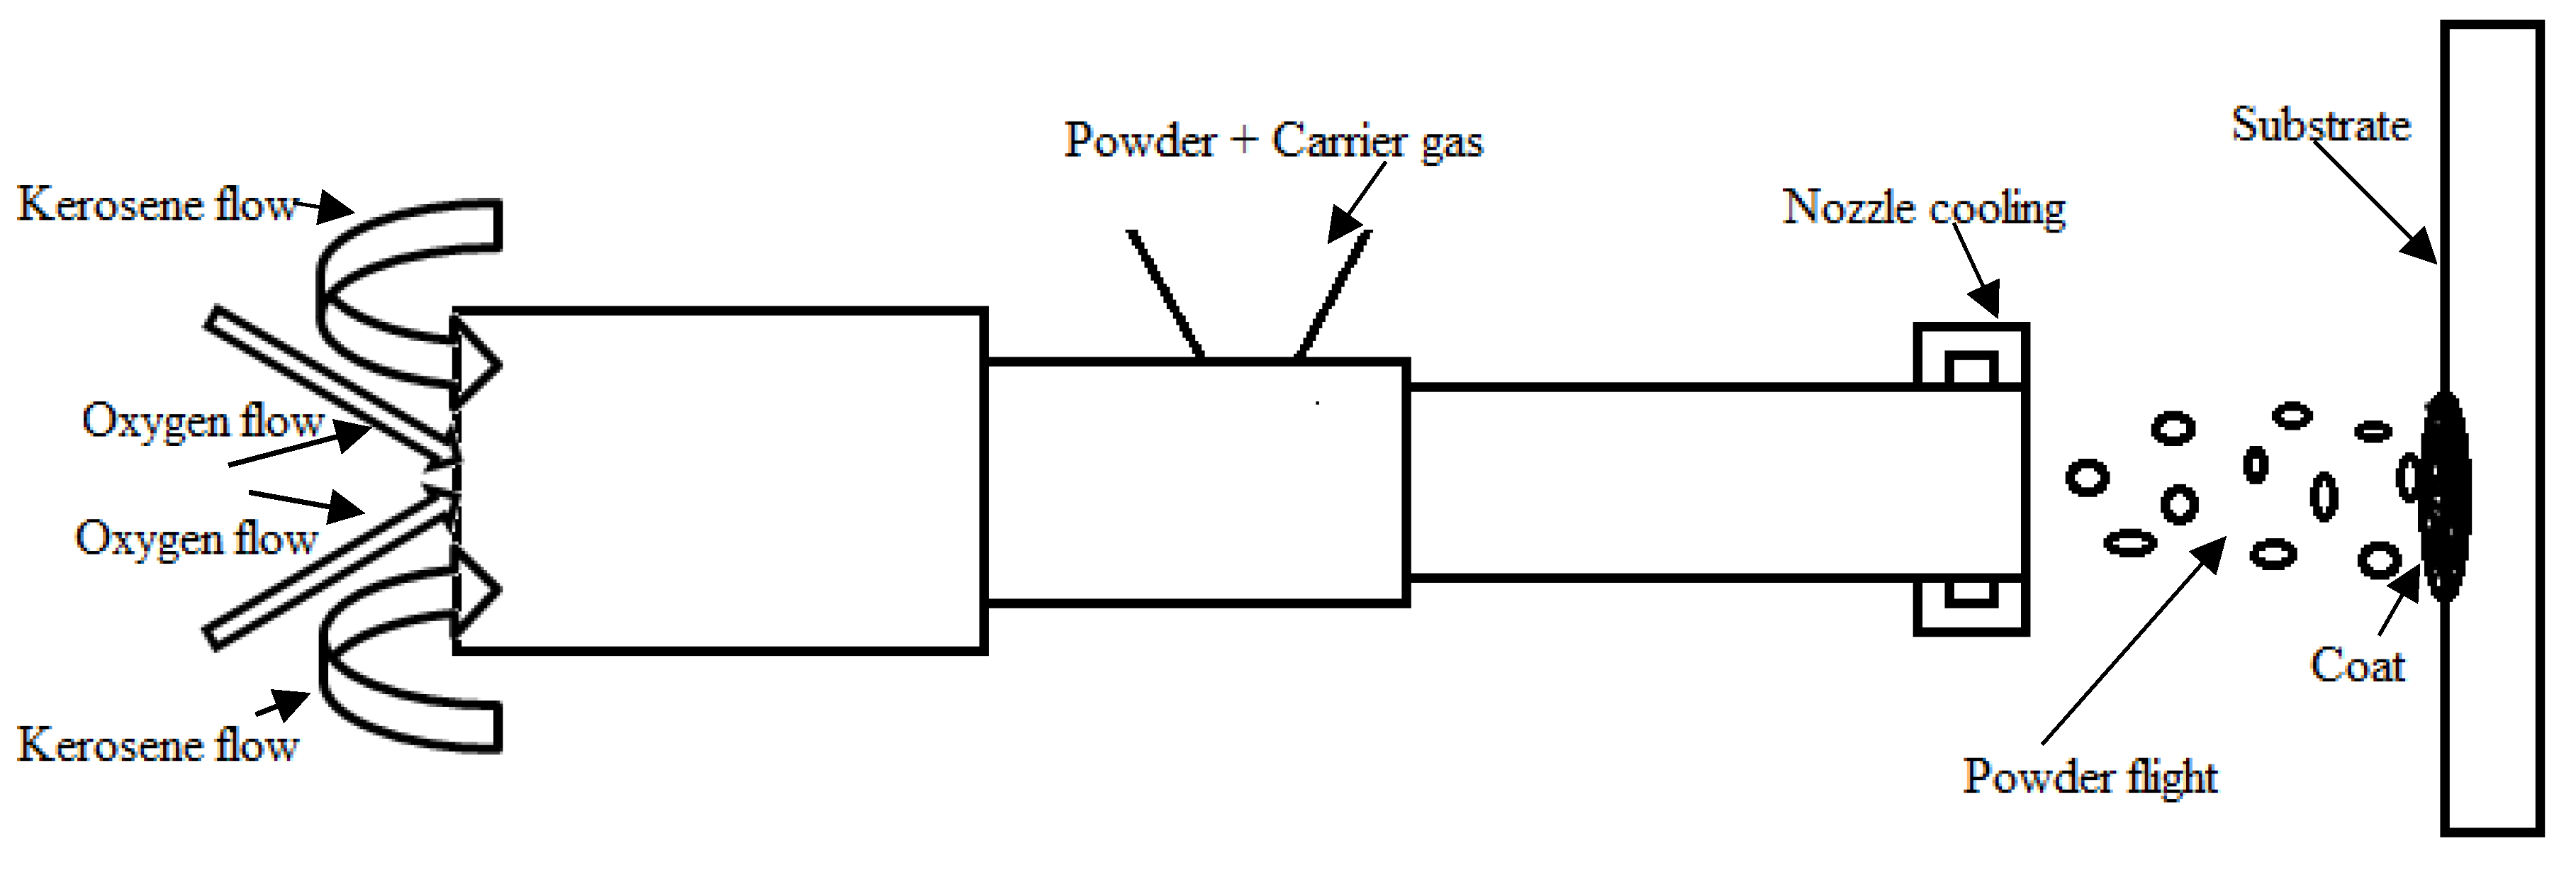
The oxidation of the coating material before hitting the target material contributes to the formation of spinel oxide. The problems occur due to direct contact of the metallic powder with the oxygen during the particle flight time. To avoid oxidation during particle flight W. Guo et al., manufactured a mechanically alloyed CoNiCrAlY powder [15]. The shell of alumina, approximately 1 µm was formed on CoNiCrAlY by ball milling. The coatings produced by core-shell structure powder exhibit low oxide formation in the thermal spraying process. The low oxide content during HVOF process assists the formation of a dense alumina layer during thermal cycling and has good corrosion resistance [15]. The partial drawback of the core-shell powder coating is the poor deformability of the powder while hitting the target material which causes excessive porosity and some hard Al-Ni phases in the final coating.
Another modification is the use of different thermal spraying guns to produce the coatings. One such study is carried out by A. C Karaoglanli, where they used atmospheric plasma spraying (APS) gun, supersonic atmospheric spraying (SAPS) gun, high-velocity oxygen fuel (HVOF) gun, detonation spraying (DS) gun, and cold gas dynamic spraying (CGDS) gun [16]. The coating was prepared on 718 supper alloy and isothermally heated to 1000 °C to study changes in microstructure and thermally grown oxide. The coating produced from the CGDS gun produces a dense uniform oxide during thermal cycling with higher corrosion resistance performance [16].
Microstructure and isothermal oxidation of CoNiCrAlY coatings was also studied by H. Luo et al. [2]. The coating was produced on IN718 alloy by using laser powder bed fusion (LPBF) and heated to 1100 °C for a time period of 1 h to 100 h. The LPBF is an additive manufacturing process, where the powder can be deposited in line with the path defined by computer-aided design. They reported the formation of homogenized phases in coating microstructure. Under low thermal cycling, the alumina layer was also found dense and crack-free. Improved microstructural and oxidation properties are attributed to the LPBF process which build-up columnar dendrite and equated grains that helps in producing a thin uniform oxide [2]. The increase in time of oxidation promotes the formation of spinel oxide which degrade corrosion resistance. Some other researchers have also studied the improvement in insulation, corrosion resistance, and tribo-properties improvement by using additive manufacturing, as in ref. [1,2,3,4], using nano-particle powder [12,16,17].
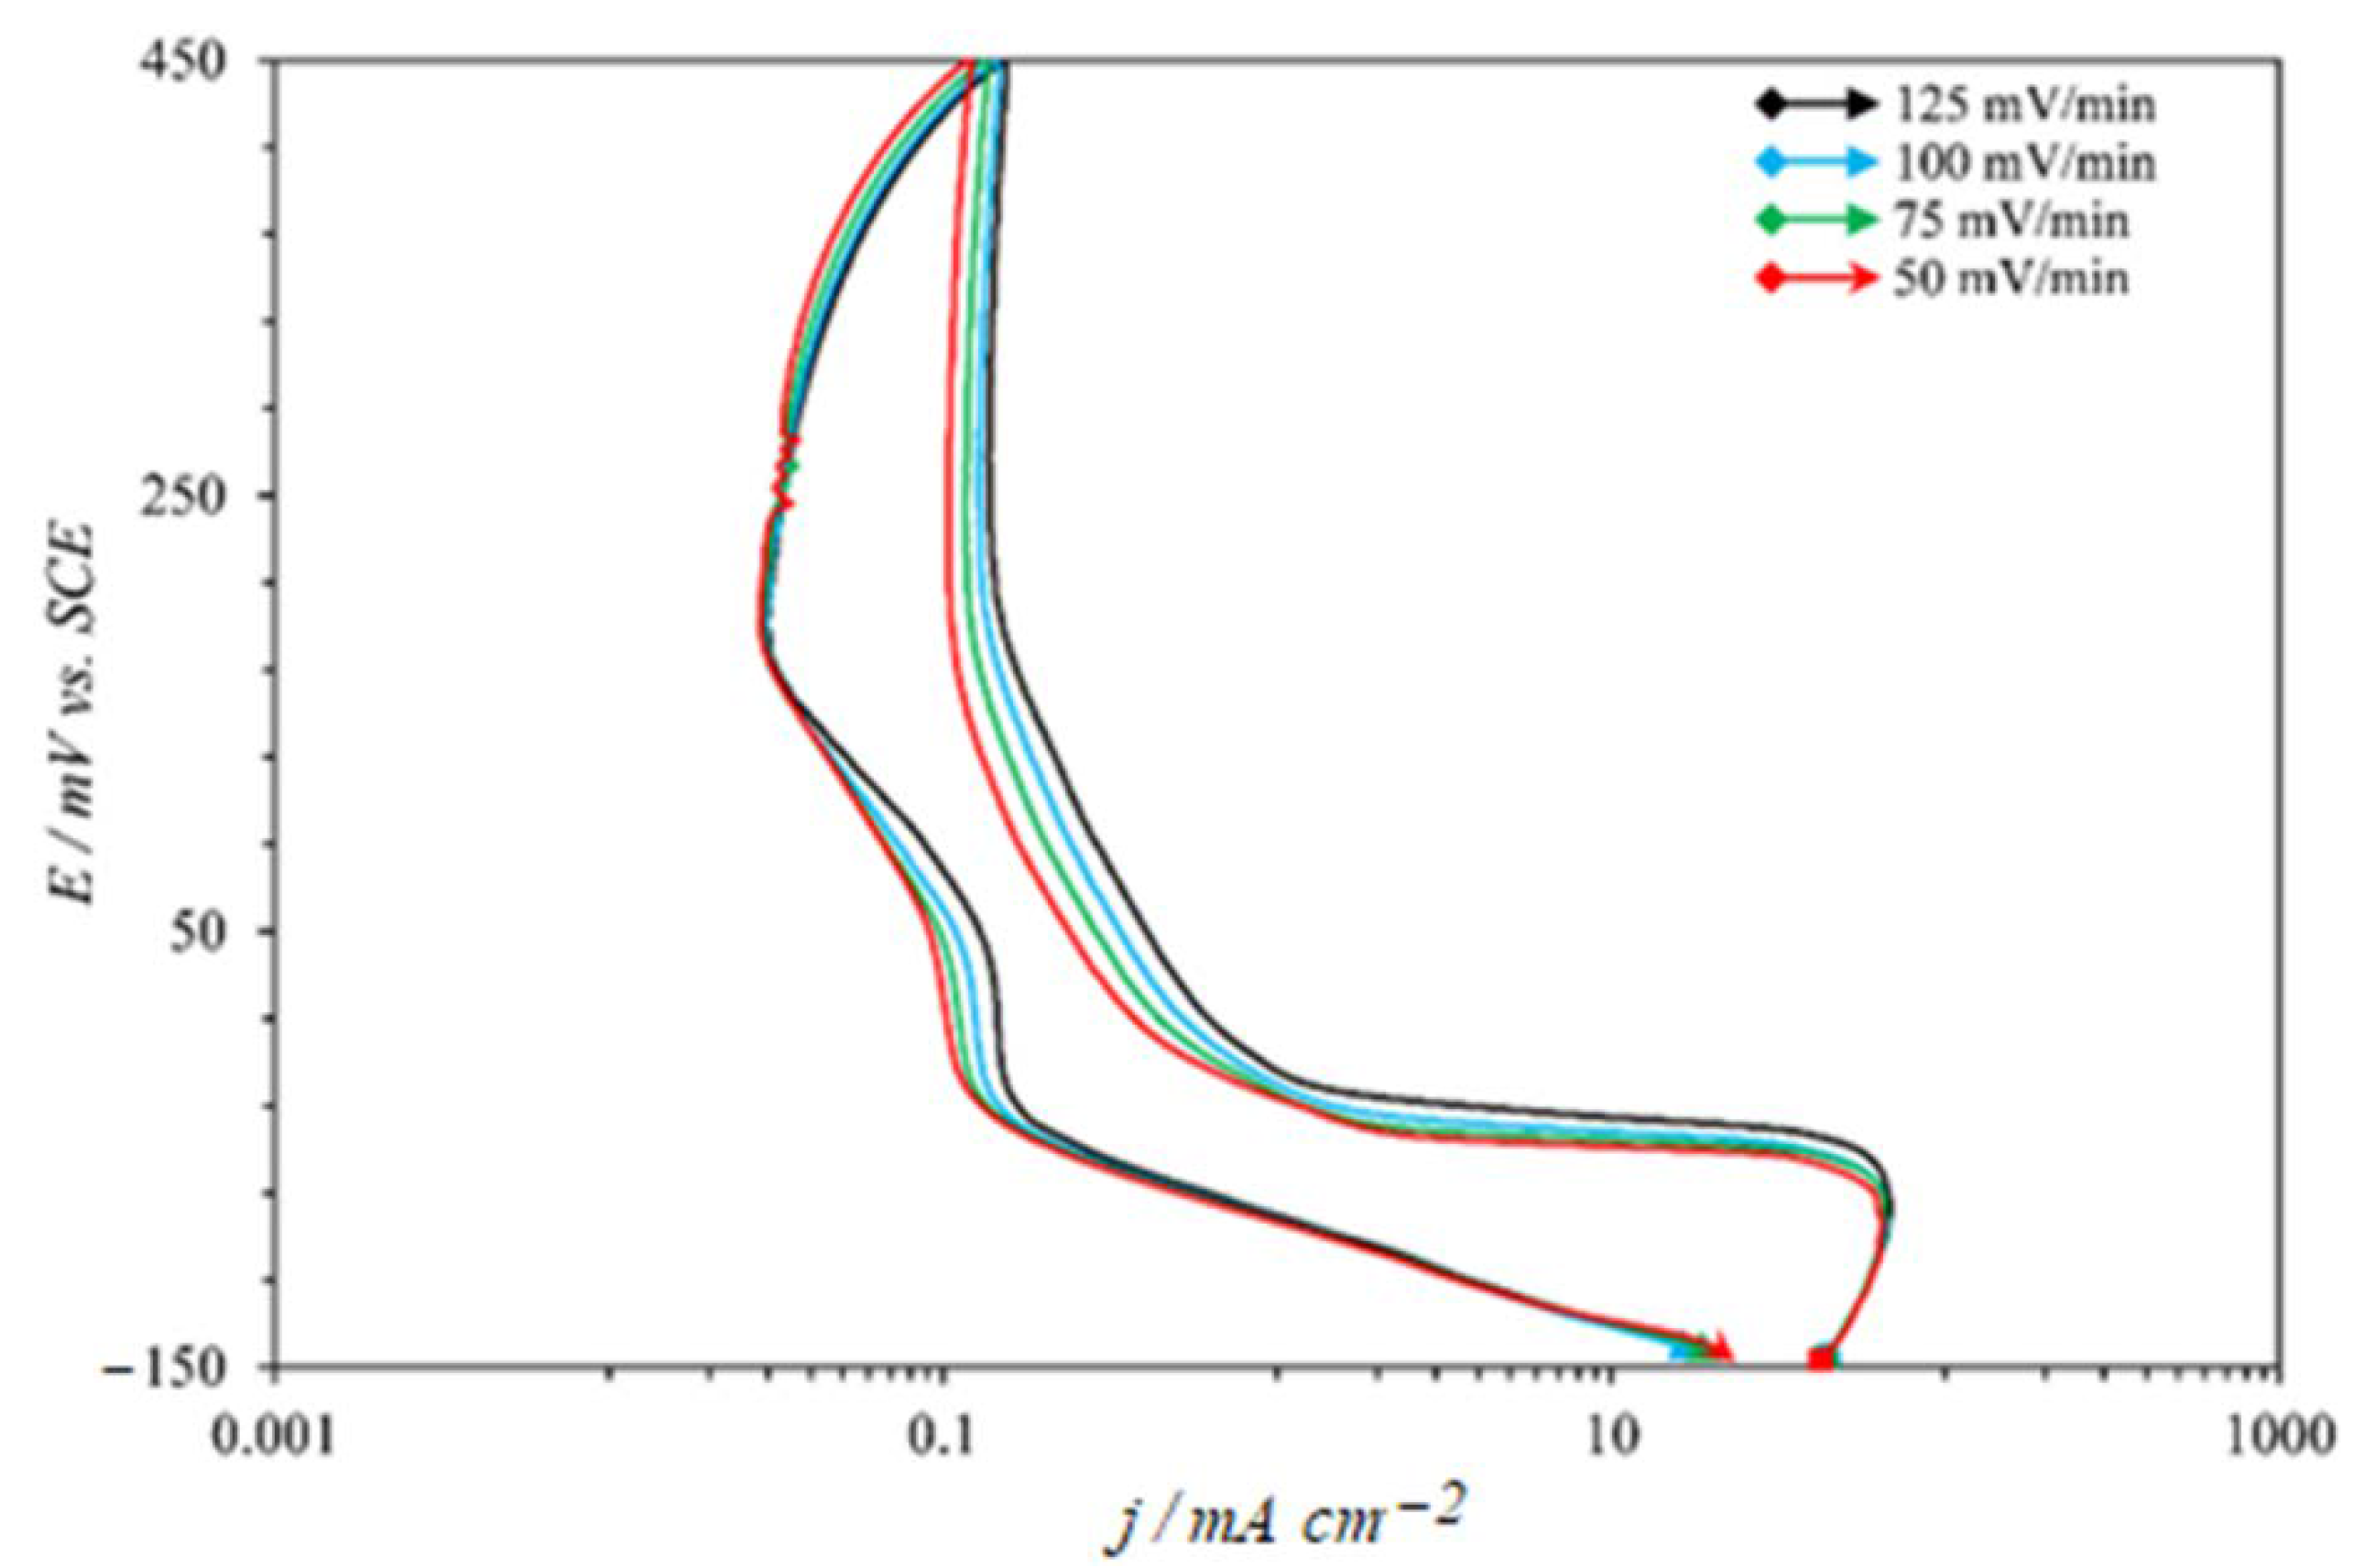
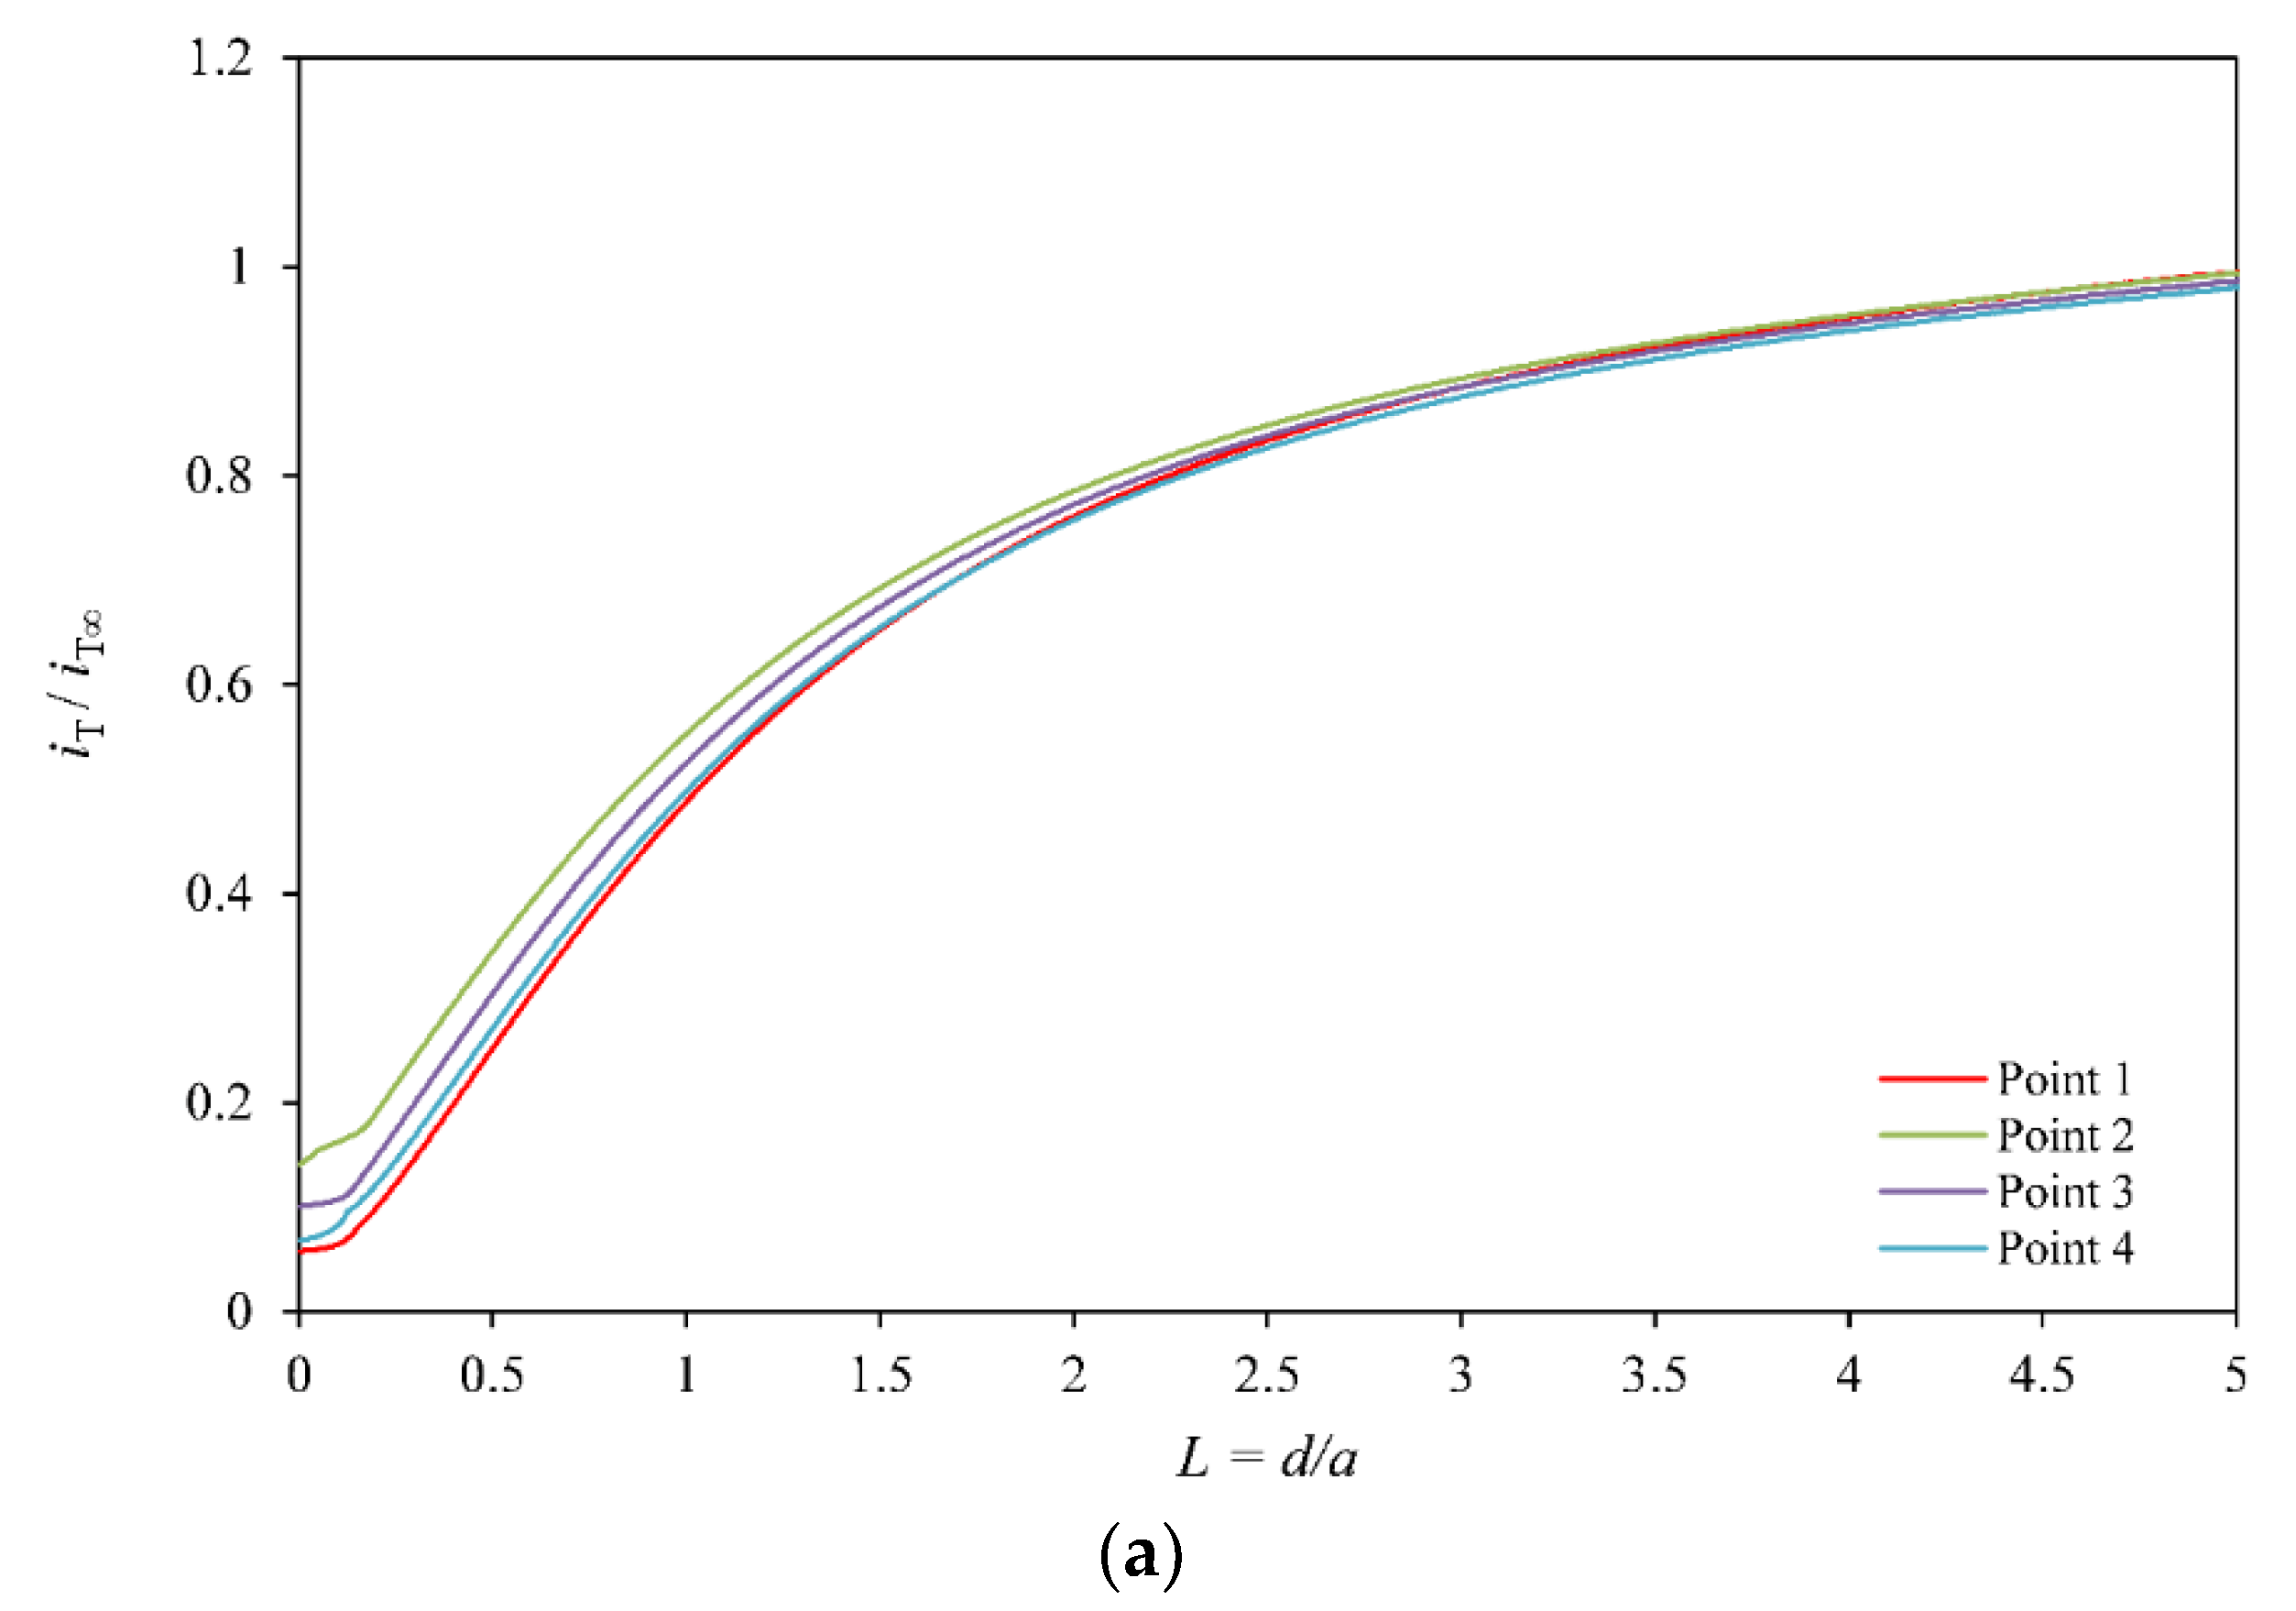
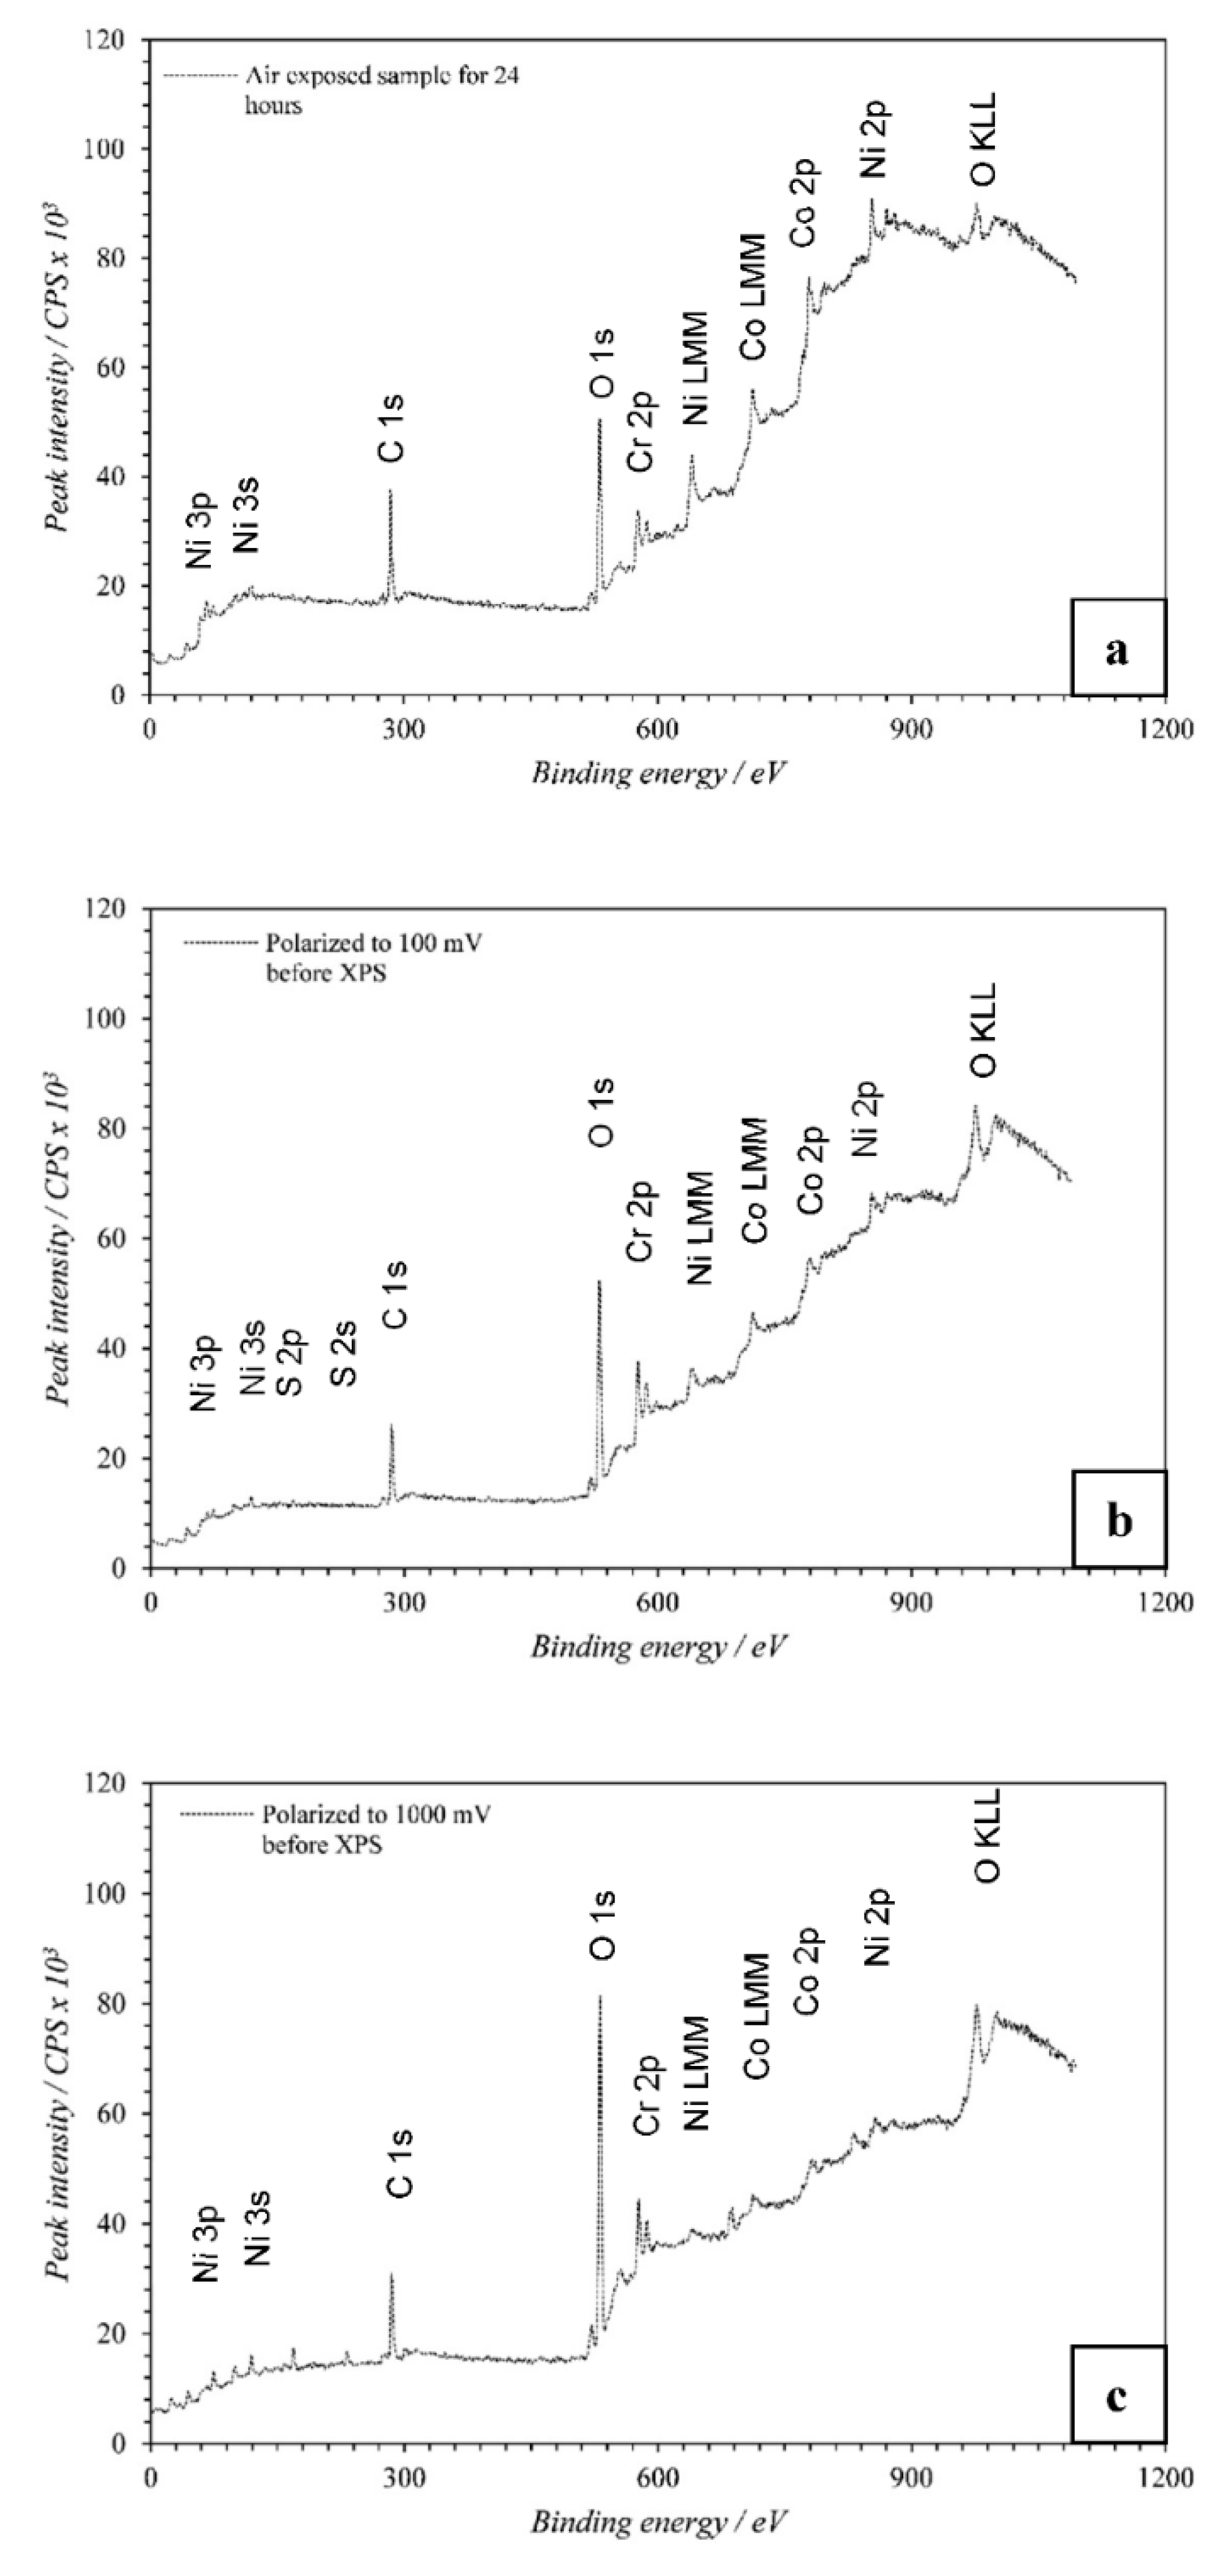
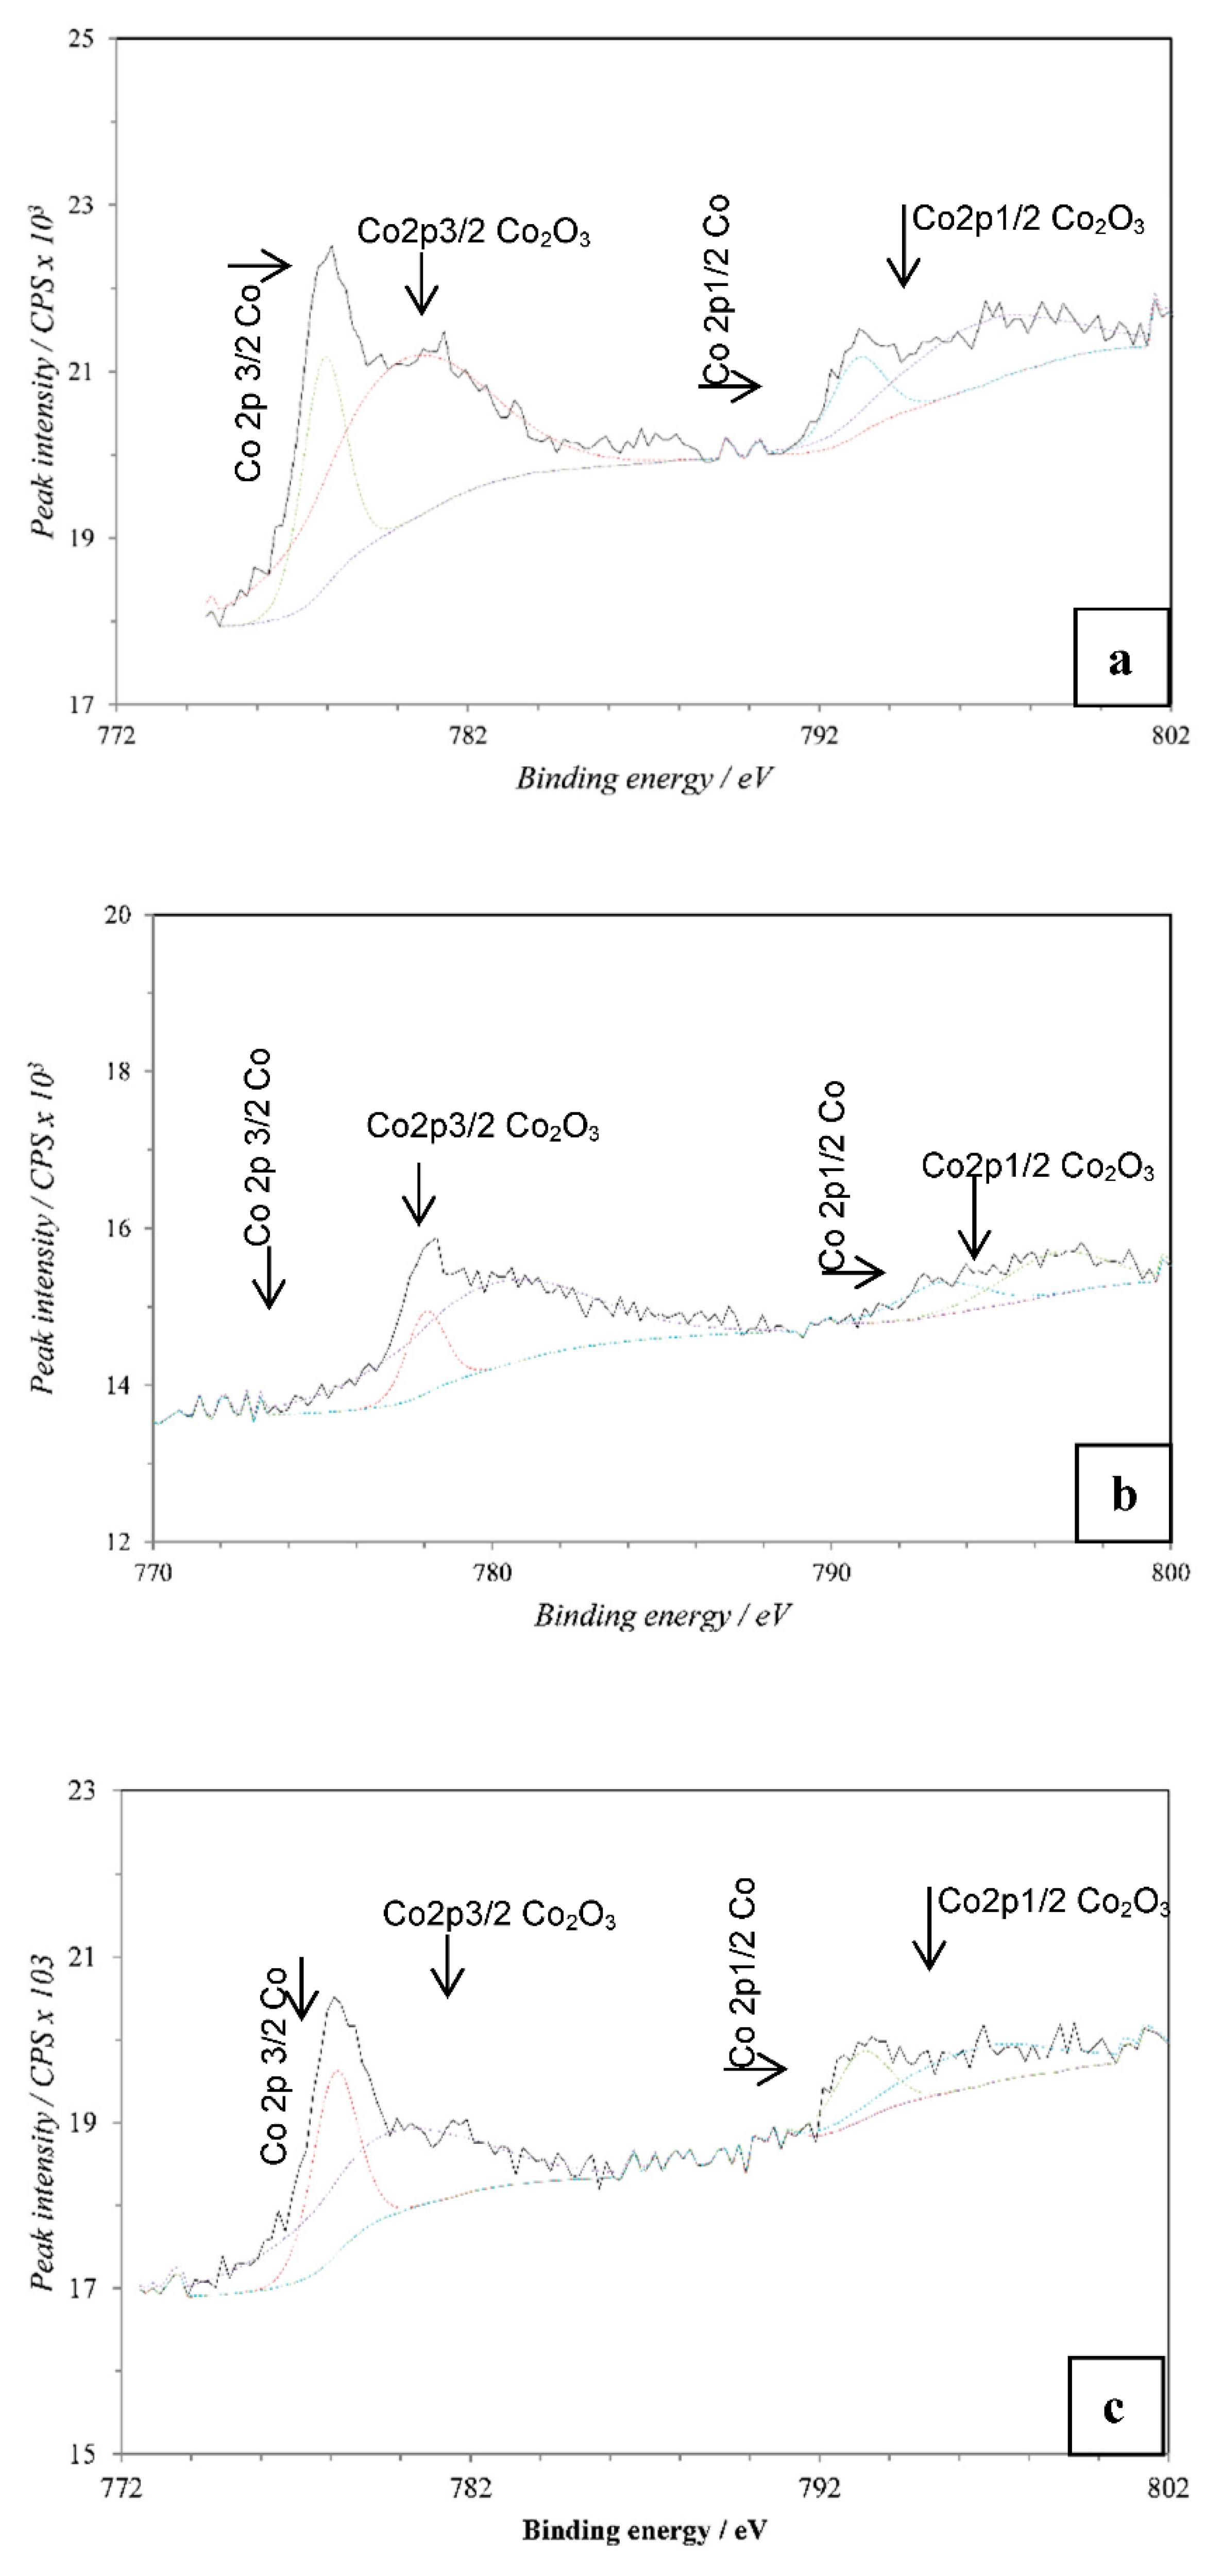
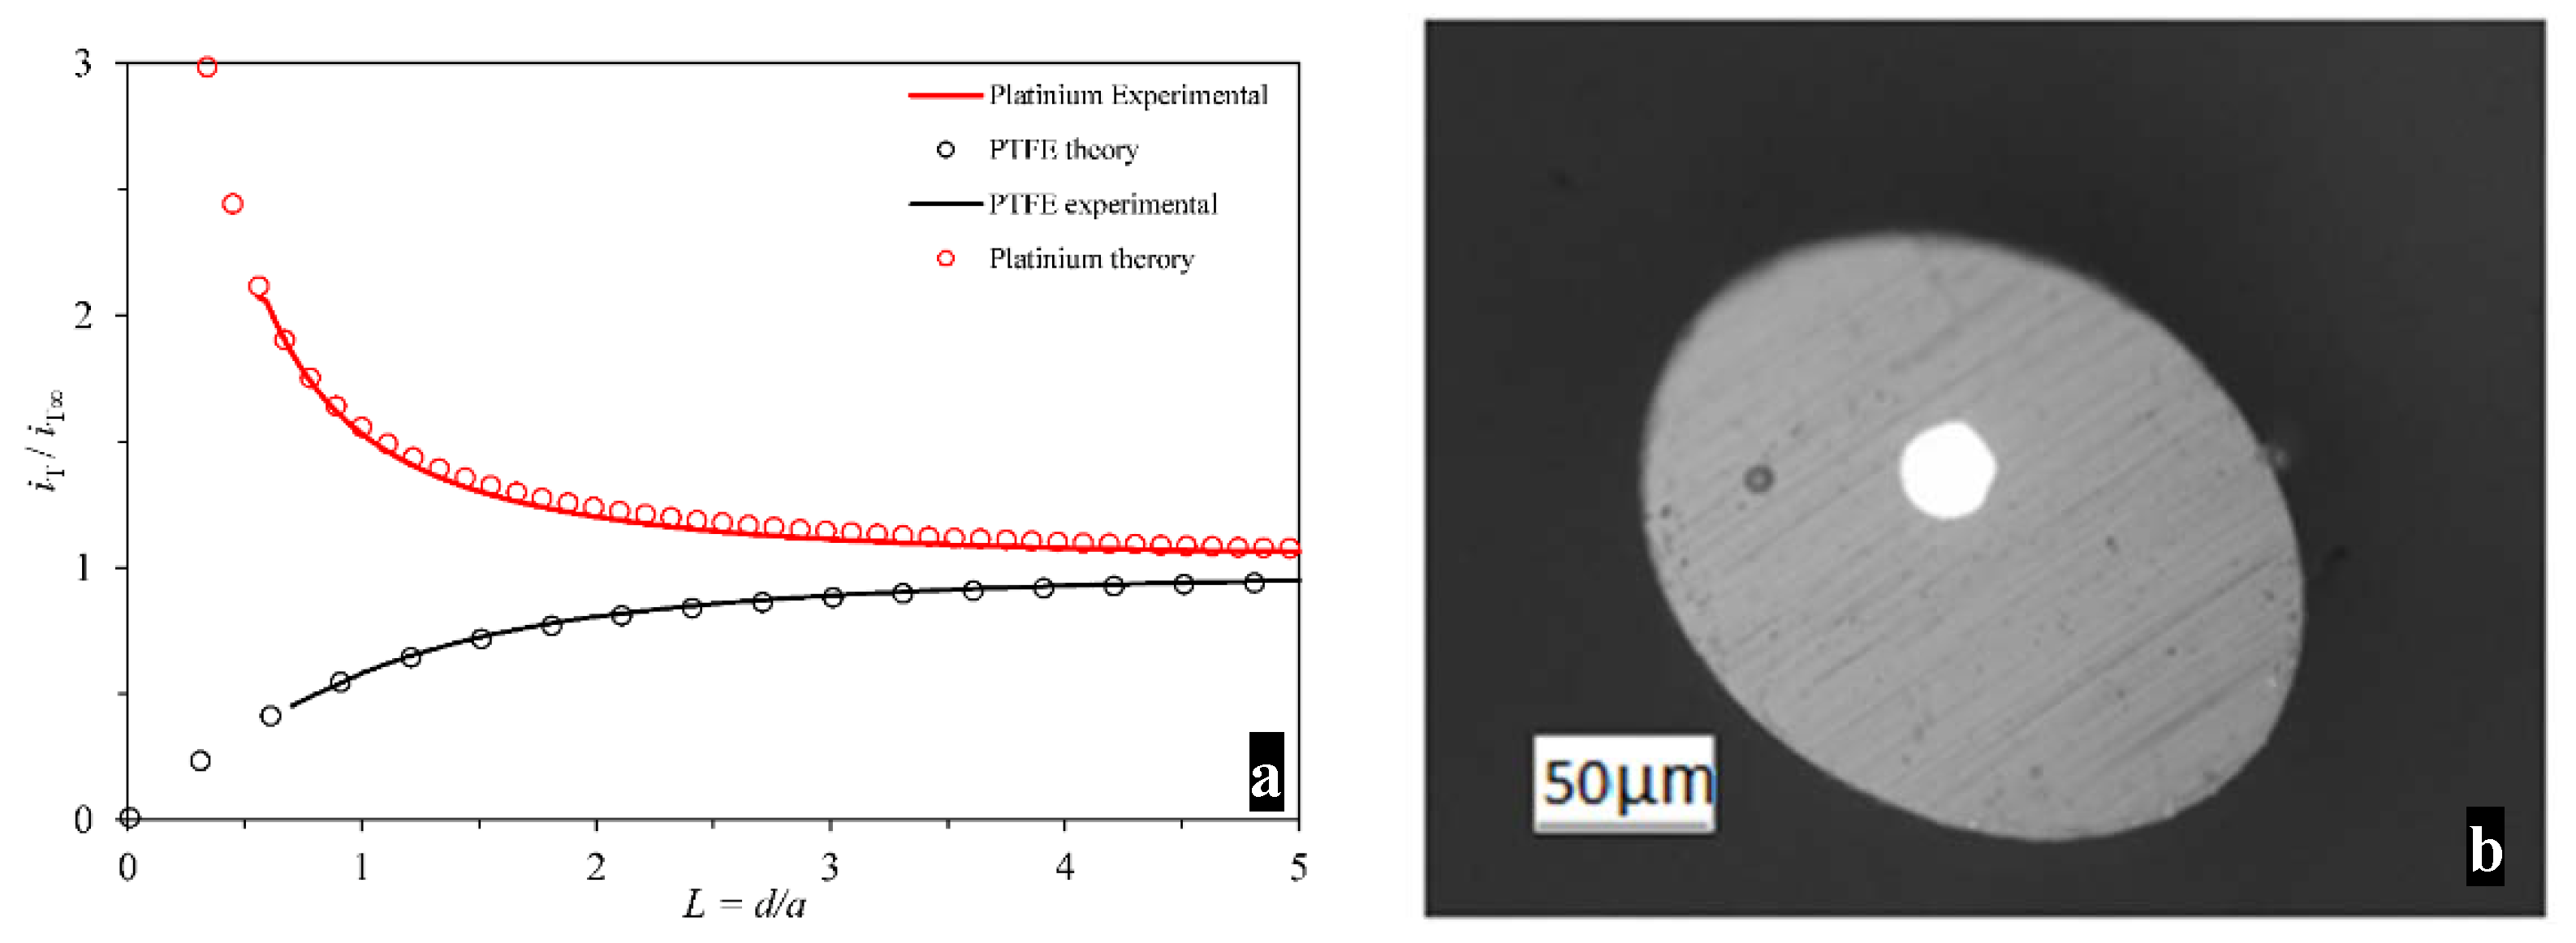
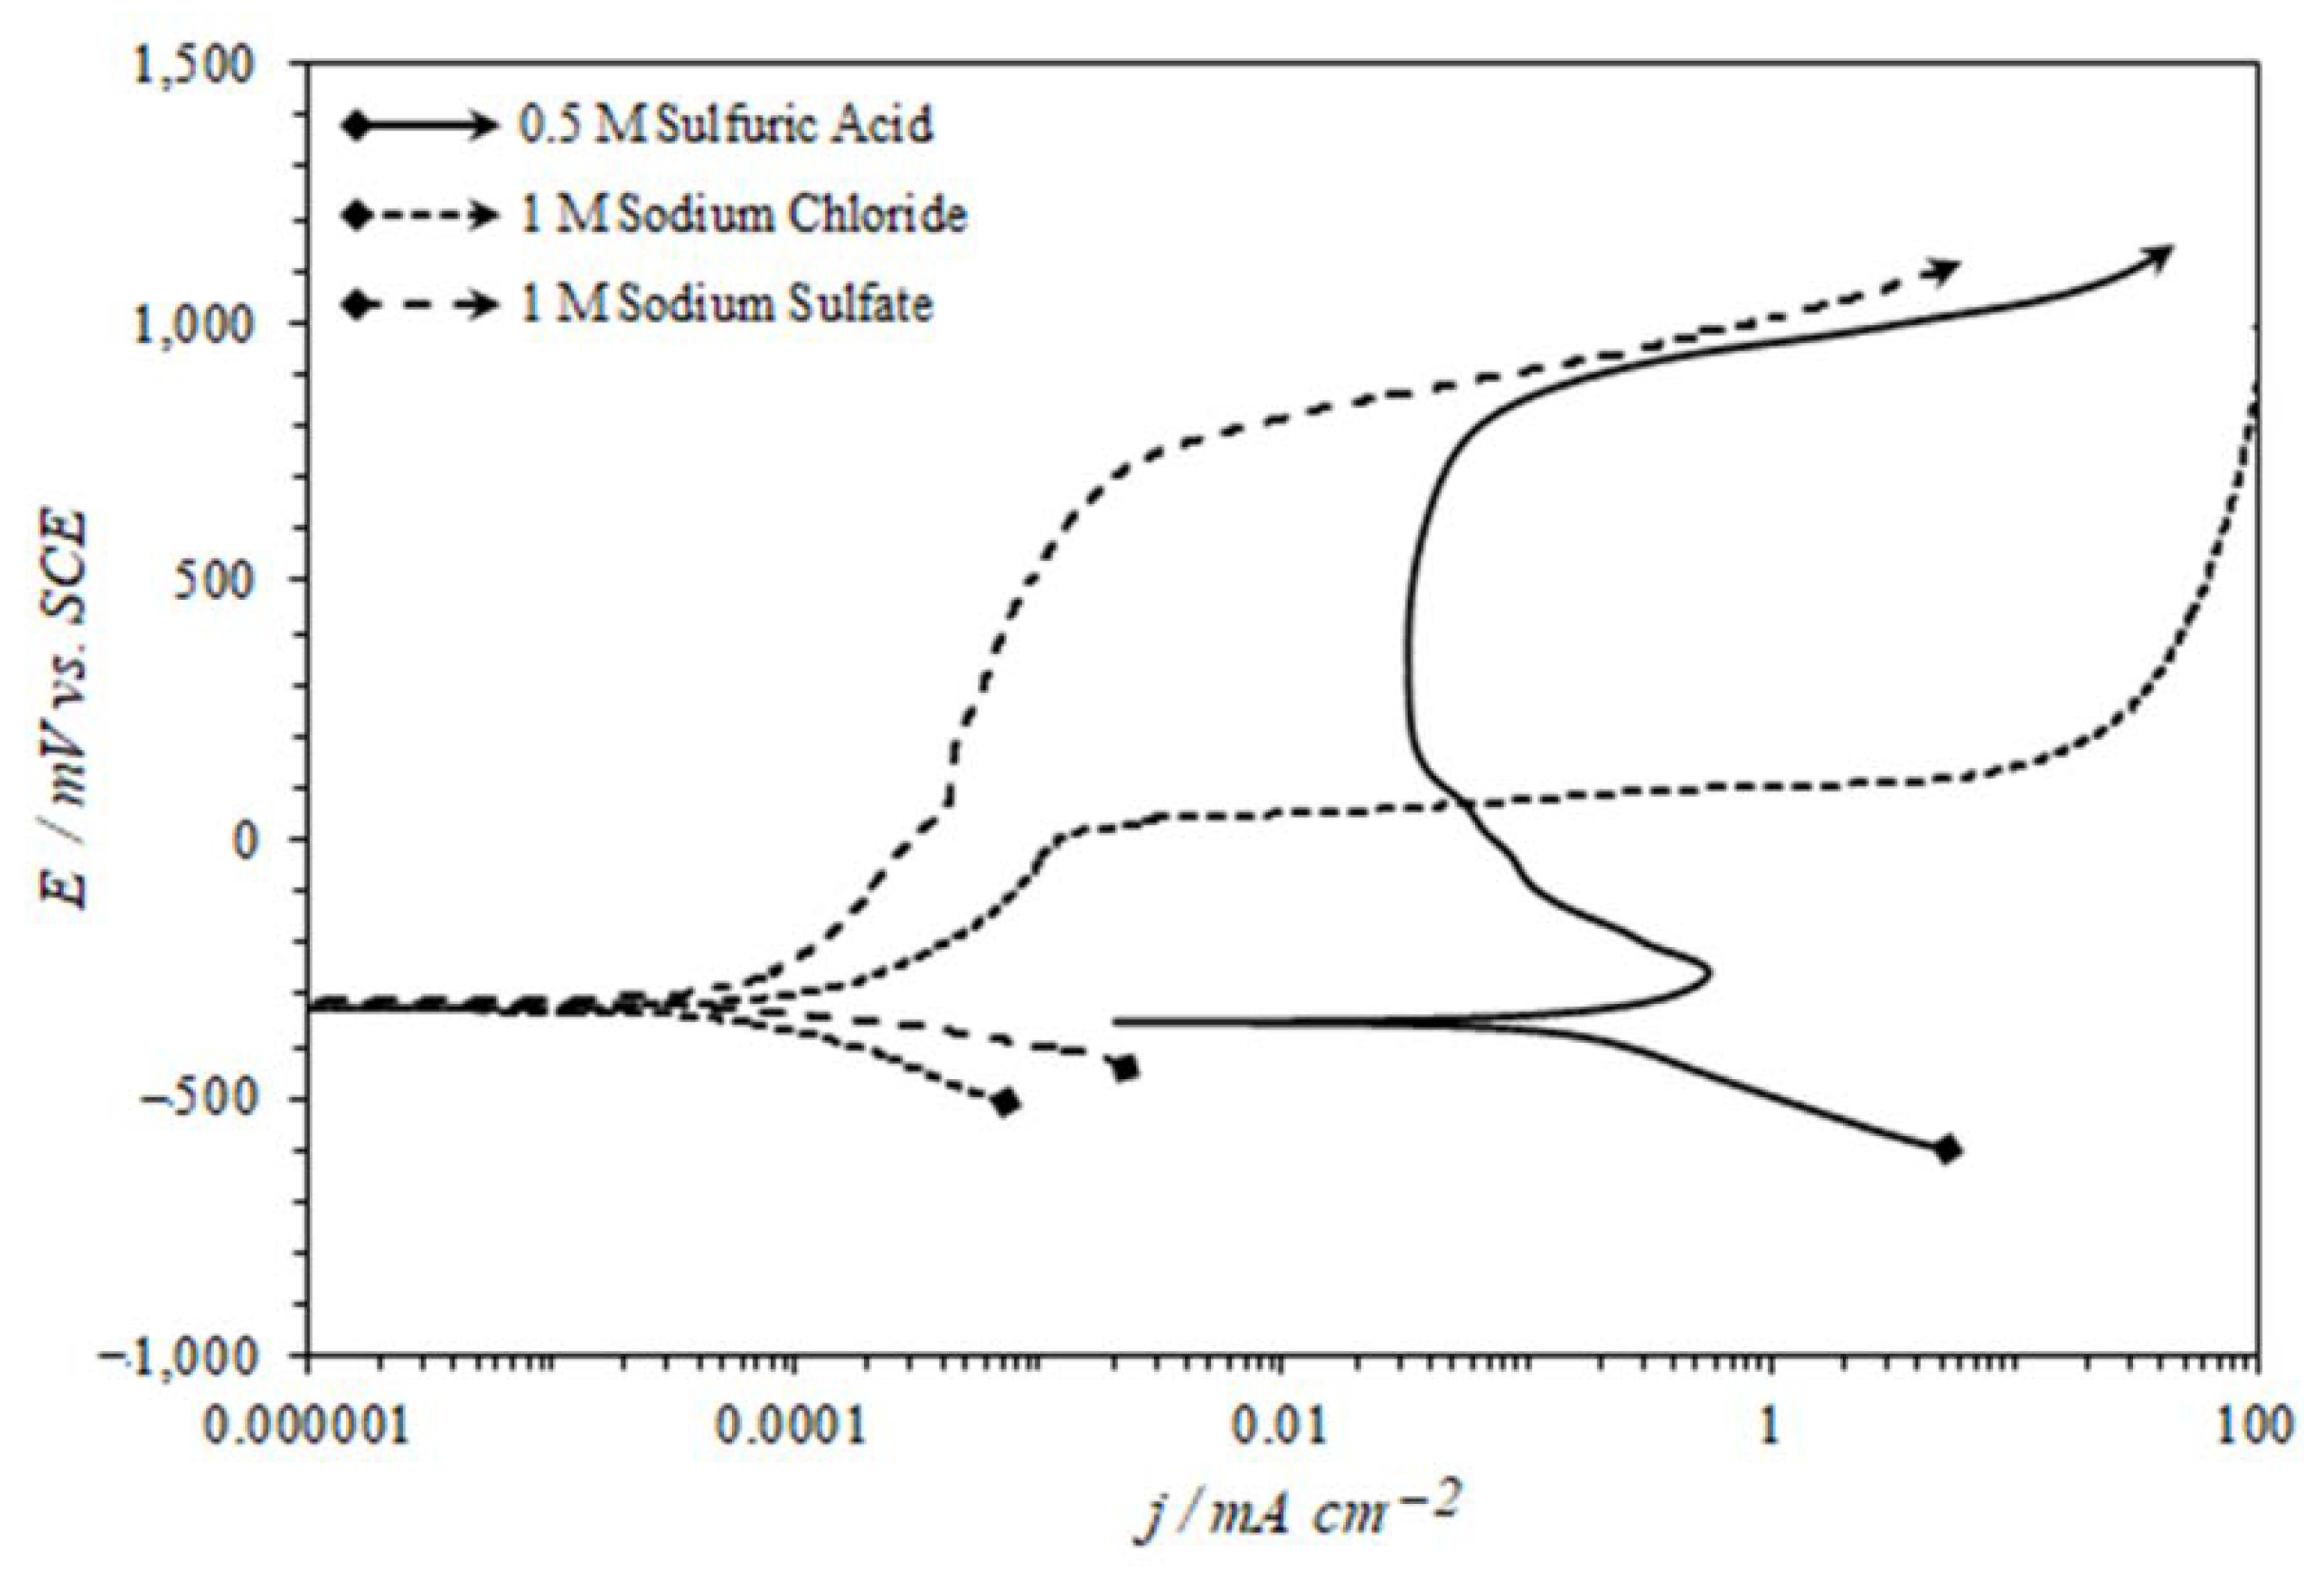
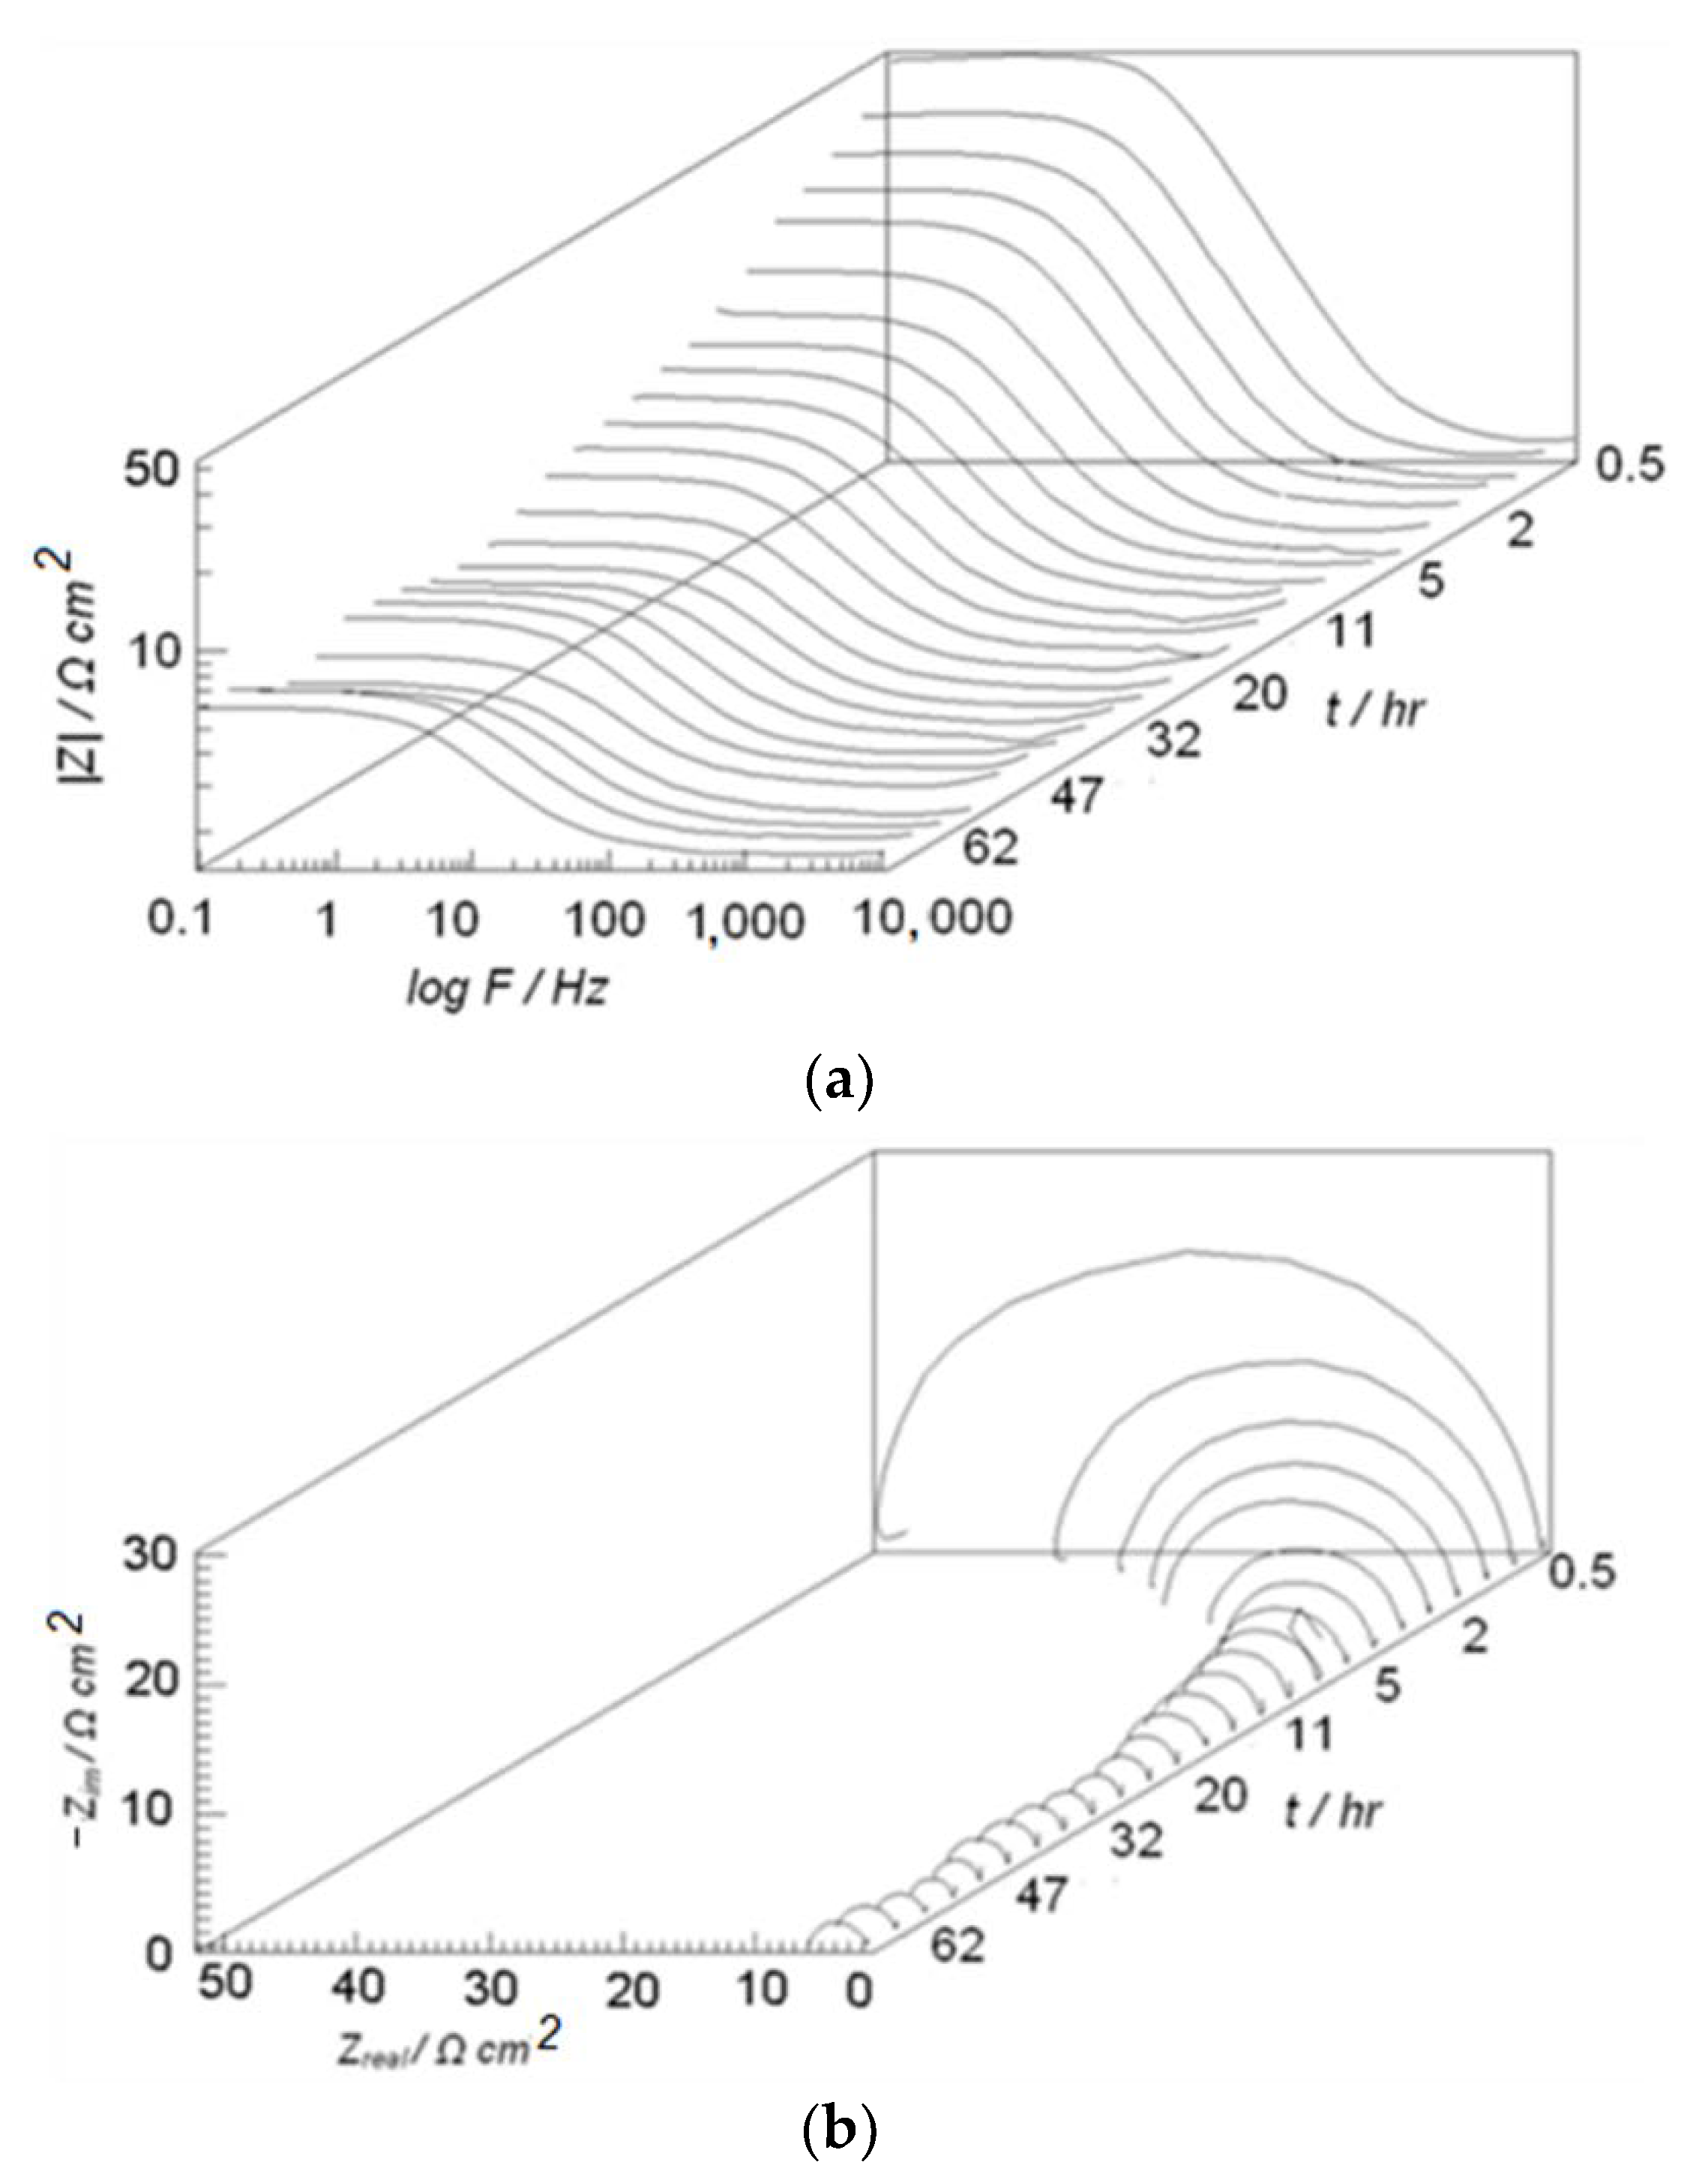
It can be summarized from the above literature review that the majority of the reported work exists in the field of microstructure study, thermally grown oxide as a function of change in the process parameters, coating deposition technique, and coating powder composition. The focus of this study is the corrosion performance evaluation by using electrochemical testing techniques and characterization of surface oxides by using X-ray photoelectron spectroscopy. The corrosion testing will be carried out by using the potentiodynamic polarization method, electrochemical impedance spectroscopy, and scanning electrochemical microscopy (SECM). By using SECM, the current distance response is recorded in the closest vicinity of the coating surface (0–60 µm). The oxide growth on the surface is simulated by potentiostatically polarizing the sample to 100 mV, 500 mV, and 1000 mV. The analysis of the oxide surface will be carried out by using X-ray photoelectron spectroscopy. The use of this experimental technique contributes to enhancing understating of corrosion performance of CoNiCrAlY coating.

2. Materials and Methods

2.1. Coating Powder Material

A commercially available gas atomized CoNiCrAlY powder with a size range of −45 µm to +20 µm was used for coating. The composition of the powder provided in the company data sheet and the one measured by using the foundry master UV optical spectrometer are presented in Table 1.

2.2. Coating Procedure

The CoNiCrAlY coating was produced on grit-blasted mild steel samples. Met-Jet III torch was used to produce a coating thickness of approximately 200 µm. The coating was prepared by using optimized parameters summarized in Table 2. The fuel used in the Met-Jet III torch is kerosene which is mixed with oxygen to burn in the combustion chamber. The powder is charged to the torch radially assisted by the carrier gas. The sample holder allows rotary and translation motion to produce multiple layers of the coating of desired thickness. The torch schematic is shown in Figure 1.

2.3. Sample Preparation

2.3.1. Microscopy

Mild steel coat samples of approximately 1 cm2 area were embedded in black conductive epoxy and gradually polished to achieve a smooth surface of <1 µm surface finish. The samples were etched in 2% Nital solution and washed with de-ionized water. A thin carbon coat was applied to minimize the charging effect. The scanning electron microscopy was carried out using Philips XL 30 model. A cross section of the coating is presented in Figure 2 to show the thickness.

2.3.2. Corrosion Testing

Mild steel-coated samples of size 1 × 1 cm size were embedded in non-conductive epoxy and polished as the above samples. On the backside of the embedded coated samples, the necessary secure/seal electrical connection was achieved by drilling a tapping. The potentiodynamic polarization and EIS tests were carried out by using 3-electrode ACM-potentiostat, Manchester, UK. SECM tests were carried out by using 4-electrode Chi-potentiostat, Texas, USA. A voltage window of −250 mV to 1200 mV scanned at 25 mV/min was used for potentiodynamic polarization tests. For reactivation polarization curves, samples were scanned from −150 mV to 450 mV at a scan rate of 50 mV/min, 75 mV/min, 100 mV/min, and 125 mV/min.
A frequency range of 0.01 Hz to 10,000 Hz with a superimposed voltage signal of 5 mV is used for impedance experiments. The data were recorded over each 100 Hz of frequency. Some of the erratic data points were removed to improve data presentation. Same process parameters were used for the EIS of the heat-treated samples and time-based EIS experiments.
Scanning electrochemical microscopy experiments were carried out while keeping the tip voltage at 0.6 V to keep the tip at steady state current. The SECM imaging was carried out by bring the microelectrode tip at a distance of 5 µm and scanning the surface at 25 µm/s in forward direction and 50 percent overlap in the lateral direction. The current distance curves were carried out by raising the microelectrode 60 µm from the surface and approaching to the closest position at the coating.

2.3.3. XPS Testing

The XPS testing was carried out on 24 h air-exposed samples and potentiostatically polarized samples for 5 min to 100 mV, 200 mV, 500 mV, and 1000 mV. The VG ESCA Lab Mark I photoelectron spectrometer, Surry, UK. with a non-monochromatic AlKα with excitation energy of 1486.6 eV was used at an ultra-high vacuum. The correction of XPS peaks was corrected by using the C 1s peak, defined at 285 eV for all samples.

2.3.4. Fabrication of Microelectrode

Microelectrodes for carrying SECM tests were carried out by heat sealing 25 µm diameter platinum (Pt) wire in borosilicate glass. The connection between Pt-wire with outside cable was done by soldering and the tip of the electrode was polished using a micropipette beveller to secure the glass to wire diameter ratio (Rg) of below 10. The theoretical curves for negative feedback and positive feedback in Figure 3a were generated by using Equations (1) and (2) [18]. The Rg value is important to get the accurate value of the current. The microelectrode approach gives positive feedback (infinite current) when reaching to conductor surface and gives negative feedback (zero current) when reaching to insulator surface. The Rg value was analyzed by fitting the positive feedback curve (Pt) and negative feedback curve (PTFE) with the theoretical curve previously generated for the line-constants values given in Table 3. Establishing an exact circular cross-section was hard establish as shown in micrograph in Figure 3b, hence a glass diameter of 160 µm–206 µm was achieved which produced an Rg value of 7.32.
Negative   feedback                 i T L = 1 k 1 + k 2 L + k 3 exp k 4 L
Positive   feedback               i T L = k 1 + k 2 L + k 3 exp k 4 L

2.3.5. Solution Preparation

The polarization curves and impedance spectroscopy experiments were conducted in 0.5 M sulfuric acid while SECM experiments were carried out by dissolving 1 mM ferrocenemethonal (redox mediator) in 0.5 M K2SO4. All solutions were prepared with the highest purity chemicals.

3. Results and Discussion

3.1. Microstructure of HVOF CoNiCrAlY Coatings

Figure 4a–c shows the microstructure of the CoNiCrAlY-etched sample. The coating shows a dense microstructure with few cracks and pores on the surface in Figure 4a. The dense microstructure is attributed to the proper fusion and soft components of the coatings. The coatings still showed a typical microstructure of HVOF coatings consisting of splats and partially melted particles [2,21]. The splats formed when a molten portion of the powder stream hit the hard target surface. Figure 4c clearly shows splat areas, this area is largely heterogeneous physically and chemically due to the non-thermodynamic cooling taking place during solidification. The microstructure in Figure 4b shows the particle boundary where the core of the particle retains its columnar-cellular structure of gas atomization. The EDS spot analysis shows the presence of a grey color γ-phase that is rich in Cr while a bright color β-phase is rich in Al. Both phases have the presence of Co and Ni present as major constituents. There was not any peak identified for the yttrium, probably due to the low concentration in the powder. The results extracted for EDS analysis are presented in Table 4.

Polarization Curves for Different HVOF Coatings

Polarization experiments were carried out in three different solutions to study the change in corrosion parameters. Figure 5 shows corrosion taking place at a higher rate in acid solution as compared to the salt solution. The corrosion potential for all the samples was found with a limit of ±50 mV. A difference of 2–3 decades of current density was found between samples polarized in sulfuric acid and salt solutions. This means that components of the coatings are corroding but corrosion is taking place at a much higher rate in sulfuric acid solution than in sodium chloride and sodium sulphate. The corrosion current density is the intersection point on the cathodic and anodic part of the polarization curves, and a higher current density indicates faster corrosion reactions. The results extracted from polarization curves are presented in the Table 5.
In CoNiCrAlY coatings, although there are enough active-passive metals to form a passive layer, still the microstructure is heterogeneous, physically (pores, cracks) and chemically (phases, composition, oxides) [3,21]. These heterogeneities of the coating do not allow for the formation of an adherent and dense passive layer. The coating sample in 3.5% NaCl did not show passivity at all while the ones in 0.5 M sulfuric acid and 3.5% Na2SO4 showed partial passivity. This indicates that samples in 3.5% NaCl actively corrode while 3.5% Na2SO4 show an up-word shift indicating the reaction is slowing down with higher potential.
The coating samples in 0.5 M sulfuric acid show a decrease in the current with an increase in potential around −250 to −150 mV which indicates the surface corrosion product is retarding the reaction. The curve also shows some humps before reaching the parallel line with the potential axis (passivity) [4,22,23]. This change may be due to the microstructure heterogeneities or composition variation around the splat boundaries. In order to investigate it further, potential-kinetic-reactivation (PKR) experiments were carried out. The PKR technique is often reported for stainless steel to study the localized deficiency of chromium due to heat effects [24,25,26]. As there are fast heating and cooling involved in the HVOF coating process there is the possibility of the formation of chromium depletion zones [2,21]. Furthermore, cracks and pores can cause crevice corrosion as well. To test the chromium depletion and crevice corrosion, tests were carried out by adding 50 ppm potassium thiocyanate (KSCN) in 0.5 M sulfuric acid solution. The polarization curves from experiments are presented in Figure 6. The crevice corrosion can be identified if the reverse scan of the polarization curve intersects the forward scan (between an active and passive region). The forward and reverse scans do not intersect each other, hence there is no crevice corrosion [27]. The chromium depletion regions can be identified by a defined reverse peak around the same location as in the forward scan. The reverse peak was not very clear but at least there was a small hump around the forward peak [28,29]. This may be due to the regions in splat boundaries that are deficient in chromium.
Alongside physical features and chemical segregation in the coatings, coatings constituents and their interaction with electrolytes make the corrosion process even more complex. In the polarization method, the applied voltage perturbation produces charging current and faradaic current [27,30]. The charging current does not contribute to reaction kinetics but rather moves the charge species near the working electrode. The current responsible for corrosion reaction is Faradaic current which is produced due to an electrochemical reaction at the coating-electrolyte interface. The factor is largely studied by electrochemists but ignored by corrosion scientists [1,23]. In order to highlight this aspect of the corrosion testing, polarization curves were recorded in the active region. The extracted data of the polarization curves at different scan rates are presented in Table 6. It can be seen at 100 mV/min, the portion of the faradic current is five-fold less than the charging current. The difference between these two currents reaches two-fold at 25 mV/s. The icorr and polarization resistance also change with scan rate. Hence it can be concluded here that a slow voltage scan rate is required to get the current that has a minimum charging current. It should be also noted that the voltage scan rate should not be too lower either which can change the surface condition too much during the testing process. The prolong exposure of the sample in a reactive electrolyte can alter the surface condition. This causes the current flow due to applied signal as well as the current involve in natural corrosion. Therefore, the voltage scan rate should be selected to furnish the above two points.

3.2. Electrochemical Impedance Spectroscopy

In order to further understand the electrochemical response of the CoNiCrAlY coating, EIS experiments were carried out in 0.5 M sulfuric acid. The surface condition of the samples was deliberately changed by polarizing the sample to 100 mV and 500 mV potentials before impedance experiments. The values were chosen from polarization graphs where coated samples actively corrode around 100 mV and acquired a partial passivity around 500 mV. The impedance data of the polarized sample were compared with the graphs recorded at open-circuit voltage.
Bode impedance graphs and the Nyquist graphs for three different conditions are presented in Figure 7a,b. It can be seen from bode impedance graphs that impedance gradually decreases at the low-frequency range while not much change was observed on the high-frequency side of the plots. The low-frequency side of the plots belongs to the polarization resistance of the corrosion processes taking place at the surface [10,31,32,33]. The low value of the polarization resistance indicates that oxidation that occurs on the surface is not a barrier to the current flow. The increase in prior polarization voltage from 100 to 500 mV makes the surface more active rather forming a passive layer.
In order to quantify impedance parameters, graphs were compared with the passive electrochemical equivalent circuit. Without going into very much detail about impedance modeling, a simple Randles circuit model was used for curve fitting [34]. The results extracted from the analysis are presented in Table 7. The gradual decrease in the impedance value from open circuit potential to the 500 mV showed that corrosion resistance of the coatings decreased. The decrease in the corrosion resistance may be due to activating more corrosion sites when oxidation potential is increased.
The Nyquist plots of all samples showed an inward semi-circle with the end of the graph lifting toward lower frequencies. The inward loop appears on the impedance spectra due to inductive behavior. The possible inductive loop response in coated structure may be elemental powder particles encapsulated by oxides in the surroundings. The inductive behavior may also occur if there are some fast corrosion reactions taking place at a lower frequency which influx the impedance loop to shift in a backward direction.
The effect of heat-treatment on surface reactivity was further tested on the samples by recording impedance spectra on coated samples isothermally heating to 1000 °C to grow Al2O3 on the surface. After heat-treatment, impedance spectra were recorded at OCP and compared with the samples prior to being polarized to 100 mV and 1000 mV. It can be seen from the Bode impedance graphs in Figure 8a and the Nyquist plots in Figure 8b that the impedance of samples increased which indicates that resistance to corrosion is much enhanced as compared to the sample not heat treated. The drop in impedance due to prior polarization is the same as of the non-heat treated samples. This means the passive layer form increases its insulation properties, yet with providing prior oxidation voltage the passive layer damage occurs. This damage translates in terms of decreasing impedance values at lower frequencies. The inverted loop trend, Figure 7, appeared in the non-heat-treated samples is no more visible in the Nyquist plot figure indicating the layer formed on the surface obstructs some of the reactions taking place because of the relatively thick oxide layer formed on the surface.
Another sequence of experiments was carried out on how coated samples behave in corrosive media with time. This experimental sequence was carried out by keeping 0.5 h–5 h of the time gap between the set of graphs acquired. The sample was kept in 0.5 M sulfuric acid for 3-days while recording the impedance after the set time. The Bode impedance plots, Figure 9a and the Nyquist plots, Figure 9b are presented on a 3-D axis to represent how impedance change with time. The decline in impedance quantities indicate low corrosion resistance. Both bode impedance and Nyquist plots show a fast decrease in the impedance for around 10 h before reaching a somewhat constant value. This indicates that at the start of the experiment, the reaction was faster and reached somewhat to a steady state. The surface of the coating has micro-cracks, pores, and regions of variant electrochemical activity. These sites initiate corrosion processes steadily, the first interaction of the solution forms a thin layer which was damaged with time due to progressive corrosion processes. These progressive corrosion processes are responsible for the decline in lowering the impedance values.

3.3. Scanning Electrochemical Microscopy

In order to study the coating surface activity in the closest vicinity, scanning electrochemical microscopy (SECM) was carried out [19,20]. The microelectrode has a platinum wire of 25 µm with an RG value of ≤10 and is used for SECM imaging and approach curves. The RG is a ratio between glass diameter and conductor diameter and measured at the tip of the microelectrode. The lower RG is required to have only diffusion-limited current at the tip surface. The SECM experiments were carried out in a droplet containing a 1 mM ferrocene methanol (FcOH) redox mediator in 0.5 M K2SO4 solution. The SECM imaging and approach curves were carried out on a pre-aligned coated surface while keeping the tip potential at 0.6 V. The voltage (0.6 V) is the oxidation potential of FcOH, necessary to achieve a steady-state current on the microelectrode tip.
The SECM image in Figure 10 is recorded in feedback mode, bringing the tip of the microelectrode at 4 µm and raster scanning an area of 500 µm × 500 µm. The SECM shows the range of feedback from the coating surface. In order to further confirm the response, the microelectrode was moved to the regions that show different contrast. The data were presented in normalized values of the current and distance, where the y-axis was tip current/steady-state current and the x-axis is tip distance from the surface/radius of platinum wire (12.5 µm). For all the four probe approach, curves (current-distance curves) recorded on the surface of the non-heat treated coating in Figure 11a show positive feedback. This means all sites were electrochemically active which increase the tip current from steady-state to infinite. The same experiment was carried out after heat-treating the coatings to 1000 °C for 2 h. The approach curves recorded at the heat-treated sample in Figure 11b show negative feedback that decrease the tip current to zero due to the insulation nature of the surface and blocks diffusion from the surrounding. The small shift in the current at the end of curves for both non-heat treated and heat-treated samples were probably due to the uneven sample surface of the coated samples. These experiments confirm that for the non-heat-treated samples, corrosion process was taking place all over the surface while the insulating film is developed on the surface after heat treatment. These tests are important in this case as they give the pointed localized activity on the coated surface. Furthermore, the SECM current data are free of charge current due to the small Rg value.

3.4. X-ray Photoelectron Spectroscopy

X-ray photoelectron spectroscopy (XPS) was carried out to analyze oxides formed on air-exposed samples and on the samples polarized to different voltages. The quantification of the passive layer was carried out by survey spectrum and analysis of the high-resolution (HR) peaks [13]. The survey in Figure 12a spectrum identifies the peak positions of O 1s, Ni 2p, Co 2p, and Cr 2p at 531 eV, 853 eV, 778 eV, and 574 eV. A very small peak of Al 2s was identified at 120 eV, the area was very small to carry out any analysis of the peak. The peak position of the elements matches well with the NIST crystal structure database [35,36]. The quantification of elements was done by measuring the area of the peaks which was measured as 71% for O 1s, 3.5% for Ni 2p, 8.1% for Co 2p, and 11% for Cr 2p for the sample exposed in air for 24 h. The percentage area for the O 1s peak in Figure 12b changes to 83% for the sample polarized to 100 mV and 76% for the sample polarized to 1000 mV in Figure 12c. The percent peak area for Ni 2p, Co 2p, and other elements also changes with polarization but oxidation of the coating constituents is much higher than the air-exposed and for the sample polarized to higher potentials.
After the formation of the oxides, their quantity approximation was carried out by HR spectra. The Ni 2p shown in Figure 13a consists of Ni 2p1/2 and Ni 2p3/2, the peak position was observed around 852 eV and 855 eV. The HR spectra further shows the presence of NiO peaks near both Ni 2p1/2 and Ni 2p3/2 peaks around 869 eV and 872 eV in Figure 13b. A satellite peak in Figure 13c was also visible on the HR-spectra of the sample polarized to 1000 mV. The results extracted from the area under the curves for quantification are presented in Table 8. The type of oxide may be polarization dependent but overall, the elemental peak area decreases with polarization and the oxide area increases with the polarization.
The HR spectra of Co 2p in Figure 14a show two sub-peaks for Co 2p3/2 and Co2p1/2 around 777.9 eV and 793.05 eV. The Co2O3 was found as a major oxide attached with Co-doublet. The peak area for the oxide was measured as 73% for the air-exposed sample in Figure 14a, 86% for 100 mV polarized sample in Figure 14b, and 78% for the 500 mV polarized sample. The HR spectra for 1000 mV polarized sample in Figure 14c was not clearly defined; hence it was not possible to do an analysis of the region.
The HR spectra of Cr 2p in Figure 15a show the doublet of Cr 2p1/2 and Cr 2p3/2 around 583 eV and 574 eV. The oxide form for both peaks was Cr2O3 which was visible at around 583 eV for Cr 2p1/2 and 577 eV for Cr 2p3/2. The results extracted from the area under the curve for the peaks in Figure 15b,c are summarized in Table 8 which shows the maximum oxidation of the sample polarized to 100 mV as compared to other samples.
It can be summarized from the above XPS results and analysis that oxidation of CoNiCrAlY coatings starts as soon as the polished surface is exposed to air. The aluminum present in the coatings starts oxidizing and forming Al2O3 followed by the oxidation of aluminum present in phases. The start of the oxidation can be linked to the Gibbs free energy of oxidation which is −1690.46 kJ/mol for Al2O3 and −1153.88 kJ/mol for Cr2O3, −251 kJ/mol for NiO and −254 kJ for CoO. The oxidation of the other elements proceeds once the high-energy element is oxidized. In case of excess energy at the coating surface (polarized samples), oxidation of two elements may go side by side to form skeletal oxide rather than compact oxide. The formation of multi-oxide is also possible when a sample is exposed to air for a prolonged time. Once the surface availability of the active element diminishes, it starts oxidizing other components of the coatings. Among all samples, the sample polarized to 100 mV showed a high level of oxidation. The voltage window can be noted as an active oxidation region from the polarization curve. It is also worth noting that Ni and Co oxidation occurs although these elements have relatively low Gibbs free energy. This may be due to preferential oxidation of the coating components which develop enough driving force to oxidize these elements at lower potential. The quantification of oxidation is not very precise due to the errors in energy position is 10% and intensities in HR spectra 20% but still, these analyses improve the understanding of oxide formation on the passive layer of the multi-component coatings system.

4. Conclusions

It can be concluded that the HVOF coating microstructure is largely heterogeneous. This heterogeneous microstructure allows the surface to stay active in salt solutions while partially passivate in acid solutions. Although this heterogeneity does not allow complete passivation, yet it does not allow the formation of crevice corrosion or sensitization. This was revealed from indistinct forward and reverse peaks of PKR polarization curves. It is also worth noting that the potentiodynamic polarization curves results include the charging current. Which causes overestimation of corrosion parameters. A polarization curve at low voltage scan rate of 25 mV/min contains almost half of the corrosion current as charging current. This aspect is partially sorted out by using electrochemical impedance spectroscopy, which separates the capacitance from polarization resistance. But with the EIS, there is a concern of surface change due to prolong exposure in electrolyte especially at low frequencies. The EIS results over an extended period of time show this trend by declining impedance with time. The promising results of scanning electrochemical microscopy reveal the surface activity in the closest proximity of the coatings. Furthermore, the results eliminate the charging current effect due to the steady state current at the microelectrode tip. The XPS results also reveal that the mixed oxide exists in the coatings at the very beginning and components of the oxides largely depend on the environment and the level of oxidation.

Author Contributions

Conceptualization, A.N. and A.F.A.F.; methodology, A.N. and Iftikhar Faraz.; software, A.N.; validation, A.N. and A.F.A.F.; formal analysis, A.N.; investigation, A.N.; A.F.A.F.; data curation, M.I.F.; writing—original draft preparation, A.N., M.I.F., A.F.A.F.; writing—review and editing, A.N., A.F.A.F., M.I.F.; visualization, A.N.; supervision, A.F.A.F.; project administration, A.N., A.F.A.F.; funding acquisition, A.N. All authors have read and agreed to the published version of the manuscript.

Funding

This work is supported by the Deanship of Scientific Research of King Faisal University under Grant No. GRANT535.

Institutional Review Board Statement

Not applicable.

Informed Consent Statement

Not applicable.

Data Availability Statement

The authors confirm that the data supporting the findings of this study are available within the article.

Acknowledgments

This work was supported by the Deanship of Scientific Research, Vice Presidency for Graduate Studies and Scientific Research, King Faisal University, Saudi Arabia [Project No. GRANT535].

Conflicts of Interest

The authors declare that there is no conflict of interest.

References

  1. Krishna, B.V.; Misra, V.N.; Mukherjee, P.S.; Sharma, P. Microstructure and properties of flame sprayed tungsten carbide coatings. Int. J. Refract. Met. Hard Mater. 2002, 20, 355–374. [Google Scholar] [CrossRef]
  2. Luo, H.; Li, X.; Pan, C.; He, P.; Zeng, K.; Hu, K.; Li, H.; Yang, C. Microstructure and oxidation resistance of CoNiCrAlY coating manufactured by laser powder bed fusion. Surf. Coat. Technol. 2021, 427, 127846. [Google Scholar] [CrossRef]
  3. Molins, R.; Normand, B.; Rannou, G.; Hannoyer, B.; Liao, H. Interlamellar Boundary Characterization in Ni-based alloy Thermally Sprayed Coating. Mater. Sci. Eng. A 2003, 351, 325–333. [Google Scholar] [CrossRef]
  4. Verdian, M.M.; Raeissi, K.; Salehi, M. Corrosion performance of HVOF and APS thermally sprayed NiTi intermetallic coatings in 3.5% NaCl solution. Corros. Sci. 2010, 52, 1052–1059. [Google Scholar] [CrossRef]
  5. Ahmaniemi, S.; Vuoristo, P.; Mantyla, T.; Gualco, C.; Bonadei, A.; di Maggio, R. Thermal cycling resistance of modified thick thermal barrier coatings. Surf. Coat. Technol. 2005, 190, 378–387. [Google Scholar] [CrossRef]
  6. Chen, W.R.; Wu, X.; Dudzinski, D.; Patnaik, P.C. Modification of oxide layer in plasma-sprayed thermal barrier coatings. Surf. Coat. Technol. 2006, 200, 5863–5868. [Google Scholar] [CrossRef]
  7. Khan, A.N.; Lu, J. Behavior of air plasma sprayed thermal barrier coatings, subject to intense thermal cycling. Surf. Coat. Technol. 2003, 166, 37–43. [Google Scholar] [CrossRef]
  8. Newaz, G.; Chen, X. Progressive damage assessment in thermal barrier coatings using thermal wave imaging technique. Surf. Coat. Technol. 2005, 190, 7–14. [Google Scholar] [CrossRef]
  9. Tsai, W.T.; Chen, J.-R. Galvanic corrosion between the constituent phases in duplex stainless steel. Corrosion Science 2007, 49, 3659–3668. [Google Scholar] [CrossRef]
  10. Schiller, C.A.; Richter, F.; Wagner, E.G.A.N. Validation and evaluation of electrochemical impedance spectra of systems with states that change with time. Phys. Chem. 2001, 2001, 374–378. [Google Scholar] [CrossRef]
  11. Park, B.-W.; Yoon, D.-Y.; Kim, D.-S. Formation and modification of a binary self-assembled monolayer on a nano-structured gold electrode and its structural characterization by electrochemical impedance spectroscopy. J. Electroanal. Chem. 2011, 661, 329–335. [Google Scholar] [CrossRef]
  12. Ali, M.S.; Song, S.; Xiao, P. Degradation of thermal barrier coatings due to thermal cycling up to 1150 °C. J. Mater. Sci. 2002, 37, 2097–2102. [Google Scholar] [CrossRef]
  13. Tang, F.; Ajdelsztajn, L.; Schoenung, J.M. Characterization of oxide scales formed on HVOF NiCrAlY coatings with various oxygen contents introduced during thermal spraying. Scr. Mater. 2004, 51, 25–29. [Google Scholar] [CrossRef]
  14. Tang, F.; Ajdelsztajn, L.; Kim, G.E.; Provenzano, V.; Schoenung, J.M. Effects of surface oxidation during HVOF processing on the primary stage oxidation of a CoNiCrAlY coating. Surf. Coat. Technol. 2004, 185, 228–233. [Google Scholar] [CrossRef]
  15. Guo, W.; Zhang, H.; Zhao, S.; Ding, Z.; Liu, B.; Li, W.; Xu, H.; Liu, H. Corrosion Behavior of the CoNiCrAlY-Al2O3 Composite Coating Based on Core-Shell Structured Powder Design. Materials 2021, 14, 7093. [Google Scholar] [CrossRef]
  16. Karaoglanli, A.C.; Grund, T.; Turk, A.; Lampke, T. A comparative study of oxidation kinetics and thermal cyclic performance of thermal barrier coatings (TBCs). Surf. Coat. Technol. 2019, 371, 47–67. [Google Scholar] [CrossRef]
  17. Fedrizzi, L.; Rossi, S.; Cristel, R.; Bonora, P.L. Corrosion and wear behaviour of HVOF cermet coatings used to replace hard chromium. Electrochim. Acta 2004, 49, 2803–2814. [Google Scholar] [CrossRef]
  18. Cornut, R.; Lefrou, C. New analytical approximation of feedback approach curves with a microdisk SECM tip and irreversible kinetic reaction at the substrate. J. Electroanal. Chem. 2008, 621, 178–184. [Google Scholar] [CrossRef]
  19. Bard, A.J.; Mirkin, M.V.; Unwin, P.R.; Wipf, D.O. Scanning electrochemical microscopy. 12. Theory and experiment of the feedback mode with finite heterogeneous electron-transfer kinetics and arbitrary substrate size. J. Phys. Chem. 1992, 96, 1861–1868. [Google Scholar] [CrossRef]
  20. Mirkin, M.V.; Fu-Ren, F.F.; Bard, A.J. Scanning electrochemical microscopy part 13. Evaluation of the tip shapes of nanometer size microelectrodes. J. Electroanal. Chem. 1992, 328, 47–62. [Google Scholar] [CrossRef]
  21. Saeidi, S. Microstructure, Oxidation & Mechanical Properties of as-Sprayed and Annealed HVOF & VPS CoNiCrAIY Coatings. Ph.D. Thesis, Mechanical, Materials and Manufacturing Engineering. University of Nottingham, Nottingham, UK, 2011. [Google Scholar]
  22. Bolelli, G.; Lusvarghi, L.; Giovanardi, R. A Comparison between the Corrosion Resistances of some HVOF-Sprayed metal alloy Coatings. Surf. Coat. Technol. 2008, 202, 4793–4809. [Google Scholar] [CrossRef]
  23. Zhang, X.L.; Jiang, Z.H.; Yao, Z.P.; Song, Y.; Wu, Z.D. Effects of scan rate on the potentiodynamic polarization curve obtained to determine the Tafel slopes and corrosion current density. Corros. Sci. 2009, 51, 581–587. [Google Scholar] [CrossRef]
  24. Li, S.-X.; Li, L.; Yu, S.-R.; Akid, R.; Xia, H.-B. Investigation of intergranular corrosion of 316L stainless steel diffusion bonded joint by electrochemical potentiokinetic reactivation. Corros. Sci. 2011, 53, 99–104. [Google Scholar] [CrossRef]
  25. Wu, T.-F.; Cheng, T.-P.; Tsai, W.-T. The electrochemical potentiokinetic reactivation behavior of Alloy 600. Mater. Chem. Phys. 2001, 70, 208–216. [Google Scholar] [CrossRef]
  26. Parvathavarthini, N.; Gupta, R.K.; Kumar, A.V.; Ramya, S.; Mudali, U.K. Interpretation of Electrochemical Potentiokinetic Reactivation data in the presence of sulphide/oxysulphide inclusions in 316LN stainless steel. Corros. Sci. 2011, 53, 3202–3214. [Google Scholar] [CrossRef]
  27. Silverman, D.C. Tutorial on Cyclic Potentiodynamic Polarization Technique. Corros. Sci. 1998, 1–21. [Google Scholar]
  28. Maday, M.F.; Mignone, A.; Vittori, M. The application of the electrochemical potentiokinetic reactivation method for detecting sensitization in inconel 600. The influence of some testing parameters. Corros. Sci. 1988, 28, 887–900. [Google Scholar] [CrossRef]
  29. Bakhshayesh, M.M.; Farzadi, A.; Doustahadi, A.; Nouripour, M. Measurement of degree of sensitization in post-weld heat treated 13Cr-4Ni martensitic stainless steel clad using double loop electrochemical potentiokinetic technique. Eng. Fail. Anal. 2022, 134, 106046. [Google Scholar] [CrossRef]
  30. ASTM. Standard Reference Test Method for Making Potentiostatic and Potentiodynamic Anodic Polarization Measurements (G5–94); ASTM International: West Conshohocken, PA, USA, 1999. [Google Scholar]
  31. Saadi, S.A.; Yi, Y.; Cho, P.; Jang, C.; Beeley, P. Passivity breakdown of 316L stainless steel during potentiodynamic polarization in NaCl solution. Corros. Sci. 2016, 111, 720–727. [Google Scholar] [CrossRef]
  32. Andrzej, L. Electrochemical Impedance Spectroscopy and its Applications. In Modern Aspects of Electrochemistry; Springer: New York, NY, USA, 2002; Volume 32, pp. 143–248. [Google Scholar]
  33. Macdonald, J.R. Impedance Spectroscopy: Theory, Experiment, and Applications; Willy: Hoboken, NJ, USA,, 2005. [Google Scholar]
  34. Verdian, M.M.; Raeissi, K.; Salehi, M. Electrochemical impedance spectroscopy of HVOF-sprayed NiTi intermetallic coatings deposited on AISI 1045 steel. J. Alloys Compd. 2010, 507, 42–46. [Google Scholar] [CrossRef]
  35. Powell, C.J.; Jablonski, A.; Naumkin, A.; Kraut-Vass, A.; Conny, J.M.; Rumble, J.R. NIST data resources for surface analysis by X-ray photoelectron spectroscopy and Auger electron spectroscopy. J. Electron Spectrosc. Relat. Phenom. 2001, 114–116, 1097–1102. [Google Scholar] [CrossRef]
  36. Crist, B.V. The XPS library website: A resource for the XPS community including—The XPS library of information, XPS spectra-base having >70,000 monochromatic XPS spectra, and spectral data processor (SDP) v8.0 software. J. Electron Spectrosc. Relat. Phenom. 2021, 248, 147046. [Google Scholar] [CrossRef]
Figure 1. Schematic diagram of HVOF process for producing coating on mild steel sample.
Coatings 12 01396 g001
Figure 2. Micrograph of the coating to represent cross section thickness.
Coatings 12 01396 g002
Figure 3. (a) Theory and experimental curves fitting for measuring RG value, (b) Microelectrode tip micrograph for RG, bright circle is platinum, grey is glass.
Coatings 12 01396 g003
Figure 4. (a) Micrograph of CoNiCrAlY coating, (b) SEM images of CoNiCrAlY coatings, (a) at 2500×, and (c) at 5000×.
Coatings 12 01396 g004
Figure 5. Polarization curves for CoNiCrAlY Coatings in different electrolytes started from −250 mV to 1200 mV at 20 mV/min after stabilizing samples in electrolytes for 1 h.
Coatings 12 01396 g005
Figure 6. Polarization curves in 0.5 M sulfuric acid with 50 ppm of KSCN reactivator.
Coatings 12 01396 g006
Figure 7. (a) Bode impedance plots, (b) Nyquist plots conducted at CoNiCrAlY coating samples in 0.5 M sulfuric acid after polarization of 100 mV (active) and 500 mV (passive).
Coatings 12 01396 g007
Figure 8. (a) Bode impedance, (b) Nyquist plots of CoNiCrAlY coatings after heat treating of sample to 1000 °C and polarizing to 100 mV and 500 mV.
Coatings 12 01396 g008
Figure 9. (a) Bode impedance, (b) Nyquist plots of CoNiCrAlY in 0.5 M sulfuric acid for a period of 72 h with a time interval of 0.5 to 5 h.
Coatings 12 01396 g009
Figure 10. SECM image in a droplet of 0.5 M K2SO4 containing 1 mM FcOH as redox mediator. The tip of the microelectrode was kept at 0.6 V to have a steady state current at the tip.
Coatings 12 01396 g010
Figure 11. Current distance curves recorded in droplet of 0.5 M K2SO4 containing 1 mM FcOH as redox mediator, (a) CoNiCrAlY coat sample, (b) heat-treated CoNiCrAlY coating sample.
Coatings 12 01396 g011aCoatings 12 01396 g011b
Figure 12. XPS survey spectra, (a) air exposed sample for 24 h, (b) sample polarized to 100 mV, (c) sample polarized to 1000 mV before XPS scan.
Coatings 12 01396 g012
Figure 13. High resolution spectra of Ni 2p peaks, (a) sample exposed for 24 h, (b) sample polarized to 100 mV and (c) sample polarized to 1000 mV before polarization.
Coatings 12 01396 g013
Figure 14. High resolution spectra of Co 2p peaks, (a) sample exposed for 24 h, (b) sample polarized to 100 mV and (c) sample polarized to 1000 mV before polarization.
Coatings 12 01396 g014
Figure 15. High resolution spectra of Cr 2p peaks, (a) sample exposed for 24 h, (b) sample polarized to 100 mV and (c) sample polarized to 1000 mV before polarization.
Coatings 12 01396 g015
Table 1. Chemical composition of the CoNiCrAlY powder.
ElementCoNiCrAlY
Data sheet20–5020–5020–505–20≤1
Lab-tested40.5332060.5
Table 2. Process parameters for coating fabrication on mild steel samples.
Coating MaterialO2 Flow (L/min)Fuel Flow (L/min)N2 Flow (L/min)Nozzle Length (mm)Torch–Sample(mm)Powder Feed Rate (g/min)Number of Passes
CoNiCrAlY8900.475.51003567020–25
Table 3. Pure positive and negative feedback at platinum and PTFE surfaces [19,20].
RGk1k2k3k4Error (%)L Validity Range
5.09 0.720350.751280.26651−1.62091<0.50.1–20
8.13 0.426761.460810.56874−2.28548<10.4–20
Table 4. Energy dispersive spectrum analysis at CoNiCrAlY-coating sample.
Element wt%OxygenAluminumChromiumCobaltNickel
Surface composition-8.7 ± 1.421.4 ± 1.136.2 ± 3.131.8 ± 3.1
Oxygen-rich area18.2 ± 1.711.2 ± 1.219.5 ± 2.627.8 ± 2.023.4 ± 1.4
Al-rich phase-10.0 ± 0.721.2 ± 0.636.2 ± 1.132.7 ± 1.2
Co-Cr-rich phase-6.3 ± 0.622.5 ± 0.338.1 ± 0.233.1 ± 0.9
Table 5. Corrosion resistance results extracted from polarization curves in Figure 5.
SolutionEcorr/mVicorr/µA cm−2ipass/µA cm−2Ebreak/mV
0.5 M H2SO4−355 ± 23130.00 ± 2.5036.15 ± 3.00910 ± 17
3.5% NaCl−310 ± 211.42 ± 0.32-17 ± 12
3.5% Na2SO4−327 ± 149.10 ± 1.62-598 ± 6
Table 6. Polarization results extracted in active regions at different scan rates.
MaterialScan RateRpβaβcIntercept IβaIntercept IβcIcharg Iβa − Iβc/2Ifarad Iβa + Iβc/2IcorrIpass/IpeakEoc
mV/mOhmsmVmVmA/cm2mA/cm2mA/cm2mA/cm2mA/cm2mA/cm2mV
CoNiCrAlY coating10049.196.4161.20.13−0.190.16−0.030.5340.99−330
7537.282.3174.10.17−0.340.255−0.0850.6531.47−326
5030.582.31860.22−0.50.36−0.140.8131.89−322
2527.182.3198.10.27−0.740.505−0.2350.9332.16−319
Table 7. Impedance spectra results after fitting with equivalent circuit model.
Prior ConditionAT OCP100 mV Polarized1000 mV Polarized
Ru (Ω cm−2)3.42.11.4
Rp (Ω cm−2)4.8 × 1012.9 × 1018.9
W (Ω cm−2)---
CPEP3.0 × 10−45.0 × 10−45.0 × 10−4
n1.01.01.0
Table 8. Results data extracted from survey spectra and HR spectra.
Polarization Condition: Polarization Was Carried Out at Constant Potential Polarizations for 5 min
ConstituentBinding Energy (eV)Air for 24 h % Peak Area100 mV % Peak Area200 mV % Peak Area500 mV % Peak Area1000 mV %Peak Area
O 1s531.4971.783.179.476.775.8
Ni 2p853.493.50.42.13.10.2
Co 2p778.498.12.13.63.82.8
Cr 2p574.355.34.66.85.413.1
Al 2s120.4911.49.88.1118.1
High-Resolution XP Spectrum Results of Co 2p
2p3/2 Co777.919.17.826.424.7-
2p3/2Co2O3780.0752.56934.746-
2p1/2 Co793.058.16.721.211.2-
2p1/2Co2O3796.620.316.517.718.1-
High-Resolution XP Spectrum Results of Ni 2p
2p3/2 Ni852.4835.114.230.23127.7
2p 3/2 NiO855.0919.766.335.730.919.6
2p1/2 Ni869.419.61.514.619.43.6
2p1/2 NiO872.5135.61819.518.732.8
2p3/2NiOsat860.33----16.3
High-Resolution XP Spectrum Results of Cr 2p
2p3/2 Cr574.259.7-6.810.63.9
2p3/2 Cr2O3577.1455.756.754.355.360.6
2p1/2 Cr583.67.93.65.79.416
2p1/2 Cr2O3587.126.735.533.224.719.5
2p3/2 Cr2O3579.48-4.2---
Publisher’s Note: MDPI stays neutral with regard to jurisdictional claims in published maps and institutional affiliations.

