Article

Investigation of the Adhesion Strength, Fracture Toughness, and Stability of M/Cr2N and M/V2N (M = Ti, Ru, Ni, Pd, Al, Ag, and Cu) Interfaces Based on First-Principles Calculations

Institute of Advanced Coating Materials, Zhejiang Provincial Key Laboratory for Cutting Tools, Taizhou University, Taizhou 317000, China
*
Authors to whom correspondence should be addressed.
Coatings 2022, 12(1), 66; https://doi.org/10.3390/coatings12010066
Submission received: 23 November 2021 / Revised: 26 December 2021 / Accepted: 4 January 2022 / Published: 7 January 2022

Abstract

:
Obtaining detailed information regarding the interfacial characteristics of metal/hexagonal-TMN composites is imperative for developing these materials with optimal mechanical properties. To this end, we systematically investigate the work of adhesion, fracture toughness, and interfacial stability of M/Cr2N and M/V2N interfaces using first-principles calculations. The orientation (0001) of hexagonal phases and (111) of fcc phases are selected as the interface orientations. Accordingly, we construct M/Cr2N interface models by considering 1N, 2N, and Cr terminations of Cr2N(0001), as well as two stacking sequences (top and hollow sites) for the 1N- and 2N-terminated interface models, respectively. The M/V2N interface models are constructed in the same way. The V-terminated Ni/V2N interface is demonstrated to provide a good combination of the work of adhesion, fracture toughness, and interfacial stability. Therefore, the Ni/V2N interface model can be regarded as the preferred configuration among the metal/hexagonal-TMN interface models considered. The present results offer a practical perspective for tailoring the interfaces in metal/hexagonal-TMN composite materials to obtain improved mechanical properties.

1. Introduction

Metal/transition metal nitride (TMN) composite materials can have good mechanical and tribological properties, because they combine the ductility and hardness provided by soft metal and hard ceramic, respectively [1,2,3]. However, the strength and failure mechanisms of the interface between the two different phases also represent important factors when studying the mechanical properties of these composites. In this regard, studies have demonstrated that the enhanced toughness of these TMN composites is facilitated via various phenomena occurring at the interface, such as crack deflection, stress relaxation, and energy dissipation [4,5,6,7,8]. Therefore, obtaining detailed information regarding the interfacial characteristics is imperative for developing advanced metal/TMN composites with optimal mechanical properties.
TMNs that crystallize in hexagonal structures, such as Cr2N and V2N, which constitute a remarkable class of hard coating materials, have a wide range of potential scientific and industrial uses as protective materials [9,10,11]. Accordingly, metal/hexagonal-TMN coating composites have attracted considerable interest in recent decades [12,13,14]. Guan et al. [12] experimentally demonstrated that Cr/Cr2N nano-multilayer coatings exhibited superior corrosion resistance and high load-bearing capacity. Li et al. [13] experimentally demonstrated that Cu/Cr2N multilayered coatings showed a combination of high hardness, good wear and corrosion resistances. Bílek et al. [14] experimentally demonstrated that Cr2N-Ag nanocomposite thin films deposited on tool steel can have good tribological performances. However, the results of experimental methods lack important details regarding the interfacial molecular mechanisms leading to the phenomenon, and the results therefore tend to be limited.
First-principles calculations based on density functional theory (DFT) can provide a deep insight into the interfaces of composite systems [15,16,17,18,19,20,21]. Here, DFT calculation has been demonstrated to be a powerful method for revealing detailed information regarding atomic and electronic structures at the interfaces between two phases, thereby facilitating predictions regarding the stability, adhesion strength, and fracture toughness of interfaces [22,23,24]. Accordingly, first-principles calculation based on DFT has developed to become one of the most frequently used theoretical methods for revealing the interfacial properties of metal/ceramic composites. Its novelty is that it provides a quantitative evolution of the levels of interfacial properties for composite systems. Moreover, the theoretical results provide a strong reference for the proceeding of related experimental work. For example, Zhao et al. [15] demonstrated that the cohesion strength and fracture toughness of the Mo/TiC interface model were significantly affected by interface orientations, which could help explain the different mechanical properties of various Mo/TiC composites. Li et al. [22] studied the interfacial bonding mechanism and stability of Al(111)/Al2MgC2(0001) interface models by DFT calculations, which could explain the heterogeneous nucleation behaviors of Al crystallites on Al2MgC2 particles in Al/Al2MgC2 composites. Jin et al. [24] investigated the behaviors of He atoms and vacancies in TiO/V interface models, theoretically revealing the effect of He bubbles on TiO/V interfaces under radiation conditions. For the metal/TMN systems considered in this work, previous theoretical studies based on DFT focused their attention on interfacial configuration, stability and bonding strength of metals/cubic TMN interfaces, such as α-Fe/CrN [25], Ni/CrN [26], Cu/TiN [27], and Al/VN [28]. However, to the best of our knowledge, little research has been devoted to metal/hexagonal-TMN interfaces, except γ-Fe(111)/Cr2N(0001) which is found in high-nitrogen steels [29,30]. Consequently, we confirm that, despite the considerable attention on the development of metal/hexagonal-TMNs composites, the interface properties of these composites remain relatively unexplored. The adhesion strength, electronic structure, fracture toughness, and stability at the interfaces between metal and hexagonal TMN materials remain poorly understood. Targeted research is needed, as it is highly conducive to understanding improvements to the mechanical properties of composites in the field of of interface engineering.
The present work addresses this issue by systematically investigating the characteristics of M/Cr2N and M/V2N interfaces using first-principles calculations based on DFT. The (0001) orientation of hexagonal phases, including Cr2N, V2N, Ti, and Ru, and the (111) orientation of fcc phases, including Ni, Pd, Al, Ag, and Cu, are selected as the interface orientations because they are both the preferred orientations of the two types of crystals [12,13,29,30]. We constructed the M/Cr2N and M/V2N interface models by considering both the 1N, 2N, and metal terminations of the nitrides, as well as possible stacking sequences, including top and hollow sites. Convergence tests of the number of atomic layers and evaluation of interfacial lattice misfit were performed beforehand to ensure the validity of the configurations of the interface models. For every metal, we calculated interfacial work of adhesion of the M/Cr2N and M/V2N interface models, and determined the optimal one with the strongest bonding strength. The partial density of states (PDOS), charge density difference plots, and Mulliken charges were analyzed to reveal the strong bonding natures. We further calculated the interfacial fracture toughness of the optimal model for every metal, and ranked the interfacial mechanical properties of these models by considering both the interfacial work of adhesion and the fracture toughness. In addition, the interfacial energy of the optimal model for every metal was calculated for a criterion of the stability of these models from thermodynamics. Finally, we evaluated the interfacial properties of the models based on the combination results of interfacial mechanical properties and stability. We believe that this work can provide a fundamental understanding of the interfacial properties of metal/hexagonal-TMN composites in order to develop advanced cermet materials with high mechanical properties and interfacial stability.

2. Mathematical and Computational Methods

2.1. Methodology

First-principles calculations were performed using the Cambridge Serial Total Energy Package (CASTEP), which employs the plane-wave ultrasoft pseudopotential method based on DFT [31,32]. The generalized gradient approximation (GGA) with the Perdew–Burke–Ernzerhof (PBE) functional was chosen to describe the exchange correlation energy [33]. A plane-wave cutoff energy of 400 eV was used in all calculations. The convergence tolerances were set as 1.0 × 10⁻⁵ eV/atom for the energy, 0.03 eV/Å for the maximum force, and 0.001 Å for the maximum displacement.

2.2. Bulk Properties

Cr2N and V2N have hexagonal closed-packed (hcp) structures with P 3 ¯ 1m space group. In the unit cell of Cr2N (V2N), there are three N atoms and six Cr (V) atoms. The N atoms occupy 1a (0, 0, 0) and 2d (0.333, 0.667, 0.5) Wyckoff sites, the Cr atoms occupy 6k (0.333, 0, 0.249), and the V atoms occupy 6k (0.323, 0, 0.272) sites [34,35,36]. The k-point mesh of the Monkhorst-Pack grid was set as 12 × 12 × 12 for bulk Cr2N, V2N, Ni, Pd, Al, Ag, and Cu, and set as 16 × 16 × 9 for bulk Ti and Ru. The values of lattice constants (a and c), bulk modulus (B), and elastic constants (Cij) calculated for Cr2N, V2N, Ti, Ru, Ni, Pd, Al, Ag, and Cu are listed in Table 1 along with corresponding data obtained from other calculated and experimental results. The good agreement between the past and present calculation results indicates that our calculation parameters are available.

2.3. Surface Convergence Test

To study the interfacial properties of the M/Cr2N and M/V2N models, we first investigated their surface structures. It is essential to ensure that both sides of the interface slabs used in calculations are thick enough to exhibit bulk-like interiors, as it is known that the binding property of thin film can differ significantly from that of thicker one. We conducted convergence tests based on the interlayer relaxation change Δ ij (interlayer relaxation as the percentage of bulk interlayer distance) to determine the appropriate numbers of layers to apply in the interface models to ensure that they were sufficiently thick. A uniform vacuum space of 15 Å thickness is applied in the z direction to separate the free surfaces. The Δ ij can be calculated as follows:
Δ ij = ( d ij d ij 0 ) / d ij 0 × 100 %
where dij and dij0 are the interlayer distances of neighboring layers after and before geometry optimization, respectively.
In general, the value of Δ ij decreases with increasing thickness. For pure metal slabs, it has been widely demonstrated that the value of Δ ij becomes low enough when the slab is thicker than 6 atomic layers [23,43,45,46]. For Cr2N(0001) slabs, as shown in Figure 1, three terminations, including one-N-atom terminated (1N-T), two-N-atoms terminated (2N-T), and Cr terminated (Cr-T) are considered. The V2N(0001) slabs have similar configurations. The interlayer distance changes for Cr2N(0001) and V2N(0001) surfaces after full relaxation are listed in Table 2. We can confirm that 9-layer Cr2N(0001) and 7-layer V2N(0001) are thick enough to exhibit bulk-like interior. In addition, these convergence results are consistent with the previous studies on Cr2N(0001) [29,30]. Therefore, 7-layer metal, 9-layer Cr2N(0001), and 9-layer V2N(0001) slab models were employed in our subsequent calculations.

2.4. Surface Energy

The surface energy is the energy required to split the crystal into two parts along a specific plane and then to form two new surfaces per unit area, which is used to describe the surface stability. The surface energy γ M slab of a pure metal slab can be calculated as follows [38]:
γ M slab = ( E M slab n M slab E M bulk ) / ( 2 A )
where E M slab is the total energy of the metal slab; n M slab is the total number of atoms in the slab; E M bulk is the total energy per atom in the bulk material; A is the corresponding surface area, and the factor 2 represents two identical surfaces of the slab, respectively. The surface energies obtained for the 7-layer metal slab models are listed in Table 3. The surface energies of these slab models are in good agreement with other calculated and experimental surface energy data in the literature, which are also listed in Table 3. These results further verify the reliability of the present DFT calculations.
The Cr2N(0001) and V2N(0001) planes are both polar surfaces, and they have the similar configurations. Take the case of Cr2N, the surface energy of the Cr2N(0001) slab γ Cr 2 N slab can be calculated as follows [38]:
γ Cr 2 N slab = 1 2 A ( E Cr 2 N slab n Cr slab μ Cr slab n N slab μ N slab )
where A is the corresponding surface area; E Cr 2 N slab is the total energy of the Cr2N(0001) slab; n Cr slab and n N slab are the number of Cr and N atoms in the Cr2N(0001) slab, respectively; μ Cr slab and μ N slab are chemical potential of Cr and N atoms in the slabs, respectively.
The Cr2N unit cell has six Cr and three N atoms. When the surface is assumed to be in equilibrium with the bulk, the total energy μ Cr 2 N bulk of the Cr2N unit cell is expressed as follows:
μ Cr 2 N bulk = 6 μ Cr slab + 3 μ N slab
By combining Equations (3) and (4), the γ Cr 2 N slab expression with only one variable μ Cr slab can be calculated as follows:
γ Cr 2 N slab = 1 2 A ( E Cr 2 N slab n N slab μ Cr 2 N bulk 3 ( n Cr slab 2 n N slab ) μ Cr slab )
According to the thermodynamic theories, μ Cr 2 N bulk also equals the sum of bulk Cr2N formation heat Δ H f 0 (Cr2N) and Cr2N chemical potentials of Cr and N ( μ Cr bulk and μ N gas ). Thus, the following equation can be obtained:
μ Cr 2 N bulk = 6 μ Cr bulk + 3 μ N gas + Δ H f 0 ( Cr 2 N )
The μ Cr bulk is calculated as E Cr bulk , the energy of per Cr atom in bulk Cr. The μ N gas is calculated as μ N gas , the energy of N atom with gaseous N2 structure (one N2 molecule in the center of a fixed cubic lattice).
Due to the compound Cr2N being more stable compared to both elementary substances, the μ Cr slab and μ N slab have to be less than μ Cr bulk and μ N gas , respectively. Accordingly, the following inequation can be obtained by combining Equations (4) and (6):
Δ H f 0 ( Cr 2 N ) 6 μ Cr slab μ Cr bulk 0
The value of Δ H f 0 (Cr2N) can be obtained by Equation (6). Our calculation result of Δ H f 0 (Cr2N) is −4.97 eV. This value is in agreement with previous theoretical data of −5.59 eV [30]. The value of Δ H f 0 (V2N) can be obtained using the same method, and the result is −10.18 eV. Accordingly, the Δ H f 0 (eV/atom) obtained for Cr2N and V2N are −0.55 eV/atom and −1.13 eV/atom, respectively. The two values are consistent with the data of −0.506 eV/atom for Cr2N and −1.090 eV/atom for V2N in the Materials Data by Materials Project, respectively.
Consequently, we calculate the surface energies of 1N, 2N, and Cr terminations of Cr2N(0001), and 1N, 2N, and V terminations of V2N(0001), and the results are illustrated in Figure 2a,b, respectively. For 1N, 2N, and Cr terminations of Cr2N(0001), the values of γ Cr 2 N slab are in the ranges of 1.25–1.92 J/m2, 0.90–2.24 J/m2, and 3.32–4.37 J/m2, respectively. For 1N, 2N, and V terminations of V2N(0001), the values of γ V 2 N slab are in the ranges of 1.97–3.27 J/m2, 0.82–3.37 J/m2, and 3.13–5.13 J/m2, respectively. It can be concluded that 1N- and 2N-teminated Cr2N(0001) have lower surface energies, which indicates that they are more thermodynamically stable than the Cr-terminated slab. Similarly, the 1N and 2N-teminated V2N(0001) are demonstrated to be more thermodynamically stable than the V-terminated slab. However, for a comprehensive investigation, 1N, 2N, and Cr or V terminations are all considered in the following studies.

2.5. Interface Models

We constructed the M/Cr2N models considering 1N, 2N, and Cr terminations of Cr2N(0001), respectively. Two stacking sequences, including top and hollow sites, were considered for the 1N-T and 2N-T interface models, respectively. Here, the top site indicates that the interfacial M atoms sit above the interfacial N atoms, and the hollow site indicates that the interfacial M atoms sit above Cr atoms at the fourth layer. Figure 3 illustrated five types of configurations for the M/Cr2N interface model for every metal considered. Accordingly, the interfacial orientation relationship of the M/Cr2N interface model for every metal are listed in Table 4, which are intentionally constructed to minimize the interfacial mismatch rate.
The M/Cr2N and M/V2N interface models were built in the same way because the lattice constants of Cr2N and V2N are approximate. Here, the softer M slabs are stretched to align with Cr2N and V2N slabs. Interfacial mismatch rates are calculated according to the change of lattice constant of the M slabs [26]. The calculated results of interfacial mismatch rates for the M/Cr2N and M/V2N interface models are illustrated in Figure 4, and they are unanimously less than 7%. Therefore, the interface models constructed in this work represent valid structures.

3. Results and Discussion

The calculations on interfacial work of adhesion, electronic structure, interfacial fracture toughness, weak point, and interfacial energy are performed in this section. Interfacial mechanical properties are assessed by the results of work of adhesion and fracture toughness. PDOS, charge density difference plots, and Mulliken charges are used to analyze interfacial bonding natures. Interfacial energies are provided to assess the interfacial stability. The interfacial properties are evaluated based on the combination of interfacial mechanical properties and stability.

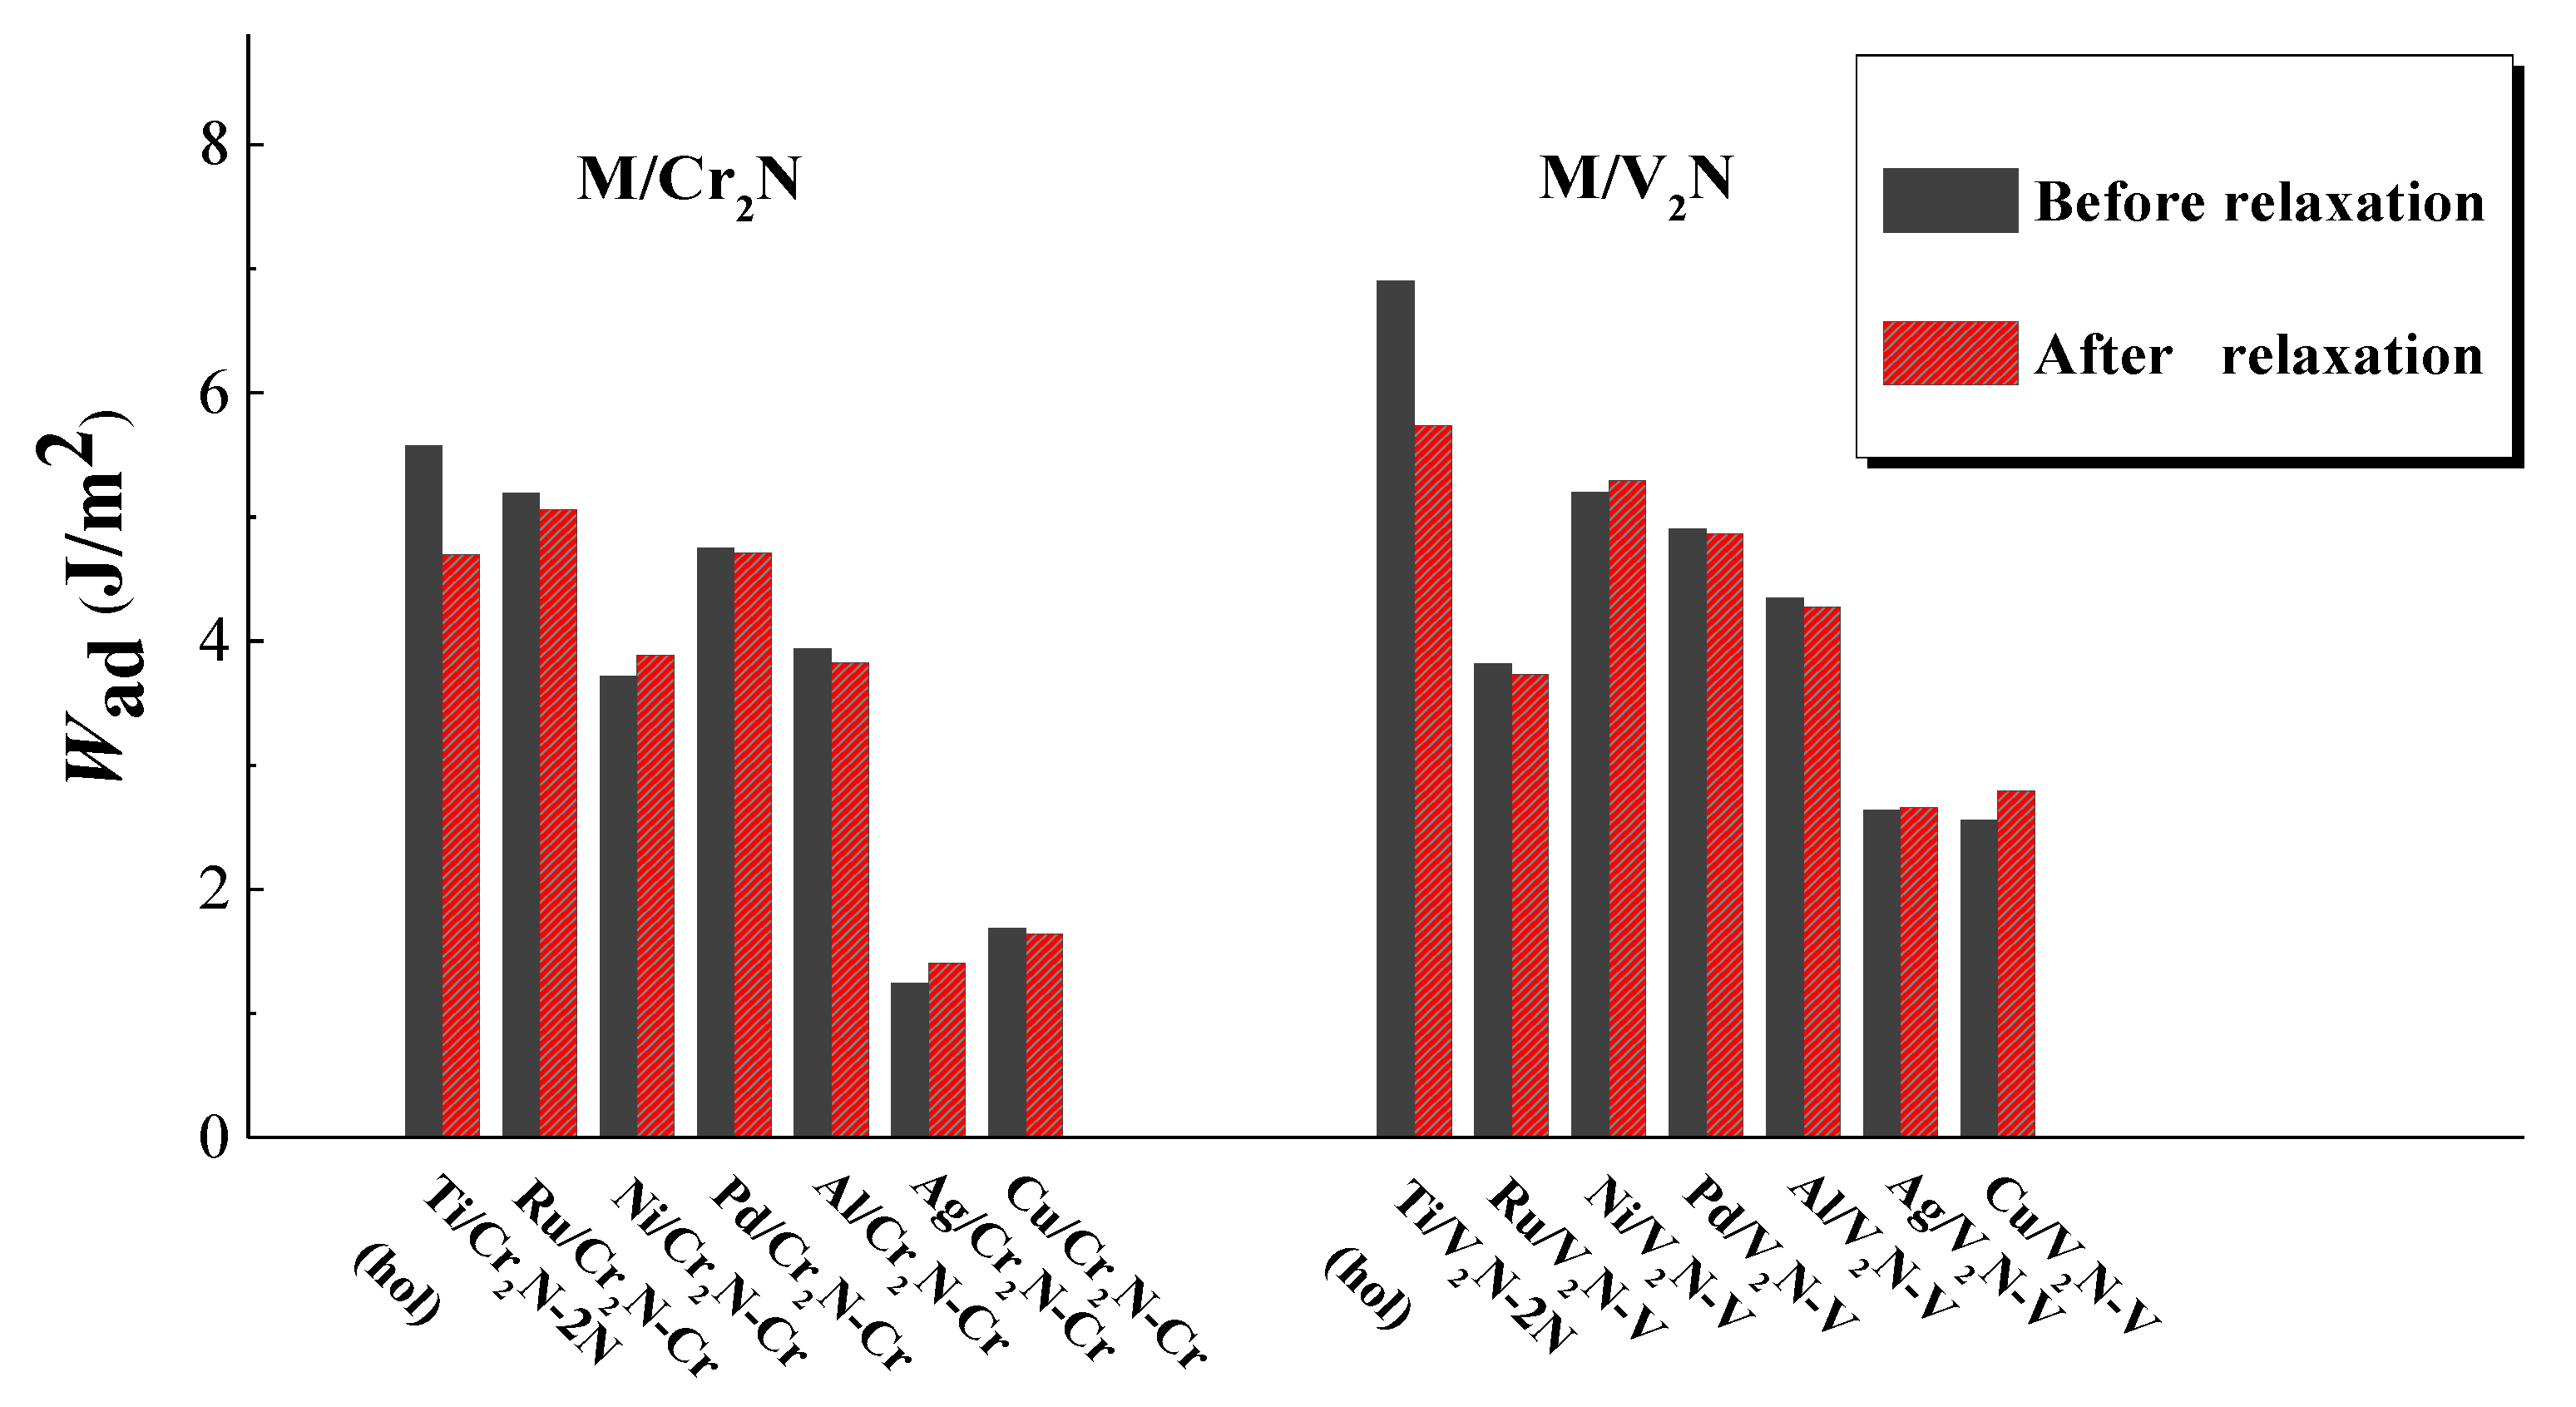
3.1. Work of Adhesion

The work of adhesion Wad is defined as the reversible work to separate a unit area interface of two condensed phases α and β. The value of Wad can be calculated as follows [53]:
W ad = ( E slab , α + E slab , β E α / β ) / A
where Eslab,α and Eslab,β are the total energies of the fully relaxed surface slabs, Eα/β is the total energy of the α/β interface model, and A is the interface area. The k-point meshes employed for the calculations of the interface models are 8 × 8 × 1. Larger values of Wad imply larger bonding strength in the interface model [54,55].
The values of Wad can be obtained by two different methods. The first method is the universal binding energy relation (UBER) method [22]. Figure 5 displays the values of Wad obtained by the UBER method versus the interfacial distance d0. The peak of the curve represents the optimal values of d0 and Wad. Therefore, we can have a preliminary evaluation on the optimal configuration among the M/Cr2N and M/V2N interface models for every metal considered. The results show that: (i) the Ti/Cr2N-2N(hol) interface model has the largest value of Wad among the Ti/Cr2N interface models; (ii) the M /Cr2N-Cr ( M = Ru, Ni, Pd, Al, Ag, and Cu) interface model has the largest value of Wad among the M /Cr2N interface models. In addition, the M/V2N interface models have similar results to those of the M/Cr2N interface models for every metal considered. Accordingly, the optimal M/Cr2N and M/V2N interface models for every metal are determined, respectively. The second method adopts the optimal structures obtained from the UBER method, and relaxes the interface models fully. Three atomic layers at the top of the M slabs and four atomic layers at the bottom of the Cr2N(0001) and V2N(0001) slabs were fixed in their bulk positions. Then, the d0 and Wad values of the optimal M/Cr2N and M/V2N interface models for every metal after relaxation are obtained. Figure 6 displays both the values of Wad for the optimal interface models before and after relaxation. The values of Wad change a little during the relaxation processes, indicating that the interface models we constructed are stable. In addition, the value of Wad after relaxation for the optimal M/Cr2N interface model follows the order: Ru/Cr2N-Cr > Pd/Cr2N-Cr > Ti/Cr2N-2N(hol) > Ni/Cr2N-Cr > Al/Cr2N-Cr > Cu/Cr2N-Cr > Ag/Cr2N-Cr. Meanwhile, the value of Wad after relaxation for the optimal M/V2N interface model follows the order: Ti/V2N-2N(hol) > Ni/V2N-V > Pd/V2N-V > Al/V2N-V > Ru/V2N-V > Cu/V2N-V > Ag/V2N-V. The Ti/V2N-2N(hol), Ni/V2N-V, and Ru/Cr2N-Cr interface models exhibit the largest, second largest, and third largest value of Wad, 5.73, 5.30, and 5.05 J/m2, among all the optimal interface models considered, respectively.
In addition, we performed test calculations for the verification on the reliability of the selected crystallographic interfaces in present work. We built other low-index crystallographic interface models as much as possible, and evaluated their interfacial bonding strengths by the values of Wad using UBER method. The calculation results are presented in the Supplementary Materials. It follows that other crystallographic interfaces have lower or negative values of Wad than the crystallographic interfaces we chose for this work. Therefore, we can confirm that the present crystallographic interfaces are preferred because of the enhanced interfacial bonding strength. This result makes sense for the coating applications motivating these composites. As we know, crystalline orientation is an important characteristic of coating growth. Interface orientation, which is constructed by crystalline orientation of each layer, have an important role in the interfacial mechanisms [15,26]. Therefore, the control of interface orientation may serve as a promising way to affect overall properties of the composites. For example, Wang et al. [26] theoretically demonstrated that the Ni(111)/CrN(111) interface orientation provides the greatest adhesion strength among the Ni/CrN interfaces, so the development of Ni(111)/CrN(111) interfaces is preferred in actual Ni/CrN coating applications. Toshihiko et al. [56] reported that the improvement of mechanical properties of Ti/TiN Multilayer coatings with increasing layer number could be explained by the evolution of preferred orientation from (111) to (100). With respect to the concerned M/Cr2N and M/V2N systems, the enhanced cohesion of their coating composites greatly associates with tailoring of special crystalline orientation of each component. Therefore, it can be inferred that the relations between deposition process and interface orientation are a great issue for the preparation of these coating composites.

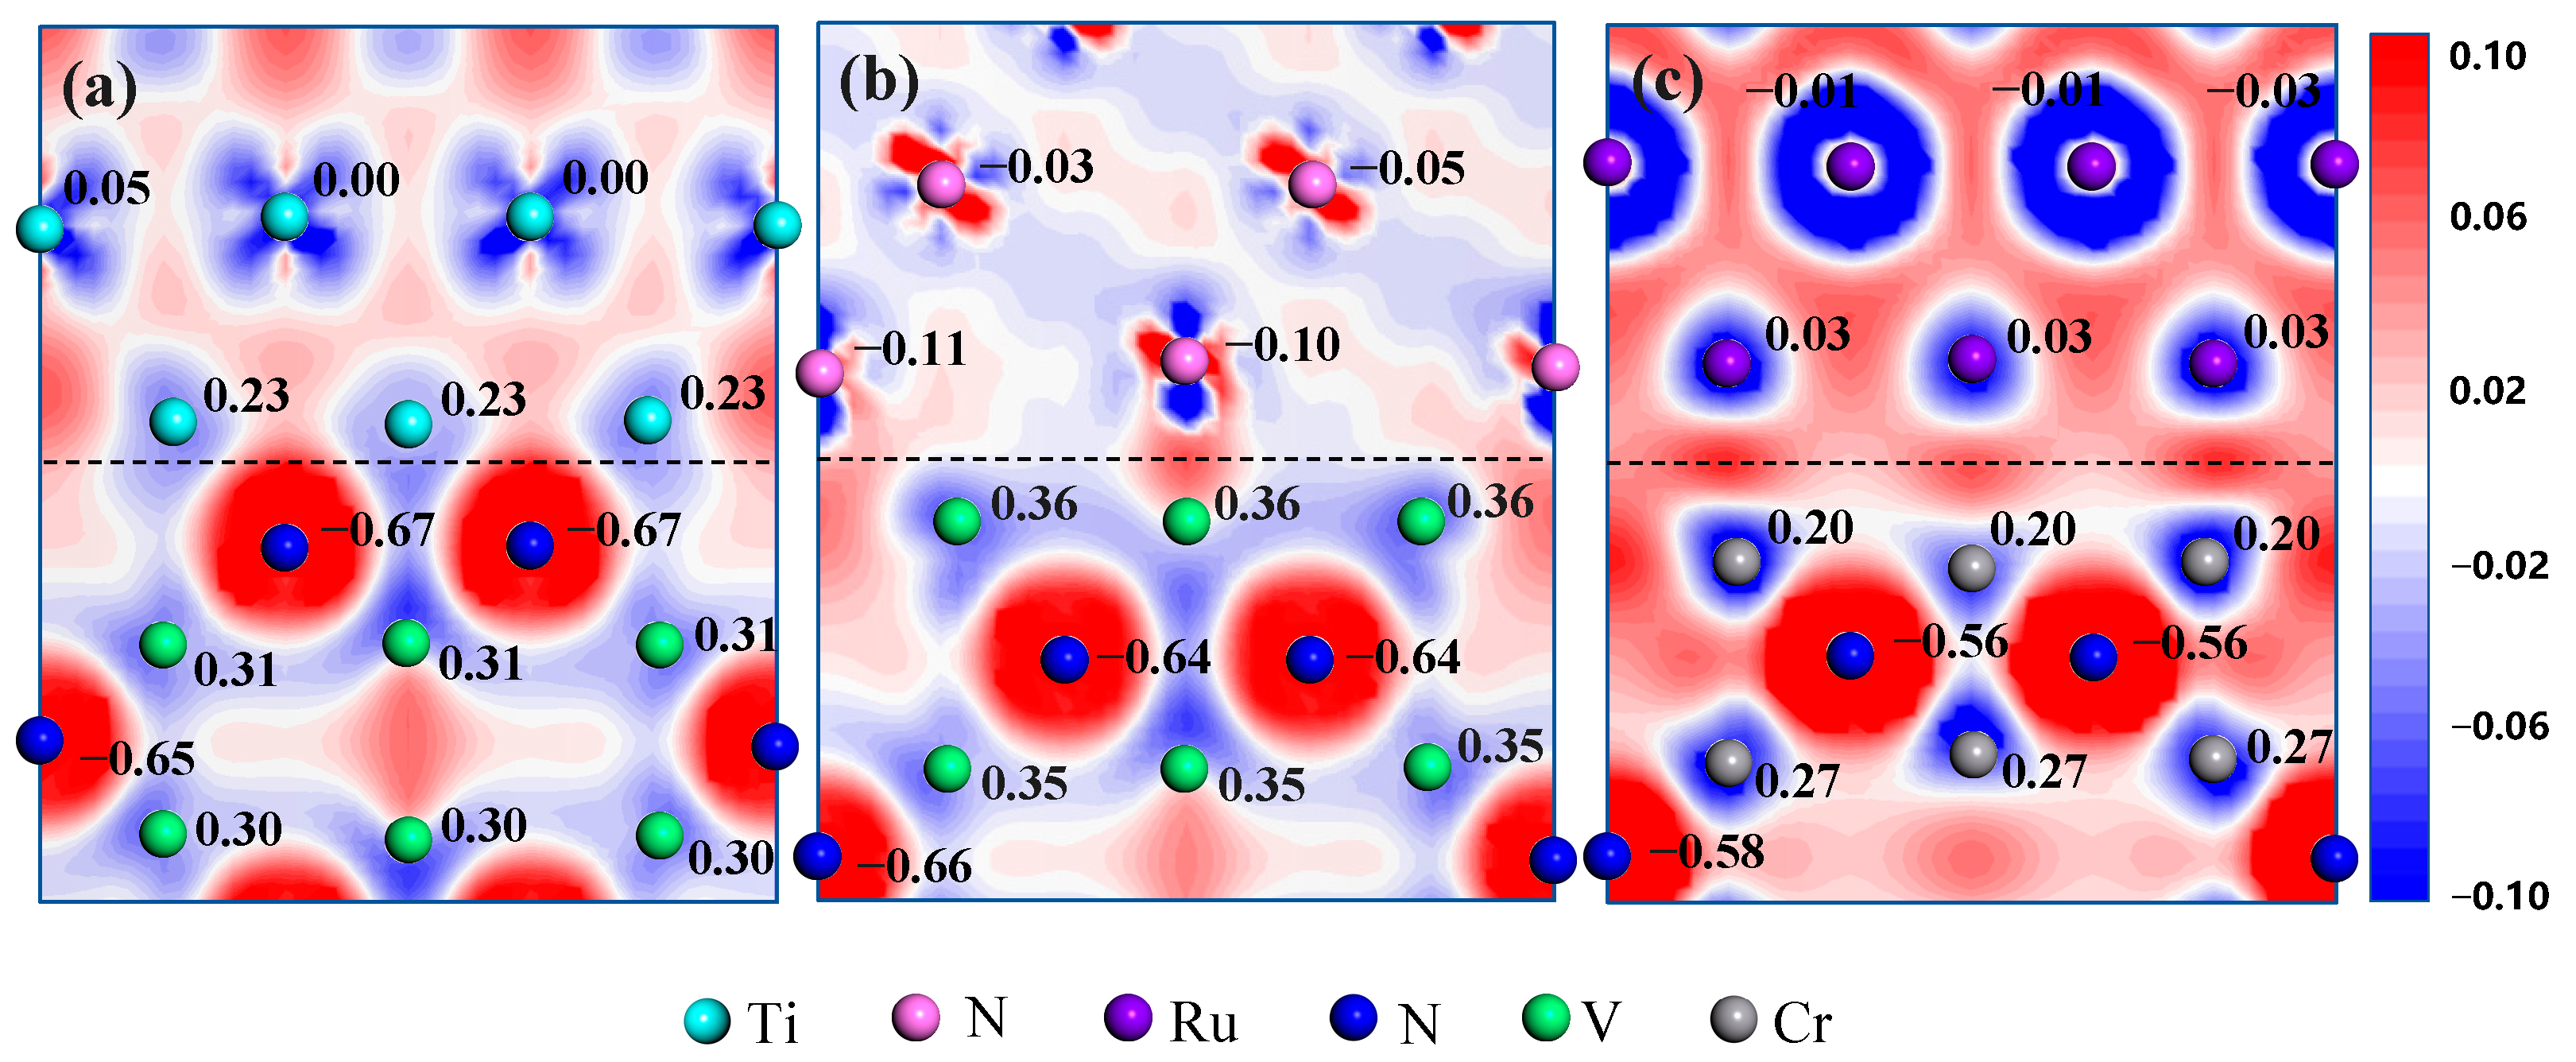
3.2. Electronic Structure

The information about electronic orbitals can be helpful for evaluating the nature of bonding interactions at the interfaces. Figure 7 and Figure 8 illustrate the PDOS and charge density difference plots of the Ti/V2N-2N(hol), Ni/V2N-V, and Ru/Cr2N-Cr interface models after relaxation, respectively. The Mulliken charge is labeled beside the atoms in Figure 8.
Figure 7a shows that the 3d orbital of the interfacial Ti atom interacts and hybridizes with the 2p orbital of the interfacial N atom at the energy of −5.0 and −6.5 eV in the Ti/V2N-2N(hol) interface model. Similarly, Figure 7b shows the Ni/V2N-V interface model exhibits the interaction and hybridization behaviors between interfacial Ni-3d and V-3d orbitals at the energy of −1.6, −2.3, and −3.3 eV, respectively. It can also be seen from Figure 7c that interfacial Ru-3d orbital interacts and hybridizes with the interfacial Cr-3d orbital for the Ru/Cr2N-Cr interface model at the energy of −1.2, −2.1, and −3.1 eV, respectively. These orbital hybridization behaviors imply the formation of covalent bonding between the atoms [38,57]. Therefore, the Ti/V2N-2N(hol), Ni/V2N-V, and Ru/Cr2N-Cr interface models all have interfacial covalent natures.
Figure 8 shows that the interfacial total charge transfer for the Ti/V2N-2N(hol), Ni/V2N-V, and Ru/Cr2N-Cr interface models are approximately 0.90, 0.46, and 0.17 e, which are mainly contributed from Ti-N, Ni-V, and Ru-Cr atom pairs, respectively. The larger charge transfer means larger electronic interactions at the interfaces. Accordingly, the interfacial strength of these interface models follows the order: Ti/V2N-2N(hol) > Ni/V2N-V > Ru/Cr2N-Cr. This tendency is consistent with the observed trends in the Wad results, where the Ti/V2N-2N(hol) interface model has the largest value of Wad among the three interface models.

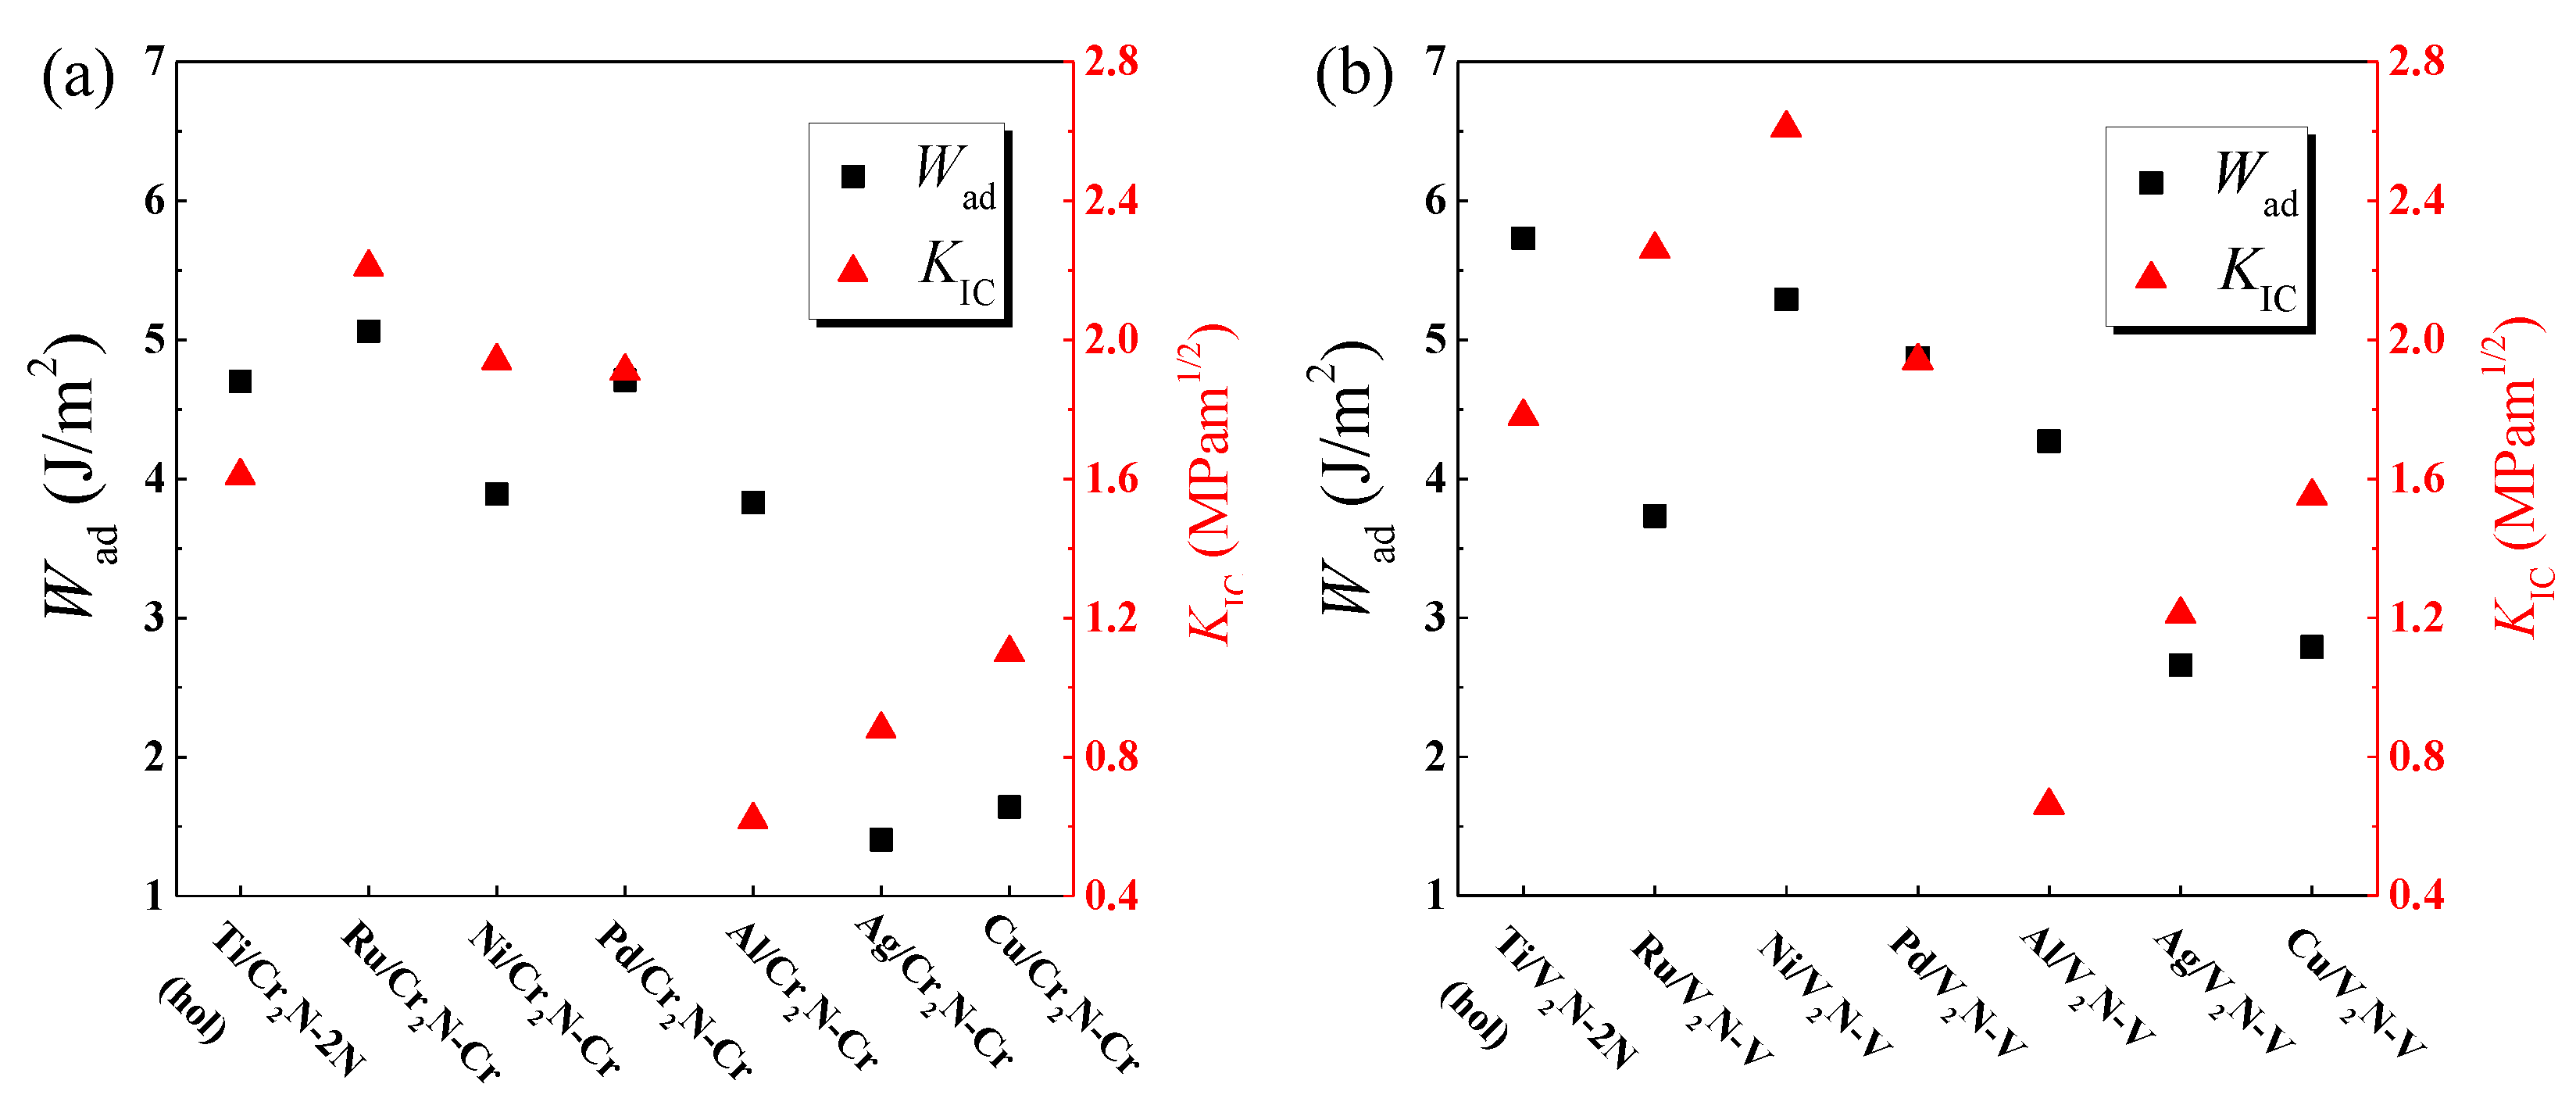
3.3. Interfacial Fracture Toughness

The fracture toughness KIC of an interface represents its strength to resist the development of a fracture along the interface. According to Griffith crack theory, the value of KIC along a specific direction [hkl] can be calculated as follows [58]:
K IC = 4 W ad E hkl
where Ehkl is the Young’s modulus of bulk materials in the direction of unit vector [hkl]. For the hexagonal crystal, Ehkl can be calculated as follows [59]:
1 E hkl = S 11 ( h 2 + k 2 ) 2 + S 33 l 4 + ( 2 S 13 + S 44 ) ( k 2 l 2 + h 2 l 2 )
Accordingly, the E0001 of hexagonal phases can be calculated as follows:
E 0001 = 1 S 33
Meanwhile, for the cubic crystal, Ehkl can be calculated as follows [60]:
1 E hkl = S 11 2 ( S 11 S 12 S 44 2 ) ( h 2 k 2 + k 2 l 2 + l 2 h 2 )
Thus, the E111 of fcc metals can be calculated as follows:
E 111 = 1 S 11 2 3 ( S 11 S 12 1 2 S 44 )
where Sij are elastic compliance constants.
The values of elastic compliances Sij and Young’s moduli E0001 obtained for hcp-TMNs (Cr2N, V2N) and hcp-metals (Ti, Ru), and elastic compliances Sij and Young’s moduli E111 obtained for fcc-metals (Ni, Pd, Al, Ag, and Cu), are listed in Table 5. We note that Ru exhibits the larger value of E0001 (592.10 GPa) in the hcp-metal group, and Ni exhibits the largest value of E111 (321.70 GPa) in the fcc-metal group.
The values of KIC obtained for the optimal M/Cr2N and M/V2N interface models for every metal after relaxation are illustrated in Figure 9. Here, the values of KIC are given as a range, because they include two fracture toughness values indicative of fracture along the metal surface (KIC-metal) and along the ceramic surface (KIC-ceramic). The results show that: (i) both the Ru/Cr2N-Cr and Ru/V2N-V interface models have larger values of KIC-metal than the values of KIC-ceramic, which is determined by the considerably large value of E0001 obtained for Ru; (ii) the Ni/Cr2N-Cr interface model has a larger value of KIC-metal than the value of KIC-ceramic, which is because the value of E111 obtained for Ni is larger than the value of E0001 obtained for V2N; (iii) except Ru/Cr2N-Cr, Ni/Cr2N-Cr, and Ru/V2N-V, the other interface models have the larger value of KIC-ceramic than the value of KIC-metal. We rank the interfacial fracture toughness KIC of the interface models in term of the lower value between KIC-metal and KIC-ceramic. Accordingly, the KIC of M/Cr2N interface models follows the order: Ru/Cr2N-Cr > Ni/Cr2N-Cr > Pd/Cr2N-Cr > Ti/Cr2N-2N > Cu/Cr2N-Cr > Ag/Cr2N-Cr > Al/Cr2N-Cr. Similarly, the KIC of M/V2N interface models follows the order: Ni/V2N-V > Ru/V2N-V > Pd/V2N-V > Ti/V2N-2N > Cu/V2N-V > Ag/V2N-V > Al/V2N-V. In addition, the Ni/V2N-V, Ru/V2N-V, and Ru/Cr2N-Cr interface models exhibit the largest, second largest, and third largest value of KIC, 2.61, 2.26, and 2.21 MPa · m1/2, among all the interface models considered, respectively.
Figure 10a,b show a combination of the Wad and KIC of the M/Cr2N and M/V2N interface models, respectively. Here, the KIC is the lower value between KIC-metal and KIC-ceramic. We note from Figure 10a that the Ru/Cr2N-Cr interface model has the largest values of Wad and KIC among the seven M/Cr2N interface models. In addition, from Figure 10b, we can see that the Ni/V2N-V interface model not only has a considerably large value of Wad, but also possesses the largest value of KIC among the seven M/V2N interface models. As to the Ti/V2N-2N(hol) interface model, despite having the largest value of Wad, it is not the perfect model, because of its relatively low value of KIC. Therefore, we can confirm that the Ru/Cr2N-Cr interface model has the best interfacial mechanical properties in the M/Cr2N group, and the Ni/V2N-V interface models has the best interfacial mechanical properties in the M/V2N group. Furthermore, the Ni/V2N-V interface model can be regarded as the best interface configuration among all the interface models considered because of its having the largest value of KIC and a larger value of Wad than the Ru/Cr2N-Cr interface model.
Previous studies [13,14] have experimentally demonstrated the excellent mechanical and tribological properties of Ag/Cr2N and Cu/Cr2N coating composite systems. However, from the perspective of first-principles study, the Ag/Cr2N-Cr and Cu/Cr2N-Cr interfaces have the minimum interfacial mechanical properties among all the models, as shown in Figure 10a. This indicates relatively weak load capacities at the interfaces, which may limit the overall mechanical properties of the composites. This result is satisfactory. It is doubtless that thermal effect will play an important role in the interfacial bonding strength of Ag/Cr2N and Cu/Cr2N composites. Further discussions of the thermal effect on the composites are beyond the scope of the present work.

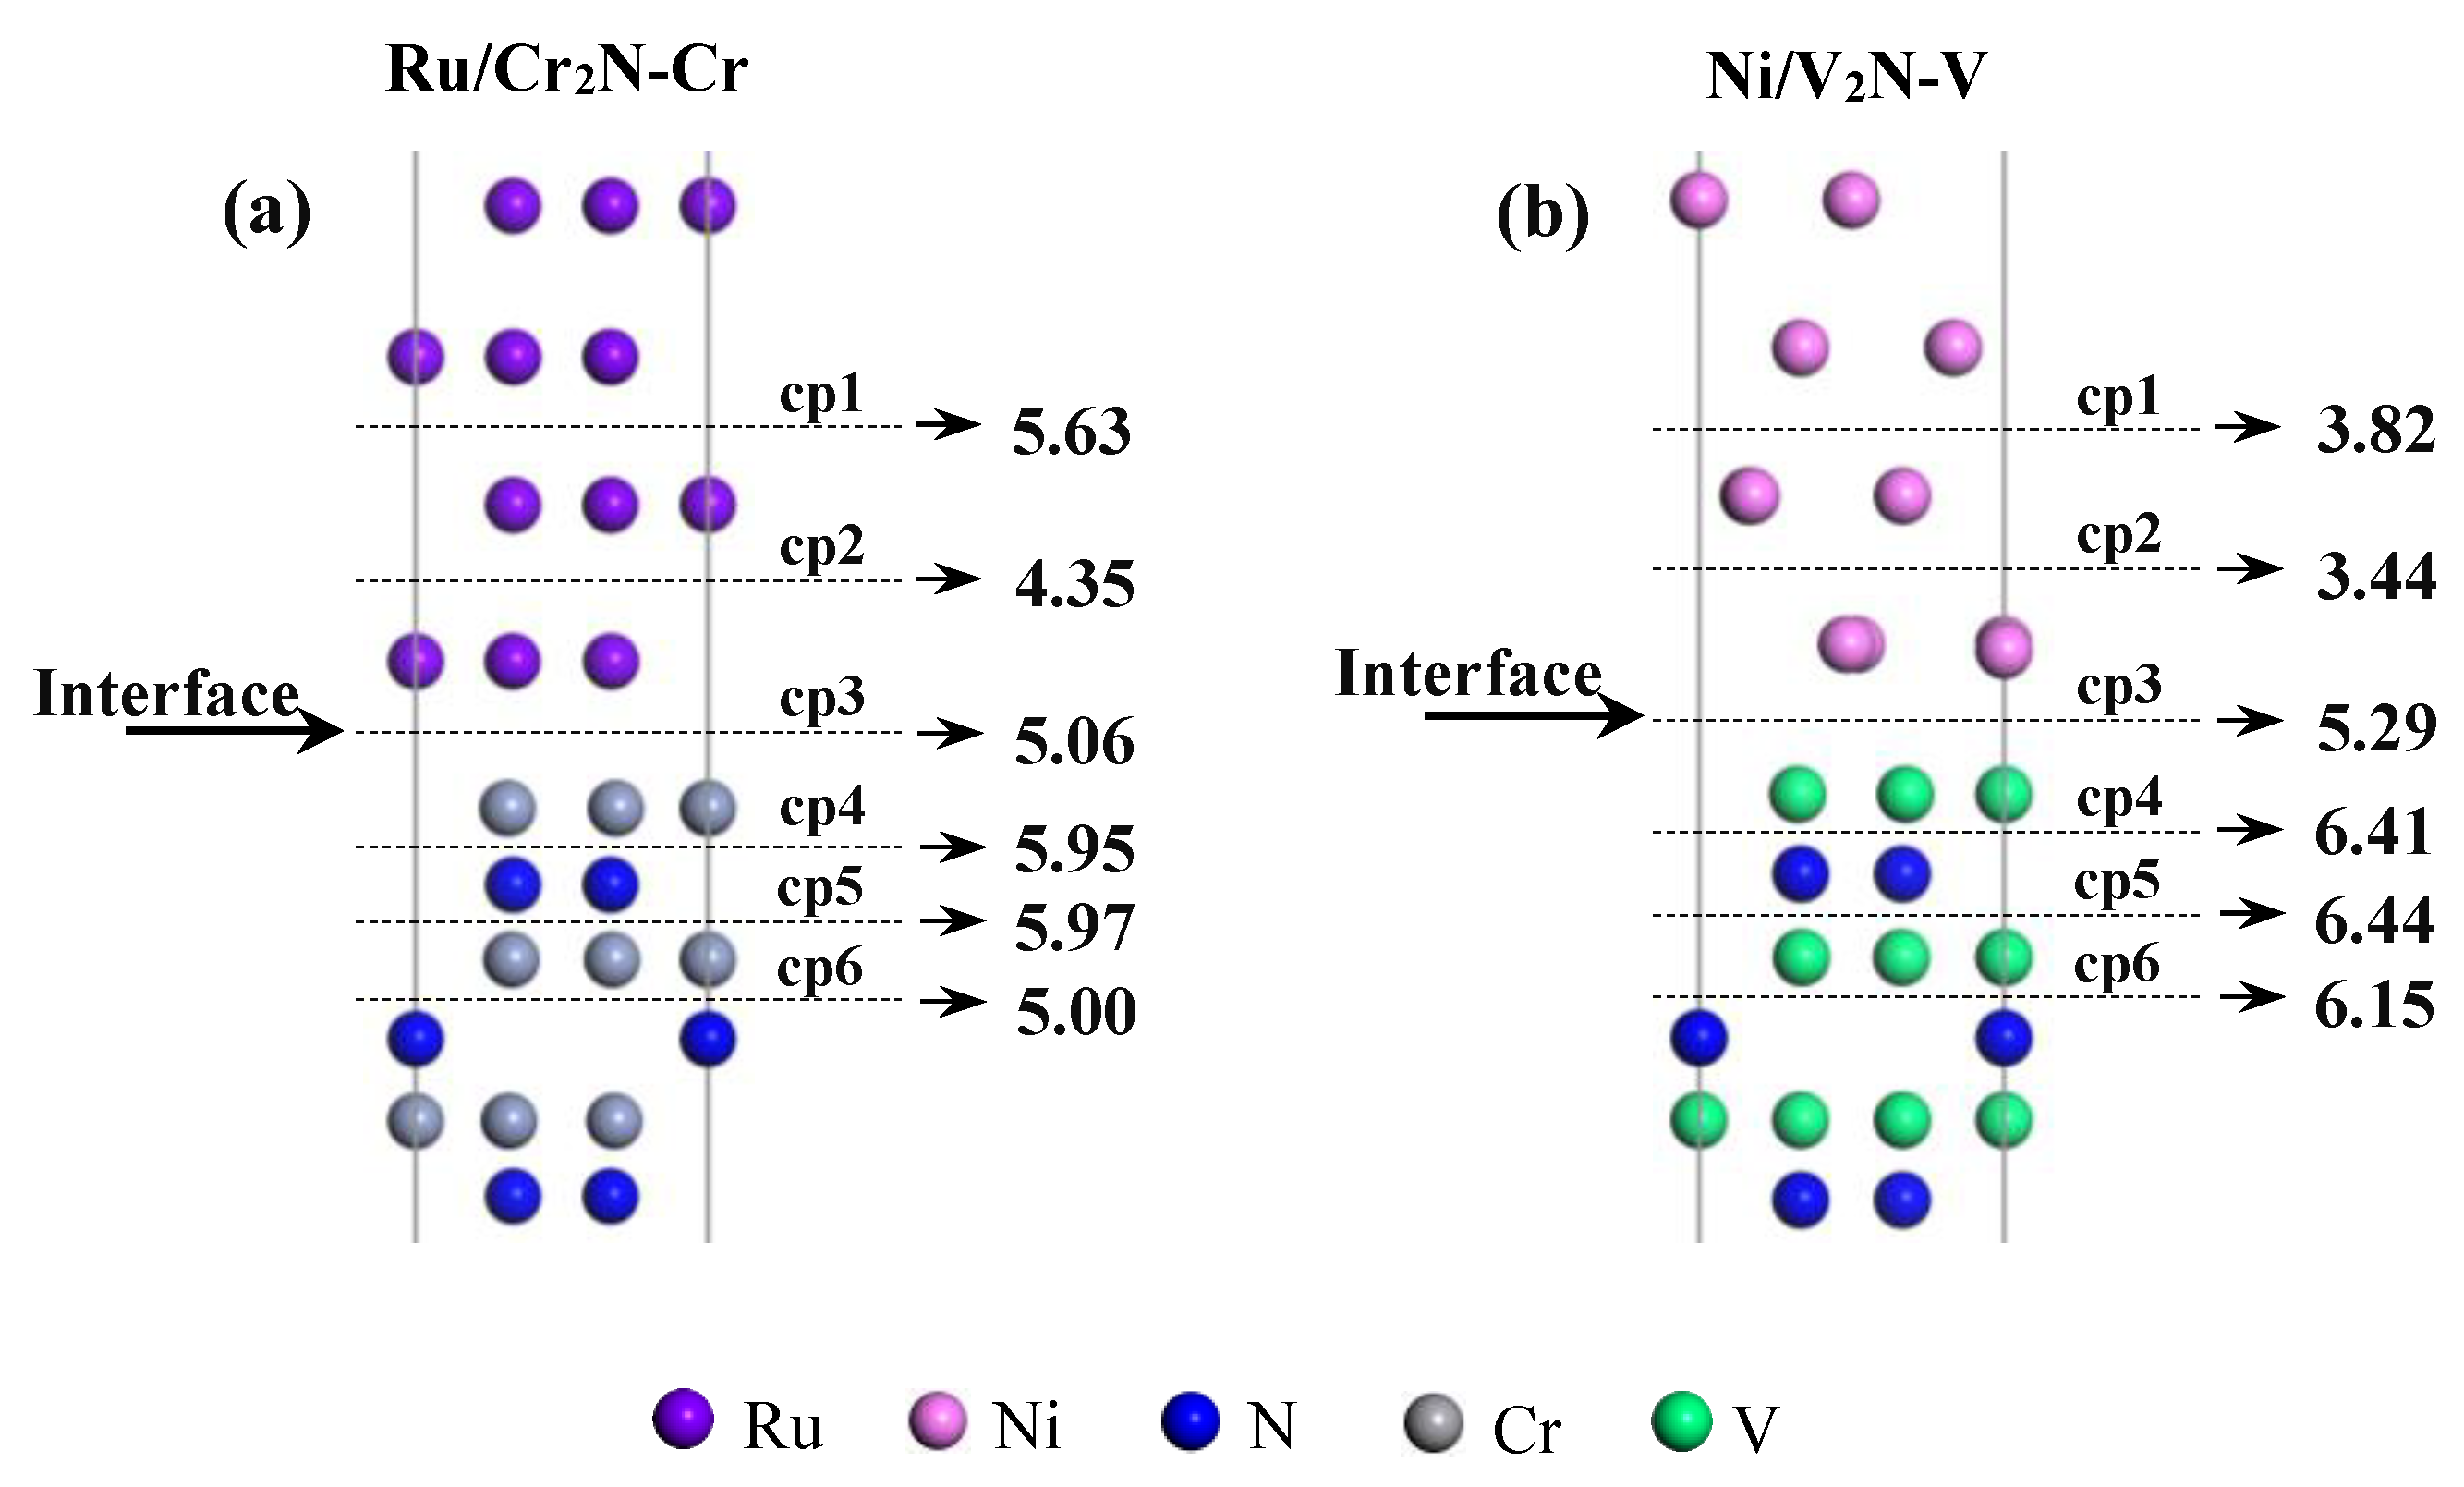
3.4. Interfacial Weak Point

To achieve further understanding of the mechanical strength of the Ru/Cr2N-Cr and Ni/V2N-V interfaces, the interfacial weak point is investigated for the two interface models [53]. We assume that both interface models are to be cleaved along six different planes. Cleavage energies are related to the number of bonds broken; therefore, all the cleavage planes are selected by considering the minimum bonds to be cut along these planes. For the Ru/Cr2N-Cr interface model, the cleavage planes are between the 1st and 1st layers of Ru(0001) and Cr2N (0001), the 1st and 2nd and 2nd and 3rd layers of Ru(0001), and the 1st and 2nd, 2nd and 3rd, and 3rd and 4th layers of Cr2N (0001). For the Ni/V2N-V interface model, the cleavage planes are between the 1st and 1st layers of Ni(111) and V2N (0001), the 1st and 2nd and 2nd and 3rd layers of Ni(111), and the 1st and 2nd, 2nd and 3rd, and 3rd and 4th layers of V2N (0001). For simplicity, these cleavage planes are denoted as cp1~cp6, respectively (as shown in Figure 11).
To estimate the reversible work needed to separate the interfaces, the Wad are calculated along different cleavage planes, and the results are labeled in Figure 11. For the Ru/Cr2N-Cr interface model, the minimum Wad (4.35 J/m2) is generated by cleaving along the cp2 plane (between the 1st and 2nd layers of Ru(0001)); for the Ni/V2N-V interface model, the minimum Wad (3.44 J/m2) is generated by cleaving along cp2 plane (between the 1st and 2nd layers of Ni(111)). The results demonstrate that the weak point always lies on the metal side for both the Ru/Cr2N-Cr and Ni/V2N-V interface models. However, the Ni/V2N-V interface model, despite its better interfacial mechanical properties, is more likely to separate because of the cracking of the Ni side under external stress.

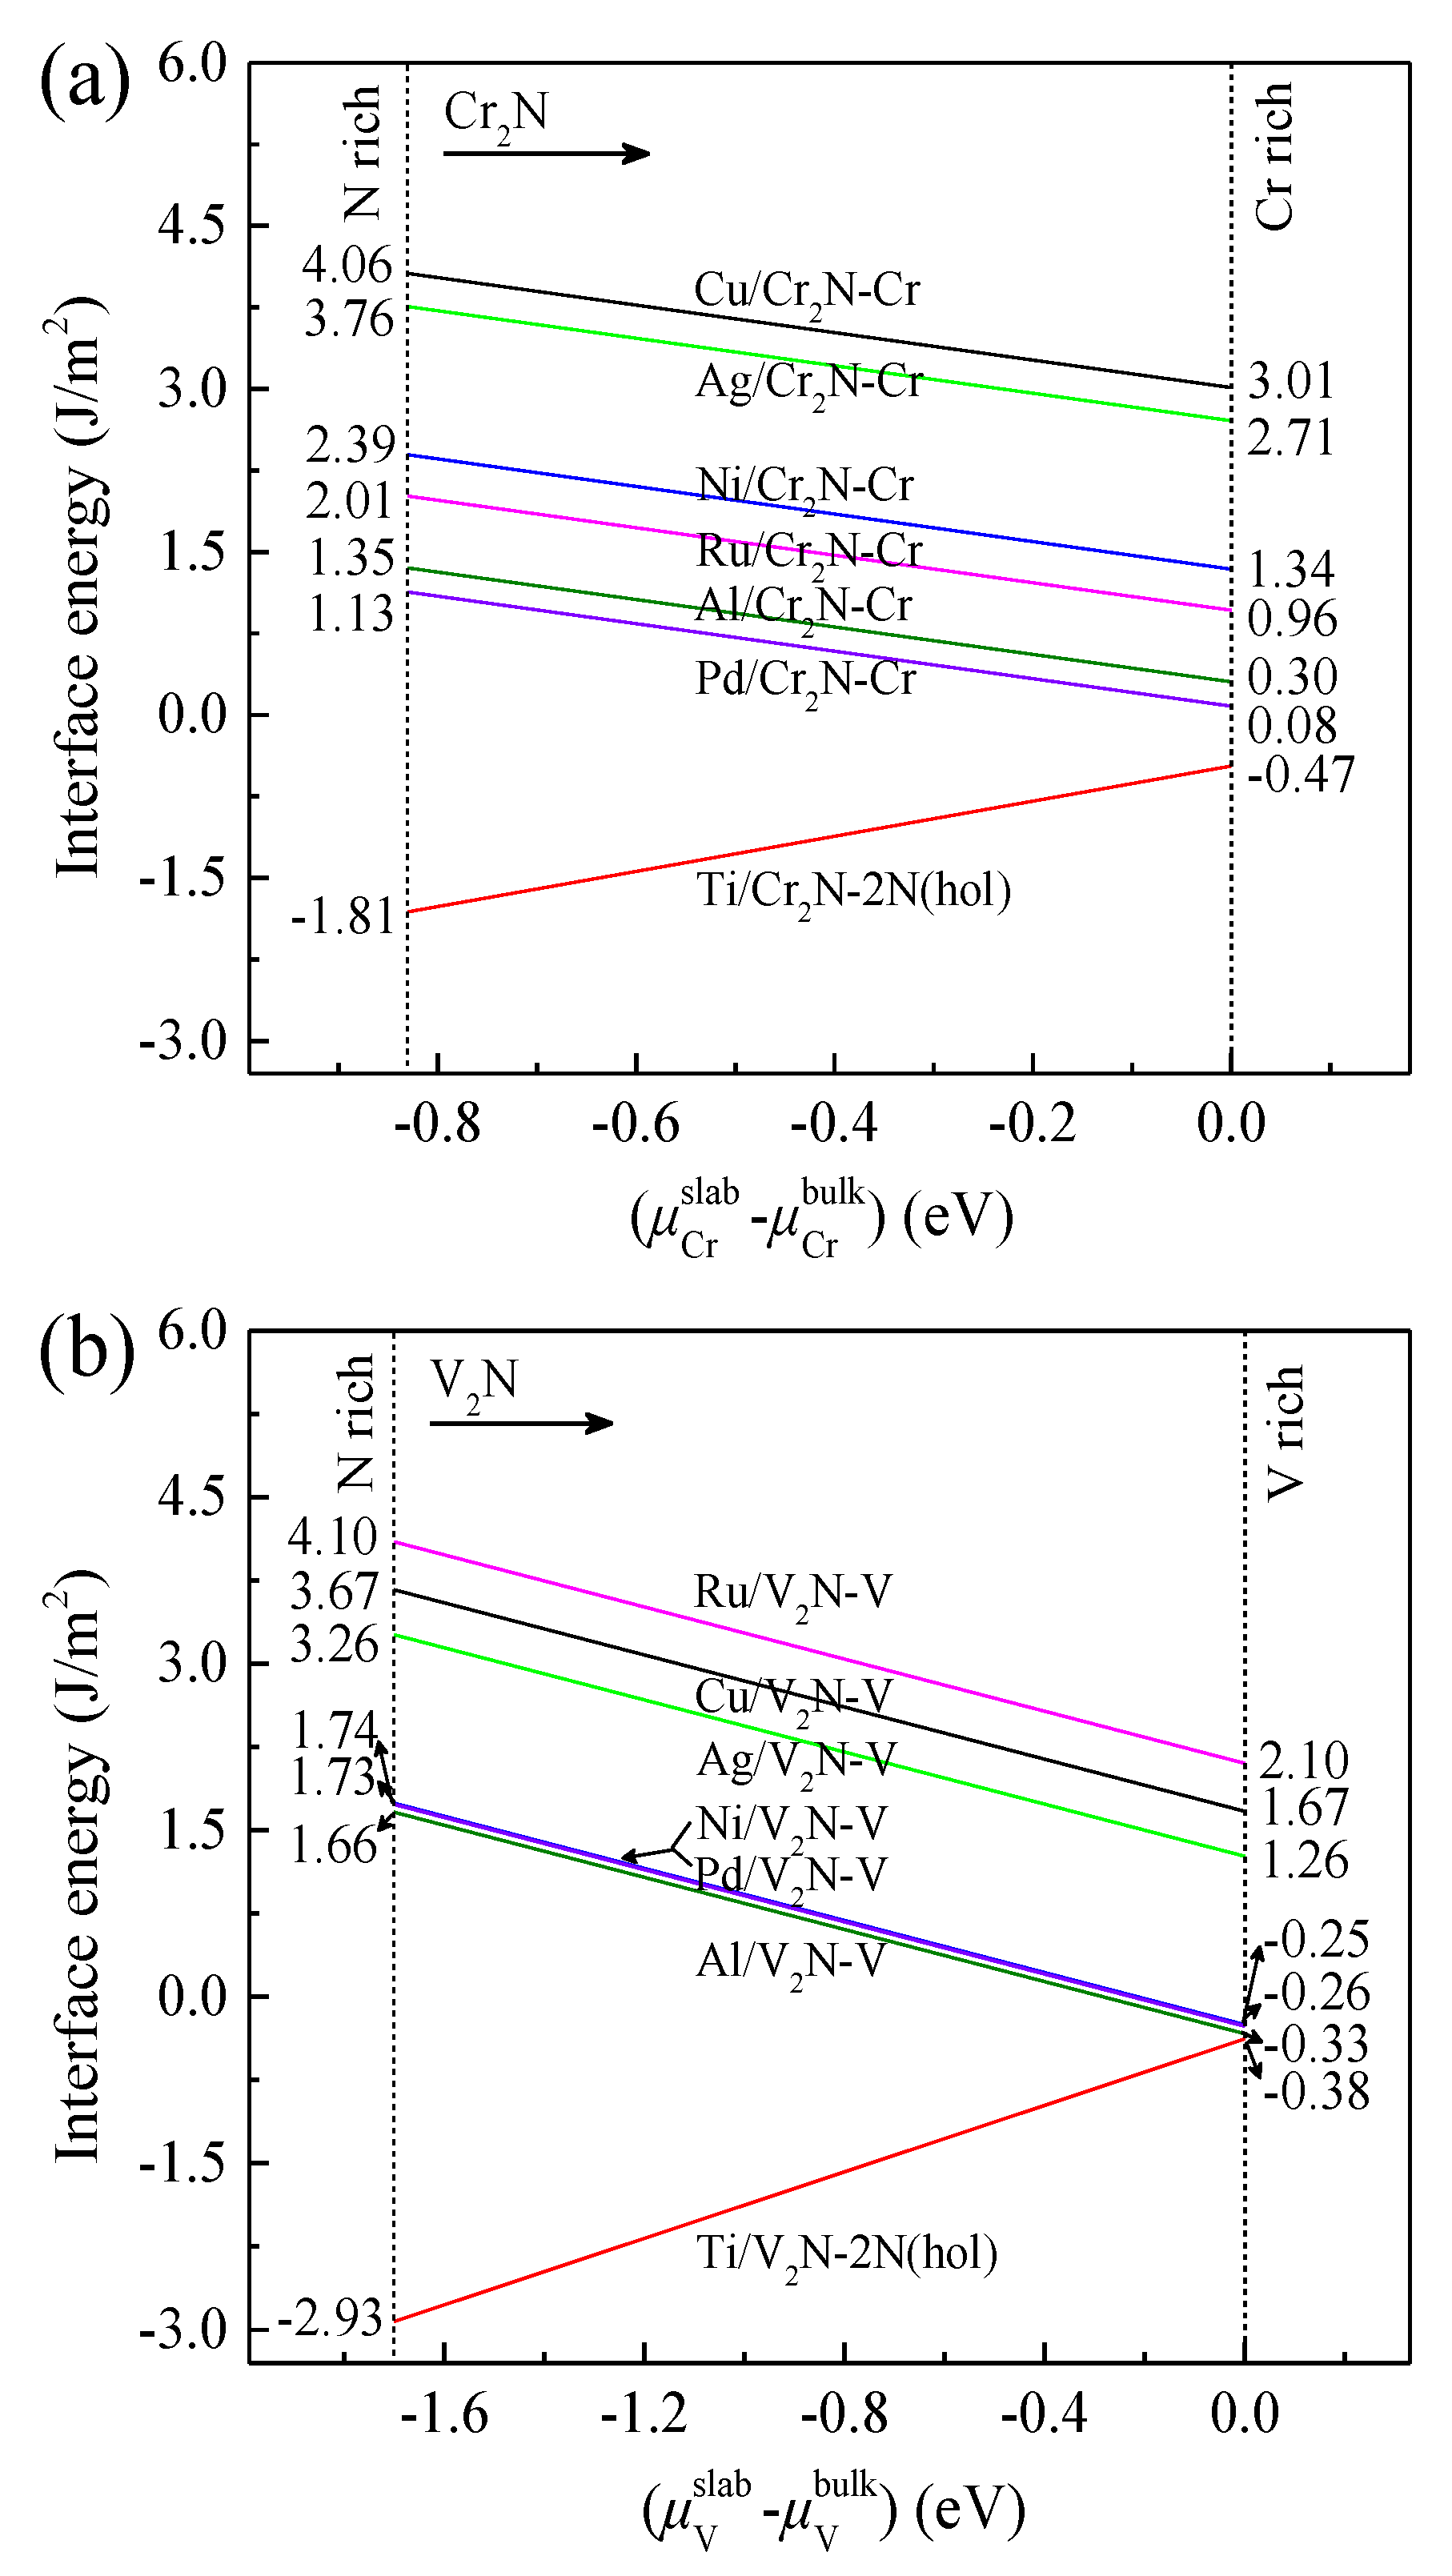
3.5. Interfacial Energy

Another quantity usually associated with interface stability is the interfacial energy γint. In general, the thermodynamic stability of the interface increases with decreasing γint. When both materials are similar, a tiny value of γint (γint ≈ 0 J/m2) is acceptable. When both materials are completely different, a positive value of γint should be obtained, and the magnitude is determined by the interfacial strain caused by the lattice misfit. In particular, the interface with a negative value of γint is thermodynamically unstable. It will provide the driving force to push interfacial atoms to diffuse across the interface, resulting in interfacial alloying behavior, or even forming a new interfacial phase [38]. Negative interfacial energies have been reported for some interface systems, in which interfacial alloying occurred through the inter-diffusion of metal atoms [61,62,63].
Figure 12a shows the values of γint for the M/Cr2N group as a function of the chromium chemical potential ( μ Cr slab μ Cr bulk ). Here, the values of γint are calculated as follows [25,64,65,66]:
γ int = γ M slab + γ Cr 2 N slab W ad
where γ M slab and γ Cr 2 N slab are the surface energies of the M and Cr2N slabs, which are calculated according to Equations (2) and (3), respectively. Similarly, the values of γint for the M/V2N group are calculated, and the results are presented in Figure 12b. Accordingly, the thermodynamic stability of the M/Cr2N interface models follows the order: Pd/Cr2N-Cr > Al/Cr2N-Cr > Ru/Cr2N-Cr > Ni/Cr2N-Cr > Ag/Cr2N-Cr > Cu/Cr2N-Cr, and the thermodynamic stability of the M/V2N interface models follows the order: Al/V2N-V > Pd/V2N-V > Ni/V2N-V > Ag/V2N-V > Cu/V2N-V > Ru/V2N-V, respectively.
The Pd/Cr2N-Cr interface model exhibits the lowest value of γint, from 0.08 to 1.13 J/m2, in the M/Cr2N models. The Al/V2N-Cr interface model exhibits the lowest value of γint, from −0.38 to 1.66 J/m2, in the M/Cr2N models. Thus, the Pd/Cr2N-Cr and Al/V2N-Cr interface models have the most stable configurations among the models considered. However, the mechanical properties of Pd/Cr2N and Al/V2N composites are not so good. As shown in Section 3.1 and Section 3.3, they are limited by the relatively low interfacial work of adhesion and fracture toughness. The Ti/Cr2N-2N(hol) and Ti/V2N-2N(hol) interfaces have negative values of γint throughout the whole range. Thus, they are thermodynamically unstable. The interfacial Ti-N distances of Ti/Cr2N-2N(hol) and Ti/V2N-2N(hol) after relaxation are 2.045 and 2.060 Å, respectively. These values are very close to the length of Ti-N bond (2.090 Å) [67]. Thus, it can be inferred that the Ti/Cr2N-2N(hol) and Ti/V2N-2N(hol) interfaces strongly tend to form Ti-N interfacial phases. In fact, the interfacial productions of Ti nitrides have been frequently observed in previous composites systems [68,69,70,71,72]. These results are reasonable because Ti is the only strong nitride-forming element in the metals we considered. The Ni/V2N-V interface model exhibits a low value of γint (1.74 J/m2) at the N-rich side. As the V chemical potential increases, the value of γint decreases to −0.25 J/m2, which is very close to zero. Thus, it follows that the Ni/V2N-V interface model has good thermodynamic stability. Moreover, based on the results in Section 3.3 and Section 3.5, an important conclusion that can be drawn is that the Ni/V2N-V interface model not only has the best interfacial mechanical properties, but also exhibits the superior stability compared to most of the other interface models.
In sum, the interfacial properties of the considered M/Cr2N and M/V2N interface models were compared and discussed in a theoretical way using the first-principles method. The results demonstrated that the Ni/V2N-V interface model is prominent among all the models considered. Therefore, Ni additives can be regarded a good choice for achieving enhanced mechanical properties in V2N phase. These results also serve as the motivation for a noteworthy attempt to explore the structure and properties of Ni/V2N composite materials in our future work.

4. Conclusions

The incorporation of ductile metal within hexagonal-TMNs, such as Cr2N and V2N, is a promising approach for the enhancement of mechanical properties. However, interfacial mechanisms at metal/hexagonal-TMN interfaces, which are the key features leading to enhanced mechanical properties of the composites, remain poorly understood. The first-principles method based on DFT could reveal interfacial mechanisms at the atomic and electronic levels, and evaluate interfacial properties quantitatively by figuring out the values of work of adhesion, fracture toughness, and interfacial energy. Thus, we conducted a systematic investigation on M/Cr2N and M/V2N (M = Ti, Ru, Ni, Pd, Al, Ag, and Cu) interfaces using the first-principles method in this work. (0001) of hexagonal phases and (111) of fcc phases were selected as the interface orientations. The M/Cr2N interface models were built by considering 1N, 2N, and Cr terminations of Cr2N(0001), and two stacking methods, including top and hollow sites. The M/V2N interface models were built in the same way. The main calculation results are given as follows:
(1)
The Ti/V2N-2N(hol), Ni/V2N-V, and Ru/Cr2N-Cr interface models exhibit the first, second, and third largest values of Wad, 5.73, 5.30, and 5.05 J/m2, among all the interface models considered, respectively.
(2)
The analyses of partial density of states (PDOS), charge density difference, and Mulliken charge are in good agreement with the observed trends in the Wad results.
(3)
The Ni/V2N-V, Ru/V2N-V, and Ru/Cr2N-Cr interface models exhibit the first, second, and third largest values of facture toughness, 2.61, 2.26, and 2.21 MPa · m1/2, among all the interface models considered, respectively.
(4)
The Ni/V2N-V interface model has a relatively low value range of γint from −0.25 to 1.74 J/m2, suggesting considerably high thermal stability compared to most of the other interface models.
According to above results, it can be concluded that the Ni/V2N-V interface model exhibits a good combination of work of adhesion, fracture toughness, and interfacial stability, and thus provides the preferred configuration among the metal/hexagonal-TMN interface models considered. Therefore, the Ni/V2N composite system is considered to be exploitable for metal/hexagonal-TMN materials with enhanced mechanical properties. This work reveals a fundamental understanding of developing advanced metal/hexagonal-TMN composites with respect to optimizing interfacial properties.

Supplementary Materials

The following supporting information can be downloaded at: https://www.mdpi.com/article/10.3390/coatings12010066/s1, Figure S1: Interface models of M/Cr2N interfaces, including (a)–(c) M1(10 1 ¯ 0 )/Cr2N(0001) (M1 = Ti and Ru), (d)–(f) M2(100)/Cr2N(0001), and (g)–(i) M2(110)/Cr2N(0001) (M2 = Ni, Pd, Al, Ag, and Cu). The orientation relationships of the interface models are (10 1 ¯ 0 )M1[ 1 ¯ 2 1 ¯ 1]M1//(0001)C2N[1 1 ¯ 00]C2N, (100)M2[011]M2//(0001)C2N[1 1 ¯ 00]C2N, and (110)M2[001]M2//(0001)C2N[1 1 ¯ 00]C2N, respectively. There are five atom layers in the top views of (a1)–(c1), (d1)–(f1) and (g1)–(i1). The smallest spheres denote interfacial atoms of metal phases, from the second smallest to largest spheres are atoms from the first to fourth layers of Cr2N(0001). Three interface models for each M/Cr2N are considered: (a1, d1, g1) 1N-terminated, (b1, e1, h1) 2N-terminated, and (c1, f1, i1) Cr-terminated, Table S1: Mismatch rates (δU and δV) of the M1(10 1 ¯ 0 )/Cr2N(0001) and M1(10 1 ¯ 0 )/V2N(0001) interface models (M1 = Ti and Ru), Table S2: Interfacial distance (d0) and work of adhesion (Wad) of the M1(10 1 ¯ 0 )/Cr2N(0001) and M1(10 1 ¯ 0 )/V2N(0001) interface models with different terminations (M1 = Ti and Ru), Table S3: Mismatch rates (δU and δV) of the M2(100)/Cr2N(0001), and M2(100)/V2N(0001) interface models (M2 = Ni, Pd, Al, Ag, and Cu), Table S4: Interfacial distance (d0) and work of adhesion (Wad) of the M2(100)/Cr2N(0001) and M2(100)/V2N(0001) interface models with different terminations (M2 = Ni, Pd, Al, Ag, and Cu), Table S5: Mismatch rates (δU and δV) of the M2(110)/Cr2N(0001) and M2(110)/V2N(0001) interface models (M2 = Ni, Pd, Al, Ag, and Cu), Table S6: Interfacial distance (d0) and work of adhesion (Wad) of the M2(110)/Cr2N(0001), and M2(110)/V2N(0001) interface models with different terminations (M2 = Ni, Pd, Al, Ag, and Cu).

Author Contributions

Conceptualization, G.L.; Data curation, M.W. and G.L.; Formal analysis, M.W. and G.L.; Investigation, M.W., G.L., Y.F. and J.W.; Methodology, M.W., G.L., M.H. and C.L.; Project administration, V.A.L.; Supervision, G.L.; Validation, M.W. and G.L.; Visualization, M.W. and G.L.; Writing–original draft, M.W. and G.L.; Writing–review & editing, M.W. and G.L. All authors have read and agreed to the published version of the manuscript.

Funding

This work was fully sponsored by National key Research and Development plan of China [Grant No. 2018YFB1107305], National natural Science Foundation of China [Grant No. 51902254], Project of National Joint Engineering Research Center for abrasion control and molding of metal materials of China [Grant No. HKDNM2019024], Zhejiang Provincial Natural Science Foundation of China [Grant No. LGG20E010004], [Grant No. LTZ20E020001], and Taizhou Science and Technology Project [Grant No. 1902gy16]. The computational work was supported by the National Supercomputing Centre in Shenzhen, China.

Institutional Review Board Statement

Not applicable.

Informed Consent Statement

Not applicable.

Data Availability Statement

The data created in this study are fully depicted in the article.

Conflicts of Interest

The authors declare no conflict of interest.

References

  1. Zhu, S.; Chen, L.; Wu, Y.; Hu, Y.; Liu, T.; Tang, K.; Wei, Q. Microstructure and corrosion resistance of Cr/Cr2N multilayer film deposited on the surface of depleted uranium. Corros. Sci. 2014, 82, 420–425. [Google Scholar] [CrossRef]
  2. Shuai, J.; Zuo, X.; Wang, Z.; Sun, L.; Chen, R.; Wang, L.; Wang, A.; Ke, P. Erosion behavior and failure mechanism of Ti/TiAlN multilayer coatings eroded by silica sand and glass beads. J. Mater. Sci. Technol. 2021, 80, 179–190. [Google Scholar] [CrossRef]
  3. Dang, C.; Li, J.; Wang, Y.; Chen, J. Structure, mechanical and tribological properties of self-toughening TiSiN/Ag multilayer coatings on Ti6Al4V prepared by arc ion plating. Appl. Surf. Sci. 2016, 386, 224–233. [Google Scholar] [CrossRef]
  4. Zhang, S.; Sun, D.; Fu, Y.; Du, H. Toughening of hard nanostructural thin films: A critical review. Surf. Coat. Technol. 2005, 198, 2–8. [Google Scholar] [CrossRef]
  5. Shuai, J.; Zuo, X.; Wang, Z.; Guo, P.; Xu, B.; Zhou, J.; Wang, A.; Ke, P. Comparative study on crack resistance of TiAlN monolithic and Ti/TiAlN multilayer coatings. Ceram. Int. 2019, 46, 6672–6681. [Google Scholar] [CrossRef]
  6. Ranade, A.N.; Krishna, L.R.; Li, Z.; Wang, J.; Korach, C.S.; Chung, Y.-W. Relationship between hardness and fracture toughness in Ti–TiB2 nanocomposite coatings. Surf. Coat. Technol. 2012, 213, 26–32. [Google Scholar] [CrossRef]
  7. Daniel, R.; Meindlhumer, M.; Zalesak, J.; Sartory, B.; Zeilinger, A.; Mitterer, C.; Keckes, J. Fracture toughness enhancement of brittle nanostructured materials by spatial heterogeneity: A micromechanical proof for CrN/Cr and TiN/SiOx multilayers. Mater. Des. 2016, 104, 227–234. [Google Scholar] [CrossRef]
  8. Wieciński, P.; Smolik, J.; Garbacz, H.; Kurzydlowski, K. Failure and deformation mechanisms during indentation in nanostructured Cr/CrN multilayer coatings. Surf. Coat. Technol. 2014, 240, 23–31. [Google Scholar] [CrossRef]
  9. Wei, G.; Scharf, T.; Zhou, J.; Huang, F.; Weaver, M.; Barnard, J. Nanotribology studies of Cr, Cr2N and CrN thin films using constant and ramped load nanoscratch techniques. Surf. Coat. Technol. 2001, 146–147, 357–362. [Google Scholar] [CrossRef]
  10. Lin, J.; Sproul, W.D.; Moore, J.J.; Lee, S.; Myers, S. High rate deposition of thick CrN and Cr2N coatings using modulated pulse power (MPP) magnetron sputtering. Surf. Coat. Technol. 2011, 205, 3226–3234. [Google Scholar] [CrossRef]
  11. Sanjinés, R.; Hones, P.; Lévy, F. Hexagonal nitride coatings: Electronic and mechanical properties of V2N, Cr2N and δ-MoN. Thin Solid Film. 1998, 332, 225–229. [Google Scholar] [CrossRef]
  12. Guan, X.; Wang, Y.; Xue, Q.; Wang, L. Toward high load bearing capacity and corrosion resistance Cr/Cr2N nano-multilayer coatings against seawater attack. Surf. Coat. Technol. 2015, 282, 78–85. [Google Scholar] [CrossRef]
  13. Li, C.-L.; Wu, F.-B.; Lee, J.-W.; Tsai, Y.-Z.; Chang, L.-C. Characteristics of Cr2N/Cu multilayered thin films with different bilayer thickness. Surf. Coat. Technol. 2009, 204, 941–946. [Google Scholar] [CrossRef]
  14. Bílek, P.; Jurči, P.; Hudáková, M.; Pašák, M.; Kusý, M.; Bohovičová, J. Cr2N-7Ag nanocomposite thin films deposited on Vanadis 6 tool steel. Appl. Surf. Sci. 2014, 307, 13–19. [Google Scholar] [CrossRef]
  15. Zhao, J.; Liu, L.C.; Gong, H.R.; Gong, X. Cohesion strength and fracture toughness of Mo-TiC interfaces. Surf. Coat. Technol. 2020, 382, 125158. [Google Scholar] [CrossRef]
  16. Zhong, W.; Wang, Z.; Gao, N.; Huang, L.-A.; Lin, Z.; Liu, Y.; Meng, F.; Deng, J.; Jin, S.; Zhang, Q.; et al. Coupled Vacancy Pairs in Ni-Doped CoSe for Improved Electrocatalytic Hydrogen Production Through Topochemical Deintercalation. Angew. Chem. Int. Ed. 2020, 59, 22743–22748. [Google Scholar] [CrossRef] [PubMed]
  17. Eglitis, R.; Rohlfing, M. First-principles calculations of the atomic and electronic structure of SrZrO3 and PbZrO3(001) and (011) surfaces. J. Phys. Condens. Matter 2010, 22, 415901. [Google Scholar] [CrossRef] [PubMed] [Green Version]
  18. Eglitis, R.; Popov, A.I. Systematic trends in (0 0 1) surface ab initio calculations of ABO3 perovskites. J. Saudi Chem. Soc. 2018, 22, 459–468. [Google Scholar] [CrossRef]
  19. Lin, Z.; Xiao, B.; Wang, Z.; Tao, W.; Shen, S.; Huang, L.; Zhang, J.; Meng, F.; Zhang, Q.; Gu, L.; et al. Planar-Coordination PdSe 2 Nanosheets as Highly Active Electrocatalyst for Hydrogen Evolution Reaction. Adv. Funct. Mater. 2021, 31, 2102321. [Google Scholar] [CrossRef]
  20. Zhuang, D.; Liu, Y.; Jin, N.; Li, J.; Cao, Z.; Zhang, J. First-principles calculations on FeWB bulk and FeWB(001)/α-Fe(111) interface. Mater. Res. Express 2021, 8, 046405. [Google Scholar] [CrossRef]
  21. Wang, Z.; Xiao, B.; Lin, Z.; Xu, Y.; Lin, Y.; Meng, F.; Zhang, Q.; Gu, L.; Fang, B.; Guo, S.; et al. PtSe2/Pt heterointerface with reduced coordination for boosted hydrogen evolution reaction. Angew. Chem. Int. Ed. 2021, 133, 23576–23581. [Google Scholar] [CrossRef]
  22. Li, J.; Cui, Y.; Zhang, M.; Zhao, J.; Luo, X. Thermodynamic evidence of α-Al heterogeneous nucleation on Al2MgC2 and the interfacial bonding mechanism: A first-principles study. J. Solid State Chem. 2020, 288, 121431. [Google Scholar] [CrossRef]
  23. He, C.; Cheng, M.; Zhang, M.; Zhang, W.X. Interfacial Stability and Electronic Properties of Ag/M (M = Ni, Cu, W, and Pd) and Cu/Cr Interfaces. J. Phys. Chem. C 2018, 122, 17928–17935. [Google Scholar] [CrossRef]
  24. Zhang, J.; Jin, N.; Lian, L.; Cao, Z.; Zhuang, D. The behaviors of He atoms and vacancies at TiO/V interface: A first-principles study. Appl. Surf. Sci. 2020, 543, 148780. [Google Scholar] [CrossRef]
  25. Shao, W.; Liu, J.; Shi, Z.; Rao, L.; Xing, X.; Zhou, Y.; Yang, Q. Theoretical calculation of adhesion performance and mechanical properties of CrN/α-Fe interface. J. Alloys Compd. 2019, 810, 151921. [Google Scholar] [CrossRef]
  26. Wang, M.; Liu, G.; Luo, X.; Levchenko, V.A. Effect of interface orientation on the adhesion strength and fracture toughness of Ni/CrN interfaces by first-principles study. Mater. Res. Express 2021, 8, 096507. [Google Scholar] [CrossRef]
  27. Yadav, S.; Ramprasad, R.; Wang, J.; Misra, A.; Liu, X.-Y. First-principles study of Cu/TiN and Al/TiN interfaces: Weak versus strong interfaces. Model. Simul. Mater. Sci. Eng. 2014, 22, 035020. [Google Scholar] [CrossRef]
  28. Siegel, D.J.; Hector, L.G.; Adams, J.B. First-principles study of metal–carbide/nitride adhesion: Al/VC vs. Al/VN. Acta Mater. 2002, 50, 619–631. [Google Scholar] [CrossRef]
  29. Huang, H.; Zhang, C.; Liu, J.; Li, Y.; Fang, X.; Li, J.; Han, P. First-Principles Study on the Structural Stability and Segregation Behavior of γ-Fe/Cr2N Interface with Alloying Additives M (M = Mn, V, Ti, Mo, and Ni). Metals 2016, 6, 156. [Google Scholar] [CrossRef]
  30. Wang, H.; Gao, X.; Yang, J.; Jia, Y.; Gong, J. First-Principles Study of Cr2N/γ-Fe Interface in High Nitrogen Steel. Mater. Trans. 2015, 56, 1047–1051. [Google Scholar] [CrossRef] [Green Version]
  31. Vanderbilt, D. Soft self-consistent pseudopotentials in a generalized eigenvalue formalism. Phys. Rev. B. 1990, 41, 7892–7895. [Google Scholar] [CrossRef]
  32. Laasonen, K.; Pasquarello, A.; Car, R.; Lee, C.; Vanderbilt, D. Car-Parrinello molecular dynamics with Vanderbilt ultrasoft pseudopotentials. Phys. Rev. B. 1993, 47, 10142–10153. [Google Scholar] [CrossRef]
  33. Perdew, J.P.; Burke, K.; Ernzerhof, M. Generalized gradient approximation made simple. Phys. Rev. Lett. 1996, 77, 3865. [Google Scholar] [CrossRef] [Green Version]
  34. Kim, S.J.; Marquart, T.; Franzen, H.F. Structure refinement for Cr2N. J. Less Common Met. 1990, 158, L9–L10. [Google Scholar] [CrossRef]
  35. Yan, M.; Chen, H. Structural, elastic and electronic properties of Cr2N: A first-principles study. Comput. Mater. Sci. 2014, 88, 81–85. [Google Scholar] [CrossRef]
  36. Christensen, A.N.; Lebech, B. The structure of β-vanadium nitride. Acta Crystallogr. 1979, 35, 2677–2678. [Google Scholar] [CrossRef]
  37. Ma, S.; Liu, Y.; Ye, J.; Zhang, H.; Pang, J. Theoretical study on the elastic, electronic and thermodynamic properties of trigonal-type Cr2N under high pressures. Comput. Mater. Sci. 2014, 95, 620–625. [Google Scholar] [CrossRef]
  38. Li, J.; Yang, Y.; Feng, G.; Luo, X.; Sun, Q.; Jin, N. Adhesion and fracture toughness at α-Ti(0001)/TiC(111): A first-principles investigation. Appl. Surf. Sci. 2013, 286, 240–248. [Google Scholar] [CrossRef]
  39. Lugovskoy, A.V.; Belov, M.P.; Krasilnikov, O.; Vekilov, Y.K. Stability of the hcp Ruthenium at high pressures from first principles. J. Appl. Phys. 2014, 116, 103507. [Google Scholar] [CrossRef]
  40. Kim, D.; Shang, S.-L.; Liu, Z.-K. Effects of alloying elements on elastic properties of Ni by first-principles calculations. Comput. Mater. Sci. 2009, 47, 254–260. [Google Scholar] [CrossRef]
  41. Wolf, R.J.; Mansour, K.A.; Lee, M.W.; Ray, J.R. Temperature dependence of elastic constants of embedded-atom models of palladium. Phys. Rev. B 1992, 46, 8027–8035. [Google Scholar] [CrossRef]
  42. Zhang, M.; Shen, J.; He, J. Elastic constants of Al and TiN calculated by ab initio method. Nonferrous Met. Soc. China 2001, 11, 244–248. [Google Scholar]
  43. Zhang, K.; Pang, M.; Zhan, Y. Atomic structure and electronic properties of Ag(111)/TiC(111) interface: Insights from first-principles simulations. J. Phys. Chem. Solids 2019, 124, 212–220. [Google Scholar] [CrossRef]
  44. Zhu, Y.D.; Yan, M.F.; Zhang, Y.X.; Zhang, C.S. First-principles investigation of structural, mechanical and electronic properties for Cu–Ti intermetallics. Comput. Mater. Sci. 2016, 123, 70–78. [Google Scholar] [CrossRef]
  45. Li, J.; Zhang, M.; Zhou, Y.; Chen, G. First-principles study of Al/A13Ti heterogeneous nucleation interface. Appl. Surf. Sci. 2014, 307, 593–600. [Google Scholar] [CrossRef]
  46. Wu, Z.; Pang, M.; Zhan, Y.; Shu, S.; Xiong, L.; Li, Z. The bonding characteristics of the Cu(111)/WC(0001) interface: An insight from first-principle calculations. Vacuum 2021, 191, 110218. [Google Scholar] [CrossRef]
  47. Da Silva, J.L.F.; Stampfl, C.; Scheffler, M. Converged properties of clean metal surfaces by all-electron first-principles calculations. Surf. Sci. 2006, 600, 703–715. [Google Scholar] [CrossRef]
  48. Singh-Miller, N.E.; Marzari, N. Surface energies, work functions, and surface relaxations of low-index metallic surfaces from first principles. Phys. Rev. B 2009, 80, 235407. [Google Scholar] [CrossRef] [Green Version]
  49. Tyson, W.; Miller, W. Surface free energies of solid metals: Estimation from liquid surface tension measurements. Surf. Sci. 1977, 62, 267–276. [Google Scholar] [CrossRef]
  50. Liu, J.; Nolan, M. Coverage and Stability of NHx Terminated Cobalt and Ruthenium Surfaces: A First Principles Investigation. J. Phys. Chem. C 2019, 123, 25166–25175. [Google Scholar] [CrossRef]
  51. Yang, J.; Wang, Y.; Huang, J.; Ye, Z.; Sun, X.; Chen, S.; Zhao, Y. First-principles calculations on Ni/W interfaces in Steel/Ni/W hot isostatic pressure diffusion bonding layer. Appl. Surf. Sci. 2019, 475, 906–916. [Google Scholar] [CrossRef]
  52. Liu, L.M.; Wang, S.Q.; Ye, H.Q. First-principles study of polar Al/TiN(111) interfaces. Acta Mater. 2004, 52, 3681–3688. [Google Scholar] [CrossRef]
  53. Li, J.; Cui, Y.; Chen, Y.; Lv, X.; Luo, X. Theoretical investigation on SiC(1 1 1)/Al4C3(0 0 0 1) interface using density functional theory calculations. Mater. Today Commun. 2019, 21, 100743. [Google Scholar] [CrossRef]
  54. Guo, W.; She, Z.; Xue, H.; Zhang, X. Study on the effect of Ti, Al, Cu, and Ag doping on the bonding properties of soldered β-Sn(100)/ZrO2(111) interface. Appl. Ceram. Technol. 2021, 18, 138–146. [Google Scholar] [CrossRef]
  55. Jiao, X.; Fu, W.; Shao, W.; Zhu, X.; Zhou, Y.; Xing, X.; Wang, Z.; Yang, Q. First-principles calculation on γ-Fe/La2O3 interface properties and austenite refinement mechanism by La2O3. Mater. Chem. Phys. 2020, 259, 124194. [Google Scholar] [CrossRef]
  56. Mori, T.; Fukuda, S.; Takemura, Y. Improvement of mechanical properties of Ti/TiN multilayer film deposited by sputtering. Surf. Coat. Technol. 2001, 140, 122–127. [Google Scholar] [CrossRef]
  57. Guo, W.; She, Z.; Xue, H.; Zhang, X. Effect of active Ti element on the bonding characteristic of the Ag(111)/α-Al2O3(0001) interface by using first principle calculation. Ceram. Int. 2020, 46, 5430–5435. [Google Scholar] [CrossRef]
  58. Mei, Z.-G.; Bhattacharya, S.; Yacout, A.M. First-principles study of fracture toughness enhancement in transition metal nitrides. Surf. Coat. Technol. 2018, 357, 903–909. [Google Scholar] [CrossRef]
  59. Chu, F.; Lei, M.; Maloy, S.; Petrovic, J.; Mitchell, T. Elastic properties of C40 transition metal disilicides. Acta Mater. 1996, 44, 3035–3048. [Google Scholar] [CrossRef]
  60. Chen, K.; Bielawski, M. Interfacial fracture toughness of transition metal nitrides. Surf. Coat. Technol. 2008, 203, 598–601. [Google Scholar] [CrossRef]
  61. Yu, R.; Song, H.; Zhang, X.-F.; Yang, P. Thermal Wetting of Platinum Nanocrystals on Silica Surface. J. Phys. Chem. B 2005, 109, 6940–6943. [Google Scholar] [CrossRef] [PubMed]
  62. Ouyang, G.; Tan, X.; Wang, C.X.; Yang, G.W. Physical and chemical origin of size-dependent spontaneous interfacial alloying of core–shell nanostructures. Chem. Phys. Lett. 2006, 420, 65–70. [Google Scholar] [CrossRef]
  63. Bauer, E. Epitaxy of metals on metals. Appl. Surf. Sci. 1982, 11–12, 479–494. [Google Scholar] [CrossRef]
  64. Christensen, M.; Dudiy, S.; Wahnström, G. First-principles simulations of metal-ceramic interface adhesion: Co/WC versus Co/TiC. Phys. Rev. B 2002, 65, 045408. [Google Scholar] [CrossRef]
  65. Lu, S.; Hu, Q.-M.; Punkkinen, M.P.J.; Johansson, B.; Vitos, L. First-principles study of fcc-Ag/bcc-Fe interfaces. Phys. Rev. B 2013, 87, 224104. [Google Scholar] [CrossRef] [Green Version]
  66. Smith, J.; Zhang, W. Stoichiometric interfaces of Al and Ag with Al2O3. Acta Mater. 2000, 48, 4395–4403. [Google Scholar] [CrossRef]
  67. Timchenko, N.A.; Zubavichus, Y.V.; Krysina, O.V.; Kuznetsov, S.I. Local structure of titanium nitride-based coatings. J. Surf. Investig. X-ray Synchrotron Neutron Tech. 2016, 10, 425–428. [Google Scholar] [CrossRef]
  68. Lee, B.-J. Predictive Analysis of Ti/AlN Interfacial Reaction Using Diffusion Simulation. Scr. Mater. 1998, 38, 499–507. [Google Scholar] [CrossRef]
  69. Herzler, J.; Leiberich, R.; Mick, H.-J.; Roth, P. Shock tube study of the formation of TiN molecules and particles. Nanostruct. Mater. 1998, 10, 1161–1171. [Google Scholar] [CrossRef]
  70. Hwang, S.; Laursen, A.B.; Porter, S.H.; Hongbin, Y.; Li, M.; Manichev, V.; Calvinho, K.U.; Amarasinghe, V.; Greenblatt, M.; Garfunkel, E.; et al. Garfunkel, Titanium Nitride As a Conducting Interfacial Layer between Hydrogen Evolution Catalysts and Silicon Photocathodes for Stable Solar-to-Hydrogen Water Splitting Devices. In ECS Meeting Abstracts; IOP Publishing: Bristol, UK, 2018. [Google Scholar]
  71. Faran, E.; Gotman, I.; Gutmanas, E.Y. Experimental study of the reaction zone at boron nitride ceramic–Ti metal interface. Mater. Sci. Eng. A 2000, 288, 66–74. [Google Scholar] [CrossRef]
  72. Morgiel, J.; Benkö, E. Microstructure of boron nitride sintered with titanium. Mater. Lett. 1995, 25, 49–52. [Google Scholar] [CrossRef]
Figure 1. Three different terminations of Cr2N(0001): (a) 1N-T, (b) 2N-T, and (c) Cr-T terminations. The V2N(0001) surface has similar configurations.
Coatings 12 00066 g001
Figure 2. (a) Cr2N(0001) and (b) V2N(0001) surface energy as a function of chromium chemical potential ( μ Cr slab μ Cr bulk ) and vanadium chemical potential ( μ V slab μ V bulk ), respectively.
Coatings 12 00066 g002
Figure 3. Interface models of M/Cr2N interfaces, including (ae) M1(0001)/Cr2N(0001) (M1 = Ti and Ru), (fj) M2(111)/Cr2N(0001) (M2 = Pd, Al, Ag, and Cu), and (ko) Ni(111)/Cr2N(0001). The orientation relationships of the interface models are (0001)M1[2 1 ¯ 1 ¯ 0]M1//(0001)C2N[1 1 ¯ 00]C2N, (111)M2[10 1 ¯ ]M2//(0001)C2N[1 1 ¯ 00]C2N, and (111)Ni[2 1 ¯ 1 ¯ ]Ni//(0001)C2N[1 1 ¯ 00]C2N, respectively. There are five atom layers in the top views of (a1e1), (f1j1) and (k1o1). The smallest spheres denote interfacial atoms of metal phases, from the second smallest to largest spheres are atoms from the first to fourth layers of Cr2N(0001). Five interface models for each M/Cr2N are considered: (a1,f1,k1) 1N-T top, (b1,g1,l1) 1N-T hollow, (c1,h1,m1) 2N-T top, (d1,i1,n1) 2N-T hollow, and (e1,j1,o1) Cr-T.
Coatings 12 00066 g003
Figure 4. Interfacial mismatch rates calculated for the interface models constructed in this work.
Coatings 12 00066 g004
Figure 5. Relationship between the work of adhesion Wad and the interfacial distance d0 obtained using the UBER method for every metal considered: (a) Ti, (b) Ru, (c) Ni, (d) Pd, (e) Al, (f) Ag, (g) Cu.
Coatings 12 00066 g005
Figure 6. The work of adhesion Wad obtained for the interface models before and after full relaxation.
Coatings 12 00066 g006
Figure 7. PDOS for selected atoms in the (a) Ti(0001)/V2N(0001)-2N(hol), (b) Ni(111)/V2N(0001)-V, and (c) Ru(0001)/Cr2N(0001)-Cr interface models. The vertical dashed line indicates the Fermi level.
Coatings 12 00066 g007
Figure 8. Charge density difference plots of (a) Ti(0001)/V2N(0001)-2N(hol), (b) Ni(111)/V2N(0001)-V, and (c) Ru(0001)/Cr2N(0001)-Cr interface models. Mulliken charge (unit: e) is labeled beside the atoms. The dashed lines represent the positions of the interfaces.
Coatings 12 00066 g008
Figure 9. The KIC-metal and KIC-ceramic obtained for the interface models after full relaxation.
Coatings 12 00066 g009
Figure 10. The combination of the interfacial work of adhesion Wad and the interfacial fracture toughness KIC of the (a) M/Cr2N and (b) M/V2N interface models considered, respectively.
Coatings 12 00066 g010
Figure 11. Different cleavage planes (cp1~cp6) for the (a) Ru(0001)/Cr2N(0001)-Cr and (b) Ni(111)/V2N(0001)-V interface models. Here, the values of Wad (unit: J/m2) obtained for the models along cp1~p6 cleavage planes are also labeled.
Coatings 12 00066 g011
Figure 12. Interfacial energies of the (a) M/Cr2N and (b) M/V2N interface models as a function of chromium chemical potential ( μ Cr slab μ Cr bulk ) and vanadium chemical potential ( μ V slab μ V bulk ), respectively.
Coatings 12 00066 g012
Table 1. Calculated lattice constant (a and c, in Å), bulk modulus (B, in GPa), and elastic constants (Cij, in GPa) of Cr2N, V2N, Ti, Ru, Ni, Pd, Al, Ag, and Cu.
PhaseSpace GroupData SourceacBC11C12C13C33C44
Cr2NP 3 ¯ 1m (162)This work4.7734.406288.9476.7157.5230.6409.0169.2
Ref. [37]4.7734.406289.0477.0158.0231.0410.0171.0
V2NP 3 ¯ 1m (162)This work4.9054.543264.9454.1162.2177.7444.7153.7
Ref. [36]4.9174.568
TiP63/mmc (194)This work2.9404.649111.6174.583.976.2182.543.6
Ref. [38]2.9414.647112.6170.392.370.5206.243.3
RuP63/mmc (194)This work2.7194.283313.2577.0182.4160.7660.1190.1
Ref. [39]2.7204.292329.9577.4176.7170.9644.2190.4
NiFm 3 ¯ m (225)This work3.536200.4281.8159.7130.5
Ref. [40]3.522198.0281.0157.0131.0
PdFm 3 ¯ m (225)This work3.930183.4224.2163.073.0
Ref. [41]3.890195.0230.0177.078.1
AlFm 3 ¯ m (225)This work4.04976.1130.548.88.7
Ref. [42]4.00073.4123.848.621.4
AgFm 3 ¯ m (225)This work4.13898.0114.989.654.5
Ref. [43]4.13898.3117.188.955.6
CuFm 3 ¯ m (225)This work3.630134.7178.2112.986.6
Ref. [44]3.631137.4162.1125.184.1
Table 2. Cr2N(0001) and V2N(0001) surface relaxations as a function of termination and slab thickness (change of the interlayer spacing Δ ij as a percentage of the spacing in bulk).
SlabTerminateInterlayerAtom Layers of SlabSlabTerminateInterlayerAtom Layers of Slab
79117911
Cr2N(0001)1N Δ 12−7.5−8.0−7.5V2N(0001)1N Δ 12−14.7−12.9−13.8
Δ 23−8.9−10.8−9.8 Δ 23−6.3−5.1−4.9
Δ 342.94.94.3 Δ 34−1.4−1.7−1.4
Δ 45 −2.3−0.6 Δ 45 1.30.4
Δ 56 −2.5 Δ 56 −0.4
2N Δ 12−15.2−16.3−16.22N Δ 12−27.0−26.1−25.4
Δ 23−11.5−10.8−9.9 Δ 23−0.3−1.10.2
Δ 348.99.08.8 Δ 340.1−0.80.1
Δ 45 −0.9−1.3 Δ 45 −0.2−0.2
Δ 56 1.5 Δ 56 −0.6
Cr Δ 12−15.9−21.9−20.5V Δ 12−6.2−5.4−5.6
Δ 231.91.62.7 Δ 23−0.30.60.2
Δ 3413.511.911.4 Δ 341.60.60.6
Δ 45 2.73.6 Δ 45 1.41.0
Δ 56 1.8 Δ 56 0
Table 3. Calculated surface energies of Ti(0001), Ru(0001), Ni(111), Pd(111), Al(111), Ag(111), and Cu(111) surfaces. The corresponding data available in the literature are also included for comparison.
Metal SlabSurface Energy (J/m2)
This WorkOther CalculationsExperiment
Ti(0001)1.991.99 [47], 1.96 [48]1.99 [49]
Ru(0001)2.702.31 [50]3.04 [49]
Ni(111)1.911.93 [23], 1.92 [51] 2.38 [49]
Pd(111)1.471.54 [23], 1.31 [48]2.00 [49]
Al(111)0.810.829 [45], 0.83 [52] 1.14 [49]
Ag(111)0.790.80 [43], 0.75 [23], 1.25 [49]
Cu(111)1.331.322 [46], 1.41 [47]1.79 [49]
Table 4. The interface orientations of M1/Cr2N (M1 = Ti and Ru), M2/Cr2N (M2 = Pd, Al, Ag, and Cu), and Ni/Cr2N interface models.
M/Cr2NInterfacial Orientation Relationship
M1/Cr2N (M1 = Ti and Ru)(0001)M1[2 1 ¯ 1 ¯ 0]M1//(0001)C2N[1 1 ¯ 00]C2N
M2/Cr2N (M2 = Pd, Al, Ag, and Cu)(111)M2[10 1 ¯ ]M2//(0001)C2N[1 1 ¯ 00]C2N
Ni/Cr2N (111)Ni[2 1 ¯ 1 ¯ ]Ni//(0001)C2N[1 1 ¯ 00]C2N
Table 5. Calculated elastic compliances (Sij, in GPa−1), Young’s moduli (E, in GPa) along [0001] direction for Cr2N, V2N, Ti, and Ru, and along [111] direction for Ni, Pd, Al, Ag, and Cu.
LatticePhaseS11S12S13S33S44E0001E111
hcp-TMNCr2N0.00292−0.00024−0.001510.004150.00596241.20
V2N0.00282−0.00071−0.000840.002920.00669342.18
hcp-MTi0.00809−0.00296−0.002140.007270.02292137.55
Ru0.00200−0.00053−0.000360.001690.00526592.10
fcc-MPd0.01150−0.004840.01370193.35
Al0.00962−0.002620.1149425.14
Ag0.02756−0.012080.01835137.93
Cu0.01103−0.004280.01155213.89
Ni0.00601−0.002180.00766321.70
Publisher’s Note: MDPI stays neutral with regard to jurisdictional claims in published maps and institutional affiliations.

