Abstract
By comprehensively considering both the high temperature mechanical properties and peritectic transformation during peritectic steel solidification, the strain is proposed to evaluate the crack sensitivity of peritectic steels produced in the brittle temperature range in the present work. The zero ductility temperature (ZDT) and the zero strength temperature (ZST) of Fe–C–0.32Si–1.6Mn–0.01P–0.015S steel under nonequilibrium conditions by taking the effect of the peritectic transformation on the solute segregation into account were calculated by the CK microsegregation model (Clyne–Kurz model) and were compared with the measured data. The comparison results show that this model can well simulate the nonequilibrium solidification process of peritectic steel. Then, based on the calculation of the CK microsegregation model, the strain during the peritectic phase transformation in the brittle temperature range (ZDT < TB < LIT) was calculated under nonequilibrium conditions. The results show that the calculated strain is in good agreement with the actual statistical longitudinal crack data indicating that the strain can therefore be used to predict the crack sensitivity of peritectic steels effectively.
1. Introduction
Generally, the C percent of peretectic steels ranges in 0.09~0.17 wt %, for which the surface longitudinal cracks are prone to appear during continuous casting process decreasing the quality of the cast product and hampering production rates [1,2,3,4,5,6]. The peritectic phase transformation always occurs during the solidification of peritectic steels, which may lead to uneven strand shell growth and produce thermal stress as well as phase transformation stress. In order to reduce crack defects in the casting slabs, metallurgists hope to adjust the composition of liquid steel to reduce the crack sensitivity of steel during steelmaking. Much research has been conducted to estimate the solidification crack sensitivity during continuous casting. Kim et al. [7] investigated the effects of carbon and sulfur on longitudinal surface cracks by calculating the nonequilibrium pseudo binary Fe–C phase diagram and introducing the strain in the brittle temperature range for the continuous casting of steels. They found that the carbon content at which longitudinal surface cracks was maximized decreased with increasing sulfur content, and the possibility of surface cracks increased with increasing sulfur content at a given carbon content. Harste et al. [8] used a mechanical model and a thermal model to predict the crack susceptibility, and they found that there was a shrinkage peak at about 0.1 wt % C. Won et al. [9] proposed the concept of “Specific Crack Susceptibility” to analyze the crack tendency based on the critical fracture stress and critical stain, and they found that the crack susceptibility of 0.12 wt % C steel is the strongest.
Obviously, the chemical composition would have a noticeable effect on the process of peritectic transition. From the perspective of solidification, the solute elements segregate at the grain boundaries of the primary solidified shell in a mold, so that a low-melting liquid film would form between the dendrites leading to a reduced resistance of the shell from deformation, during which the peritectic phase transformation could occur near the solidus temperature resulting in the fact that the total thermal stress and phase transformation stress are close to the fracture strength of the primary solidified shell, which is easy to cause cracks in the weak parts of the shell. Therefore, the peritectic phase transformation during solidification has an important influence on the longitudinal cracks on the surface of the cast slab, and once the stress on the shell exceeds the critical stress at high temperature, cracks would occur in weak parts of the shell [10,11,12,13,14,15].
So, it is important to predict the sensitivity of the cracks during peritectic steel production. The methods proposed to describe the sensitivity of such steels in the literature mainly focuses on the basis of high temperature mechanical properties of the steels only, and the influence of peritectic phase transformation accompanied with element segregation on longitudinal cracks during solidification is always ignored.
In the present study, the characterized method for the sensitivity of the peritectic steels combined with both the high temperature mechanical properties and the peritectic transformation during peritectic phase transformation in the brittle temperature range is proposed comprehensively and is validated by statistical longitudinal crack data from literature, which can be used to evaluate the crack sensitivity of peritectic steels more reasonably. Furthermore, the results of this calculation are advantageous for the chemical composition control and utilization of mold fluxes to avoid the cracks occurring when producing such steels.
2. Calculation Procedures
2.1. Segregation Model
The CK microsegregation model is used to quantitatively describe the relationship between the concentration of the solutes and the solid fraction during the solidification of peritectic steels. In the solid–liquid interface, the solute concentration is assumed to be in the local equilibrium. The equilibrium distribution coefficient of the solute elements at the solid–liquid interface and liquidus slope is assumed to be constant. Solute elements are assumed to diffuse completely in the liquid. The effects of the solute segregation is assumed to be superimposable. The equation of the CK model is shown as follows [16]:
where fs is the solid fraction, k is the equilibrium distribution coefficient, C0,i is the initial concentration of the solute element i, CL,i is the concentration of the solute element i in the solidification front, and β is the correction factor given as follows:
where αi is the Fourier number of the solute element i, Ds is the diffusion coefficient of the solute in the solid phase, tf is the local solidification time, TL is the liquidus temperature, TS is the solidus temperature, CR is cooling rate, and λ is the secondary dendrite arm spacing given as follows [17]:
where %CC is the carbon content.
2.2. Model Calculation
2.2.1. Determination of Liquidus Temperature and Solidus Temperature
The liquidus temperature (TL) and the temperature of the solidification front (Tint) at different solid fractions are calculated using the following equations [18]:
where mi is the liquidus slope of the solute element i. When the solid fraction is 1, the Tint calculated by Equation (8) is the solidus temperature.
δ-ferrite and γ-austenite appear during the solidification of peritectic steels. When the carbon content in the solidification front is lower than the peritectic end point (CL), the peritectic steels will solidify in the L→δ-ferrite mode until the peritectic reaction occurs. With the solidification proceeding, the carbon content in the solidification front is continuously enriched. Once the carbon content in the solidification front exceeds the peritectic end point (CL), the peritectic phase transformation occurs, and the residual liquid phase will solidify in the γ-austenite mode [19]. Due to the significant difference between the diffusion coefficient and equilibrium distribution coefficient of the solute elements in the δ-ferrite phase and the γ-austenite phase [20], the peritectic phase transformation will have an important effect on the segregation of the solute elements. The solidification parameters of the solute elements in the δ-ferrite and γ-austenite are shown in Table 1 [21,22,23,24,25,26]:

Table 1.
Solidification parameters (R = 8.314 J/mol/K) [21,22,23,24,25,26].
The segregation model is initially calculated in the δ-ferrite solidification mode. When the carbon content in the residual liquid phase reaches CL, the critical solid fraction (fsw) and the content of the solute elements (Csw) are recorded. The virtual initial composition, which ensures that the solute content obtained by solidifying to fsw in the γ-austenite mode is equal to the solute content obtained by solidifying the actual initial composition to fsw in the δ-ferrite mode, can be obtained according to Equation (9). Then the segregation model is calculated in the γ-austenite solidification mode.
where is the virtual initial concentration of the solute element i; Csw,i is the concentration of the solute element i at fsw. The iteration method was used to calculate TS. The process of the calculation is shown in Figure 1.
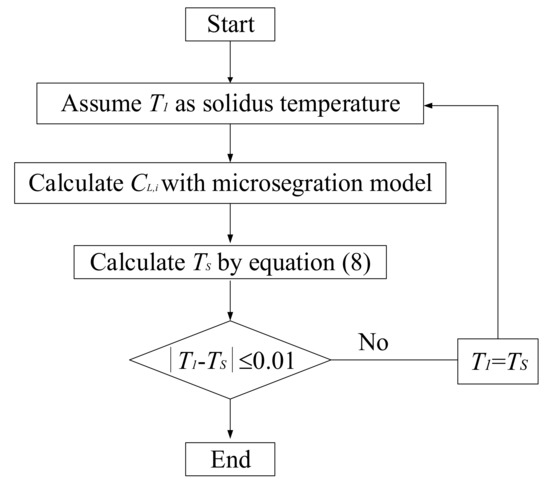
Figure 1.
Flow chart for calculation of TS.
2.2.2. Determination of Peritectic Phase Transformation Temperature during Solidification
When the carbon concentration at the solidification front reaches the carbon content of the peritectic end point (CL), the Tint calculated by the segregation model is used as the starting temperature of the peritectic phase transformation (Tp), and the corresponding solid fraction is considered to be the starting solid fraction of the peritectic transformation (fsp). The mass fraction of liquid phase (fL) and solid phase (δ-ferrite or γ-austenite) at the starting or end temperature of the peritectic phase transformation (fX) during solidification can be calculated as follows:
where ρL(T) is the density of the liquid phase at the temperature of T, ρX(T) is the density of the δ-ferrite or γ-austenite at the temperature of T, which is as follows [27]:
The ratio of the liquid phase to the δ-ferrite under the segregation condition is consistent with the equilibrium condition when the liquid phase and δ-ferrite transform completely into the γ-austenite in the same system [28]. This is determined by the conservation of mass and can be calculated using the thermodynamic Thermo-Calc software with the TCFE-7 database.
Based on the ratio and the mass fraction of the liquid phase and the δ-ferrite at Tp, the mass fraction of each phase at the end of the peritectic phase transformation during solidification can be obtained. When no liquid phase remains at the end of the peritectic phase transformation, the solid fraction at the end of the peritectic phase transformation (fsE) is 1. When the liquid phase remains at the end of the peritectic phase transformation, fsE is less than 1. Firstly, the mass fractions of the γ-austenite (fγ′) and the liquid phase (fL′) at the end of the peritectic phase transformation were calculated, and then the iteration method was used to calculate fsE. The process of calculation is shown in Figure 2.
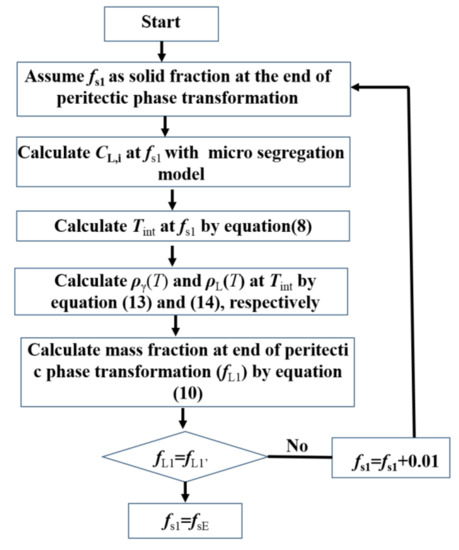
Figure 2.
Flow chart for calculation of fsE.
2.3. Model Validation
The nonequilibrium, pseudo-binary Fe–C phase diagram of the Fe–C–0.32Si–1.6Mn–0.01P–0.015S steel at a cooling rate of 0.17 K/s and the secondary dendrite arm spacing of 1000 μm were calculated using the microsegregation analysis. Schmidtman [29] measured the zero ductility temperature (ZDT) and zero strength temperature (ZST) of the steel as a function of the carbon content, which were used to be compared with the calculated nonequilibrium phase diagrams as shown in Figure 3.
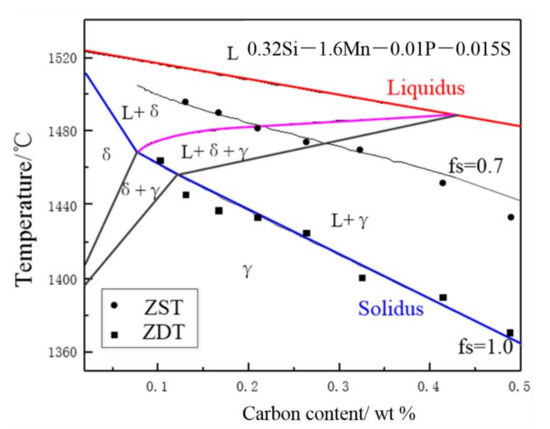
Figure 3.
Nonequilibrium, pseudo binary Fe–C phase diagram of the Fe–C–0.32Si–1.6Mn–0.01P–0.015S steel.
In Figure 3, the complete solidification temperatures calculated are in good agreement with the ZDT measured by Schmidtman as well as the ZST calculated in the present work, and the solid fraction of the temperature, under which the measured ZDT and ZST agree well with the calculated results, is 0.7. Therefore, the results calculated by the microsegregation model proposed above can simulate the nonequilibrium solidification process of peritectic steel.
3. Results and Discussion
3.1. Analysis of Crack Sensitivity
All cracks observed in the continuously cast steel originate and propagate along the interdendrites in the mushy zone except the transverse cracks. Clyne et al. [30] divided the mushy zone into the mass and liquid feeding zones and the crack zone. Cracks formed in the mass and liquid feeding zones are refilled with the surrounding liquid, whereas cracks formed in the crack zone can not be refilled with the liquid because the dendrite arms are compacted enough to resist the feeding of the liquid. They proposed the boundary between the two zones to be the liquid impenetrable temperature (LIT) and defined the brittle temperature range TB as ZDT < TB < LIT. Davies and Shin [31] used 0.9 as the solid fraction in the boundary. ZDT is defined as the temperature at which the solid fraction reaches unity (fs = 1). The literature [32,33] reported that the peritectic transformation speed is so fast that the resulting shrinkage stress cannot be released in time. If the peritectic phase transformation occurs in the brittle temperature range (i.e., ZDT < TB < LIT), the shrinkage stress would exceed the high temperature strength of the steel, easily leading to longitudinal cracks at the grain boundaries. Therefore, the strain during the peritectic phase transformation in the brittle temperature range (ZDT < TB < LIT) can be used to evaluate the crack sensitivity of peritectic steels. εth is generally expressed as the sum of the strain caused by cooling and the strain caused by phase transformation as follows:
where T is the temperature, Tref is the reference temperature, α∗ is the thermal expansion coefficient defined as α∗ = dεth/dT, and Δεδ→γ is the strain due to the δ→γ transformation. The strain during the peritectic phase transformation in the brittle temperature range (ZDT < TB < LIT) could be expressed as:
where εC∗ and Δ can be interpreted as the thermal strain and the strain induced by the δ→γ transformation during the peritectic phase transformation in the brittle temperature range. T1 is the initial temperature of the peritectic phase transformation in the brittle temperature range; T2 is the end temperature of the peritectic phase transformation in the brittle temperature range. The strain can be simply expressed as a function of density as follows [7]:
where ρT1 and ρT2 are the density of the steel at T1 and T2, respectively. The density of the steel was obtained as follows [27]:
3.2. Validation of Crack Sensitivity
The comparison of the index of the longitudinal surface cracks of 0.14Si–0.36Mn–0.016P–0.013S steel under the different carbon content in the literature [34] with the calculated strain during the peritectic phase transformation in the brittle temperature range (ZDT < TB < LIT) is shown in Figure 4. The index of the longitudinal surface cracks is a value expressing the longitudinal surface crack ratio. In view of a current slow cooling method used in continuous casting, the cooling rate is set as 10 °C/s. The carbon content at which the maximum number of longitudinal surface cracks appear is about 0.13~0.14 wt%, which agrees well with the experimental results in the literature [34].
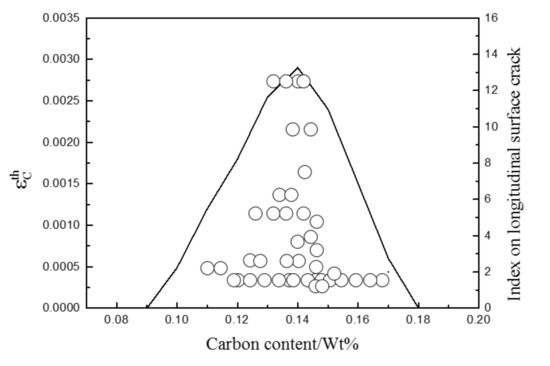
Figure 4.
Measured index on longitudinal surface crack and calculated strain during the peritectic phase transformation in the brittle temperature range (ZDT < TB < LIT).
In order to further verify the accuracy of the calculation method presented in the current work, the longitudinal crack ratio of the continuous casting slabs statistically obtained from an actual steel plant was used to compare with the calculation results. The comparison of the measured data and calculated data by present model is shown in Figure 5.
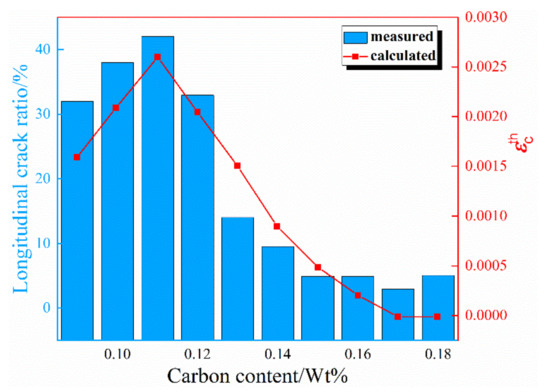
Figure 5.
Comparison of measured data and calculated data by present model.
The steels obtained from the steel plant were divided into 10 parts according to the carbon content of 0.09~0.18 wt %, and the content of Si, Mn, P, and S was similar, and thus the average value of these steels were calculated in the 10 sections. The strain during the peritectic phase transformation in the brittle temperature range (ZDT < TB < LIT) under different carbon content is also shown in Figure 5.
As shown in Figure 5, the strain during the peritectic phase transformation calculated in the brittle temperature range (ZDT < TB < LIT) by the proposed model in this study is consistent with the measured data from the steel plant. The result calculated in the present work shows that the strain at 0.15~0.18 wt % of element C is apparently lower than that at 0.09~0.12 wt % meaning a lighter sensitivity in the range of element C 0.15~0.18 wt %. According to the results of comparison, the strain during the peritectic phase transformation in the brittle temperature range (ZDT < TB < LIT) could characterize the tendency of the longitudinal surface crack during continuous casting perfectly, so the proposed model is reasonable to evaluate the sensitivity of cracks during peritectic steels.
4. Conclusions
The strain is proposed by comprehensively considering both the high temperature mechanical properties and the peritectic transformation during the peritectic steel solidification to evaluate the crack sensitivity of peritectic steels produced in the brittle temperature range (ZDT < TB < LIT) in the present work, and the conclusions are as follows:
- (1)
- Based on the analysis of the CK microsegregation model, which took the effect of the peritectic transformation on the solute segregation into account, the zero ductility temperature (ZDT) and zero strength temperature (ZST) of Fe–C–0.32Si–1.6Mn–0.01P–0.015S steel were determined. The calculated results are in good agreement with that measured in the literature.
- (2)
- The model to calculate the strain by comprehensively considering both the high temperature mechanical properties and the peritectic transformation during peritectic steel solidification was proposed to evaluate the crack sensitivity of peritectic steels produced in the brittle temperature range (ZDT < TB < LIT) in the present work, and the results were compared with the longitudinal crack ratio of peritectic steels in the literature showing a good agreement with the statistical longitudinal crack data from literature.
- (3)
- Validated by the statistical data from steel plants and literature, the model proposed in the present work can be used to effectively predict the crack sensitivity of peritectic steels.
Author Contributions
Software, Y.L.; validation, Y.L. and K.L.; writing—original draft preparation, K.L.; writing—review and editing, K.L.; supervision, S.C. All authors have read and agreed to the published version of the manuscript.
Funding
This research received no external funding.
Institutional Review Board Statement
Not applicable.
Informed Consent Statement
Not applicable.
Data Availability Statement
Data is contained within the article.
Conflicts of Interest
The authors declare no conflict of interest.
References
- Suzuki, M.; Yu, C.H.; Sato, H.; Tsui, Y.; Shibata, H.; Emi, T. Origin of heat transfer anomaly and solidifying shell deformation of peritectic steels in continuous casting. Trans. Iron Steel Inst. Jpn. 2007, 36, S171–S174. [Google Scholar] [CrossRef]
- Saraswat, R.; Maijer, D.M.; Lee, P.D.; Mills, K.C. The Effect of Mould Flux Properties on thermomechanical behaviour during billet continuous casting. ISIJ Int. 2007, 47, 95–104. [Google Scholar] [CrossRef]
- Konishi, J.; Militzer, M.; Samarasekera, I.V.; Brimacombe, J.K. Modeling the formation of longitudinal facial cracks during continu-ous casting of hypoperitectic steel. Metall. Mater. Trans. B 2002, 33, 413–423. [Google Scholar] [CrossRef]
- Zhang, Y.; Yu, L.; Fu, T.; Wang, J.; Shen, F.; Cui, K. Microstructure evolution and growth mechanism of Si-MoSi2 composite coatings on TZM (Mo–0.5Ti–0.1Zr–0.02 C) alloy. J. Alloys Compd. 2021, 894, 162403. [Google Scholar] [CrossRef]
- Zhang, Y.; Fu, T.; Cui, K.; Shen, F.; Wang, J.; Yu, L.; Mao, H. Evolution of surface morphology, roughness and texture of tungsten disilicide coatings on tungsten substrate. Vacuum 2021, 191, 110297. [Google Scholar] [CrossRef]
- Zhang, Y.; Cui, K.; Fu, T.; Wang, J.; Shen, F.; Zhang, X.; Yu, L. Formation of MoSi2 and Si/MoSi2 coatings on TZM (Mo–0.5 Ti–0.1 Zr–0.02 C) alloy by hot dip silicon-plating method. Ceram. Int. 2021, 47, 23053–23065. [Google Scholar] [CrossRef]
- Kim, K.-H.; Yeo, T.-J.; Oh, K.H.; Lee, D.N. Effect of carbon and sulfur in continuously cast strand on longitudinal surface cracks. ISIJ Int. 1996, 36, 284–289. [Google Scholar] [CrossRef]
- Harste, K.; Schwerdtfeger, K. Shrinkage of round iron-carbon ingots during solidification and subsequent cooling. ISIJ Int. 2003, 43, 1011–1020. [Google Scholar] [CrossRef][Green Version]
- Won, Y.M.; Han, H.N.; Yeo, T.-J.; Oh, K.H. Analysis of solidification cracking using the specific crack susceptibility. ISIJ Int. 2000, 40, 129–136. [Google Scholar] [CrossRef]
- Cui, K.; Fu, T.; Zhang, Y.; Wang, J.; Mao, H.; Tan, T. Microstructure and mechanical properties of CaAl12O19 reinforced Al2O3-Cr2O3 composites. J. Eur. Ceram. Soc. 2021, 41, 7935–7945. [Google Scholar] [CrossRef]
- Kim, K.-H.; Oh, K.H.; Lee, D.N. Mechanical behavior of carbon steels during continuous casting. Scr. Mater. 1996, 34, 301–307. [Google Scholar] [CrossRef]
- Cui, K.; Zhang, Y.; Fu, T.; Hussain, S.; Saad AlGarni, T.; Wang, J.; Zhang, X.; Ali, S. Effects of Cr2O3 content on micro-structure and mechanical properties of Al2O3 matrix composites. Coatings 2021, 11, 234. [Google Scholar] [CrossRef]
- Guo, L.; Li, W.; Bobadilla, M.; Yao, M.; Shen, H. High temperature mechanical properties of micro-alloyed carbon steel in the mushy zone. Steel Res. Int. 2010, 81, 387–393. [Google Scholar] [CrossRef]
- Won, Y.M.; Yeo, T.-J.; Seol, D.J.; Oh, K.H. A new criterion for internal crack formation in continuously cast steels. Met. Mater. Trans. A 2000, 31, 779–794. [Google Scholar] [CrossRef]
- Wang, J.; Zhang, Y.; Cui, K.; Fu, T.; Gao, J.; Hussain, S.; AlGarni, T.S. Pyrometallurgical recovery of zinc and valuable metals from electric arc furnace dust—A review. J. Clean. Prod. 2021, 298, 126788. [Google Scholar] [CrossRef]
- Clyne, T.W.; Kurz, W. Solute redistribution during solidification with rapid solid state diffusion. Metall. Trans. A 1981, 12, 965–971. [Google Scholar] [CrossRef]
- Won, Y.-M.; Thomas, B. Simple model of microsegregation during solidification of steels. Met. Mater. Trans. A 2001, 32, 1755–1767. [Google Scholar] [CrossRef]
- Han, Z.Q.; Cai, K.K. Study on a mathematical model of microsegregation in continuously cast slab. Acta Metall. Sin. 2000, 36, 869–873. [Google Scholar]
- Zhu, L.G.; Liu, Z.; Han, Y.H. A microsegregation model in the two-phase region of an ND steel continuous casting billet. Chin. J. Eng. 2019, 41, 461–469. [Google Scholar]
- Cai, Z.Z.; Zhu, M.Y. Microsegregation of solute elements in solidifying mushy zone of steel and its effect on longitudinal sur-face cracks of continuous casting strand. Acta Metall. Sin. 2009, 45, 55–61. [Google Scholar]
- Choudhary, S.K.; Ghosh, A. Mathematical model for prediction of composition of inclusions formed during solidification of liquid steel. ISIJ Int. 2009, 49, 1819–1827. [Google Scholar] [CrossRef]
- Ueshima, Y.; Mizoguchi, S.; Matsumiya, T.; Kajioka, H. Analysis of solute distribution in dendrites of carbon steel with δ/γ transformation during solidification. Met. Mater. Trans. A 1986, 17, 845–859. [Google Scholar] [CrossRef]
- Ma, Z.T.; Dieter, J. Characteristics of oxide precipitation and growth during solidification of deoxidized steel. ISIJ Int. 1998, 38, 46–52. [Google Scholar] [CrossRef]
- Liu, Z.Z.; Wei, J.; Cai, K.K. A couple mathematical model of microsegregation and inclusion precipitation during solidification of silicon steel. ISIJ Int. 2002, 42, 958–963. [Google Scholar] [CrossRef]
- Kobayashi, Y.; Liu, Z.; Nagai, K. Effect of phosphorus on sulfide precipitation in strip cast low carbon steel. J. Jpn. Inst. Met. 2006, 70, 440–446. [Google Scholar] [CrossRef][Green Version]
- Liu, Z.; Kobayashi, Y.; Yang, J.; Nagai, K.; Kuwabara, M. “In-situ” Observation of the δ/γ phase transformation on the sur-face of low carbon steel containing phosphorus at various cooling rates. ISIJ Int. 2006, 46, 847–853. [Google Scholar] [CrossRef][Green Version]
- Jablonka, A.; Harste, K.; Schwerdtfeger, K. Thermomechanical properties of iron and iron-carbon alloys: Density and thermal contraction. Steel Res. 1991, 62, 24–33. [Google Scholar] [CrossRef]
- Xu, J.; He, S.; Jiang, X.; Wu, T.; Wang, Q. Analysis of crack susceptibility of regular carbon steel slabs using volume-based shrinkage index. ISIJ Int. 2013, 53, 1812–1817. [Google Scholar] [CrossRef]
- Schmidtman, E.; Rakoski, F. Bnfluß des kohlenstoffgehaltes von 0.015 bis 1% und der gefügestruktur auf das hochtempera-turfestigkeits- und-zähigkeitsverhalten von baustählen nach der erstarrung aus der schmelze. Steel Res. Int. 1983, 54, 357–361. [Google Scholar]
- Clyne, T.W.; Wolf, M.; Kurz, W. The effect of melt composition on solidification cracking of steel, with particular reference to continuous casting. Met. Mater. Trans. A 1982, 13, 259–266. [Google Scholar] [CrossRef]
- Davies, G.J.; Shin, Y.K. Solidification Technology in the Foundry and Cast House; The Metal Society: London, UK, 1979; p. 517. [Google Scholar]
- Fredriksson, H.; Stjerndahl, J. Microstructure evolution during the solidification of steel. Met. Sci. 1982, 16, 575–580. [Google Scholar] [CrossRef]
- Shibata, H.; Arai, Y.; Suzuki, M.; Emi, T. Kinetics of peritectic reaction and transformation in Fe–C alloys. Met. Mater. Trans. A 2000, 31, 981–991. [Google Scholar] [CrossRef]
- Blazek, K.E.; Saucedo, I.G.; Tsai, H.T. An investigation on mold heat transfer during continuous casting. Steelmak. Conf. Proc. 1988, 71, 411–421. [Google Scholar]
Publisher’s Note: MDPI stays neutral with regard to jurisdictional claims in published maps and institutional affiliations. |
© 2021 by the authors. Licensee MDPI, Basel, Switzerland. This article is an open access article distributed under the terms and conditions of the Creative Commons Attribution (CC BY) license (https://creativecommons.org/licenses/by/4.0/).