
Analysis of the Possibility of Using New Types of Protective Coatings and Abrasion-Resistant Linings under the Operating Conditions of the Spiral Classifier at KGHM Polska Miedź S.A. Ore Concentration Plant


Abstract
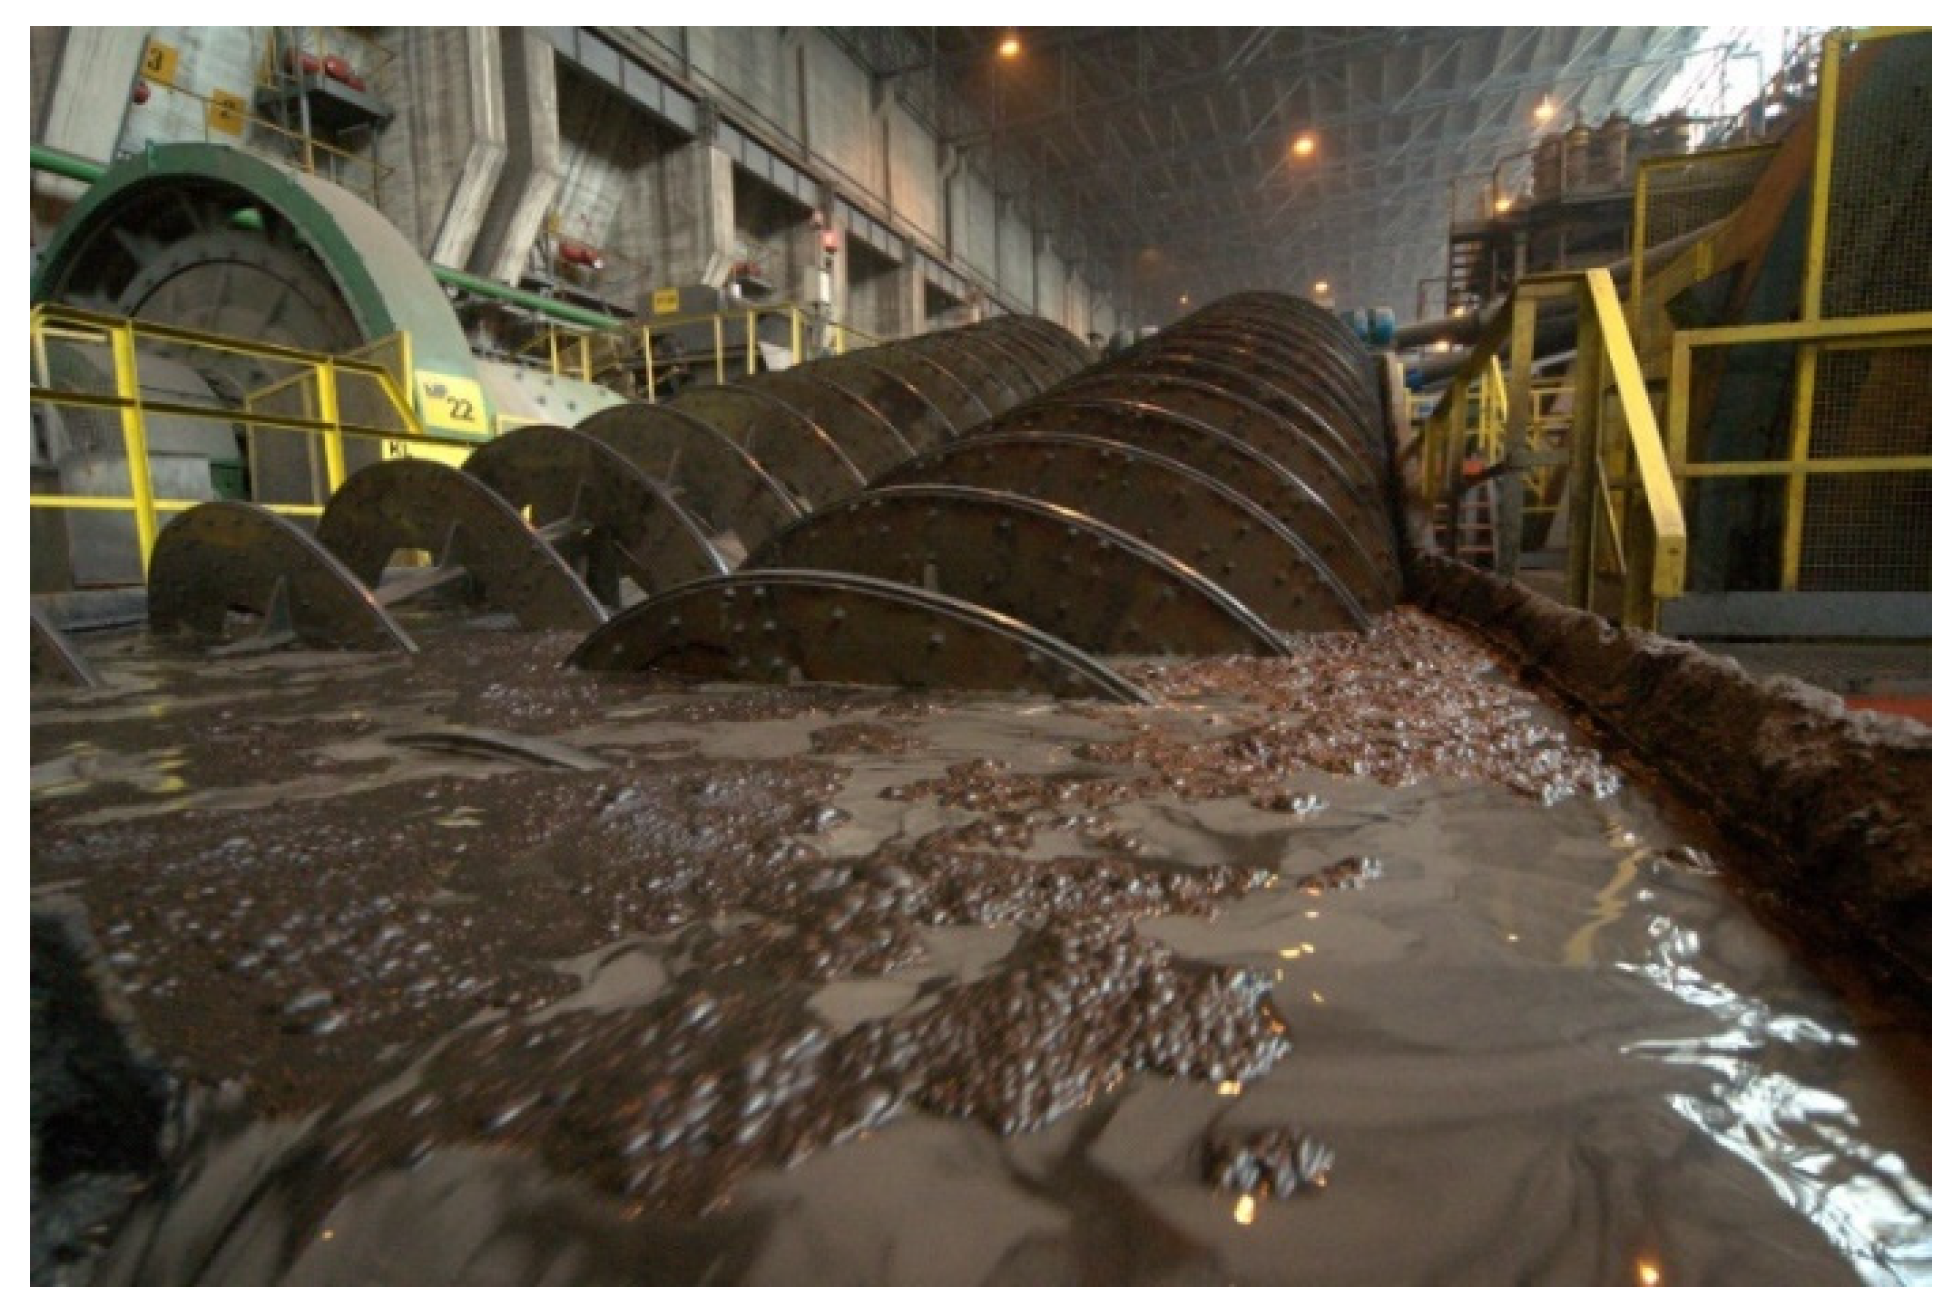
:1. Introduction
2. Materials and Methods
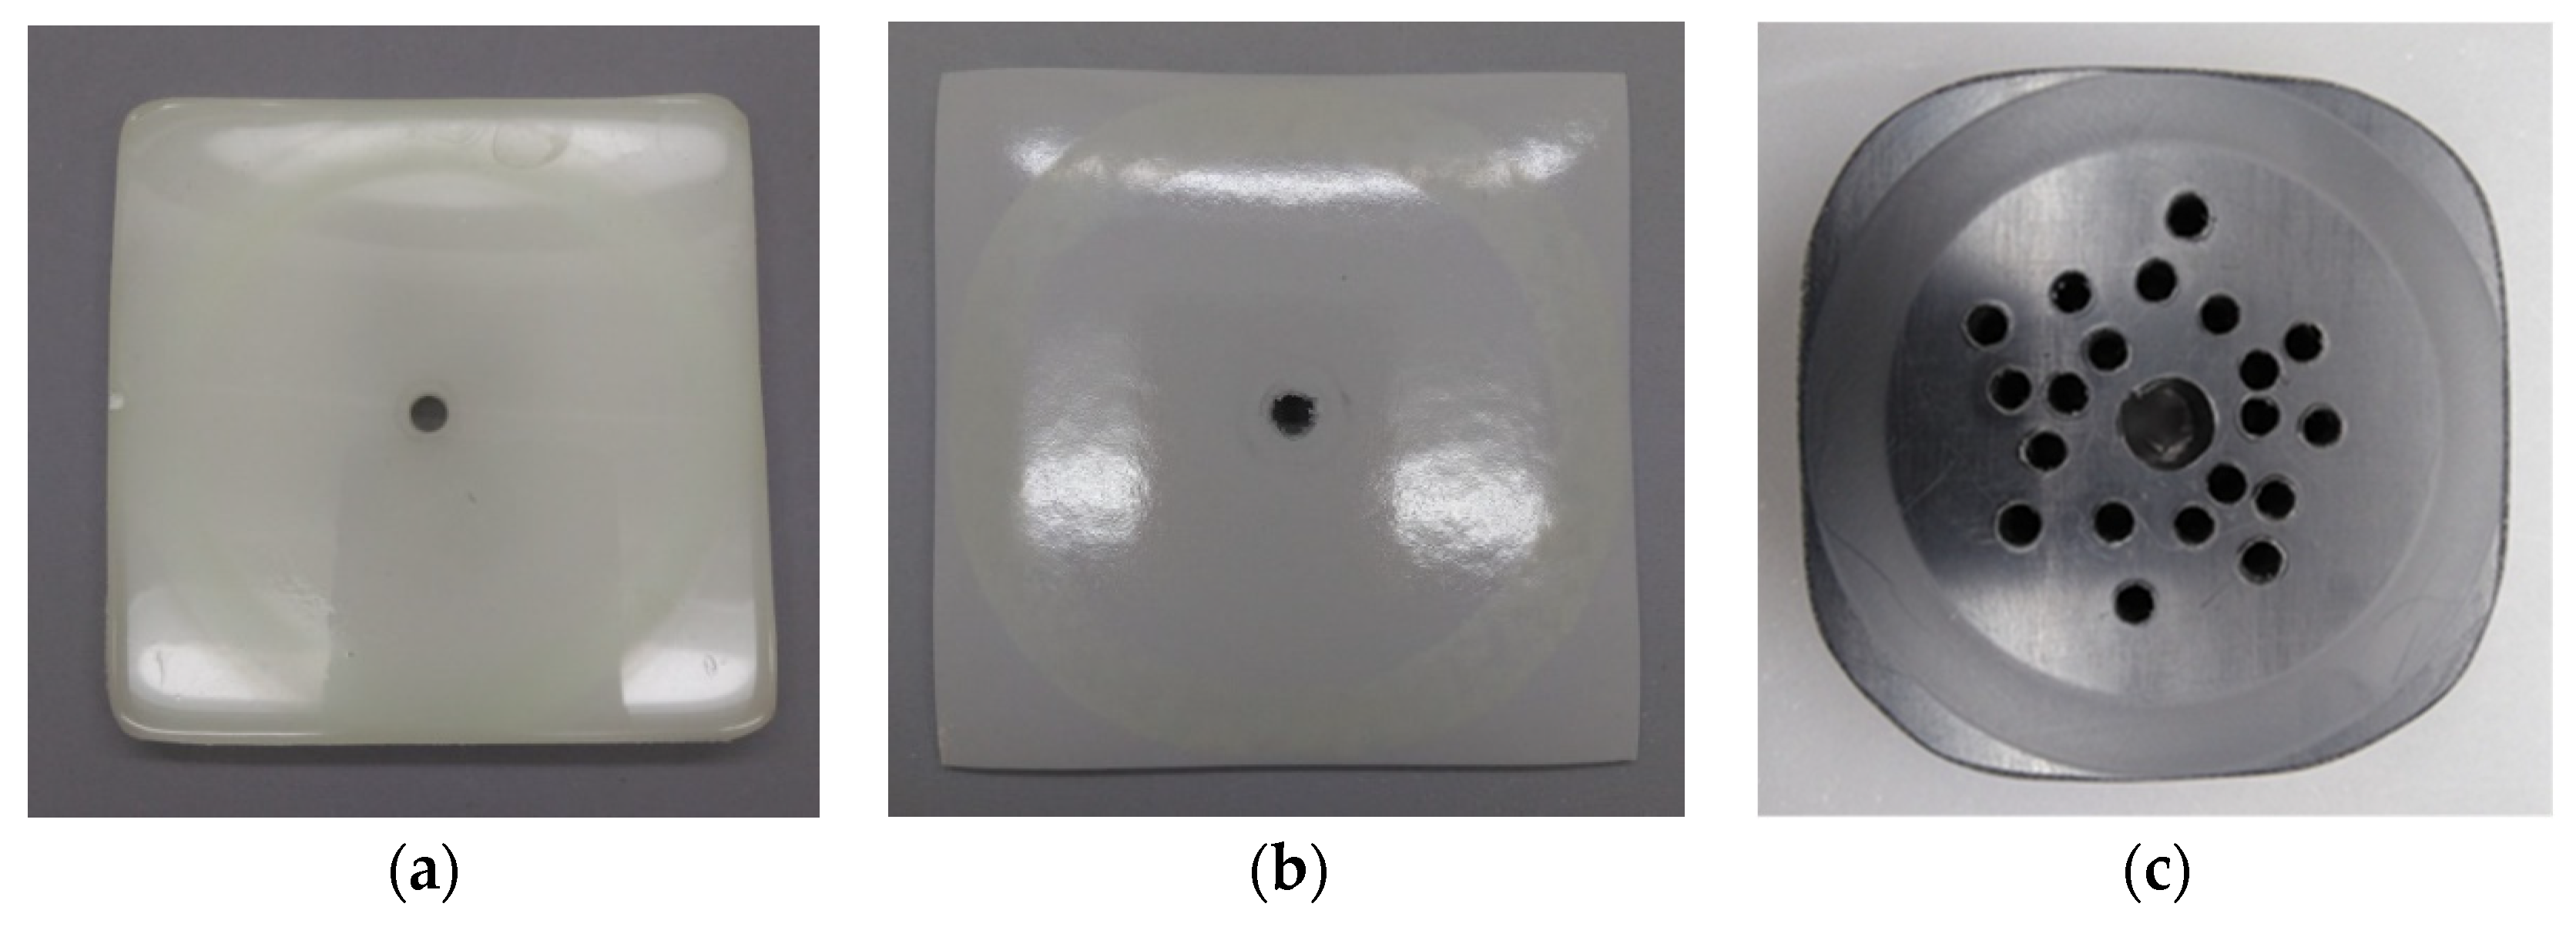
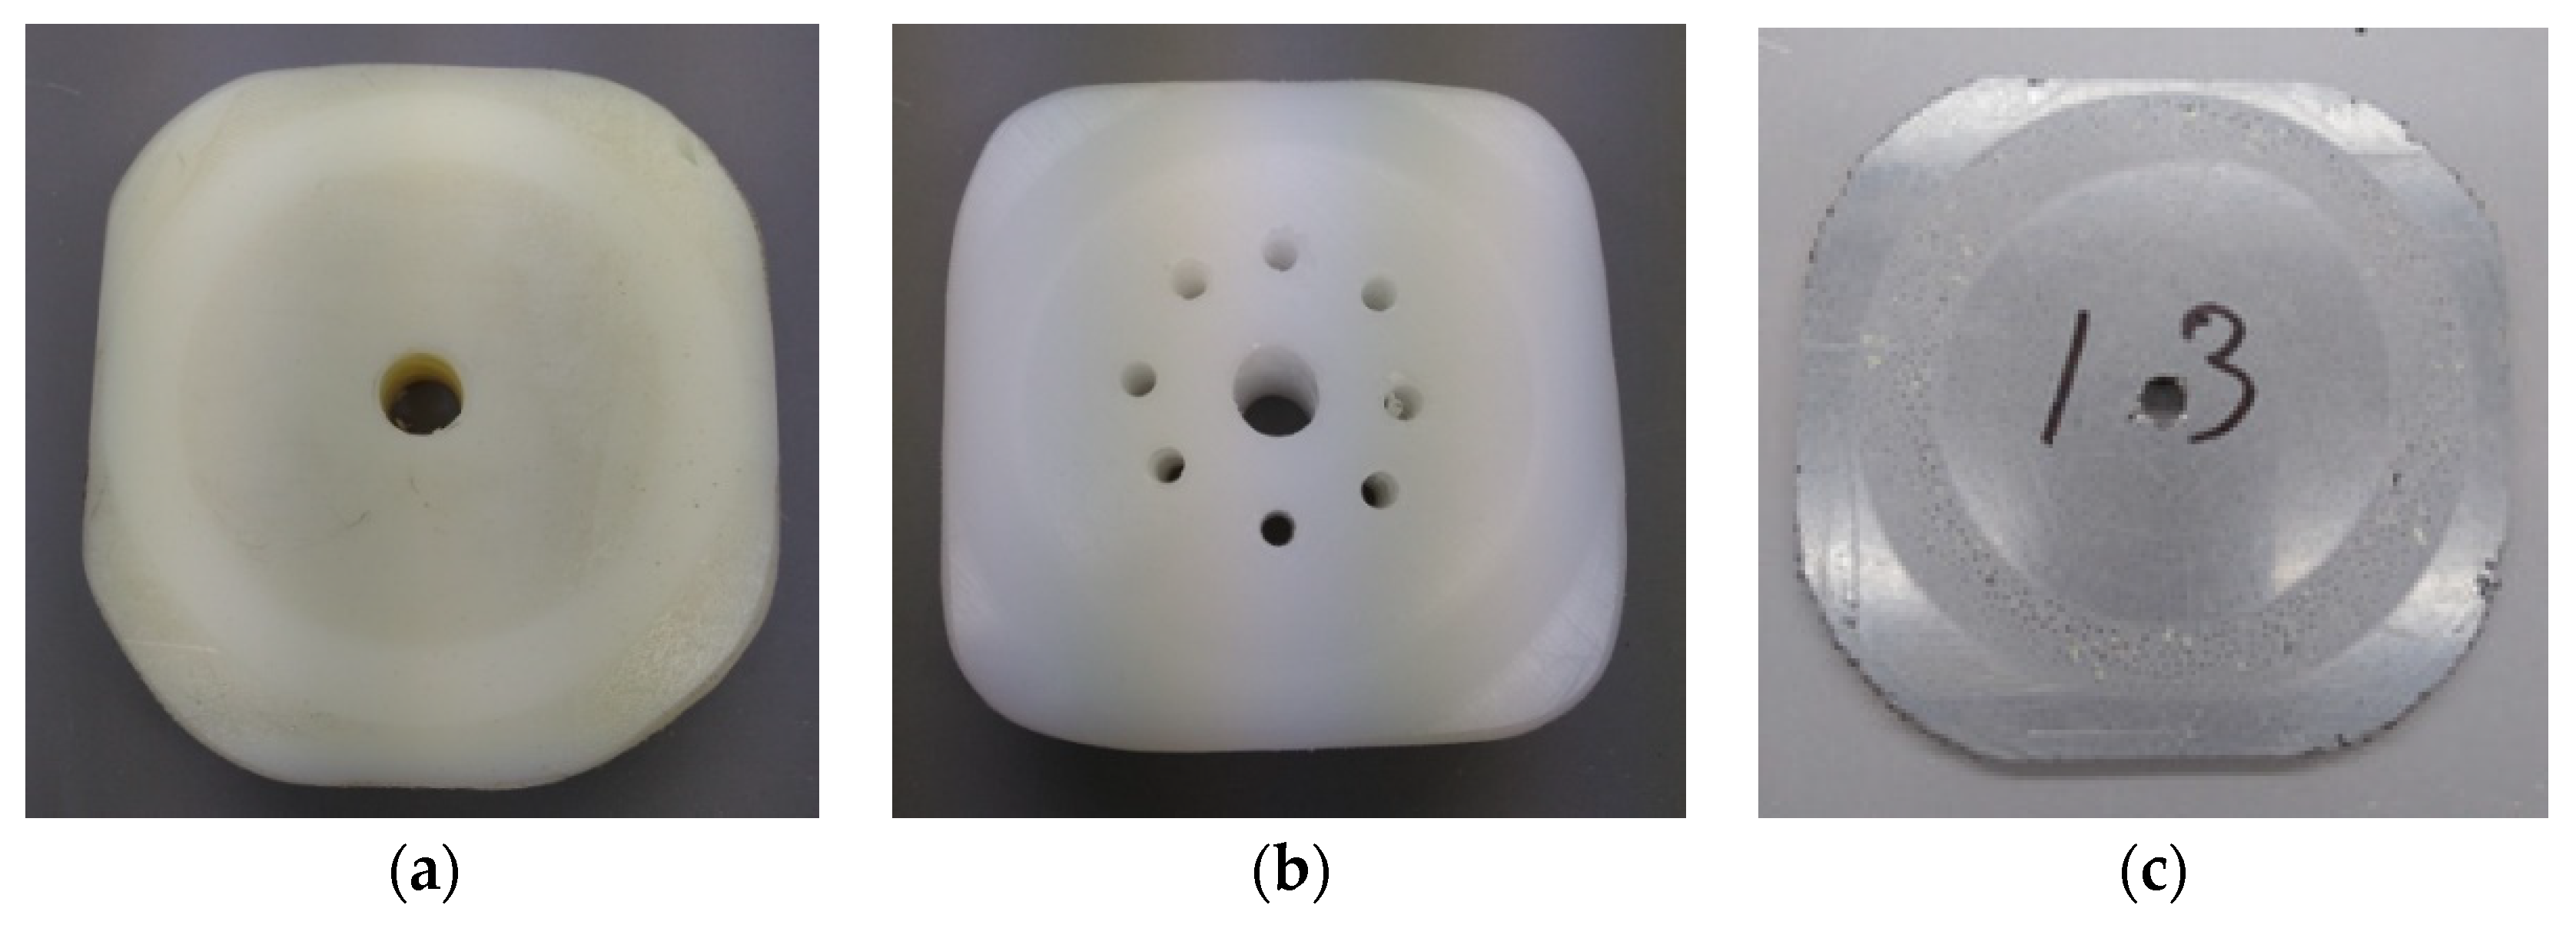
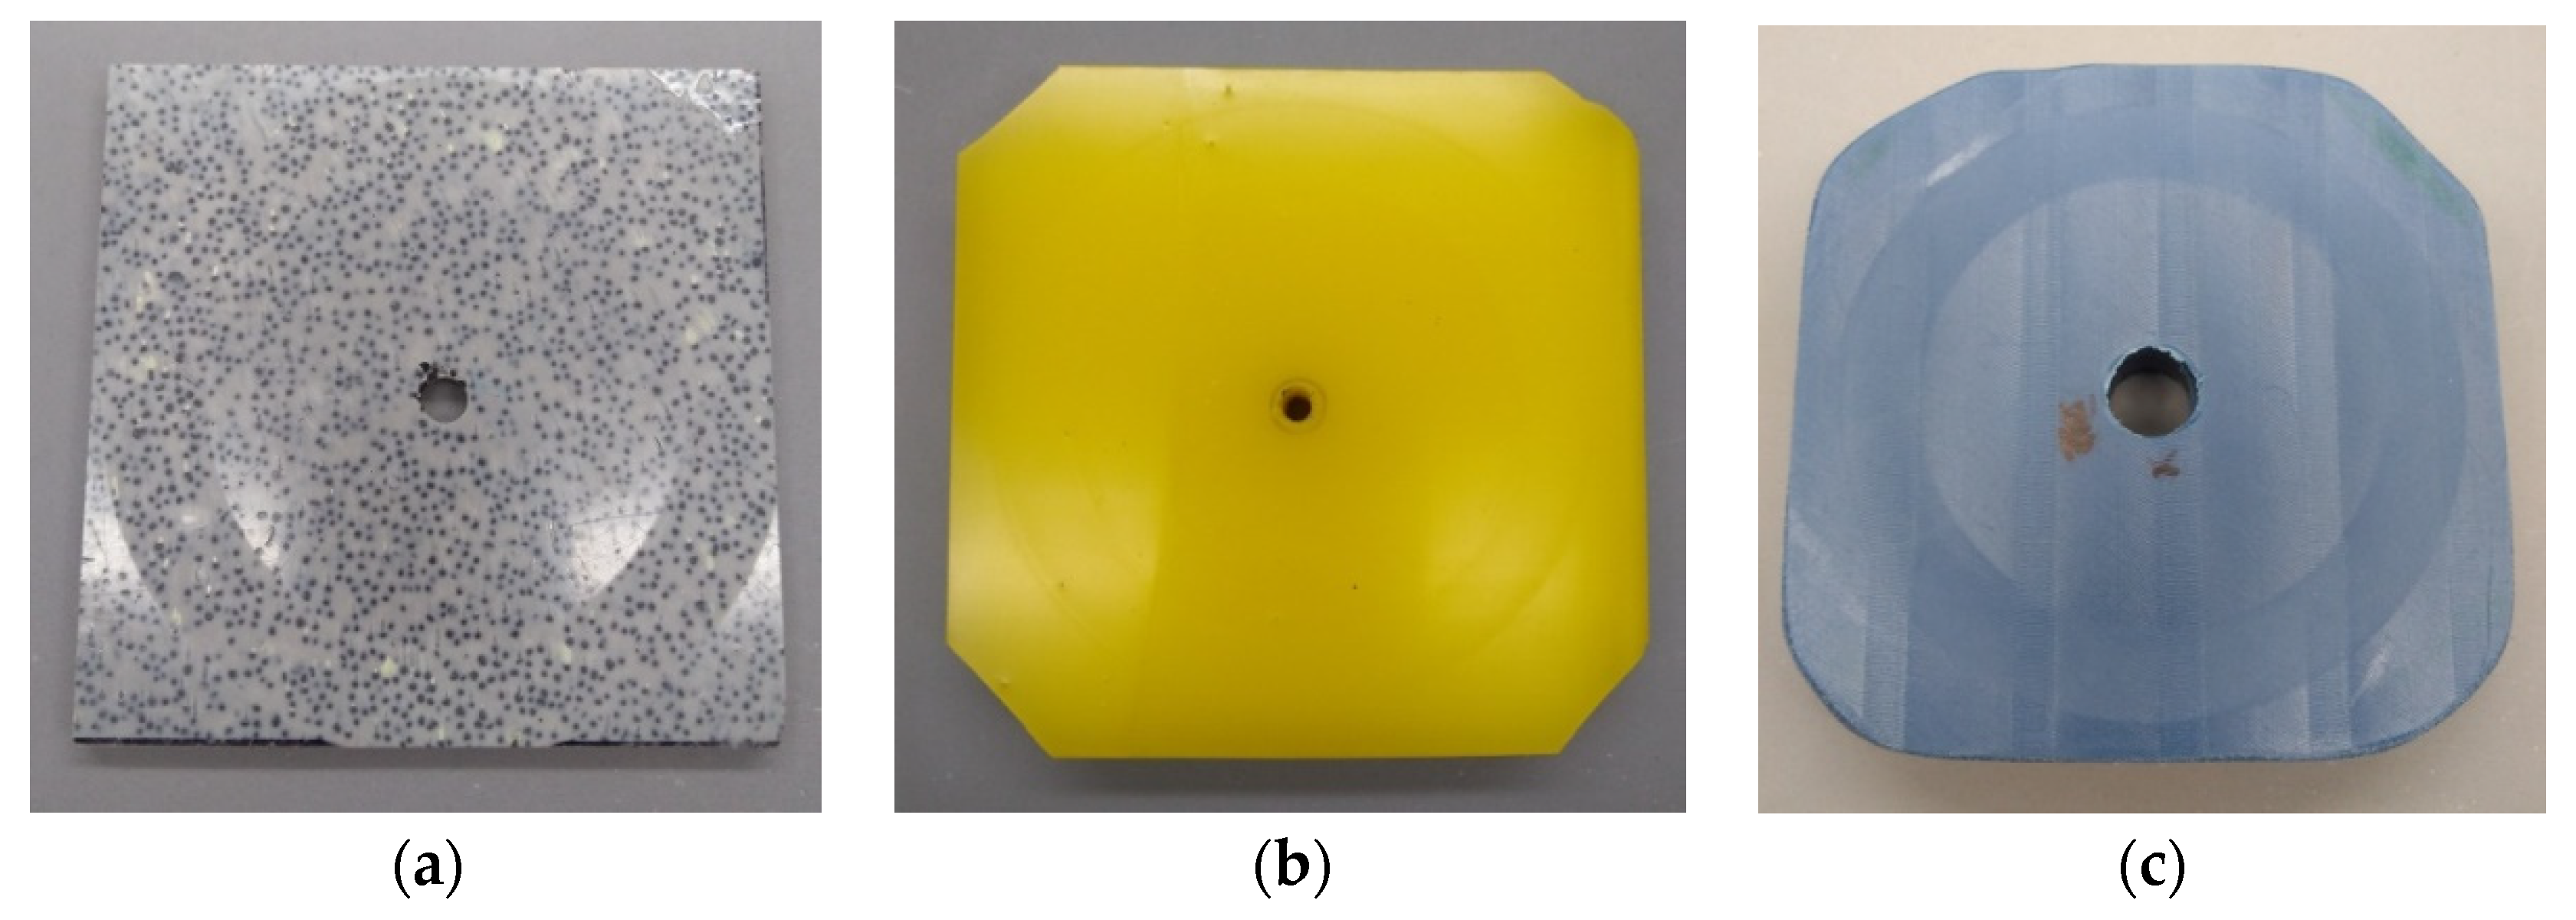
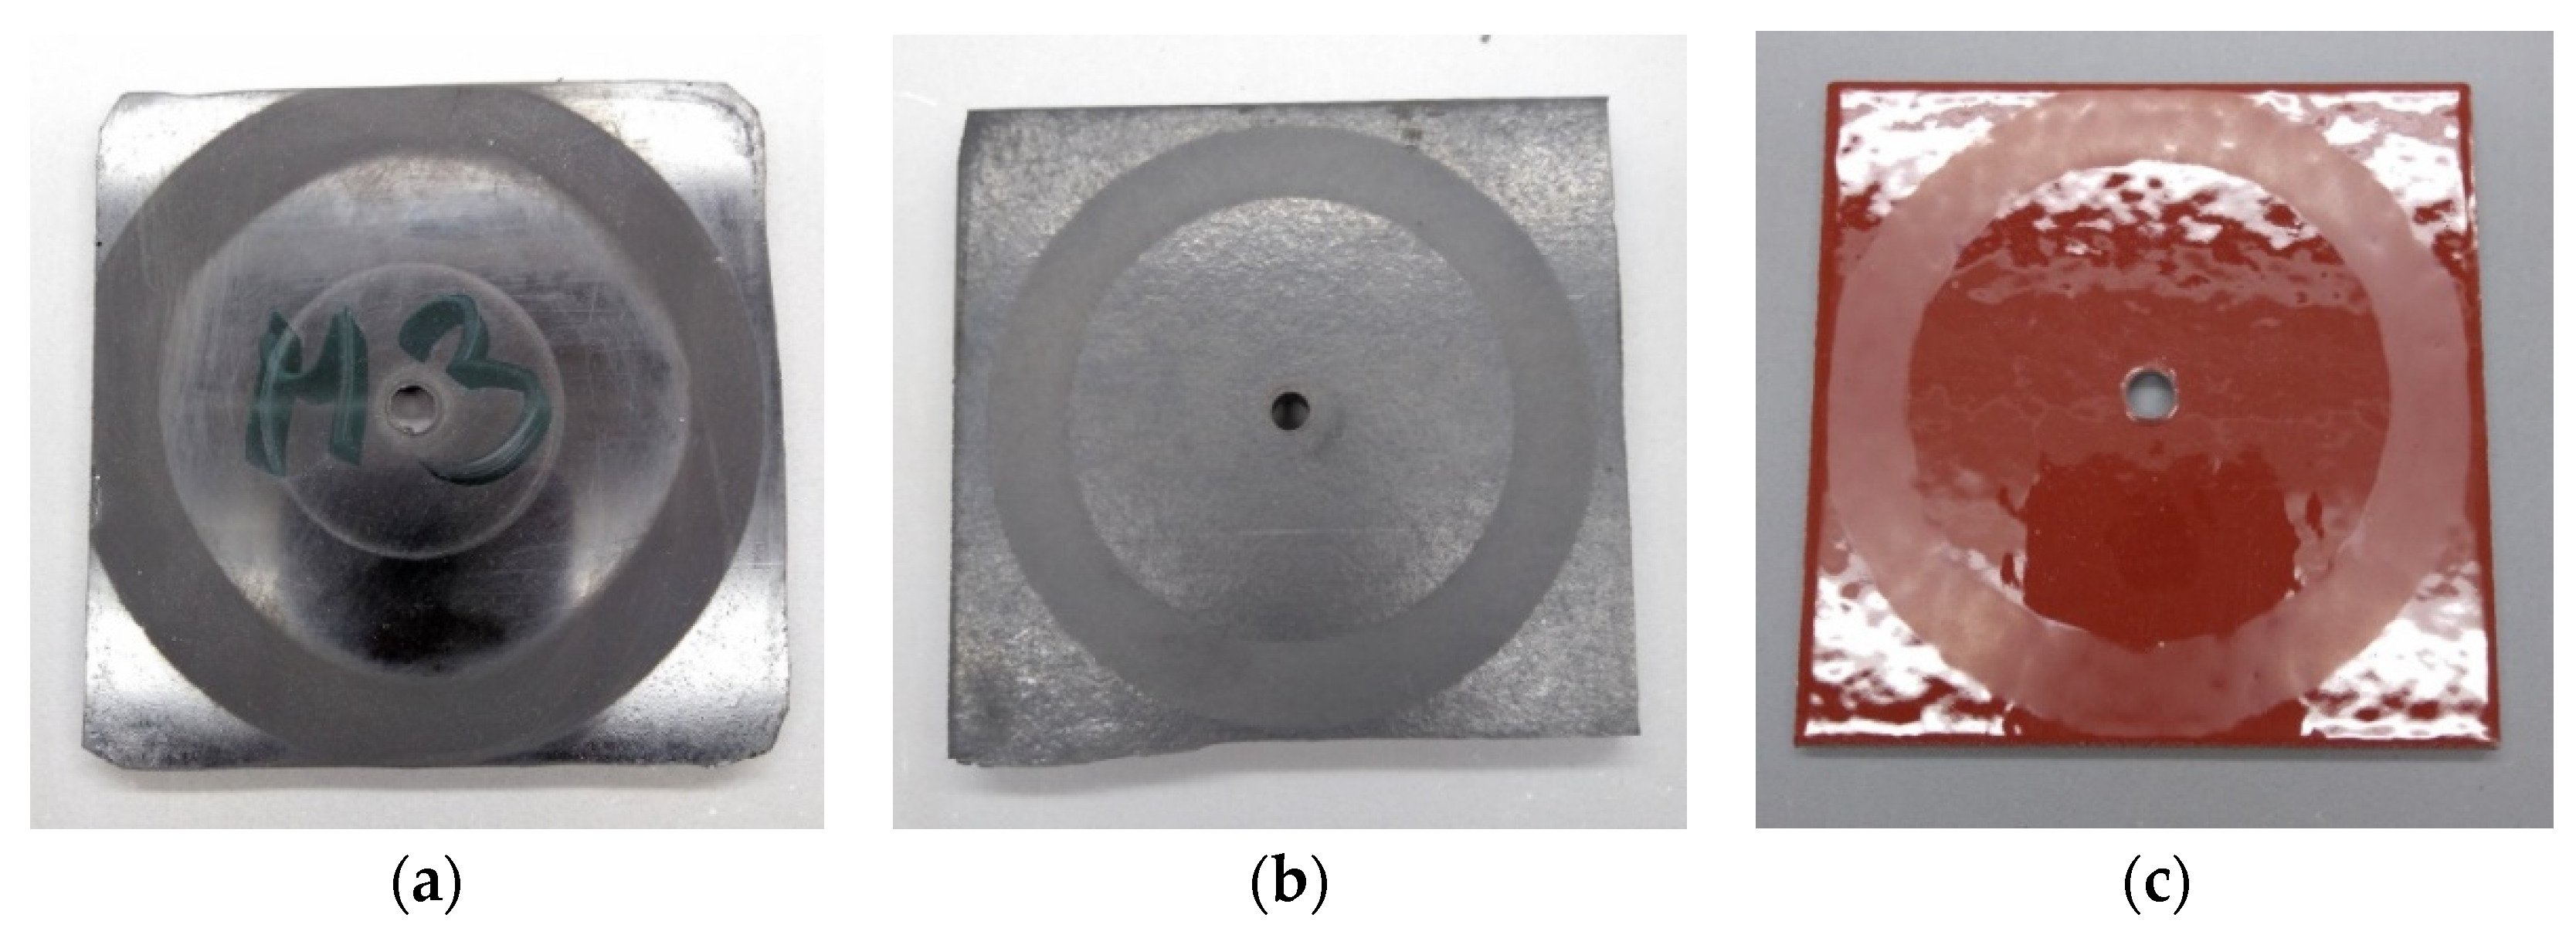
2.1. Determination of Abrasion Resistance of Protective Coatings and Wear Linings—Laboratory Tests
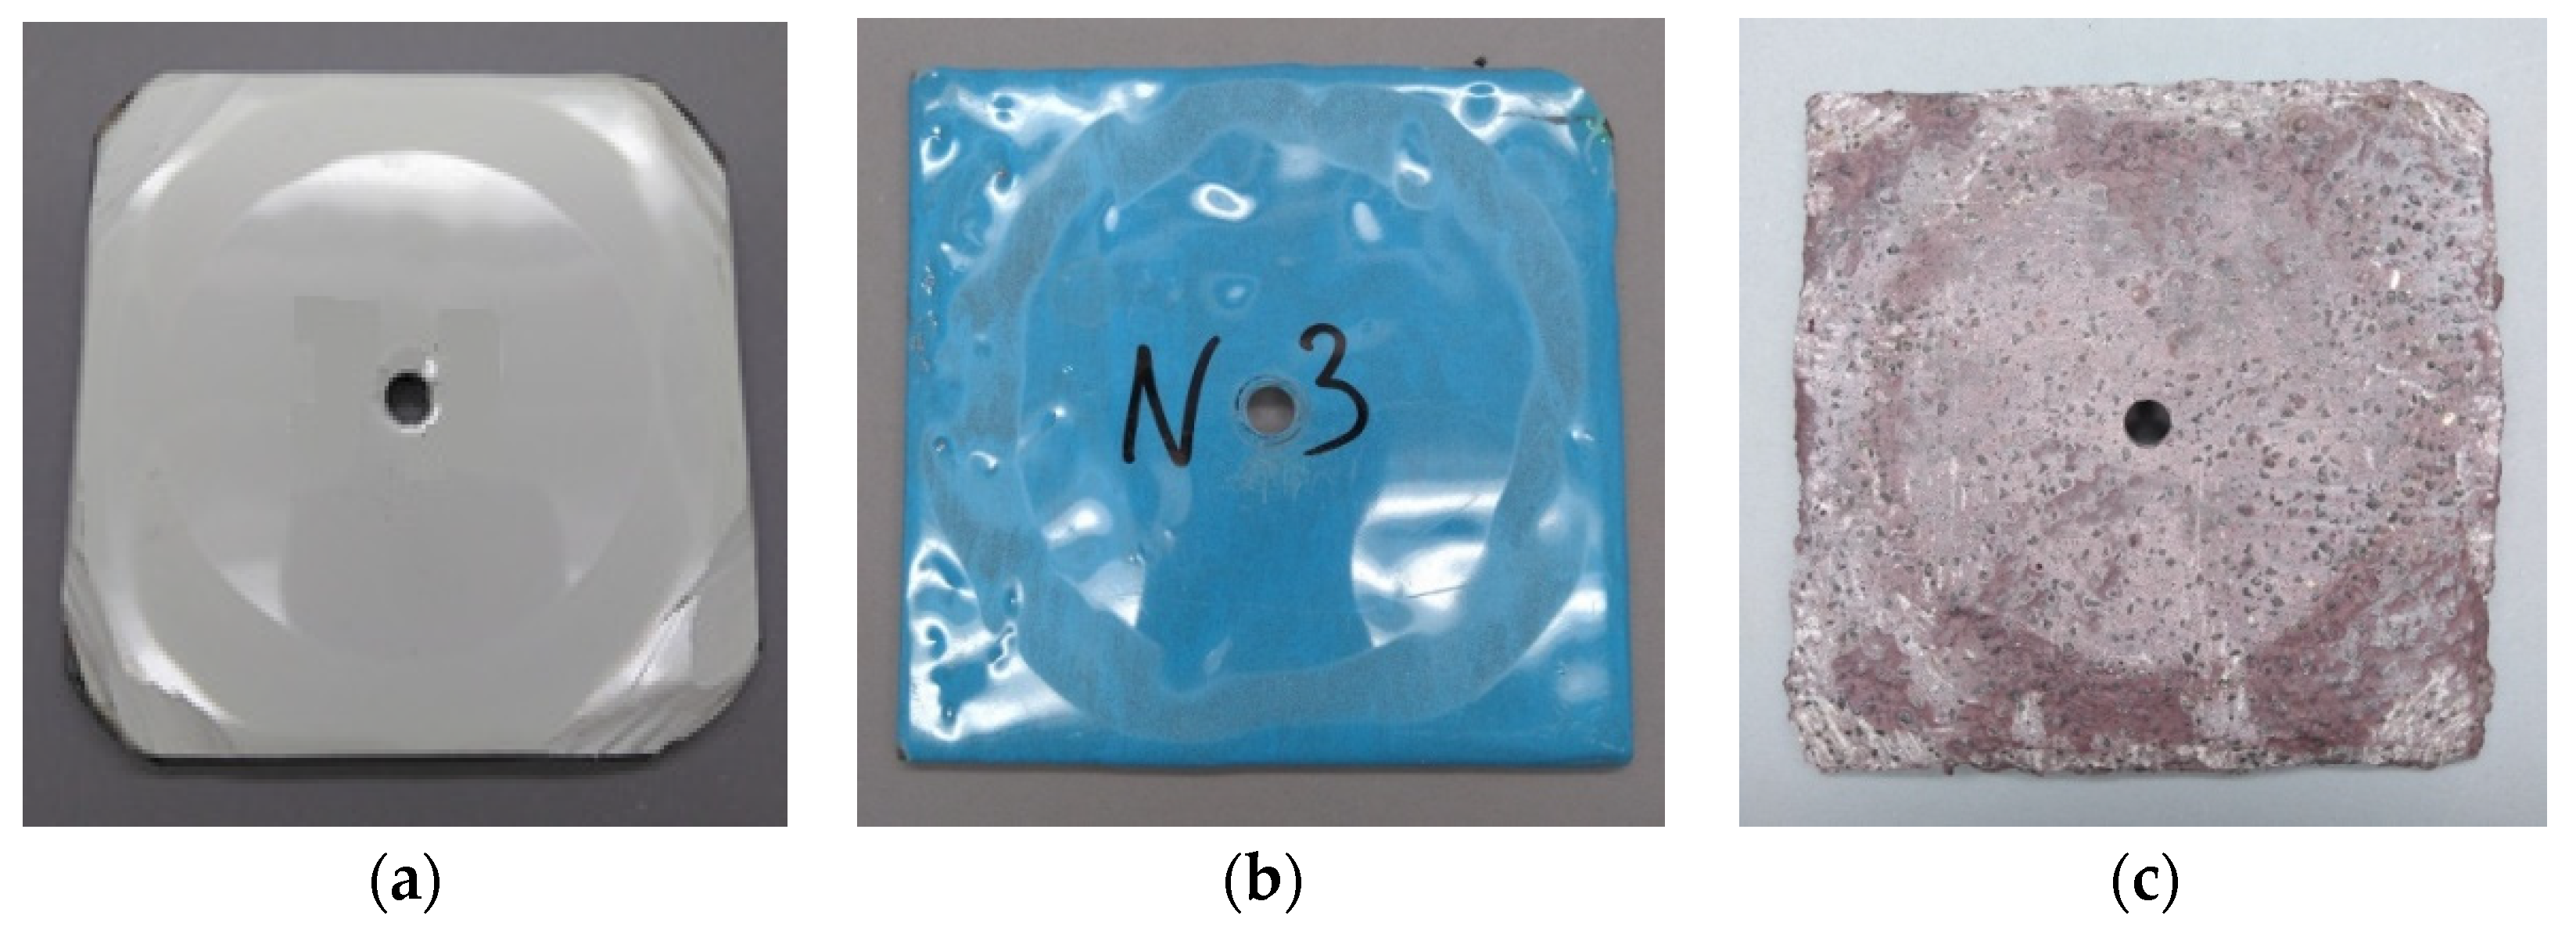
2.1.1. Mass Measurement of Coating Samples
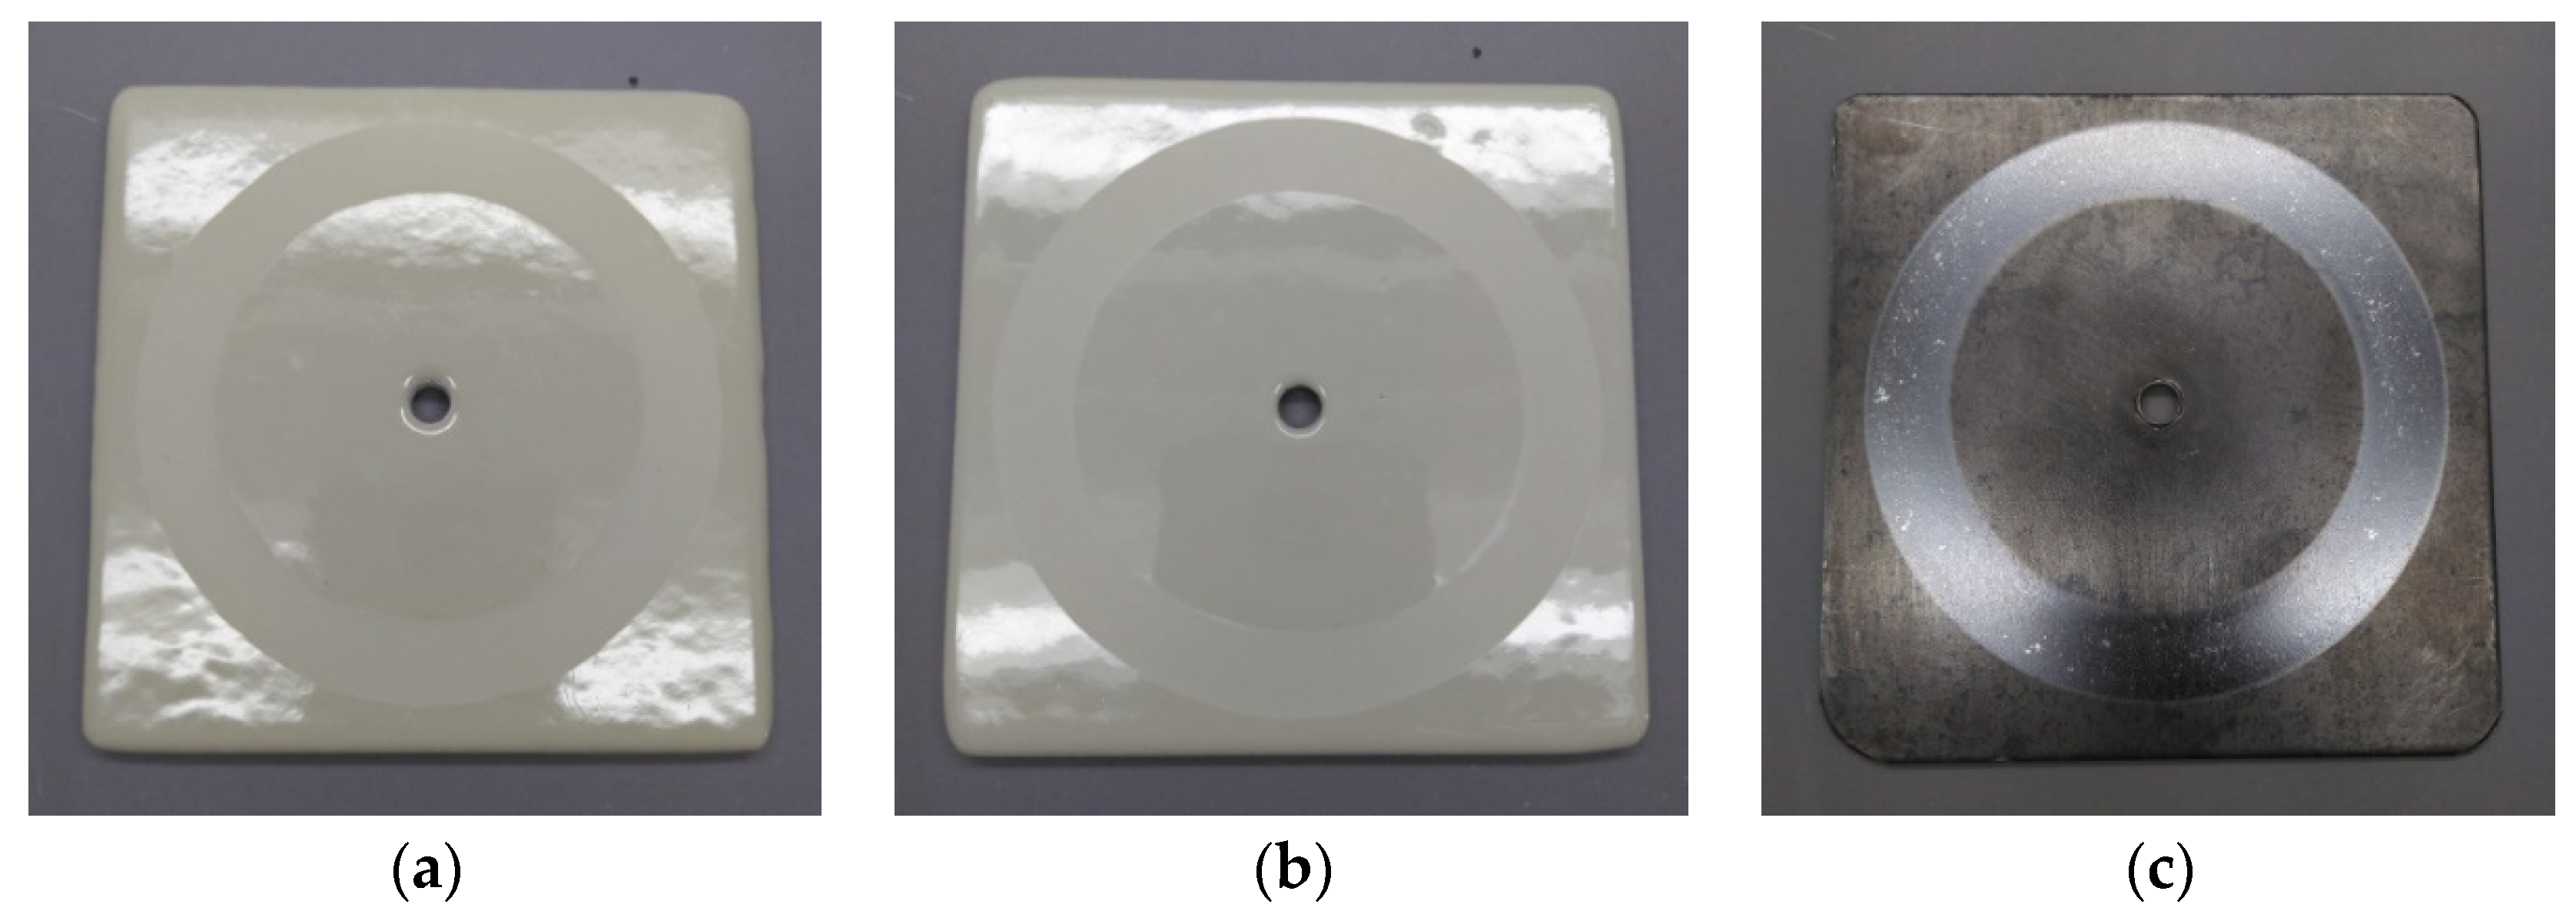
2.1.2. Measuring the Thickness of Tested Coating Samples
2.1.3. Research Methodology
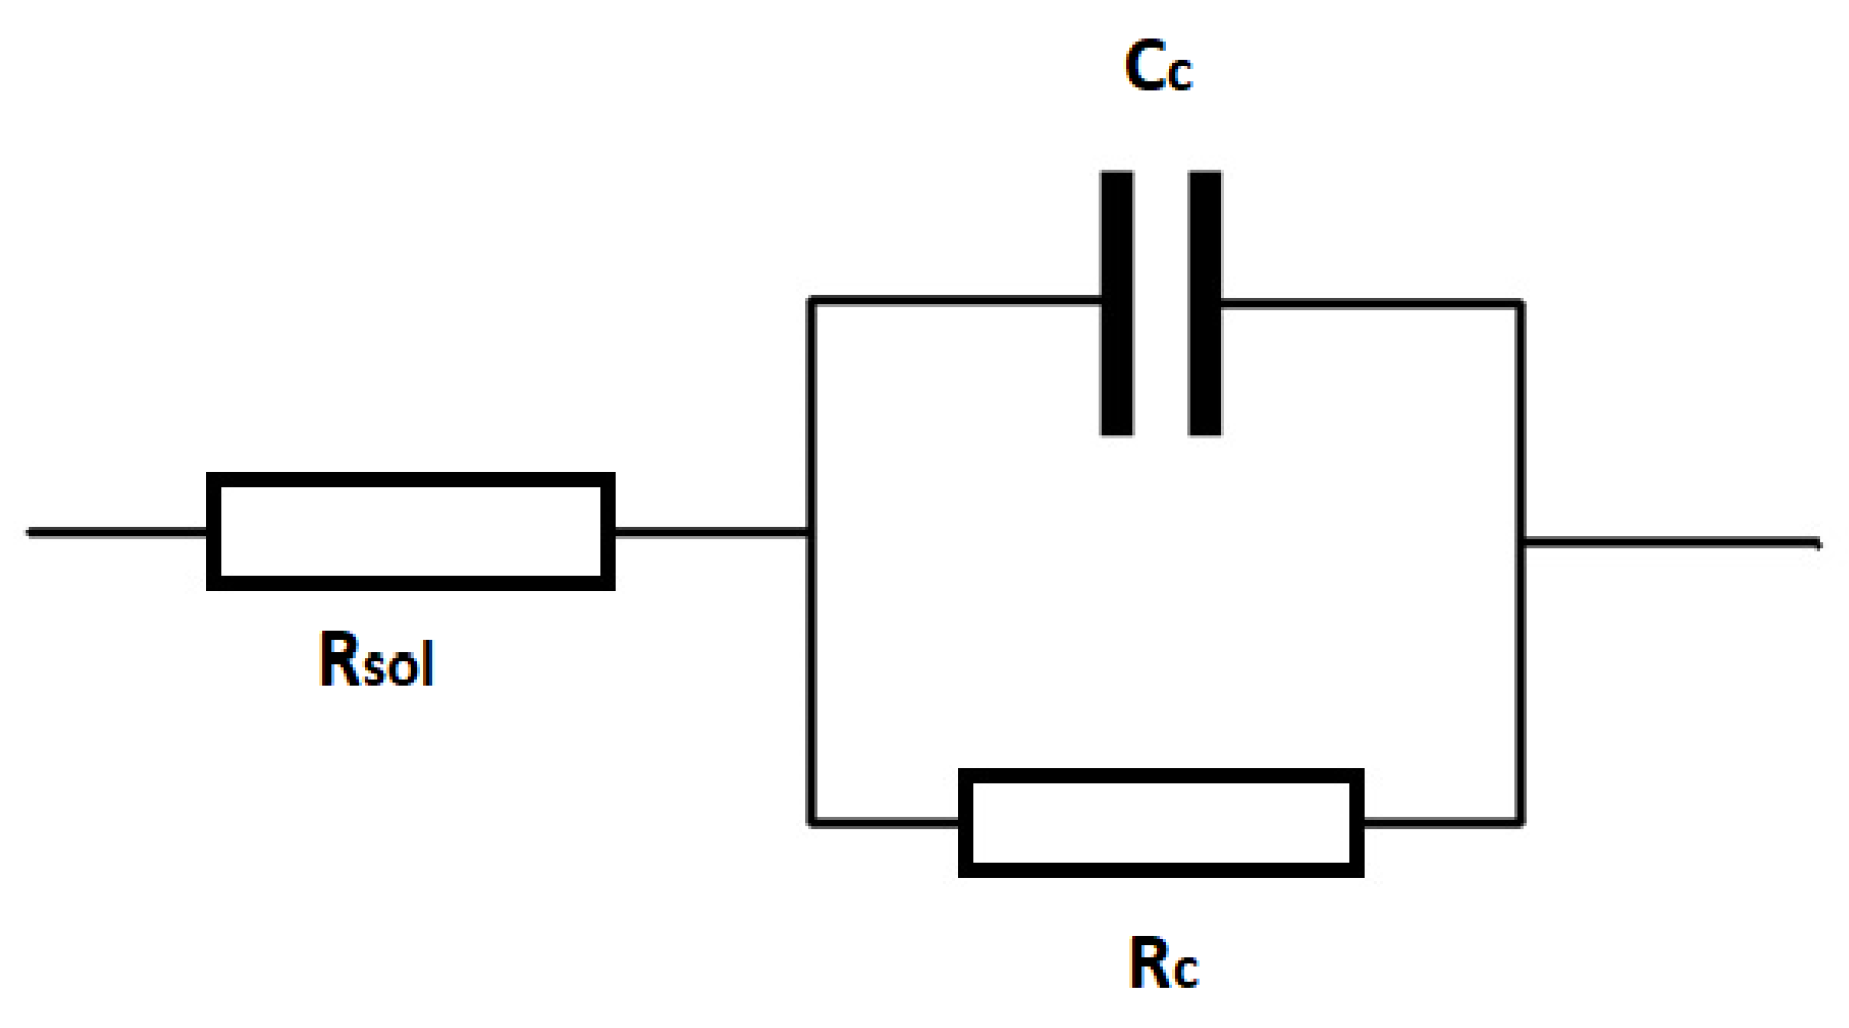
2.2. Determination of Resistance of Coatings by Electrochemical Impedance Spectroscopy (EIS)—Laboratory Testing
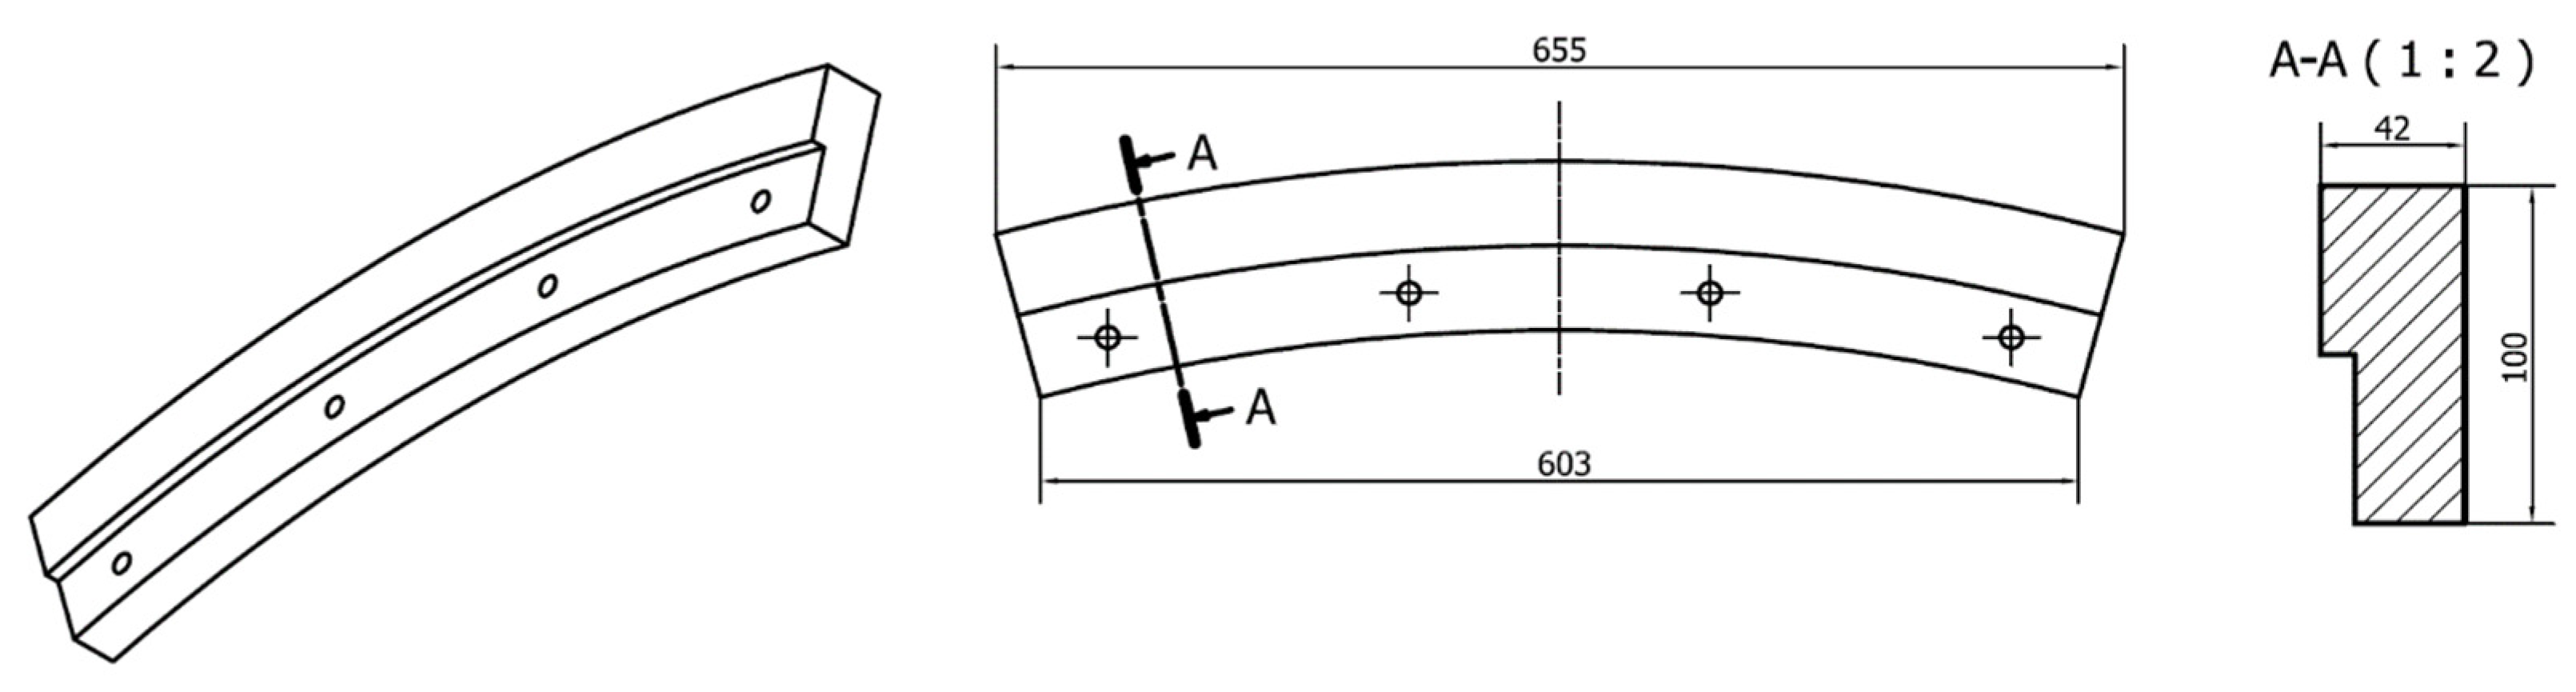
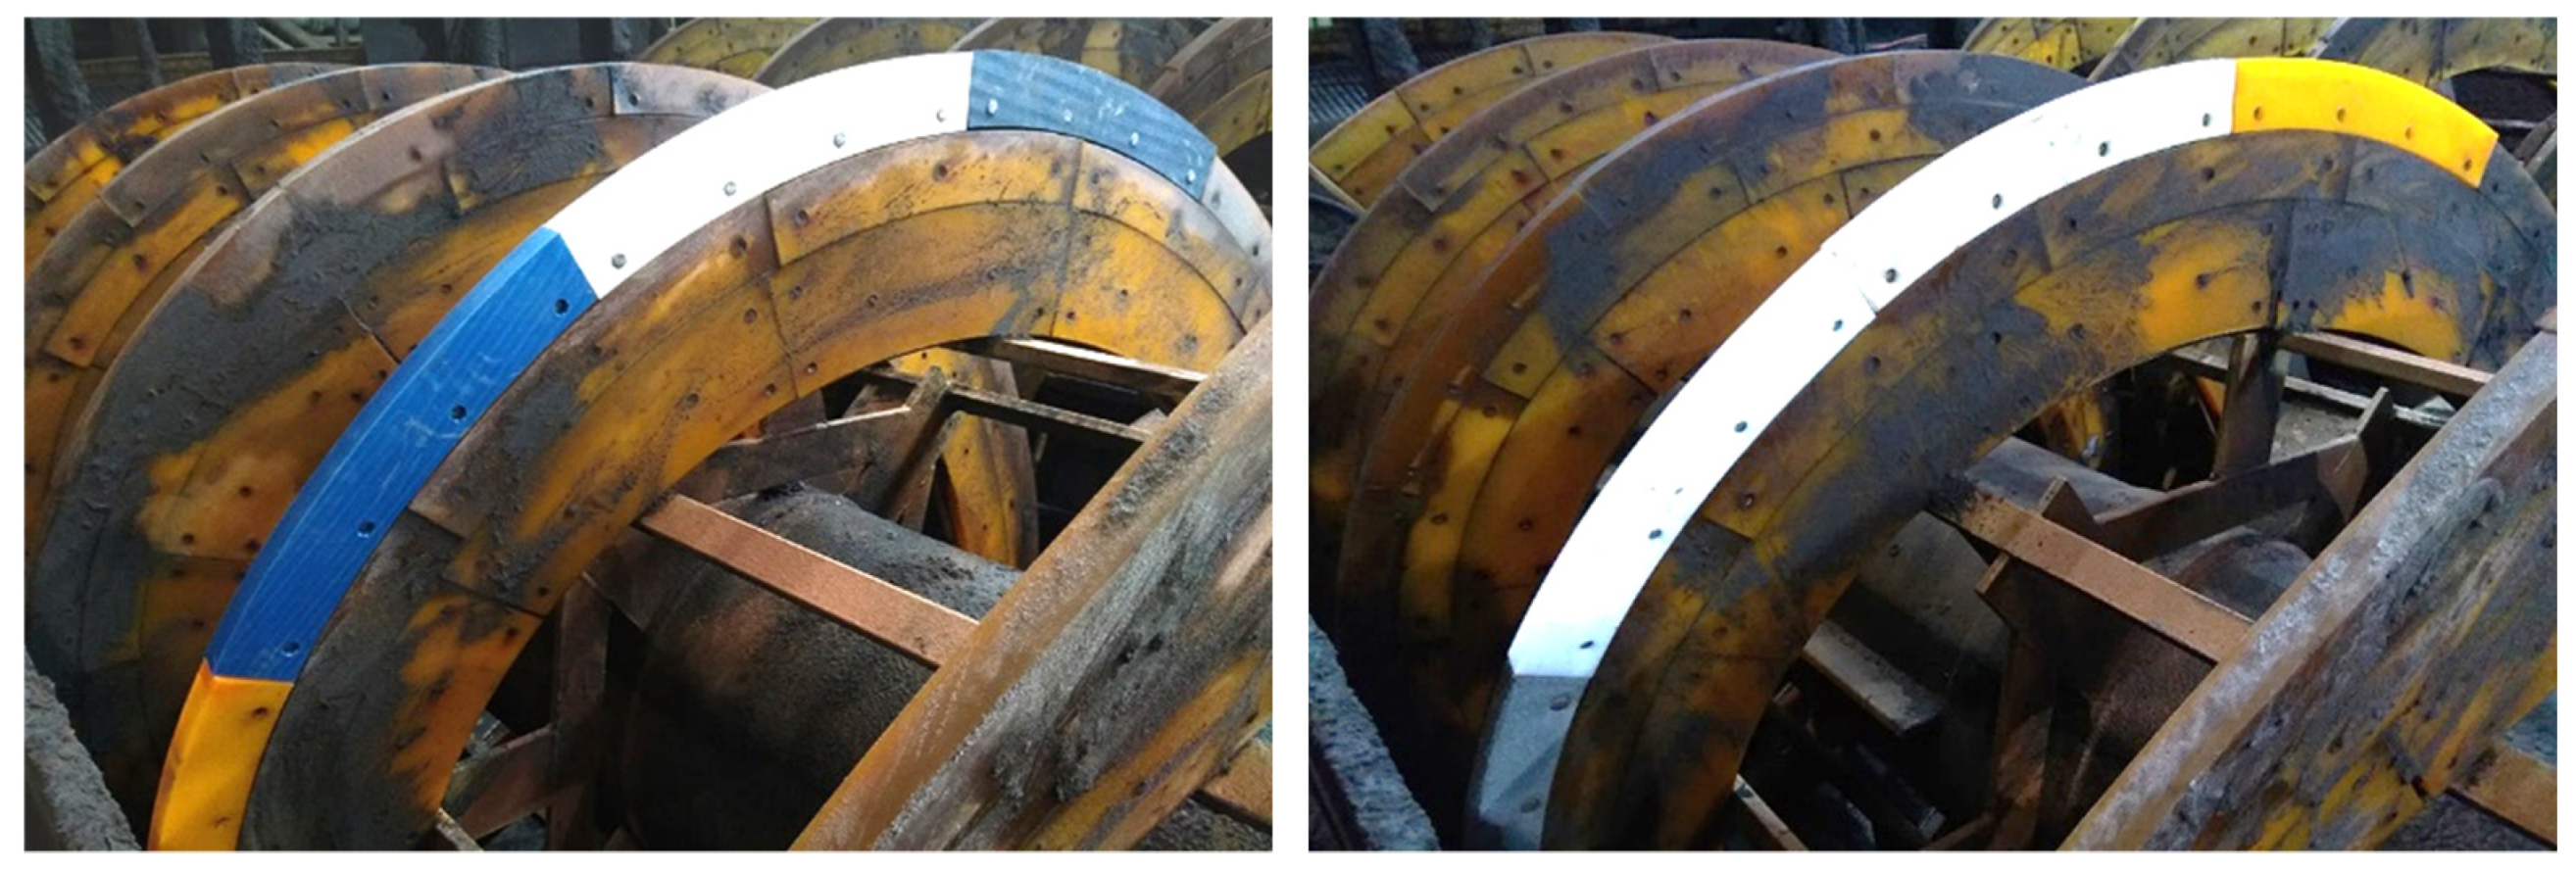
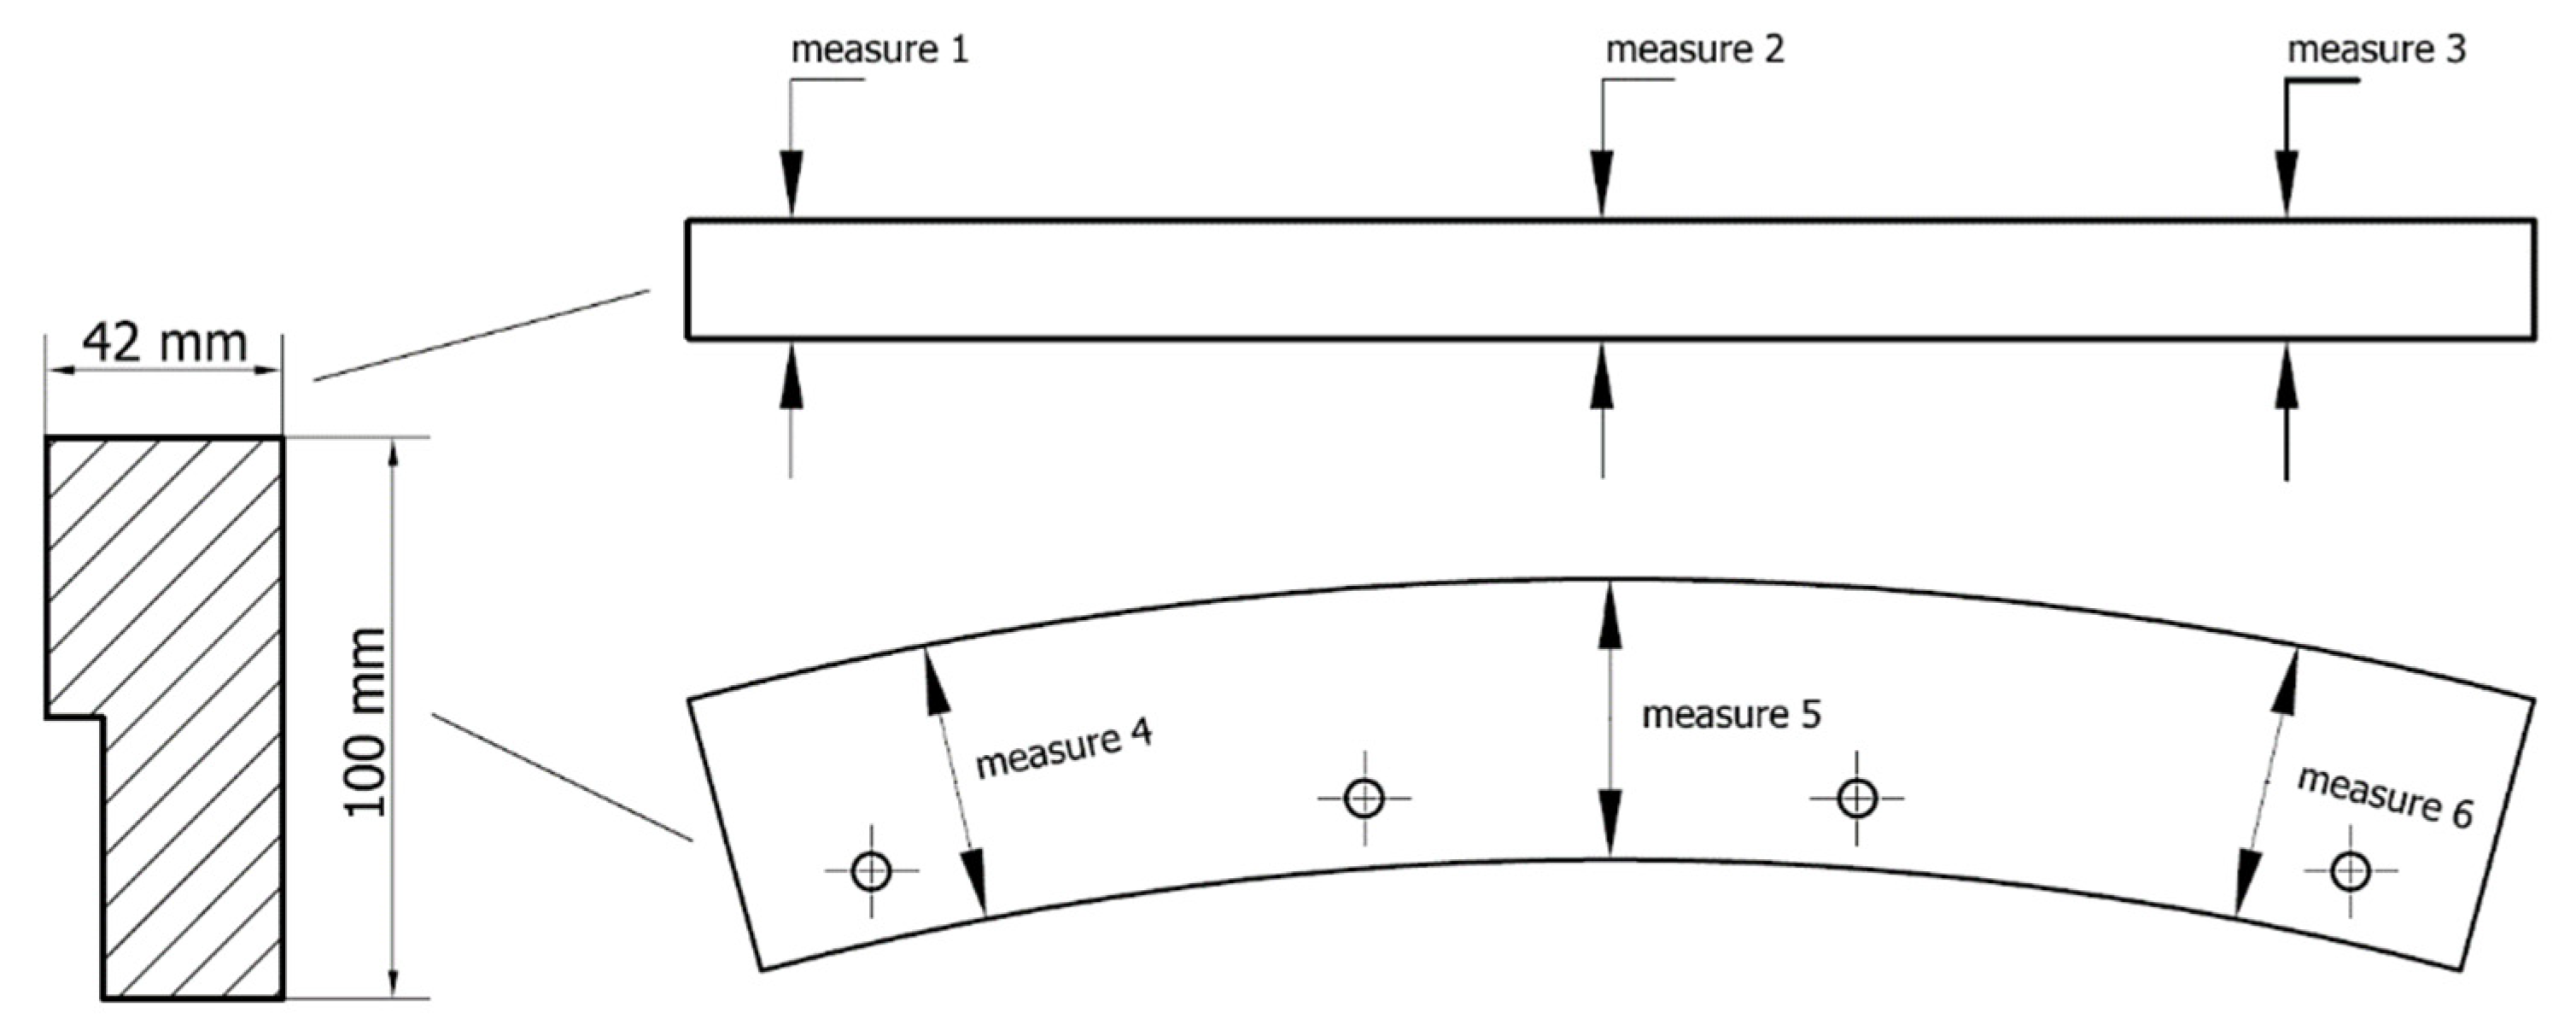
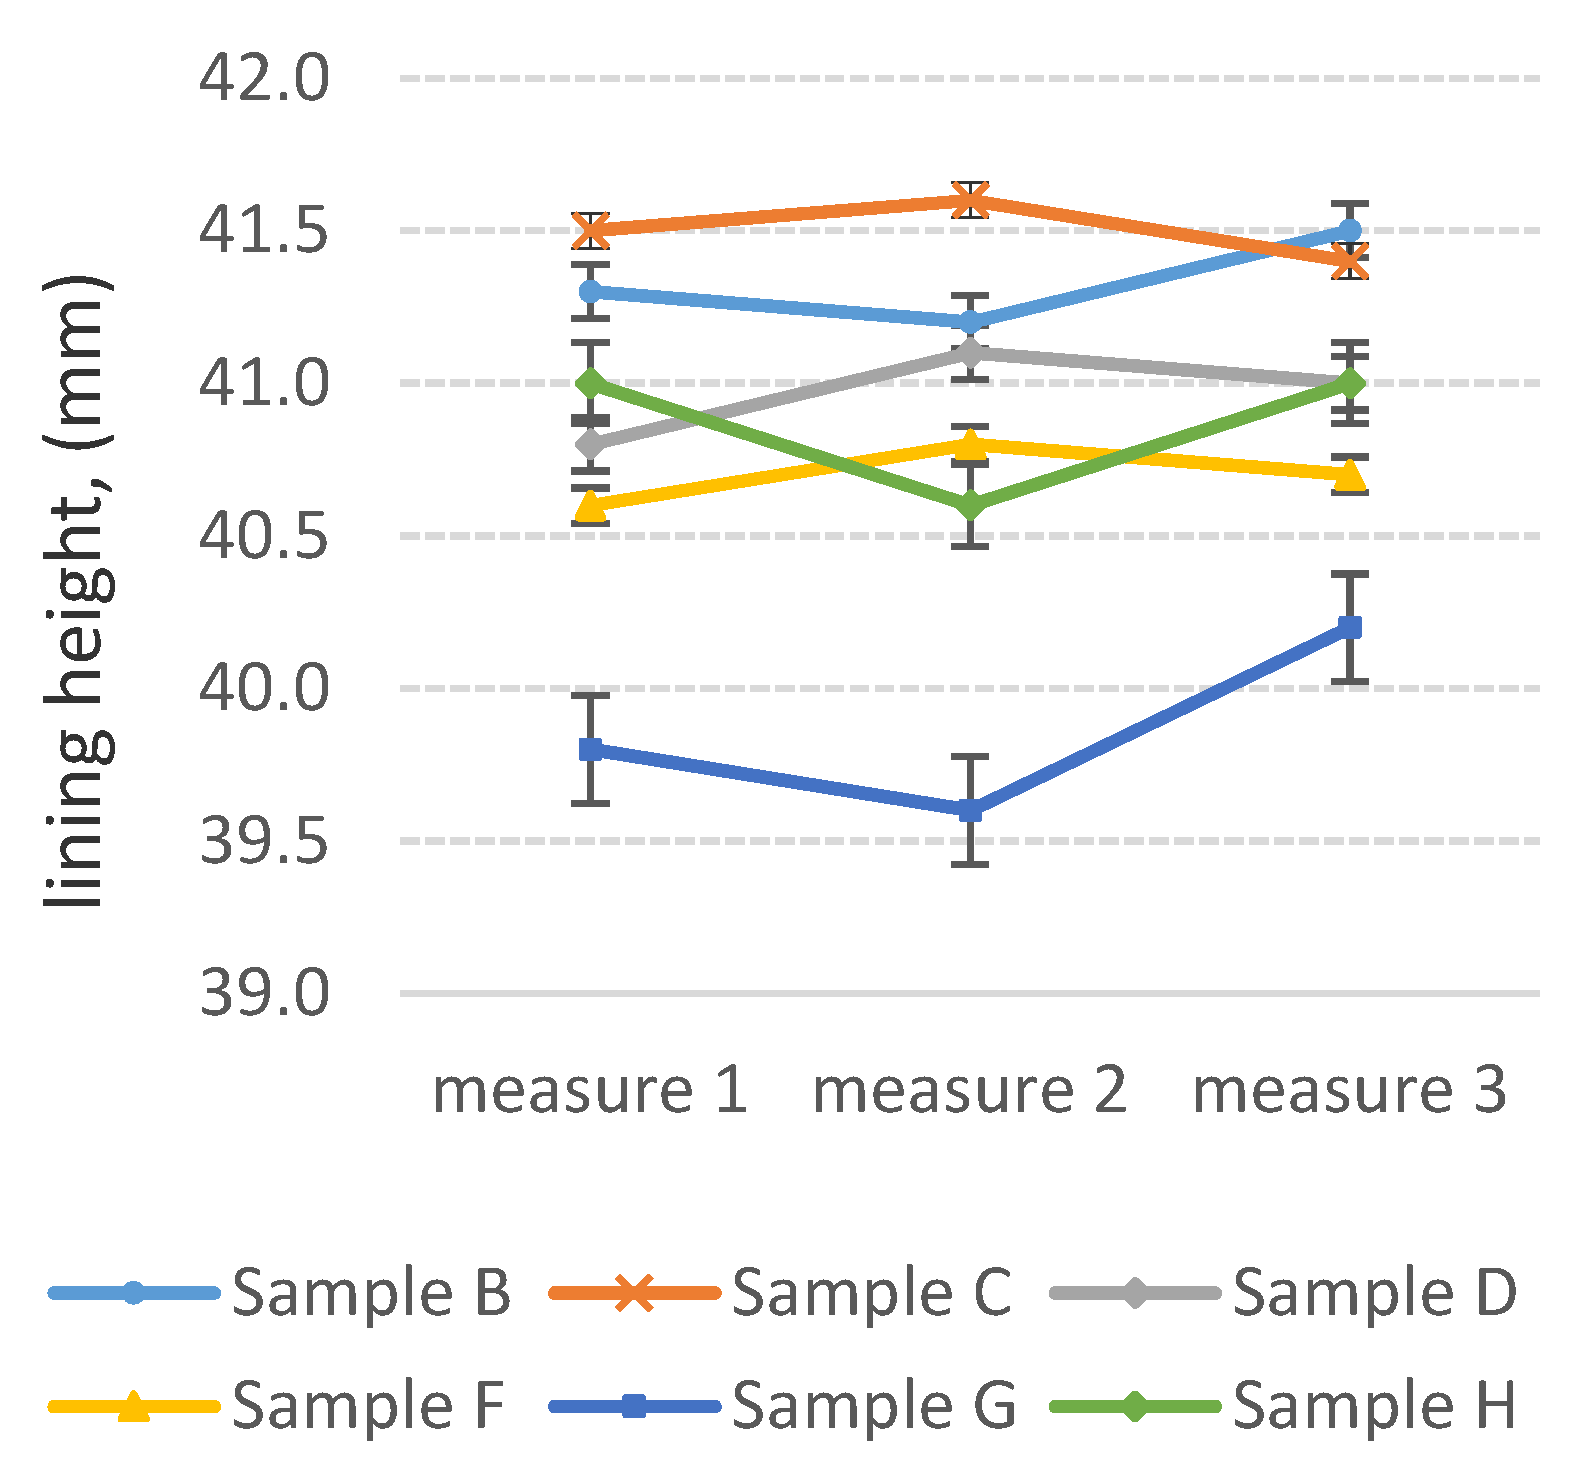
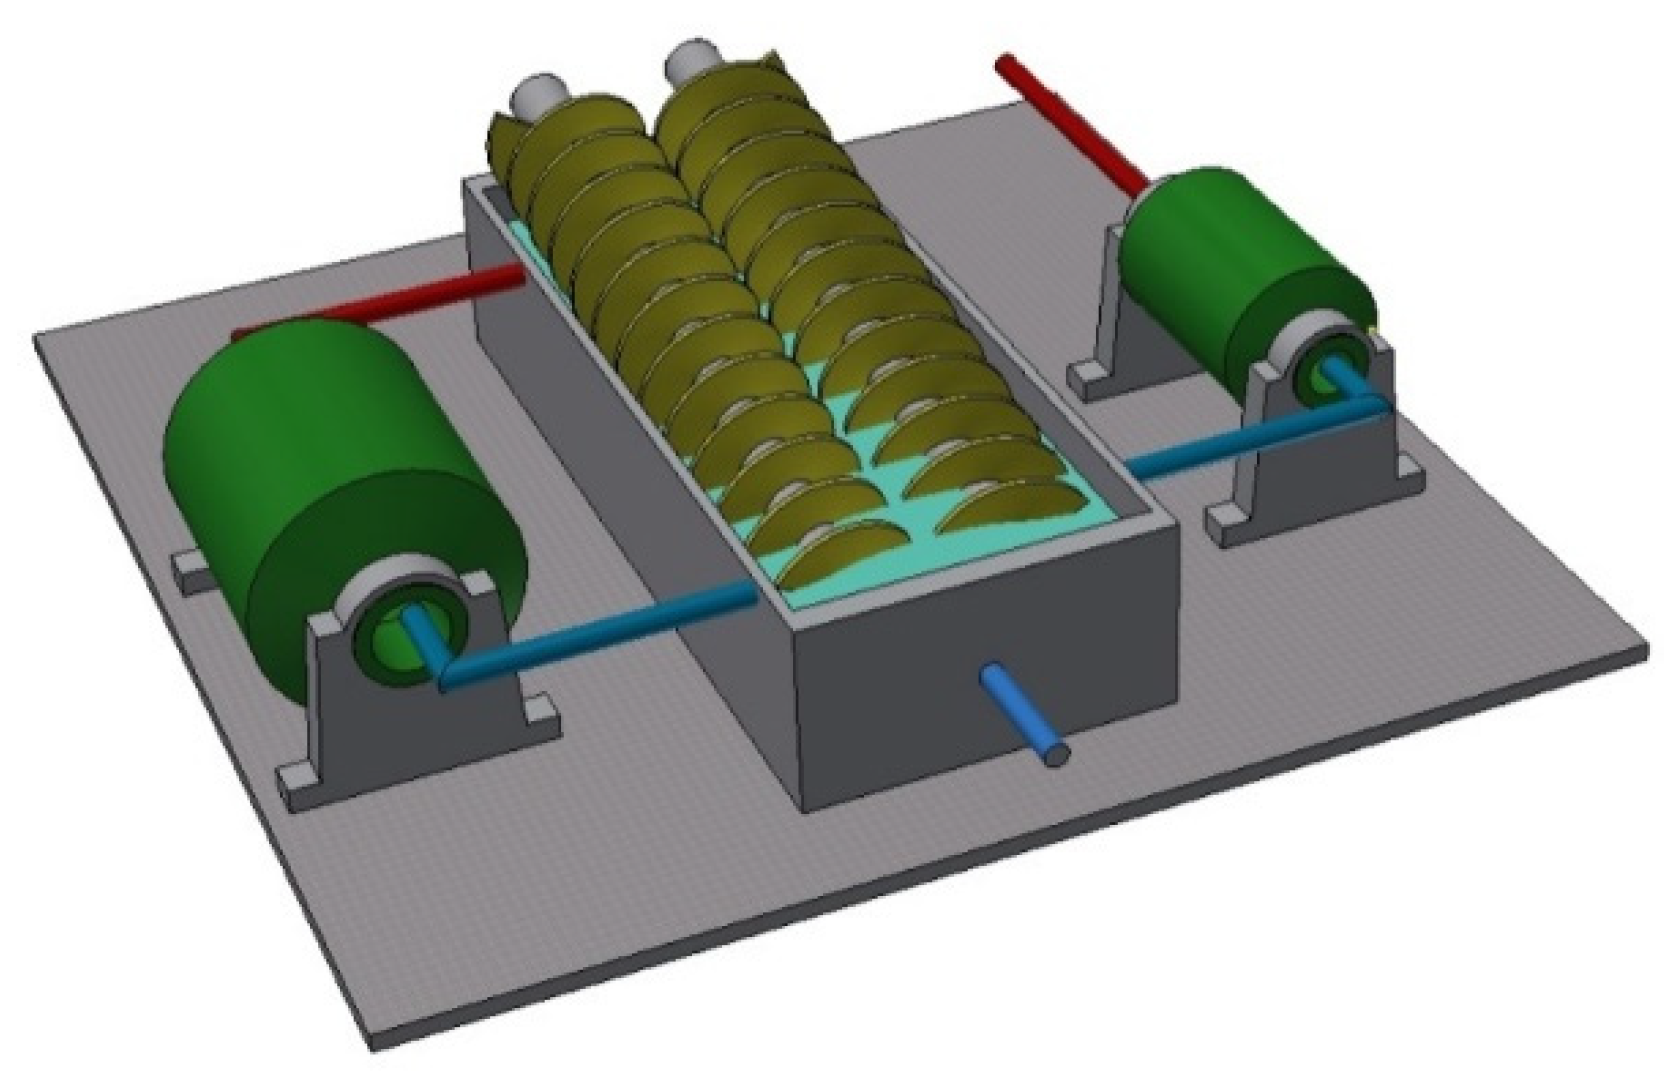
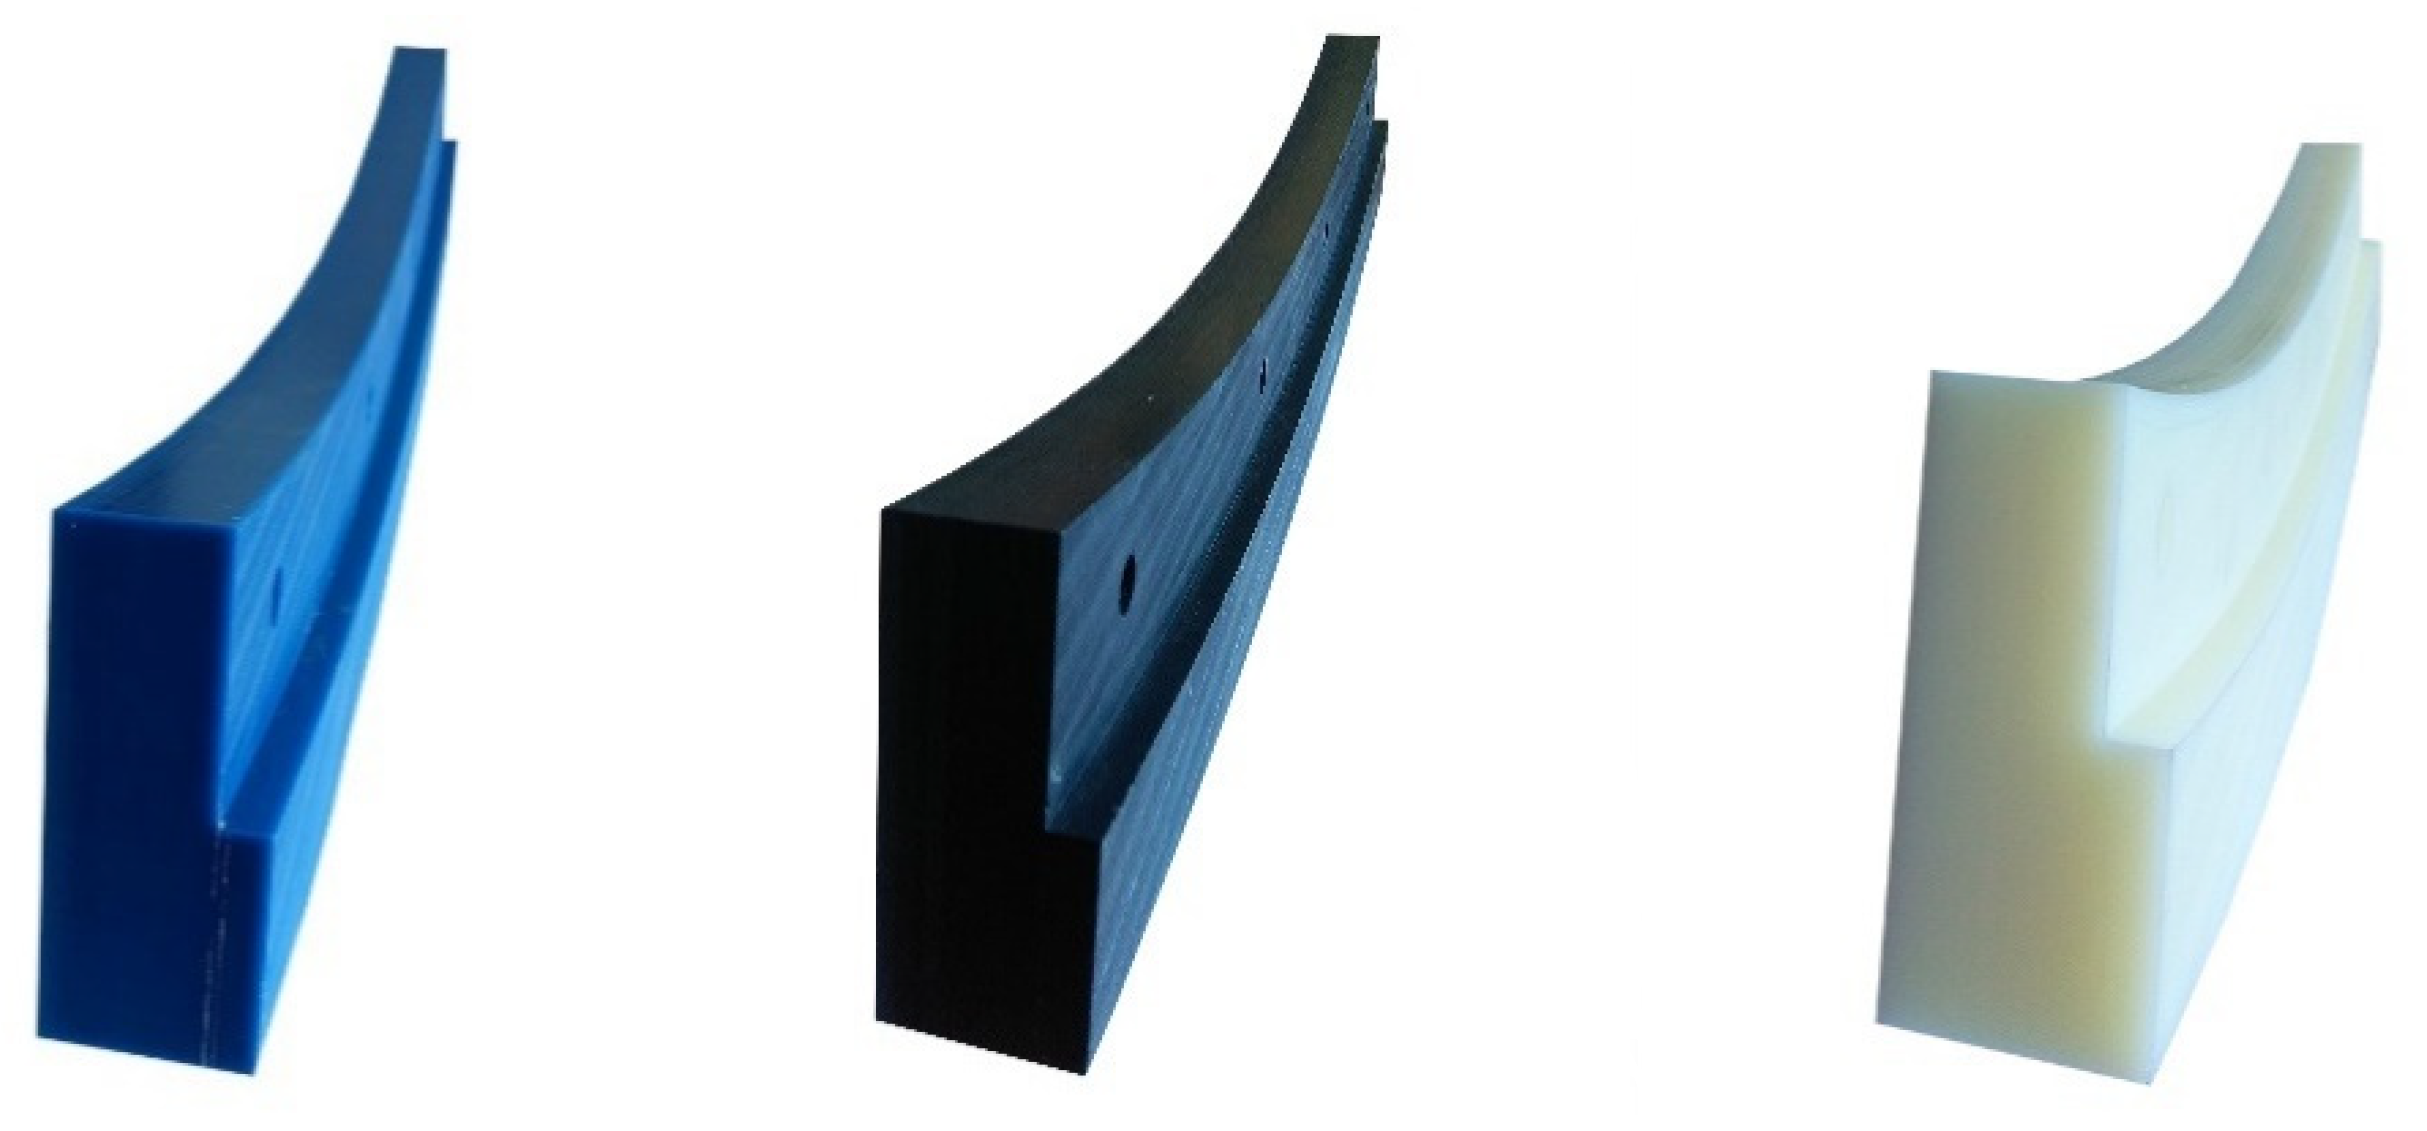
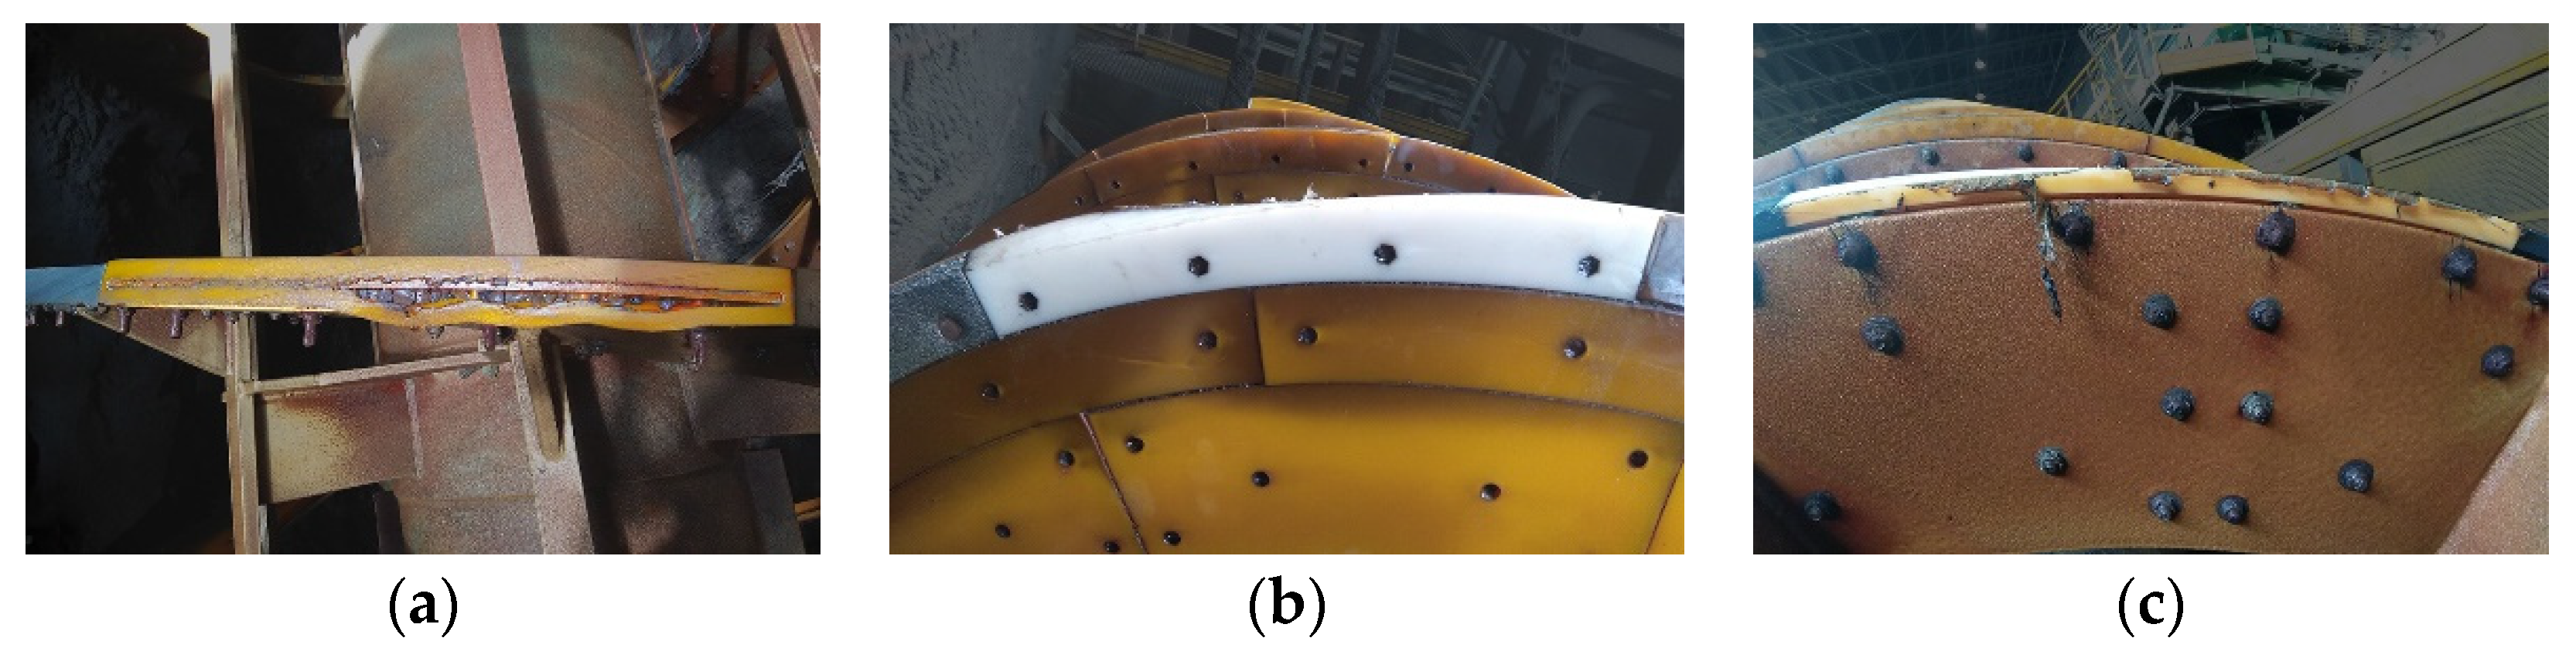
2.3. Determination of Abrasion Resistance of Wear-Resistant Linings—Industrial Tests
3. Results and Discussion
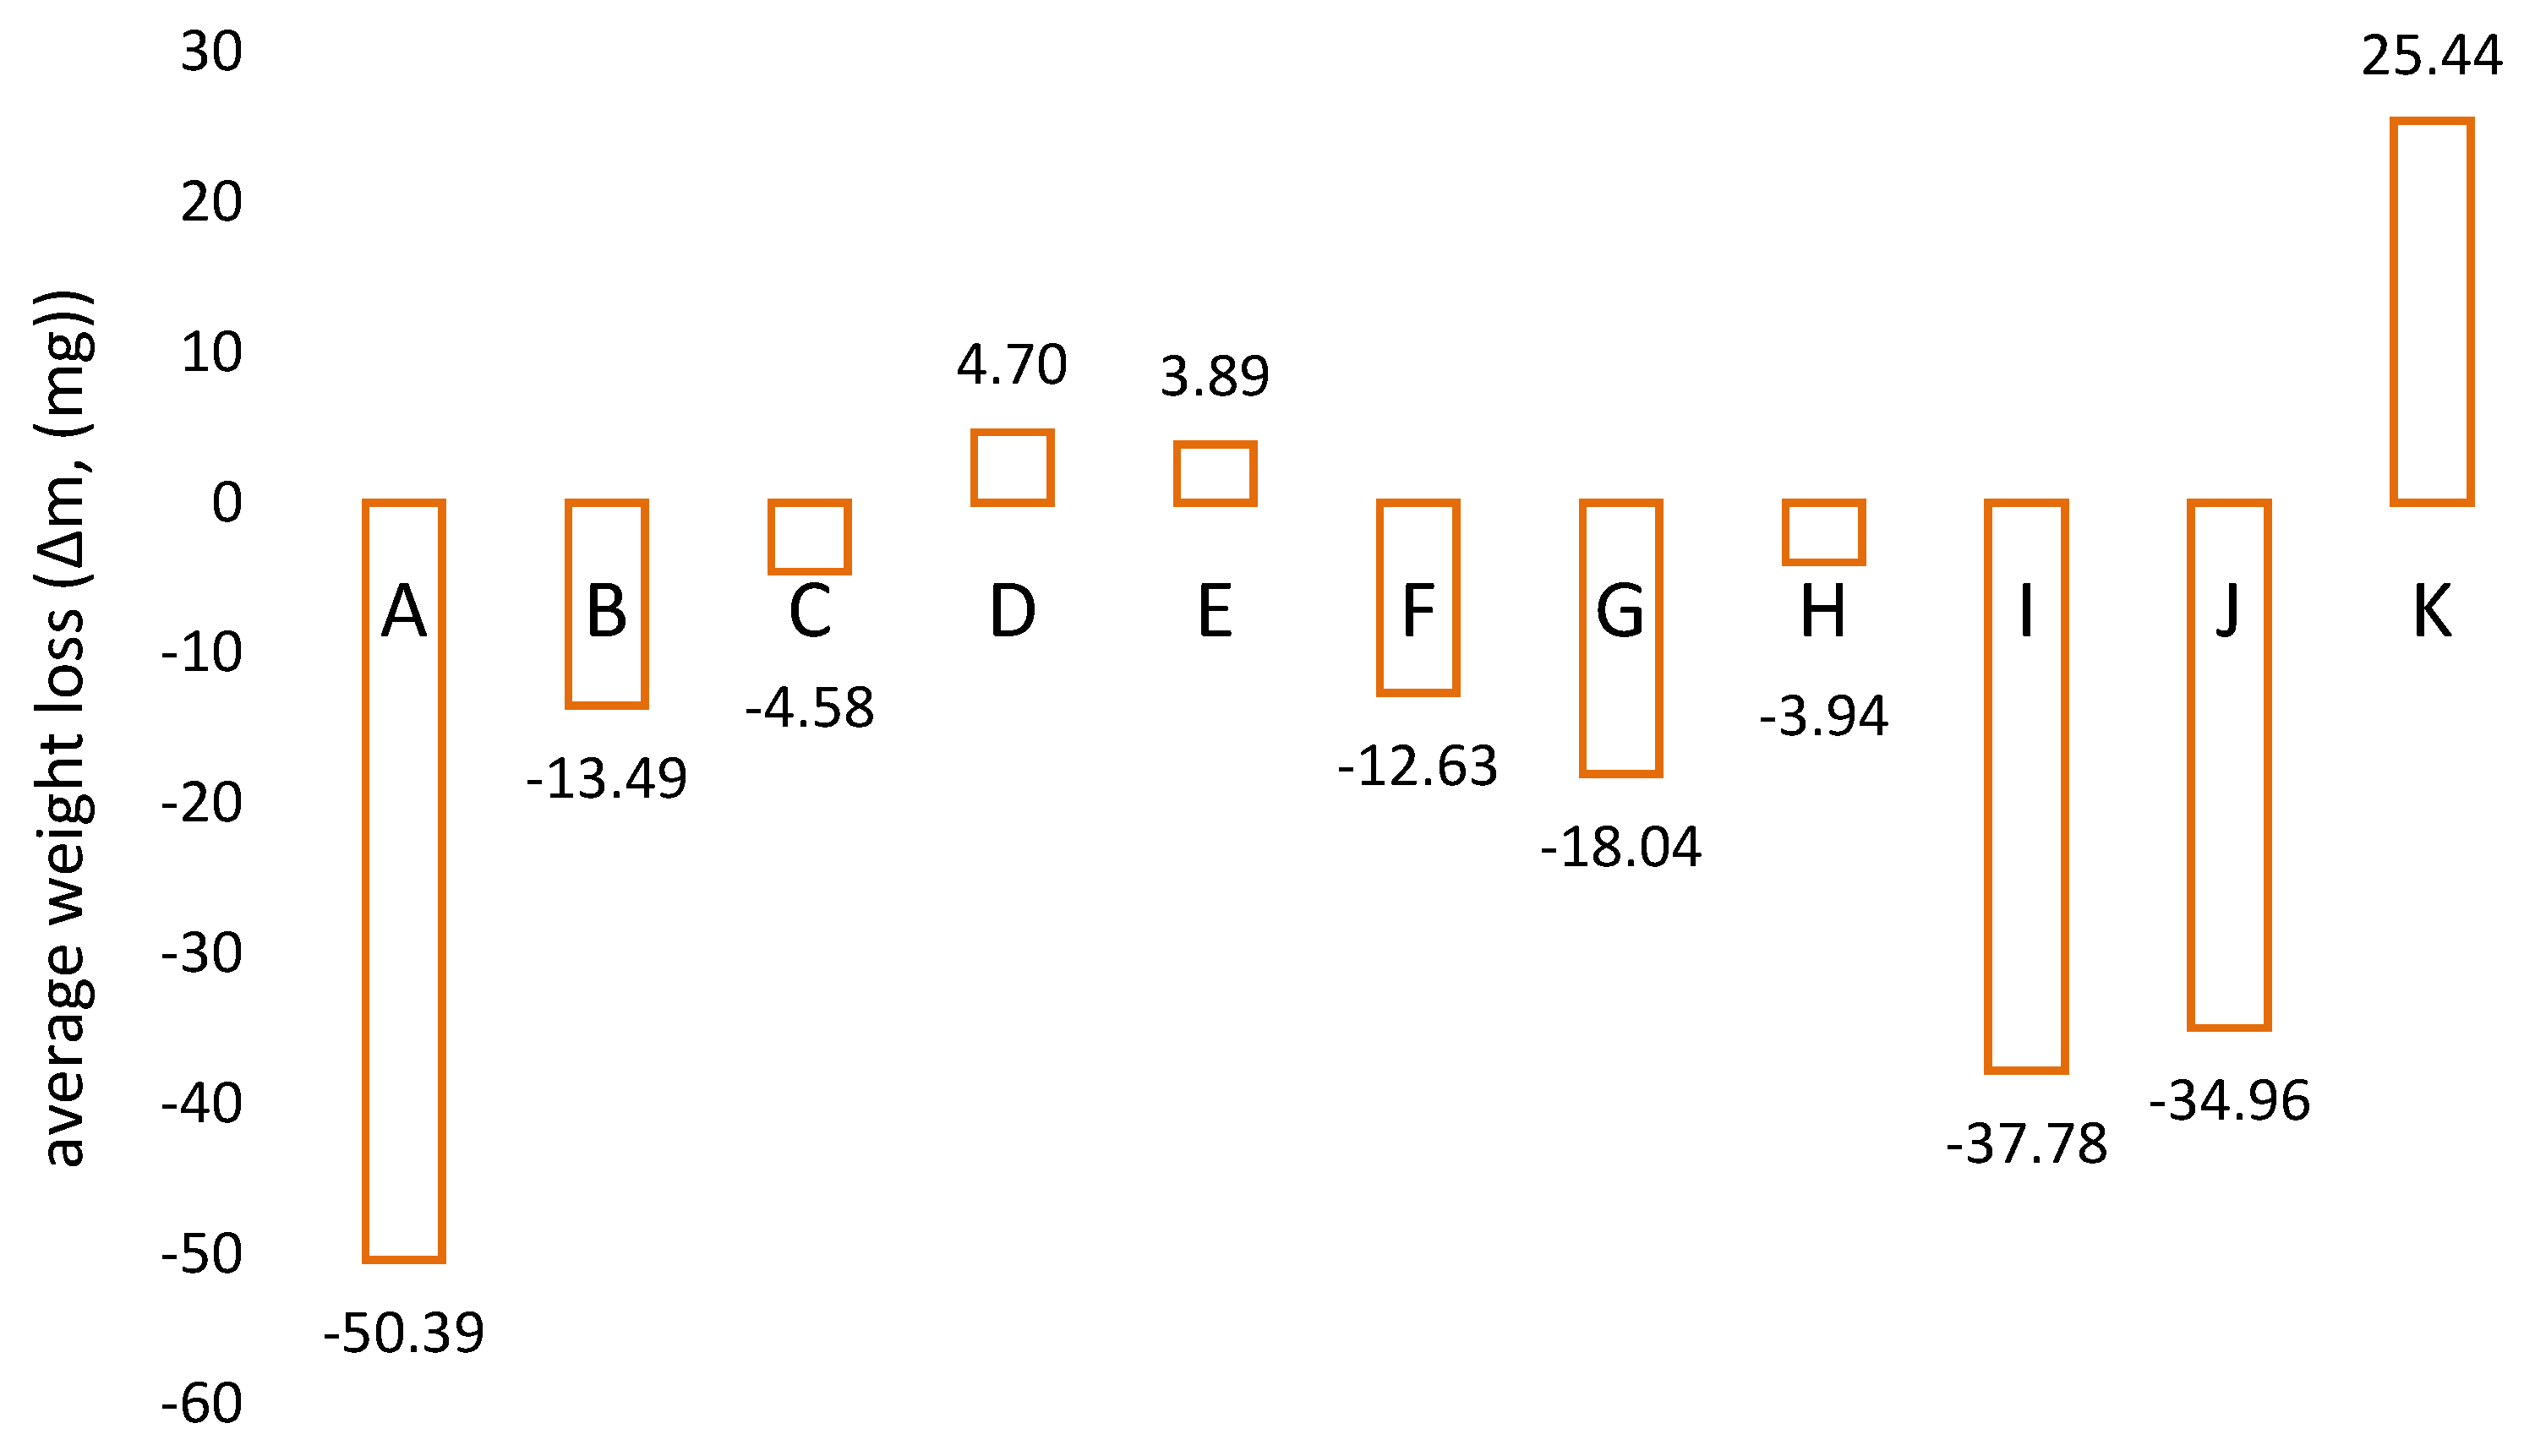
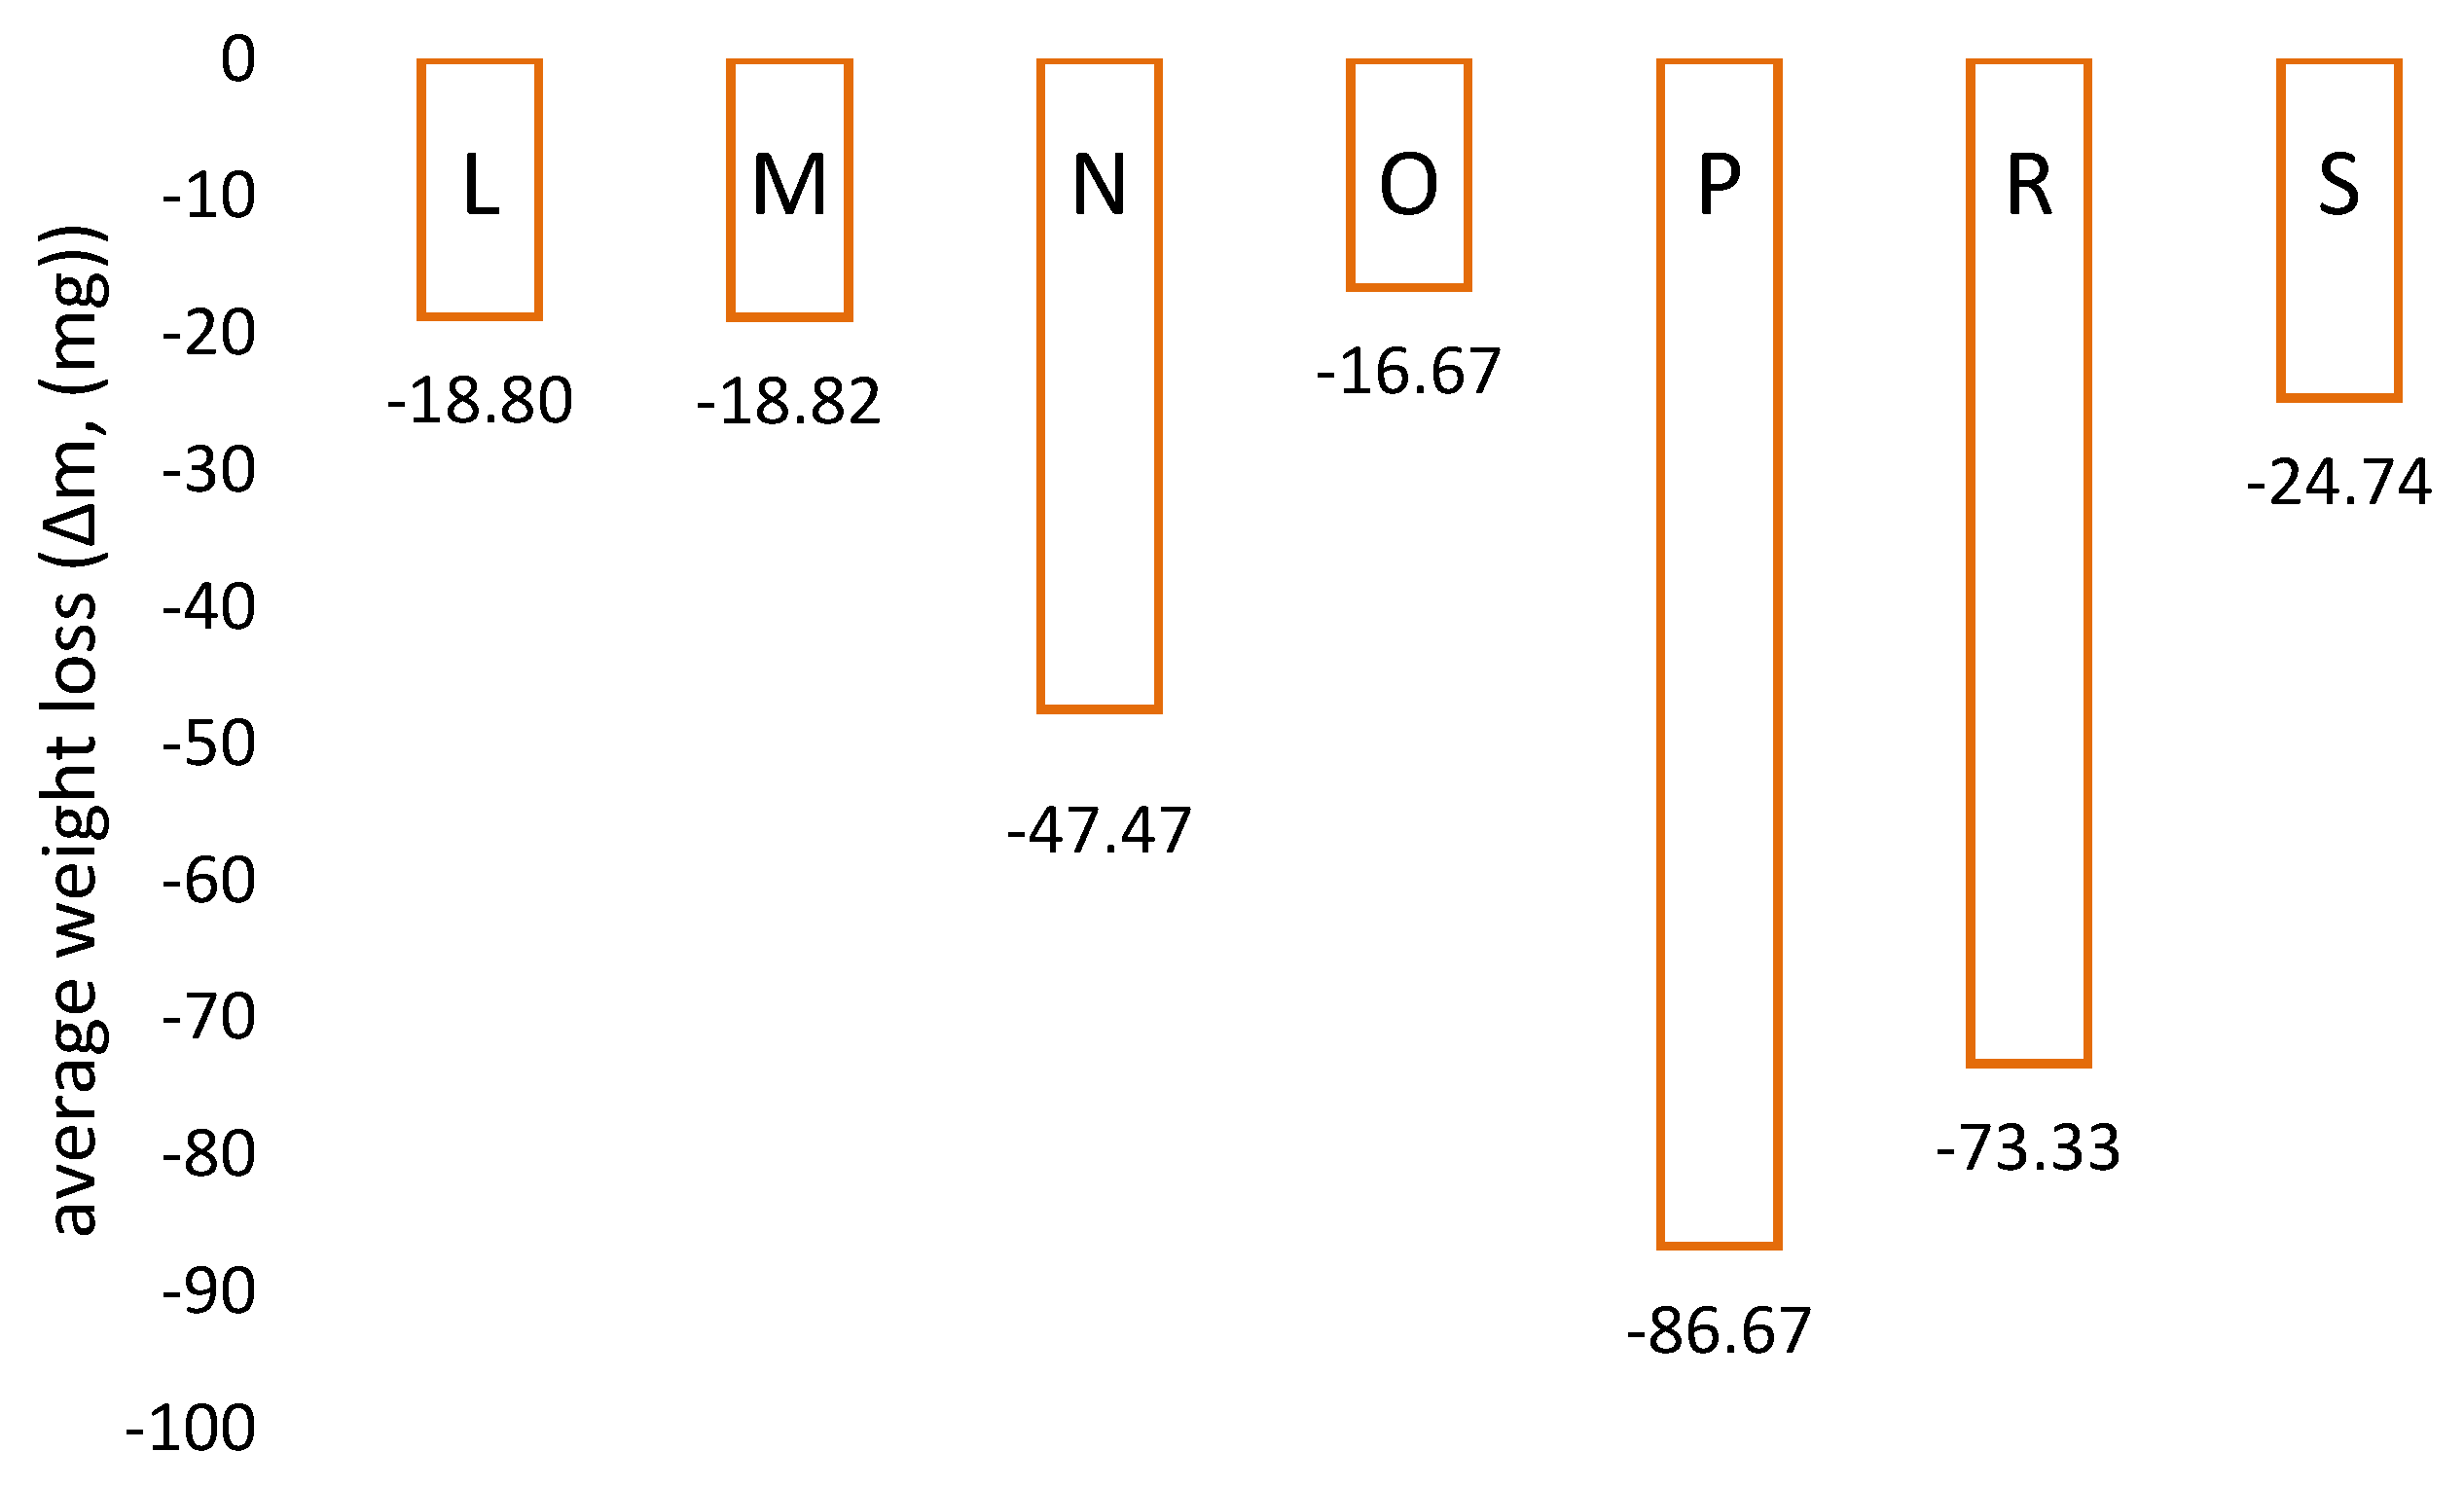
3.1. Determination of Abrasion Resistance of Protective Coatings and Wear Linings—Laboratory Tests
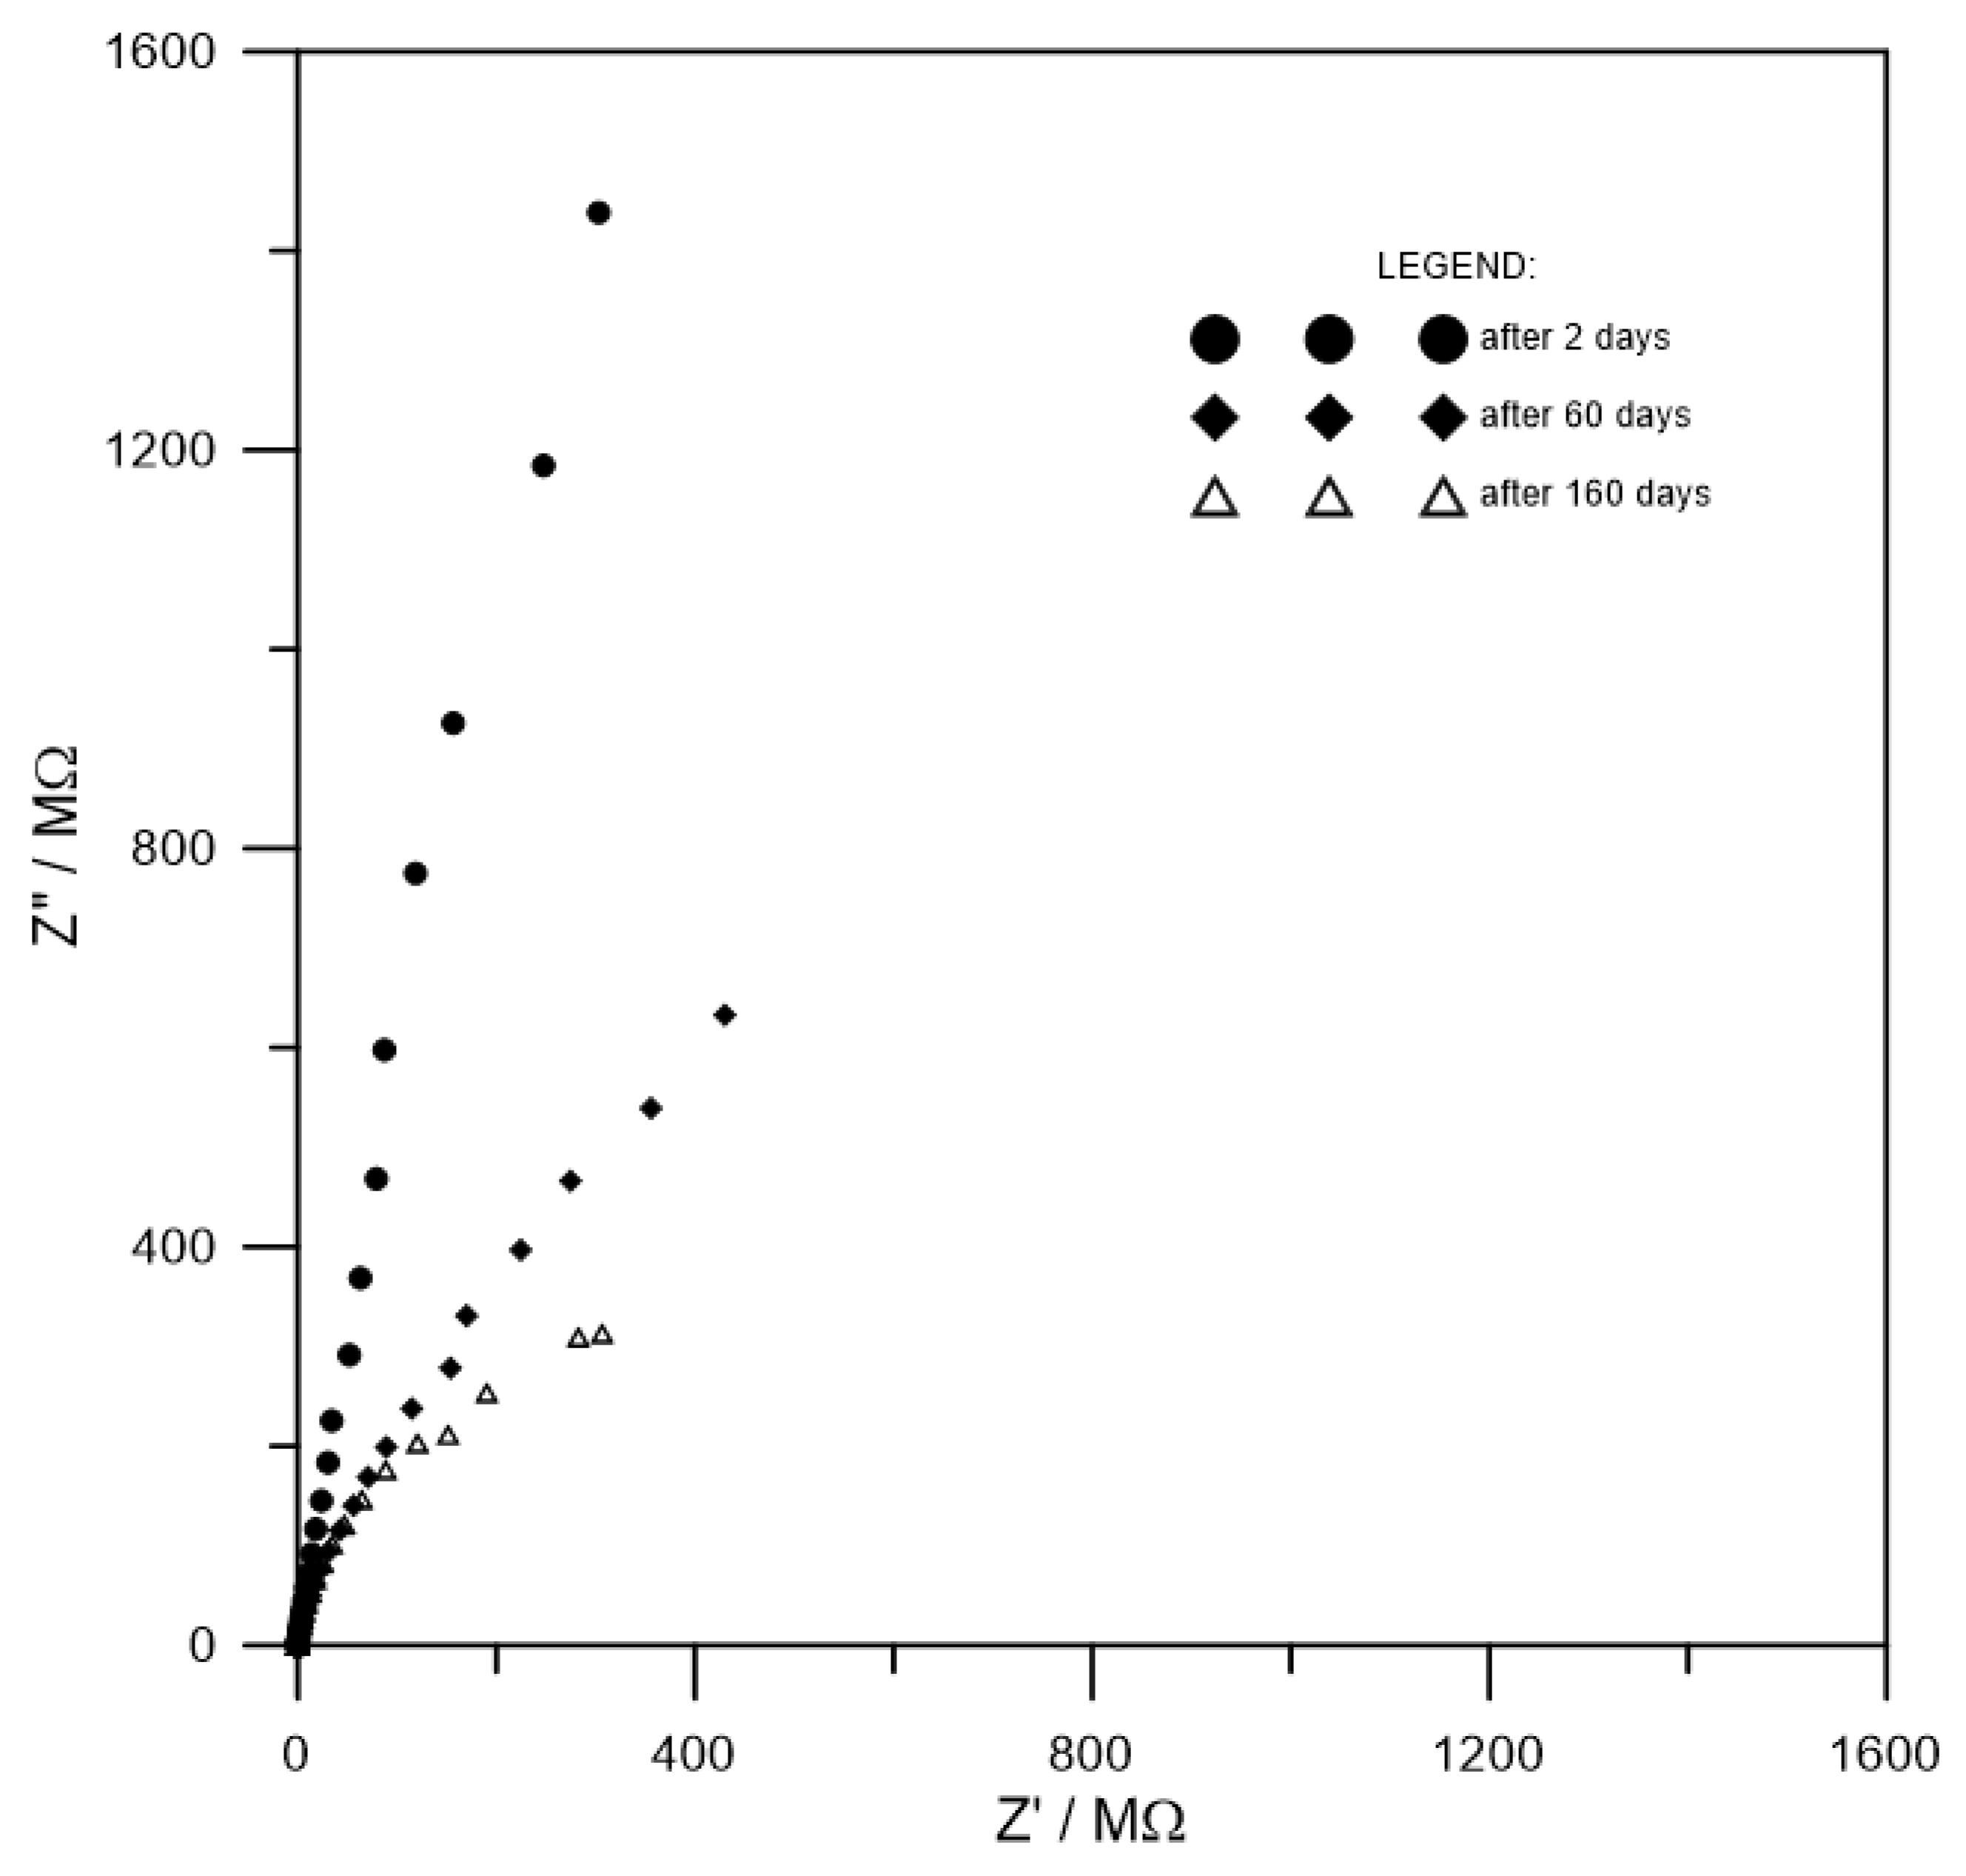
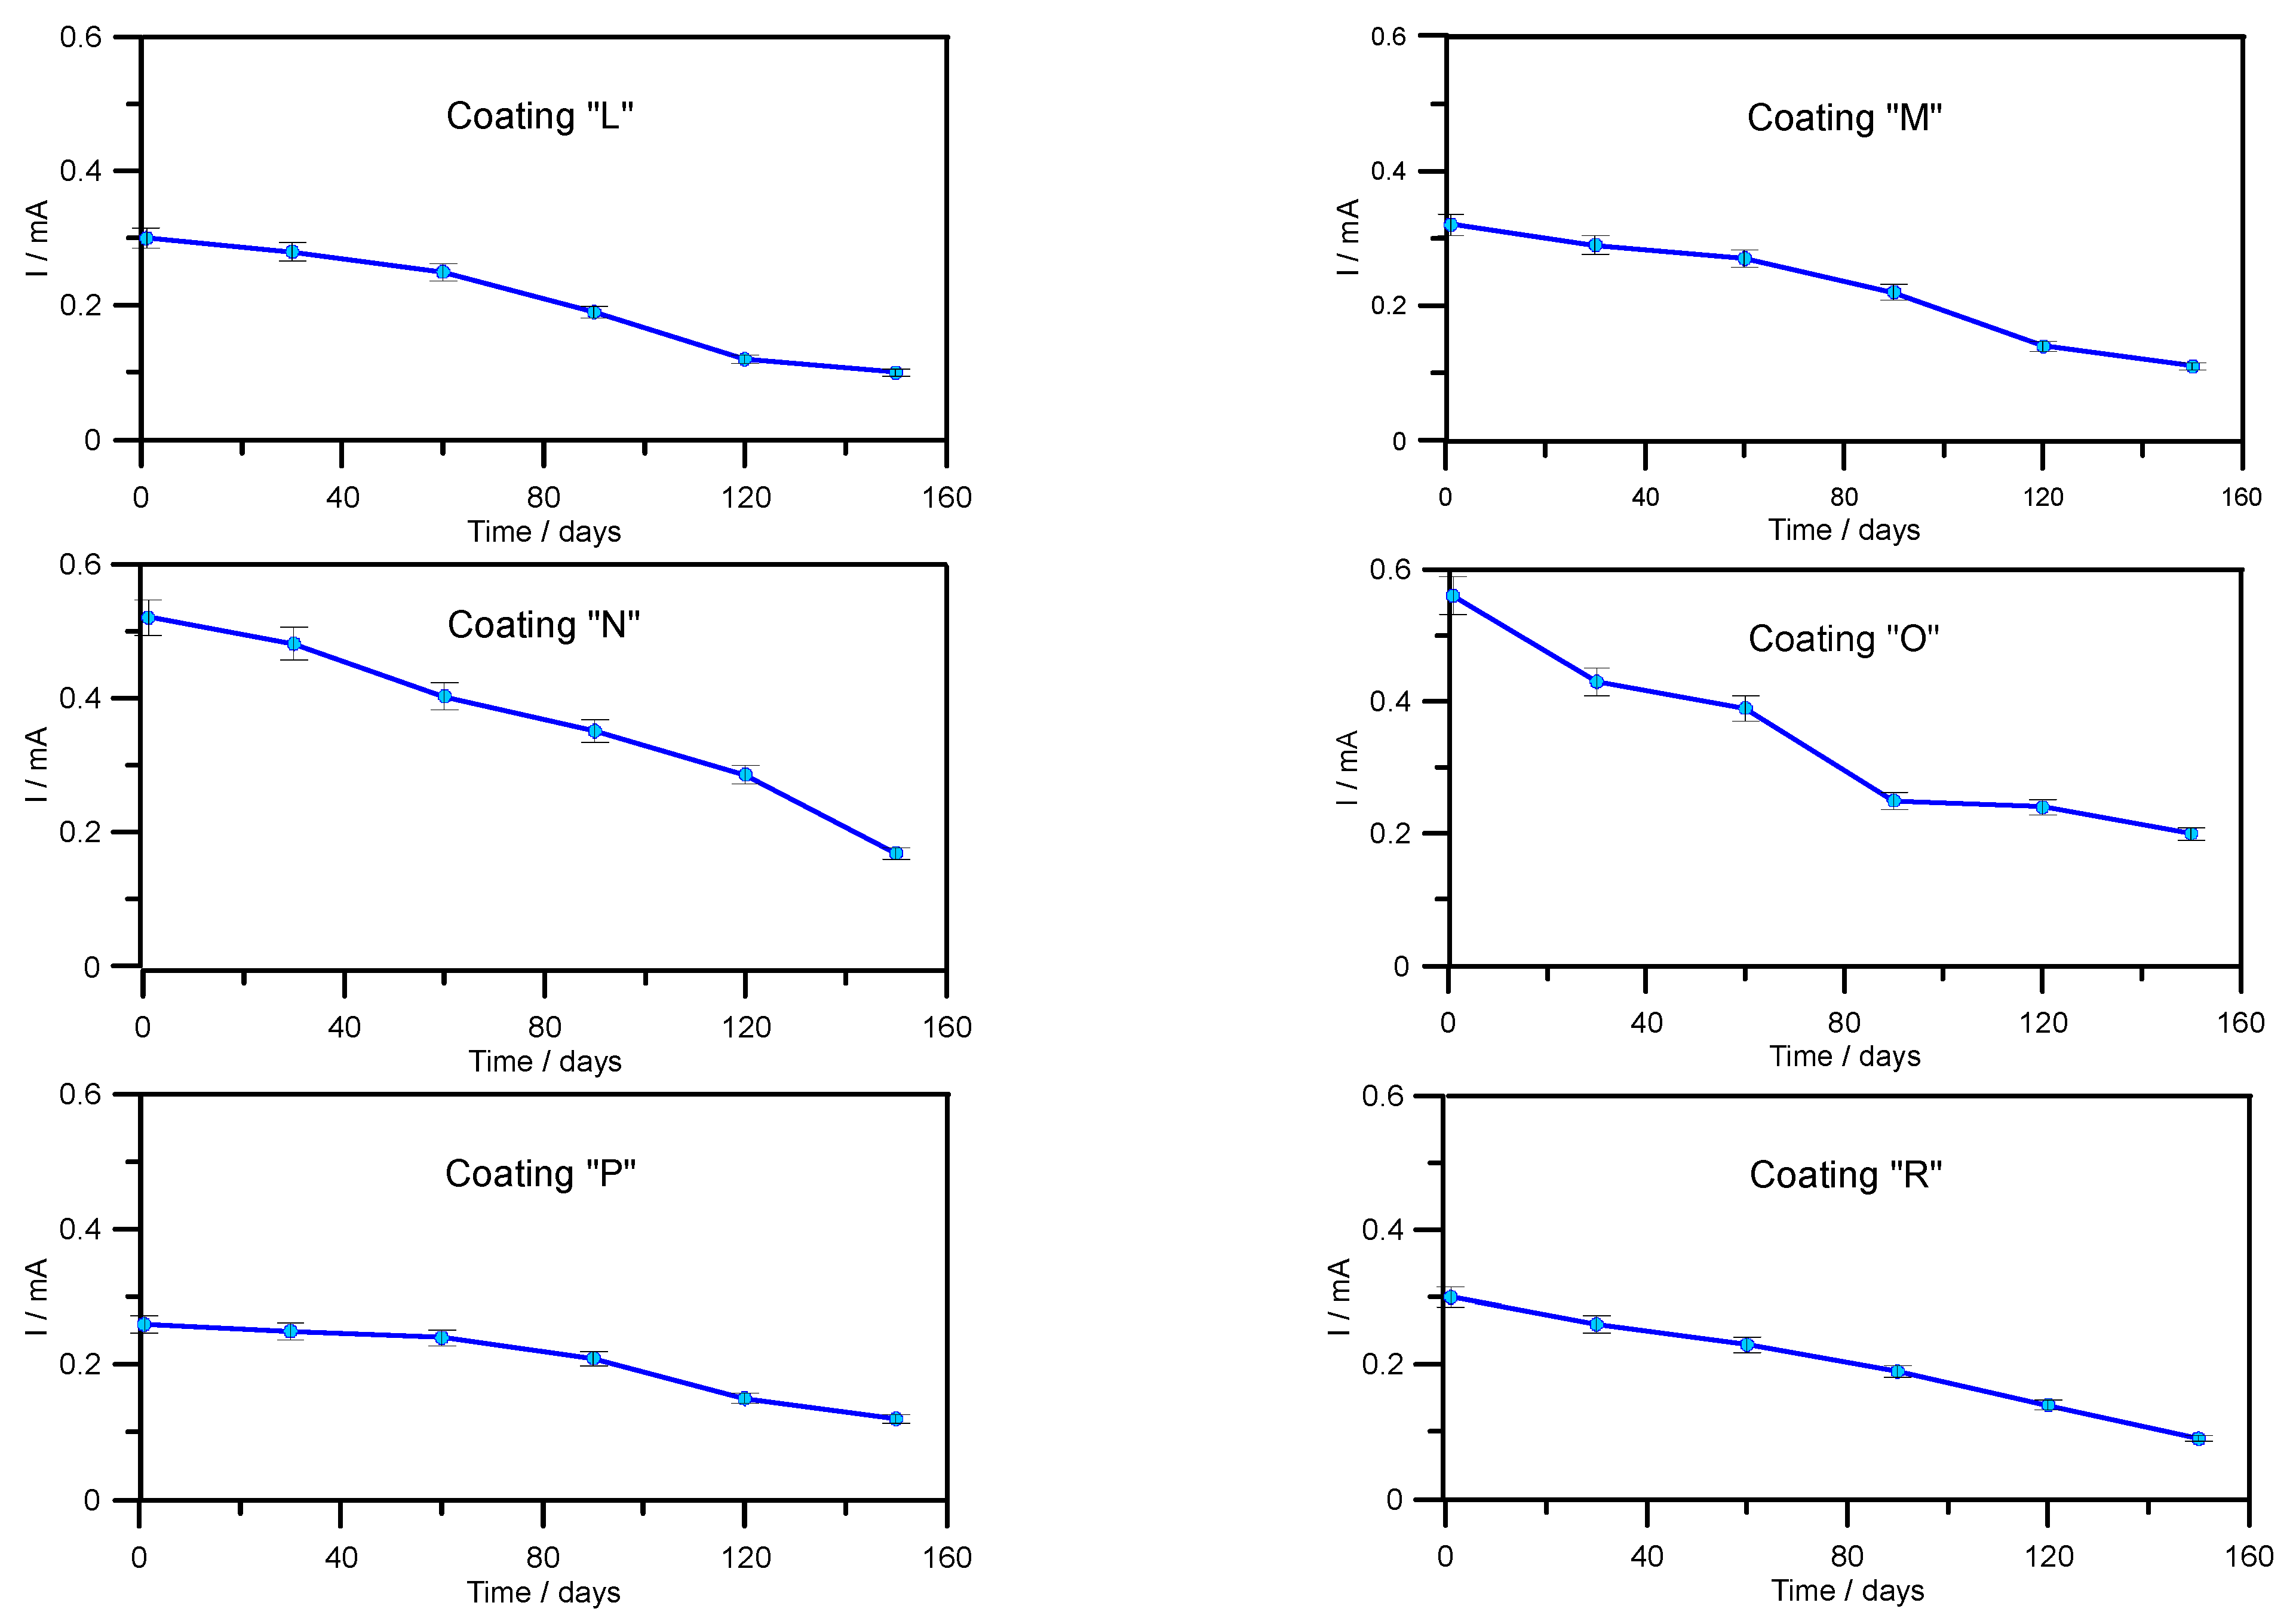
3.2. Determination of Resistance of Coatings by Electrochemical Impedance Spectroscopy (EIS)—Laboratory Testing
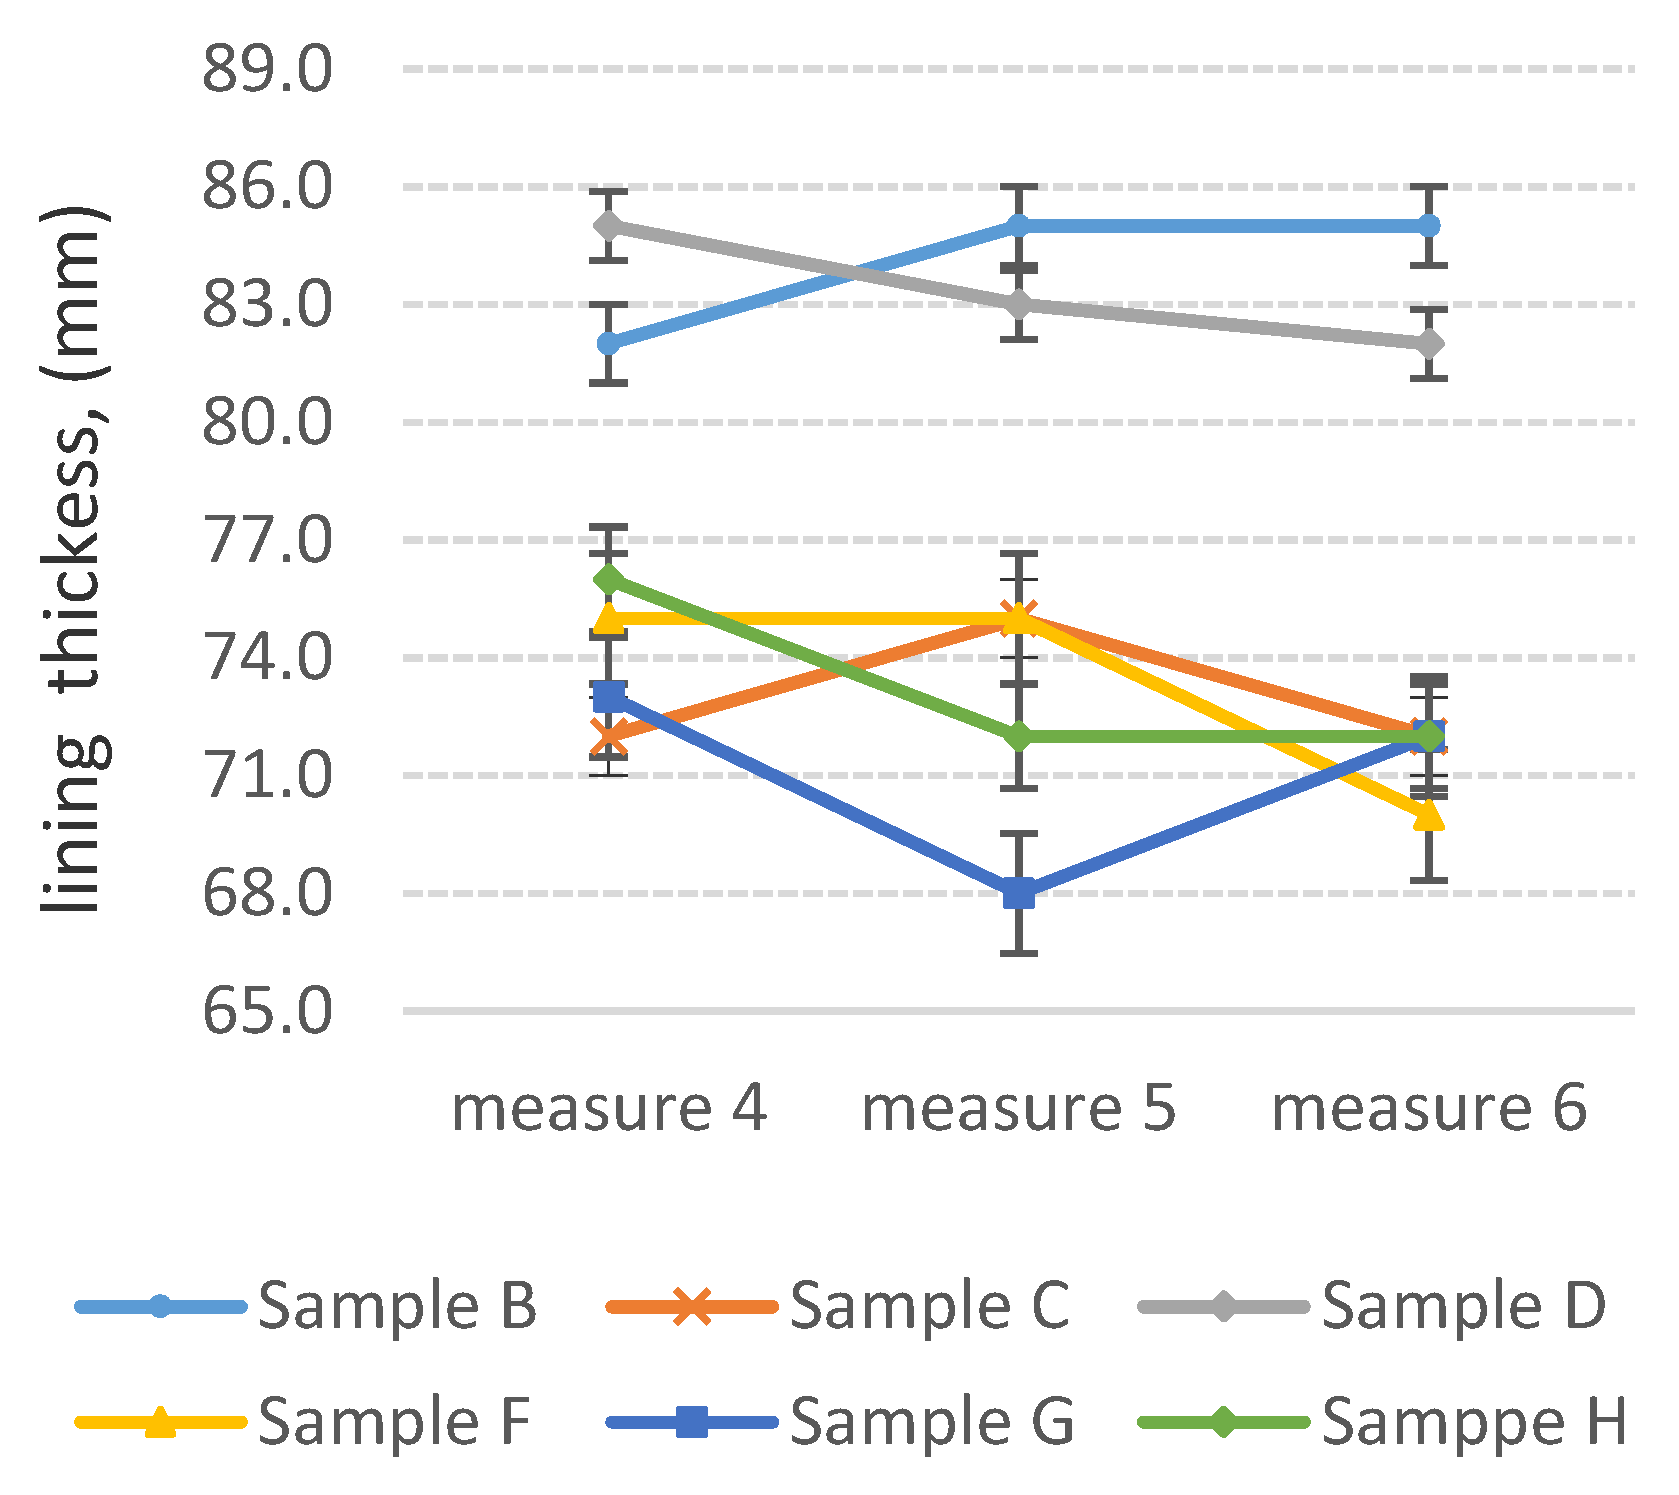
3.3. Determination of Abrasion Resistance of Wear-Resistant Linings—Industrial Tests
4. Conclusions
Author Contributions
Funding
Institutional Review Board Statement
Informed Consent Statement
Data Availability Statement
Conflicts of Interest
References
- Bigum, M.; Brogaard, L.; Christensen, T.H. Metal recovery from high-grade WEEE: A life cycle assessment. J. Hazard. Mater. 2012, 207, 8–14. [Google Scholar] [CrossRef]
- Torres, C.M.; Taboada, M.E.; Graber, T.A.; Herreros, O.O.; Ghorbani, Y.; Watling, H.R. The effect of seawater based media on copper dissolution from low-grade copper ore. Miner. Eng. 2015, 71, 139–145. [Google Scholar] [CrossRef]
- Official KGHM Polska Miedź S.A. Site. Available online: https://kghm.com/en/our-business/mining-and-enrichment (accessed on 1 August 2021).
- Matis, K.A.; Mavros, P. Recovery of metals by ion flotation from dilute aqueous solutions. Sep. Purif. Methods 1991, 20, 1–48. [Google Scholar] [CrossRef]
- Yu, L.; Liu, Q.; Li, S.; Deng, J.; Luo, B.; Lai, H. Adsorption performance of copper ions on arsenopyrite surfaces and implicationsfor flotation. Appl. Surf. Sci. 2019, 488, 185–193. [Google Scholar] [CrossRef]
- Kyzas, G.Z.; Mitropoulos, A.C.; Matis, K.A. From microbubblesto nanobubbles: Effect on flotation. Processes 2021, 9, 1287. [Google Scholar] [CrossRef]
- Sokolović, J.; Stanojlović, R.; Andrić, L.; Stirbanovic, Z.; Ćirić, N. Flotation studies of copper ore Majdanpek to enhance copper recovery and concentrate grade with different collectors. J. Min. Metall. A Min. 2019, 55, 53–65. [Google Scholar] [CrossRef]
- Baran, A.; Śliwka, M.; Lis, M. Selected properties of flotation tailings wastes deposited in the Gilow and Zelazny most waste reservoirs regarding their potential environmental management. Arch. Min. Sci. 2013, 58, 969–978. [Google Scholar] [CrossRef]
- Official KGHM Polska Miedź S.A. Site. Available online: https://kghm.com/en/our-business/processes/ore-enrichment (accessed on 1 August 2021).
- Skrzypkowski, K.; Korzeniowski, W.; Zagorski, K.; Dudek, P. Application of long expansions rock bolt support in the underground mines of Legnica-Glogow copper district. Studia Geotechn. Mech. 2017, 39, 45–57. [Google Scholar] [CrossRef] [Green Version]
- Biswas, S.; Satapathy, A. A comparative study on erosion characteristics of red mud filled bamboo–epoxy and glass–epoxy composites. Mater. Des. 2010, 31, 1752–1767. [Google Scholar] [CrossRef]
- Duan, C.; Karelin, V.Y. Abrasive erosion and corrosion of hydraulic machinery. World Sci. 2003, 11, 272. [Google Scholar] [CrossRef]
- Ackah, K.; Owusu, C.; Amoah, F. Optimisation of operational parameters of a spiral classifier using design of experiment (DOE). Ghana Min. J. 2020, 20, 45–50. [Google Scholar] [CrossRef]
- Bazin, C.; Sadeghi, M.; Renaud, M. An operational model for a spiral classifier. Miner. Eng. 2016, 91, 74–85. [Google Scholar] [CrossRef]
- Czekajło, M.; Zakowski, K. Failures and a concept of corrosion protectiston system for spiral classifiers at KGHM Polska Miedź S.A. Ore Conc. Plant. Eng. Fail. Anal. 2020, 109, 104287–104294. [Google Scholar] [CrossRef]
- Czekajło, M.; Zakowski, K. Increasing efficiency of technological process by limiting impact of corrosive environment on operation of spiral classifiers. IOP Conf. Ser. Mater. Sci. Eng. 2018, 427, 012032. [Google Scholar] [CrossRef] [Green Version]
- Malka, R.; Nešić, S.; Gulino, D.A. Erosion-corrosion and synergistic effects in disturbed liquid-particle flow. Wear 2007, 262, 791–799. [Google Scholar] [CrossRef] [Green Version]
- Atasoy, Y.; Spottiswood, D.J. A study of particle separation in a spiral concentrator. Miner. Eng. 1995, 8, 1197–1208. [Google Scholar] [CrossRef]
- Bazin, C.; Sadeghi, M.; Bourassa, M.; Roy, P.; Lavoie, F.; Cataford, D.; Rochefort, C.; Gosselin, C. Size recovery curves of minerals in industrial spirals for processing iron oxide ores. Miner. Eng. 2014, 65, 115–123. [Google Scholar] [CrossRef]
- Pilov, P.I.; Kirnarsky, A.S. Developments of spiral separation technology for retreatment of fines from coal dumps. Mine planning and equipment section. In 6th International Symposium on Mine Planning and Equipment Selection (MPES); Imprint; CRC Press: Ostrava, Czech Republic, 1997; pp. 193–196. [Google Scholar]
- Lan, X.; Gao, J.; Du, Y.; Guo, Z. A novel method of selectively enriching and separating rare earth elements from rare-earth concentrate under super gravity. Miner. Eng. 2019, 133, 27–34. [Google Scholar] [CrossRef]
- Altun, N.E.; Sakuhuni, G.; Klein, B. The use of continuous centrifugal gravity concentration in grinding circuit. Modified approach for improved metallurgical performance and reduced grinding requirements. Physicochem. Probl. Mineral. Pro. 2015, 51, 115–126. [Google Scholar] [CrossRef]
- Lu, B.T. Statistical approaches for assessment of water corrosivity. Corros. Eng. Sci. Technol. 2011, 46, 651–656. [Google Scholar] [CrossRef]
- EN ISO 7784-2:2016-05. Paints and Varnishes—Determination of Resistance to Abrasion—Part 2: Method with Abrasive Rubber Wheels and Rotating Test Specimen; International Organization for Standardization: Geneva, Switzerland, 2016. [Google Scholar]
- EN ISO 2808:2020-01. Paints and Varnishes—Determination of Film Thickness; International Organization for Standardization: Geneva, Switzerland, 2019. [Google Scholar]
- Zoltán, L.; Tamás, K. A generalized model of the equivalent circuits in the electrochemical impedance spectroscopy. Electrochim. Acta 2020, 363, 137199. [Google Scholar] [CrossRef]
- Margarit-Mattos, I. EIS and organic coatings performance: Revisiting some key points. Electrochim. Acta 2020, 354, 136725. [Google Scholar] [CrossRef]
- Hammouda, N.; Kamel, B. EIS study of the corrosion behavior of an organic coating applied on Algerian oil tanker. Metall. Res. Technol. 2020, 117, 610. [Google Scholar] [CrossRef]


| Dimensions (Length × Width × Height) (m) | 9.82 × 5.13 × 4.02 |
| Classifier Inclination Angle (o) | 19 |
| Diameter of Spirals (mm) | Ø 2400 |
| Spiral Speed (1/min) | 3.5 |
| Maximum Underflow Capacity (Mg/h) | 250 |
| Density of Feed (g/dm3) | 1500–1650 |
| Overflow Density (g/dm3) | 1350–1450 |
| Underflow Density (g/dm3) | 2000–2200 |
| Sample Number | Type of Material |
|---|---|
| Group of Materials | |
| A | Epoxy system with alumina ceramic filling |
| B | Polyurethane |
| C | Ultra-high molecular-modified polyethylene with antiadhesive additives |
| D | Polymer based on MDI (methylene diphenyl diisocyanate) and PTMG (polytetramethylene glycol) |
| E | Polyurethane elastomer |
| F | PA 6 C (cast polyamide 6) with added molybdenum disulphide |
| G | PA 6 C (polyamide 6 cast) |
| H | High-density polyethylene |
| I | Epoxy system with ceramic filling |
| J | Rubber-like urethane mass |
| K | Vulcanised rubber |
| Coating Group | |
| L | Amine-cured phenol-epoxy coating |
| M | Elastomeric coating based on pure polyurea primed with epoxy coating |
| N | Epoxy coating with ceramic filling |
| O | Coating consisting of hard and dense ceramic aggregates and a polymer bonding agent |
| P | Epoxy coating with 100% solids content |
| R | Two-component epoxy resin-based coating |
| Structural Steel | |
| S | Sheet metal S 235 |
| Type of Sample | Sample Photo | Sample Mark | Measurement 1 (µm) | Measurement 2 (µm) | Measurement 3 (µm) | Average Thickness (µm) | Standard Deviation (µm) |
|---|---|---|---|---|---|---|---|
| Coat L |  | 1 | 610 | 593 | 624 | 609 | 13 |
| 2 | 694 | 696 | 666 | 685 | 14 | ||
| 3 | 642 | 630 | 644 | 639 | 6 | ||
| Coat M |  | 1 | 3030 | 2920 | 3300 | 3083 | 160 |
| 2 | 3200 | 2995 | 2820 | 3005 | 155 | ||
| 3 | 3550 | 3390 | 3570 | 3503 | 81 | ||
| Coat N |  | 1 | 848 | 548 | 644 | 680 | 125 |
| 2 | 638 | 551 | 666 | 618 | 49 | ||
| 3 | 812 | 1202 | 1210 | 1075 | 186 | ||
| Coat O |  | 1 | 7290 | 6610 | 6140 | 6680 | 472 |
| 2 | 7730 | 7630 | 6180 | 7180 | 708 | ||
| 3 | 8680 | 8390 | 8530 | 8533 | 118 | ||
| Coat P |  | 1 | 1202 | 1292 | 1190 | 1228 | 46 |
| 2 | 1100 | 1106 | 1134 | 1117 | 15 | ||
| 3 | 1156 | 986 | 1148 | 1097 | 78 | ||
| Coat R |  | 1 | 634 | 560 | 533 | 576 | 43 |
| 2 | 554 | 680 | 642 | 625 | 53 | ||
| 3 | 520 | 550 | 506 | 525 | 18 |
| Expousure time/measurement error | Rc/Ω | Cc/F |
| After 2 days | 8.79 × 10⁹ | 8.88 × 10⁻¹⁰ |
| Relative standard error/% | 24.01 | 0.33 |
| After 60 days | 6.02 × 10⁸ | 1.19 × 10⁻⁹ |
| Relative standard error/% | 6.24 | 0.47 |
| After 160 days | 1.25 × 10⁸ | 6.62 × 10⁻⁹ |
| Relative standard error/% | 10.23 | 5.61 |
Publisher’s Note: MDPI stays neutral with regard to jurisdictional claims in published maps and institutional affiliations. |
© 2021 by the authors. Licensee MDPI, Basel, Switzerland. This article is an open access article distributed under the terms and conditions of the Creative Commons Attribution (CC BY) license (https://creativecommons.org/licenses/by/4.0/).
Share and Cite
Czekajło, M.; Zakowski, K.; Krakowiak, S.; Kierepa, S. Analysis of the Possibility of Using New Types of Protective Coatings and Abrasion-Resistant Linings under the Operating Conditions of the Spiral Classifier at KGHM Polska Miedź S.A. Ore Concentration Plant. Coatings 2021, 11, 1138. https://doi.org/10.3390/coatings11091138
Czekajło M, Zakowski K, Krakowiak S, Kierepa S. Analysis of the Possibility of Using New Types of Protective Coatings and Abrasion-Resistant Linings under the Operating Conditions of the Spiral Classifier at KGHM Polska Miedź S.A. Ore Concentration Plant. Coatings. 2021; 11(9):1138. https://doi.org/10.3390/coatings11091138
Chicago/Turabian StyleCzekajło, Marcin, Krzysztof Zakowski, Stefan Krakowiak, and Sławomir Kierepa. 2021. "Analysis of the Possibility of Using New Types of Protective Coatings and Abrasion-Resistant Linings under the Operating Conditions of the Spiral Classifier at KGHM Polska Miedź S.A. Ore Concentration Plant" Coatings 11, no. 9: 1138. https://doi.org/10.3390/coatings11091138
APA StyleCzekajło, M., Zakowski, K., Krakowiak, S., & Kierepa, S. (2021). Analysis of the Possibility of Using New Types of Protective Coatings and Abrasion-Resistant Linings under the Operating Conditions of the Spiral Classifier at KGHM Polska Miedź S.A. Ore Concentration Plant. Coatings, 11(9), 1138. https://doi.org/10.3390/coatings11091138