Article

Tunability Investigation in the BaTiO3-CaTiO3-BaZrO3 Phase Diagram Using a Refined Combinatorial Thin Film Approach

1
GREMAN, UMR CNRS 7347, Université de Tours, INSA CVL, Parc de Grandmont, 37200 Tours, France
2
ICMCB, UMR CNRS 5026, Université de Bordeaux, 33608 Pessac CEDEX, France
3
STMicroelectronics, 10 Rue Thalès de Milet, 37071 Tours, France
*
Author to whom correspondence should be addressed.
Coatings 2021, 11(9), 1082; https://doi.org/10.3390/coatings11091082
Submission received: 9 August 2021 / Revised: 29 August 2021 / Accepted: 1 September 2021 / Published: 7 September 2021
(This article belongs to the Special Issue Advances in Multi-Target Physical Vapor Deposition Techniques)

Abstract

:
Tunable ferroelectric capacitors, which exhibit a decrease in the dielectric permittivity under an electric field, are widely used in electronics for RF tunable applications. Current devices use barium strontium titanate (BST) as the tunable dielectric, but new applications call for tunable materials with specific performance improvements. It is then of crucial importance to dispose of a large panel of electrically characterized materials to identify the most suited compound for a given set of device specifications. Here, we report on the dielectric tuning properties of Ba1−xCaxTi1−yZryO3 (BCTZ) thin films libraries (0 ≤ x ≤ 30% and 0 ≤ y ≤ 28.5%) synthesized by combinatorial pulsed laser deposition (CPLD). An original CPLD approach allowing reliable and statistical ternary phase diagrams exploration is reported. The effects of Ca and Zr content on tunability, breakdown voltage and dielectric losses are explicated and shown to be beneficial up to a certain amount. Compounds close to (Ba0.84Ca0.16)(Ti0.8Zr0.2)O3 exhibit the highest figures of merit, while a zone with compositions around (Ba0.91Ca0.09)(Ti0.81Zr0.19)O3 show the best compromise between tuning ratio and figure of merit. These results highlight the potential of BCTZ thin films for electrically tunable applications.

1. Introduction

Ferroelectric (FE)-perovskite-films-based heterostructures are found in many microelectronic components dedicated to RF and microwave (MW) applications thanks to the large electric field dependence of the relative dielectric permittivity εr(E) near the Curie temperature TC [1]. FE Capacitors are thus voltage tunable to be used for tuning filters, resonators, phase shifters [2]. In addition, dielectric losses below 1% are required. The solid solution Ba1−xSrxTiO3 (BST) is the most used FE material in nowadays RF and MW tunable capacitors because of its excellent tunability/losses compromise and adjustable TC (via Sr content x) [1,2]. However, emerging technologies call for improved tunable capacitor properties. In particular, for Near Field Communications (NFC) technology, the operating voltage is reduced to a 0–3 V range compared to 0–24 V for actual tunable capacitor products in mobile phone application [3], resulting in a lowered electric field and tunability. Thus, for a given application with a defined operating window (maximum applicable voltage, temperature range, minimum filters quality factor and Figure of Merit from circuit design), one has to seek for the FE material with the best compromise between various properties (tunability, dielectric losses, temperature coefficient TC). Improving BST’s tunability and leakage current by chemical doping, e.g., by compensating donor-type defects with acceptor-type dopants or by bringing the ferroelectric-paraelectric transition temperature closer to room temperature, has been largely attempted [4,5,6], but only a few dopants were found actually to work [7,8,9,10].
Another possibility is to look for other BaTiO3-based systems to keep device integration close to the one already in use for BST tunable capacitors. Recently, the (Ba,Ca)(Ti,Zr)O3 system has been attracting attention due to its high tunability, low dielectric losses and large piezoelectric coefficient [11,12,13,14,15,16,17,18,19,20]. In particular, Liu and Ren studied the system (1−x)Ba(Ti0.8Zr0.2)O3−x(Ba0.7Ca0.3)TiO3 which shows, for x = 0.5, a piezoelectric coefficient (d33) of about 620pm/V in ceramics [11], while it is reduced to about 70 and 80 pm/V for 350nm and 600nm thick films, respectively, with a tunability of 80% at about 330 kV/cm [12,16]. The large piezoelectric coefficient has been ascribed to the presence of a morphotropic phase boundary (MPB) between ferroelectric phases with rhombohedral and tetragonal symmetries, similarly to the PbTiO3-PbZrO3 (PZT) system and the presence of a triple point. It was later shown that a phase with orthorhombic symmetry was present between the rhombohedral and tetragonal symmetries, leading to a quadruple point, also called the phase convergence region (PCR) [18,19]. Our goal is to investigate the tunability properties of compositions in the BaTiO3-BaZrO3-CaTiO3 ternary phase diagram (BCTZ) in thin film libraries using combinatorial pulsed laser deposition (CPLD). It is appealing to try synthesizing an entire ternary phase diagram on a single substrate using three targets with CPLD [21]. This approach, however, requires complex masking schemes and a uniform deposition rate across the substrate in order to control local compositions and thicknesses [22]. This is very challenging, as the strongly forward peaked plume makes PLD an intrinsically non-uniform deposition technique. Another severe drawback of this approach is its non-statistical character, as one composition is only represented in a single location. An intrinsic drawback of PLD is the generation of sub-micrometric droplets. Although their density can be strongly reduced by working at a laser fluence close to the ablation threshold, some of them reach nevertheless the surface and may give rise to electrical shorts in parallel plate capacitors’ structures with electrode areas of thousands of micron square. It is thus necessary to rely on a statistical population per composition to spot possible outliers not reflecting the material’s properties.
We developed an original CPLD approach with a less complex masking scheme and a statistical character allowing us to produce continuous slices across the BCTZ ternary phase diagram using three targets [23,24]. Eight BCTZ polycrystalline thin film libraries were synthesized where 280 different compounds with Ca and Zr contents spreading in the ranges 0 ≤ Ca ≤ 11% and 0 ≤ Zr ≤ 30% were statistically characterized. The produced tunability map reveals the presence of two zones with high tunability in the ternary phase diagram. Insights on the impact of higher Ca concentration (up to 30%) on the tunability were obtained from three additional composition spread libraries deposited using two additional targets (binary samples). Taking dielectric losses (tanδ) into account via the figure of merit (FOM) allowed the identification of a zone with compositions around (Ba0.84Ca0.16)(Ti0.8Zr0.2)O3 showing the highest figures of merit (≈ 9000), while compositions close to (Ba0.91Ca0.09)(Ti0.81Zr0.19)O3 showed the best compromise between tuning ratios and figures of merit.

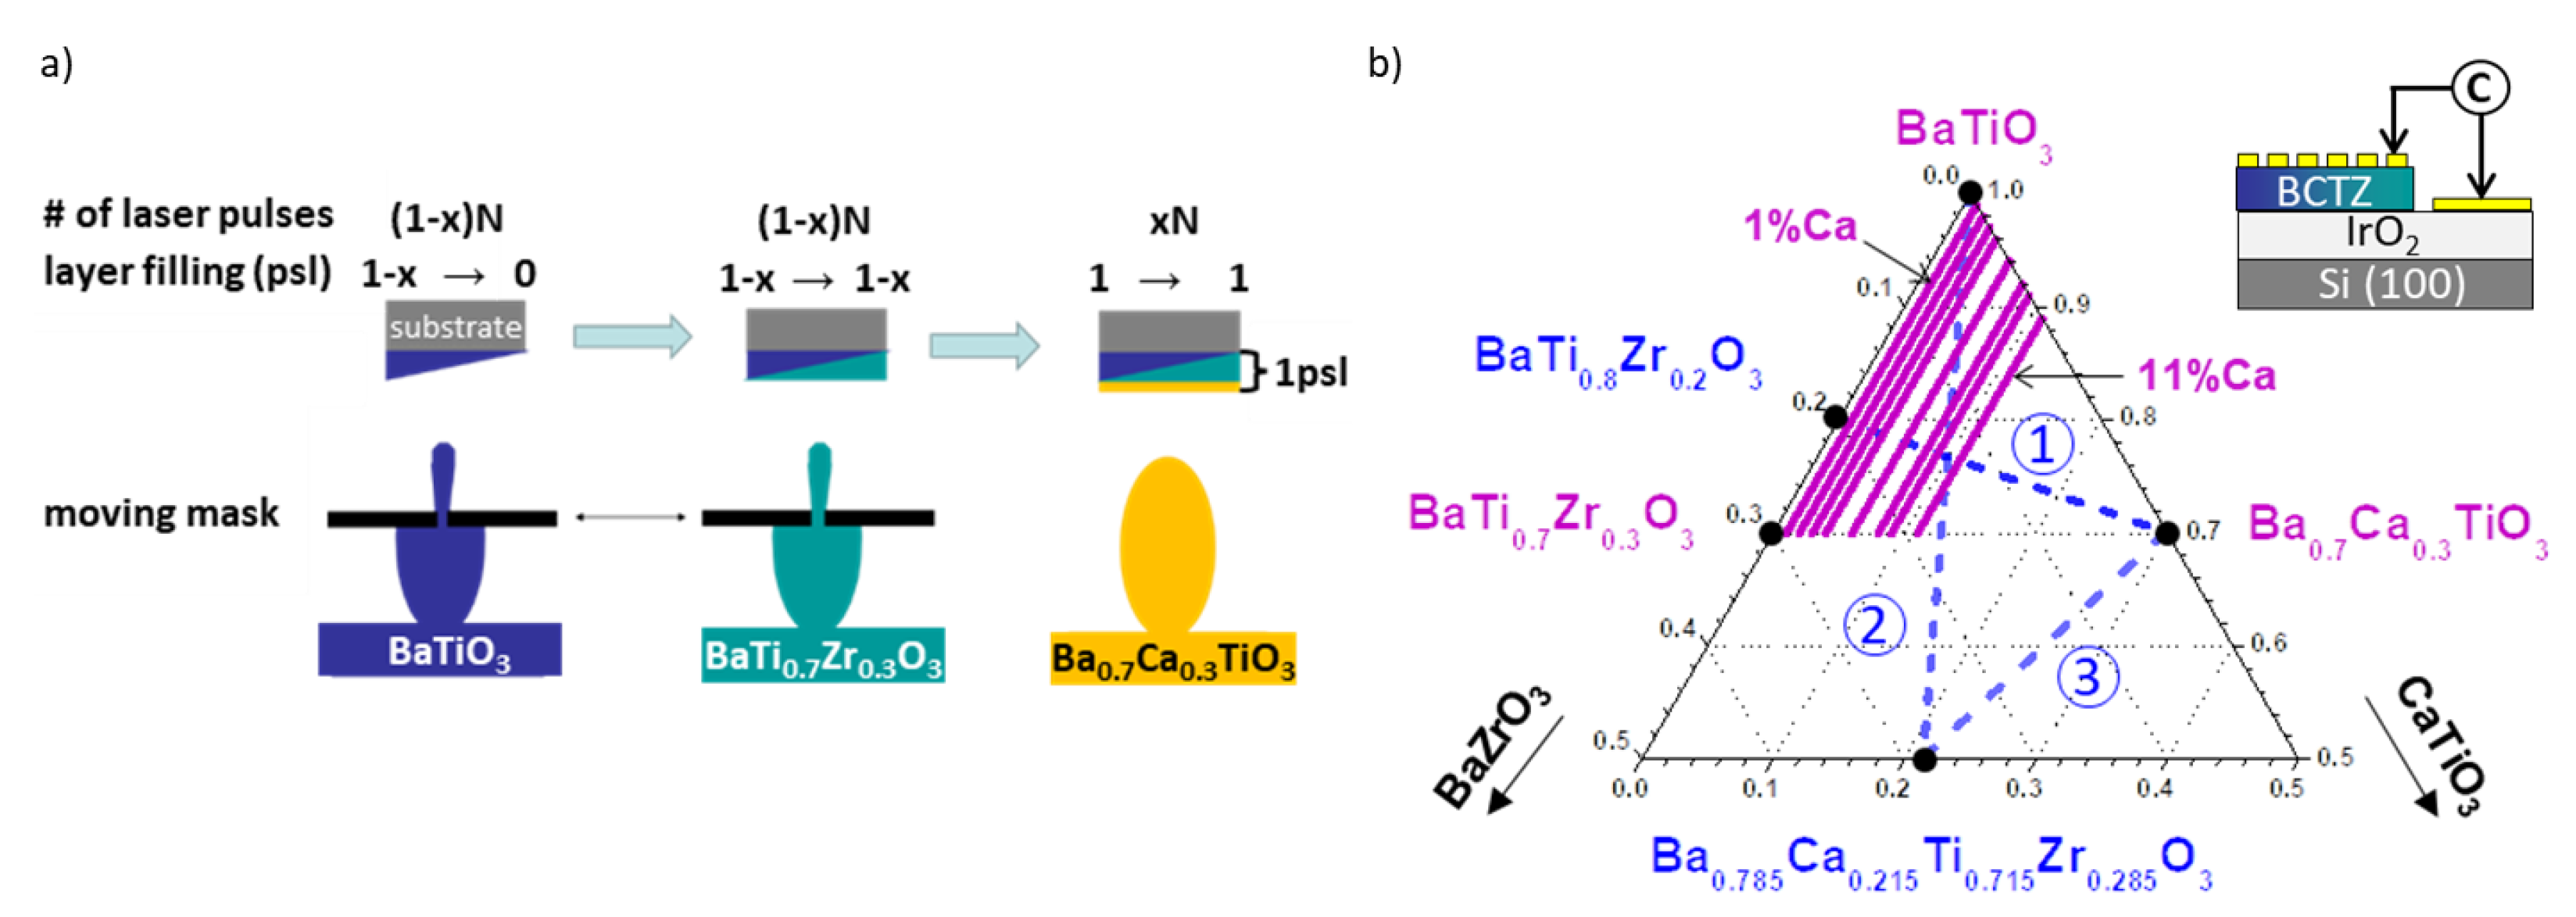
2. Materials and Methods

CPLD BCTZ composition spread thin films, with thicknesses of about 130nm, were synthesized on polycristalline IrO2 electrodes (140 nm) sputter deposited onto Si (100) substrates (10 × 10 mm2). CPLD is based on the localization of a successive deposition from 2 or 3 targets on the substrate with a shadow mask. The local composition then depends on the precise relative amount of material coming from each target. The mixing of the cations issued from different targets was conducted at the perovskite single layer (psl) level with a CPLD deposition cycle corresponding to the growth of a single perovskite layer thick film (thickness ≈ 4 Å, see Figure 1a). Repetition of this cycle then led to forming of the film with a homogeneous composition in the thickness direction. Tight lateral control of the local composition requires a uniform deposition rate and cationic composition over the whole substrate surface for each target separately. This is quite challenging with the strong radial distribution of PLD and the composition dependence on laser fluence and spot size [25]. A demonstration of single target PLD thin film uniformity, although essential for CPLD samples’ credibility, is unfortunately seldom made in published work. To obtain film uniformity, the optical image projection of a homogenized laser beam is raster scanned across the target, staying in focus at all times. The ablation plume is thus sweeping across the substrate surface. Laser fluence is in-situ monitored prior to each deposition. Multiple demonstrations of PLD films’ thickness and composition uniformity have already been published [24].
We explored a part of the BCTZ phase diagram using an original 3 targets CPLD scheme. The control of the linear variation of the composition was obtained as in classical CPLD [8] using BaTiO3 (BTO) and BaTi0.7Zr0.3O3 (BZT) targets (see Figure 1a). The trick is to use sub-psl deposition from these two targets and to complete the perovskite single layer using the 3rd target Ba0.7Ca0.3TiO3 (BCT). Let us assume, for the sake of discussion, that the deposition rates are identical for the 3 targets with N laser pulses required for one psl. We fix, for a given sample, an x value with 0 ≤ x ≤ 1. Then, the combinatorial deposition cycle comprises (1 − x)N pulses on the 1st target synchronized with the mask displacements in one direction, followed by (1 − x)N pulses on the 2nd target with opposite mask displacements, and finally xN pulses on the 3rd target without a mask (Figure 1a). The Ca content of such a sample is then constant (fixed by x) while the Ti/Zr ratio is continuously varying (controlled by mask positions). Its composition gradient is represented in the ternary phase diagram by a line parallel to the BaTiO3-BaZrO3 border with an offset toward the CaTiO3 summit. The gradient compositions are given by Ba(1−x)+0.7xCa0.3xZr0.7(1−x)(1−y)Ti(1−x)y+xO3 with 0 ≤ y ≤ 1. We deposited 8 BCTZ libraries with fixed Ca contents (1%, 2%, 3%, 4%, 6%, 8%, 9% and 11% at. composition) which are represented by the purple lines in Figure 1b. Properties of the sample with 3% Ca have been reported elsewhere [23]. In addition, two extra targets (Ba(Ti0.8Zr0.2)O3 and (Ba0.785Ca0.215)(Ti0.715Zr0.285)O3) were used to synthesized 3 additional libraries (binary samples), represented by the blue dashed lines in Figure 1b and dubbed route 1 to 3. Route 1 is equivalent to the solid solution studied by Liu and Ren [11]. The KrF excimer laser fluence was set at 2J·cm−2, the temperature at 700 °C and the deposition dynamic oxygen pressure at 0.3mbar. These deposition conditions led to epitaxial growth of well-crystallised and smooth BCTZ film libraries on (001) SrTiO3 single crystal substrates (See supplementary Figures S1–S3). Part of the substrate was covered during growth to allow access to the IrO2 bottom electrode (see details in supplementary Figure S4). After deposition, a static oxygen pressure of 500mbar was introduced in the chamber. The samples were then cooled down to 400 °C at 3 °C·min−1 and then kept for 1 h at this temperature before cooling down to room temperature. DC magnetron sputtering was then used to deposit Au top electrodes (100 × 300 µm2) through a shadow mask. A matrix of 600 capacitors (50 columns along the composition gradient with 12 repetitions per composition) was thus defined on each library. A schematic of the sample structure is represented in the top-right of Figure 1b. The composition gradient extends along 7 mm, edged by two 1.5 mm wide stripes with constant composition to accommodate for the mask/substrate relative alignment resolution and allowing precise gradient localization during electrical characterization. Thus, 35 different compositions between gradient end members were actually electrically measured. The composition gradient along the sample libraries was characterized either by Wavelength Dispersive Spectroscopy (WDS JEOL JXA-8230 EPMA) or by Rutherford Backscattering Spectroscopy (RBS). The capacitance measurements were realised using an Agilent 4294a impedance analyzer and a motorized cascade probe station. A fast initial C(V) scan through the libraries was performed at 100kHz under an AC voltage of 50mV and sweeping the DC voltage from −5 V to +5 V and then from +5 V to −5 V. The automatization of these measurements allowed for the total 6600 capacitors (11 libraries) to be characterized within 24 h. After treating the initial fast scan data, selected lines of compositions were then destructively measured from −7 V to 30 V to determine high field tunability and breakdown voltage versus the composition variation.

3. Results

3.1. Composition Gradient Characterization

To establish the control of both local composition and BCTZ thickness across the libraries, WDS profiles of Ba, Ca, Zr, Ti, Ir, Si elements were measured along the gradient (250 steps every 40 microns) and perpendicular to the gradient (250 steps every 20 microns) on the 6% Ca library. E-beam excited elements emit specific photons that travel through various layers before arriving to the detector. Within these layers, the photon absorption rates depend on its energy and on the composition and thickness of the said layers. Perpendicular to the gradient, the constant nominal BCTZ composition and thickness should lead to constant absorptions rates, i.e., a constant WDS signal from Si and Ir. Indeed, we found very small relative intensity variations ( σ I / I ¯ ) for Si (1.73%) and for Ir (1.4%)(see supplementary Figure S5), implying a good homogeneity of both the composition and thickness of the BCTZ layer. BCTZ homogeneous composition was further confirmed from the relative signal variation for Ba, Ca, Ti and Zr ( σ I / I ¯ = 2.33%, 3.7%, 1.94%, 1.75%, respectively, see supplementary Figure S5). Note that the higher variation for Ca was correlated to its small signal amplitude relative to its small weight proportion within the probed volume. Along the gradient direction, the absorption rates within the BCTZ layer vary with the composition. However, the Zr and Ti signals showed, as expected, an anti-correlated almost linear continuous variation, while the Ba and Ca signals showed little variation(see supplementary Figure S6). To quantify the BCTZ composition, we self-consistently simulated the photon absorption within each layers using a commercial software (STRATAGEM) after acquiring the WDS signals in one location at several acceleration voltages. Assuming an oxygen stoichiometric formula BaxCayTizZrtO3 and no conditions on x, y, z and t, the extracted composition was Ba0,91Ca0,08Ti0,87Zr0,14O3, close to the nominal Ba0,94Ca0,06Ti0,845Zr0,155O3. Note that the total self-consistently extracted atomic composition for the A and B site (A0.99B1.01O3) are very close to unity. The composition gradient was also checked by RBS on the 3% Ca library [23].

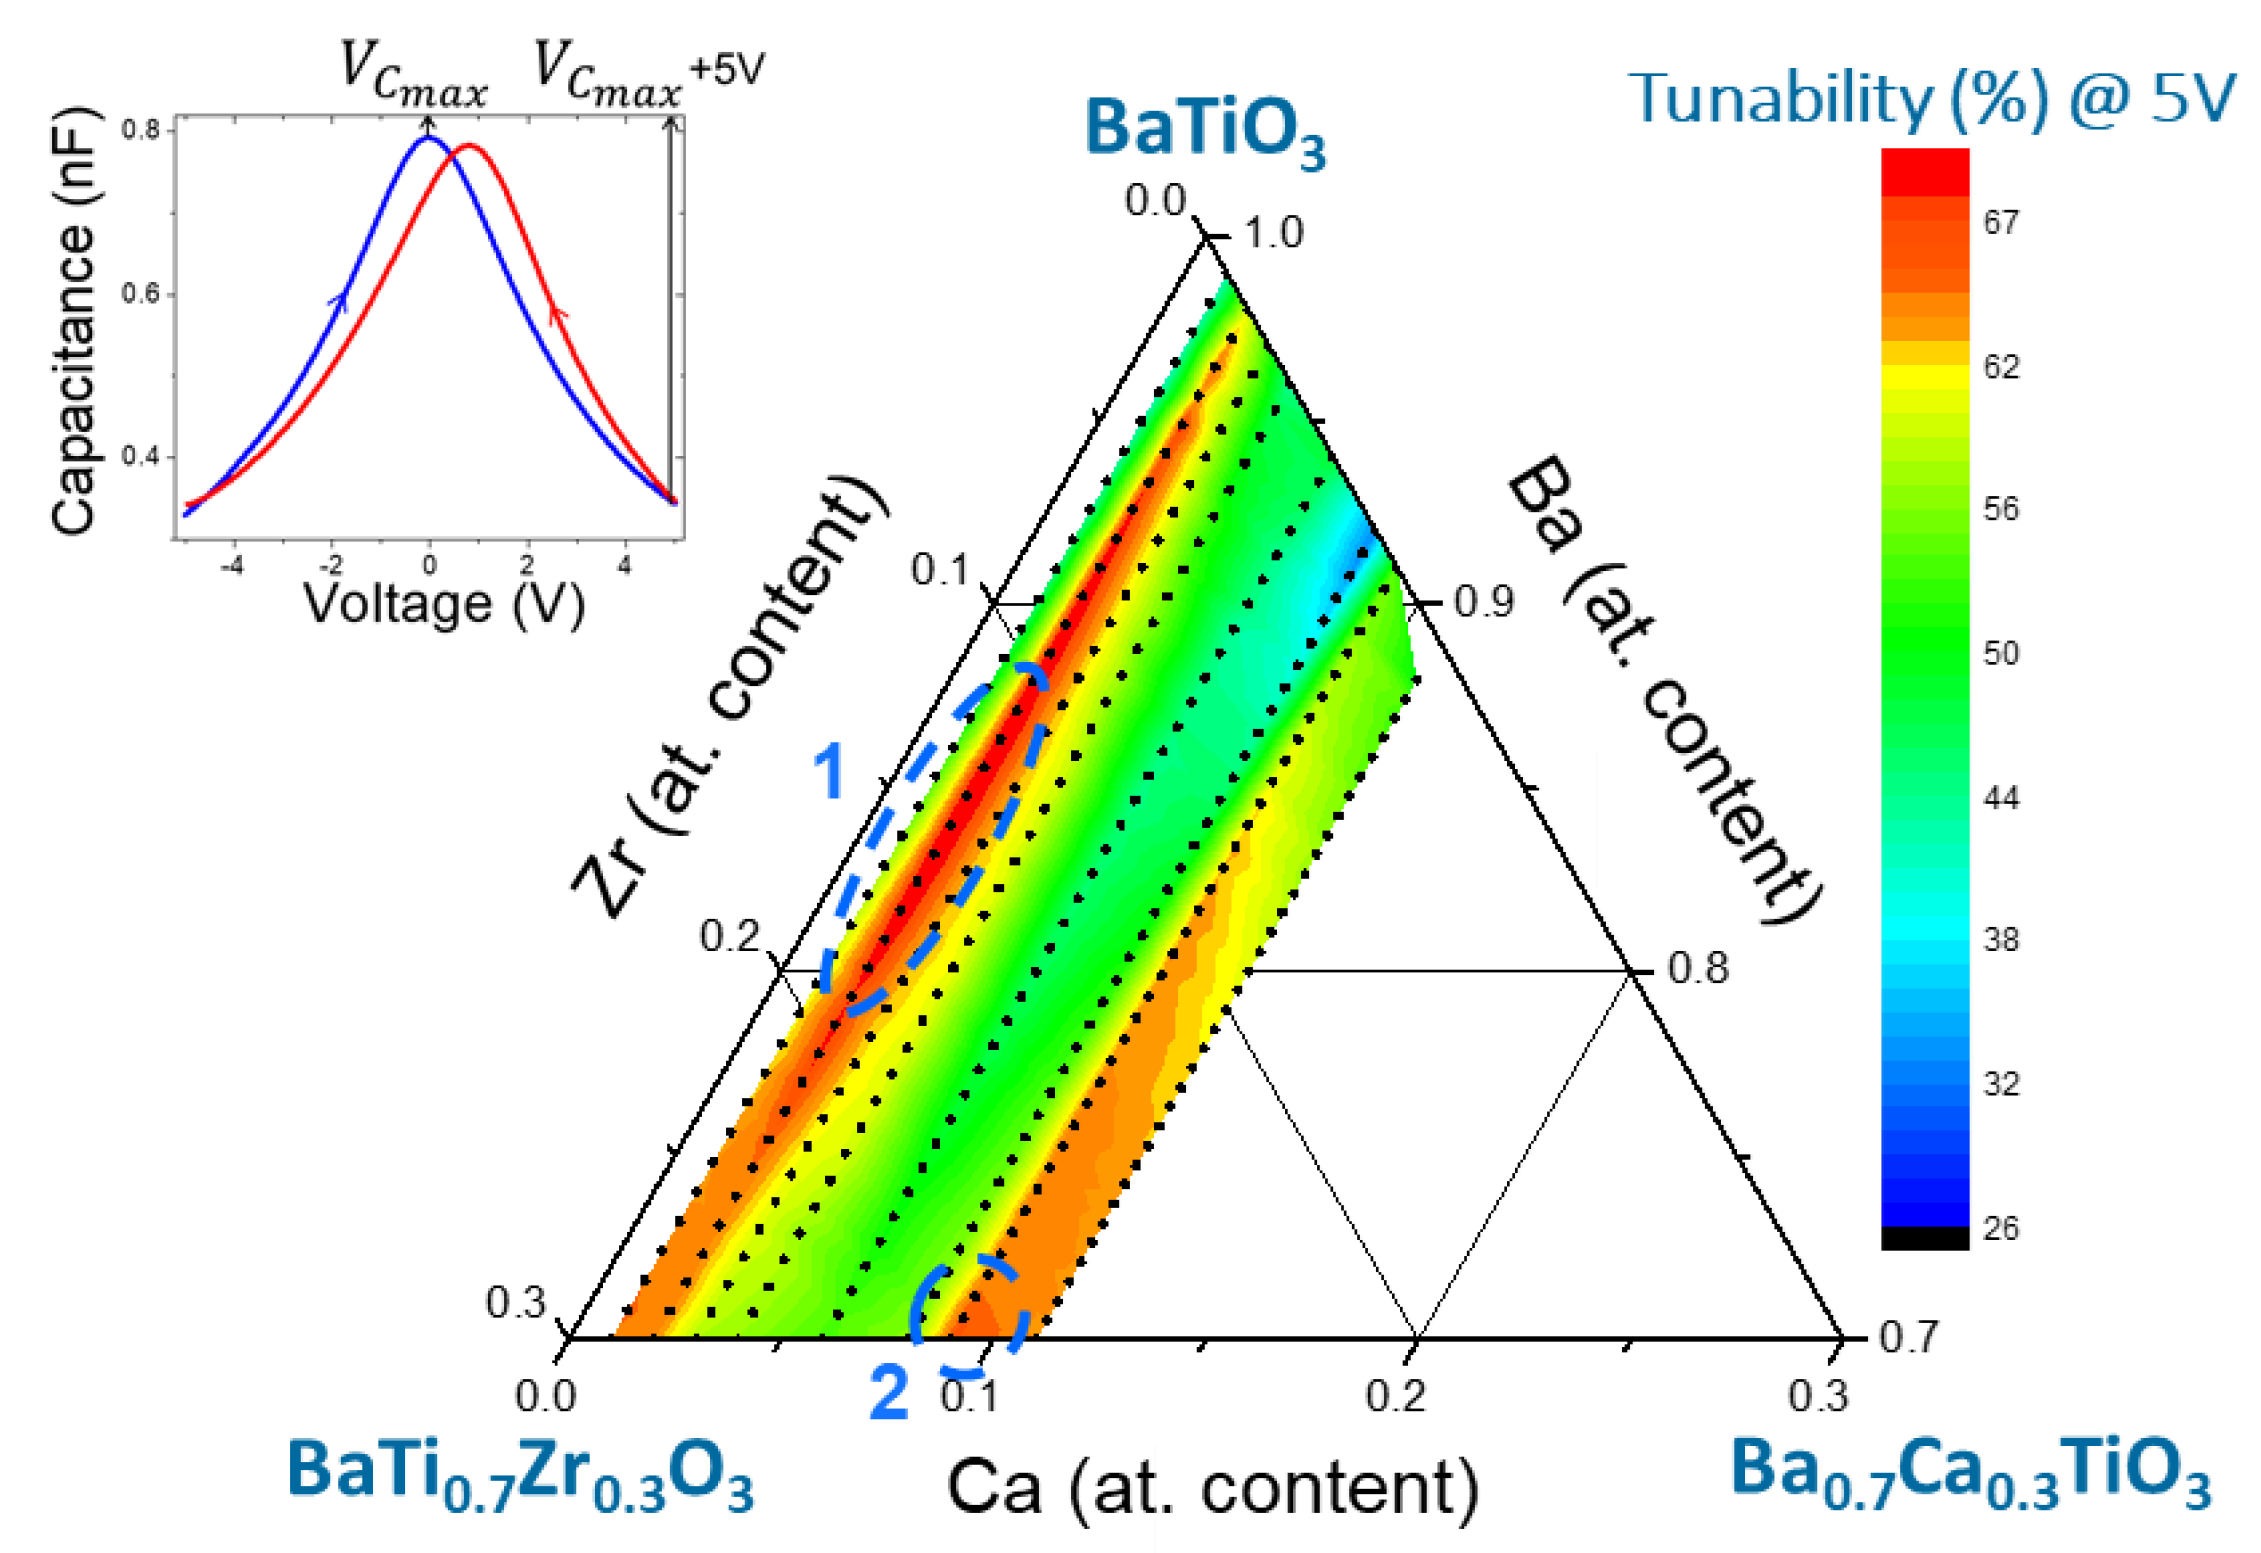
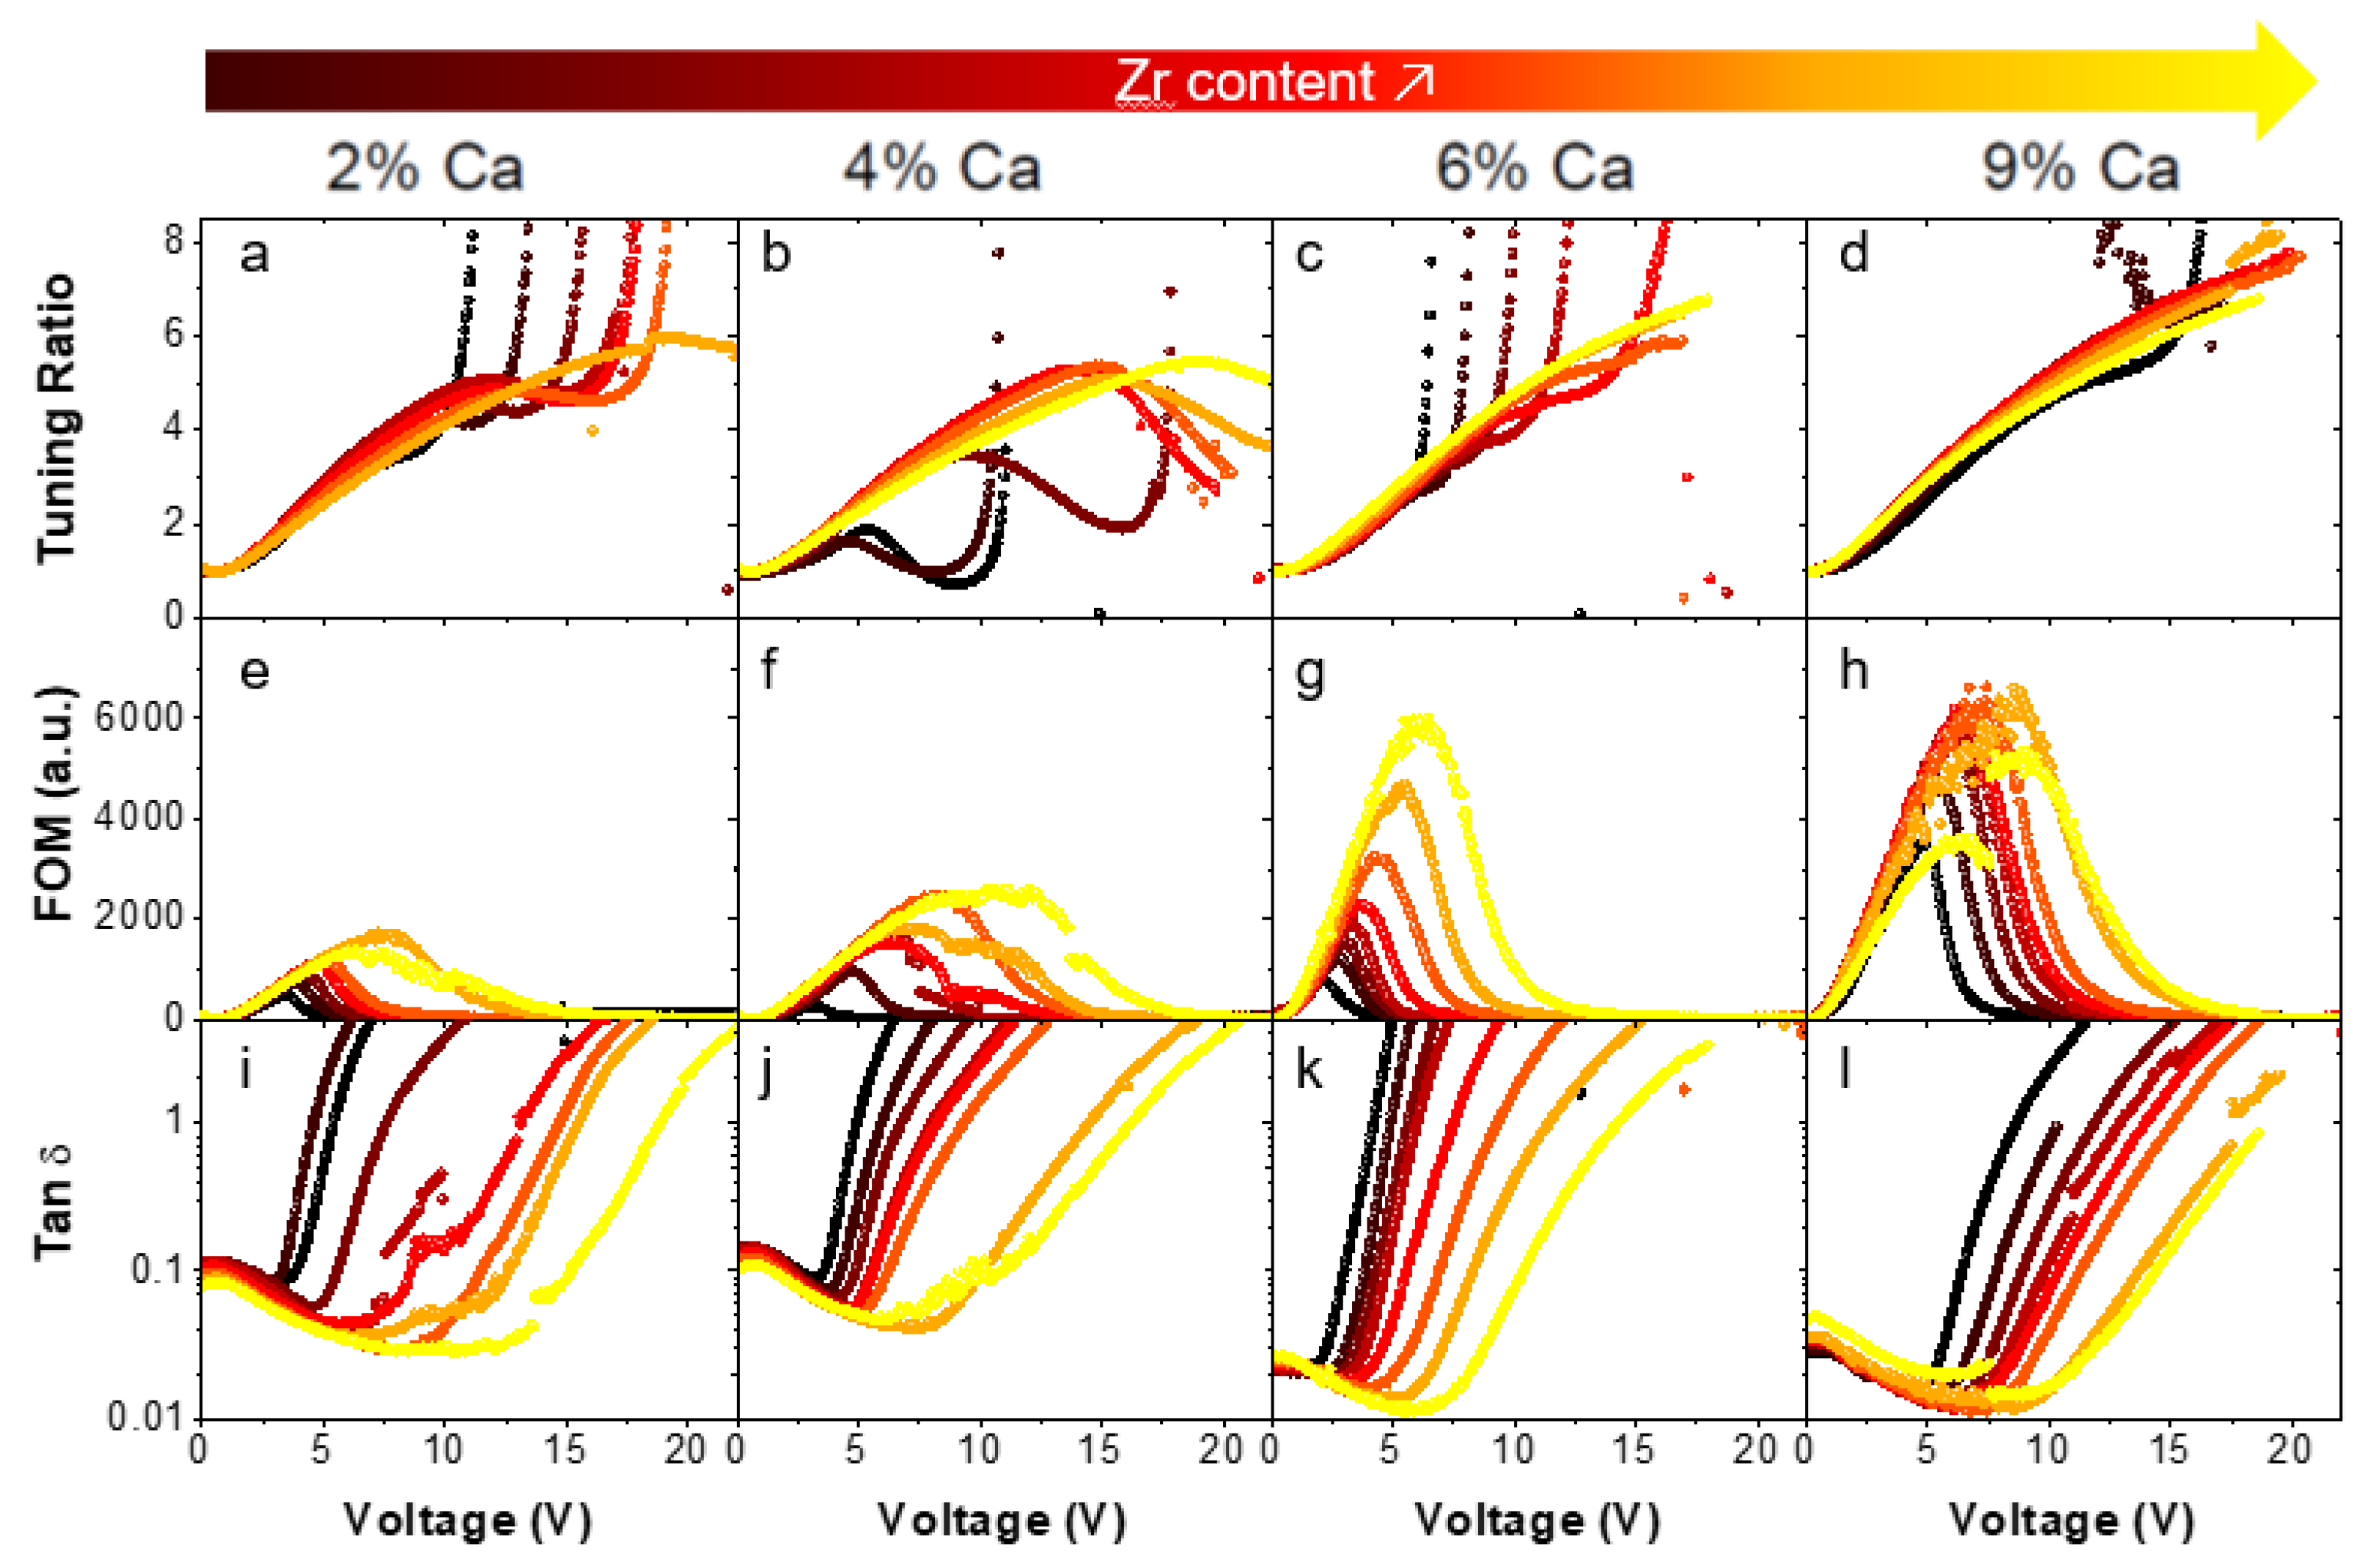
3.2. Fast Intitial C(V) Screening
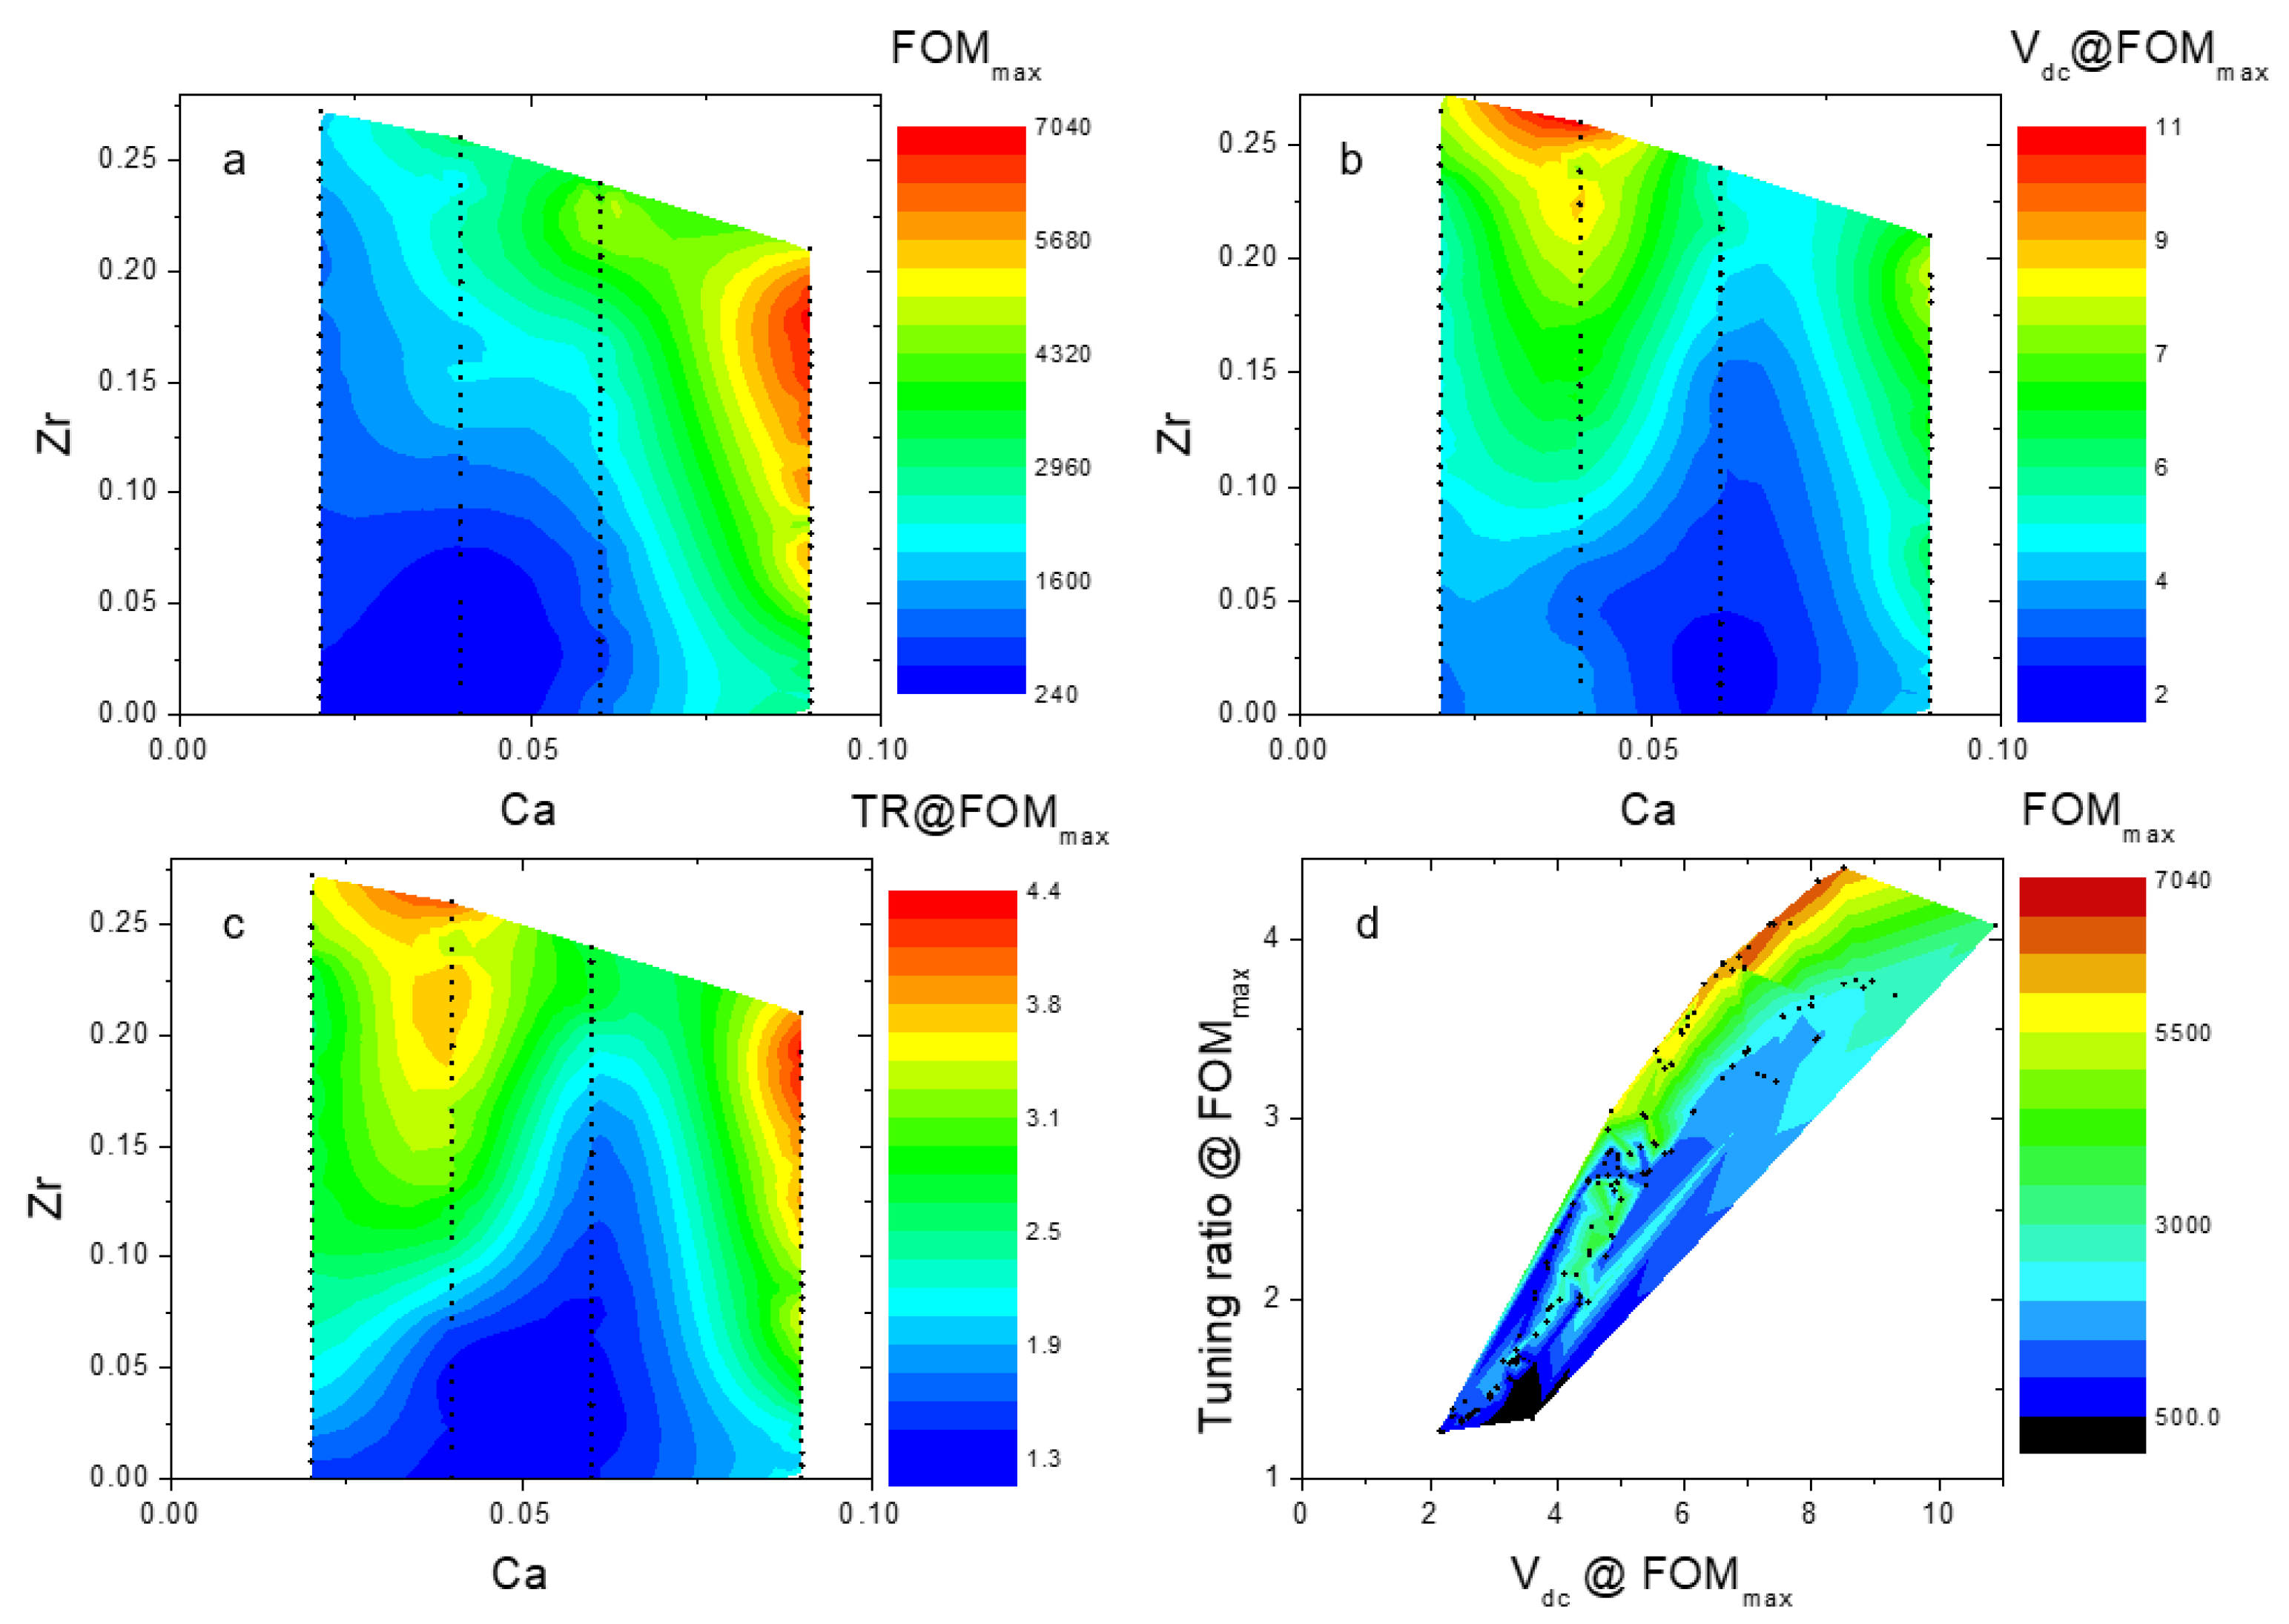
Figure 2 shows a map of the tunability of the 280 compounds tested on the eight ternary libraries as a function of the nominal Zr and Ca content. For comparison purposes, the tunability of the capacitors was extracted from the C(V) curves within the same voltage range taking into account the offsets associated with composition dependent hysteretic behavior (see top-left Figure 2). The maximum capacitance (Cmax) and its associated voltage (VCmax) were extracted, and the tunability was calculated between VCmax and VCmax+ 5V as:
t u n a b i l i t y ( % ) = C m a x C ( V C m a x + 5 V ) C m a x 100 ,
A statistical analysis among the 12 representative capacitors per composition then gave the represented tunability value in Figure 2.
From this figure, two zones dubbed zone 1 and 2 with local tunability maxima are revealed: zone 1 peaking at 69% for low Ca content (2–3%) and a Zr content of about 12% and zone 2 peaking at 66% for about 10% of Ca and 21% of Zr (see blue dashed ellipses in Figure 2). We established that for the 3% Ca library, the maximum tunability was obtained for the composition that has its paraelectric to ferroelectric transition temperature (Tc) at room temperature [23]. It is then safe to assume, at least for the smaller amount of Ca (<5%), that the maximum tunability is due to the temperature dependence of the capacitance. Considering the zone 2, a decrease in Tc towards room temperature with increased Zr content could explain the higher tunabilities too. However, the much higher Zr content than in zone 1 should induce a more drastic drop in Tc; as Ca doping in BST is known to have little effect on Tc, it is not anticipated that higher Ca content in zone 2 would counteract the Zr effect. Instead, it could be an indication that we are approaching a morphotropic phase boundary.
Even though the zone at lower Ca content seems to display higher tunabilities than the zone around 10% Ca, the global device performances do not depend solely on the tunability but also on dielectric losses and on accessible voltage range. To characterize overall properties further, we selected the 2%, 4%, 6% and 9% Ca content libraries and destructively measured the C(V) curves from −7 V to 30 V along the composition gradient for a single line of capacitors to study their tunabilities and losses up to the breakdown voltage. The reason for selecting capacitors on the same lines is to ensure a fair comparison of the dielectric losses vs. composition. Indeed, dielectric losses do not depend solely on the dielectric material but also on the device connections in general, and on the bottom electrode access resistance in particular. In our sample geometry, only capacitors on a same raw (line) are at the same distance from the bottom electrode contact pad, i.e., have the same access resistance. The tuning ratio (TM = Cmax/C(V)), dielectric losses Tan δ and the figure of merit (FOM = tunability(%)/Tan δ) of the devices were then compared. Figure 3 shows the tuning ratio (a)(b)(c)(d), the FOM (e)(f)(g)(h) and Tan δ (i)(j)(k)(l) for different Ca content (2%, 4%, 6% and 9%) as a function of applied voltage and increasing the Zr amount for the ternary systems.
Based on Figure 3a–d, a tuning ratio of 5/1, corresponding to a tunability of 80%, could be reached in most of the compositions which is already promising for applications. Tuning ratios up to 7/1 were even attained for some compositions. It can also be seen that the breakdown voltage (Vbd), corresponding to the sharp increase in the tuning ratio as C(Vbd) goes to zero, increased with increasing Zr content for all the Ca content, as reported previously for 3% Ca23. From Figure 3e–h, the maximum reachable value for the FOM increased with Ca content, from about 2000 for 2% Ca, up to about 6000 for some compositions from the 6% and 9% libraries. However, the FOM decreased continuously down to 0 after a certain voltage, while the tuning ratio kept increasing so that a compromise between FOM and tuning ratio needs to be met for the best performance. This decrease in the FOM is directly related to the non-monotonic behavior of Tan δ, as shown in Figure 2i–l. The dielectric losses first decrease with the bias field, as expected for ferroelectrics, before shooting up very rapidly at an upturn voltage Vup ranging from 3 to 10 V depending on the composition. The peak in FOM occurs for the same upturn bias. Comparing curves from top and bottom panels, it can be seen that the breakdown voltage Vbd is several volts higher than Vup. The addition of Ca to BTO (i.e., Zr content = 0, black curves) has a moderate and non-monotonic effect on the Tan δ upturn voltage (Vup = 3.1 V for 2%, 3.25 V for 4%, 1.8 V for 6% and 4.5 V for 9%). Oppositely, the addition of Zr at a constant Ca content strongly and systematically increases Vup in the Tan δ. As a consequence, a continuous offsetting of the increasing branch of the losses is observed, up to 7.5 V for the Zr maximum content of 28% (Figure 3i). This is correlated with the improvement in breakdown voltage upon the Zr addition, as seen in the top panel of Figure 3. Another feature is the decrease in the dielectric loss at 0 V with the increase in Ca content (about one order of magnitude from 2% Ca to 9% Ca), whatever the Zr content.
Thus, both the addition of Ca and Zr are beneficial to the overall performance of the devices, although in different ways: Ca improves the 0 V dielectric losses, while Zr improves both the losses’ upturn voltage and the dielectric breakdown voltage.
To select the optimum composition for a given application, multiple device specifications have to be taken into account: the minimum required tuning ratio and FOM, and the maximum driving voltage available. These parameters are inter-related and have to be considered as a set. In Figure 4a–c, we represented maps of the maximum FOM (FOMmax), tuning ratio (TR) obtained at FOMmax and applied voltage (Vdc) at FOMmax for the four lines of capacitors from the 2%, 4%, 6% and 9% Ca libraries as a function of Ca and Zr contents. We summarized theses data in Figure 4d where the interconnection of the operational parameters FOMmax, TR at FOMmax and Vdc at FOMmax is explicitly shown. Figure 4d allows us to assess quickly if some compounds fulfill all specifications of a given application. One can see from these maps that the highest Vdc value (11 V) obtained for 4% of Ca and about 26% of Zr leads to the highest TR but not necessarily to the highest FOMmax. The best set of (TR, FOMmax) is obtained for higher Ca content (9%) and high Zr content (about 19%).
To access rapidly to the part of the phase diagram containing, at the same time, a high content of Ca an Zr and to reproduce the solid solution from [11], we used two extra targets, respectively, Ba0.785Ca0.215Ti0.715Zr0.285O3 (BCTZ) and BaTi0.8Zr0.2O3 (BZT), to produce three binary samples dubbed route 1, 2 and 3 (see dotted blue lines Figure 1). The same analysis was then conducted on the binary sample. Figure 5a–f shows the FOM and tuning ratio for the three lines.
The highest reachable FOM values among all the samples were displayed by the BTO-BCTZ system (route 2 Figure 5d). However, as both the amount of Zr and Ca were increasing up to 0.285 and 0.215, respectively, it can be seen that the voltage required to reach a tuning ratio, e.g., a tuning ratio of 5, increased (Figure 5a). Thus, while adding Zr and Ca is beneficial for the FOM, increasing their amount above a certain limit led to the decrease in the tuning ratio at a given voltage. From Figure 5b,e, along route 1 from BCT to BZT, i.e., decreasing Ca and increasing Zr amounts, the tuning ratio at a given voltage increased, while the FOM improved before deteriorating at a low amount of Ca, consistent with our previous observations for the ternary systems. In Figure 5c,f (route 3 from BCT to BCTZ), where the amount of Ca decreased from 0.3 to 0.215, while the Zr amount was increasing from 0 to 0.285, it can be seen that the FOM and especially the tuning ratio are overall the worst of those three samples. This may be related to the solid solution limit of Ca found in the BTO structure, which is at about 22% Ca for ceramics prepared by conventional solid-state reaction [26] up to about 34% Ca for ceramics prepared by the zone-melt method [27].
There is no point to map the evolution of FOMmax, Vdc and TR at FOMmax vs. the composition for the binary samples, the lines being too far away in the ternary phase diagram. It is, however, possible to display those parameters vs. the Ca content in a continuous way, taking advantage of the common end members’ composition that are the BCTZ and BCT targets for routes 2–3 and 3–1, respectively (Figure 6a–i). As pointed out earlier, in these set of capacitors measured destructively, one composition has only one representative, so no statistical analysis could be applied per composition. Instead, we have taken advantage of the continuous spread of composition by smoothing the data in Figure 6a–i using three adjacent points averaging. Error bars in the FOM data are estimated to about 300 from the noise present in the loss signal close to its minimum. A sort of plateau can be seen in the tuning ratio at FOMmax (TR≈3.6) for the BTO-BCTZ system (Figure 6a) for 8% ≤ Ca content (at.) ≤ 12%, but interestingly both FOMmax and Vdc increase by 50% over this range. A similar trend was reported on BCTZ thin film obtained by co-sputtering along the line Ba1−xCaxTi1−xZrxO3, with a maximum of tunability recorded for x = 0.12. [28]. Although the TR starts to decrease for Ca > 12%, the FOMmax still increases and reaches about 8900, i.e., the highest value of this study, for 16.5% ≤ Ca ≤ 19%. In route 3, adding some Ca while removing some Zr from BTCZ towards BCT helps neither the TR nor the FOMmax (Figure 6b,e respectively), and route 3 is clearly not the way to go for tunable capacitors. Finally, along the BCT-BZT route analogous to [11], no local enhancement of TR, FOMmax or Vdc was observed around a Ca content (at.) of 15% corresponding to the MPB [11,12,13,14,15,16,17,18] (Figure 6c,f,i). Instead, a steady increase in TR, FOMmax and Vdc is observed as Ca content decreases below 15%, with a peak at Ca (at.) = 3.33% corresponding to FOMmax ≈ 6740, TR ≈ 4 and Vdc ≈ 5.7 V at FOMmax, i.e., close to the best values reported in the ternary libraries.
Again, we summarized these data in Figure 6j where FOMmax vs. TR and Vdc at FOMmax is mapped for the binary libraries together with the ternary libraries.

4. Discussion

The original CPLD approach described here in exploring ternary phase diagrams in a reliable and statistical way by taking multiple slices across the diagram is a major upgrade of the combinatorial exploration in thin film developed so far. There are multiple improvements of this approach with respect to published work on combinatorial exploration of ternary phase diagrams using a single sample. First, the simple masking scheme used here to localize the deposition on the substrate allows a tight control of the local composition and thickness. In previous published work using shadow masks, the masking scheme was quite complex [21,22], implying a very difficult control of both the composition and the thickness over the library. Hence, the reported local composition in ref [21] was off nominal, with no mention of the thickness uniformity, while in most studies, a comparison between actual and nominal local compositions is not even addressed [29]. Other groups produced ternary phase diagrams by PLD without shadow masks, relying on rotated and off-centred substrates to produce lateral thickness variations in different directions for each target. Prediction of thickness variation and local composition were then made using simple models and simulations, which correlate at least semi-quantitatively with the measured compositions and thicknesses for binary oxides [30]. A demonstration has not been made for multi-cationic targets, and by nature this deposition scheme cannot produce uniform thickness libraries. Another improvement over previous work is the statistical population per composition given here by the slicing approach, which gives confidence and credibility in the determined properties. Outliers are easily spotted and dismissed with a statistical analysis. Furthermore, in previous work on tunable material with a complete ternary phase diagram on a single sample, there was no room for an access to bottom electrodes. Tunability and losses were evaluated by a scanned microwave microscope [29] at GHz frequencies with no electrodes; thus, it did not encompass any electrode/dielectric interface effect.
Regarding the exploration of the BCTZ phase diagram presented here, we characterized 35 different compounds on each of the 11 synthesized libraries, i.e., a total of 385 different compositions. A fast initial low voltage C(V) screening allowed us to identify two regions with high tunabilities. Higher voltage characterizations, up to the breakdown voltage, were made to investigate the relative roles of Ca and Zr further with respect to tunability, losses, voltage at loss upturn (Vup) and breakdown voltages (Vbd). It has been shown that Ca and Zr substitutions are beneficial up to a certain point with different benefits. Ca substitution for Ba reduces the losses at zero biasing voltage, while Zr substitution for Ti improves both the losses’ upturn voltage and the dielectric breakdown voltage. As a higher dc field and tuning ratio are accessible when increasing Vup, Zr substitution is also beneficial for the FOM. In general, for a given composition, the best performances with minimal losses were obtained at Vup where the FOM reached its maximum. The representation in a single map of the maximum FOM vs. Vdc and TR at FOMmax (Figure 6j) for the 385 tested compounds allows us to identify quickly whether compositions exist that fulfill all specifications associated with a given applications. Indeed, no composition maximizes all the operational parameters, and the overall maximum FOM found here (about 9000 for Ba0.84Ca0.16Ti0.8Zr0.2TiO3) did not correspond with the maximum overall tuning ratio (4.4 for Ba0.91Ca0.09Ti0.81Zr0.19TiO3 with FOMmax = 6600 and Vdc = 8.5 V). For comparison purposes, let us consider state-of-the-art tunable BST-doped material found in commercial STMicroelectronics RF tunable capacitors for antenna impedance matching in 4G mobile phones. In the capacitor specifications [31] are reported a tuning ratio of 5/1 from 1 V to 24 V (i.e., Vdc = 24 V, tunability = 80%) and a quality factor Q = 55 (at 2 V and 700 MHz, Q = 1/Tanδ) giving a FOM of 4400. Comparing with Ba0.91Ca0.09Ti0.81Zr0.19TiO3, we have a slightly smaller tuning ratio (4.4 vs. 5), a higher FOM (6600 vs. 4400) and a much lower driving voltage (8.5 V vs. 24 V). This compound might be better suited than doped BST for near field communications (NFC) applications where the driving field does not exceed 3 V. Finally, the large range of properties described here illustrates the flexibility of the BCTZ system depending on the needs.

5. Conclusions

We deposited polycrystalline BCTZ thin films libraries on IrO2/Si(100) substrates using a refined combinatorial pulsed laser deposition (CPLD) scheme. We showed that CPLD is a powerful technique to study continuous lines reliably through the BaTiO3-CaTiO3-BaZrO3 phase diagram (or any other phase diagram) in thin film form, which is crucial for their integration into devices, and allows a comparison with their bulk counterpart. By investigating the tunabilities and the figures of merit of the devices at room temperature, we were able to determine regions of the phase diagram with either the highest tunability or the highest FOM. Thus, we were able to determine a composition depending on the needs: low operation voltage (if high tunability is not required), high tuning ratio (up to 4.4) and high FOM (up to 9000). Finally, these results showed that BCTZ is a good candidate for tunable application and can potentially be used as a starting block for further improvements in their functionality.

Supplementary Materials

The following are available online at https://www.mdpi.com/article/10.3390/coatings11091082/s1. Figure S1. (a) Diffractogram of a Ba0.785Ca0.215Ti0.715Zr0.285O3 film; (b) AFM surface topography im-age of the same Ba0.785Ca0.215Ti0.715Zr0.285O3 film. Figure S2. RSMs around the (103) node measured at various X position along the gradient of the BaTiO3-Ba0.785Ca0.215Ti0.715Zr0.285O3 library grown on (La,Sr)MnO3/STO. Figure S3. BCTZ in-plane and out-of plane lattice parameters, and c/a tetragonality, versus posi-tion. Figure S4. (a) Schematics of the shadow-mask deposition process and of the obtained CPLD li-braries; (b) Schematic (top) and top view picture (bottom) of a finalized library. Figure S5. (a) WDS signals coming from Zr, Ca and Ir along the white arrow (left) where a con-stant composition and thickness of BCTZ is targeted. Figure S6. Schematic (top left) of the 6% Ca library with the WDS scanning line (white arrow) and the location for quantitative measurement (yellow spot) together with the WDS signals com-ing from Ir, Ca, Ba, Ti, and Zr along the scan.

Author Contributions

Conceptualization, C.D., J.W.; methodology, J.W.; validation, C.D.; investigation, C.D., J.W., P.P., P.G., Q.S., S.P., M.M., B.N.; data curation, C.D.; writing—C.D.; writing—review and editing, J.W., N.J.; project administration, J.W.; funding acquisition, M.M., P.P., J.W. All authors have read and agreed to the published version of the manuscript.

Funding

This research was funded by Investissement d’Avenir project Tours2015 and by Région Centre Val de Loire ARD Project MAPS.

Institutional Review Board Statement

Not applicable.

Informed Consent Statement

Not applicable.

Data Availability Statement

Data available upon reasonable request.

Acknowledgments

Jean-Louis Longuet from CEA, DAM, Le Ripault, F-37260 Monts, France, is acknowledged for the WDS characterizations.

Conflicts of Interest

The authors declare no conflict of interest.

References

  1. Tagantsev, A.K.; Sherman, V.O.; Astafiev, K.F.; Venkatesh, J.; Setter, N. Ferroelectric materials for microwave tunable applications. J. Electroceram. 2003, 11, 5–66. [Google Scholar] [CrossRef]
  2. Bao, P.; Jackson, T.J.; Lancaster, M.J. Barium strontium titanate thin film varactors for room-temperature microwave device applications. J. Phys. D 2008, 41, 063001. [Google Scholar] [CrossRef]
  3. Subramanyam, G.; Cole, M.W.; Sun, N.X.; Kalkur, T.S.; Sbrockey, N.M.; Tompa, G.S.; Guo, X.; Chen, C.; Alpay, S.P.; Rossetti, G.A., Jr. Challenges and opportunities for multi-functional oxide thin films for voltage tunable radio frequency/microwave components. J. Appl. Phys. 2013, 114, 191301. [Google Scholar] [CrossRef]
  4. Cole, M.W.; Joshi, P.C.; Ervin, M.H. La doped Ba1-xSrxTiO3 thin films for tunable device applications. J. Appl. Phys. 2001, 89, 6336. [Google Scholar] [CrossRef]
  5. Cole, M.W.; Joshi, P.C.; Ervin, M.H.; Wood, M.C.; Pfeffer, R.L. The influence of Mg doping on the materials properties of Ba1−xSrxTiO3 thin films for tunable device applications. Thin Solid Films 2000, 374, 34–41. [Google Scholar] [CrossRef]
  6. Horwitz, J.S.; Chang, W.; Carter, A.C.; Pond, J.M.; Kirchoefer, S.W.; Chrisey, D.B.; Levy, J.; Hubert, C. Structure/property relationships in ferroelectric thin films for frequency agile microwave electronics. Integr. Ferroelectr. 1998, 22, 279–289. [Google Scholar] [CrossRef]
  7. Wang, R.-V.; McIntyre, P.C.; Baniecki, J.D.; Nomura, K.; Shioga, T.; Kurihara, K.; Ishii, M. Effect of Y doping and composition-dependent elastic strain on the electrical properties of (Ba,Sr)TiO3 thin films deposited at 520 °C. Appl. Phys. Lett. 2005, 87, 192906. [Google Scholar] [CrossRef]
  8. Liu, G.; Wolfman, J.; Autret-Lambert, C.; Sakai, J.; Roger, S.; Gervais, M.; Gervais, F. Microstructural and dielectric properties of Ba0.6Sr0.4Ti1−xZrxO3 based combinatorial thin film capacitors library. J. Appl. Phys. 2010, 108, 114108. [Google Scholar] [CrossRef]
  9. Cole, M.W.; Hubbard, C.; Ngo, E.; Ervin, M.; Wood, M. Structure–property relationships in pure and acceptor-doped Ba1−xSrxTiO3 thin films for tunable microwave device applications. J. Appl. Phys. 2002, 92, 475. [Google Scholar] [CrossRef]
  10. Jeon, Y.-A.; Seo, T.-S.; Yoon, S.-G. Effect of Ni doping on improvement of the tunability and dielectric loss of Ba0.5Sr0.5TiO3 thin films for microwave tunable devices. Jpn. J. Appl. Phys. 2001, 40, 6496. [Google Scholar] [CrossRef]
  11. Liu, W.; Ren, X. Large piezoelectric effect in Pb-free ceramics. Phys. Rev. Lett. 2009, 103, 257602. [Google Scholar] [CrossRef]
  12. Jiang, L.L.; Tang, X.G.; Li, Q.; Chan, H.L.W. Dielectric properties of (Ba,Ca)(Zr,Ti)O3/CaRuO3 heterostructure thin films prepared by pulsed laser deposition. Vacuum 2009, 83, 1018–1021. [Google Scholar] [CrossRef]
  13. Piorra, A.; Petraru, A.; Kohlstedt, H.; Wuttig, M.; Quandt, E. Piezoelectric properties of 0.5(Ba0.7Ca0.3TiO3)—0.5[Ba(Zr0.2Ti0.8)O3] ferroelectric lead-free laser deposited thin films. J. Appl. Phys. 2011, 109, 104101. [Google Scholar] [CrossRef]
  14. Benabdallah, F.; Simon, A.; Khemakhen, H.; Elissalde, C.; Maglione, M. Linking large piezoelectric coefficients to highly flexible polarization of lead free BaTiO3-CaTiO3-BaZrO3 ceramics. J. Appl. Phys. 2011, 109, 124116. [Google Scholar] [CrossRef]
  15. Puli, V.S.; Kumar, A.; Chrisey, D.B.; Tomozawa, M.; Scott, J.F.; Katiyar, R.S. Barium zirconate-titanate/barium calcium-titanate ceramics via sol–gel process: Novel high-energy-density capacitors. J. Phys. D Appl. Phys. 2011, 44, 395403. [Google Scholar] [CrossRef]
  16. Kang, G.; Yao, K.; Wang, J. (1 − x)Ba(Zr0.2Ti0.8)O3–x(Ba0.7Ca0.3)TiO3 Ferroelectric Thin Films Prepared from Chemical Solutions. J. Am. Ceram. Soc. 2012, 95, 986–991. [Google Scholar] [CrossRef]
  17. Puli, V.S.; Pradhan, D.K.; Adireddy, S.; Martínez, R.; Silwal, P.; Scott, J.F.; Ramana, C.V.; Chrisey, D.B.; Katiyar, R.S. Nanoscale polarisation switching and leakage currents in (Ba0. 955Ca0. 045)(Zr0. 17Ti0.83)O3 epitaxial thin films. J. Phys. D: Appl. Phys. 2015, 48, 355502. [Google Scholar] [CrossRef]
  18. Keeble, D.; Benadallah, F.; Thomas, P.; Maglione, M.; Kreisel, J. Revised structural phase diagram of (Ba0.7Ca0.3TiO3)-(BaZr0.2Ti0.8O3). Appl. Phys. Lett. 2013, 102, 92903. [Google Scholar] [CrossRef]
  19. Xue, D.; Gao, J.; Zhou, Y.; Ding, X.; Sun, J.; Lookman, T.; Ren, X. Phase transitions and phase diagram of Ba(Zr0.2Ti0.8)O3-x(Ba0.7Ca0.3)TiO3 Pb-free system by anelastic measurement. J. Appl. Phys. 2015, 117, 124107. [Google Scholar] [CrossRef]
  20. Acosta, M.; Novak, N.; Rojas, V.; Patel, S.; Vaish, R.; Koruza, J.; Rossetti, G.A., Jr.; Rödel, J. BaTiO3-based piezoelectrics: Fundamentals, current status, and perspectives. App. Phys. Rev. 2017, 4, 041305. [Google Scholar] [CrossRef]
  21. Yamada, Y.; Fukumura, T.; Ikeda, M.; Ohtani, M.; Toyosaki, H.; Ohtomo, A.; Matsukura, F.; Ohno, H.; Kawasaki, M. Fabrication of Ternary Phase Composition-Spread Thin Film Libraries and Their High-Throughput Characterization: Ti1− x− yZrxHfyO2 for Bandgap Engineering. J. Supercond. 2005, 18, 109–113. [Google Scholar] [CrossRef]
  22. Yamamoto, Y.; Takahashi, R.; Matsumoto, Y.; Chikyowa, T.; Koinuma, H. Mathematical design of linear action masks for binary and ternary composition spread film library. Appl. Surf. Sci. 2004, 223, 9–13. [Google Scholar] [CrossRef]
  23. Daumont, C.; Simon, Q.; Le Mouellic, E.; Payan, S.; Gardes, P.; Poveda, P.; Negulescu, B.; Maglione, M.; Wolfman, J. Tunability, dielectric, and piezoelectric properties of Ba(1−x)CaxTi(1−y)ZryO3 ferroelectric thin films. J. Appl. Phys. 2016, 119, 094107. [Google Scholar] [CrossRef]
  24. Wolfman, J.; Negulescu, B.; Ruyter, A.; Niang, N.; Jaber, N. Interface combinatorial pulsed laser deposition to enhance heterostructures functional properties. In Practical Applications of Laser Ablation, 1st ed.; Yang, D., Ed.; IntechOpen Ltd.: London, UK, 2020; Volume 1, pp. 3–21. [Google Scholar]
  25. Ohnishi, T.; Shibuya, K.; Yamamoto, T.; Lippmaa, M. Defects and transport in complex oxide thin films. J. Appl. Phys. 2008, 103, 103703. [Google Scholar] [CrossRef]
  26. Mitsui, T.; Westphal, W. Dielectric and X-Ray Studies of CaxBa1−xTiO3 and CaxSr1−xTiO3. Phys. Rev. 1961, 124, 1354. [Google Scholar] [CrossRef]
  27. Fu, D.; Itoh, M.; Koshihara, S.-Y. Invariant lattice strain and polarization in BaTiO3–CaTiO3 ferroelectric alloys. J. Phys. Cond. Matter. 2010, 22, 052204. [Google Scholar] [CrossRef] [PubMed]
  28. Simon, Q.; Daumont, C.J.M.; Payan, S.; Gardes, P.; Poveda, P.; Wolfman, J.; Maglione, M. Extreme dielectric non-linearities at the convergence point in Ba1-xCaxTi1-xZrxO3 thin films. J. Alloys Compd. 2018, 747, 366–373. [Google Scholar] [CrossRef]
  29. Green, M.L.; Takeuchi, I.; Hattrick-Simpers, J.R. Applications of high throughput (combinatorial) methodologies to electronic, magnetic, optical, and energy-related materials. J. Appl. Phys. 2013, 113, 231101. [Google Scholar] [CrossRef]
  30. Bassim, N.D.; Schenck, P.K.; Otani, M.; Oguchi, H. Model, prediction, and experimental verification of composition and thickness in continuous spread thin film grown by pulsed laser deposition. Rev. Sci. Instr. 2007, 78, 072203. [Google Scholar] [CrossRef]
  31. Commercial Tunable Capacitor Specification Sheet. Download Product Specifications: DS11850 Parascan™ Tunable Integrated Capacitor. Available online: https://www.st.com/en/emi-filtering-and-signal-conditioning/stptic-27c4.html#documentation (accessed on 25 August 2021).
Figure 1. (a) Schematic of the perovskite single layer (psl) CPLD cycle deposition using 3 targets. A unique deposition rate of N laser pulses/psl is assumed and 0 < x < 1. (b) Targets’ composition (black dots) and synthesized libraries (purple lines from 3 targets, blue dashed lines from 2 targets) represented within the BaTiO3-BaZrO3-CaTiO3 ternary phase diagram. Inset represents a schematic of the sample’s microstructure.
Coatings 11 01082 g001
Figure 2. Fast initial screening tunability map (5 V amplitude). The black dots are the actual data points. Top-left is a typical hysteretical C(V) curve.
Coatings 11 01082 g002
Figure 3. Tuning ratio (ad), FOM (eh) and Tan δ (il) vs. applied dc voltage and Zr content for different amounts of Ca. From left to right: 2%, 4%, 6%, 9% Ca. The amount of Zr increases from black (dark) to yellow (bright) in each graph.
Coatings 11 01082 g003
Figure 4. Maps of FOMmax (a), Vdc at FOMmax (b) and TR at FOMmax (c) for the 2%, 4%, 6%, 9% Ca libraries vs. Ca and Zr amount. (d) Map of FOMmax vs. TR at FOMmax and Vdc at FOMmax for the same capacitors. Black dots are the actual data points.
Coatings 11 01082 g004
Figure 5. Tuning ratio (ac), FOM (df) and Tan δ (gi) vs. applied dc voltage for varying Ca and Zr content along route 2 (BTO-BCTZ), route 1 (BCT-BZT) and route 3 (BCTZ-BCT).
Coatings 11 01082 g005
Figure 6. (ac) TR at FOMmax, (df) FOMmax and (gi) Vdc at FOMmax along route 2 (BTO-BCTZ), route 3 (BCTZ-BCT) and route 1 (BCT-BST) (from left to right). (j) Map of FOMmax vs. TR at FOMmax and Vdc at FOMmax for all the capacitors (binary and ternary systems) characterized at high voltage. Black dots are the actual data points.
Coatings 11 01082 g006
Publisher’s Note: MDPI stays neutral with regard to jurisdictional claims in published maps and institutional affiliations.

