Abstract
Non-steroidal anti-inflammatory drugs (NSAIDs) are among the most common pharmaceuticals used worldwide. They are widely detected in natural waters due to their persistence in wastewater treatment, and their removal is desirable in wastewater management. As a contribution to tackle this challenge, this study explores magnetic quaternary chitosan-based nanosorbents for the effective magnetically assisted removal of three NSAIDs (diclofenac, naproxen, and ketoprofen) from water. Toward this goal, silane groups were grafted onto the backbone of trimethyl chitosan through the reaction with an epoxide functionalized silane. Once silanized, the modified chitosan was employed to coat Fe3O4 nanoparticles. The prepared materials were characterized using FTIR spectroscopy and solid-state 29Si and 13C NMR spectroscopy, which confirmed the encapsulation of Fe3O4 nanoparticles with a hybrid siliceous material enriched in trimethyl chitosan. The effect of the initial NSAIDs concentration, pH, and contact time in the adsorption behavior was investigated. The kinetic data were well described by the pseudo-second-order kinetic model, indicating a chemisorption mechanism. The maximum adsorption capacities estimated from the Langmuir model were 188.5 mg/g (0.5925 mmol/g), 438.1 mg/g (1.7371 mmol/g), and 221.5 mg/g (0.8710 mmol/g) for diclofenac, naproxen, and ketoprofen, respectively. These adsorption capacities are higher than those of most reported sorbents, indicating the potential of these biosorbents to remove the selected NSAIDs using low-energy magnetically assisted separation.
1. Introduction
Water pollution is one of the most critical environmental problems that the world urgently needs to address, since clean water is vital for every living organism [1]. There has been an increasing interest in emerging contaminants, such as pharmaceutically active compounds [2]. In the European Union (EU), about 3000 different substances are used for human medication purposes that are highly persistent in the environment and are of toxicological concern [3]. These chemicals are considered emerging pollutants because their discharge limits in the environment still remain unregulated or are in the process of regularization [4,5]. Non-steroidal anti-inflammatory drugs (NSAIDs) are among the most frequently used pharmaceuticals and are included in the watch list of compounds in the EU related to the top 10 persistent pollutants [6]. NSAIDs encompass an extensive range of pharmaceuticals used to treat pain and inflammation in different arthritic and post-operative situations [6,7]. Among the NSAIDs, diclofenac (DCF), naproxen (NAP), and ketoprofen (KET) are recurrently detected in the environment as trace contaminants [1,8,9]. NSAIDs undergo several processes during wastewater treatment, but they are not entirely removed from water using conventional procedures [6,10]. This contributes to the occurrence of high levels of NSAIDs in aquatic environments, reaching values as high as μg/L concentration at multiple locations worldwide [6,11].
Several treatment methods such as activated carbon filtration, reverse osmosis, flocculation, and ozonation and advanced technologies including membrane bioreactors and advanced oxidation processes have been proposed to remove pharmaceuticals from wastewater [9,12,13,14,15]. The field application of most of these methods is limited by complex processes, high-energy consumption, and consequently high costs. In the search for greener and more sustainable removal processes, of easy operation and affordable cost, polysaccharides offer several advantages as promising candidates for adsorption processes because they are biopolymers that are naturally available, biodegradable, and relatively low-cost [16]. Furthermore, they contain numerous functional groups in their structure that can interact with pollutants dissolved in water. However, polysaccharide-based sorbents are challenging to separate from treated water, a limitation that has restrained their use [16]. To improve the adsorption properties and overcome these drawbacks, some efforts have been undertaken to develop organic–inorganic hybrids by grafting the polysaccharides to water-insoluble inorganic substrates [17,18,19,20]. Because of the mild conditions provided by sol–gel chemistry, this route is highly attractive for incorporating biopolymers [21]. These methods employ functional alkoxysilanes as linkers between the siliceous shells and the biopolymer, for obtaining hybrid materials in which such phases are strongly linked. Typically, these silane coupling agents have a functional group selected to react with the biopolymer, and hydrolyzable alkoxy groups that form covalent bonds with the siliceous component [22,23,24,25].
Chitosan is a natural amino-polysaccharide derived from chitin, which is one of the most abundant biopolymers in nature [26]. The existence of primary amine and hydroxyl groups in its structure allows for chemical modifications, improving their solubility and providing reactive groups for covalent bonding to an inorganic substrate, such as amorphous silica [27]. For example, chitosan was chemically modified into multi-functional sorbents to accomplish certain requirements for specific applications [28]; N,N,N-trimethyl chitosan (TMC), a quaternary hydrophilic derivative of chitosan, has attracted considerable attention because it contains quaternary ammonium moieties (–N+(CH3)3) in its backbone [29,30]. The cationic nature is very appealing and led to the development of novel sorbents with the ability to interact with negatively charged pollutants [29].
In the past few years, colloidal magnetic nanoparticles have been proposed as sorbents for water treatment applications due to their magnetic features, large surface area, and facile water dispersibility [16,31,32]. Magnetic nanoparticles are easily and quickly separated from treated water in the presence of an external magnetic field gradient, representing an advantage in relation to non-magnetic sorbents. Iron oxide nanoparticles are the most used in research to treat polluted water due to their low cost and moderate environmental impact [16]. These magnetic nanoparticles can be applied to remove contaminants from water provided they have been surface modified with an adequate coating, which can be either inorganic or organic in nature [16]. The enhancement of the adsorptive capacity of magnetic nanoparticles and improved selectivity towards target pollutants can be achieved by chemical functionalization of the particles’ surfaces with biopolymers.
This research aimed to explore a new chemical route for the surface modification of colloidal magnetic nanoparticles in which siliceous shells of trimethyl chitosan (TMC) have been modified with an epoxide functionalized silane coupling agent. These new magnetic nanosorbents were investigated for the adsorptive removal of three selected NSAIDs (diclofenac, naproxen, and ketoprofen) from water. Additionally, the kinetics and the equilibrium of the adsorption process were studied to understand the adsorption behavior and mechanism involved.
2. Materials and Methods
2.1. Chemicals
The pharmaceuticals used in the adsorption studies were sodium diclofenac salt (C14H10Cl2NNaO2, Alfa Aesar, Kandel, Germany, >98%), sodium naproxen (C14H13NaO3, Sigma-Aldrich, Steinheim, Germany, 98%–100%), and ketoprofen (C16H14O3, Sigma-Aldrich, >98%). Trimethyl chitosan was supplied by Henan Tianfu Chemical Co., Ltd. (Zhengzhou, China) and used as received (degree of quaternization: 15.3%). Ferrous sulfate heptahydrate (FeSO4·7H2O, Panreac, Barcelona, Spain, >99%), potassium hydroxide (KOH, LabChem, Zelienople, PA, USA, >86%), and potassium nitrate (KNO3, Sigma-Aldrich, >99%) were used in the synthesis of magnetite nanoparticles. Ethanol (CH3CH2OH, Panreac, >99%) and methanol (CH3OH, VWR, Radnor, PA, USA, >99%) were used to wash the prepared materials. 3-(glycidyloxypropyl)trimethoxysilane (GPTMS, C9H20O5Si, Sigma-Aldrich, >98%) was used as a silane coupling agent. N,N-dimethylformamide (HCON(CH3)2, Carlo Erba Reagents, Peypin, France, >99%) was used as a solvent. Tetraethyl orthosilicate (TEOS, Si(OC2H5)4, Sigma-Aldrich, >99%) was used as a silica precursor. Ammonia solution (NH4OH, Riedel-de-Häen, Hanover, Germany, 25%) was used as a base catalyst. All solutions were prepared in ultra-pure water (0.22 µm filter, Milli-Q, Millipore, Darmstadt, Germany).
2.2. Derivatization of the Quaternary Chitosan
Trimethyl chitosan (TMC) was modified by reaction with the alkoxysilane coupling agent GPTMS [19,20,33]. Hence, TMC (1 g) was previously dried at 30 °C for 24 h, and the reaction with GPTMS (5.2 mmol, 1.24 mL) was performed using dry N,N-dimethylformamide (13 mL) as solvent. The reaction was conducted at 100 °C, under a dry nitrogen atmosphere, with stirring at 500 rpm and over 24 h. The obtained material, hereafter named TMC/GPTMS, was washed thoroughly with dry methanol and dry ethanol and finally dried at room temperature.
2.3. Synthesis of Magnetic Bio-Hybrid Sorbent
The magnetic core was synthesized by oxidative hydrolysis of Fe2SO4·7H2O in alkaline conditions to obtain magnetite (Fe3O4) nanoparticles (Supporting Information) [34]. Then the magnetic core was coated using the sol–gel method by adding a mixture of the silica precursor (TEOS) with the derivatized chitosan (TMC/GPTMS). Briefly, for the coating, an ethanolic solution (38 mL) containing Fe3O4 nanoparticles (40 mg) was kept immersed in an ice bath under sonication (horn Sonics, Vibracell) for 15 min. Next, the ammonia solution (2.4 mL), TEOS (0.406 mL), and TMC/GPTMS (0.3 g) were slowly added, and the reaction was maintained for 2 h under sonication in an ice bath. After the reaction, the resulting magnetic biosorbent was collected by magnetic separation using an NdFeB magnet and washed six times with ethanol. The particles were dried at room temperature, and the quaternary chitosan magnetic biosorbent (Fe3O4@SiO2/TMC/GPTMS) was obtained.
2.4. Synthesis of Non-Magnetic Quaternary Chitosan Particles
Non-magnetic quaternary chitosan particles (SiO2/TMC/GPTMS) were also prepared by employing a similar method but in the absence of Fe3O4 nanoparticles. In the synthesis, 0.3 g of TMC/GPTMS and 0.406 mL of TEOS were added to a mixture of 0.9 mL of deionized water, 8.5 mL of ethanol, and 0.15 mL of ammonia [35]. The reaction was stirred (500 rpm) at RT for 24 h. Then, the particles were washed five times with deionized water and one time with dry ethanol, separated by centrifugation (10 min at 13,300 rpm), and dried. For complementary studies using solid state NMR spectroscopy (Bruker, Billerica, MA, USA), SiO2 particles were also prepared by using the Stöber method (Supporting Information) [36].
2.5. Characterization of Materials
2.5.1. X-ray Powder Diffraction
The crystalline structure of the produced materials was evaluated by X-ray powder diffraction (XRD). The XRD data were collected using a PANalytical Empyrean X-ray diffractometer (Malvern, Worcestershire, UK) equipped with a Cu Kα monochromatic radiation source at 45 kV/40 mA.
2.5.2. Fourier Transform Infrared Spectroscopy
Fourier transform infrared (FTIR) spectra of the materials were acquired over the range of 4000–450 cm−1 using a Bruker Optics Tensor 27 spectrometer (Bruker, Billerica, MA, USA) coupled to a horizontal attenuated total reflectance (ATR) cell. The samples were placed on the ATR crystal, and 256 scans were acquired at 4 cm−1 resolution.
2.5.3. Transmission and Scanning Electron Microscopy
The morphology of the produced materials was analyzed by transmission electron microscopy (TEM) and scanning electron microscopy (SEM). Transmission electron microscopy was performed using a Hitachi H-9000 TEM microscope (Chiyoda, Tokyo, Japan) carried out at an accelerating voltage of 300 kV. A drop (10 μL) of a diluted suspension of the particles in ethanol was placed on a copper grid with a lacey amorphous carbon film and left to dry before TEM analysis. Scanning electron microscopy was performed using a Hitachi SU-70 instrument at 15 kV. For SEM analysis, the samples were prepared by placing an aliquot of a dilute suspension of particles in ethanol on a glass slide, which was glued to the sample holder using double-sided carbon tape, and then coated with carbon.
2.5.4. Elemental Analysis, Specific Surface Area, and Pore Volume
The elemental analysis of carbon, hydrogen, nitrogen, and sulfur was performed using a Leco Truspec-Micro CHNS 630-200-200 (Leco, Saint Joseph, MI, USA). The specific surface area of the particles was assessed by nitrogen adsorption/desorption measurements using a Gemini V2.0 Micromeritics instrument (Micromeritics, Norcross, GA, USA). The materials were first outgassed overnight at 80 °C/1.5 bar, and then adsorption and desorption isotherms were conducted at liquid nitrogen temperature (−196 °C). The specific surface area was determined using the Brunauer–Emmett–Teller (BET) equation for relative pressures (P/P0) up to 0.3. The pore volume was evaluated from the adsorption amount using the Barret–Joyner–Halenda (BJH).
2.5.5. Zeta Potential
The surface charge of the colloidal nanoparticles was assessed by zeta potential measurements in a Zetasizer Nano ZS instrument (Malvern Instruments) (Malvern, Worcestershire, UK) that uses a HeNe laser operating at 633 nm and a scattering detector at 173°. The measurements were performed in aqueous suspensions of the particles using a disposable folded capillary cell.
2.5.6. Nuclear Magnetic Resonance Spectroscopy
The 13C cross-polarization (CP)/magic-angle spinning (MAS) nuclear magnetic resonance (NMR) and 29Si MAS/CP MAS NMR spectra were recorded on a Bruker Avance III 400 MHz (9.4 T) spectrometer(Bruker, Billerica, MA, USA) at 79.49 and 100.61 MHz, respectively. 13C CP/MAS NMR spectra were acquired with 3.65 μs 1H 90° pulses, 1.5 ms contact time, a recycle delay of 5 s, and at a spinning rate of 9 kHz. 29Si MAS NMR spectra were recorded with 4.5 μs 1H 90° pulses, a recycle delay of 60 s, and at a spinning rate of 5 kHz. The chemical shifts are quoted in ppm relative to tetramethylsilane (TMS).
2.6. Batch Adsorption Experiments
Individual aqueous solutions of diclofenac sodium (DCF), naproxen sodium (NAP), and ketoprofen (KET), with the required concentrations, were prepared using ultra-pure water. The DCF, NAP, and KET concentrations were determined spectrophotometrically using a Jasco U 560 UV–VIS spectrophotometer, measuring the maximum absorbance at 276, 230, and 260 nm, respectively. The calibration curves were obtained from the analysis of the spectra obtained at distinct NSAID concentrations: DCF (0.12–12.0 mg/L), NAP (0.12–3.0 mg/L), and KET (0.12–12.0 mg/L) (Figure S1, Supporting Information). The structures and characteristics of NSAIDs are shown in Table S1 (Supporting Information). The experiments were performed in glass vials, in which an exact amount of the magnetic biosorbent (0.5 mg/mL dosage) was placed in contact with solutions with known DCF, NAP, and KET concentration. The NSAID solutions containing the magnetic biosorbent were continuously stirred in an orbital shaker incubator (IKA, Staufen, Germany, KS 4000i control) at 200 rpm under controlled temperature (25.0 ± 1.0 °C) over a specific time (0 min to 300 min) in dark conditions. After adsorption for a pre-determined contact time, the biosorbent was magnetically separated using a NdFeB magnet, and the concentration of the corresponding pharmaceutical (Ct) in the supernatant was assessed by UV–VIS spectroscopy (GBC Scientific Equipment, Hampshire, IL, USA). The percentage of removal of each NSAIDs was calculated using Equation (1), where C0 is the initial concentration (mg/L).
Additionally, control experiments (pharmaceutical solution without the sorbent) were carried out simultaneously with adsorption experiments.
2.6.1. Effect of pH on the Removal of NSAIDs
DCF, NAP, and KET solutions (50 mg/L), with distinct pH values (5, 6, 7, 8, and 9), were prepared by adjusting the pH with an appropriate amount of NaOH (0.01 M) or HCl (0.01 M). The adsorption experiments were then conducted using 0.5 mg/mL of sorbent in each case. The mixtures were shaken continuously at 30 rpm for 5 h to ensure that the adsorption equilibrium was achieved. Then, the magnetic biosorbent was separated magnetically from the solution, and DCF, NAP, and KET concentrations in the supernatant were assessed by UV–VIS spectrophotometry.
2.6.2. Kinetics and Equilibrium Adsorption Studies
The adsorption kinetics of single DCF, NAP, and KET solutions with different concentrations (10, 50, and 100 mg/L) were prepared, and the pH was adjusted to 5. An appropriate amount of the magnetic biosorbent was added to the mixture (0.5 mg/mL), and the adsorption process was conducted. The mixtures were shaken, and aliquots of 1 mL were collected along the time (during 5 h, 300 min) at room temperature (25.0 ± 1.0 °C). The amount of pharmaceutical adsorbed at each time t (qt, mg/g) was determined by Equation (2):
where C0 (mg/L) is the initial concentration (mg/L), Ct (mg/L) is the pharmaceutical concentration in the aqueous phase at time t (min), V (L) is the volume of solution, and m (mg) is the mass of the magnetic biosorbent.
Equilibrium adsorption studies were performed by dispersing 0.5 mg/mL of magnetic biosorbent, in DCF, NAP, and KET aqueous solutions, with distinct initial concentrations (ranging from 5 to 350 mg/L) at pH = 5. The experiments were conducted for 5 h (300 min) at room temperature (25.0 ± 1.0 °C). The amount of DCF, NAP, and KET adsorbed at equilibrium (qe, mg/g) was assessed by UV–VIS spectroscopy and calculated using Equation (2) for Ct = Ce, where Ce (mg/L) is the concentration of DCF, NAP, and KET at equilibrium.
3. Results and Discussion
3.1. Materials Characterization
3.1.1. XRD Analysis
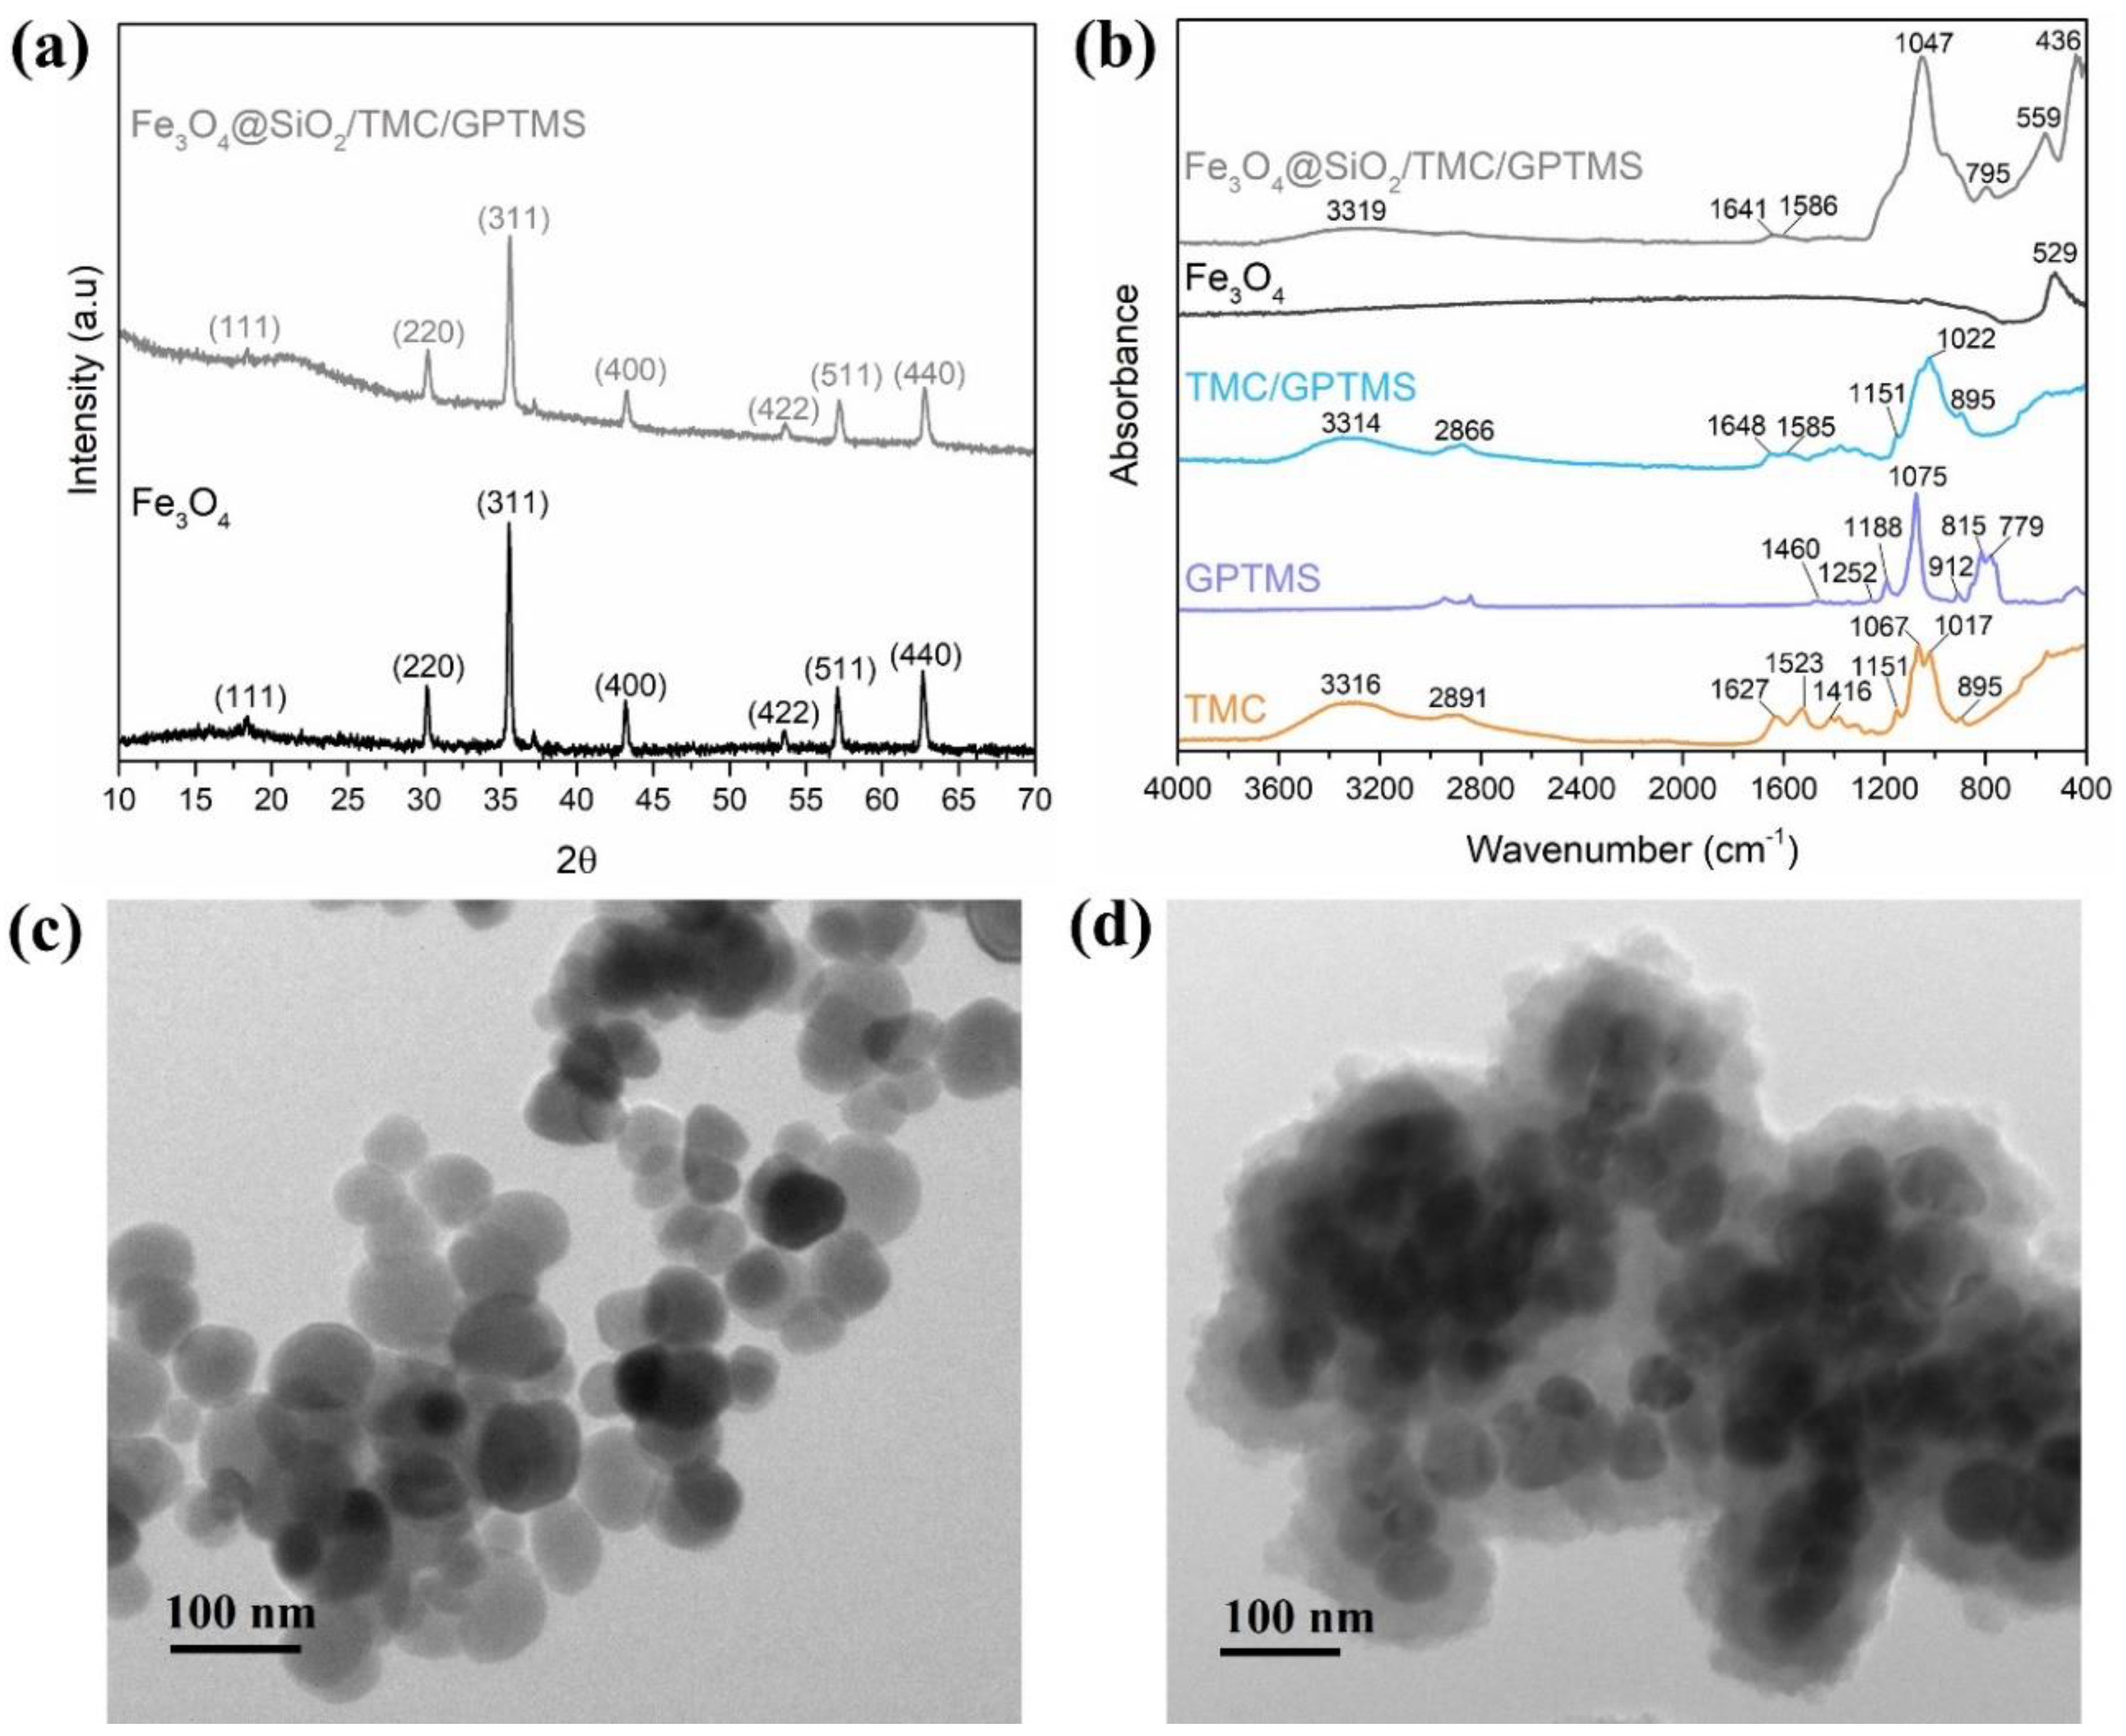
The powder X-ray diffraction (XRD) pattern of the particles used as cores (Figure 1a), along with the labelling of the respective Miller indices, indicated the presence of magnetite (Fe3O4) with cubic inverse spinel structure (JCPDS file No. 19-0629) [37]. A similar XRD pattern was observed for the Fe3O4@SiO2/TMC/GPTMS particles, confirming that after surface modification, the composition of the core of the particles was maintained as Fe3O4. The XRD of the Fe3O4@SiO2/TMC/GPTMS particles also showed a broad peak around 23° that is characteristic of short-range order in amorphous SiO2, in agreement with the presence of the siliceous network coating the magnetic cores [38]. These Fe3O4 particles are ferrimagnetic and exhibit a small magnetization hysteresis loop at room temperature with a saturation magnetization of 83 emu/g [19].
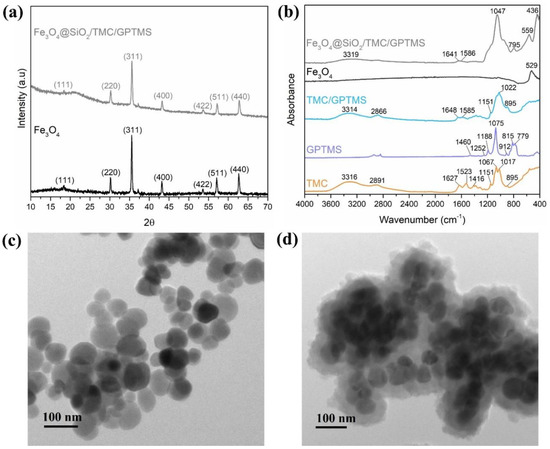
Figure 1.
(a) Powder XRD patterns of Fe3O4 and Fe3O4@SiO2/TMC/GPTMS particles; (b) ATR-FTIR spectra of TMC, GPTMS, TMC/GPTMS, Fe3O4, and Fe3O4@SiO2/TMC/GPTMS materials; and TEM images of (c) Fe3O4 and (d) Fe3O4@SiO2/TMC/GPTMS particles.
3.1.2. FTIR and TEM Results
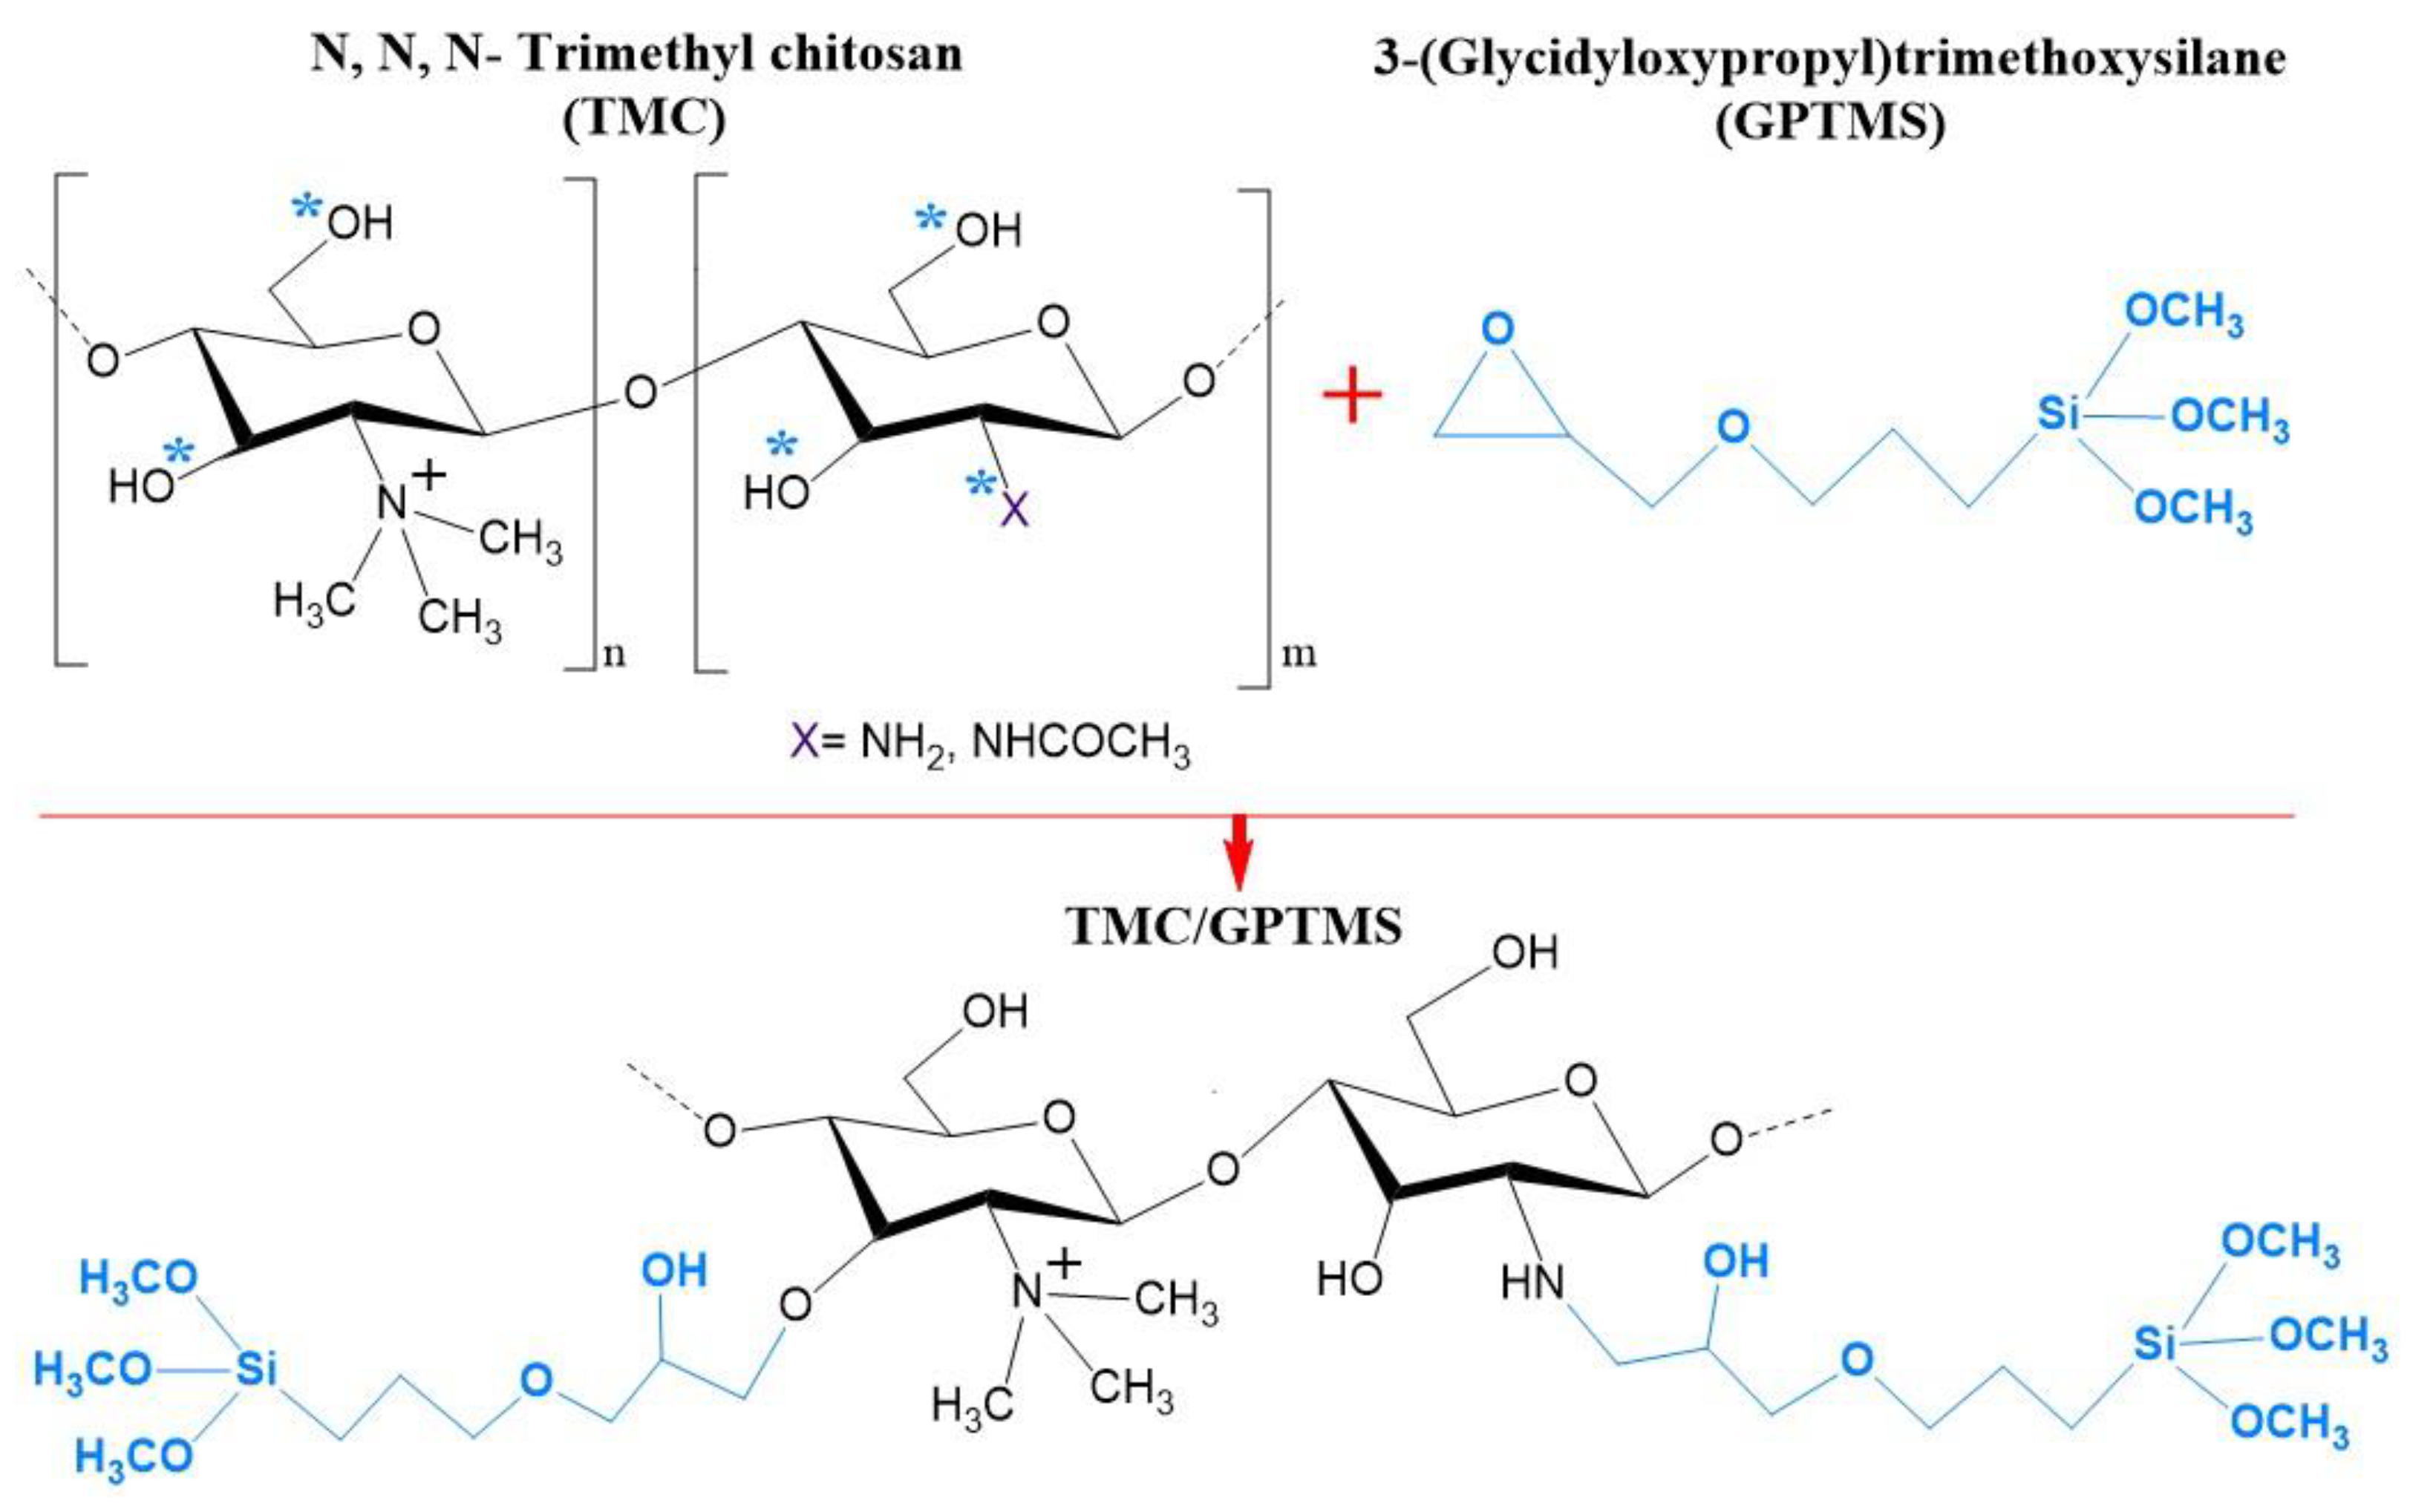
The FTIR spectrum of the Fe3O4 particles (Figure 1b) showed the characteristic band at 529 cm−1 assigned to the Fe–O stretching vibration [39]. This band was also visible at 559 cm−1 in the spectrum of Fe3O4@SiO2/TMC/GPTMS particles, although it was shifted to higher wavenumbers. FTIR analysis of the coated particles was challenging because the main vibrational bands of TMC and the siliceous network may overlap. The FTIR spectrum of TMC showed bands at approximately 3316 cm−1 attributed to –OH bonds, at 2891 cm−1 ascribed to asymmetrical stretching of C–H bonds, and peaks at 1627 and 1523 cm−1 belonging to C–O stretching (amide I) and N–H bending (amide II) vibrations, respectively [40]. Moreover, the band at 1416 cm−1 was assigned to the characteristic absorption of N–CH3 groups in TMC [41]. Additionally, the intense bands between 1000 and 1200 cm−1 were ascribed to C–O vibrations in the polysaccharide backbone [33]. In the preparation of TMC/GPTMS, both hydroxyl and amine groups of TMC can react with the epoxide groups of the alkoxysilane GPTMS to yield ether (−CH2OCH2−) and secondary amine (−CHNHCH2−) covalent bonds, respectively (Figure 2). In the FTIR spectrum of GPTMS (Figure 1b), the band at 1460 cm−1 is associated with the deformation vibrational mode of the methylene groups of the propyl unit [42,43]. The band at 1252 cm−1 was due to the epoxide ring stretching vibration, and the band at 1188 cm−1 was ascribed to the C−H deformation mode of the Si−O−CH3 [42,43,44]. The C−O stretching vibration of the epoxide ring could be observed at 912 cm−1, and the bands at 1075 cm−1, 815 cm−1, and 779 cm−1 corresponded to the stretching and bending vibrations of the Si−O−C bonds of GPTMS [42,43,45]. In the TMC/GPTMS spectrum, the absence of the band of the epoxide ring could be evidence for epoxide ring opening upon reaction with TMC [46,47,48]. The amide bands of TMC were retained and appeared shifted to higher wavenumbers (1627–1648 and 1585 cm−1 for C=O and N–H bending, respectively). This may be attributed to changes in the H-bonding network in the TMC/GPTMS. Although the FTIR results are not conclusive to clearly discern the mechanism for the reaction between TMC and GPTMS, the results suggest the formation of covalent bonding through the reaction of the epoxide ring of GPTMS. The FTIR spectrum of Fe3O4@SiO2/TMC/GPTMS particles also displayed the vibrational bands expected for a material comprising a siliceous network. This inorganic phase gives FTIR bands at 795 cm−1 and 446 cm−1 that can be assigned to symmetric Si–O–Si stretching and O–Si–O deformation modes of amorphous silica, respectively [20,33]. Moreover, the presence of a broad band centered at 1047 cm−1 can result from overlapped vibrational contributions of the trimethyl chitosan and amorphous silica [20,33].

Figure 2.
Schematic representation of the reaction between the hydroxyl (−OH) and/or amine (−NH2) groups of N,N,N-trimethyl chitosan (TMC) with the epoxide groups of 3-(glycidyloxypropyl)trimethoxysilane (GPTMS). The reactive target sites are indicated with *.
The resulting particles were composed of a magnetite spheroidal core (56 ± 11 nm) coated by amorphous shells with irregular surfaces (Figure 1c,d). The thickness of the shells was around 37 ± 6 nm. The XRD and FTIR results and the TEM images confirmed the encapsulation of the Fe3O4 particles. Note that the TEM image provided was representative of the sample, always showing denser nanoparticles (magnetite) surrounded by a material with lower image contrast (biopolymer/silica material), resulting in small aggregates with several magnetic cores.
3.1.3. Specific Surface Area and Elemental Analysis
The BET specific surface area decreased from 27.4 m2/g in Fe3O4 to 13.6 m2/g in Fe3O4@SiO2/TMC/GPTMS particles (Table 1), which is consistent with an increase of the average particle size due to the formation of the outer hybrid shells. Table 1 shows the elemental microanalysis results of the prepared materials. As expected, the Fe3O4 particles revealed negligible carbon (<0.2%) and nitrogen (<0.04%) contents. In contrast, the Fe3O4@SiO2/TMC/GPTMS particles had a carbon content of 30 wt% and a relevant nitrogen amount (5.9 wt%), confirming the incorporation of the organic (TMC) component in the final particles.

Table 1.
Compositional and structural properties of the materials: elemental analysis, particle diameter, BET surface area, and pore volume.
3.1.4. NMR Analysis
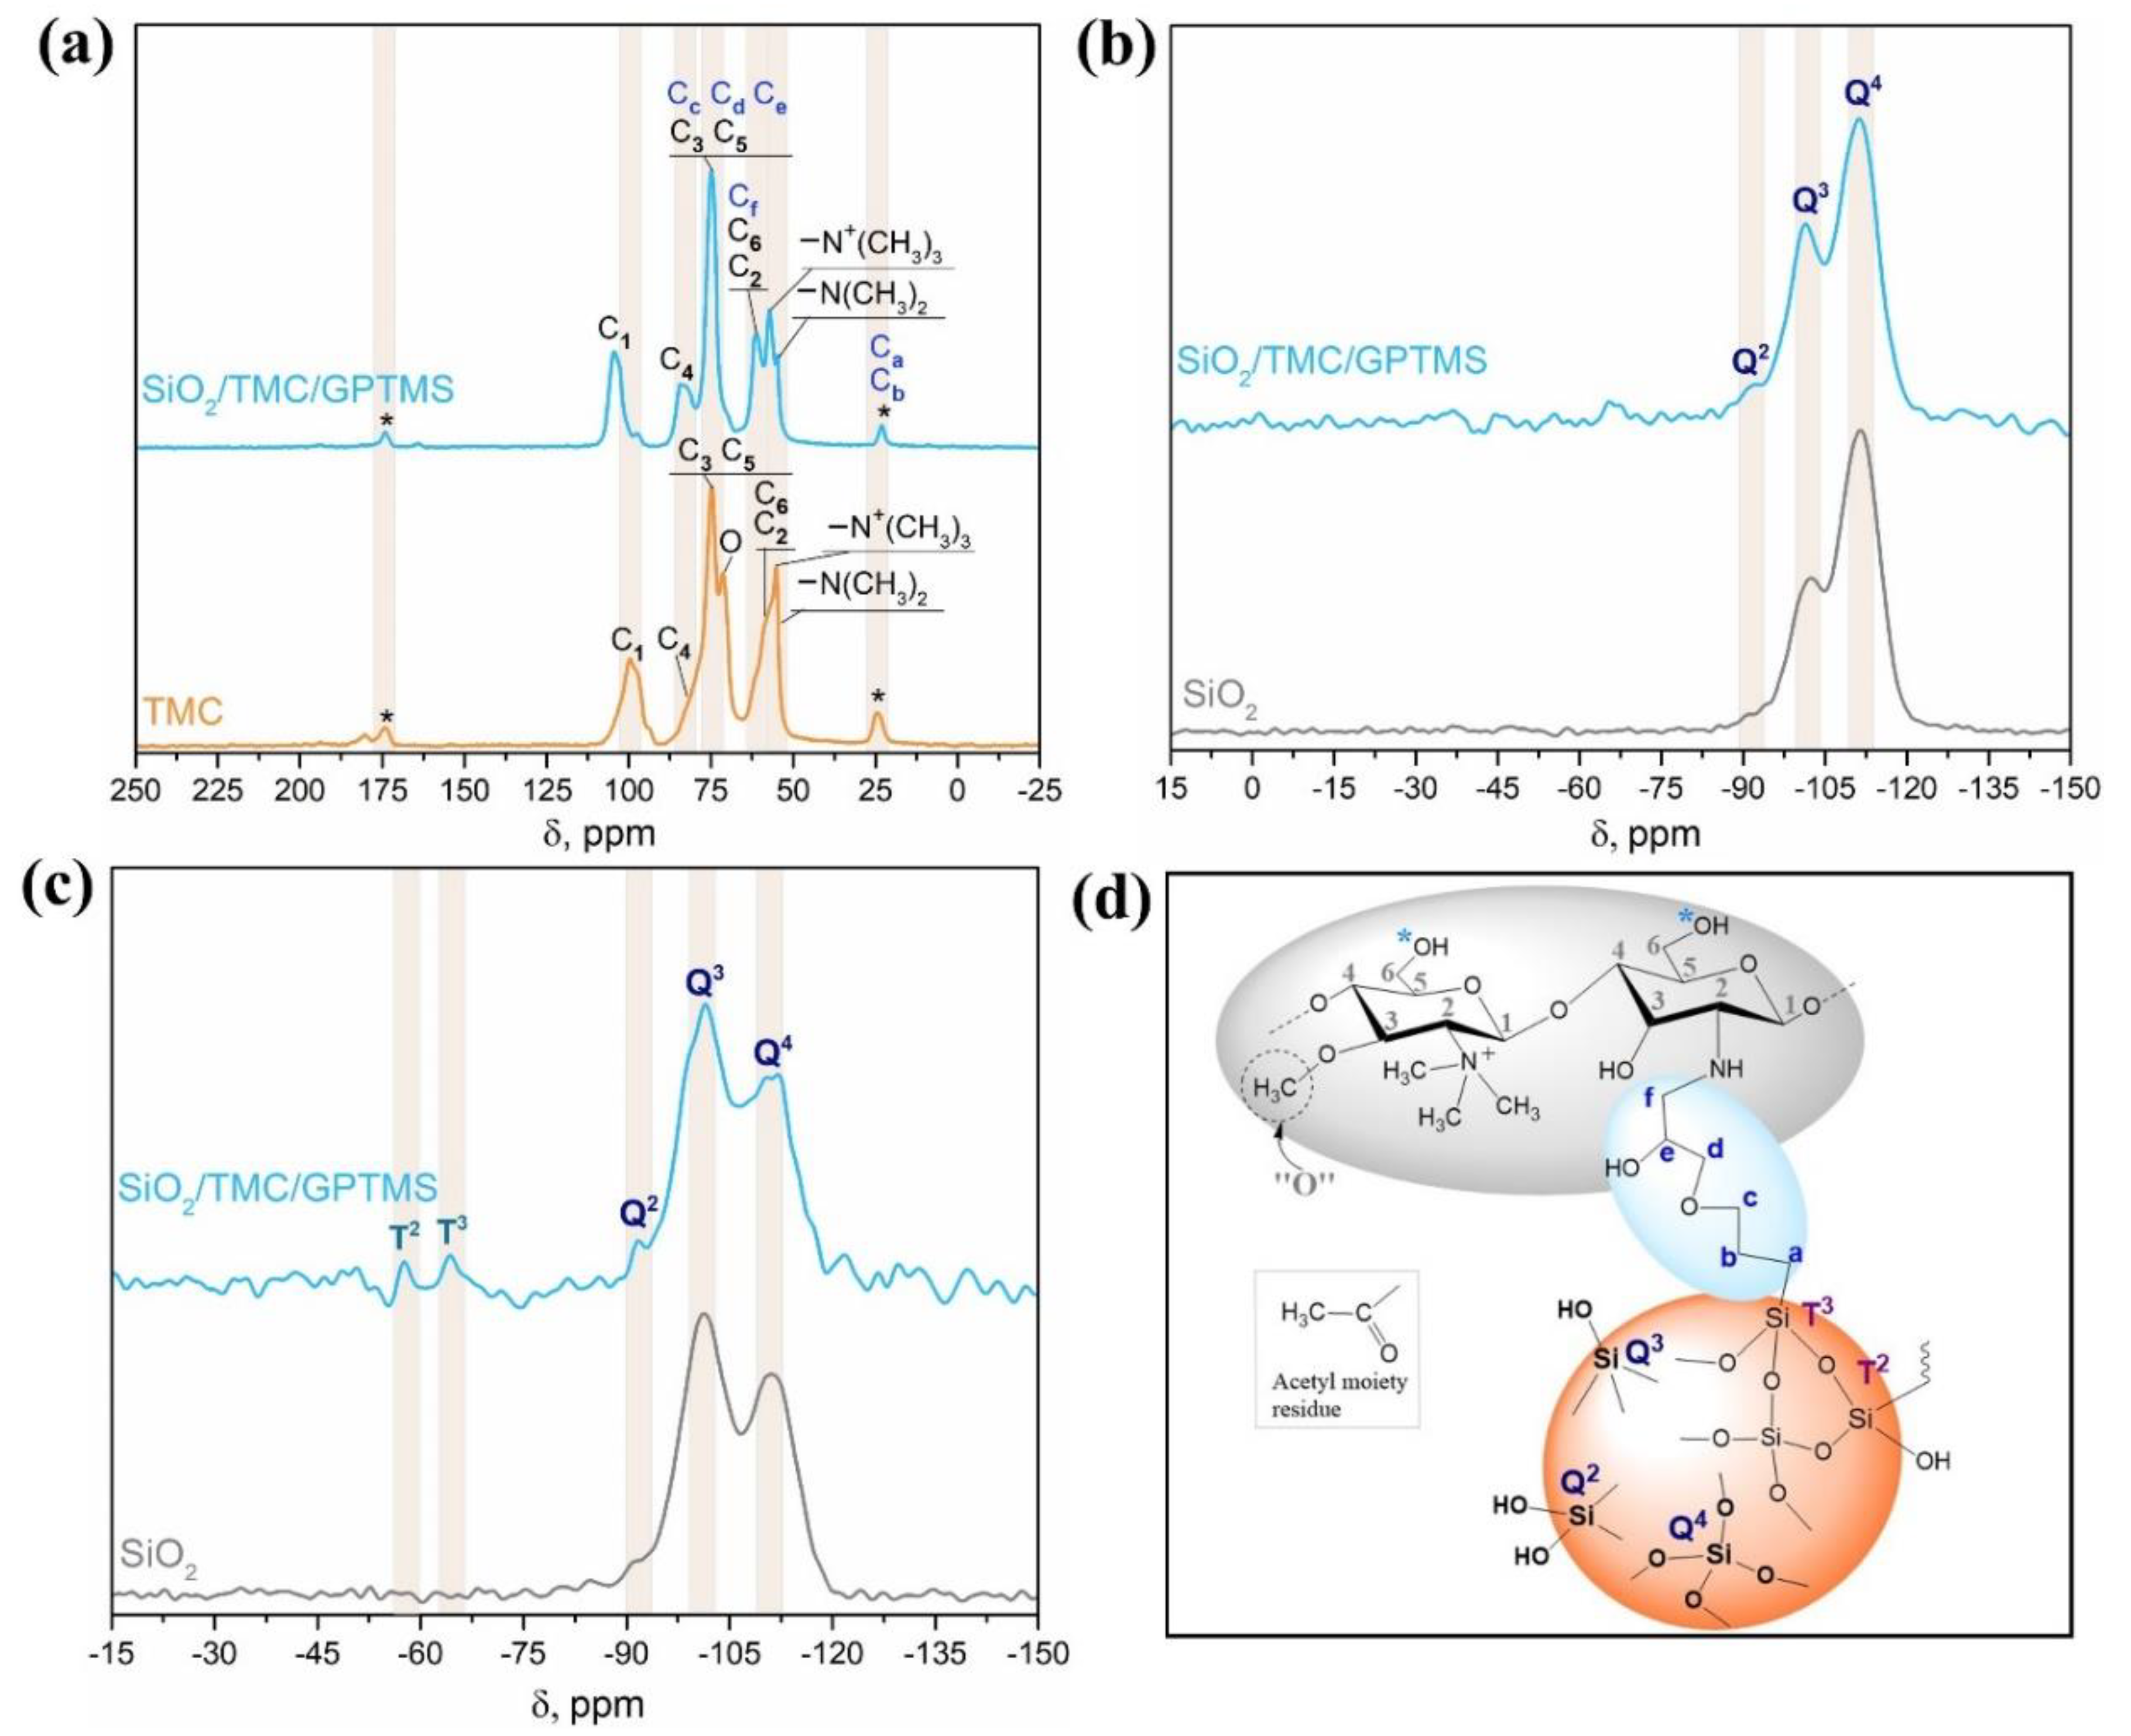
Solid-state NMR spectroscopy analysis of the non-magnetic quaternary chitosan particles (SiO2/TMC/GPTMS) was performed to inquire about the shells’ chemical nature of the Fe3O4@SiO2/TMC/GPTMS particles. A brief characterization of SiO2/TMC/GPTMS particles by SEM and FTIR spectroscopy is included in Figure S2 (Supporting Information). Figure 3a shows the 13C CP/MAS NMR spectra for TMC and SiO2/TMC/GPTMS particles, and the corresponding chemical-shift assignments are listed in Table S2 (Supporting Information). The 13C NMR spectrum of TMC showed the following evidences: δ = 24.3 ppm attributed to the carbon atom of the methyl moieties of the acetyl groups; δ = 54.8 ppm, which correspond to carbon atoms of N,N-dimethylated groups; δ = 55.2 ppm attributed to carbon atoms of N,N,N-trimethylated groups; δ = 57.8 ppm, where two overlapped signals were observed and ascribed to carbon C6 and C2; δ = 71.2 ppm, representing the carbon atoms in the O-methylated groups; δ = 74.7 ppm assigned to carbons C5 and C3; δ = 81.1 ppm ascribed to the carbon C4; δ = 99.7 ppm assigned to carbon C1; and finally δ = 173.8 ppm that corresponds to the carbon of carbonyl of acetyl group [49,50]. The 13C NMR spectrum of SiO2/TMC/GPTMS showed the resonances associated with the carbons of GPTMS that were overlapped with the NMR peaks assigned to the carbon atoms of TMC and that were observed in the range δ = 22.8–173.8 ppm. The methoxy groups (Si–O–CH3) associated with GPTMS are usually identified by a 13C resonance at δ = 50 ppm. However, this resonance was absent, suggesting that the hydrolysis of GPTMS to form silanol groups proceeded to completion [23]. The signals of the carbon atoms Ca and Cb of the Si-bonded propyl chain linked to GPTMS at δ = 22.8 ppm were overlapped with the signal of the carbon of the methyl moieties of the acetyl groups, which were attributed to the reaction of epoxide ring with the primary amine of TMC (–NH2) to form a secondary amine [24]. Due to many different C–O species, the spectrum was saturated with resonances in the range of 50–120 ppm, making difficult the assignment of the resonances of Cc, Cd, Ce, and Cf in this region. Nevertheless, the literature concerning the reaction of different biopolymers with GPTMS suggests that the resonances of the carbons Cc, Cd, Ce, and Cf might be assigned in this region [51,52,53].
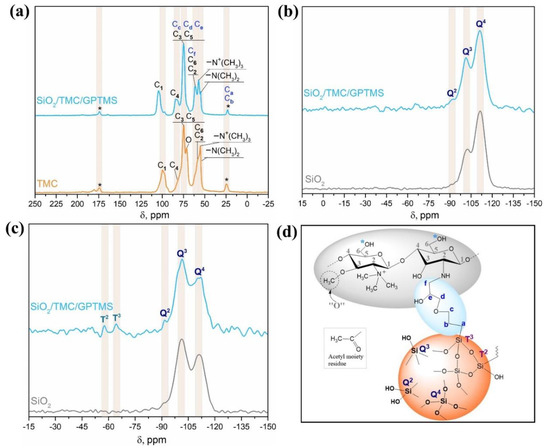
Figure 3.
(a) 13C CP/MAS NMR spectra of TMC and SiO2/TMC/GPTMS hybrid particles; (b) 29Si MAS NMR spectra and (c) 29Si CP/MAS NMR spectra of SiO2 and SiO2/TMC/GPTMS particles; and (d) schematic representation of SiO2/TMC/GPTMS particles with the labelling of Si sites according to NMR spectroscopy notation (acetyl groups are not represented in the TMC molecule).
29Si NMR spectroscopy was used to provide further insight into the structure of hybrid materials. The 29Si MAS NMR and 29Si CP/MAS NMR spectra of the non-magnetic SiO2/TMC/GPTMS particles are shown in Figure 3b,c, respectively. For comparison, the NMR spectra of amorphous SiO2 particles prepared using the same approach but in the absence of TMC (SEM and FTIR results were included in Figure S2, Supporting Information) were also included in Figure 3b,c. A specific region could be clearly observed from δ = −90 to −120 ppm, corresponding to the silica Q species. The Q species describes the connectivity of the silica network, and the Qn denotes a silicon atom with n bridging oxygens (Figure 3d) [54]. Therefore, a higher value of n in Q species indicates a more connected silica network. From the 29Si MAS NMR spectrum of SiO2/TMC/GPTMS, it was clear that the Q2 (δ = −91.9 ppm), Q3 (δ = −101.2 ppm), and Q4 (δ = −111.3 ppm) structures were the dominant Q species, in accordance with the literature (Figure 3b) [54]. The degree of condensation of the silica network could be obtained using the fraction of silanol groups ((Q2 + Q3)/Q4) calculated from the 29Si MAS NMR spectra, and is given in Table S2, Supporting Information. The degree of condensation was 0.52 in SiO2 particles and decreased to 0.48 in the SiO2/TMC/GPTMS particles. Since the degree of condensation decreased, it means evidence for the covalent bonding of the precursor TMC/GPTMS with the surface of the particles [35]. From the 29Si CP/MAS NMR spectrum of SiO2/TMC/GPTMS (Figure 3c), two distinct regions could be clearly observed from δ = −50 to −70 ppm and from δ = −90 to −120 ppm, corresponding to the silica T and Q species, respectively. The amount of T species indicates the degree of cross-linking between GPTMS and the silica network. Tn denotes a silicon atom bonded to carbon with n bridging oxygens (–Si–O–Si–) [24]. Therefore, a higher value of n in T and Q species indicates a more connected silica network. From the 29Si CP/MAS NMR spectra (Figure 3c) it was possible to observe that the Q3 and Q4 structures were the dominant Q species in the SiO2/TMC/GPTMS particles with no Q1 species detected, implying a highly condensed silica network [24,54]. Moreover, the 29Si CP/MAS NMR spectrum of SiO2/TMC/GPTMS particles showed two resonances ascribed to the T2 (δ = −57.6 ppm) and T3 (δ = −64.2 ppm) sites [55]. Additionally, the absence of T1 species indicated that the alkoxy portion of the GPTMS molecules underwent a high degree of condensation, confirming the covalent bonding of TMC/GPTMS to the siliceous network.
3.2. Adsorption Studies
3.2.1. Influence of pH and Adsorption Mechanism
The pH of the solution is a key factor in the adsorption process and interactions at the sorbent–sorbate interface. It influences the surface chemistry of the sorbent and the speciation of the solutions. The pKa range of the three targeted NSAIDs was between 4.00 and 4.45 (pKa DCF = 4.00; pKa NAP = 4.19; pKa KET = 4.45) [7], as shown in Figure 4a–c. The selected NSAIDs are classified as weak acid compounds, and thus the pH will affect their chemical speciation in solution. At pH < pKa, the NSAIDs are mainly protonated (neutral), while at pH > pKa the NSAIDs are deprotonated (negatively charged). Measurement of zeta potential values of the Fe3O4@SiO2/TMC/GPTMS particles as a function of pH was also performed to provide information on the surface charge of the sorbent (Figure 4d). The point of zero charge (pHpzc) is the pH in which the net charge on the sorbent surface is zero, and it was found to be between pH = 8 and 9, which means that at pH < pHpzc the surface was positively charged (Figure 4d) and could interact electrostatically with deprotonated NSAIDs species. At pH values not higher than 8, the particles presented positive zeta potentials due to the contribution of cationic trimethylammonium groups (−N+(CH3)3) from TMC present at the particles’ surfaces. Adsorption of DCF, NAP, and KET showed identical pH-dependent patterns (Figure 4d). This indicates that these NSAIDs may undergo the same type of interactions with the surface of Fe3O4@SiO2/TMC/GPTMS particles. As shown in Figure 4d, high adsorption capacity was observed at pH = 5 for DCF, NAP, and KET, and then the subsequent adsorption experiments were performed at this pH. At this pH, the particles are positively charged, and the NSAIDs are mainly in the deprotonated form, which promotes the electrostatic interactions and increase the adsorption capacity [56]. When the pH increased from 5 to 9, the adsorption capacity (qt) decreased for all the NSAIDs tested, most likely because the surface charge of the nanoparticles also decreased. At pH = 9 the NSAIDs and the surface of the particles were negatively charged, and repulsive forces could occur. However, the particles still adsorbed NSAIDs, indicating that electrostatic interactions are not the only mechanisms that govern the adsorption at this pH.
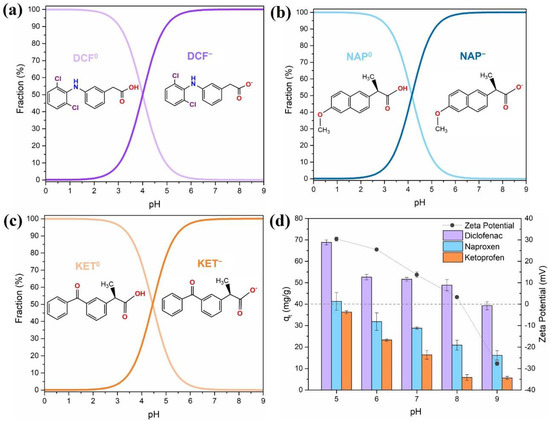
Figure 4.
Speciation of (a) diclofenac (DCF), (b) naproxen (NAP), and (c) ketoprofen (KET) as a function of pH in aqueous solution, and (d) effect of the pH of the medium (from 5 to 9) on the adsorption of DCF, NAP, and KET (50 mg/L, 5 h contact time, sorbent dose 0.5 mg/mL) using Fe3O4@SiO2/TMC/GPTMS particles and zeta potential values of Fe3O4@SiO2/TMC/GPTMS particles. Error bars correspond to standard deviations obtained from two replicates.
There are several possible mechanisms for the adsorption of NSAIDs onto the Fe3O4@SiO2/TMC/GPTMS particles: (i) electrostatic interactions between the cationic trimethylammonium groups from TMC and the carboxylate groups of the NSAIDs molecules [57,58]; (ii) H-bonding interactions among the NSAIDs (carboxyl, amine, and ester groups) with the hydroxyl groups of trimethyl chitosan [58,59]; and (iii) hydrophobic interactions in which the hydrophobic dimethylated groups (−N(CH3)2) of trimethyl chitosan can capture the NSAID molecules [59,60,61]. Previous studies have explained the adsorption of NSAIDs on other sorbents based on hydrogen bonding [59,60]. Taking into account the results in Figure 4d, at pH = 9, the adsorption capacity of each NSAID towards Fe3O4@SiO2/TMC/GPTMS particles decreased in the order DCF > NAP > KET. The extent of the interaction through hydrogen bonding has been well explained based on two factors: differences in the chemical structures of each NSAIDs, and the interactions between each functional group present in the NSAIDs [60,62]. As can be seen by the molecular structures of DCF, NAP, and KET (Table S1, Supporting Information), these molecules showed three bonding sites each. Hydrogen bonding increased as the accessibility of the available sites for interaction increases in each NSAID molecule. Furthermore, among the NSAIDs tested, DCF presented a higher affinity towards sorbent particles, most likely because it contains both H-donor (amine) and H-acceptor (oxygen-containing) functional groups that can establish H-bonds with Fe3O4@SiO2/TMC/GPTMS particles [60]. In the case of NAP, the oxygen of the methoxy group may lead to more hydrogen bonding than the keto-group in KET [60].
3.2.2. Influence of Contact Time and Initial NSAIDs Concentration
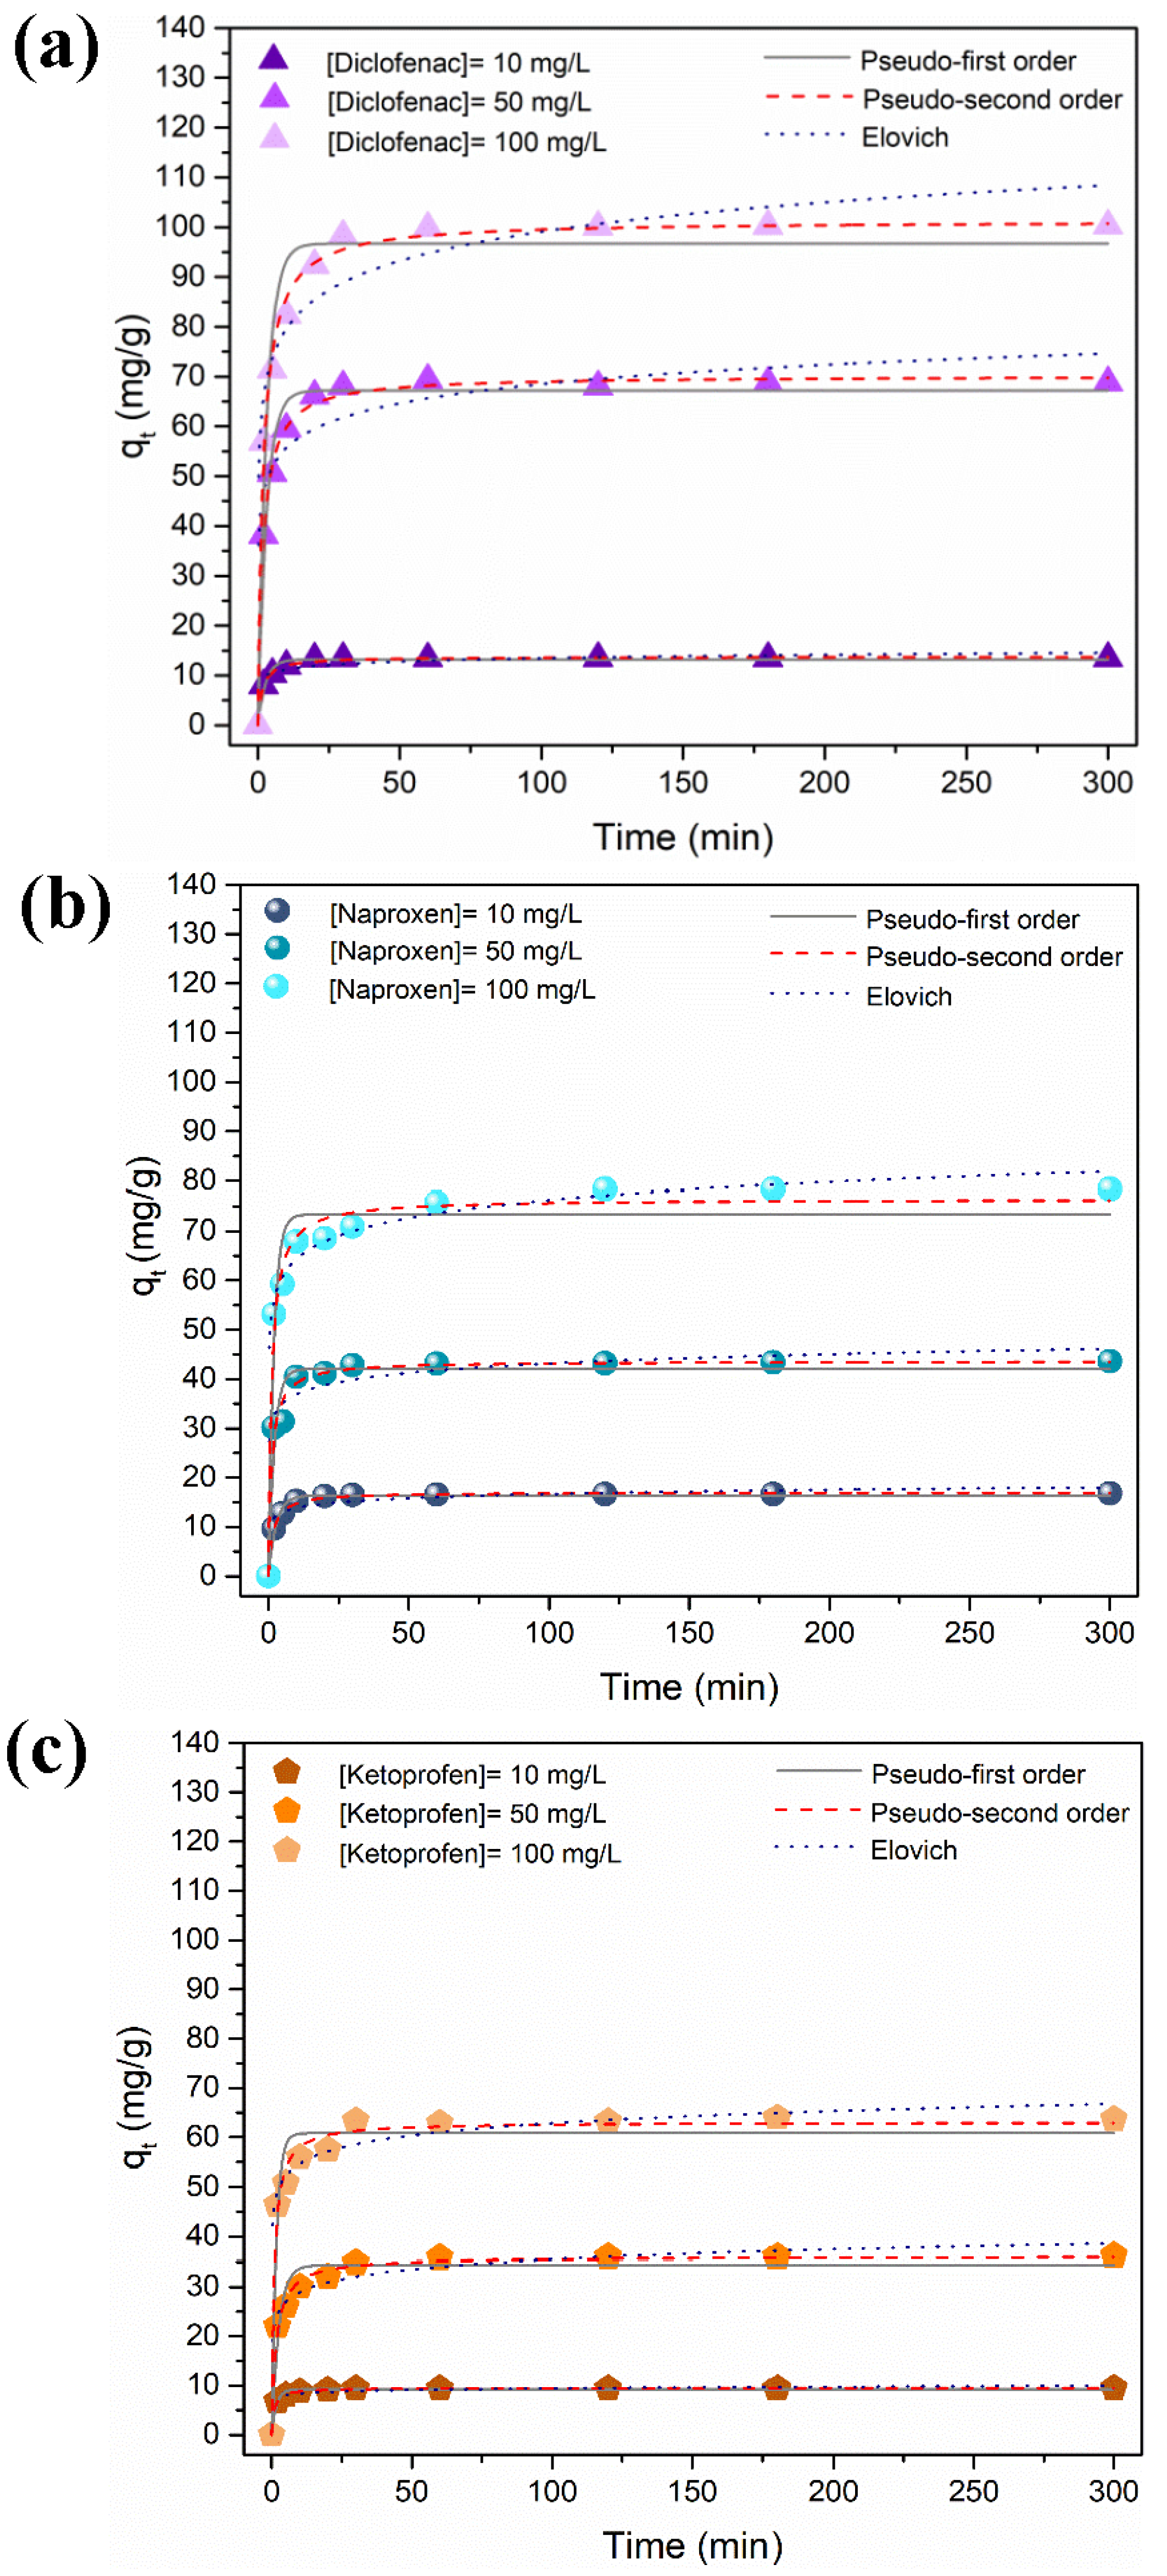
The influence of contact time on the adsorption of DCF, NAP, and KET at variable initial concentration is shown in Figure 5. The adsorption process was rapid in the first half-hour due to the presence of a high number of available surface sorption sites. The number of existing available sites decreased, and the adsorption sites became saturated for longer contact times. The equilibrium was achieved in 30 min for the lowest concentration tested. To ensure that the equilibrium was reached regardless of the NSAID concentration, the adsorption time was extended up to 5 h. The adsorption capacity increased with the increase of the NSAIDs’ initial concentrations.
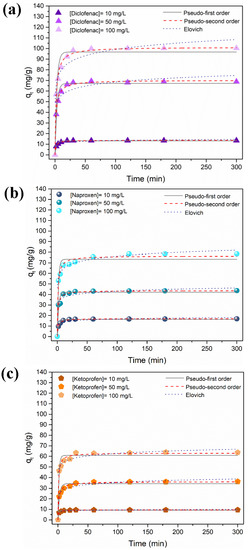
Figure 5.
Time profile of adsorption capacity of (a) diclofenac, (b) naproxen, and (c) ketoprofen using the Fe3O4@SiO2/TMC/GPTMS particles at variable initial concentrations (10, 50, and 100 mg/L, at pH = 5, contact time of 300 min/5 h) and the corresponding kinetic model fitting.
The affinity of the NSAID compounds towards the magnetic particles was different and followed the trend DCF > NAP > KET. More specifically, the maximum experimental adsorption capacities reached were 100.3 mg/g (0.3153 mmol/g), 78.4 mg/g (0.3108 mmol/g), and 63.7 mg/g (0.2505 mmol/g) for DCF, NAP, and KET, respectively, for an initial concentration of 100 mg/L. The maximum NSAID removal (Figure S3, Supporting Information) was ca. 80%, 60%, and 42% of DCF, NAP, and KET, respectively, for an initial concentration of 10 mg/L. These adsorption experiments were performed at pH = 5, and the surfaces of the particles were positively charged at this pH. As shown in Figure 4a–c, at pH = 5, the NSAID that had a higher fraction of negative species was DCF (90.8% DCF−, 87.4% NAP−, and 78.9% KET−), which promoted the electrostatic interactions and increased the adsorption capacity. Furthermore, as mentioned above, more prominent H-bonding between DCF and particles surface may contribute to increasing adsorption. Blank experiments without magnetic particles were carried out in parallel, and no relevant losses of DCF, NAP, or KET (<2%) were detected along the time (Figure S4, Supporting Information). This is evidence that the decrease of the NSAIDs concentrations in the presence of the trimethyl chitosan magnetic sorbent was ascribed to adsorption phenomena. Moreover, the removal of the NSAIDs with bare Fe3O4 particles (Figure S5, Supporting Information) was minimal (<3%, qmax = 2.7 mg/g), which confirms the relevance of the TMC as a surface modifier for the removal of NSAIDs from water.
3.2.3. Kinetic Adsorption Studies
The experimental adsorption data were analyzed using the most common kinetic models to understand the nature of the adsorption process: the pseudo-first-order [63], the pseudo-second-order [64], and the Elovich models [65]. The non-linear forms of the kinetic equations (Equations (S1)–(S3), Supporting Information) were fit to the data. The goodness of fit was determined based on the coefficient of determination (R2) and the Chi-square test value (χ2) (Equations (S4) and (S5), Supporting Information). The kinetic parameters and the evaluation of the goodness of fit, obtained by non-linear regression analysis, are reported in Table S2 (Supporting Information), and the kinetic fittings are shown in Figure 5.
Overall, the pseudo-second-order equation provided good fits for all the NSAIDs (R2 between 0.98 and 0.99 and low χ2 value), supporting the chemisorption mechanism. Moreover, the values of qt obtained from the pseudo-second-order model were closer to the experimental results than the qt values predicted from the pseudo-first-order and Elovich models. The pseudo-second-order model assumes that the adsorption rate is reaction-controlled [66]. Thus, these results suggest that the adsorption rate can be governed by the electrostatic interactions between the cationic groups of trimethyl chitosan with the anionic DCF, NAP, and KET molecules [64]. Similar observations have been reported regarding the kinetic profile of NSAID adsorption for other materials [67,68,69].
3.2.4. Equilibrium Adsorption Studies
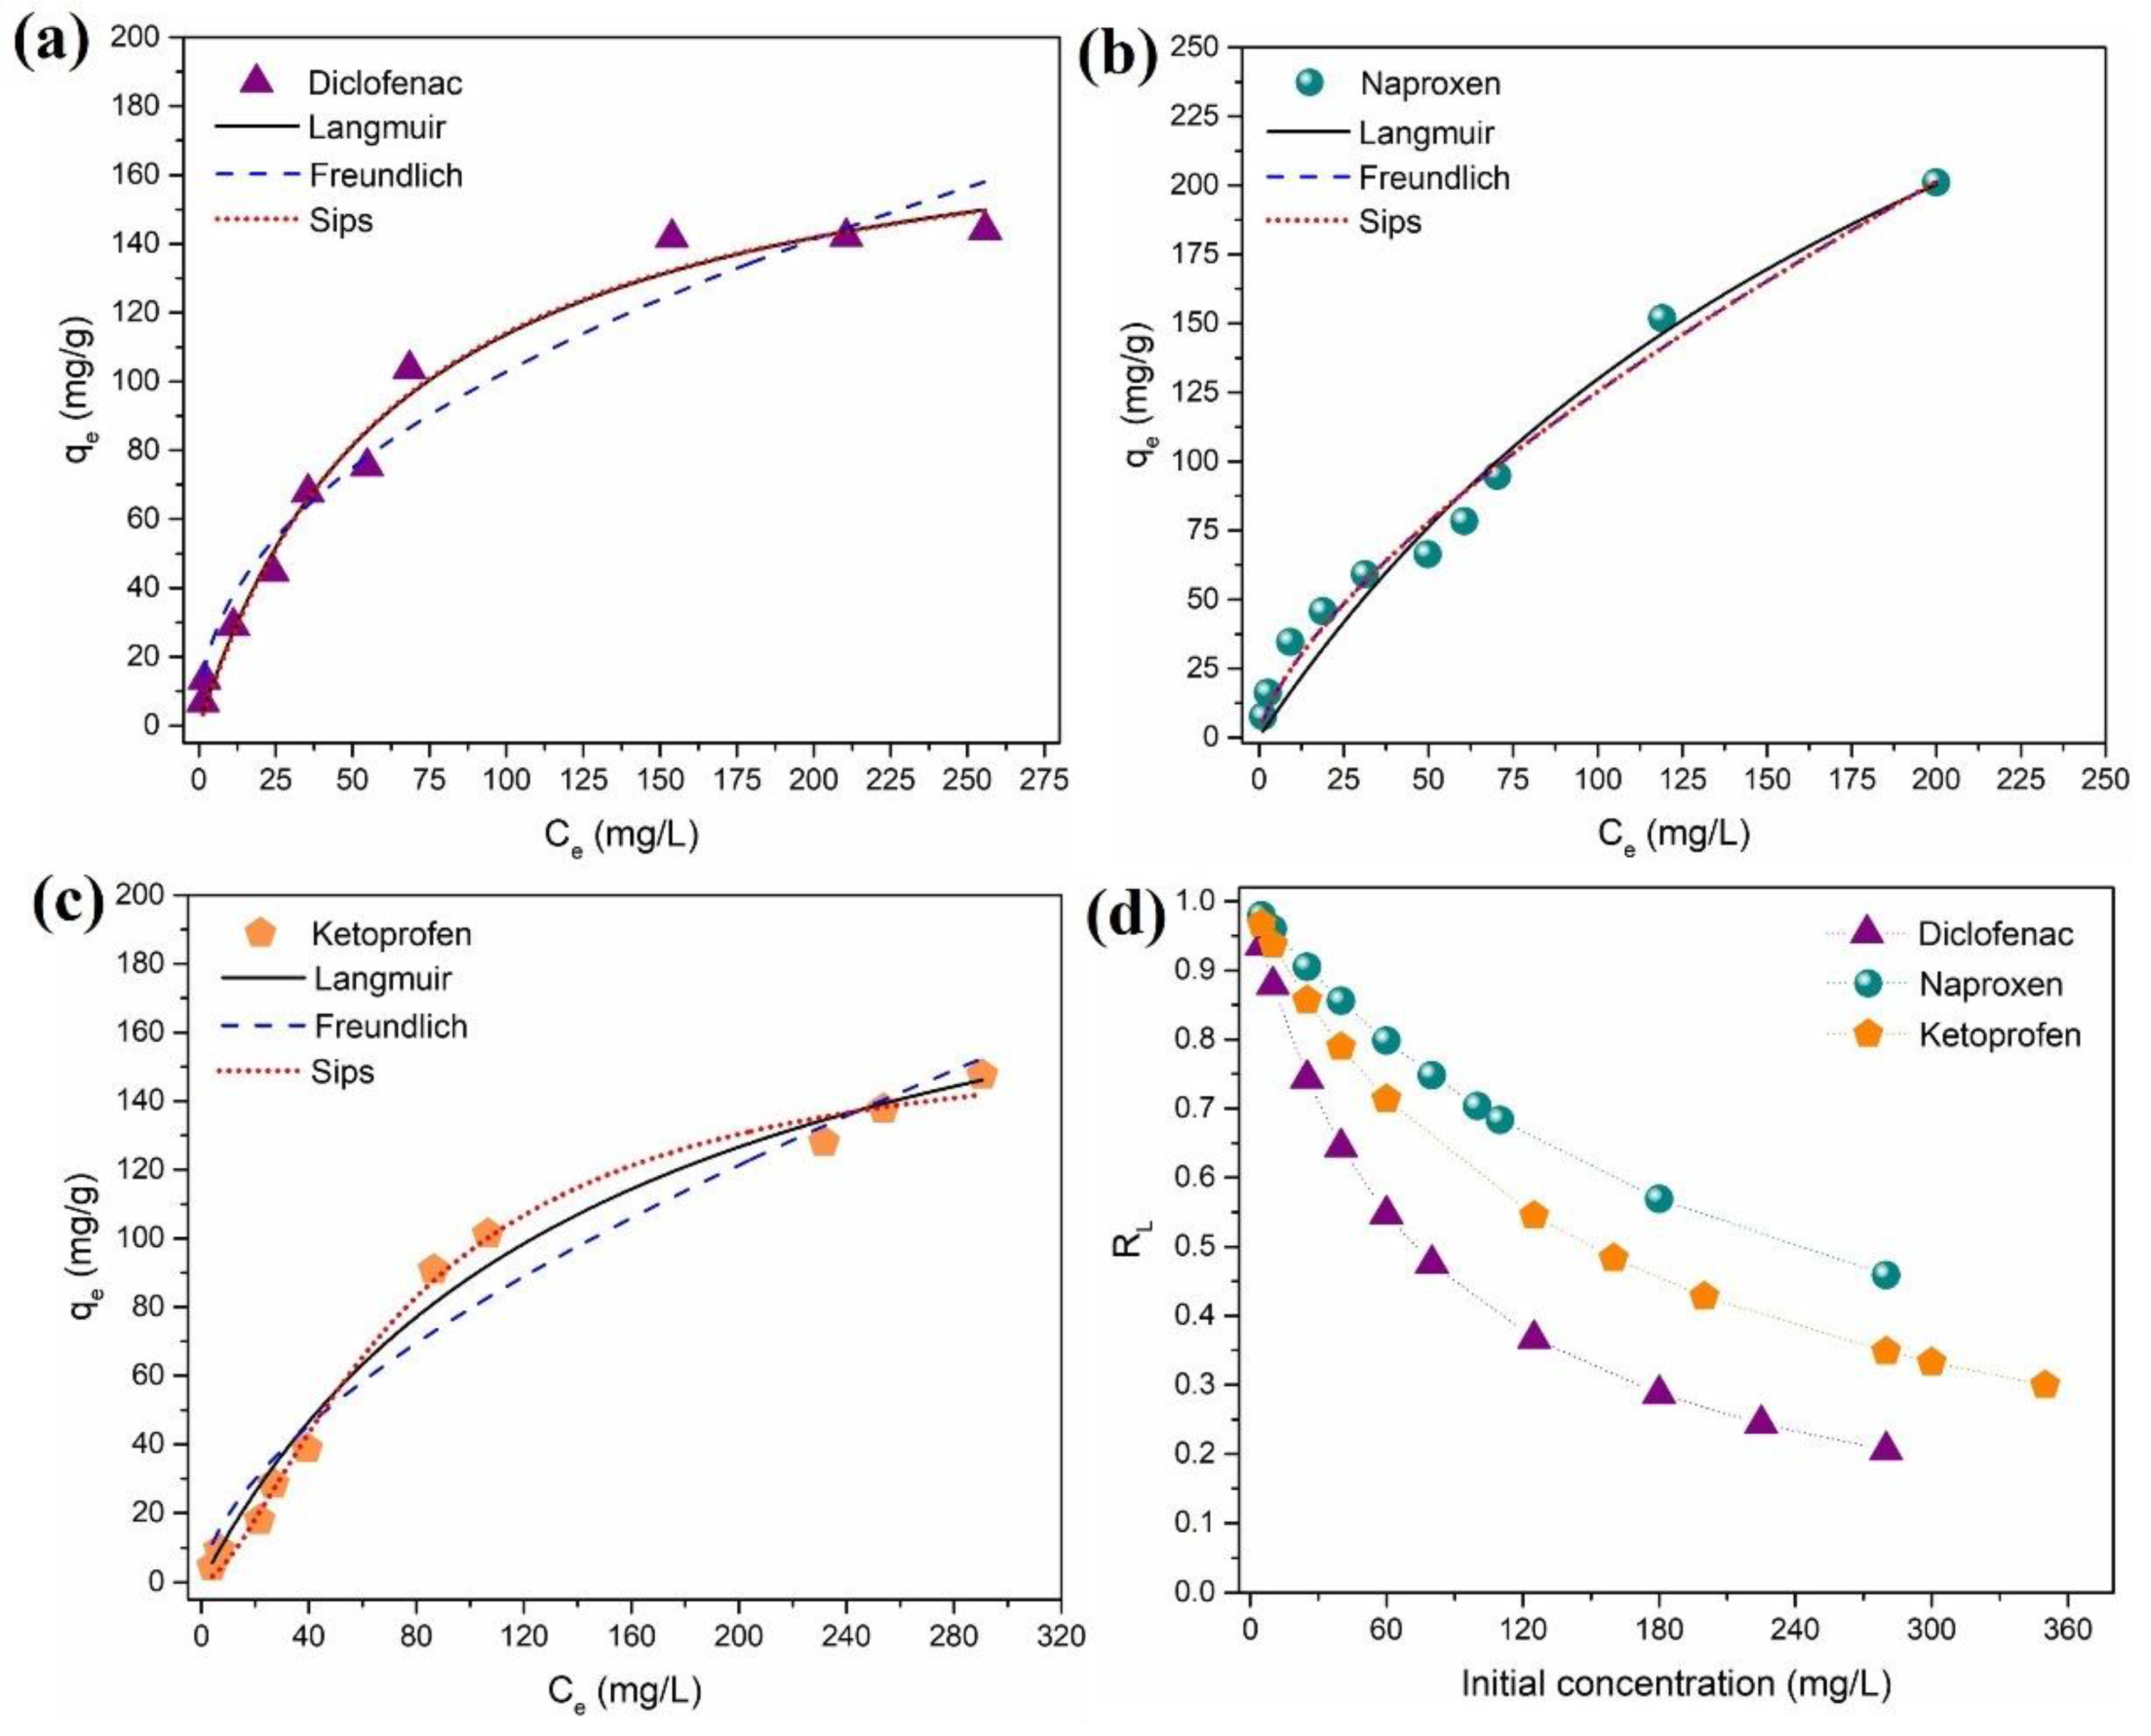
The equilibrium adsorption capacity of DCF, NAP, and KET (qe, mg/g), as a function of the liquid-phase equilibrium concentration of DCF, NAP, and KET (Ce, mg/L), is depicted in Figure 6. In accordance with Giles et al. (1960), isotherms can be divided into four main groups in terms of shape: L, S, H, and C [70]. The isotherm data obtained for all NSAIDs were the L-type (Langmuir), which is characterized by an initial concave region relative to the concentration axis (Figure 6). The equilibrium data were analyzed using the isotherm models of Langmuir [71] and Freundlich [72] (Equations (S6) and (S7), Supporting Information, respectively), which are two-parameter isotherms, and the Sips model [73] (Equation (S8), Supporting Information), which is a three-parameter isotherm. The fitted model parameters are depicted in Table S3 (Supporting Information). Based on the values of R2 (0.9820–0.9940) and χ2, it can be concluded that overall, the Sips isotherm provided a good fit of the experimental equilibrium data for DCF, NAP, and KET.
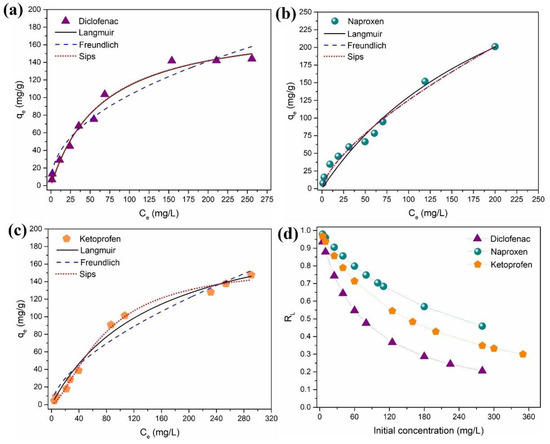
Figure 6.
Isotherm data for the adsorption of (a) diclofenac, (b) naproxen, and (c) ketoprofen on the Fe3O4@SiO2/TMC/GPTMS particles and model fitting, and (d) RL values for DCF, NAP, and KET as a function of initial concentration sorbate concentration.
The Langmuir isotherm is one of the most used adsorption isotherm models, and it supposes monolayer coverage of NSAIDs over a homogeneous sorbent surface. The Langmuir monolayer maximum adsorption capacity calculated was 188.5 mg/g (0.5925 mmol/g), 438.1 mg/g (1.7371 mmol/g), and 221.5 mg/g (0.8710 mmol/g) for DCF, NAP, and KET, respectively. The Freundlich isotherm is an empirical model, which assumes the existence of heterogeneous adsorption sites on the surface of the sorbent. Moreover, the Freundlich constant KF is related to the affinity of the NSAIDs to the Fe3O4@SiO2/TMC/GPTMS particles. Thus, a high KF value for DCF (KF = 12.5) suggests higher affinity when compared to NAP (KF = 5.3) and KET (KF = 4.8). The Sips (or Langmuir–Freundlich) isotherm is a combination of Langmuir and Freundlich isotherms. At low sorbate concentration, the Sips equation reduces to a Freundlich isotherm, while at high sorbate concentrations, it predicts the sorption capacity of a monolayer, characteristic of the Langmuir isotherm [67]. The Sips isotherm equation is characterized by the dimensionless heterogeneity factor (βS), which varies from 1, in a homogeneous surface, to βS < 1, in a heterogeneous surface [74]. For Fe3O4@SiO2/TMC/GPTMS particles, the results showed that βS was smaller than 1 for DCF, NAP, and KET, which indicates heterogeneous surfaces in these sorbents.
For further understanding of the adsorption process, Langmuir isotherm parameters can be used to predict the affinity between the NSAIDs and sorbent particles using a dimensionless constant called separation factor or equilibrium parameter (RL), which is expressed by Equation (3) [75] as follows:
where KL (L/mg) is the Langmuir constant, and C0 (mg/L) is the initial sorbate concentration. The value of RL shows if the adsorption process is favorable or not as follows: if RL = 0, the adsorption process is irreversible, and this occurs if KL is very large, indicating very strong adsorption; if 0 < RL < 1, the adsorption is favorable, and this is the standard case; RL = 1 indicates that the adsorption isotherm is a straight line, and so it is called linear adsorption; for RL > 1, the adsorption is unfavorable, meaning that desorption happens [67,76]. Figure 6d shows the calculated RL values versus the initial concentrations of DCF, NAP, and KET. All the RL values were between 0 and 1, indicating that the adsorption of DCF, NAP, and KET over the Fe3O4@SiO2/TMC/GPTMS particles was favorable at the conditions studied. Additionally, lower RL values at higher initial DCF, NAP, and KET concentrations indicated that adsorption was more favorable at higher sorbate concentrations.
3.2.5. Comparison with Other Adsorbents
The efficiency of the proposed particles for the removal of DCF, NAP, and KET was compared with other sorbents reported in the literature. The maximum adsorption capacity of DCF, NAP, and KET was 188.5 mg/g (0.5925 mmol/g), 438.1 mg/g (1.7371 mmol/g), and 221.5 mg/g (0.8710 mmol/g), respectively. As can be seen in Table 2, the particles here developed are very effective in the removal of the selected NSAIDs and present maximum adsorption capacity higher than most of the reported sorbents. In addition, these particles offer the advantage of fast separation and recovery from water using low-energy magnetic separation. Hence, these results demonstrate the potential of the proposed particles for removing NSAIDs from water.
Table 2.
Comparison of the maximum adsorption capacity (qmax) of several sorbents reported in the literature for the removal of diclofenac, naproxen, and ketoprofen.
4. Conclusions
We have reported here studies on batch mode for the adsorption of three selected NSAIDs frequently detected in aquatic media, using new magnetic nanosorbents based on trimethyl chitosan. The resulting nanosorbents removed diclofenac, naproxen, and ketoprofen efficiently from aqueous solutions, denoting high adsorption capacity. This improved efficiency is related to the high affinity of functional groups from trimethyl chitosan, used here as a surface modifier, to NSAIDs molecules, along with reduced particle dimensions and high surface-to-volume ratios. It was observed that the affinity of the NSAID compounds towards the magnetic particles followed the trend DCF > NAP > KET. Therefore, this magnetic biosorbent based on quaternary chitosan offers new possibilities for water purification contaminated with diclofenac, naproxen, and ketoprofen by applying magnetic-assisted cleaning technologies. Future perspectives for integrating these new nanosorbents in adsorption technologies are promising due to their effectiveness as compared to other materials described in the literature.
Supplementary Materials
The following are available online at https://www.mdpi.com/article/10.3390/coatings11080964/s1, Figure S1: Calibration curves for diclofenac (0.12–12.0 mg/L), naproxen (0.12–3 mg/L), and ketoprofen (0.12–12.0 mg/L) in ultra-pure water, providing a linear relation between the absorbance and the concentration, Figure S2: SEM images of (a) SiO2/TMC/GPTMS and (c) SiO2 particles and ATR-FTIR spectra of (b) SiO2/TMC/GPTMS and (d) SiO2 particles, Figure S3: Time profile of removal percentage of NSAIDs at variable (a) DCF, (b) NAP, and (c) KET initial concentration (10, 50, and 100 mg/L), using the particles Fe3O4@SiO2/TMC/GPTMS, for 5 h (300 min), Figure S4: Variation of diclofenac, naproxen, and ketoprofen concentration on control experiments performed in absence of adsorbent particles to assess the loss of DCF, NAP, and KET caused by other phenomena than adsorption on sorbents, Figure S5: Time profile of removal percentage and (b) adsorption capacity of diclofenac, naproxen, and ketoprofen at 50 mg/L, using Fe3O4 particles, for 5 h (300 min), Figure S6: Kinetic parameters estimated from pseudo-first and -second order and Elovich models, and evaluation of their fittings for diclofenac, naproxen, and ketoprofen, using Fe3O4@SiO2/TMC/GPTMS particles, Table S1: Selected characteristics and structures of NSAIDs, Table S2: 13C CP/MAS, 29Si MAS, and 29Si CP/MAS NMR chemical shifts for TMC, SiO2/TMC/GPTMS, and SiO2 particles and quantification of the 29Si Qn resonances, Table S3: Equilibrium model parameters obtained from model fitting to experimental sorption data of Fe3O4@SiO2/TMC/GPTMS for the removal of DCF, NAP, and KET, together with the goodness of fit.
Author Contributions
Conceptualization, S.F.S. and A.L.D.-d.-S.; methodology, S.F.S. and A.L.D.-d.-S.; validation, T.T. and A.L.D.-d.-S.; formal analysis, S.F.S. and A.L.D.-d.-S.; investigation, S.F.S. and A.L.D.-d.-S.; resources, T.T. and A.L.D.-d.-S.; data curation, S.F.S. and A.L.D.-d.-S.; writing—original draft preparation, S.F.S.; writing—review and editing, T.T. and A.L.D.-d.-S.; supervision, T.T. and A.L.D.-d.-S.; funding acquisition, T.T. and A.L.D.-d.-S. All authors have read and agreed to the published version of the manuscript.
Funding
This work was developed within the scope of the project CICECO-Aveiro Institute of Materials, UIDB/50011/2020 and UIDP/50011/2020, financed by national funds through the Portuguese Foundation for Science and Technology/MCTES. S.F. Soares thanks the Fundação para a Ciência e Tecnologia (FCT) for the PhD grant SFRH/BD/121366/2016. A.L.D.-d.-S. acknowledges FCT for the research contract under the Program ‘Investigador FCT’ 2014 and for funding from the project IF/00405/2014.
Institutional Review Board Statement
Not applicable.
Informed Consent Statement
Not applicable.
Data Availability Statement
All data reported in this paper is contained within the manuscript and supplementary material.
Acknowledgments
The authors thank the RNME (National Electronic Microscopy Network) for microscopy facilities.
Conflicts of Interest
The authors declare no conflict of interest.
References
- Golovko, O.; Örn, S.; Sörengård, M.; Frieberg, K.; Nassazzi, W.; Lai, F.Y.; Ahrens, L. Occurrence and removal of chemicals of emerging concern in wastewater treatment plants and their impact on receiving water systems. Sci. Total Environ. 2021, 754, 142122. [Google Scholar] [CrossRef]
- Tran, N.H.; Reinhard, M.; Gin, K.Y.-H. Occurrence and fate of emerging contaminants in municipal wastewater treatment plants from different geographical regions-a review. Water Res. 2018, 133, 182–207. [Google Scholar] [CrossRef]
- Fent, K.; Weston, A.; Caminada, D. Ecotoxicology of human pharmaceuticals. Aquat. Toxicol. 2006, 76, 122–159. [Google Scholar] [CrossRef]
- Sousa, J.C.G.; Ribeiro, A.R.; Barbosa, M.O.; Pereira, M.F.R.; Silva, A.M.T. A review on environmental monitoring of water organic pollutants identified by EU guidelines. J. Hazard. Mater. 2018, 344, 146–162. [Google Scholar] [CrossRef] [PubMed]
- Barbosa, M.O.; Moreira, N.F.F.; Ribeiro, A.R.; Pereira, M.F.R.; Silva, A.M.T. Occurrence and removal of organic micropollutants: An overview of the watch list of EU Decision 2015/495. Water Res. 2016, 94, 257–279. [Google Scholar] [CrossRef]
- Izadi, P.; Izadi, P.; Salem, R.; Papry, S.A.; Magdouli, S.; Pulicharla, R.; Brar, S.K. Non-steroidal anti-inflammatory drugs in the environment: Where were we and how far we have come? Environ. Pollut. 2020, 267, 115370. [Google Scholar] [CrossRef] [PubMed]
- Mlunguza, N.Y.; Ncube, S.; Nokwethemba Mahlambi, P.; Chimuka, L.; Madikizela, L.M. Adsorbents and removal strategies of non-steroidal anti-inflammatory drugs from contaminated water bodies. J. Environ. Chem. Eng. 2019, 7, 103142. [Google Scholar] [CrossRef]
- Kermia, A.E.B.; Fouial-Djebbar, D.; Trari, M. Occurrence, fate and removal efficiencies of pharmaceuticals in wastewater treatment plants (WWTPs) discharging in the coastal environment of Algiers. Comptes Rendus Chim. 2016, 19, 963–970. [Google Scholar] [CrossRef]
- Couto, C.F.; Lange, L.C.; Amaral, M.C.S. Occurrence, fate and removal of pharmaceutically active compounds (PhACs) in water and wastewater treatment plants—A review. J. Water Process Eng. 2019, 32, 100927. [Google Scholar] [CrossRef]
- Luo, Y.; Guo, W.; Ngo, H.H.; Nghiem, L.D.; Hai, F.I.; Zhang, J.; Liang, S.; Wang, X.C. A review on the occurrence of micropollutants in the aquatic environment and their fate and removal during wastewater treatment. Sci. Total Environ. 2014, 473–474, 619–641. [Google Scholar] [CrossRef] [PubMed]
- Petrie, B.; Camacho-Muñoz, D. Analysis, fate and toxicity of chiral non-steroidal anti-inflammatory drugs in wastewaters and the environment: A review. Environ. Chem. Lett. 2021, 19, 43–75. [Google Scholar]
- Hena, S.; Gutierrez, L.; Croué, J.-P. Removal of pharmaceutical and personal care products (PPCPs) from wastewater using microalgae: A review. J. Hazard. Mater. 2021, 403, 124041. [Google Scholar] [CrossRef] [PubMed]
- Gros, M.; Petrović, M.; Ginebreda, A.; Barceló, D. Removal of pharmaceuticals during wastewater treatment and environmental risk assessment using hazard indexes. Environ. Int. 2010, 36, 15–26. [Google Scholar] [CrossRef]
- Zaied, B.K.; Rashid, M.; Nasrullah, M.; Zularisam, A.W.; Pant, D.; Singh, L. A comprehensive review on contaminants removal from pharmaceutical wastewater by electrocoagulation process. Sci. Total Environ. 2020, 726, 138095. [Google Scholar] [CrossRef]
- Zupanc, M.; Kosjek, T.; Petkovšek, M.; Dular, M.; Kompare, B.; Širok, B.; Blažeka, Ž.; Heath, E. Removal of pharmaceuticals from wastewater by biological processes, hydrodynamic cavitation and UV treatment. Ultrason. Sonochem. 2013, 20, 1104–1112. [Google Scholar] [CrossRef]
- Soares, S.F.; Fernandes, T.; Trindade, T.; Daniel-da-Silva, A.L. Surface engineered magnetic biosorbents for water treatment. In Green Adsorbents for Pollutant Removal. Environmental Chemistry for a Sustainable World; Crini, G., Lichtfouse, E., Eds.; Springer: Cham, Switzerland, 2018; pp. 301–342. ISBN 978-3-319-92111-2. [Google Scholar]
- Budnyak, T.M.; Yanovska, E.S.; Kołodyńska, D.; Sternik, D.; Pylypchuk, I.V.; Ischenko, M.V.; Tertykh, V.A. Preparation and properties of organomineral adsorbent obtained by sol–gel technology. J. Therm. Anal. Calorim. 2016, 125, 1335–1351. [Google Scholar] [CrossRef]
- Salama, A. Polysaccharides/silica hybrid materials: New perspectives for sustainable raw materials. J. Carbohydr. Chem. 2016, 35, 131–149. [Google Scholar] [CrossRef]
- Soares, S.F.; Rocha, M.J.; Ferro, M.; Amorim, C.O.; Amaral, J.S.; Trindade, T.; Daniel-da-Silva, A.L. Magnetic nanosorbents with siliceous hybrid shells of alginic acid and carrageenan for removal of ciprofloxacin. Int. J. Biol. Macromol. 2019, 139, 827–841. [Google Scholar] [CrossRef]
- Soares, S.F.; Fernandes, T.; Sacramento, M.; Trindade, T.; Daniel-da-Silva, A.L. Magnetic quaternary chitosan hybrid nanoparticles for the efficient uptake of diclofenac from water. Carbohydr. Polym. 2019, 203, 35–44. [Google Scholar] [CrossRef] [PubMed]
- Ogoshi, T.; Chujo, Y. Organic–inorganic polymer hybrids prepared by the sol-gel method. Compos. Interfaces 2005, 11, 539–566. [Google Scholar] [CrossRef]
- Wang, D.; Liu, W.; Feng, Q.; Dong, C.; Liu, Q.; Duan, L.; Huang, J.; Zhu, W.; Li, Z.; Xiong, J.; et al. Effect of inorganic/organic ratio and chemical coupling on the performance of porous silica/chitosan hybrid scaffolds. Mater. Sci. Eng. C 2017, 70, 969–975. [Google Scholar] [CrossRef] [PubMed]
- Wang, D.; Romer, F.; Connell, L.; Walter, C.; Saiz, E.; Yue, S.; Lee, P.D.; McPhail, D.S.; Hanna, J.V.; Jones, J.R. Highly flexible silica/chitosan hybrid scaffolds with oriented pores for tissue regeneration. J. Mater. Chem. B 2015, 3, 7560–7576. [Google Scholar] [CrossRef] [Green Version]
- Connell, L.S.; Romer, F.; Suárez, M.; Valliant, E.M.; Zhang, Z.; Lee, P.D.; Smith, M.E.; Hanna, J.V.; Jones, J.R. Chemical characterisation and fabrication of chitosan–silica hybrid scaffolds with 3-glycidoxypropyl trimethoxysilane. J. Mater. Chem. B 2014, 2, 668–680. [Google Scholar] [CrossRef]
- Mallakpour, S.; Madani, M. A review of current coupling agents for modification of metal oxide nanoparticles. Prog. Org. Coat. 2015, 86, 194–207. [Google Scholar] [CrossRef]
- Roosen, J.; Spooren, J.; Binnemans, K. Adsorption performance of functionalized chitosan–silica hybrid materials toward rare earths. J. Mater. Chem. A 2014, 2, 19415–19426. [Google Scholar] [CrossRef] [Green Version]
- Bakshi, P.S.; Selvakumar, D.; Kadirvelu, K.; Kumar, N.S. Chitosan as an environment friendly biomaterial–A review on recent modifications and applications. Int. J. Biol. Macromol. 2020, 150, 1072–1083. [Google Scholar] [CrossRef] [PubMed]
- Kyzas, G.; Bikiaris, D. Recent modifications of chitosan for adsorption applications: A critical and systematic review. Mar. Drugs 2015, 13, 312–337. [Google Scholar] [CrossRef]
- Negm, N.A.; Hefni, H.H.H.; Abd-Elaal, A.A.A.; Badr, E.A.; Abou Kana, M.T.H. Advancement on modification of chitosan biopolymer and its potential applications. Int. J. Biol. Macromol. 2020, 152, 681–702. [Google Scholar] [CrossRef]
- Wu, M.; Long, Z.; Xiao, H.; Dong, C. Recent research progress on preparation and application of N,N,N-trimethyl chitosan. Carbohydr. Res. 2016, 434, 27–32. [Google Scholar] [CrossRef]
- Pinheiro, P.C.; Daniel-da-Silva, A.L.; Nogueira, H.I.S.; Trindade, T. Functionalized inorganic nanoparticles for magnetic separation and SERS detection of water pollutants. Eur. J. Inorg. Chem. 2018, 2018, 3443–3461. [Google Scholar] [CrossRef]
- Chibowski, E.; Szcześ, A. Magnetic water treatment–A review of the latest approaches. Chemosphere 2018, 203, 54–67. [Google Scholar] [CrossRef]
- Soares, S.F.; Fernandes, T.; Trindade, T.; Daniel-da-Silva, A.L. Trimethyl chitosan/siloxane-hybrid coated Fe3O4 nanoparticles for the uptake of sulfamethoxazole from water. Molecules 2019, 24, 1958. [Google Scholar] [CrossRef] [Green Version]
- Oliveira-Silva, R.; Pinto da Costa, J.; Vitorino, R.; Daniel-da-Silva, A.L. Magnetic chelating nanoprobes for enrichment and selective recovery of metalloproteases from human saliva. J. Mater. Chem. B 2015, 3, 238–249. [Google Scholar] [CrossRef]
- Soares, S.F.; Trindade, T.; Daniel-da-Silva, A.L. Carrageenan-silica hybrid nanoparticles prepared by a non-emulsion method. Eur. J. Inorg. Chem. 2015, 2015, 4588–4594. [Google Scholar] [CrossRef]
- Green, D.; Lin, J.; Lam, Y.-F.; Hu, M.Z.-C.; Schaefer, D.W.; Harris, M. Size, volume fraction, and nucleation of Stober silica nanoparticles. J. Colloid Interface Sci. 2003, 266, 346–358. [Google Scholar] [CrossRef]
- Joint Committee for Powder Diffraction Studies, JCPDS, card no. 19-0629.
- Biswas, R.K.; Khan, P.; Mukherjee, S.; Mukhopadhyay, A.K.; Ghosh, J.; Muraleedharan, K. Study of short range structure of amorphous Silica from PDF using Ag radiation in laboratory XRD system, RAMAN and NEXAFS. J. Non. Cryst. Solids 2018, 488, 1–9. [Google Scholar] [CrossRef]
- Namduri, H.; Nasrazadani, S. Quantitative analysis of iron oxides using Fourier transform infrared spectrophotometry. Corros. Sci. 2008, 50, 2493–2497. [Google Scholar] [CrossRef]
- Mansur, H.S.; Mansur, A.A.P.; Curti, E.; De Almeida, M.V. Functionalized-chitosan/quantum dot nano-hybrids for nanomedicine applications: Towards biolabeling and biosorbing phosphate metabolites. J. Mater. Chem. B 2013, 1, 1696. [Google Scholar] [CrossRef] [PubMed]
- de Britto, D.; Assis, O.B.G. A novel method for obtaining a quaternary salt of chitosan. Carbohydr. Polym. 2007, 69, 305–310. [Google Scholar] [CrossRef]
- Schramm, C. High temperature ATR-FTIR characterization of the interaction of polycarboxylic acids and organotrialkoxysilanes with cellulosic material. Spectrochim. Acta Part A Mol. Biomol. Spectrosc. 2020, 243, 118815. [Google Scholar] [CrossRef]
- Ma, J.; Duan, L.; Lu, J.; Lyu, B.; Gao, D.; Wu, X. Fabrication of modified hydrogenated castor oil/GPTMS-ZnO composites and effect on UV resistance of leather. Sci. Rep. 2017, 7, 3742. [Google Scholar] [CrossRef] [Green Version]
- Šapić, I.M.; Bistričić, L.; Volovšek, V.; Dananić, V.; Furić, K. DFT study of molecular structure and vibrations of 3-glycidoxypropyltrimethoxysilane. Spectrochim. Acta Part A Mol. Biomol. Spectrosc. 2009, 72, 833–840. [Google Scholar] [CrossRef]
- Dun, Y.; Zuo, Y. Preparation and characterization of a GPTMS/graphene coating on AA-2024 alloy. Appl. Surf. Sci. 2017, 416, 492–502. [Google Scholar] [CrossRef]
- Balgude, D.; Konge, K.; Sabnis, A. Synthesis and characterization of sol–gel derived CNSL based hybrid anti-corrosive coatings. J. Sol-Gel Sci. Technol. 2014, 69, 155–165. [Google Scholar] [CrossRef]
- Zhang, C.; Zhang, C.; Sun, J.; Ding, R.; Zhang, Q.; Xu, Y. A double-layer moisture barrier & antireflective film based on bridged polysilsesquioxane and porous silica. RSC Adv. 2015, 5, 56998–57005. [Google Scholar]
- Tiringer, U.; Milošev, I.; Durán, A.; Castro, Y. Hybrid sol–gel coatings based on GPTMS/TEOS containing colloidal SiO2 and cerium nitrate for increasing corrosion protection of aluminium alloy 7075-T6. J. Sol-Gel Sci. Technol. 2018, 85, 546–557. [Google Scholar] [CrossRef]
- de Britto, D.; Forato, L.A.; Assis, O.B.G. Determination of the average degree of quaternization of N,N,N-trimethylchitosan by solid state 13C NMR. Carbohydr. Polym. 2008, 74, 86–91. [Google Scholar] [CrossRef]
- de Britto, D.; Celi Goy, R.; Campana Filho, S.P.; Assis, O.B.G. Quaternary salts of chitosan: History, antimicrobial features, and prospects. Int. J. Carbohydr. Chem. 2011, 2011, 1–12. [Google Scholar] [CrossRef] [Green Version]
- Liu, B.; Li, X.; Zheng, C.; Wang, X.; Sun, R. Facile and green synthesis of silver nanoparticles in quaternized carboxymethyl chitosan solution. Nanotechnology 2013, 24, 235601. [Google Scholar] [CrossRef]
- Gouveia, Z.; Perinpanayagam, H.; Zhu, J. Development of robust chitosan–silica class II hybrid coatings with antimicrobial properties for titanium implants. Coatings 2020, 10, 534. [Google Scholar] [CrossRef]
- Vueva, Y.; Connell, L.S.; Chayanun, S.; Wang, D.; McPhail, D.S.; Romer, F.; Hanna, J.V.; Jones, J.R. Silica/alginate hybrid biomaterials and assessment of their covalent coupling. Appl. Mater. Today 2018, 11, 1–12. [Google Scholar] [CrossRef]
- Babonneau, F.; Baccile, N.; Laurent, G.; Maquet, J.; Azaïs, T.; Gervais, C.; Bonhomme, C. Solid-state nuclear magnetic resonance: A valuable tool to explore organic-inorganic interfaces in silica-based hybrid materials. Comptes Rendus Chim. 2010, 13, 58–68. [Google Scholar] [CrossRef]
- Lippach, A.K.W.; Krämer, R.; Hansen, M.R.; Roos, S.; Stöwe, K.; Stommel, M.; Wenz, G.; Maier, W.F. Synthesis and mechanical properties of organic-inorganic hybrid materials from lignin and polysiloxanes. ChemSusChem 2012, 5, 1778–1786. [Google Scholar] [CrossRef]
- Wang, T.; Liu, S.; Gao, G.; Zhao, P.; Lu, N.; Lun, X.; Hou, X. Magnetic solid phase extraction of non-steroidal anti-inflammatory drugs from water samples using a metal organic framework of type Fe3O4/MIL-101(Cr), and their quantitation by UPLC-MS/MS. Microchim. Acta 2017, 184, 2981–2990. [Google Scholar] [CrossRef]
- Mao, N.; Huang, L.; Shuai, Q. Facile synthesis of porous carbon for the removal of diclofenac sodium from water. ACS Omega 2019, 4, 15051–15060. [Google Scholar] [CrossRef] [Green Version]
- Rasheed, T.; Bilal, M.; Hassan, A.A.; Nabeel, F.; Bharagava, R.N.; Romanholo Ferreira, L.F.; Tran, H.N.; Iqbal, H.M.N. Environmental threatening concern and efficient removal of pharmaceutically active compounds using metal-organic frameworks as adsorbents. Environ. Res. 2020, 185, 109436. [Google Scholar] [CrossRef]
- Pap, S.; Taggart, M.A.; Shearer, L.; Li, Y.; Radovic, S.; Turk Sekulic, M. Removal behaviour of NSAIDs from wastewater using a P-functionalised microporous carbon. Chemosphere 2021, 264, 128439. [Google Scholar] [CrossRef]
- Mohiuddin, I.; Grover, A.; Aulakh, J.S.; Malik, A.K.; Lee, S.S.; Brown, R.J.C.; Kim, K.-H. Starch-Mg/Al layered double hydroxide composites as an efficient solid phase extraction sorbent for non-steroidal anti-inflammatory drugs as environmental pollutants. J. Hazard. Mater. 2021, 401, 123782. [Google Scholar] [CrossRef]
- Maryam, B.; Buscio, V.; Odabasi, S.U.; Buyukgungor, H. A study on behavior, interaction and rejection of paracetamol, diclofenac and ibuprofen (PhACs) from wastewater by nanofiltration membranes. Environ. Technol. Innov. 2020, 18, 100641. [Google Scholar] [CrossRef]
- Seo, P.W.; Bhadra, B.N.; Ahmed, I.; Khan, N.A.; Jhung, S.H. Adsorptive removal of pharmaceuticals and personal care products from water with functionalized metal-organic frameworks: Remarkable adsorbents with hydrogen-bonding abilities. Sci. Rep. 2016, 6, 34462. [Google Scholar] [CrossRef] [Green Version]
- Lagergren, S. Zur Theorie der Sogenannten Adsorption Gelöster Stoffe; Handlingar, Ed.; Springer: Berlin, Germany, 1907; Volume 2, ISBN 0368-6590. [Google Scholar]
- Ho, Y.S.; McKay, G. Pseudo-second order model for sorption processes. Process Biochem. 1999, 34, 451–465. [Google Scholar] [CrossRef]
- Chien, S.H.; Clayton, W.R. Application of Elovich equation to the kinetics of phosphate release and sorption in soils. Soil Sci. Soc. Am. J. 1980, 44, 265. [Google Scholar] [CrossRef]
- Xiao, Y.; Azaiez, J.; Hill, J.M. Erroneous application of pseudo-second-order adsorption kinetics model: Ignored assumptions and spurious correlations. Ind. Eng. Chem. Res. 2018, 57, 2705–2709. [Google Scholar] [CrossRef]
- Hasan, Z.; Choi, E.-J.; Jhung, S.H. Adsorption of naproxen and clofibric acid over a metal–organic framework MIL-101 functionalized with acidic and basic groups. Chem. Eng. J. 2013, 219, 537–544. [Google Scholar] [CrossRef]
- Hasan, Z.; Jeon, J.; Jhung, S.H. Adsorptive removal of naproxen and clofibric acid from water using metal-organic frameworks. J. Hazard. Mater. 2012, 209–210, 151–157. [Google Scholar] [CrossRef] [PubMed]
- Phasuphan, W.; Praphairaksit, N.; Imyim, A. Removal of ibuprofen, diclofenac, and naproxen from water using chitosan-modified waste tire crumb rubber. J. Mol. Liq. 2019, 294, 111554. [Google Scholar] [CrossRef]
- Giles, C.H.; MacEwan, T.H.; Nakhwa, S.N.; Smith, D. 786. Studies in adsorption. Part XI. A system of classification of solution adsorption isotherms, and its use in diagnosis of adsorption mechanisms and in measurement of specific surface areas of solids. J. Chem. Soc. 1960, 14, 3973–3993. [Google Scholar] [CrossRef]
- Langmuir, I. The adsorption of gases on plane surfaces of glass, mica and platinum. J. Am. Chem. Soc. 1918, 40, 1361–1403. [Google Scholar] [CrossRef] [Green Version]
- Freundlich, H.Z. Concerning adsorption in solutions. Zeitschrift für Phys. Chem. 1906, 57, 444–448. [Google Scholar]
- Sips, R. On the structure of a catalyst surface. J. Chem. Phys. 1948, 16, 490. [Google Scholar] [CrossRef]
- Ramadoss, R.; Subramaniam, D. Removal of divalent nickel from aqueous solution using blue-green marine algae: Adsorption modeling and applicability of various isotherm models. Sep. Sci. Technol. 2019, 54, 943–961. [Google Scholar] [CrossRef]
- Weber, T.W.; Chakravorti, R.K. Pore and solid diffusion models for fixed-bed adsorbers. AIChE J. 1974, 20, 228–238. [Google Scholar] [CrossRef]
- Liu, H.; Dong, Y.; Wang, H.; Liu, Y. Adsorption behavior of ammonium by a bioadsorbent–Boston ivy leaf powder. J. Environ. Sci. 2010, 22, 1513–1518. [Google Scholar] [CrossRef]
- Husein, D.Z.; Hassanien, R.; Al-Hakkani, M.F. Green-synthesized copper nano-adsorbent for the removal of pharmaceutical pollutants from real wastewater samples. Heliyon 2019, 5, e02339. [Google Scholar] [CrossRef] [PubMed] [Green Version]
- Jung, C.; Boateng, L.K.; Flora, J.R.V.; Oh, J.; Braswell, M.C.; Son, A.; Yoon, Y. Competitive adsorption of selected non-steroidal anti-inflammatory drugs on activated biochars: Experimental and molecular modeling study. Chem. Eng. J. 2015, 264, 1–9. [Google Scholar] [CrossRef]
- Li, Y.; Wang, Y.; He, L.; Meng, L.; Lu, H.; Li, X. Preparation of poly(4-vinylpyridine)-functionalized magnetic Al-MOF for the removal of naproxen from aqueous solution. J. Hazard. Mater. 2020, 383, 121144. [Google Scholar] [CrossRef]
- Mohammadi Nodeh, M.K.; Radfard, M.; Zardari, L.A.; Rashidi Nodeh, H. Enhanced removal of naproxen from wastewater using silica magnetic nanoparticles decorated onto graphene oxide; parametric and equilibrium study. Sep. Sci. Technol. 2018, 53, 2476–2485. [Google Scholar] [CrossRef]
- İlbay, Z.; Şahin, S.; Kerkez, Ö.; Bayazit, Ş.S. Isolation of naproxen from wastewater using carbon-based magnetic adsorbents. Int. J. Environ. Sci. Technol. 2015, 12, 3541–3550. [Google Scholar] [CrossRef] [Green Version]
- Önal, Y.; Akmil-Başar, C.; Sarıcı-Özdemir, Ç. Elucidation of the naproxen sodium adsorption onto activated carbon prepared from waste apricot: Kinetic, equilibrium and thermodynamic characterization. J. Hazard. Mater. 2007, 148, 727–734. [Google Scholar] [CrossRef] [PubMed]
- Kebede, T.G.; Dube, S.; Nindi, M.M. Biopolymer electrospun nanofibres for the adsorption of pharmaceuticals from water systems. J. Environ. Chem. Eng. 2019, 7, 103330. [Google Scholar] [CrossRef]
- Peng, G.; Zhang, M.; Deng, S.; Shan, D.; He, Q.; Yu, G. Adsorption and catalytic oxidation of pharmaceuticals by nitrogen-doped reduced graphene oxide/Fe3O4 nanocomposite. Chem. Eng. J. 2018, 341, 361–370. [Google Scholar] [CrossRef]
- Lawal, I.A.; Lawal, M.M.; Akpotu, S.O.; Azeez, M.A.; Ndungu, P.; Moodley, B. Theoretical and experimental adsorption studies of sulfamethoxazole and ketoprofen on synthesized ionic liquids modified CNTs. Ecotoxicol. Environ. Saf. 2018, 161, 542–552. [Google Scholar] [CrossRef] [PubMed]
- Fröhlich, A.C.; Foletto, E.L.; Dotto, G.L. Preparation and characterization of NiFe2O4/activated carbon composite as potential magnetic adsorbent for removal of ibuprofen and ketoprofen pharmaceuticals from aqueous solutions. J. Clean. Prod. 2019, 229, 828–837. [Google Scholar] [CrossRef]

Publisher’s Note: MDPI stays neutral with regard to jurisdictional claims in published maps and institutional affiliations. |
© 2021 by the authors. Licensee MDPI, Basel, Switzerland. This article is an open access article distributed under the terms and conditions of the Creative Commons Attribution (CC BY) license (https://creativecommons.org/licenses/by/4.0/).