
Computational Fluid Dynamics Analysis of Particle Deposition Induced by a Showerhead Electrode in a Capacitively Coupled Plasma Reactor


Abstract
:
1. Introduction
2. Materials and Methods
2.1. Mathematical Model for the Gas Flows
2.2. Mathematical Model for the Particle Motions
2.3. Mathematical Model for Heat Transfer and Multi-Component Transport
2.4. Mathematical Model for the Plasma Discharges
2.5. Numerical Scheme
2.6. Computational Mesh
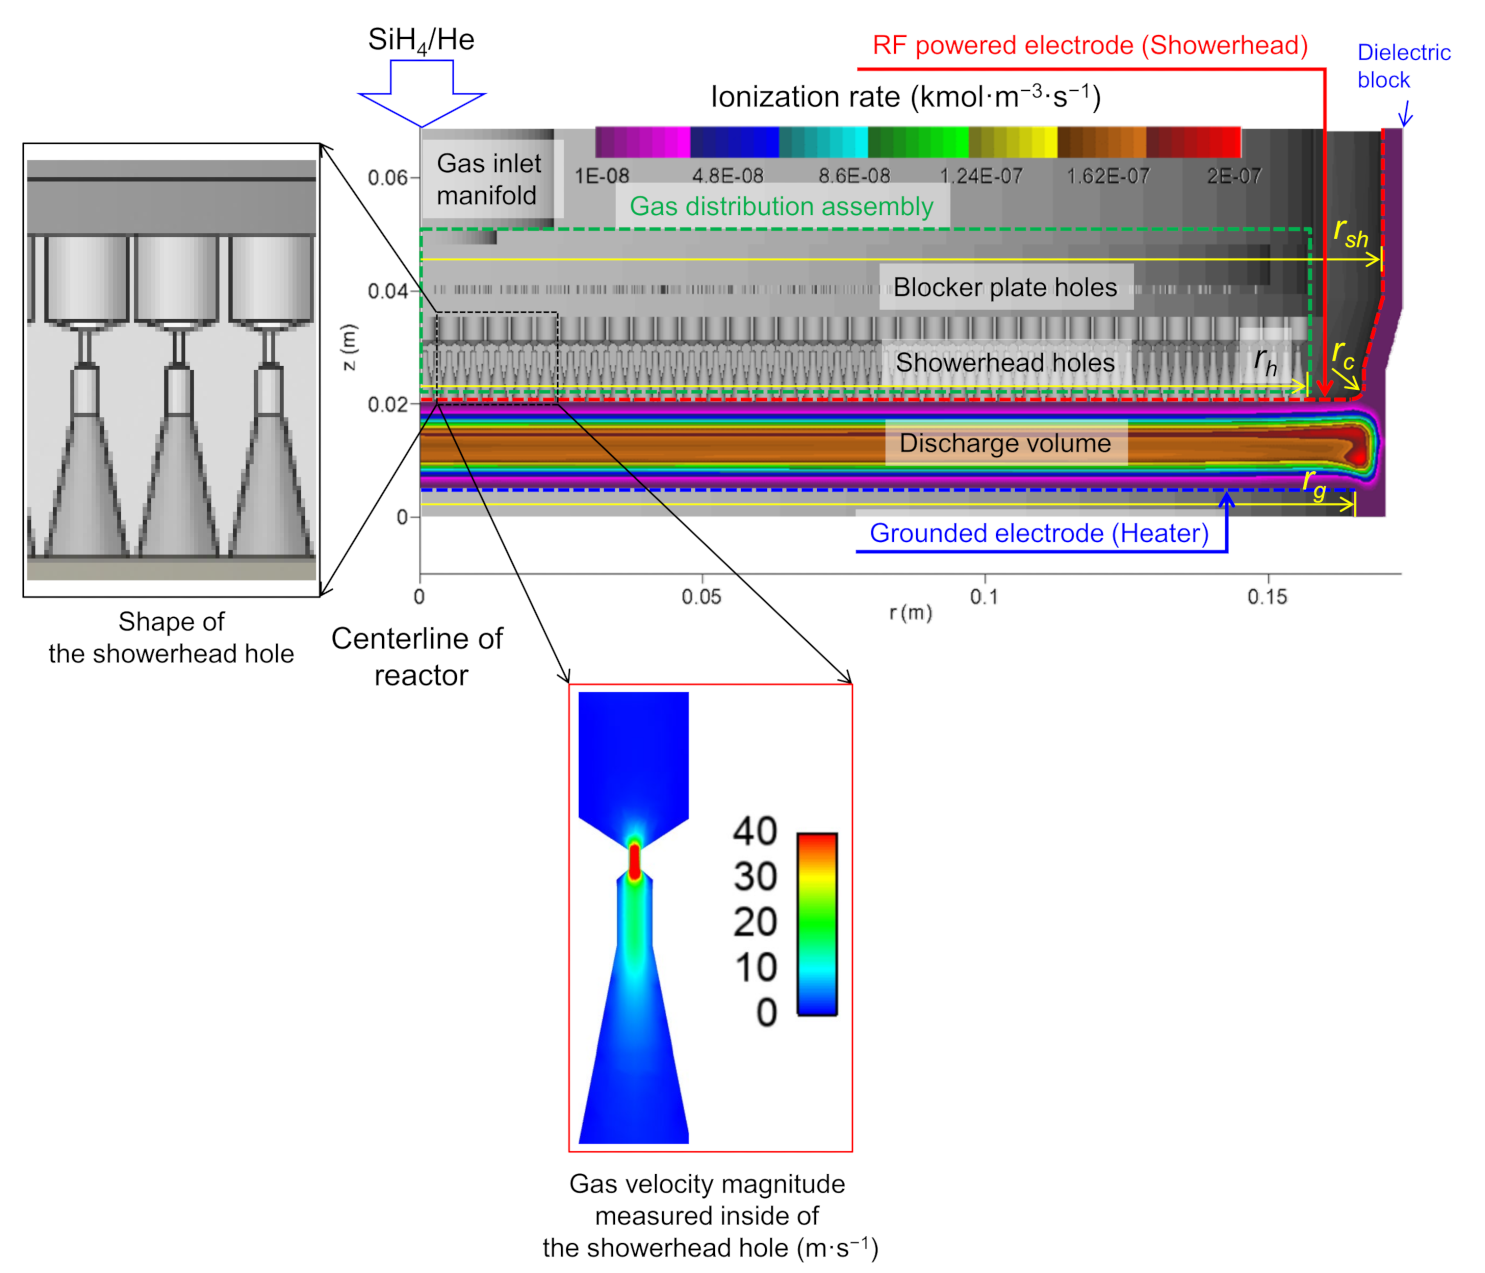
2.7. Reactor Geometry and Problem Settings
3. Results
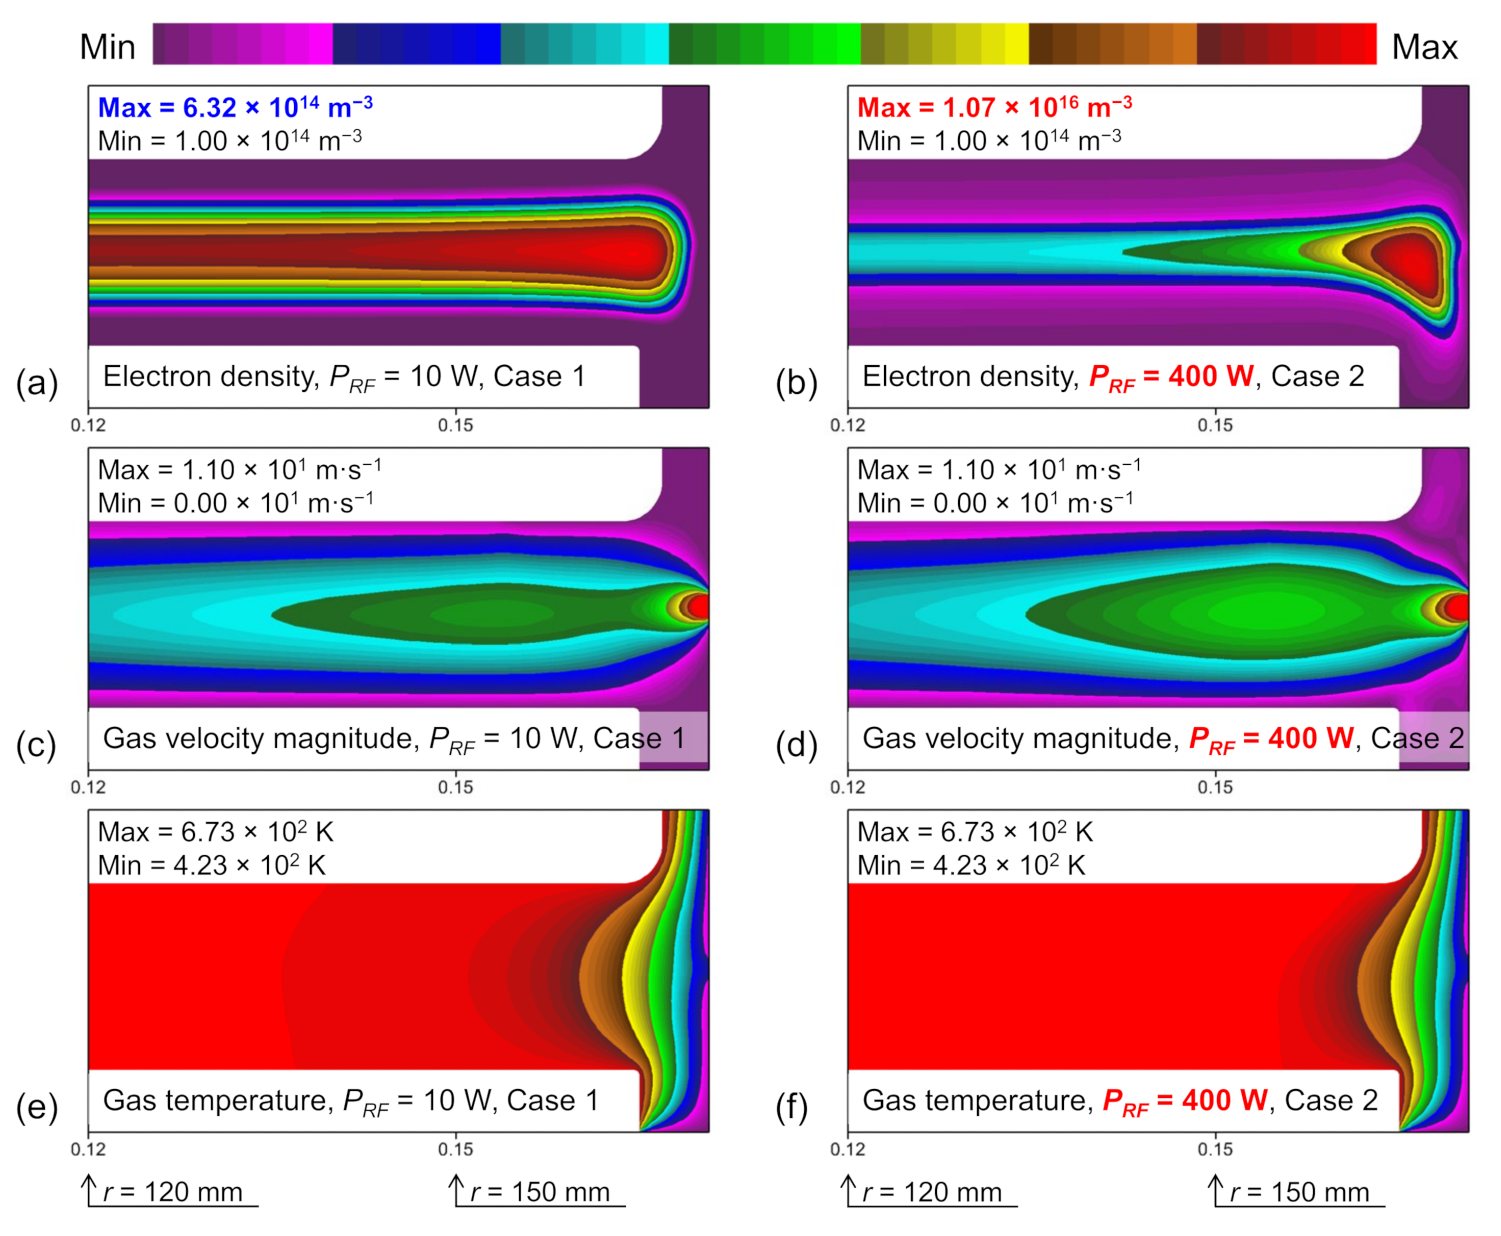
3.1. Gas Flows in a CCP Reactor
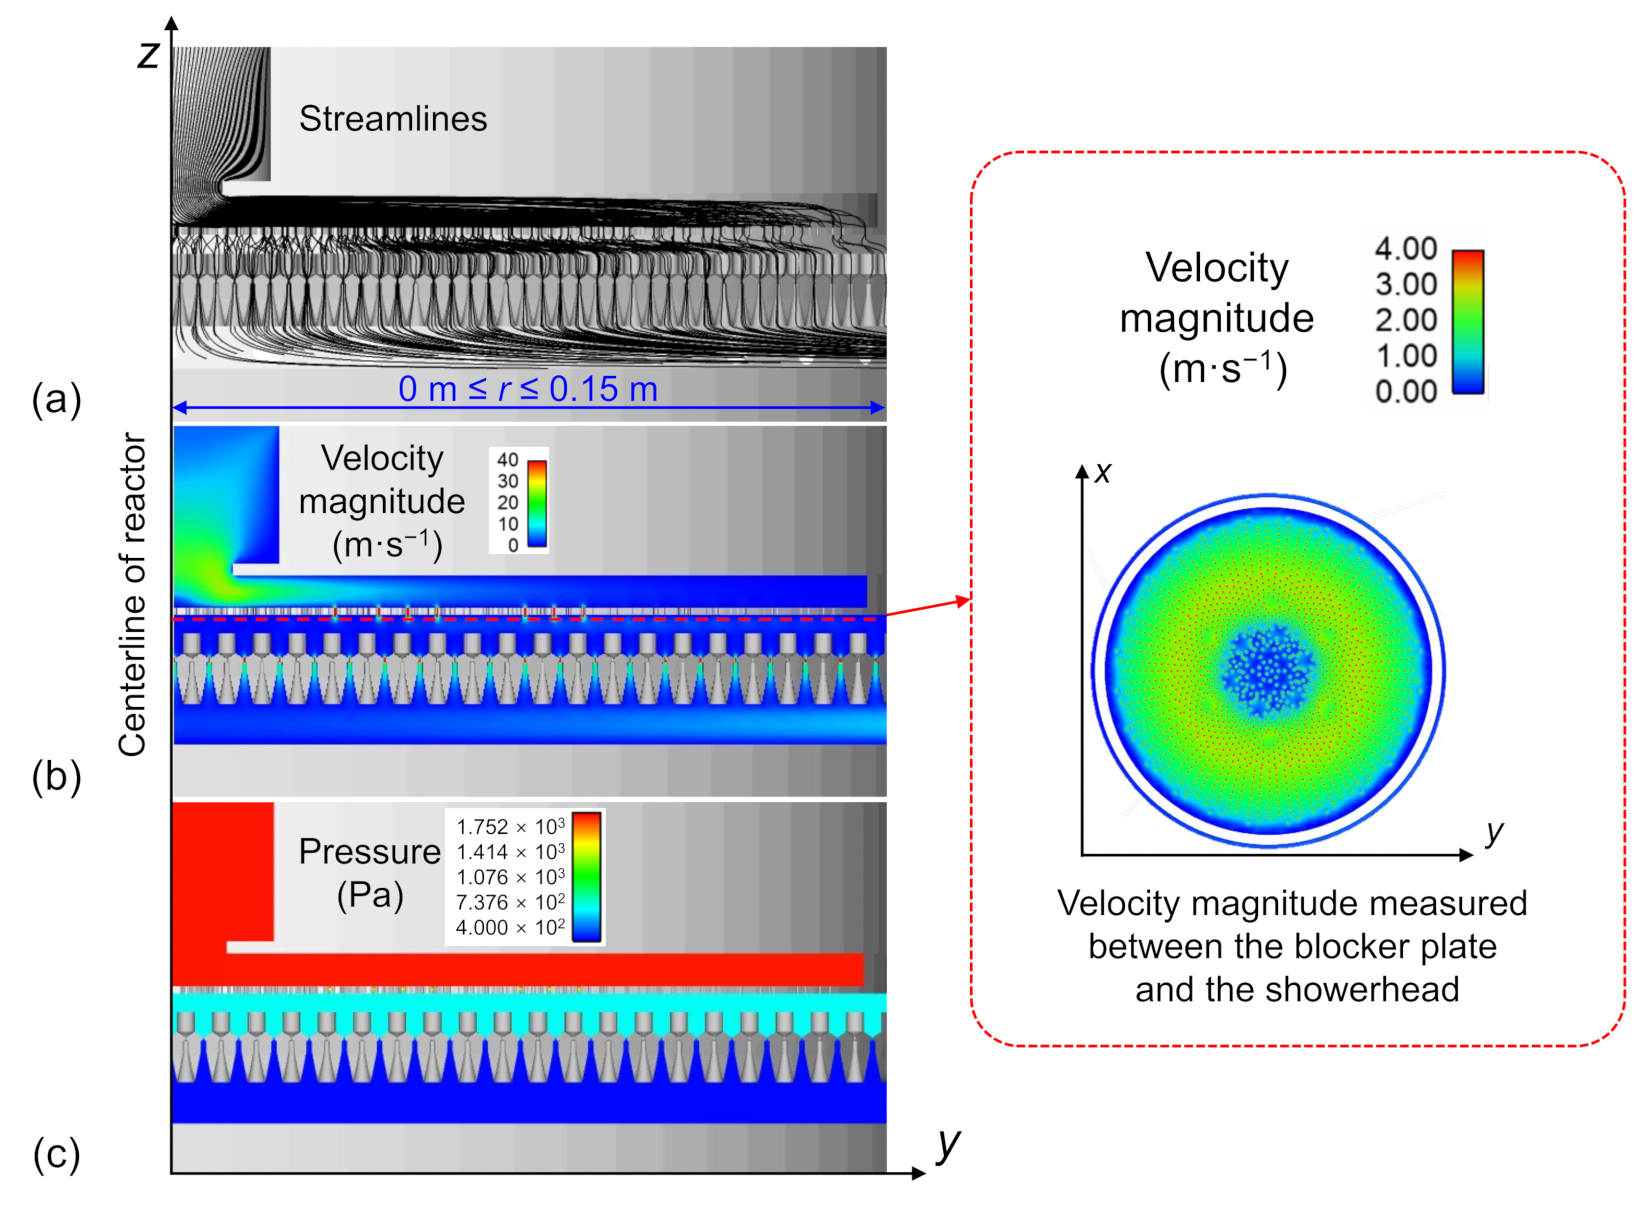
3.2. Analysis of Gas Flows in a Three-Dimensional Geometry
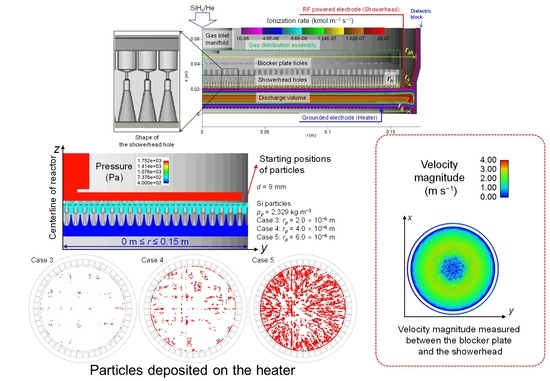
3.3. Particle Deposition
4. Discussion
5. Conclusions
Author Contributions
Funding
Institutional Review Board Statement
Informed Consent Statement
Data Availability Statement
Conflicts of Interest
References
- Smith, D.L. Thin-Film Deposition: Principles and Practice; McGraw-Hill: New York, NY, USA, 1995. [Google Scholar]
- Street, R.A. Technology and Applications of Amorphous Silicon; Springer: Berlin/Heidelberg, Germany; Springer: New York, NY, USA, 2000. [Google Scholar]
- Lieberman, M.A.; Lichtenberg, A.J. Principles of Plasma Discharges and Materials Processing; John Wiley & Sons Inc.: Hoboken, NJ, USA, 2005. [Google Scholar]
- Yavas, O.; Richter, E.; Kluthe, C.; Sickmoeller, M. Wafer-edge yield engineering in leading-edge DRAM manufacturing. Semicond. Fabtech 2009, 35, 1. [Google Scholar]
- Hichri, H.; Sippel, J.O.; Grunow, S.L.; Bunke, C.; Kelp, J.; Fang, R.; Kulkarni, D.; Angyal, M.; Houghton, T.; Santiago, A.; et al. Integration solutions for 65 nm back end of line defect reduction and manufacturability. J. ECS Trans. 2007, 11, 265–275. [Google Scholar] [CrossRef]
- Menz, W.J.; Kraft, M. A new model for silicon nanoparticle synthesis. Combust. Flame 2013, 160, 947–958. [Google Scholar] [CrossRef]
- Rader, D.J.; Geller, A.S. Showerhead-enhanced inertial particle deposition in parallel-plate reactors. Aerosol Sci. Technol. 1998, 28, 105–132. [Google Scholar] [CrossRef]
- Nijhawan, S.; McMurry, P.H.; Campbell, S.A. Particle transport in a parallel-plate semiconductor reactor: Chamber modification and design criterion for enhanced process cleanliness. J. Vac. Sci. Technol. A 2000, 18, 2198–2206. [Google Scholar] [CrossRef]
- Hash, D.B.; Mihopoulos, T.; Govindan, T.R.; Meyyappan, M. Characterization of showerhead performance at low pressure. J. Vac. Sci. Technol. B 2000, 18, 2808–2813. [Google Scholar] [CrossRef]
- Sansonnens, L.; Howling, A.A.; Hollenstein, C. A gas flow uniformity study in large-area showerhead reactors for RF plasma deposition. Plasma Sources Sci. Technol. 2000, 9, 205. [Google Scholar] [CrossRef]
- Sobbia, R.; Sansonnens, L.; Bondkowski, J. Uniformity study in large-area showerhead reactors. J. Vac. Sci. Technol. A 2005, 23, 927–932. [Google Scholar] [CrossRef]
- Howling, A.A.; Legradic, B.; Chesaux, M.; Hollenstein, C. Plasma deposition in an ideal showerhead reactor: A two-dimensional analytical solution. Plasma Sources Sci. Technol. 2012, 21, 015005. [Google Scholar] [CrossRef]
- Setyawan, H.; Shimada, M.; Ohtsuka, K.; Okuyama, K. Visualization and numerical simulation of fine particle transport in a low-pressure parallel plate chemical vapor deposition reactor. Chem. Eng. Sci. 2002, 57, 497–506. [Google Scholar] [CrossRef]
- Setyawan, H.; Shimada, M.; Imajo, Y.; Hayashi, Y.; Okuyama, K. Characterization of particle contamination in process steps during plasma-enhanced chemical vapor deposition operation. J. Aerosol. Sci. 2003, 34, 923–936. [Google Scholar] [CrossRef]
- Setyawan, H.; Shimada, M.; Hayashi, Y.; Okuyama, K.; Yokoyama, S. Particle formation and trapping behavior in a TEOS/O2 plasma and their effects on contamination of a Si wafer. Aerosol Sci. Technol. 2004, 38, 120–127. [Google Scholar] [CrossRef]
- Kim, H.J.; Yang, W.; Joo, J. Effect of electrode spacing on the density distributions of electrons, ions, and metastable and radical molecules in SiH4/NH3/N2/He capacitively coupled plasmas. J. Appl. Phys. 2015, 118, 043304. [Google Scholar] [CrossRef]
- Kim, H.J.; Lee, H.J. Analysis of intermediate pressure SiH4/He capacitively coupled plasma for deposition of an amorphous hydrogenated silicon film in consideration of thermal diffusion effects. Plasma Sources Sci. Technol. 2017, 26, 085003. [Google Scholar] [CrossRef]
- Morsi, S.A.; Alexander, A.J. An investigation of particle trajectories in two-phase flow systems. J. Fluid Mech. 1972, 55, 193–208. [Google Scholar] [CrossRef]
- Simerics Inc. Available online: https://www.simerics.com (accessed on 30 July 2021).
- Patankar, S.V. Numerical Heat Transfer and Fluid Flow; Routledge: London, UK, 1980. [Google Scholar]
- Kim, H.J.; Beskok, A. An algebraic factorisation scheme for spectral element solution of incompressible flow and scalar transport. Int. J. Comp. Fluid Dyn. 2010, 24, 95–108. [Google Scholar] [CrossRef]
- ESI Group. CFD-ACE+ 2020.0 Manual; ESI US R&D Inc.: Huntsville, AL, USA, 2020. [Google Scholar]
- Farouk, T.; Farouk, B.; Staack, D.; Gutsol, A.; Fridman, A. Simulation of dc atmospheric pressure argon micro glow-discharge. Plasma Sources Sci. Technol. 2006, 15, 676–688. [Google Scholar] [CrossRef]
- Farouk, T.; Farouk, B.; Gutsol, A.; Fridman, A. Atmospheric pressure methane-hydrogen dc micro-glow discharge for thin film deposition. J. Phys. D Appl. Phys. 2008, 41, 175202. [Google Scholar] [CrossRef]
- Danko, S.; Bluhm, D.; Bolsinger, V.; Dobrygin, W.; Schmidt, O.; Brinkmann, R.P. A global model study of silane/hydrogen discharges. Plasma Sources Sci. Technol. 2013, 22, 055009. [Google Scholar] [CrossRef]
- Zhang, B.; Zhang, X. Control of higher-silane generation by dilution gases in SiH4 plasmas. Plasma Sources Sci. Technol. 2020, 29, 095012. [Google Scholar] [CrossRef]
- Agarwal, A.; Rauf, S.; Collins, K. Gas heating mechanisms in capacitively coupled plasmas. Plasma Sources Sci. Technol. 2012, 21, 055012. [Google Scholar] [CrossRef]
- Bird, R.B.; Stewart, W.E.; Lightfoot, E.N. Transport Phenomena; John Wiley & Sons, Inc.: New York, NY, USA, 2007. [Google Scholar]


| Case No. | Physics | Geo-Metry (Mesh) | Showerhead Temp. (Tsh, K) | RF Power (PRF, W) | Gas Pressure (pg, Pa) | SiH4/He Flows (sccm) | Particle Density (kg·m−3) and Size (m) | Electrode Spacing (d, mm) |
|---|---|---|---|---|---|---|---|---|
| 1 | Discharges | 2D | 673 | 10 | 400 | 50/5000 | – | 15 |
| 2 | Discharges | 2D | 673 | 400 | 400 | 50/5000 | – | 15 |
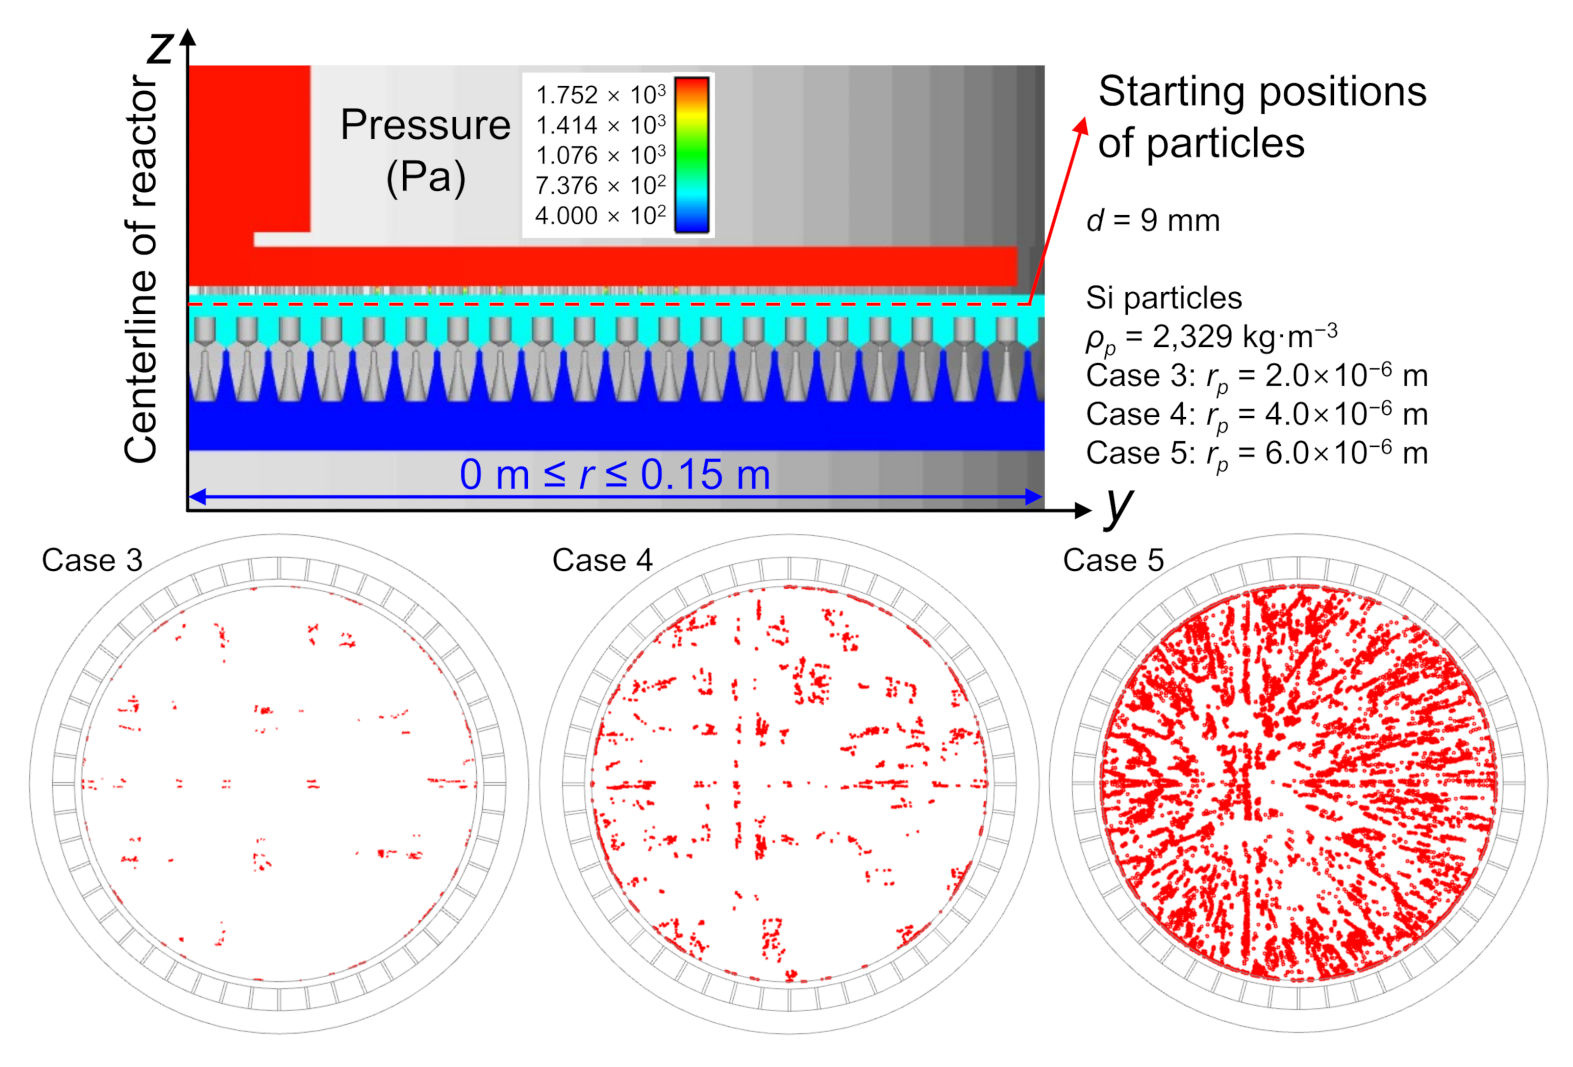
| 3 | Gas flows | 3D | 673 | – | 400 | 50/5000 | 2329, 2 × 10⁻⁶ | 9 |
| 4 | Gas flows | 3D | 673 | – | 400 | 50/5000 | 2329, 4 × 10⁻⁶ | 9 |
| 5 | Gas flows | 3D | 673 | – | 400 | 50/5000 | 2329, 6 × 10⁻⁶ | 9 |
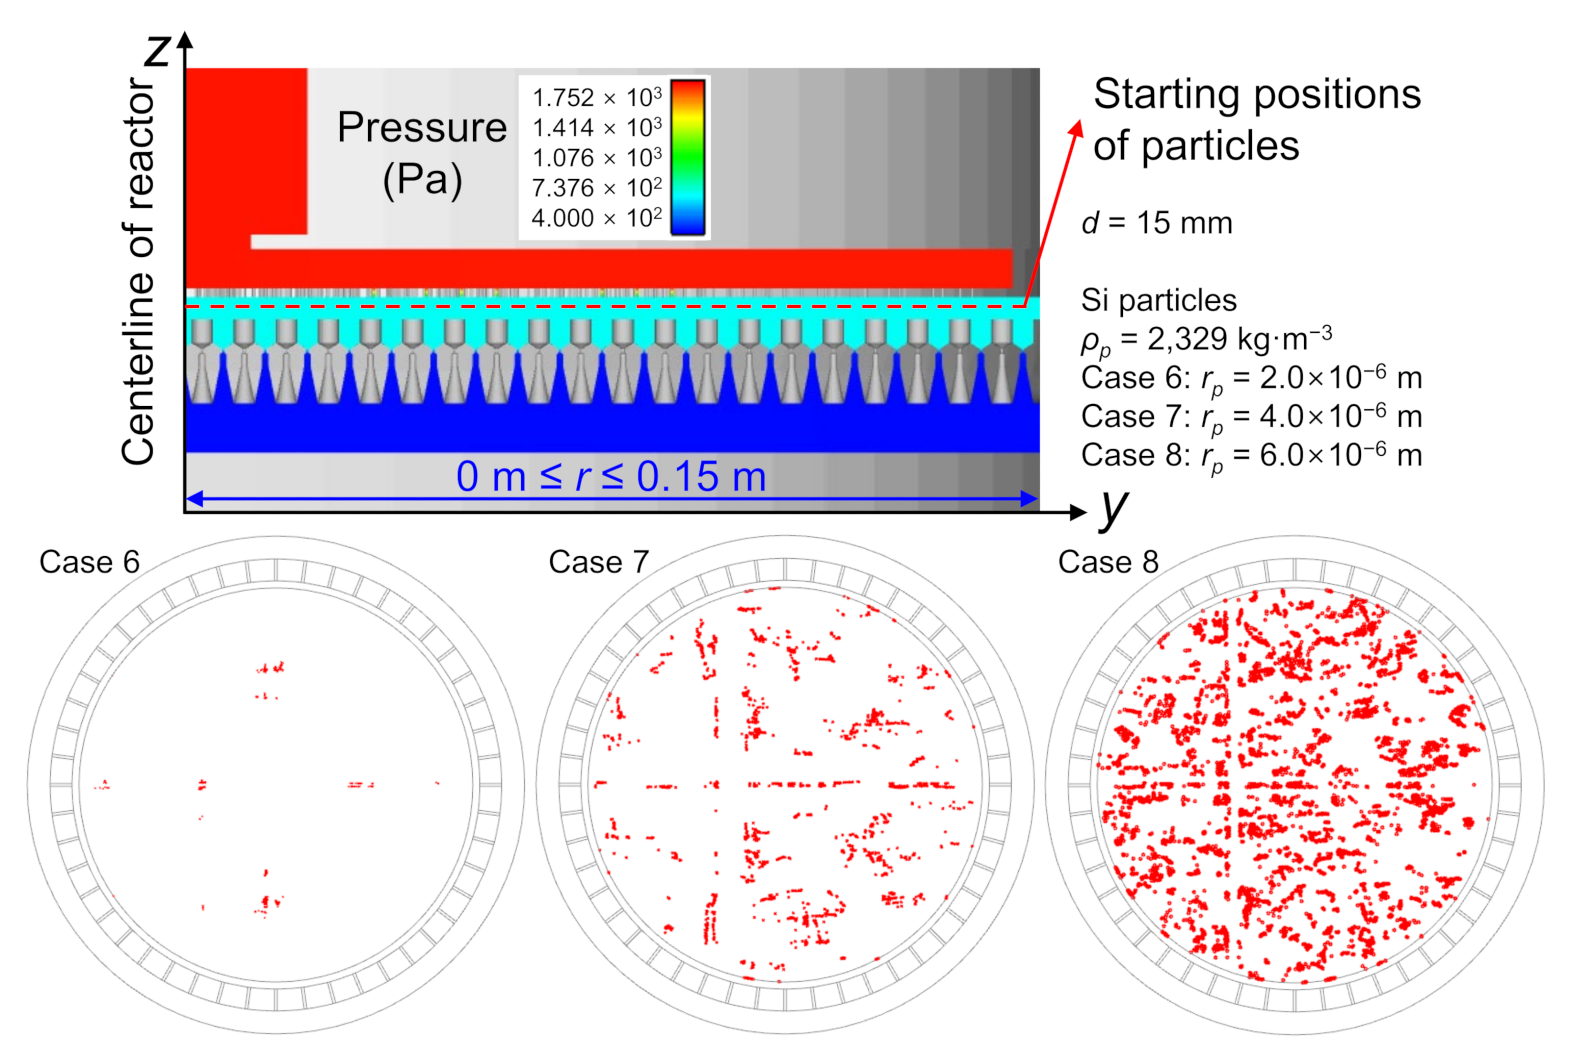
| 6 | Gas flows | 3D | 673 | – | 400 | 50/5000 | 2329, 2 × 10⁻⁶ | 15 |
| 7 | Gas flows | 3D | 673 | – | 400 | 50/5000 | 2329, 4 × 10⁻⁶ | 15 |
| 8 | Gas flows | 3D | 673 | – | 400 | 50/5000 | 2329, 6 × 10⁻⁶ | 15 |
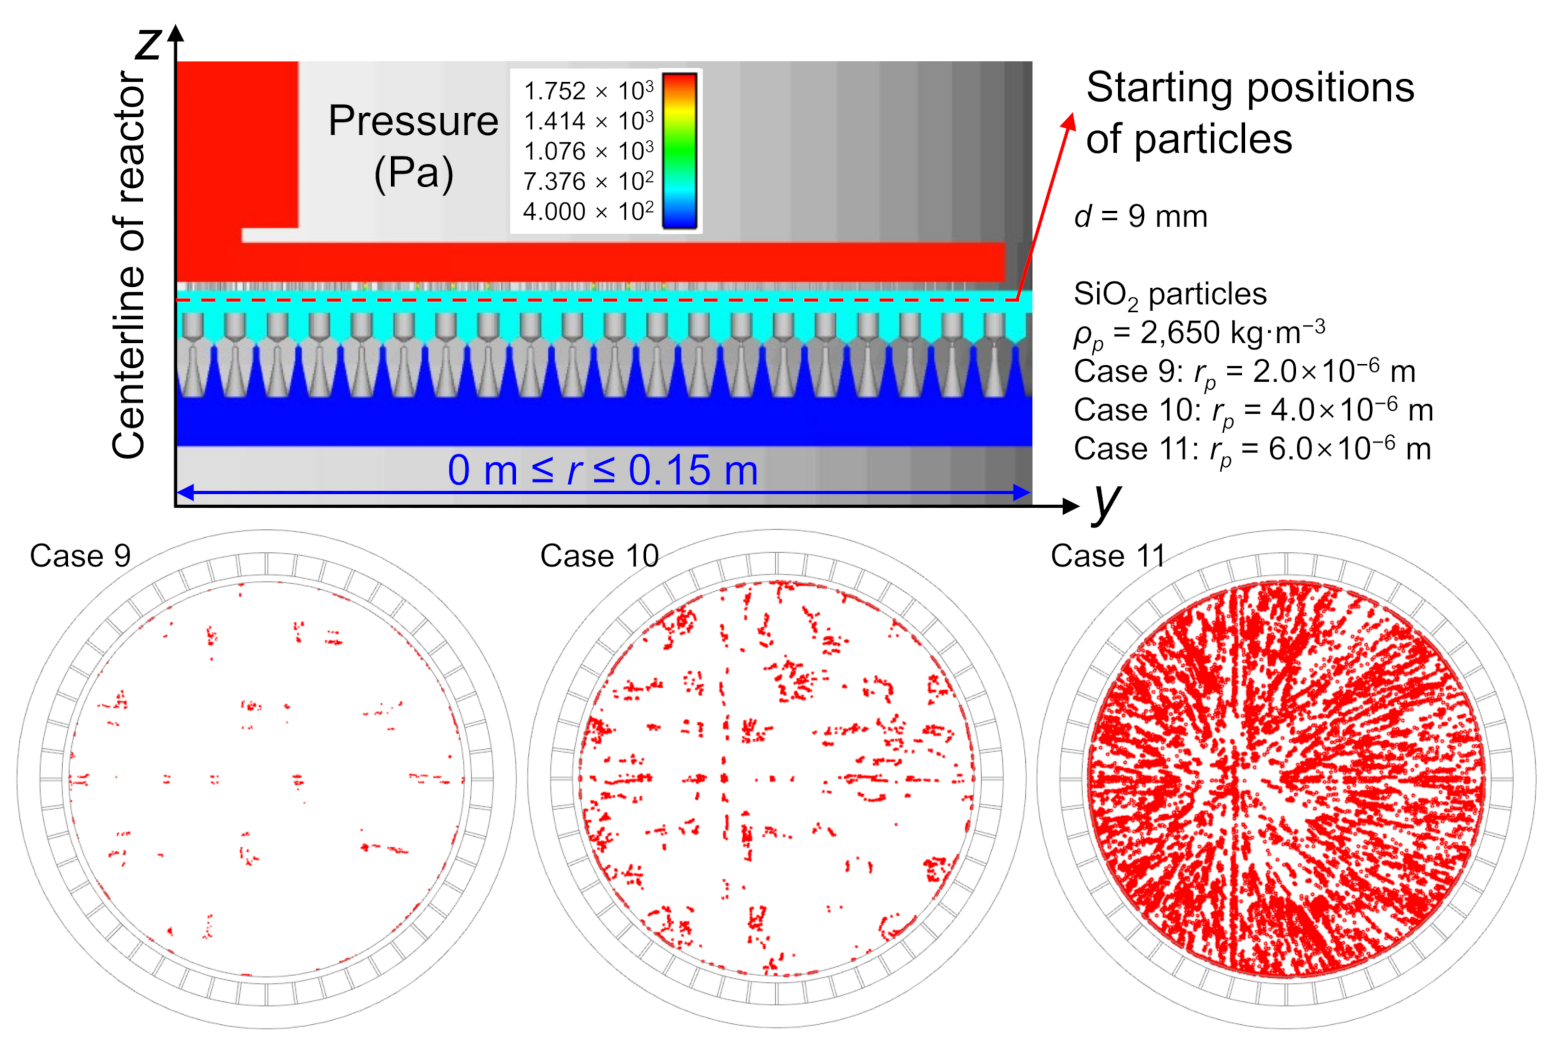
| 9 | Gas flows | 3D | 673 | – | 400 | 50/5000 | 2650, 2 × 10⁻⁶ | 9 |
| 10 | Gas flows | 3D | 673 | – | 400 | 50/5000 | 2650, 4 × 10⁻⁶ | 9 |
| 11 | Gas flows | 3D | 673 | – | 400 | 50/5000 | 2650, 6 × 10⁻⁶ | 9 |
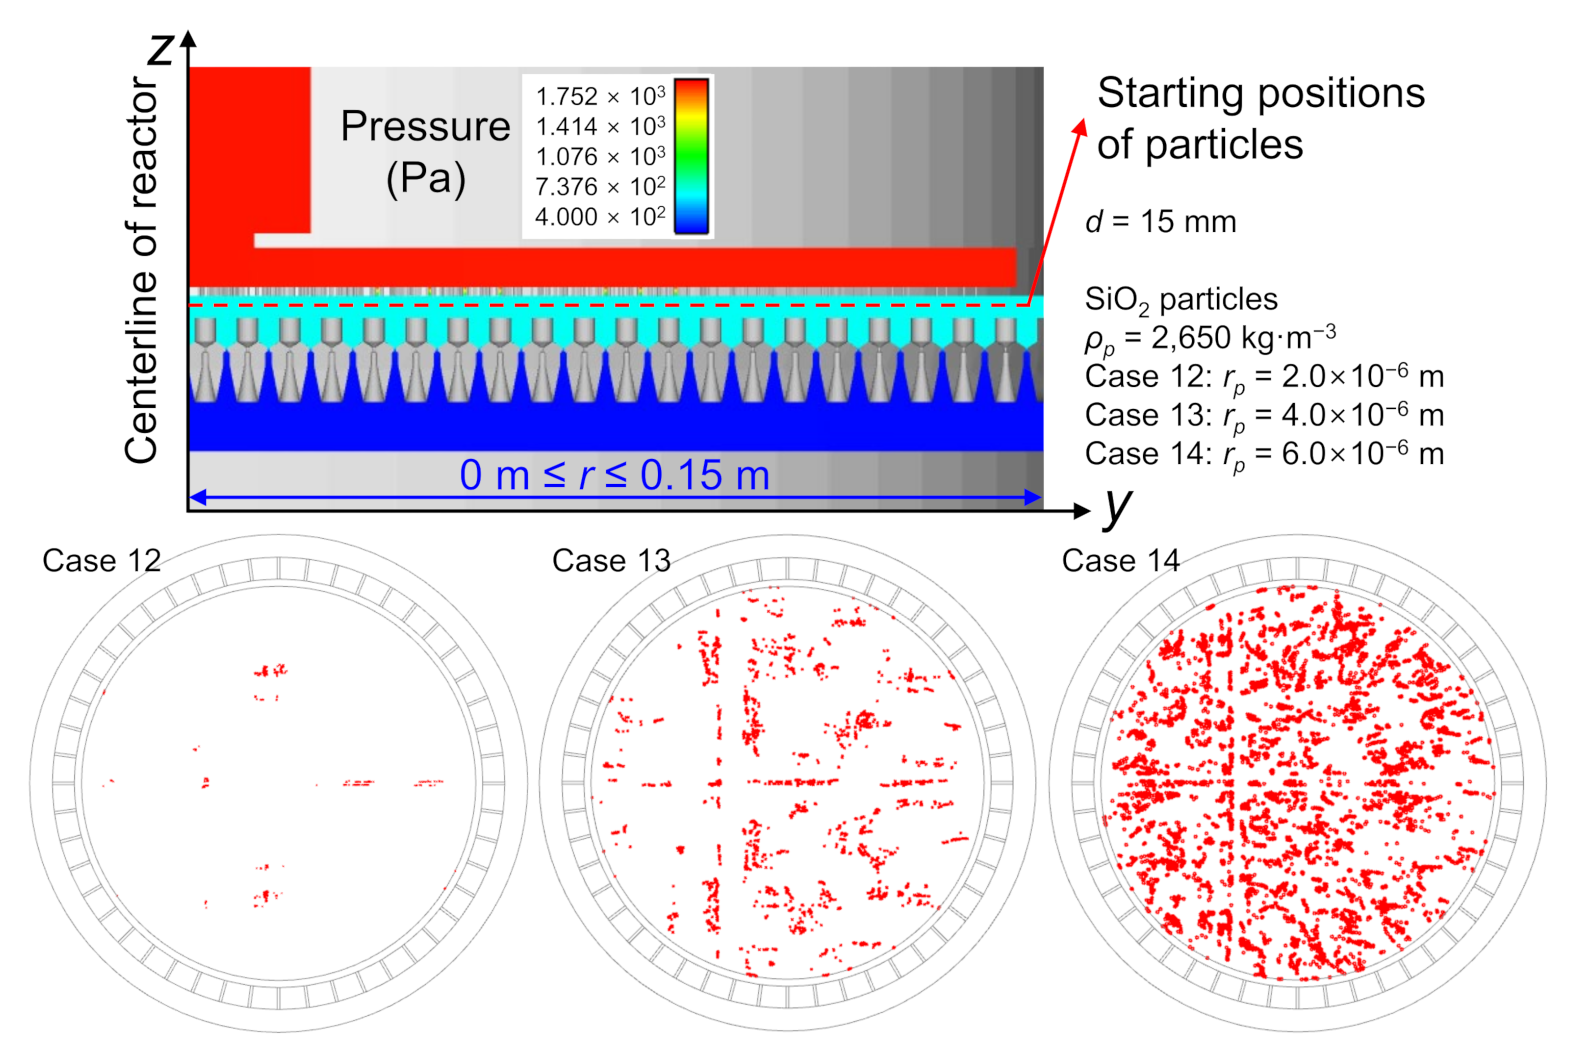
| 12 | Gas flows | 3D | 673 | – | 400 | 50/5000 | 2650, 2 × 10⁻⁶ | 15 |
| 13 | Gas flows | 3D | 673 | – | 400 | 50/5000 | 2650, 4 × 10⁻⁶ | 15 |
| 14 | Gas flows | 3D | 673 | – | 400 | 50/5000 | 2650, 6 × 10⁻⁶ | 15 |
| 15 | Discharges | 2D | 473 | 100 | 800 | 100/5000 | – | 15 |
| 16 | Discharges | 2D | 473 | 100 | 800 | 100/5000 | – | 20 |
| 17 | Discharges | 2D | 473 | 100 | 2400 | 100/5000 | – | 7 |
| 18 | Discharges | 2D | 473 | 100 | 2400 | 100/5000 | – | 15 |
Publisher’s Note: MDPI stays neutral with regard to jurisdictional claims in published maps and institutional affiliations. |
© 2021 by the authors. Licensee MDPI, Basel, Switzerland. This article is an open access article distributed under the terms and conditions of the Creative Commons Attribution (CC BY) license (https://creativecommons.org/licenses/by/4.0/).
Share and Cite
Kim, H.J.; Yoon, J.H. Computational Fluid Dynamics Analysis of Particle Deposition Induced by a Showerhead Electrode in a Capacitively Coupled Plasma Reactor. Coatings 2021, 11, 1004. https://doi.org/10.3390/coatings11081004
Kim HJ, Yoon JH. Computational Fluid Dynamics Analysis of Particle Deposition Induced by a Showerhead Electrode in a Capacitively Coupled Plasma Reactor. Coatings. 2021; 11(8):1004. https://doi.org/10.3390/coatings11081004
Chicago/Turabian StyleKim, Ho Jun, and Jung Hwan Yoon. 2021. "Computational Fluid Dynamics Analysis of Particle Deposition Induced by a Showerhead Electrode in a Capacitively Coupled Plasma Reactor" Coatings 11, no. 8: 1004. https://doi.org/10.3390/coatings11081004
APA StyleKim, H. J., & Yoon, J. H. (2021). Computational Fluid Dynamics Analysis of Particle Deposition Induced by a Showerhead Electrode in a Capacitively Coupled Plasma Reactor. Coatings, 11(8), 1004. https://doi.org/10.3390/coatings11081004