Article

Effect of Microcracks on the Tensile Properties of 3D Woven Composites

1
Nanjing Fiberglass Research & Design Institute Co., Ltd., Nanjing 210012, China
2
Continental Technology LLC, 6079 Osage Drive, Carmel, IN 46033, USA
*
Authors to whom correspondence should be addressed.
Coatings 2021, 11(7), 794; https://doi.org/10.3390/coatings11070794
Submission received: 30 May 2021 / Revised: 27 June 2021 / Accepted: 29 June 2021 / Published: 1 July 2021
(This article belongs to the Special Issue Damage and Fracture of Composites)

Abstract

:
This study provides an experimental investigation on the effect of microcracks on the tensile properties of 3D woven composites. A four-step experimental procedure using the combination of micro-XCT, acoustic emission (AE) and digital image correlation (DIC) is here proposed. Typical tensile damage behaviors were characterized by the stress–strain curves, AE signal analysis and DIC full field strain measurement. Due to a typical four stages stress–strain behavior, phenomena of stiffness degradation and stiffness hardening were successively found during the tensile process. Samples with various damage levels were produced by the in situ AE monitoring. Their 3D microcrack morphologies show the crack initiation, propagation process and the damage modes. Detectable damages initiated during the stress range from 65.98% to 72.93% σs. The cracks volume fraction (CVF) shows a positive correlation relationship with the corresponding tensile load. Moreover, the CVF was used to characterize the degree of damage. The samples with various phased damages were tested again in the fourth step to obtain their residual modulus and residual strength. Detected microcracks have little influence on the residual strength, while the residual modulus witnesses a regular decrease along with the damage increase. The effect of microcracks on the tensile properties is characterized by the relationships between the gradually increased damages and the corresponding residual properties which provide a foundation for damage evaluation of 3D woven structures in service.

1. Introduction

Three-dimensional woven composites were developed in the 1960s to overcome the shortcomings of traditional laminates and have been paid more and more attention to, due not only to the outstanding mechanical properties but also to their higher production efficiency and net-shape manufacturing with complex geometry designs [1,2,3]. Compared with traditional laminates and 2D woven composites, 3D woven composites have weft and warp yarns woven multilayers, resulting in improved delamination resistance, higher damage tolerance, reduced notch sensitivity and improved fracture toughness [4,5,6]. Three-dimensional woven composites are good candidates for structural applications with out-of-plane and impact loading conditions and have been widely used in the aerospace, automotive, construction, biomedicine and safety industries [7,8,9,10,11].
Three-dimensional woven composites, on the other hand, have more complex mesoscopic structures, leading to extra challenges to investigate their mechanical behaviors and damage evolution process. Previous studies predominantly focused on the mechanical performances and failure mode analysis under different loading conditions [5,12,13,14,15,16]. There are also some investigations which highlight the multi-scale finite element algorithm of 3D woven composites to predict the tensile and compressive modulus and strength and to characterize the corresponding damage process [17,18,19,20]. To discover the advantages of 3D woven composites over 2D composites, the mechanical responses under quasi-static and impact loading conditions have also been discussed [21,22,23,24,25]. However, one of the most common damage modes is microcracks for 3D woven structures in service and there are few studies that give a clear description of the microcrack initiation, propagation process and, especially, their influence on the mechanical properties [8,10].
Nowadays, a range of non-destructive techniques (NDT) are employed to study the damage behavior of 3D woven composites. Acoustic emission (AE), digital image correlations (DIC) and X-ray based computer tomography (CT) are the three methods usually adopted in open literatures to characterize the mechanical behaviors and damage mechanisms. AE is a passive NDT method for structures undergoing deformation and can give a comprehensive damage diagnostic of damage initiation, identification and damage localization [24,26,27]. In fact, most of AE features, such as amplitude, energy, rise time, duration and counts, are highly affected by the sensor type, sensor to source distance, coupling quality and user defined parameters. The results of the same samples can vary among different researchers, so that it is difficult to achieve a reliable and robust AE monitoring of composite structures, especially for damage identification. On the other hand, AE monitors the transient stress waves generated by the rapid release of energy from localized fractures, making it a reliable method to monitor damage initiation and damage evolution.
DIC is an optical technique that combines image registration and tracking methods for accurate 2D measurements of changes in images and has been extended to 3D measurements. DIC was chosen by some researchers to map the surface strain field for a better understanding of not only the quasi-static mechanical properties and the deforming process of 3D woven composites, but also their fatigue performances and damage mechanisms [28,29,30]. DIC records the whole procedure of the composites tests, being able to give out the full-field strain map and the strain evolution process, on which one can identify the strain concentration locations. However, DIC only allows us to do damage evaluation from the sample surfaces and we cannot obtain any information that can characterize the inner damages.
Another NDT technique, X-ray based computer tomography, makes it possible to qualitatively and quantitively analyze the inner damage behaviors through visualization of the tomography photograph and the damage 3D reconstruction [31,32,33,34]. In recent years, in situ CT technology was also adopted to characterize the damage development of quasi-static and fatigue loading conditions [14,35,36,37]. This in situ CT technology allows us to generate a more real and continuous damage evolution process, with the load staying consistent. However, due to the unit cell property of 3D woven composites, the tensile tests need larger samples with at least two unit cells along the width direction to obtain reliable tensile properties, making the required load range much larger than traditional laminate composites. According to the authors’ experiences, the tensile fracture load of carbon/epoxy 3D woven composites is usually larger than 100 kN, making the application of in situ CT technology in tensile tests of 3D woven composites still limited.
In this paper, the typical tensile damage behavior of 3D woven composites is investigated with a four-step experimental method showing the initiation and propagation of microcracks and the effect of microcracks on the tensile properties. Typical tensile behaviors of 3D woven composites are discussed through stress–strain curves, combining AE signal analysis and DIC full field strain measurement. Tensile samples with various microcracks were produced in the second step by tensile tests, which were manually stopped at different stress levels before the final fracture, according to the in situ AE monitoring. In the third step, these samples were scanned and reconstructed by means of micro-CT. The 3D microcrack morphologies were extracted showing the crack initiation, propagation process and the damage modes. The cracks volume fraction (CVF) was used to characterize the degree of damage. The samples with various phased damages were tested again, in the fourth step, to obtain their residual modulus and residual strength. The effect of microcracks on the tensile properties is characterized by the relationships between the gradually increased damages and the corresponding normalized residual properties.

2. Experimentation

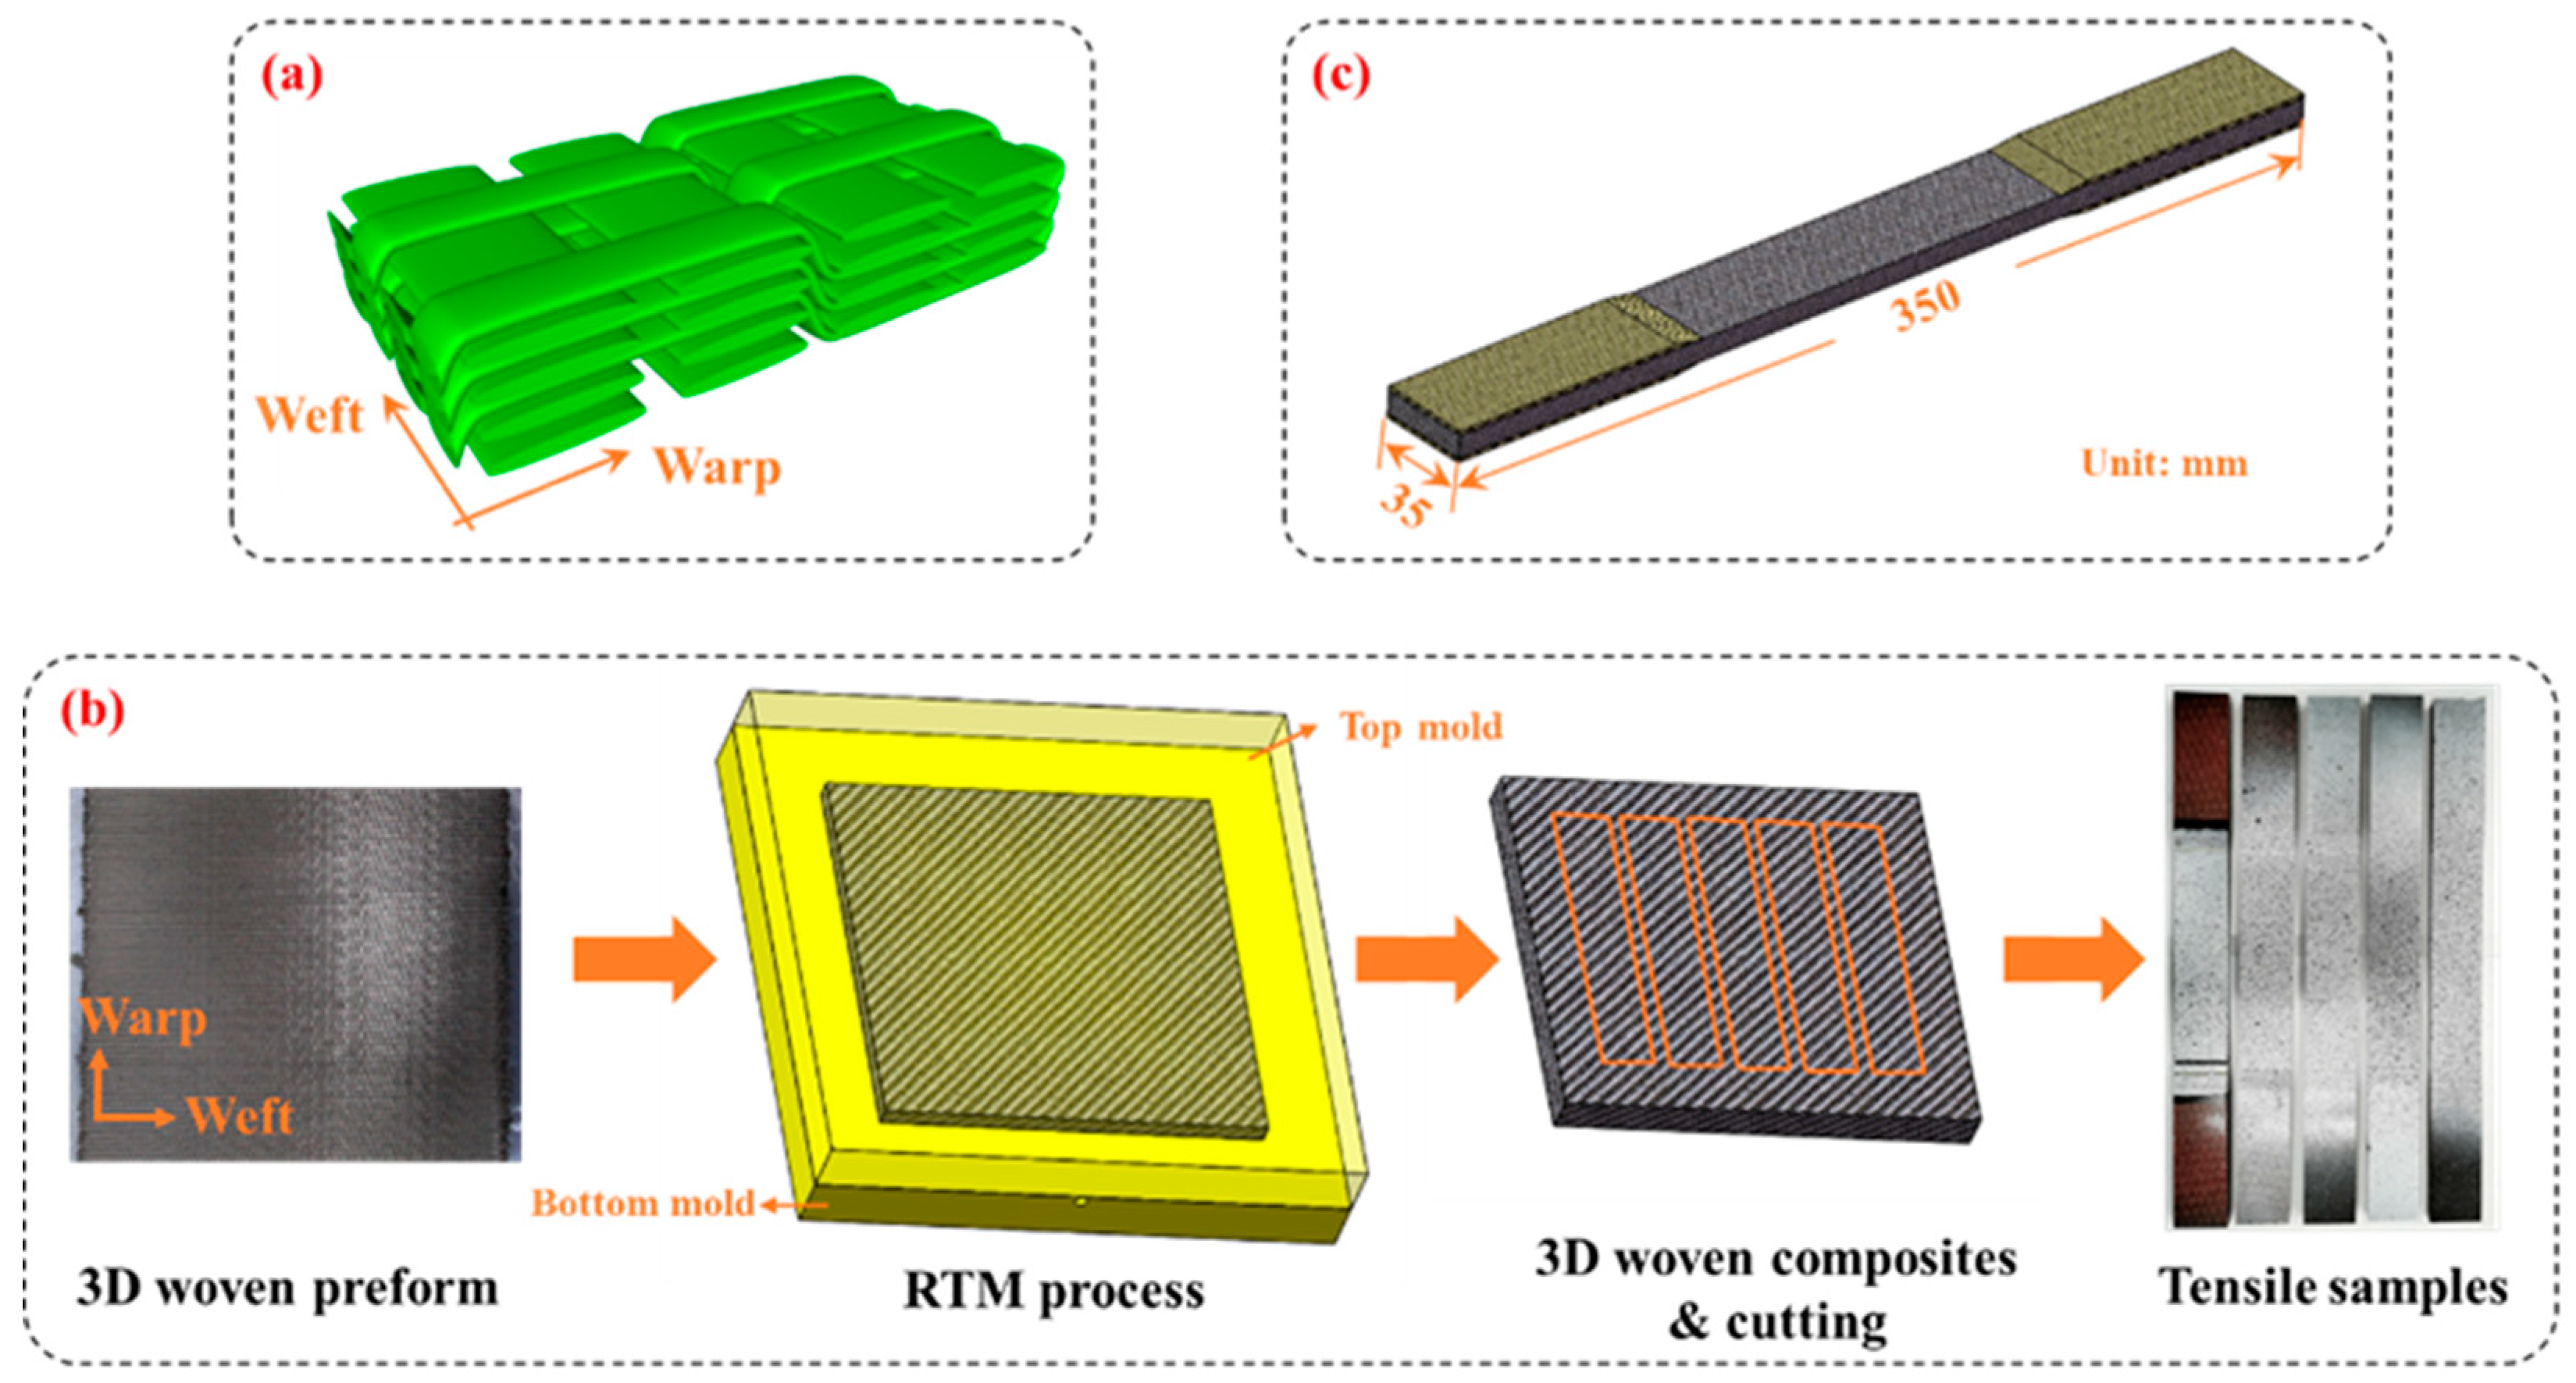
2.1. Materials and Specimens

All specimens in this study were made from CCF800 carbon fiber (Weihai Expansion Fiber Co., Ltd., Weihai, China) and self-developed epoxy resin. The mechanical properties of the carbon fiber and epoxy resin are listed in Table 1. The woven architecture is shown in Figure 1a. Techniques of carbon fiber weaving and resin transfer molding (RTM) shown in Figure 1b were employed to produce the specimens. Specimens shown in Figure 1c, with a length of 350 mm, a width of 35 mm and a thickness of 6 mm, were used in this study. Glassfiber/epoxy laminates and 502 glue were used to manufacture the tabs and to bond the tabs on the specimen, respectively.

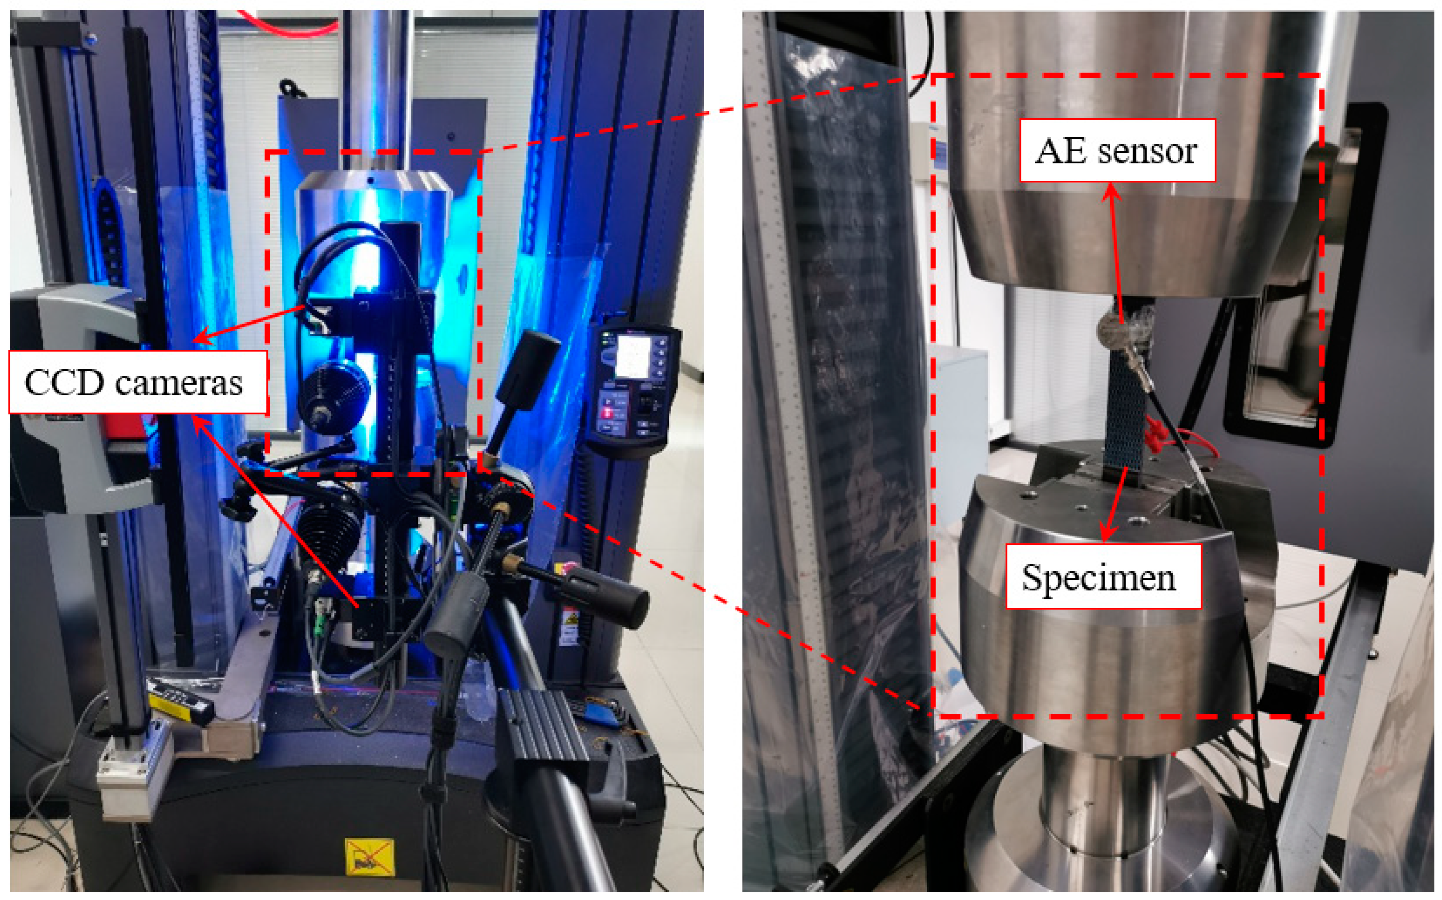
2.2. Instrumentation

2.2.1. Acoustic Emission (AE)

A two-channel AMSY-6 AE data acquisition system from Vallen Systeme (Wolfratshausen, Germany) with a sampling rate of 10 MHz was used in this study. AE measurements were achieved using a VS150-RIC sensor (Vallen Systeme, Wolfratshausen, Germany) with an inner preamplification of 34 dB and an operating frequency range of 100–450 kHz. The sensor was coupled on the surface of the tensile specimens with a thin layer of silicon grease and was fixed using transparent tape. To suppress the background noise, a threshold of 40 dB was used in the experiments. The coupling state of the specimens and the sensor was checked by knocking slightly on the specimens before each test.

2.2.2. Digital Image Correlation

A 3D digital image correlation (DIC) system (ARAMIS SRX from GOM company, Braunschweig, Germany) was used to obtain the full-field surface strain throughout the tensile experiments. Two CCD cameras with an image resolution of 4096 × 3068 pixels were used in this DIC system and a sampling rate of 4 frames per second was used in the tests. Before the tests, the top surface of specimens was painted with speckle patterns, while the DIC system was calibrated using the calibration board provided by the system manufacturer. The ARAMIS professional software was used to perform the post-processing of the results to obtain the tensile stress–strain curves and the strain evolution process throughout the tensile test. Nowadays, instead of the traditional strain gage method, DIC is used as a reliable method to acquire the fracture strain.

2.2.3. Micro-XCT

The micro-XCT measurements were carried out using a computed tomography scanner D2 from DIONDO corporation (Hattingen, Germany) with a 240 kV nano-focus X-ray tube. The specimens with phased damages were exposed to radiation and rotated through 360° to obtain a sequence of more than 1600 slice tomograms. An X-ray voltage of 110 kV and an X-ray current of 110 μA were used in the tests. The nano-focus X-ray tube had a spot size of 0.5 μm, while the high-resolution flat panel detector had 3072 × 3072 pixels with a pixel size of 139 μm. A maximum possible resolution of 12 μm for the phased specimens was achieved.

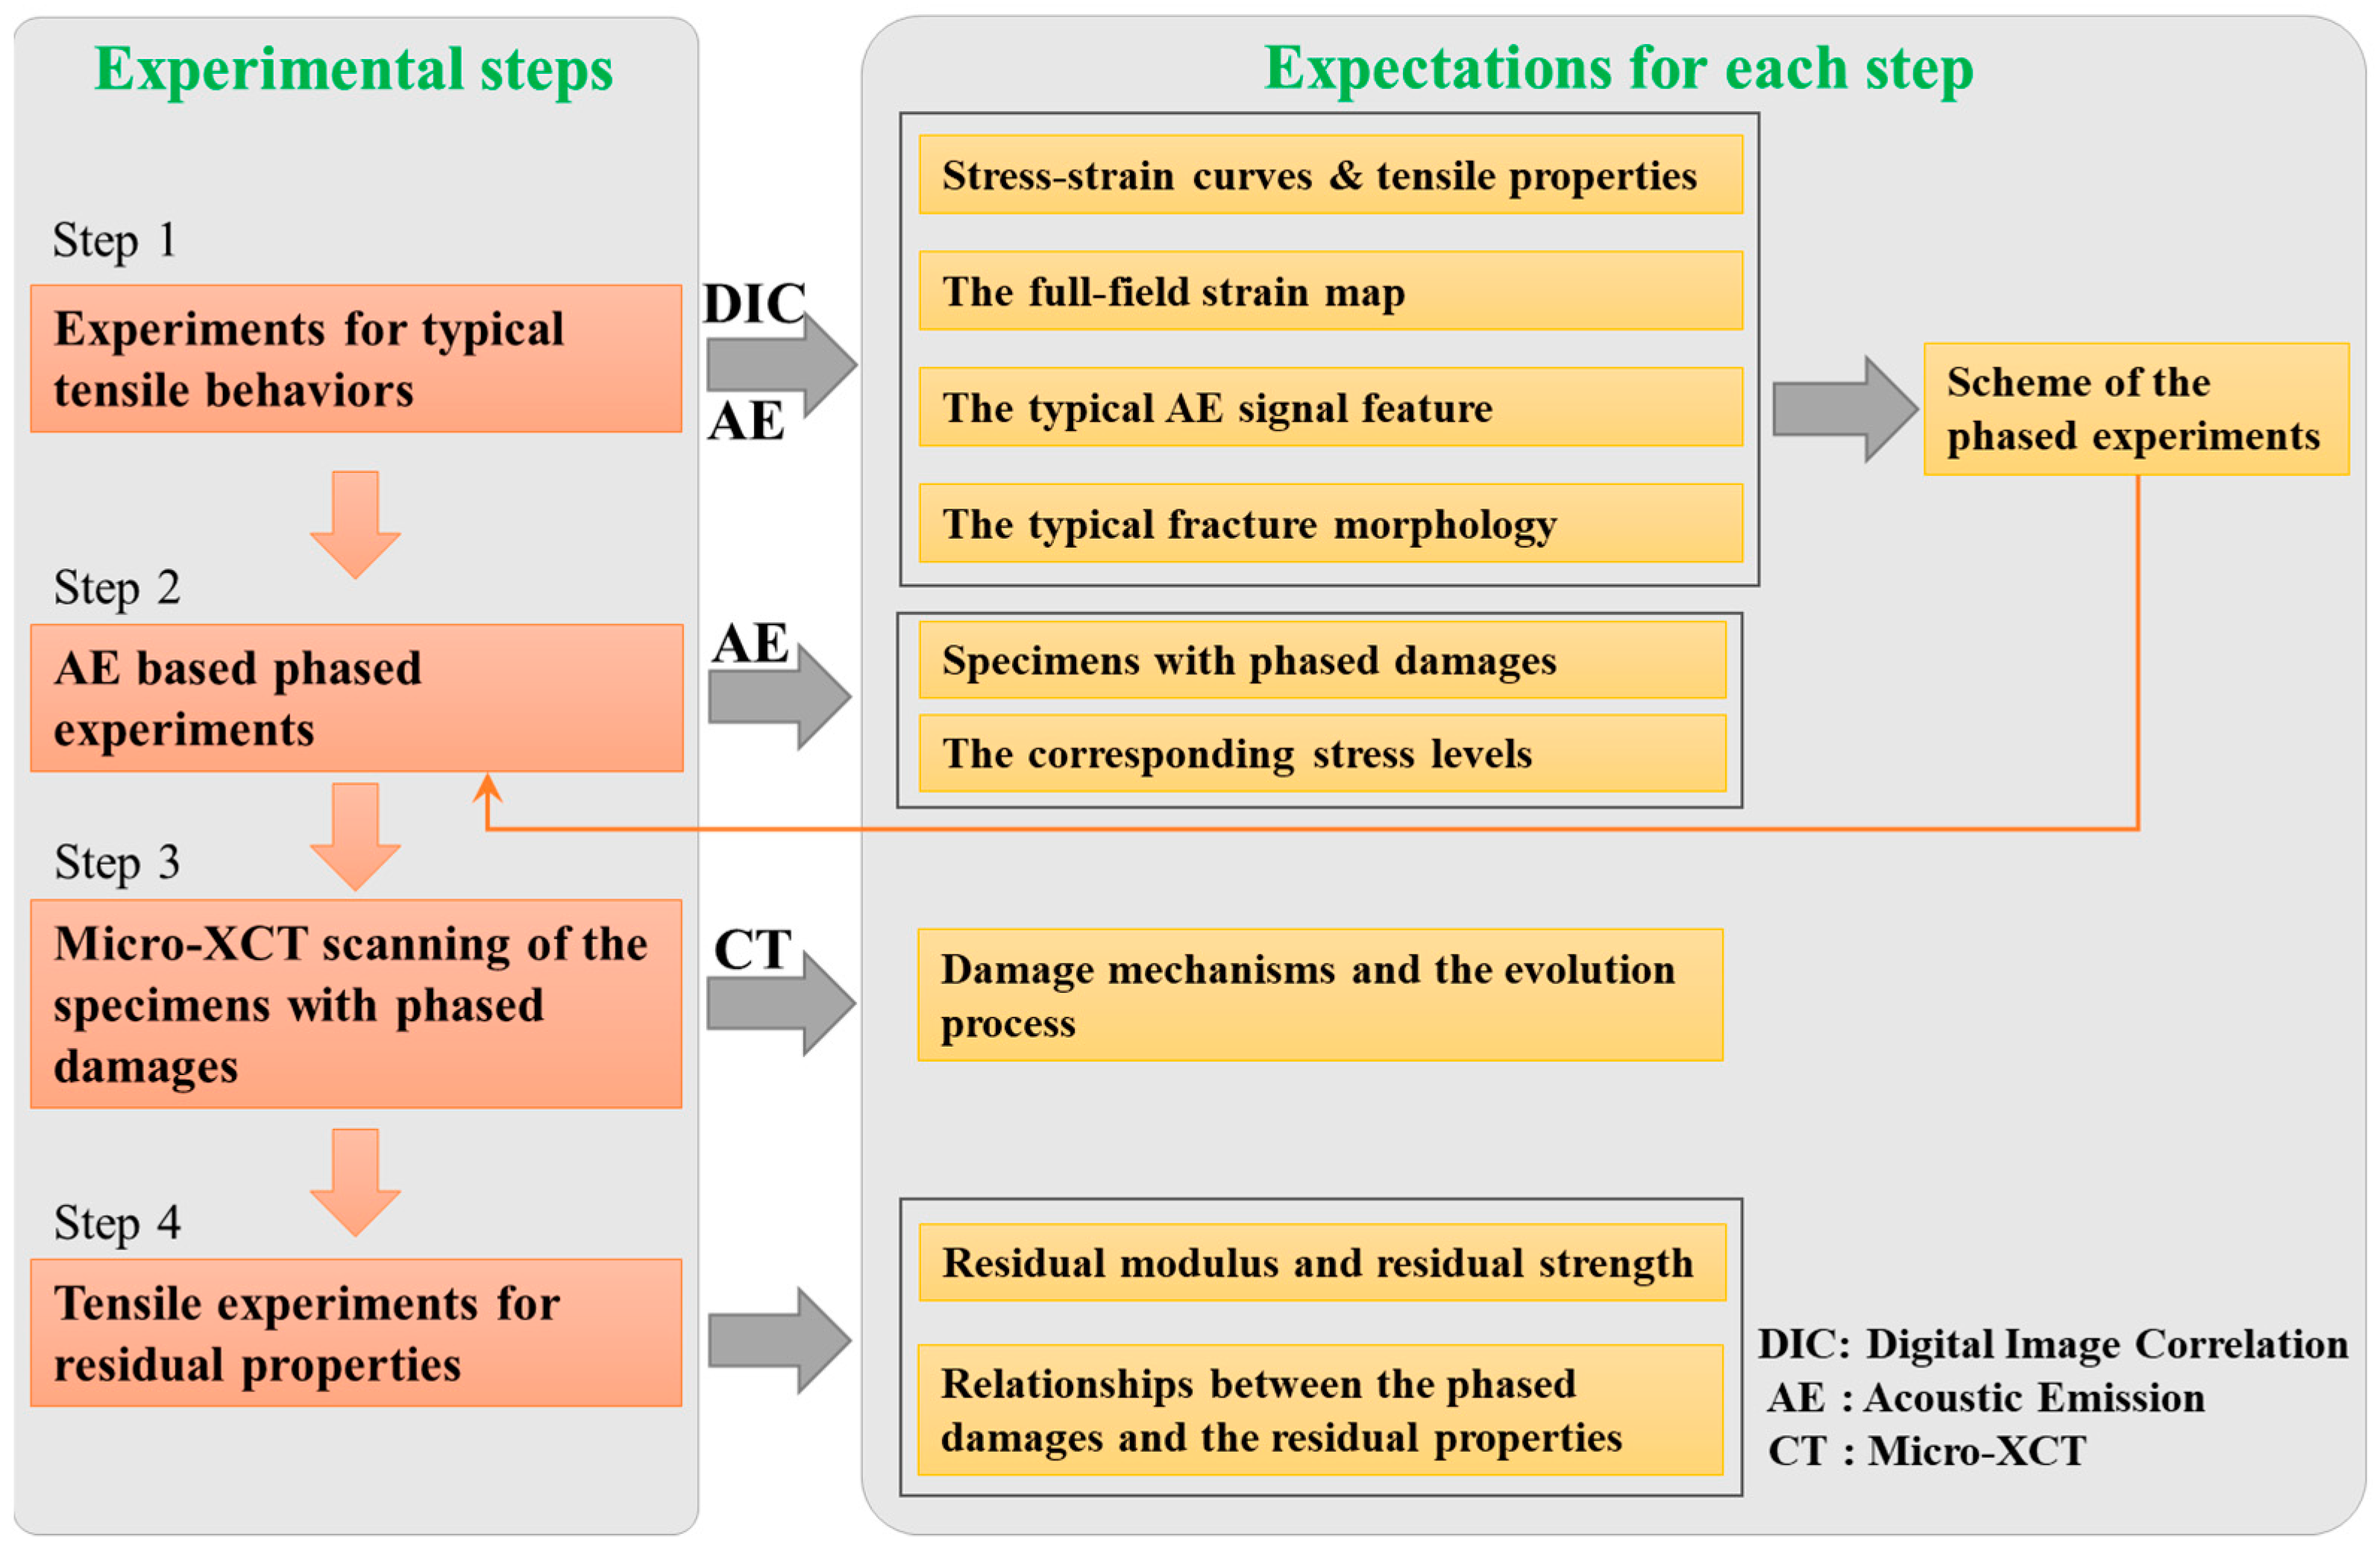
2.3. Experimental Procedures and Setups

In this work, a four-step experimental procedure based on the phased approach is proposed to provide an experimental investigation on the effect of microcracks on the tensile properties of 3D woven composites. A combination of the aforementioned AE, DIC and micro-XCT was used to characterize the damage mechanisms, evolution process and residual performances. The four steps, with different expectations for each step, are shown in Figure 2. The first step was to carry out the tensile experiments of 3D woven composites, using an Instron 5890 test machine (Norwood, MA, USA) with a 250 kN load cell, to obtain the homogenized tensile modulus, tensile strength and elongation at break. The typical tensile behaviors were also characterized from multi-perspectives using stress–strain curves, the full-field strain evolution process, the AE signal features and the fracture morphologies. Experimental setups with a DIC system and an AE system are shown in Figure 3. A load rate of 2 mm/min was used in all tests. The homogenized modulus was calculated using the strain range from 1000 to 3000 με. Contrastive analysis of the typical AE energy curves against the load curves was performed to determine the scheme of the phased experiments, which was the foundation of the second step. Combining the AE energy curves with the load curves, one can tell the exact damage initiation time, evolution process and the influence of the damage on the instantaneous tensile mechanical responses.
The second step was to perform the AE based phased experiments. The purpose of this step was to obtain specimens with phased damages at various stress levels. According to the scheme of phased experiments projected in the first step, the tensile tests were manually stopped at different stress level by means of AE energy in situ monitoring. The third step was to identify the phased damages with the nondestructive micro-XCT system. In this study, the phased damages were characterized using one technical metric of the cracks volume fraction (CVF). The results show the microcrack initiation and the propagation process. After the CT scanning tests, specimens with phased damages produced in Step 2 were tested again in the fourth step, to obtain their residual modulus and residual strength. With a combination of the results from Step 3 and Step 4, one can have a quantitative characterization of the phased damages and the residual properties, making it possible to identify the effect of microcracks on the tensile properties.

3. Results and Discussions

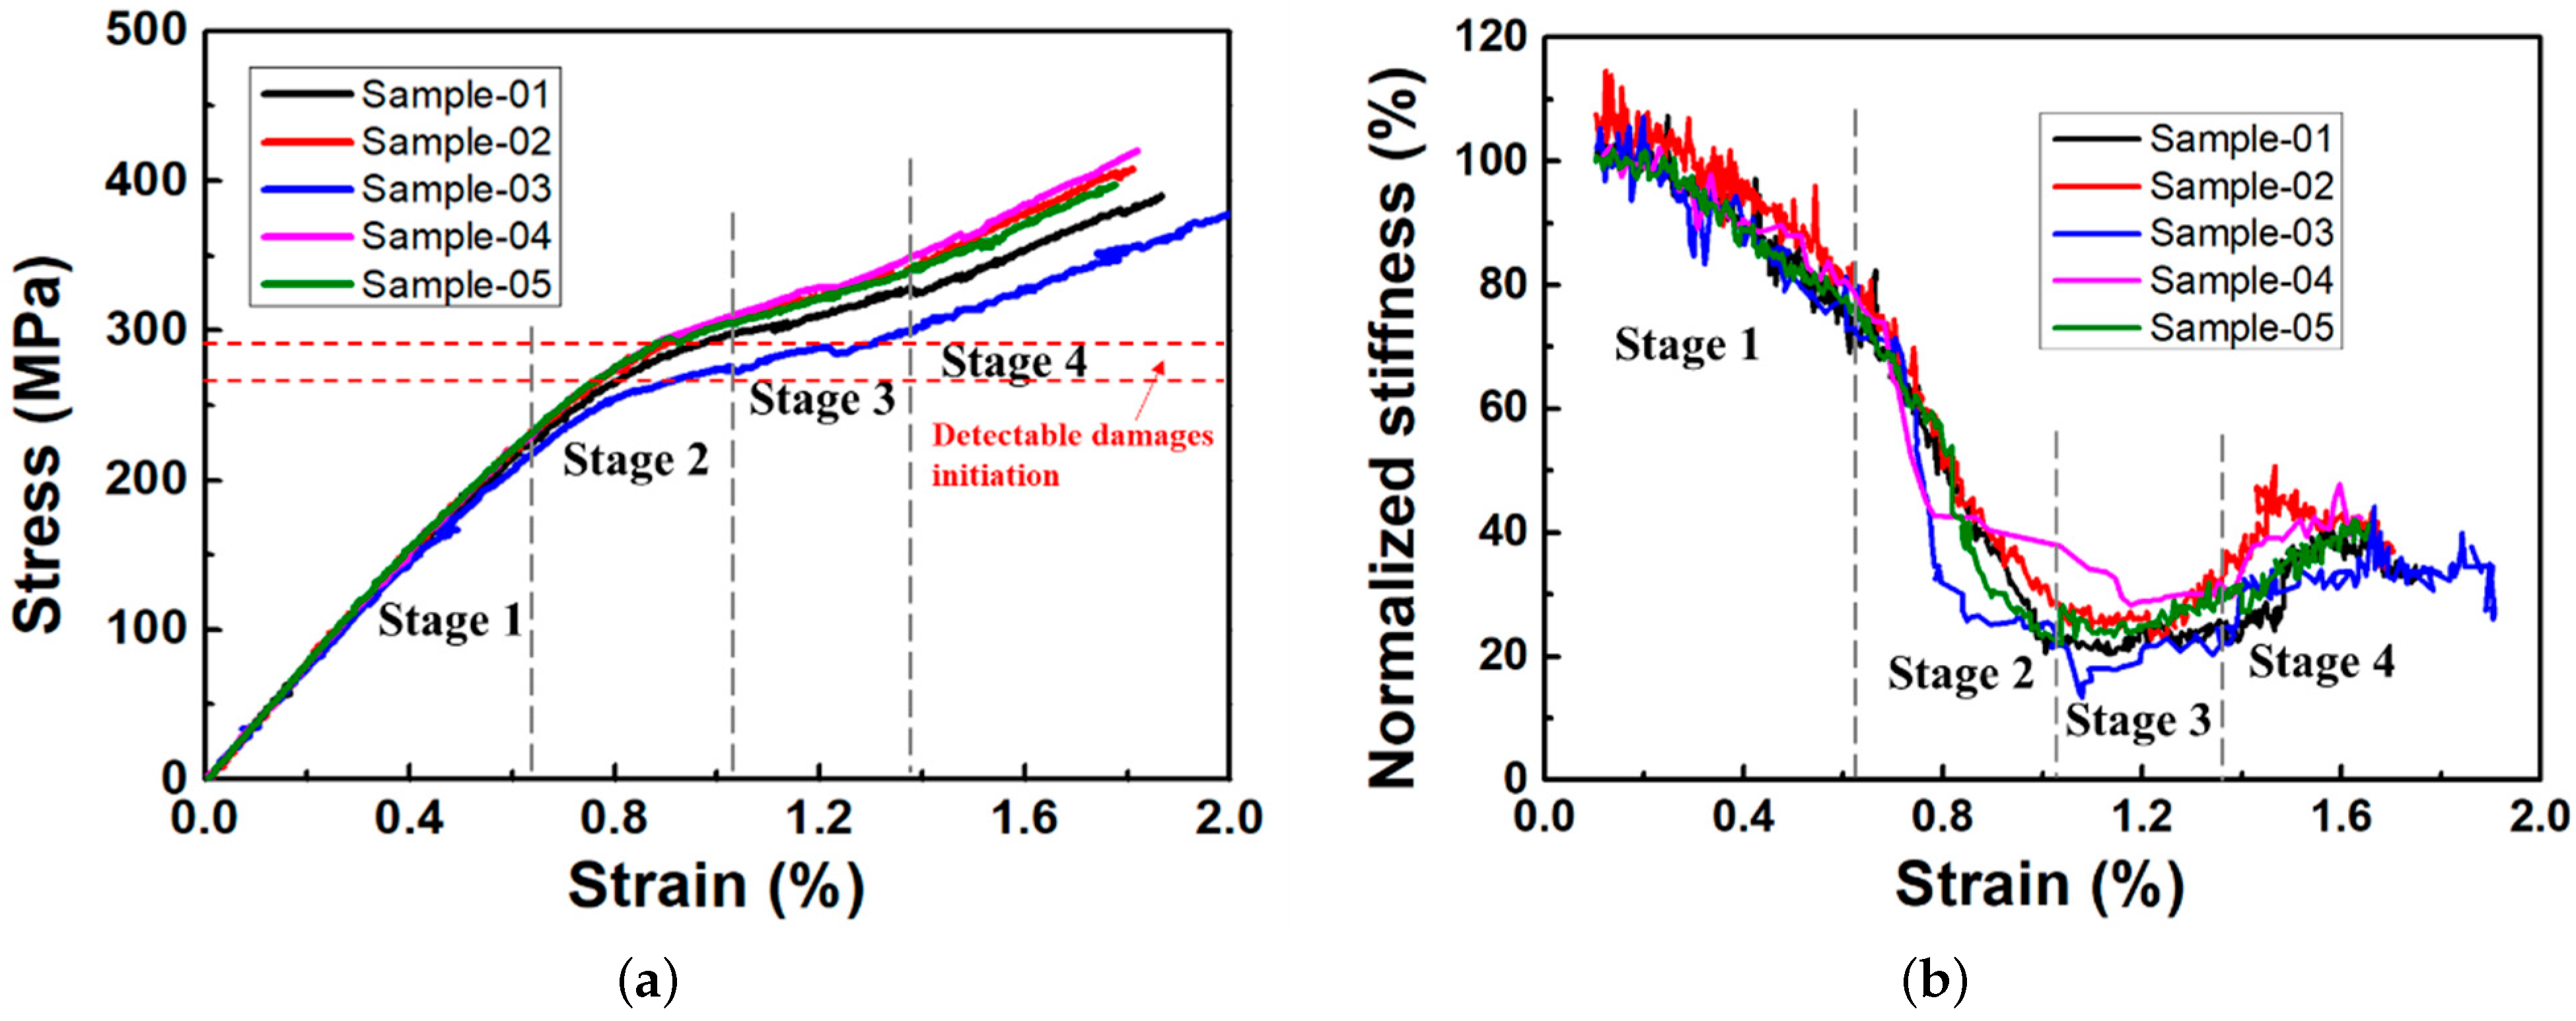
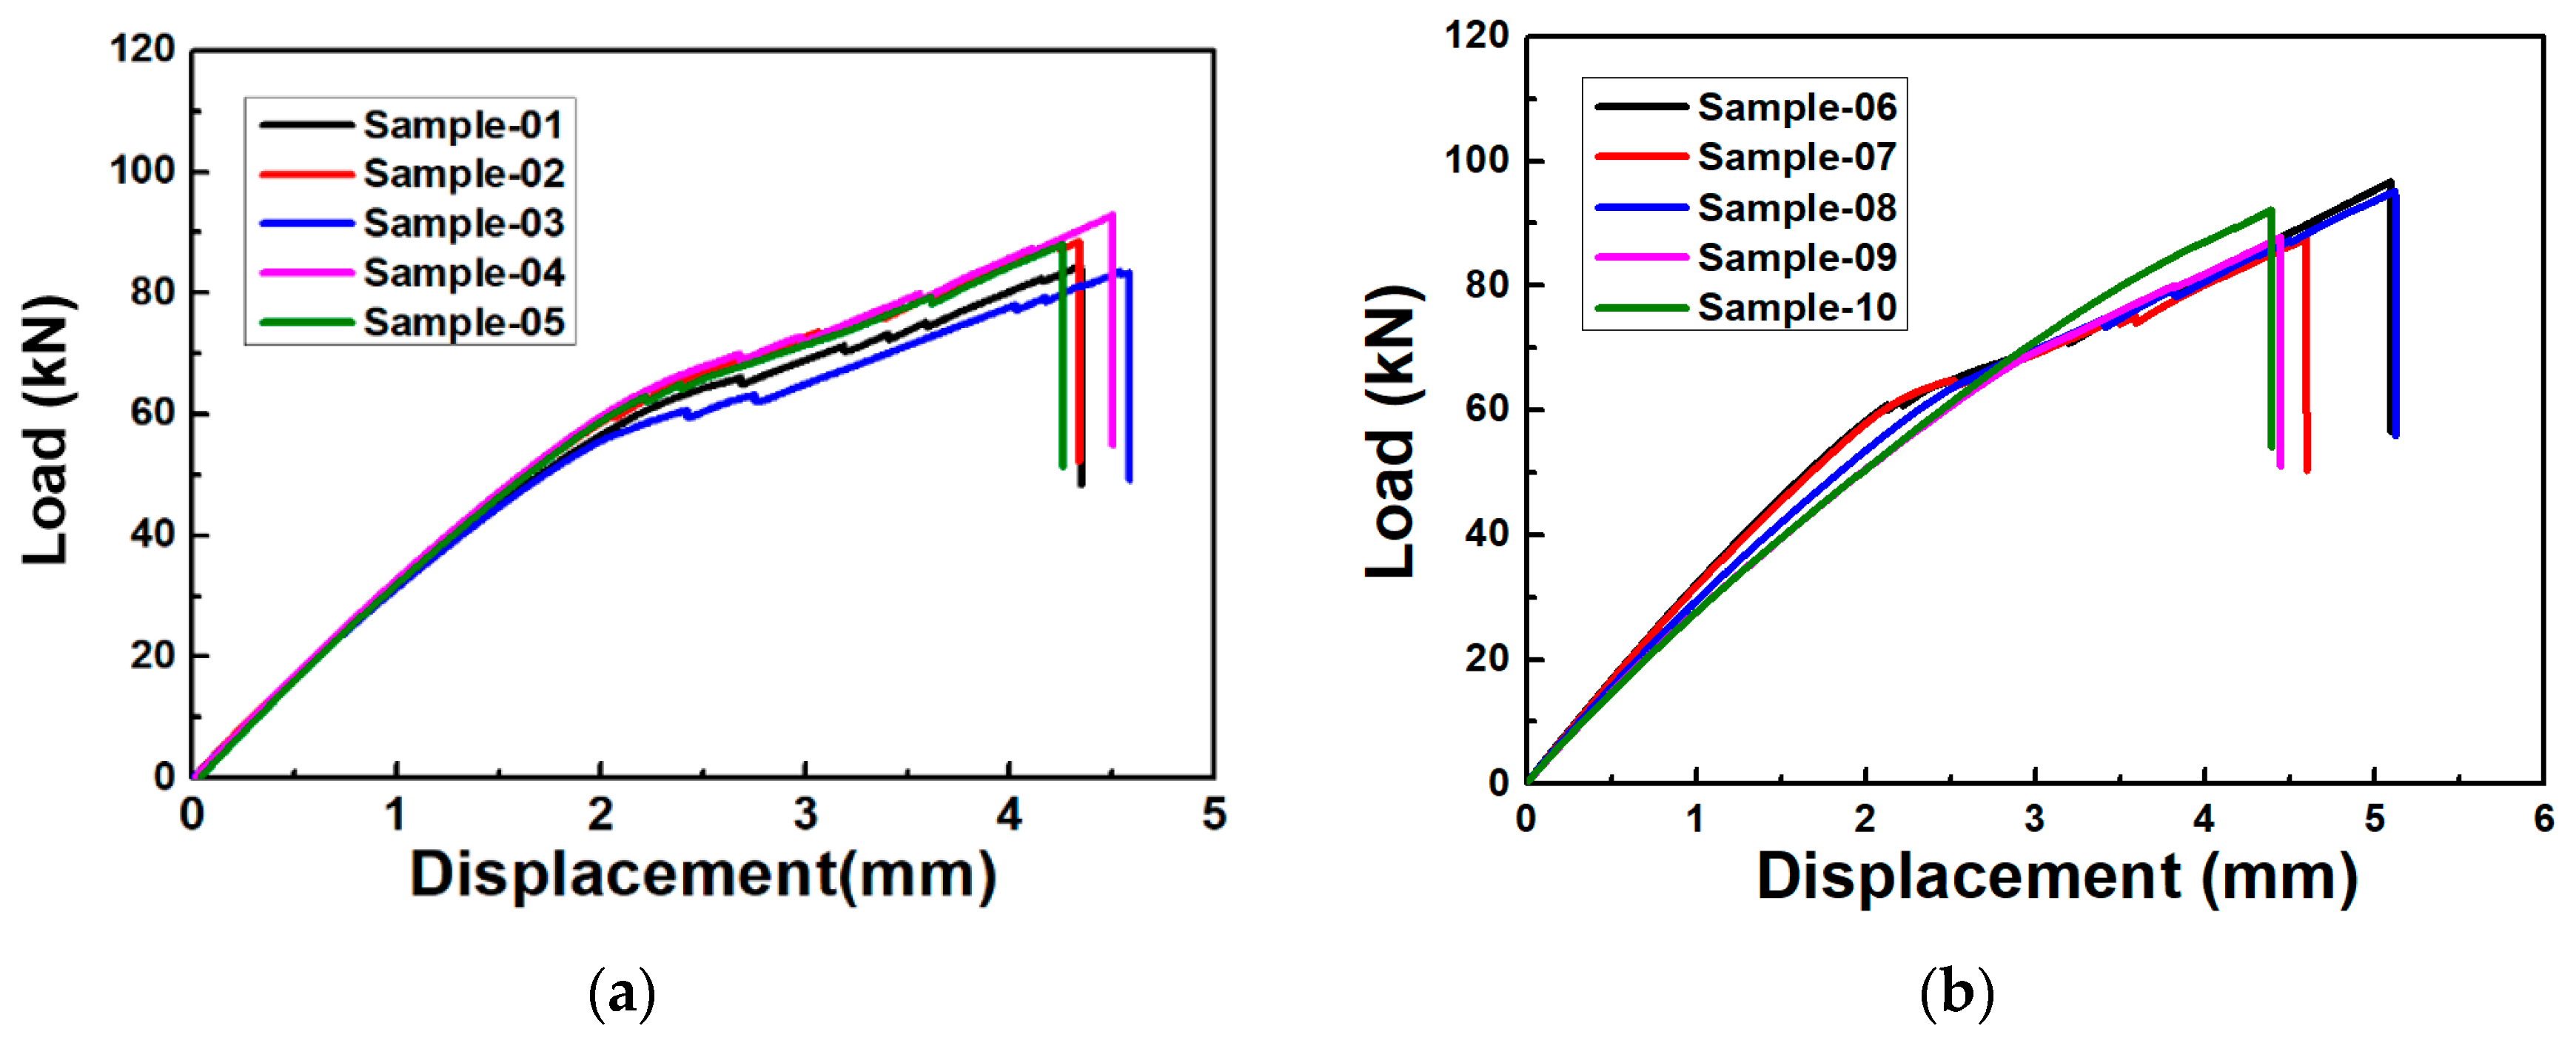
3.1. Typical Tensile Behaviors of 3D Woven Composites

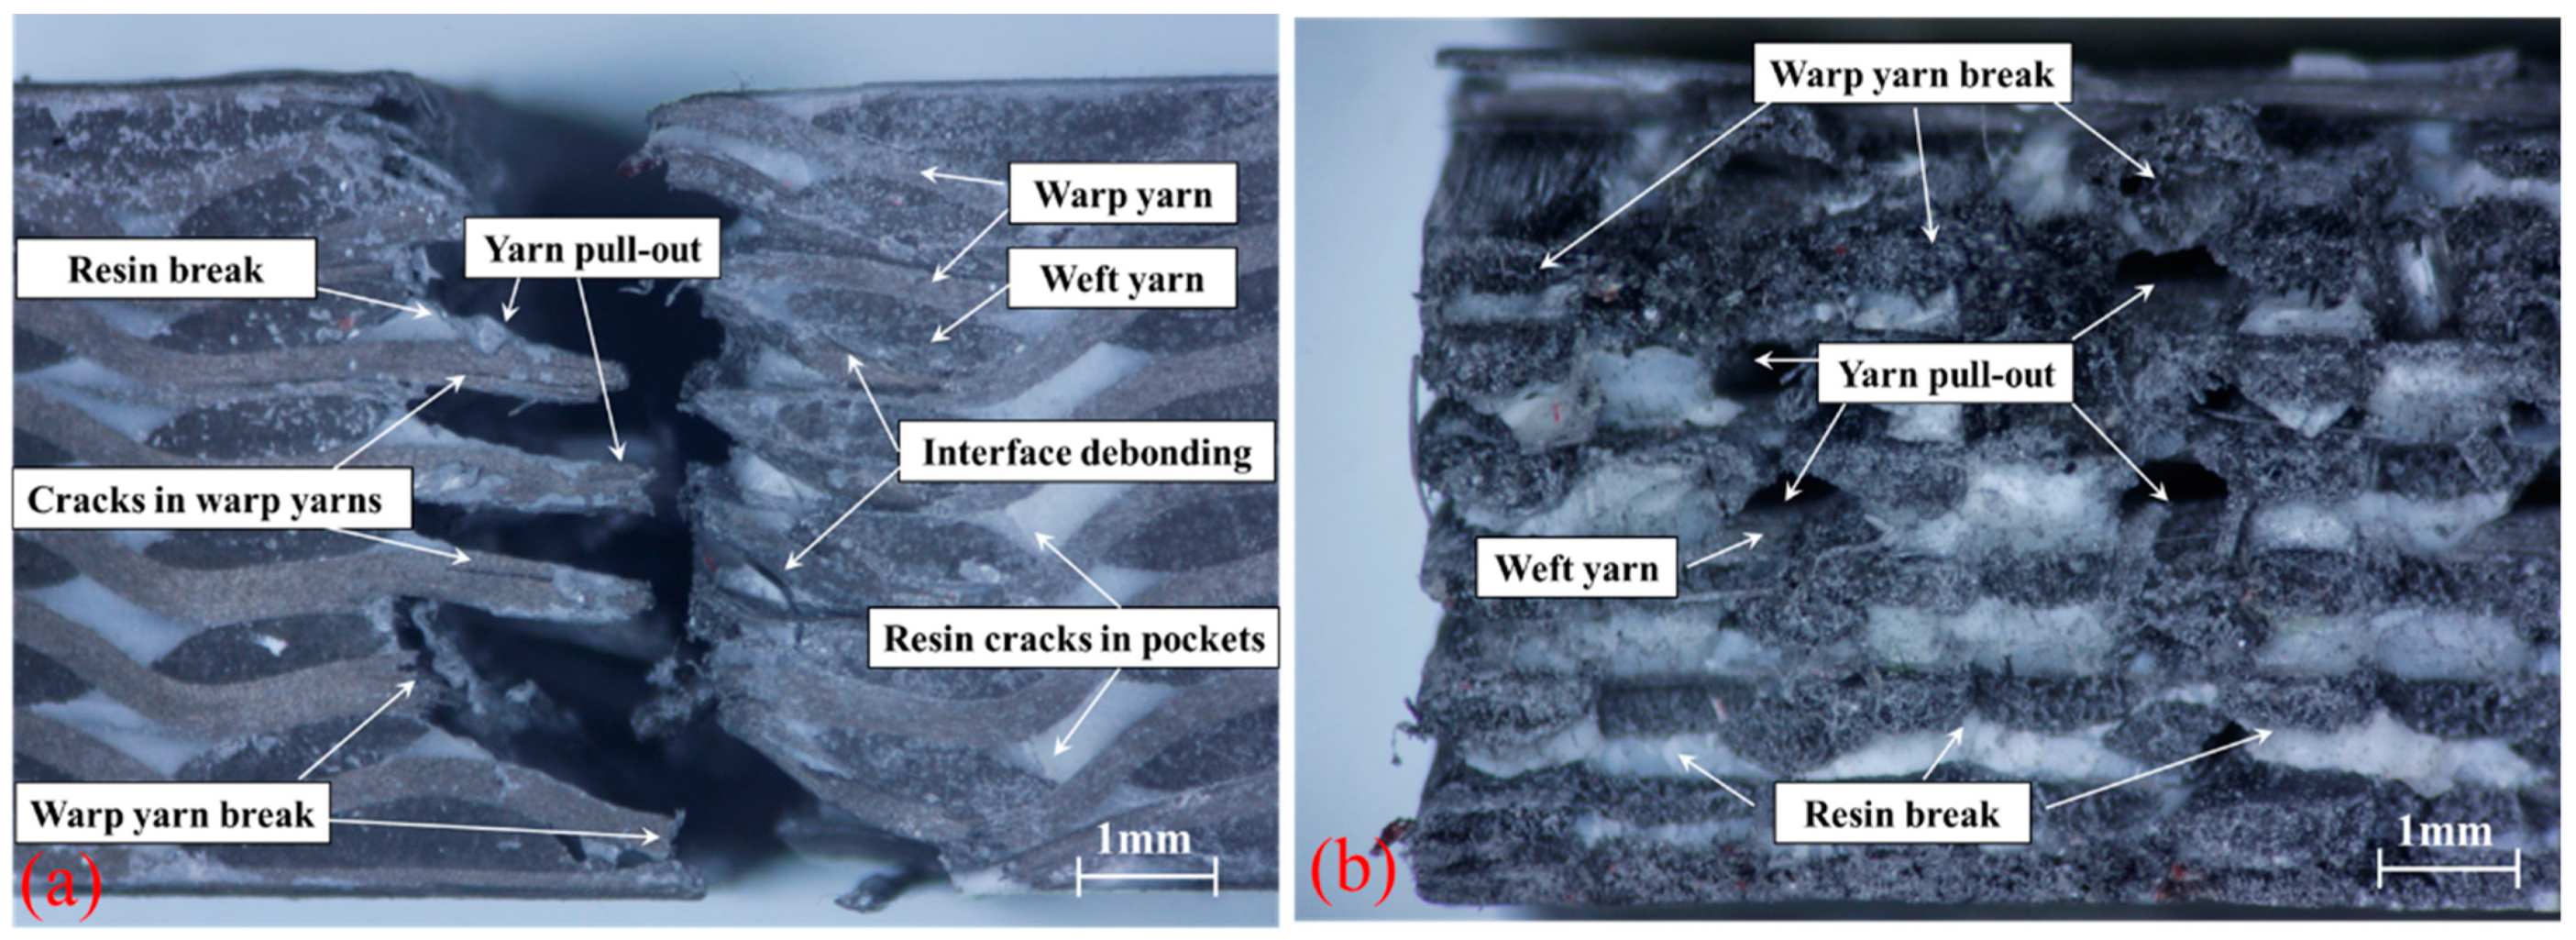
3.1.1. Tensile Properties and the Fracture Mechanisms

Typical tensile stress–strain curves of 3D woven composites in warp direction generated from the first step show a classical bilinear response and material softening, as shown in Figure 4a. The stress data were obtained using the load from the test machine divided by the cross-sectional area of each specimen, while the strain data were acquired from the DIC system using a calculating region, shown in Figure 5a. The typical stress–strain curves can be divided into four stages according to different mechanical behaviors. Stage 1 represents a linear process at the early part of the tensile tests with a strain range from 0.0% to 0.65%. The tensile modulus calculated using strain range of 0.1%–0.3% is shown in Table 2, with coefficients of variation (CoV) for the tensile modulus, the tensile strength and the elongation at break being 2.97%, 3.95% and 4.95%, respectively. The normalized stiffness–strain curves are shown in Figure 4b. Within the strain interval of 0.1%–0.3%, the normalized stiffness stays stable and then decreases slowly as the strain increases. An inflection point, as shown in Figure 4a, follows thereafter, at the strain level of 0.8%, which was classified into Stage 2. As shown in Figure 4b, the initial damages gave rise to a fast stiffness degradation of the tensile specimens during Stage 2. In Stage 3, the tangent tensile modulus intends to stay at a relatively stable value, which is obviously lower than the value in Stage 1. The phenomenon that appears in Stage 4 has never been reported in previous studies, showing a slight increase of the normalized stiffness after the plateau. According to the micro-XCT scanning results, shown in Section 3.3, the cracks induced by the tensile stress in Stage 4 give the warp yarns a certain deformation space, making the warp yarns straighter than their initiate state, leading to an increase in the normalized stiffness. The elongation at break and tensile strength of the specimens are shown in Table 2, both with a satisfying CoV of 3.95% and 6.45%, respectively.
Typical morphology of the tensile fracture surfaces is shown in Figure 6. Failure mechanisms were found to be repeatable among the tested samples. Observed failure modes in the 3D woven composites coincide with a previous study by Tan et al. [38]. Fracture planes were identified along the weft yarns accompanied by matrix/yarns debonding. Warp yarns pull-outs were seen leaving yarn-holes on the inner fracture surface. Longitudinal warp yarn cracking was found on the front surface of the evaluated samples. Matrix cracking was present in the surrounding composites parallel and adjacent to the warp and weft yarns. However, warp yarn breakages at the global failure location were found to be the primary failure mechanism.

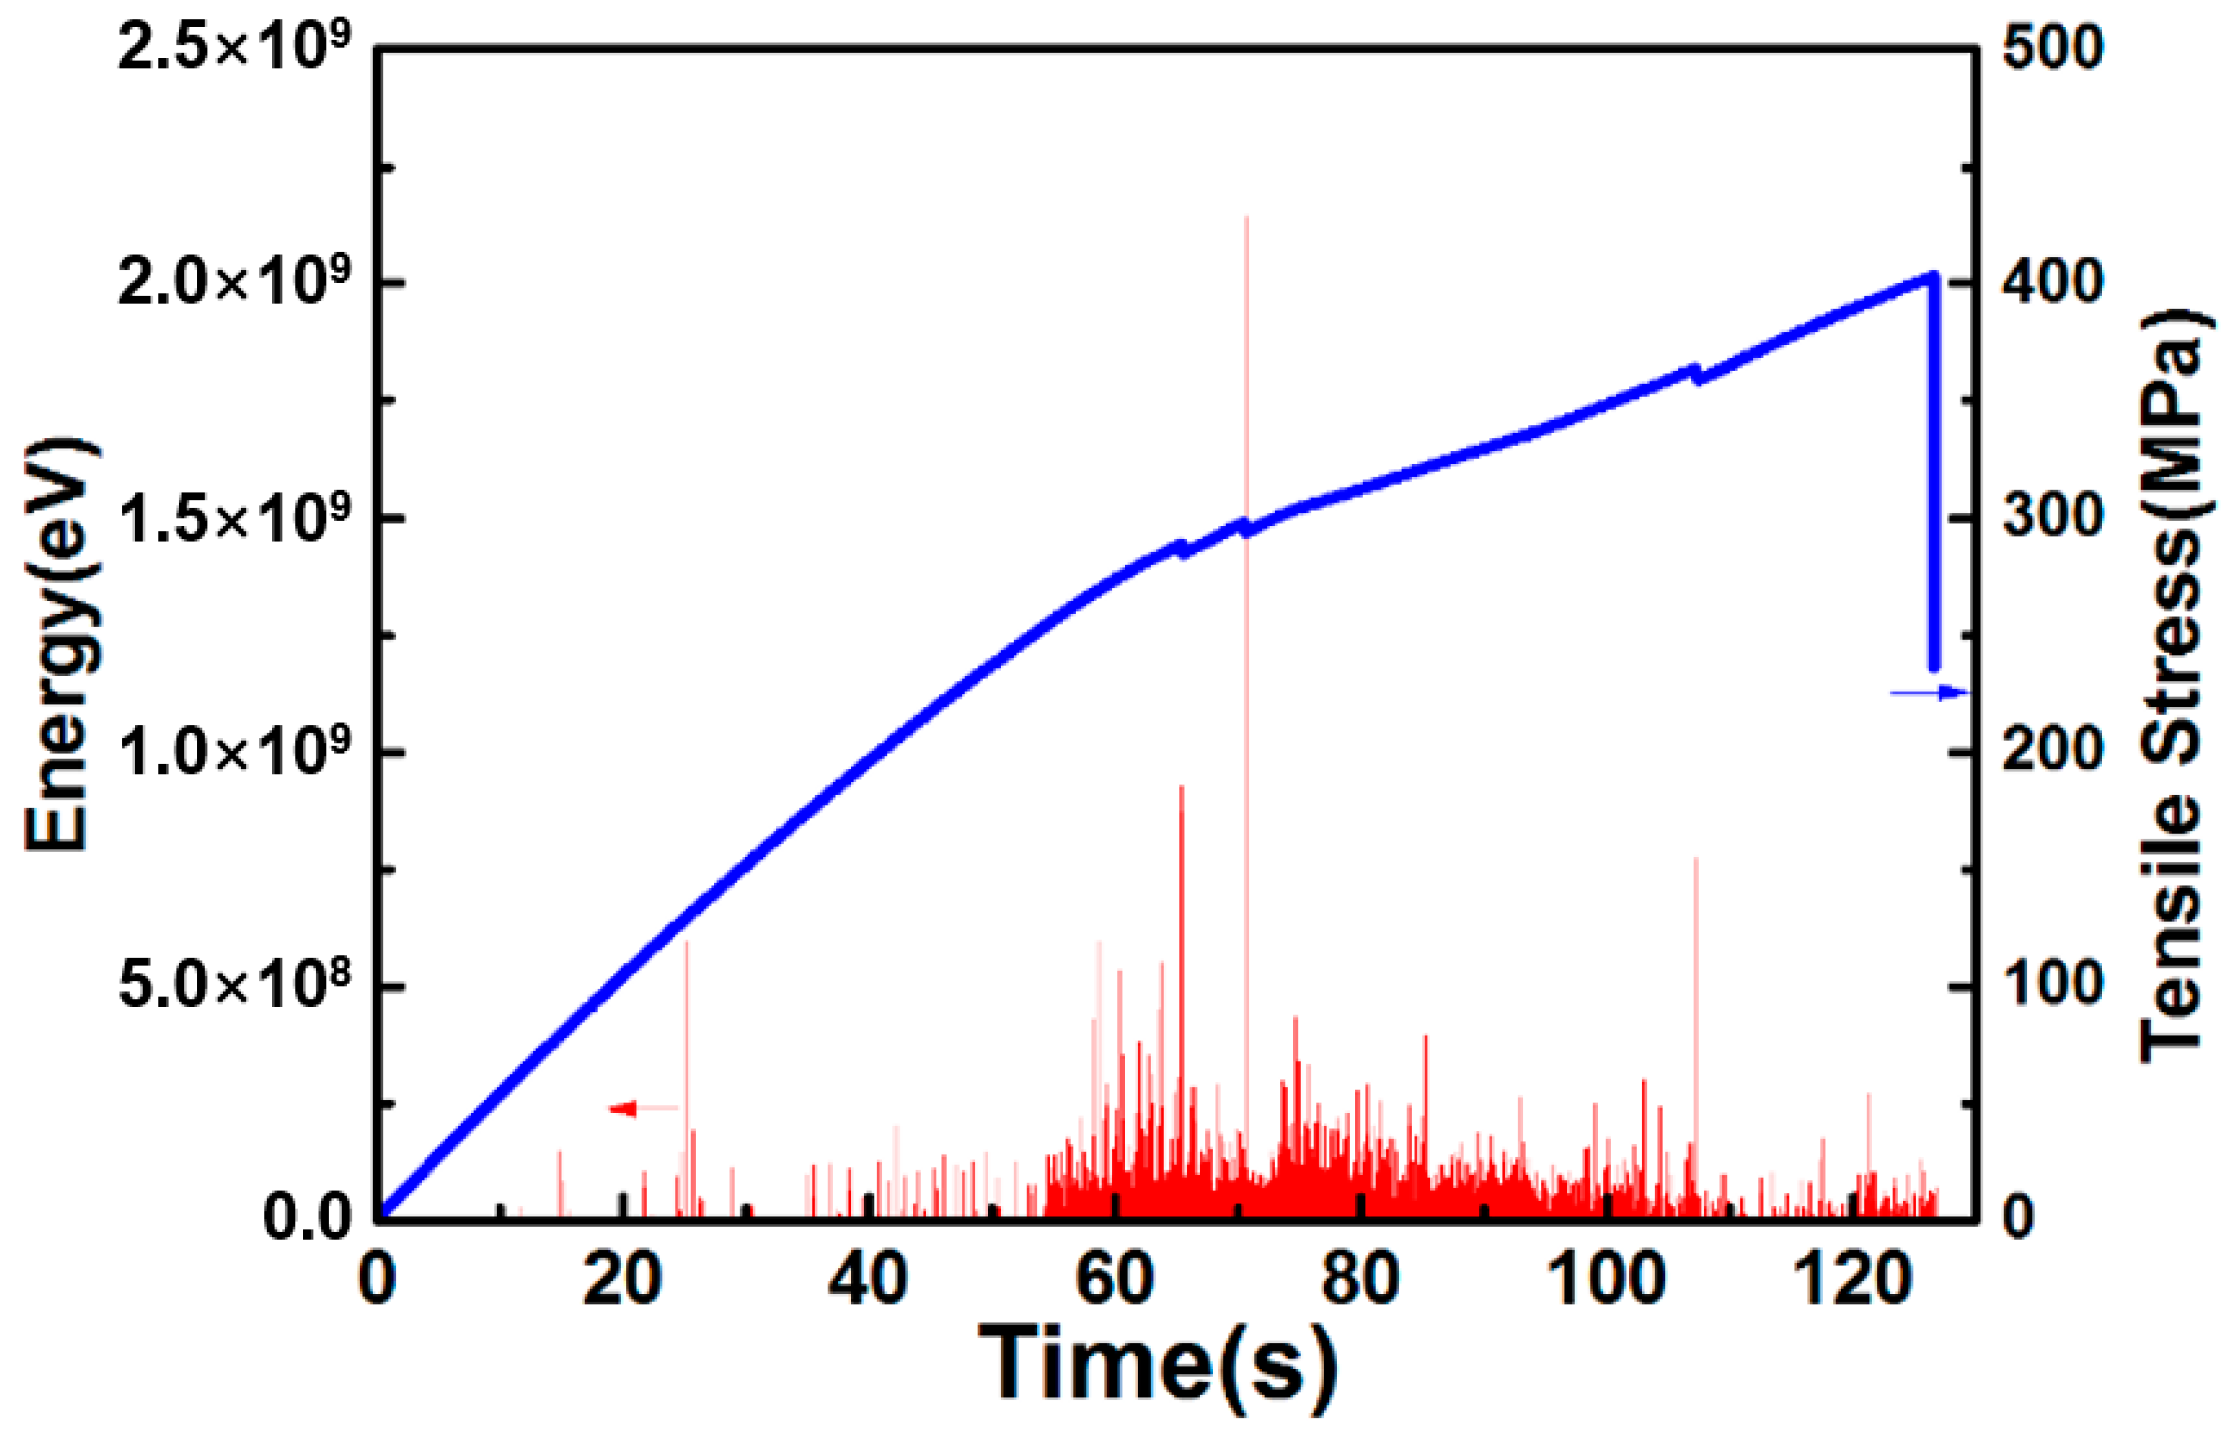
3.1.2. AE Monitoring and Damage Mechanisms Evolution

The main features of the AE signal consist of amplitude, rise time, counts, duration, energy, etc. [25]. According to previous studies, AE energy, AE counts, AE events and the cumulative values of the aforementioned three parameters are the main employed features to detect damage initiation and to characterize the evolution process. J.A. Pascoe utilized AE events as the initiation criterion and the first identified AE event was considered as the moment of the damage initiation [39]. Fotouhi M and Oskouei AR used the first high-energy and high-counts AE signal as the criterion for damage initiation [40,41]. The cumulative AE energy, cumulative AE events and cumulative AE counts have also been used as the damage initiation criterion, with the first significant increase in these cumulative curves being considered as the damage initiation moment [42,43,44]. In this study, the real-time high-energy AE monitoring was used as the damage initiation criterion and to record the damage process in the tensile tests.
Figure 7 shows the recorded typical AE energy distribution during the tensile tests in contrast with the load curve. One can observe that the AE signal shows a random behavior, while the load curve indicates a bilinear characteristic with an inflection point occurring at almost central time, during the test. The first high-energy AE signal occurred during the linear stage, which means that some relatively severe damages were brought out early. Thereafter, at the inflection point, a higher-energy AE signals took place concentratedly, indicating that lots of damages arose at this point, resulting in the material softening phenomenon. What needs to be noticed is that higher-energy AE signals burst along with the load reduction phenomena, illustrating that AE energy is a good choice to characterize the damage evolution process.

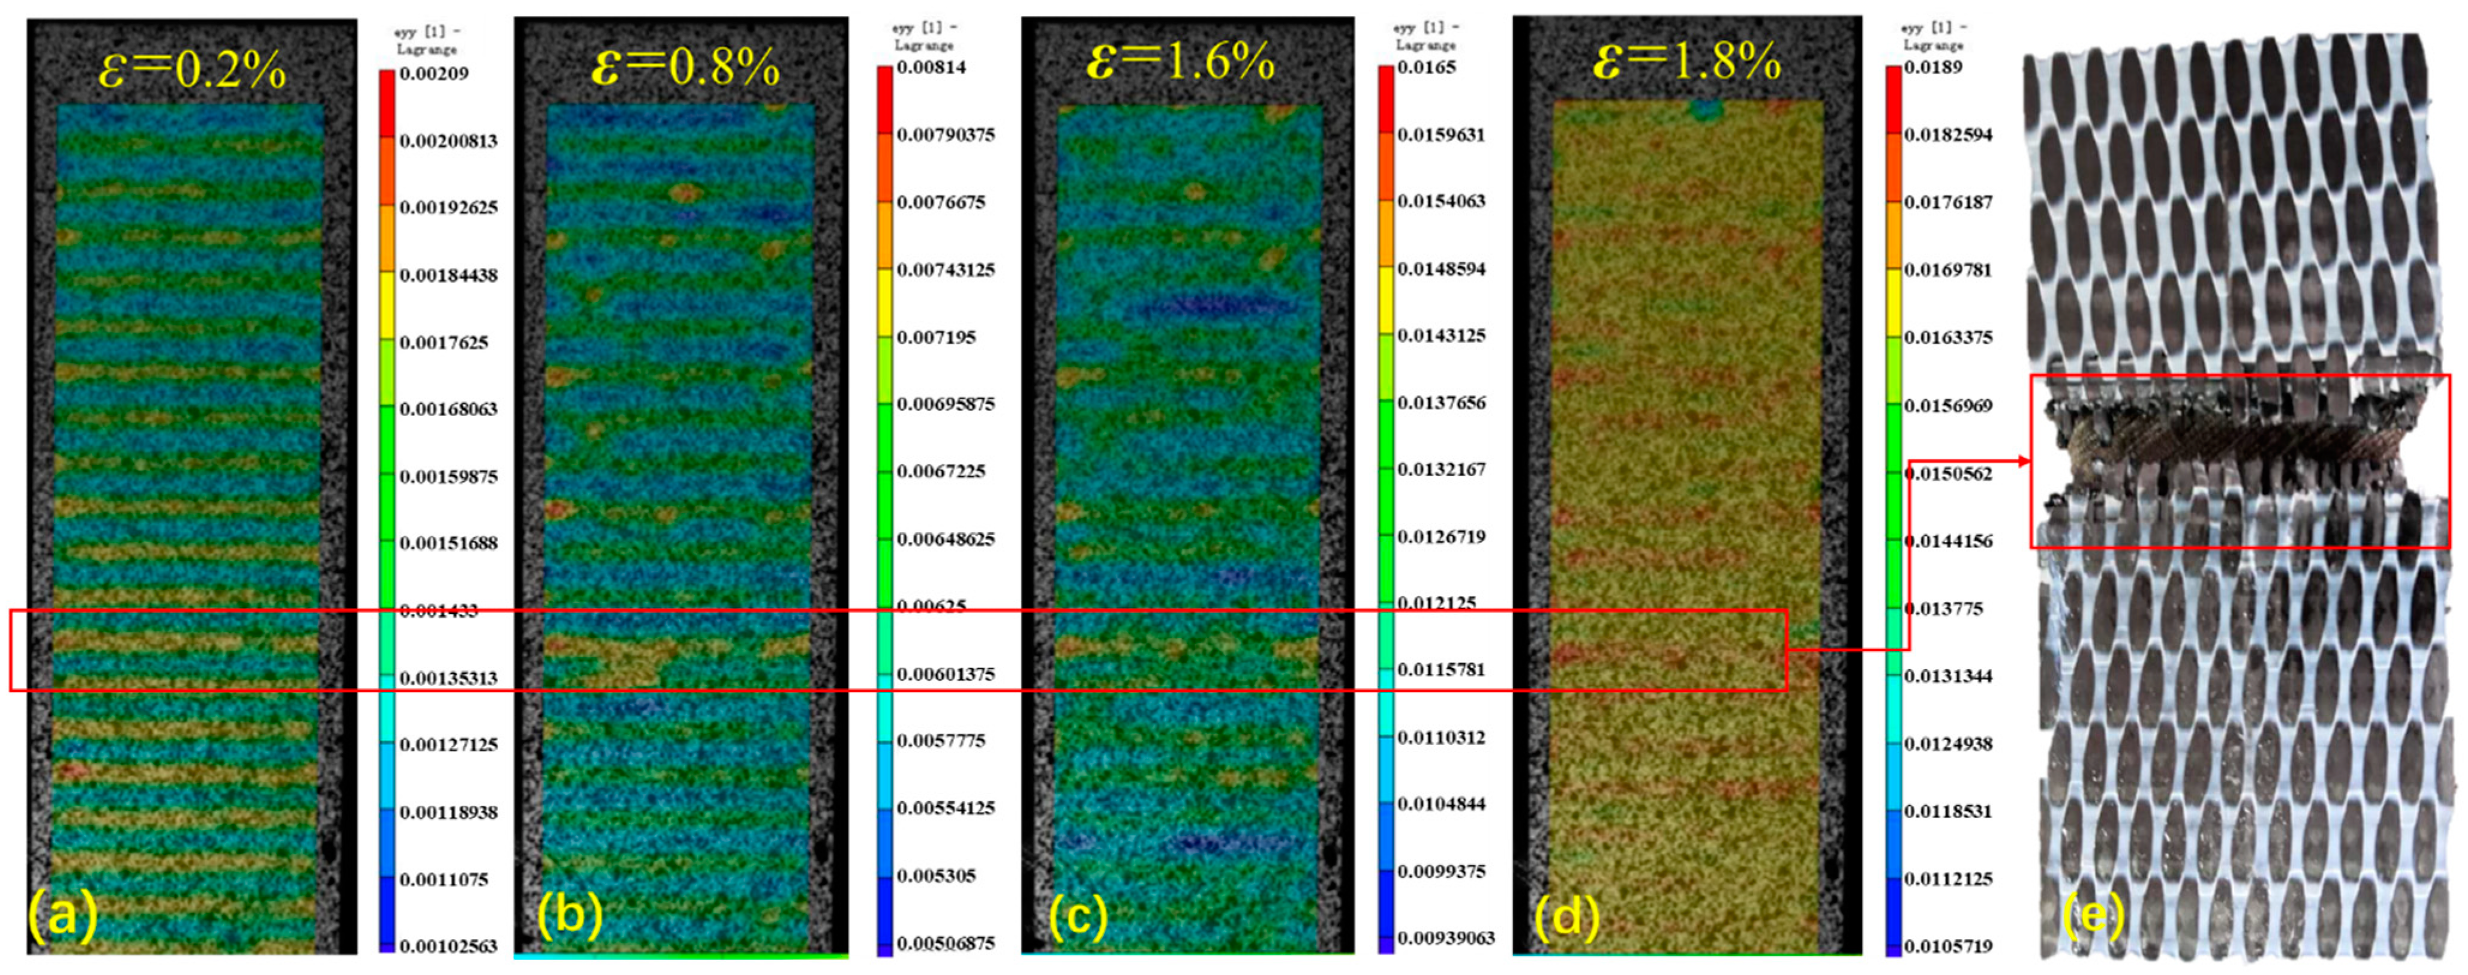
3.1.3. DIC Monitoring and Damage Mechanisms Evolution

In order to characterize the corresponding strain response, full field strain maps at strain levels of 0.2%, 0.8%, 1.6% and 1.8% are shown in Figure 5a–d, respectively. Observed surface strain distribution coincides with previous studies [30,45]. High strain concentrations in the matrix material were found during the tensile process. Moreover, this localized higher strain, with the corresponding damage experienced by the surface matrix material, partially contributed to the bilinear stress–strain response. At a strain level of 0.2%, one can observe that the surface strain field demonstrates an array map with higher and lower strain areas distributed in accordance with the surface topology shown in Figure 5e. Along with the tensile process, the surface strain distribution evolves gradually to a less regular map, due to the strain concentration of the matrix material. Moreover, the highest strain concentration area demonstrated in Figure 5b–d was located in the same position and resulted in the final tensile fracture (Figure 5e). In other words, the DIC monitoring of the full field strain distribution gives valuable information not only for a reliable homogenized Young’s modulus but also for the material fracture behavior.

3.2. AE Energy Based Phased Experiments

According to the contrast analysis of the typical AE energy curve with the tensile load curve on Figure 7, high-energy AE signals showed up throughout the whole tensile process, from the early linear stage through the inflection point to the load reduction moments during the second linear part. As shown in Figure 8a, tensile tests of five specimens showed a good repeatability of the aforementioned observations. Based on the consistency of the experimental phenomena, one can scheme the phased experiments into at least 3 phases using the real-time AE energy monitoring method. To explore more details of the damage evolution process, the authors planned and completed five-phases tensile tests, using specimens from sample-06 to sample-10, with the first phase point at the early linear part, the second at the inflection point, the third and the fourth at the second linear part, while the fifth phase point was set just before the final tensile fracture. All the five phase points were set at the instant moment when a high-energy AE signal showed up. Results of the five-phases experiments are demonstrated in Figure 8b. The five-phases tests were manually stopped at the stress levels of 28.81%, 65.98%, 72.93%, 78.14% and 89.20% σs, respectively, with the damage degree increasing and accumulating in turn, according to the AE energy curves. The correspondence between the phased samples and the stress levels is shown in Table 3.

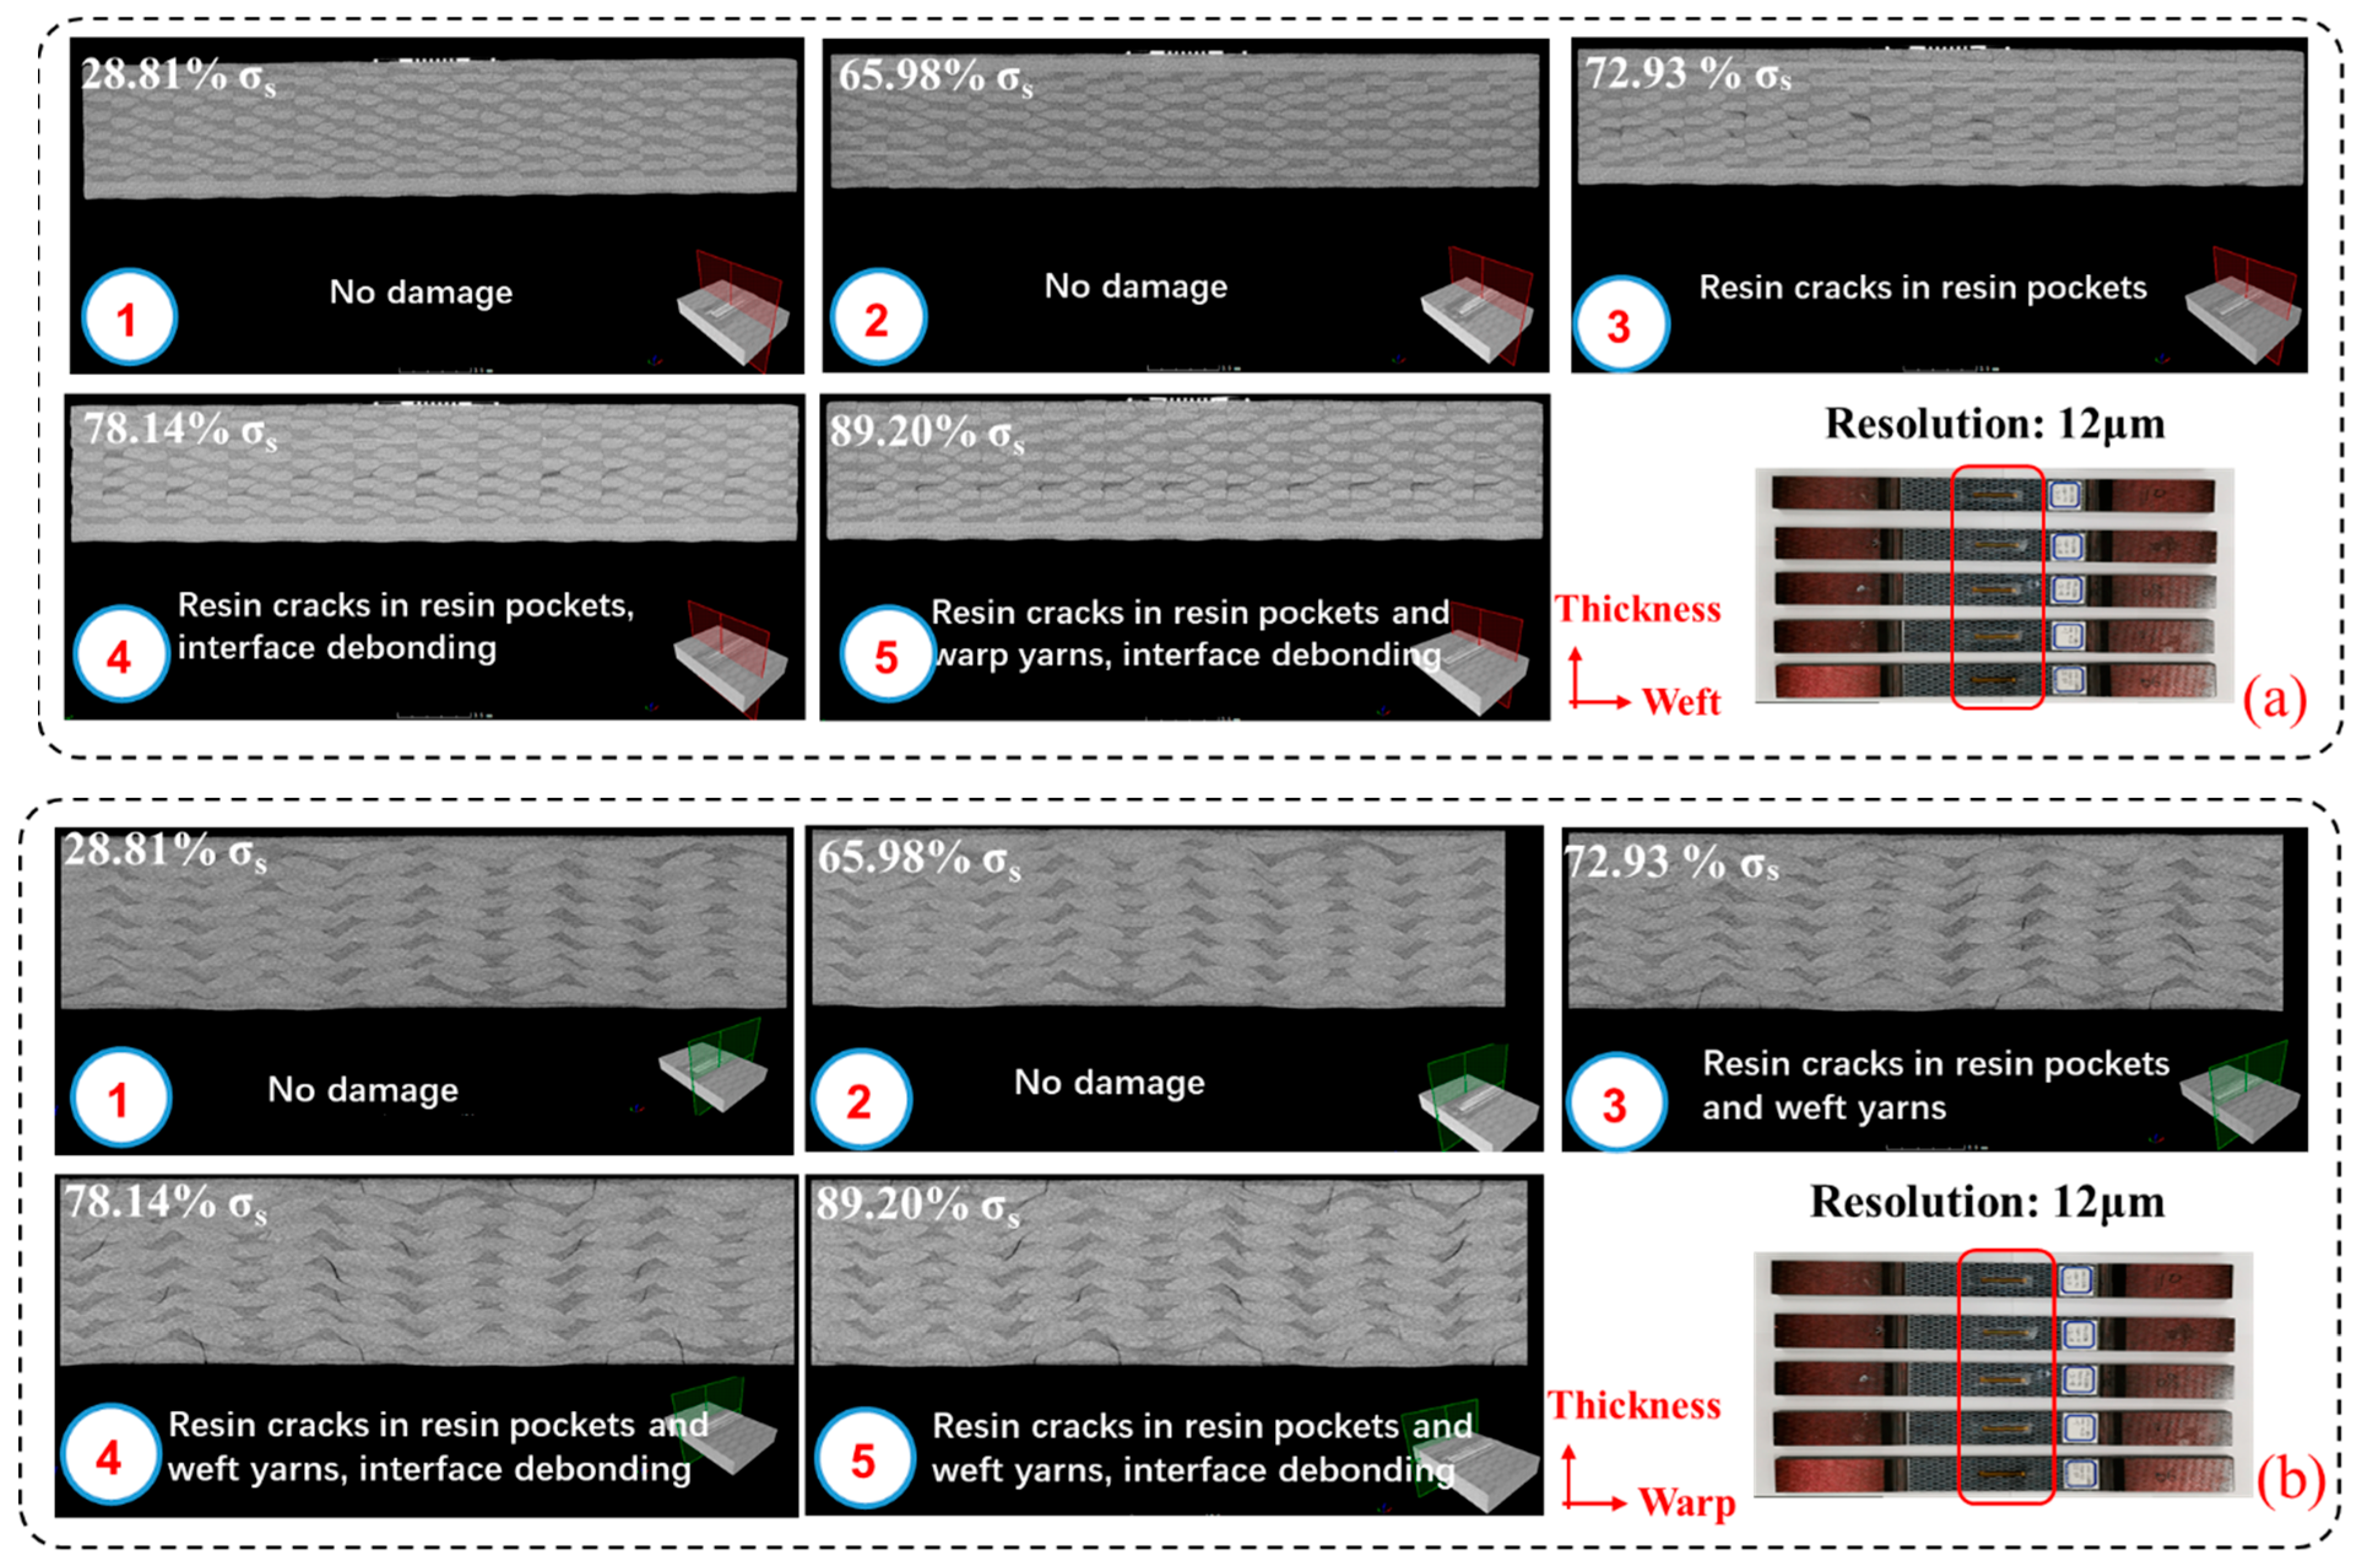
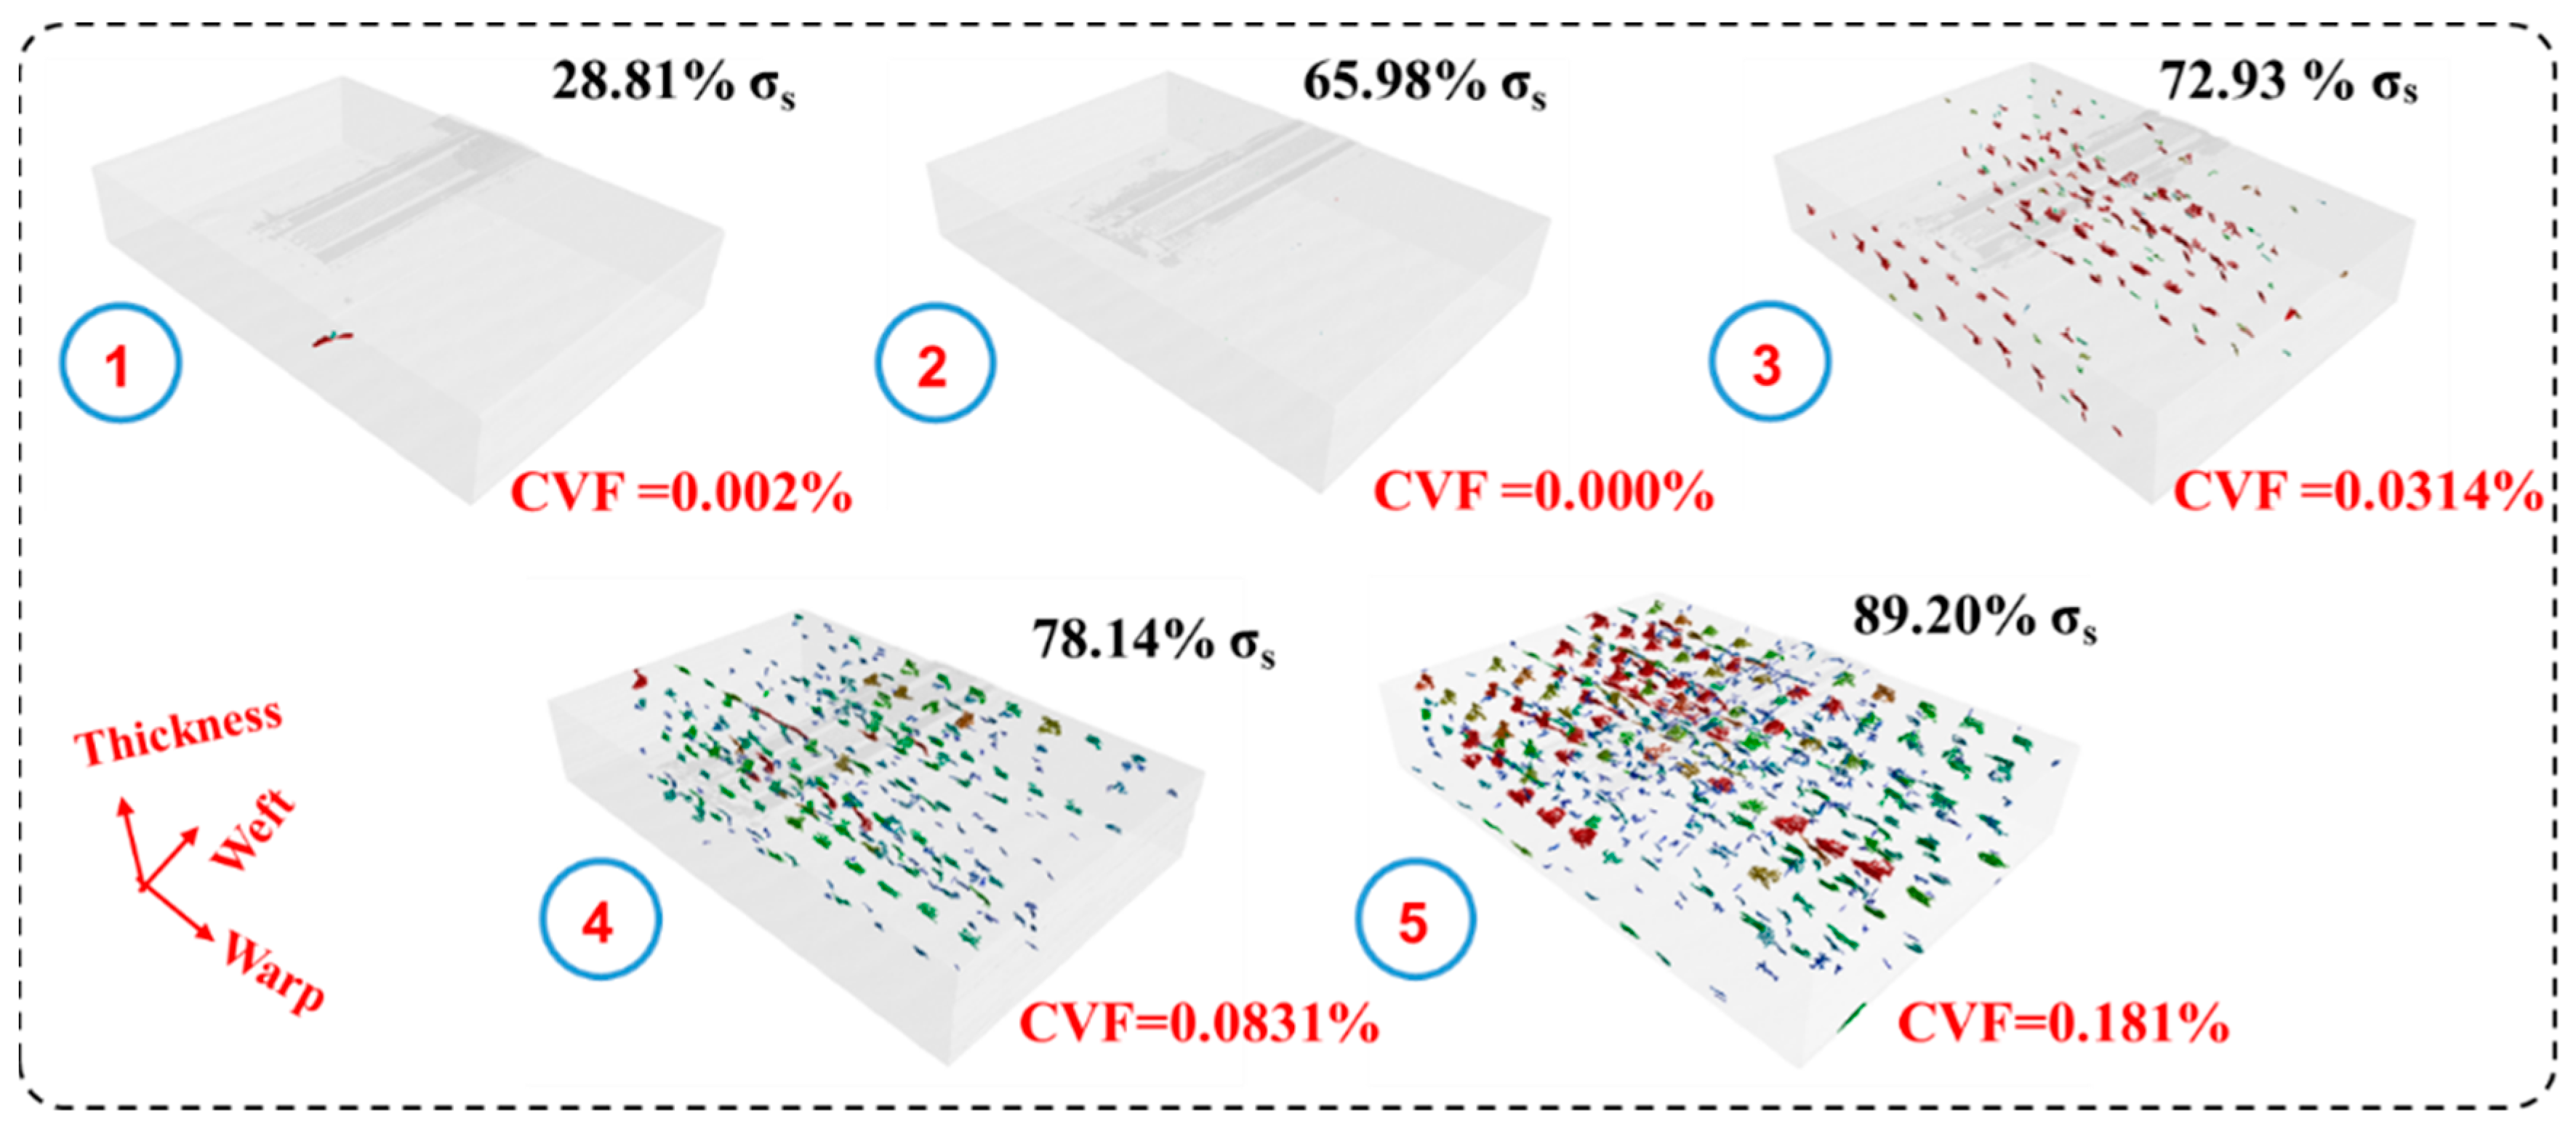
3.3. Micro-XCT Detection and the Damages Evolution Process

For a better understanding of the damages evolution process and the corresponding damage modes during tensile tests of 3D woven composites, the five phased samples with different damage levels were scanned using a micro-XCT system in the third step. Quantitative and qualitative characterization of the inner damages were analyzed using the CT cross-sectional pictures and the cracks 3D reconstruction, as shown in Figure 9 and Figure 10.
Figure 9 shows the CT cross-sectional pictures of the five phased samples along the warp (a) and weft (b) directions, respectively, with a maximum possible resolution of 12 μm. The displayed pictures correspond to a same area of interest in the five specimens. At the first and second phase points (stress levels of 28.81% and 65.98% σs, respectively), no damage was observed in the specimens (Figure 9①,②). Resin cracks were detected in the observation plane at the third phase point (Figure 9③), corresponding to a stress level of 72.93% σs, indicating that detectable damages showed up firstly during the stress range of 65.98%–72.93% σs. From Figure 9a,c, one can see that, at this phase point, these resin cracks mainly distribute in the resin pockets, while some resin cracks also appear in the weft yarns, according to Figure 9b. These cracks grew wider and longer at the last two phases with higher stress levels of 78.14% and 89.20% σs, respectively. Another damage mode of interface debonding was detected at the last two phases (Figure 9④,⑤).
Figure 10 demonstrates the 3D reconstruction of inner cracks of the five phased specimens. The quantification analysis of the damages was performed using the VG Studio Max 3.3 (Monterrey, Mexico). In each 3D representation, the damage voxels were separated from the yarns and the matrix voxels according to the various grey levels of materials and voids. Obtained results cannot be used as absolute values. However, the crack volume fraction (CVF) measured in this study is proportionally affected by the number and size of the cracks and can be used to characterize the damage level of each specimen. The CVF represents the ratio between the volume of inner cracks and the total detected volume. No cracks were detected at the first two phases. Up to the stress level of 72.93% σs, the cracks can be detected with a random distribution in the specimen. Cracks propagated and new ones appeared at the last two phases due to higher stress levels. The CVF for the five phased specimens is 0.002%, 0.000%, 0.0314%, 0.0831% and 0.181%, respectively. In accordance with the observations on Figure 9, the damage volume increases and accumulates in turn within the maximum applied tensile stress. However, one abnormal datum was found; at the stress level of 28.81% σs, the CVF value is offered by the artifacts, not by the damages. Artifacts have different geometric morphology, compared with the inner cracks, and no artifacts were found in the other four phased specimens. No cracks can be seen until the third stress level, indicating that the detectable damages initiate between the stress levels of 65.98% and 72.93% σs, as shown in Figure 4 (red dash line). The detectable damages initiate in Stage 2 and, thereafter, the slope of the stress–strain curves decreases slightly, indicating that the detectable damage initiation is accountable for the fast stiffness degradation. Combining tensile stress–strain curves shown in Figure 4 and the micro-CT CVF analysis, one possible explanation for the slight increase of tensile stiffness at Stage 4 is that the cracks induced by the tensile stress give the warp yarns a certain deformation space, making the warp yarns straighter than their initiate state.

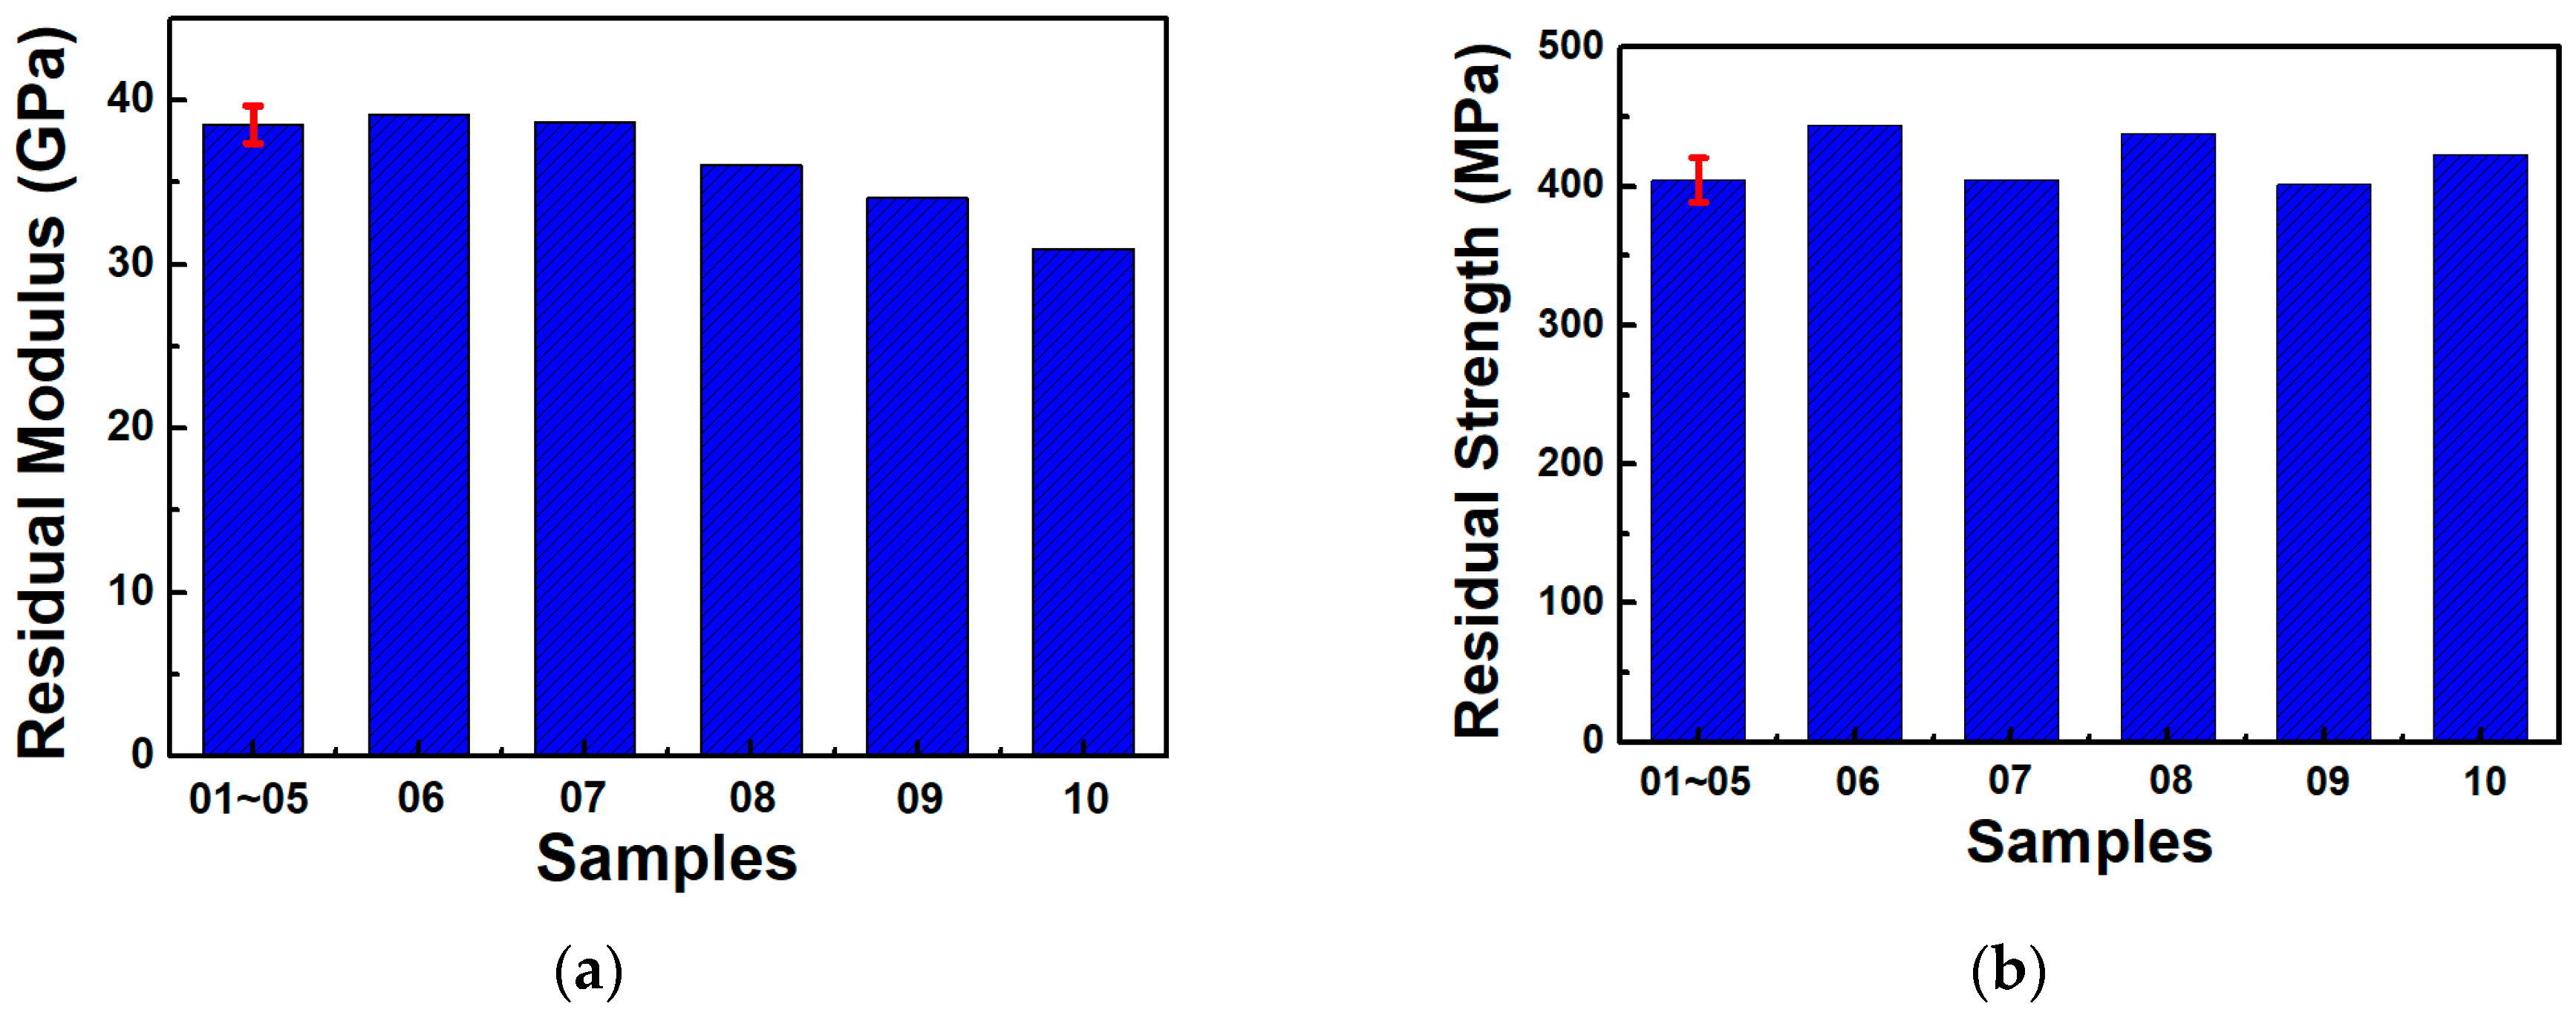
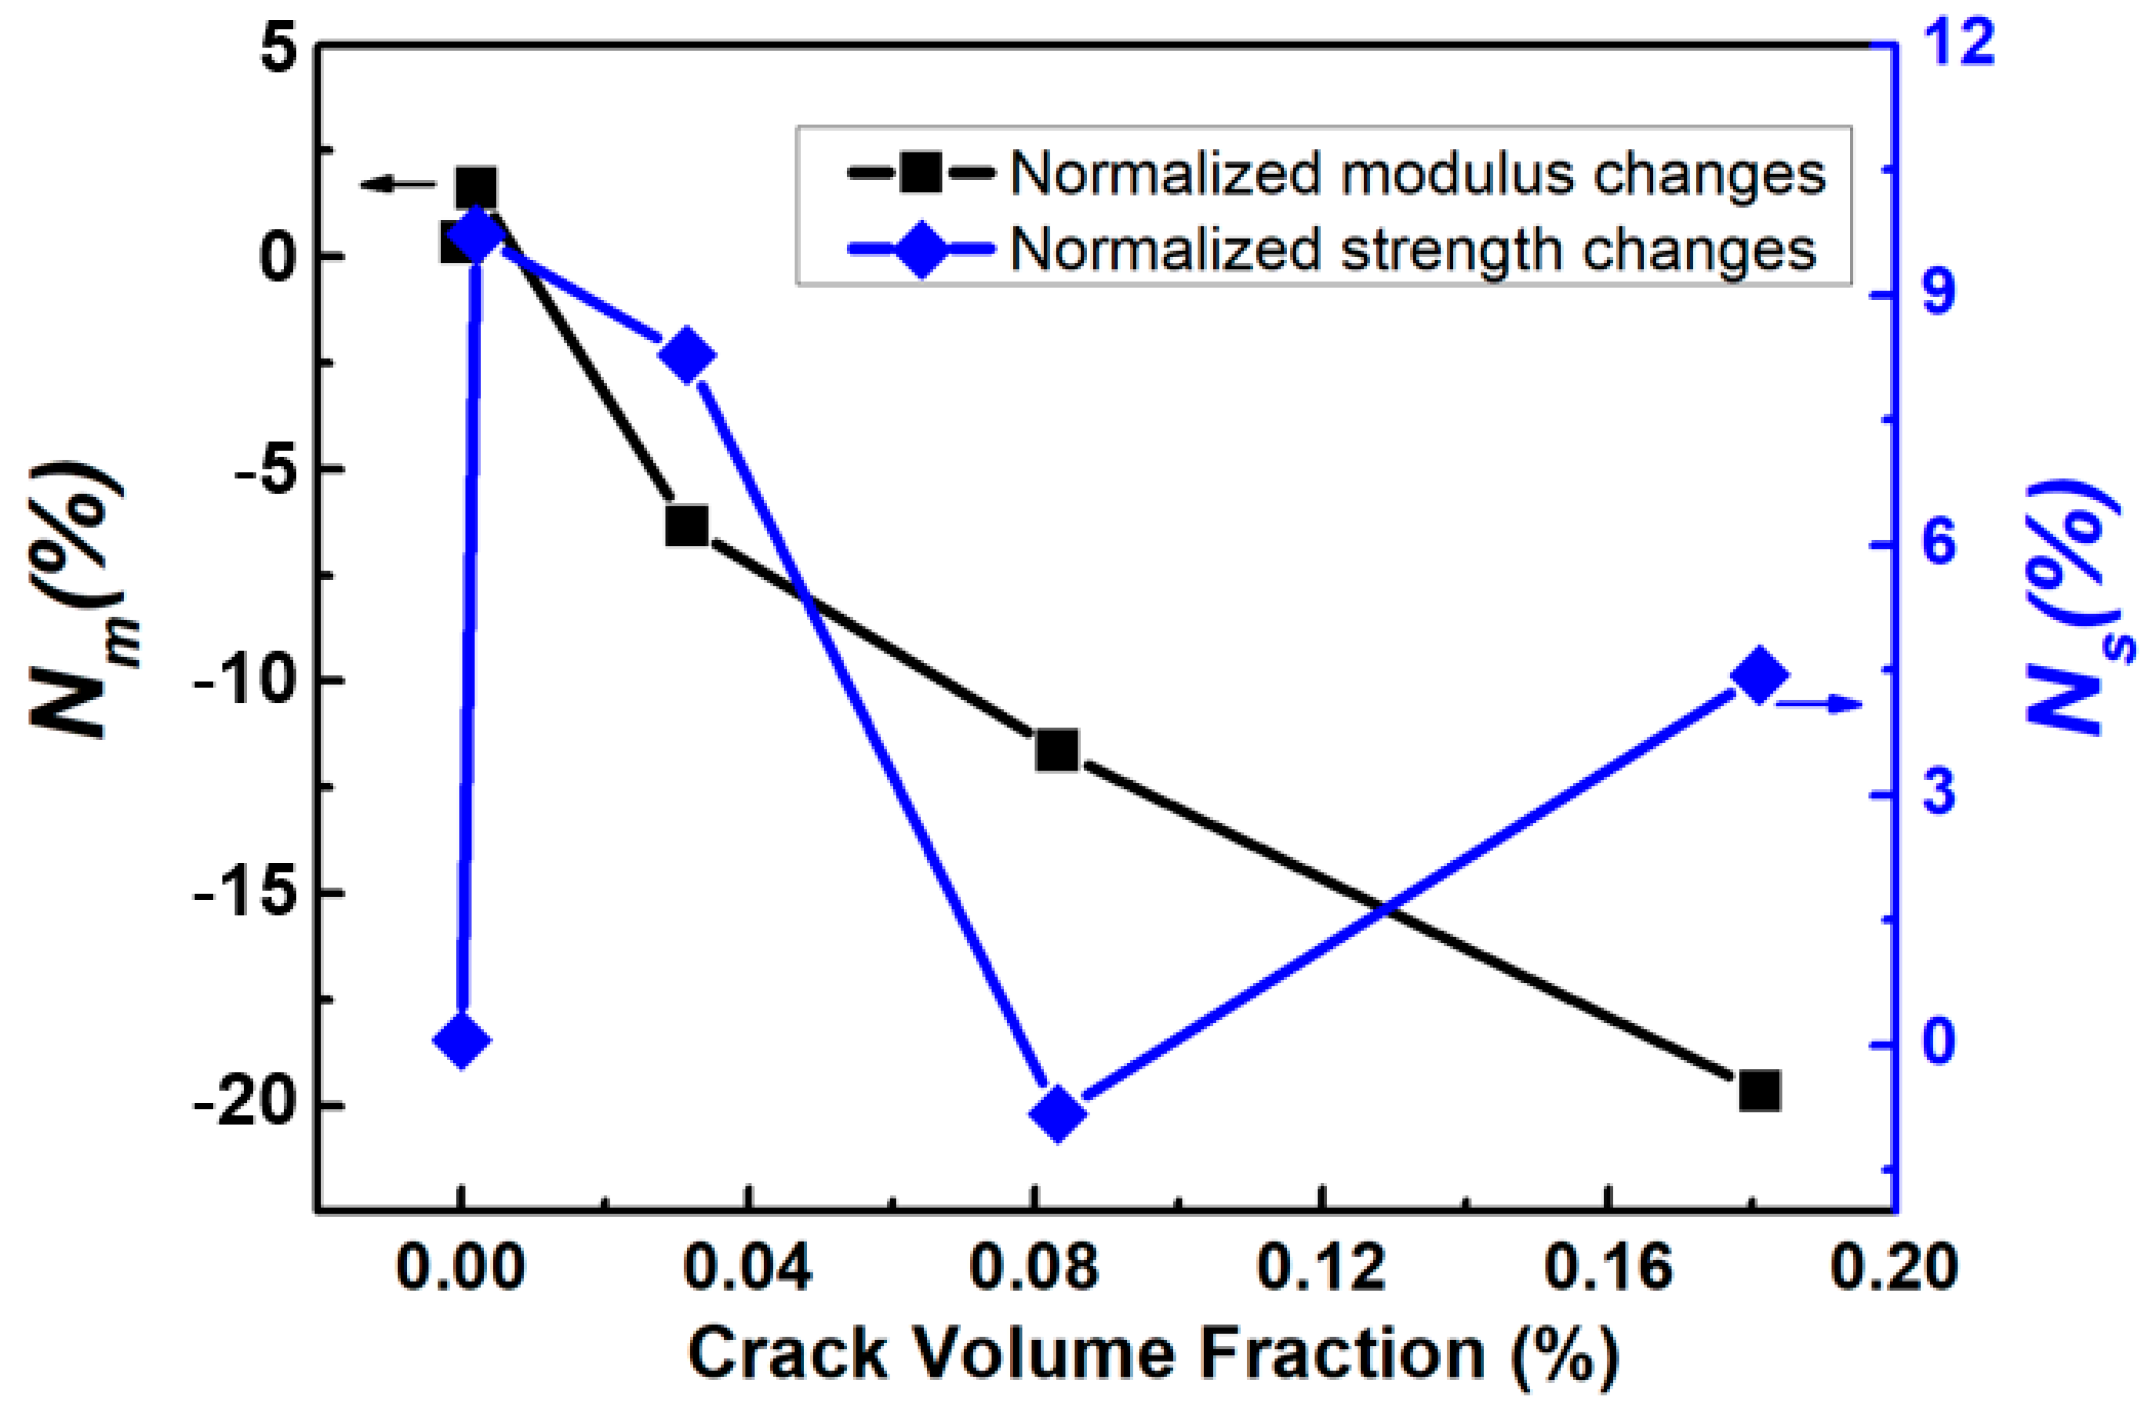
3.4. Residual Properties and the Effect of Microcracks

The phased specimens were used in the following tensile experiments to obtain their residual properties after the nondestructive micro-XCT damage detection. The obtained load-displacement curves of each sample, from 06–10, are shown in Figure 11b. With a contrast analysis against the load–displacement curves for typical tensile behavior (Figure 11a), one can see that the bilinear characterization stays consistent, while the variation of the five curves grows larger. The obtained residual properties compared with the typical properties are shown in Figure 12. The average value of tensile modulus witnesses a decrease of 7.66%, while the average value of tensile strength stays almost consistent. What calls for special attention is that the coefficient of variation changes, obviously, from 2.97% to 9.49% for the tensile modulus. Explanation for the CoV increase is that the phased damages provided a certain space for the yarns to deform. Various spaces of each specimen induced by the five damage levels resulted in various warp yarn deformations, furtherly leading to a larger variation and a slight decrease in tensile modulus. The tensile modulus showed a regular degradation with the damage level increase.
As discussed in Section 3.3, the crack volume fraction (CVF) was adopted to quantitatively characterize the inner damages induced by the phased tensile stress. To characterize the effect of microcracks on the tensile properties, the normalized properties changes vs. the CVF are shown in Figure 13, where the normalized modulus/strength changes are obtained by the following equation:
{ N m = M r M 0 M 0 N s = S r S 0 S 0
where Mr and Sr are the residual modulus and residual strength, respectively, M0 and S0 are the typical average modulus and strength obtained from Step 1 and Nm and Ns are the normalized tensile modulus and strength changes induced by the microcracks.
As shown in Figure 13, the residual strength of three samples achieves a slight increase, compared with the typical average values, while the other two stay almost consistent, indicating that the inner cracks had little influence on the tensile strength of 3D woven composites. However, the residual modulus of the first two damage levels (CVF = 0.002% and 0.000%, respectively) remains almost unchanged, while the other three damage levels witness a regular decrease. The dividing boundary appears at the third damage level, with a CVF of 0.0314%, and a residual modulus reduction of 6.33% was achieved at this point. The increase of CVF leads to nonlinear decrease of the residual tensile modulus. Finally, with a maximum CVF of 0.181%, the residual modulus decreases up to 19.64%.

4. Conclusions

A four-step experimental procedure based on the phased approach was proposed and completed combining three nondestructive evaluation techniques of micro-XCT, acoustic emission (AE) and digital image correlation (DIC). Typical tensile behaviors, damage mechanisms, damage evolution processes, residual performances and the effect of microcracks on the tensile properties of 3D woven composites subjected to tensile load in warp direction were discussed. According to the present investigation, the following conclusions can be drawn:
(1) The typical tensile stress–strain behaviors can be classified into four stages. Stage 1 represents the early linear part, while Stage 2 witnesses a deflection section to bilinear response with a fast stiffness degradation. In Stage 3 the tangent tensile modulus intends to stay at a relatively stable value, which is obviously lower than the value in Stage 1. However, Stage 4 shows a strain hardening phenomenon after the plateau.
(2) According to the AE energy monitoring results, damages show up at the early linear section. However, these early damages cannot be detected by micro-XCT and have no influence for their residual properties. Detectable inner damages initiate during the stress range from 65.98% to 72.93% σs. Resin cracks in resin pockets and yarns and interface debonding are the main detected damage modes. Therefore, enhancing the interface property and the matrix toughness during the material design and production can improve the tensile performance of the 3D woven composites.
(3) According to the analysis of the relationship between the CVF and the normalized tensile properties changes, detected microcracks have little influence on the residual strength, while the residual modulus witnesses a regular decrease along with the damage increase. As a result, the modulus degradation induced by inner cracks can be adopted to conduct damage evaluation for 3D woven structures in service.

Author Contributions

Conceptualization, J.H.; data curation, J.H. and Y.F.; investigation, Y.F. and K.W.; methodology, J.H.; resources, C.L. and L.Z.; supervision, Q.Z. and X.S.; validation, H.Z. and F.S.; writing—original draft, J.H.; writing—review and editing, J.H. and X.S. All authors have read and agreed to the published version of the manuscript.

Funding

This research was funded by the Natural Science Foundation of Jiangsu Province, Grant No.: BK20190146.

Institutional Review Board Statement

Not applicable.

Informed Consent Statement

Not applicable.

Data Availability Statement

Data available on request due to restrictions eg privacy or ethical.

Acknowledgments

The first author would like to thank Huaguan Li for his help with microscope images. Thanks also go to the TexGen development team.

Conflicts of Interest

The authors declare no conflict of interest.

References

  1. Mouritz, A.P.; Bannister, M.K.; Falzon, P.J.; Leong, K.H. Review of applications for advanced three-dimensional fibre textile composites. Compos. Part A Appl. Sci. 1999, 30, 1445–1461. [Google Scholar] [CrossRef]
  2. Novak, N.; Dobnik Dubrovski, P.; Borovinšek, M.; Vesenjak, M.; Ren, Z. Deformation behaviour of advanced textile composites with auxetic structure. Compos. Struct. 2020, 252, 112761. [Google Scholar] [CrossRef]
  3. Yao, L.; Jiang, M.; Zhou, D.; Xu, F.; Zhao, D.; Zhang, W. Fabrication and characterization of microstrip array antennas integrated in the three dimensional orthogonal woven composite. Compos. Part B Eng. 2011, 42, 885–890. [Google Scholar] [CrossRef]
  4. Abbasi, S.; Ladani, R.B.; Wang, C.H.; Mouritz, A.P. Improving the delamination resistance of fibre reinforced polymer composites using 3D woven metal Z-Filaments. Compos. Sci. Technol. 2020, 198, 108301. [Google Scholar] [CrossRef]
  5. Gerlach, R.; Siviour, C.R.; Wiegand, J.; Petrinic, N. In-plane and through-thickness properties, failure modes, damage and delamination in 3D woven carbon fibre composites subjected to impact loading. Compos. Sci. Technol. 2012, 72, 397–411. [Google Scholar] [CrossRef]
  6. Pankow, M.; Salvi, A.; Waas, A.M.; Yen, C.F.; Ghiorse, S. Resistance to delamination of 3D woven textile composites evaluated using end notch flexure (ENF) tests: Experimental results. Compos. Part A Appl. Sci. 2011, 42, 1463–1476. [Google Scholar] [CrossRef]
  7. Petersen, R.; Liu, P.R. 3D-woven fiber-reinforced composite for CAD/CAM dental application. SAMPE J. 2016, 2016, LB15–0138. [Google Scholar] [PubMed]
  8. Zhang, D.; Chen, L.; Sun, Y.; Zhang, Y.; Qian, K. Multi-Scale modeling of an integrated 3D braided composite with applications to helicopter arm. Appl. Compos. Mater. 2017, 24, 1233–1250. [Google Scholar] [CrossRef]
  9. Wang, Y.; Soutis, C. Fatigue behaviour of composite t-joints in wind turbine blade applications. Appl. Compos. Mater. 2017, 24, 461–475. [Google Scholar] [CrossRef]
  10. Yan, S.; Zeng, X.; Long, A. Experimental assessment of the mechanical behaviour of 3D woven composite T-joints. Compos. Part B Eng. 2018, 154, 108–113. [Google Scholar] [CrossRef] [Green Version]
  11. Limmer, L.; Weissenbach, G.; Brown, D.; McIlhagger, R.; Wallace, E. The potential of 3-D woven composites exemplified in a composite component for a lower-leg prosthesis. Compos. Part A Appl. Sci. 1996, 27, 271–277. [Google Scholar] [CrossRef]
  12. Karahan, M.; Lomov, S.V.; Bogdanovich, A.E.; Verpoest, I. Fatigue tensile behavior of carbon/epoxy composite reinforced with non-crimp 3D orthogonal woven fabric. Compos. Sci. Technol. 2011, 71, 1961–1972. [Google Scholar] [CrossRef]
  13. Kuo, W.-S.; Ko, T.-H.; Chen, C.-P. Effect of weaving processes on compressive behavior of 3D woven composites. Compos. Part A Appl. Sci. 2007, 38, 555–565. [Google Scholar] [CrossRef]
  14. Li, Z.; Guo, L.; Zhang, L.; Wang, Q. In situ experimental investigation on the out-plane damage evolution of 3D woven carbon-fiber reinforced composites. Compos. Sci. Technol. 2018, 162, 101–109. [Google Scholar] [CrossRef]
  15. Mounien, R.; Fagiano, C.; Paulmier, P.; Tranquart, B.; Irisarri, F.X. Experimental characterization of the bearing behavior of 3D woven composites. Compos. Part B Eng. 2017, 116, 369–376. [Google Scholar] [CrossRef]
  16. Rudov-Clark, S.; Mouritz, A.P. Tensile fatigue properties of a 3D orthogonal woven composite. Compos. Part A Appl. Sci. 2008, 39, 1018–1024. [Google Scholar] [CrossRef]
  17. Pierreux, G.; Van Hemelrijck, D.; Massart, T.J. Automated generation of 3D orthogonal woven composites RVEs including yarn cross-section variations. Compos. Sci. Technol. 2019, 176, 90–102. [Google Scholar] [CrossRef] [Green Version]
  18. Zheng, T.; Guo, L.; Huang, J.; Liu, G. A novel mesoscopic progressive damage model for 3D angle-interlock woven composites. Compos. Sci. Technol. 2020, 185, 107894. [Google Scholar] [CrossRef]
  19. Ansar, M.; Xinwei, W.; Chouwei, Z. Modeling strategies of 3D woven composites: A review. Compos. Struct. 2011, 93, 1947–1963. [Google Scholar] [CrossRef]
  20. Gereke, T.; Cherif, C. A review of numerical models for 3D woven composite reinforcements. Compos. Struct. 2019, 209, 60–66. [Google Scholar] [CrossRef]
  21. Bahei-El-Din, Y.A.; Zikry, M.A. Impact-induced deformation fields in 2D and 3D woven composites. Compos. Sci. Technol. 2003, 63, 923–942. [Google Scholar] [CrossRef]
  22. Bandaru, A.K.; Sachan, Y.; Ahmad, S.; Alagirusamy, R.; Bhatnagar, N. On the mechanical response of 2D plain woven and 3D angle-interlock fabrics. Compos. Part B Eng. 2017, 118, 135–148. [Google Scholar] [CrossRef]
  23. Hart, K.R.; Chia, P.X.L.; Sheridan, L.E.; Wetzel, E.D.; Sottos, N.R.; White, S.R. Mechanisms and characterization of impact damage in 2D and 3D woven fiber-reinforced composites. Compos. Part A Appl. Sci. 2017, 101, 432–443. [Google Scholar] [CrossRef]
  24. Saeedifar, M.; Saleh, M.N.; El-Dessouky, H.M.; Teixeira De Freitas, S.; Zarouchas, D. Damage assessment of NCF, 2D and 3D woven composites under compression after multiple-impact using acoustic emission. Compos. Part A Appl. Sci. 2020, 132, 105833. [Google Scholar] [CrossRef]
  25. Saleh, M.N.; El-Dessouky, H.M.; Saeedifar, M.; De Freitas, S.T.; Scaife, R.J.; Zarouchas, D. Compression after multiple low velocity impacts of NCF, 2D and 3D woven composites. Compos. Part A Appl. Sci. 2019, 125, 105576. [Google Scholar] [CrossRef]
  26. Saeedifar, M.; Zarouchas, D. Damage characterization of laminated composites using acoustic emission: A review. Compos. Part B Eng. 2020, 195, 108039. [Google Scholar] [CrossRef]
  27. Li, L.; Yentl, S.; Ilya, S.; Xiong, Y.; Stepan, V.L. Cluster analysis of acoustic emission signals for 2D and 3D woven carbon fiber/epoxy composites. J. Compos. Mater. 2016, 50, 1921–1935. [Google Scholar] [CrossRef] [Green Version]
  28. Holmes, J.; Das, R.; Stachurski, Z.; Compston, P.; Kalyanasundaram, S. Development of an S-specimen geometry for shear testing of woven thermoplastic composites. Compos. Part B Eng. 2020, 203, 108485. [Google Scholar] [CrossRef]
  29. Montesano, J.; Selezneva, M.; Levesque, M.; Fawaz, Z. Modeling fatigue damage evolution in polymer matrix composite structures and validation using in-situ digital image correlation. Compos. Struct. 2015, 125, 354–361. [Google Scholar] [CrossRef]
  30. Guo, L.; Huang, J.; Zhang, L.; Sun, X. Damage evolution of 3D woven carbon/epoxy composites under tension-tension fatigue loading based on synchrotron radiation computed tomography (SRCT). Int. J. Fatigue 2020, 142, 105913. [Google Scholar] [CrossRef]
  31. Abtew, M.A.; Boussu, F.; Bruniaux, P.; Loghin, C.; Cristian, I. Ballistic impact mechanisms—A review on textiles and fibre-reinforced composites impact responses. Compos. Struct. 2019, 223, 110966. [Google Scholar] [CrossRef]
  32. Gigliotti, M.; Pannier, Y.; Gonzalez, R.A.; Lafarie-Frenot, M.C.; Lomov, S.V. X-ray micro-computed-tomography characterization of cracks induced by thermal cycling in non-crimp 3D orthogonal woven composite materials with porosity. Compos. Part A Appl. Sci. 2018, 112, 100–110. [Google Scholar] [CrossRef]
  33. Seltzer, R.; González, C.; Muñoz, R.; Llorca, J.; Blanco-Varela, T. X-ray microtomography analysis of the damage micromechanisms in 3D woven composites under low-velocity impact. Compos. Part A Appl. Sci. 2013, 45, 49–60. [Google Scholar] [CrossRef] [Green Version]
  34. Xu, F.; Sun, L.; Zhu, L.; Yang, S.; Hui, D.; Qiu, Y. X-ray 3D microscopy analysis of fracture mechanisms for 3D orthogonal woven E-glass/epoxy composites with drilled and moulded-in holes. Compos. Part B Eng. 2018, 133, 193–202. [Google Scholar] [CrossRef]
  35. Brault, R.; Germaneau, A.; Dupré, J.C.; Doumalin, P.; Mistou, S. In-situ analysis of laminated composite materials by X-ray micro-computed tomography and digital volume correlation. Exp. Mech. 2013, 53, 1143–1151. [Google Scholar] [CrossRef] [Green Version]
  36. Garcea, S.C.; Sinclair, I.; Spearing, S.M. In situ synchrotron tomographic evaluation of the effect of toughening strategies on fatigue micromechanisms in carbon fibre reinforced polymers. Compos. Sci. Technol. 2015, 109, 32–39. [Google Scholar] [CrossRef]
  37. Hülsbusch, D.; Mrzljak, S.; Walther, F. In situ computed tomography for the characterization of the fatigue damage development in glass fiber-reinforced polyurethane. Mater. Test. 2019, 61, 821–828. [Google Scholar] [CrossRef]
  38. Tan, P.; Tong, L.; Steven, G.P.; Ishikawa, T. Behavior of 3D orthogonal woven CFRP composites. Part I. Experimental investigation. Compos. Part A Appl. Sci. 2000, 31, 259–271. [Google Scholar] [CrossRef]
  39. Pascoe, J.A.; Zarouchas, D.S.; Alderliesten, R.C.; Benedictus, R. Using acoustic emission to understand fatigue crack growth within a single load cycle. Eng. Fract. Mech. 2018, 194, 281–300. [Google Scholar] [CrossRef] [Green Version]
  40. Fotouhi, M.; Heidary, H.; Ahmadi, M.; Pashmforoush, F. Characterization of composite materials damage under quasi-static three-point bending test using wavelet and fuzzy C-means clustering. J. Compos. Mater. 2012, 46, 1795–1808. [Google Scholar] [CrossRef]
  41. Oskouei, A.R.; Ahmadi, M. Acoustic emission characteristics of mode I delamination in glass/polyester composites. J. Compos. Mater. 2009, 44, 793–807. [Google Scholar] [CrossRef]
  42. Lissek, F.; Haeger, A.; Knoblauch, V.; Hloch, S.; Pude, F.; Kaufeld, M. Acoustic emission for interlaminar toughness testing of CFRP: Evaluation of the crack growth due to burst analysis. Compos. Part B Eng. 2018, 136, 55–62. [Google Scholar] [CrossRef]
  43. Nikbakht, M.; Yousefi, J.; Hosseini-Toudeshky, H.; Minak, G. Delamination evaluation of composite laminates with different interface fiber orientations using acoustic emission features and micro visualization. Compos. Part B Eng. 2017, 113, 185–196. [Google Scholar] [CrossRef]
  44. Saeedifar, M.; Najafabadi, M.A.; Zarouchas, D.; Toudeshky, H.H.; Jalalvand, M. Clustering of interlaminar and intralaminar damages in laminated composites under indentation loading using acoustic emission. Compos. Part B Eng. 2018, 144, 206–219. [Google Scholar] [CrossRef] [Green Version]
  45. Warren, K.C.; Lopez-Anido, R.A.; Goering, J. Experimental investigation of three-dimensional woven composites. Compos. Part A Appl. Sci. 2015, 73, 242–259. [Google Scholar] [CrossRef]
Figure 1. The 3D woven composites and samples: (a) 3D woven architecture, (b) the tensile sample manufacturing process and (c) the geometrical sizes of the tensile sample.
Coatings 11 00794 g001
Figure 2. The flow chart of the 4-step experimental procedure.
Coatings 11 00794 g002
Figure 3. Experimental setups for the tensile tests.
Coatings 11 00794 g003
Figure 4. The typical stress–strain curves (a) and the normalized stiffness–strain curves (b).
Coatings 11 00794 g004
Figure 5. Full field strain maps at different strain levels (ad) and the top view of the specimen fracture planes (e).
Coatings 11 00794 g005
Figure 6. The tensile fracture morphology: the front view (a) and the inner left view (b).
Coatings 11 00794 g006
Figure 7. The typical AE energy distribution in contrast with the load curve.
Coatings 11 00794 g007
Figure 8. AE data repeatability and the phased experiments scheme (a) and results of the phased experiments (b).
Coatings 11 00794 g008
Figure 9. Micro-CT cross-sectional view of the phased specimens along the warp (a) and weft (b) directions, respectively.
Coatings 11 00794 g009
Figure 10. Micro-XCT 3D reconstruction at the five phases showing the microcracks evolution process.
Coatings 11 00794 g010
Figure 11. Load-displacement curves of the typical tensile behaviors (a) and the residual properties (b) obtained from Step 1 and Step 4, respectively.
Coatings 11 00794 g011
Figure 12. Residual modulus (a) and residual strength (b) due to the phased damages (samples 01–05 represent the initial typical values, while the samples 06/07/08/09/10 demonstrate the residual values).
Coatings 11 00794 g012
Figure 13. Normalized tensile properties changes vs. the CVF, showing the effect of microcracks.
Coatings 11 00794 g013
Table 1. Mechanical properties of the CCF800 carbon fiber and epoxy resin.
MaterialsTensile Modulus (GPa)Tensile Strength (MPa)Elongation at Break (%)
Carbon fiber27551201.72
Epoxy resin3.51025.6
Table 2. Mechanical properties generated from Step 1.
Mechanical PropertiesSample-01Sample-02Sample-03Sample-04Sample-05Average ValueCoV (%)
Tensile modulus (GPa)38.4737.6237.2239.4239.9138.532.97
Tensile strength (MPa)403.46427.54386.50411.75393.80404.613.95
Elongation at break (%)1.871.812.081.821.781.876.45
Table 3. The correspondence between the phased samples and the stress levels.
Phase Points Corresponding Samples Stress Levels (σ/σs)
Sample-0628.81%
Sample-0765.98%
Sample-0872.93%
Sample-0978.14%
Sample-1089.20%
σ is the real-time tensile stress, while σs is the average value of ultimate tensile stress obtained in Step 1; in this paper, σs = 404.61 MPa.
Publisher’s Note: MDPI stays neutral with regard to jurisdictional claims in published maps and institutional affiliations.

