1. Introduction
Due to the need to slow climate changes, it is necessary to reduce energy consumption, especially energy that is not renewable and comes from fossil fuels. According to [
1], in 2016, crude oil production was approximately 4.4 billion tones, of which approximately 60% was converted into motor fuels (gasoline and diesel). As the vast majority of this type of fuel is consumed by motor vehicles, this means that reducing vehicle fuel consumption by only 1% can result in a reduction of crude oil consumption by about 15–20 million tons per year. According to [
2], annual greenhouse gas emissions are around 50 billion tones, of which road transport accounts for around 12%, that is, 6 billion tones. A 1% reduction in fuel consumption thus means a reduction in emissions of around 60 million tonnes per year.
Rolling resistance of car tires is one of the most important components of the total resistance acting on motor vehicles. It is assumed that for low and medium speed driving (30–90 km/h), reducing the total resistance acting on a vehicle by 1% (with similar impact on fuel consumption) requires reducing the rolling resistance of tires by 3%–4% [
3].
Tire rolling resistance depends on many factors, including tire construction, road surface characteristics, weather conditions and traffic parameters. The subject of this article is the influence of the road surface, in particular the influence of the texture of the road pavement. In many available publications [
4,
5,
6,
7] there have been attempts to perform the assessment of the influence of the pavement on the rolling resistance on the basis of Mean Profile Depth (MPD) [
8], but in most cases correlation between rolling resistance and MPD was not very high. A comprehensive state of the art review was published by Wills, Robbins and Thompson [
9] and they concluded that: “… the greater the texture of the pavement, the greater the rolling resistance” and “In many cases, texture could change the rolling resistance of pavement by 5 to 10 percent”.
Understanding the relationship between pavement texture and rolling resistance is important because it enables multi-criteria optimization of the pavement. The texture affects, among others, tire/road noise, grip (wet and dry), tire wear and driving comfort. Since precise measurements of rolling resistance in road conditions are very difficult to perform [
10], it is advantageous to determine whether the pavement will promote low rolling resistance based on its geometrical characteristics. In many countries development work is currently underway to create environmentally friendly pavements, that is, pavements that reduce vehicle noise and contribute to fuel consumption reduction [
11]. Multi-criteria optimization of the pavement is difficult because there are many factors that influence pavement characteristics in a complicated way. For example, on surfaces with high MPD, with little rainfall, water is collected in dip pits and voids. This reduces the risk of hydroplaning and does not require intensive pumping of water by the tire tread, which is also beneficial for rolling resistance. Such a pavement, however, stores water for a longer period of time, and this in turn leads the longer lasting pavement dampness after the rain has stopped, but the water stored in the road cavities cools the tires and this in turn significantly increases the rolling resistance [
12].
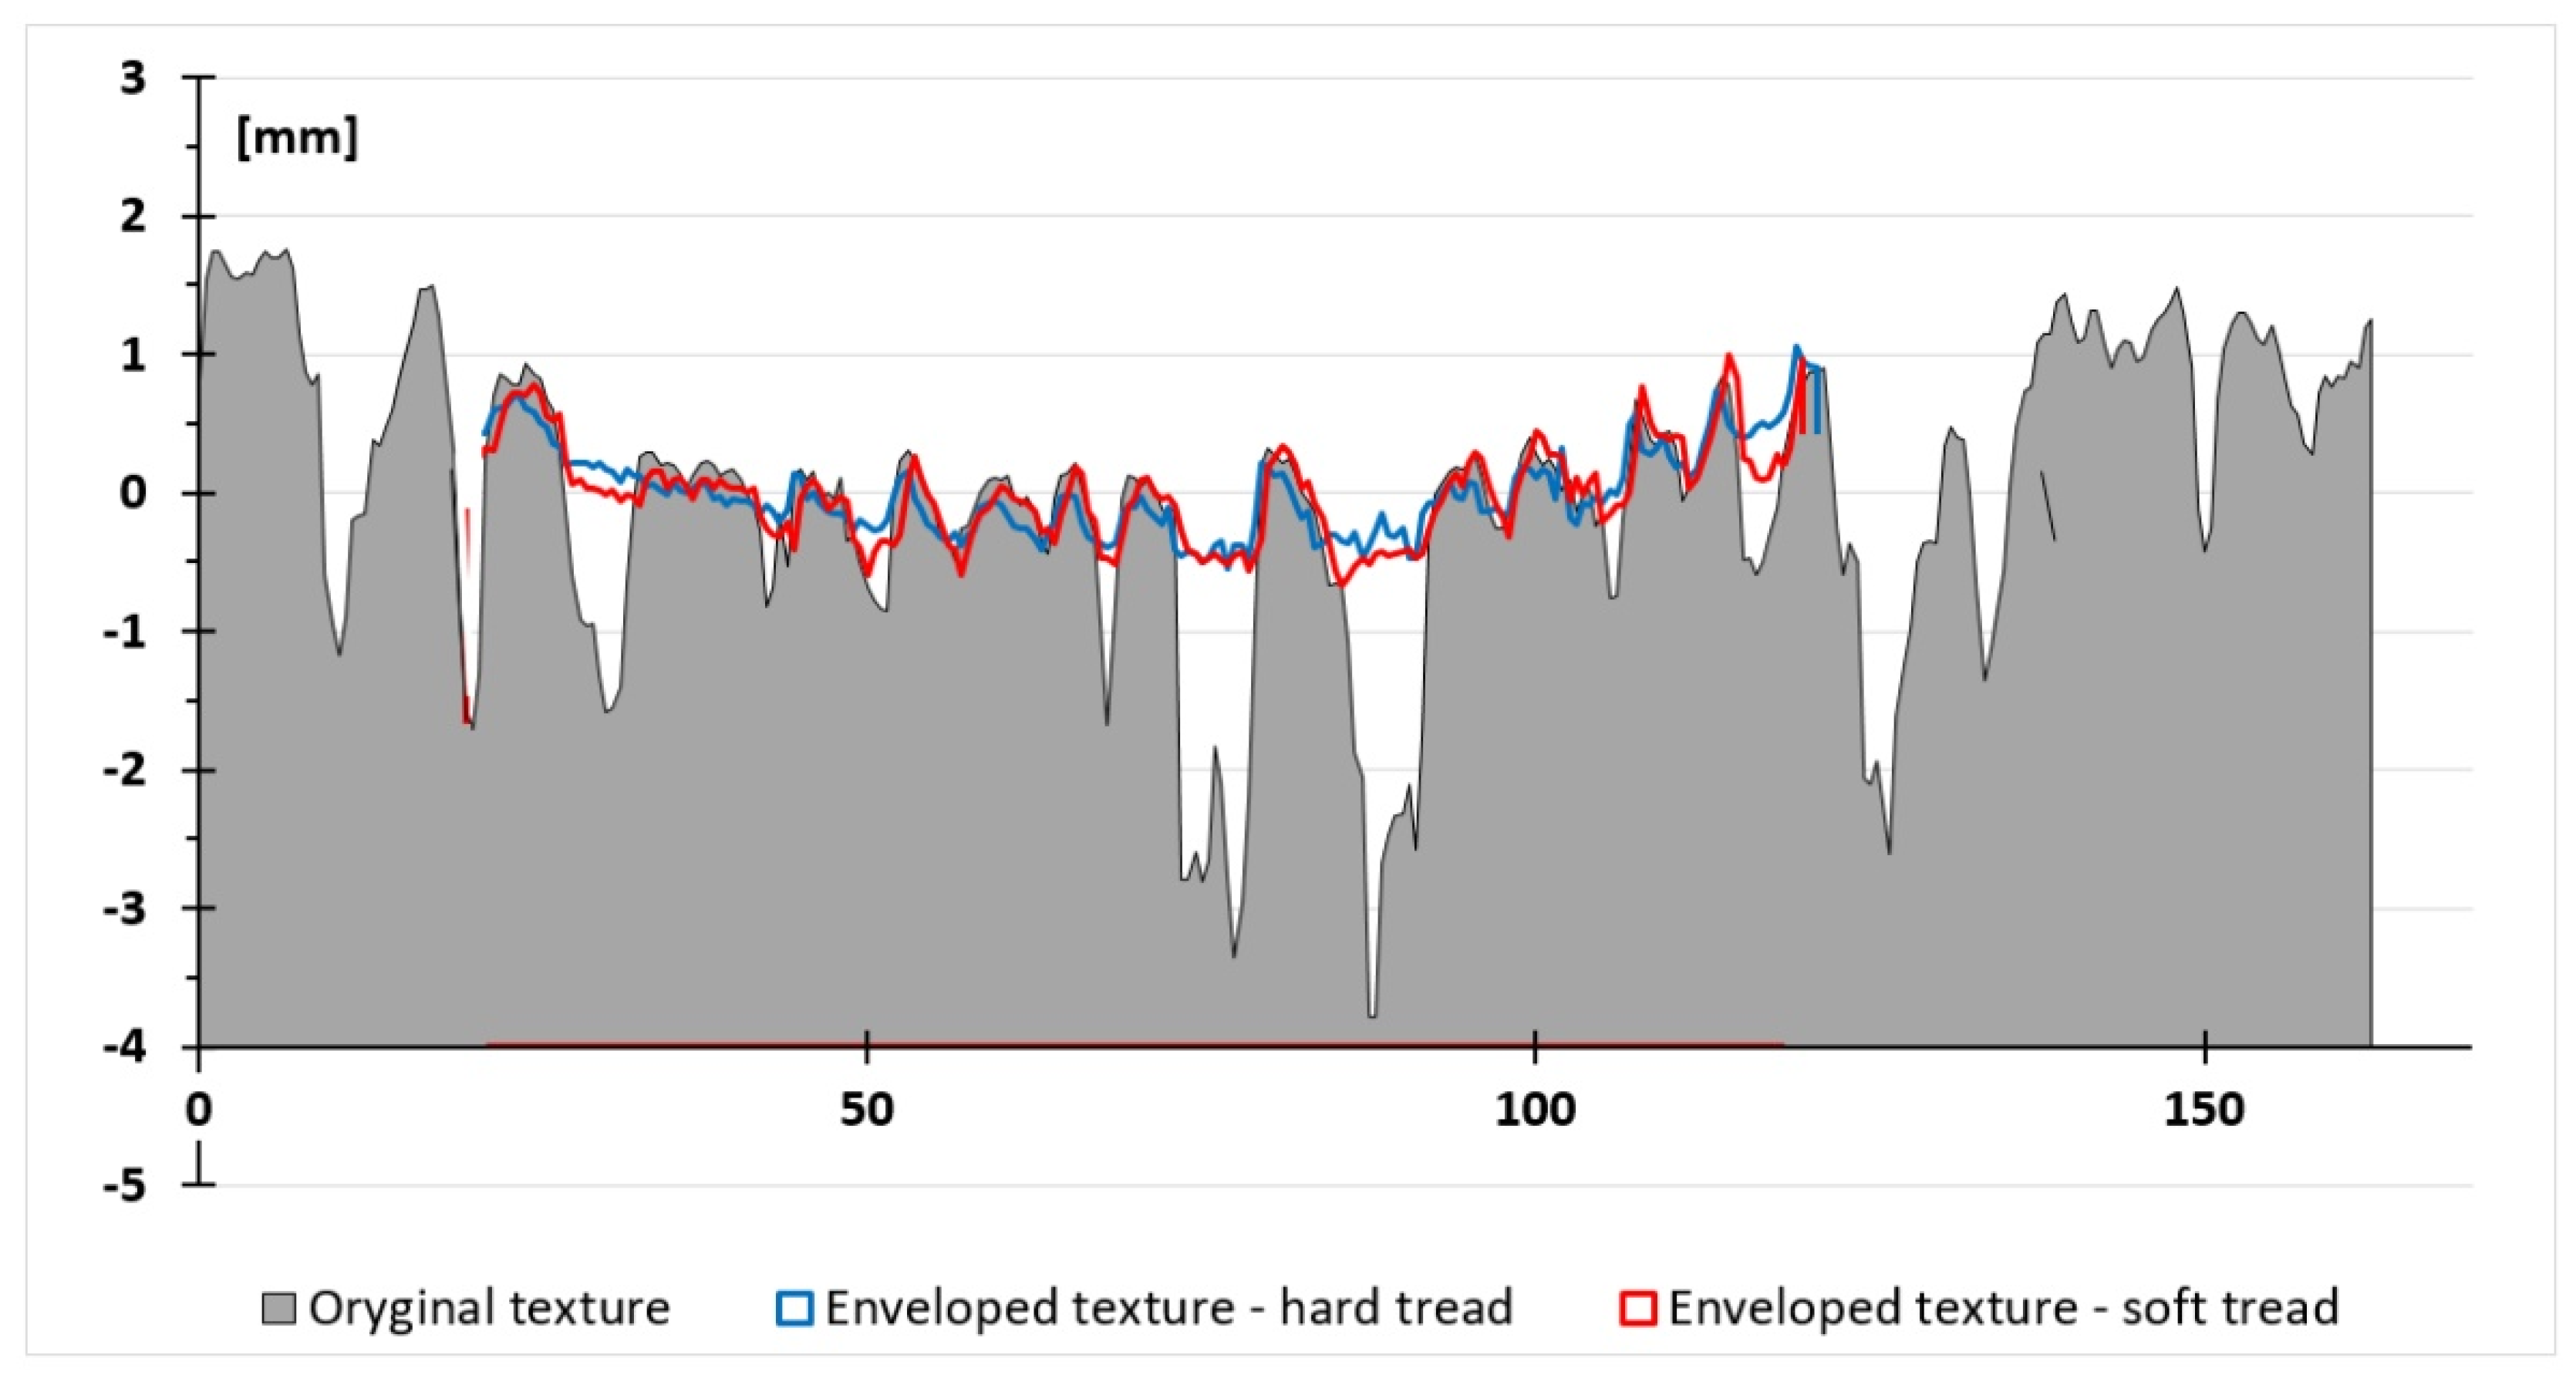
Undoubtedly there is a strong relationship between pavement texture and rolling resistance, but the pavement texture must be parameterized in the way the tire “sees” it. The MPD is a purely geometric texture parameter that has been designed to describe the texture in terms of its effect on tire/road noise where volume of cavities between tread rubber and pavement surface plays an important role. MPD may also indicate the surface’s ability to accumulate water during low-intensity rainfall. Unfortunately, the MPD does not describe the deformation of the tread elements well, because the tread rubber does not “sense” the exact shape of texture of the surface during contact, but in most cases the contact is restricted only to the summits of the texture. This phenomenon is called tire enveloping [
7].
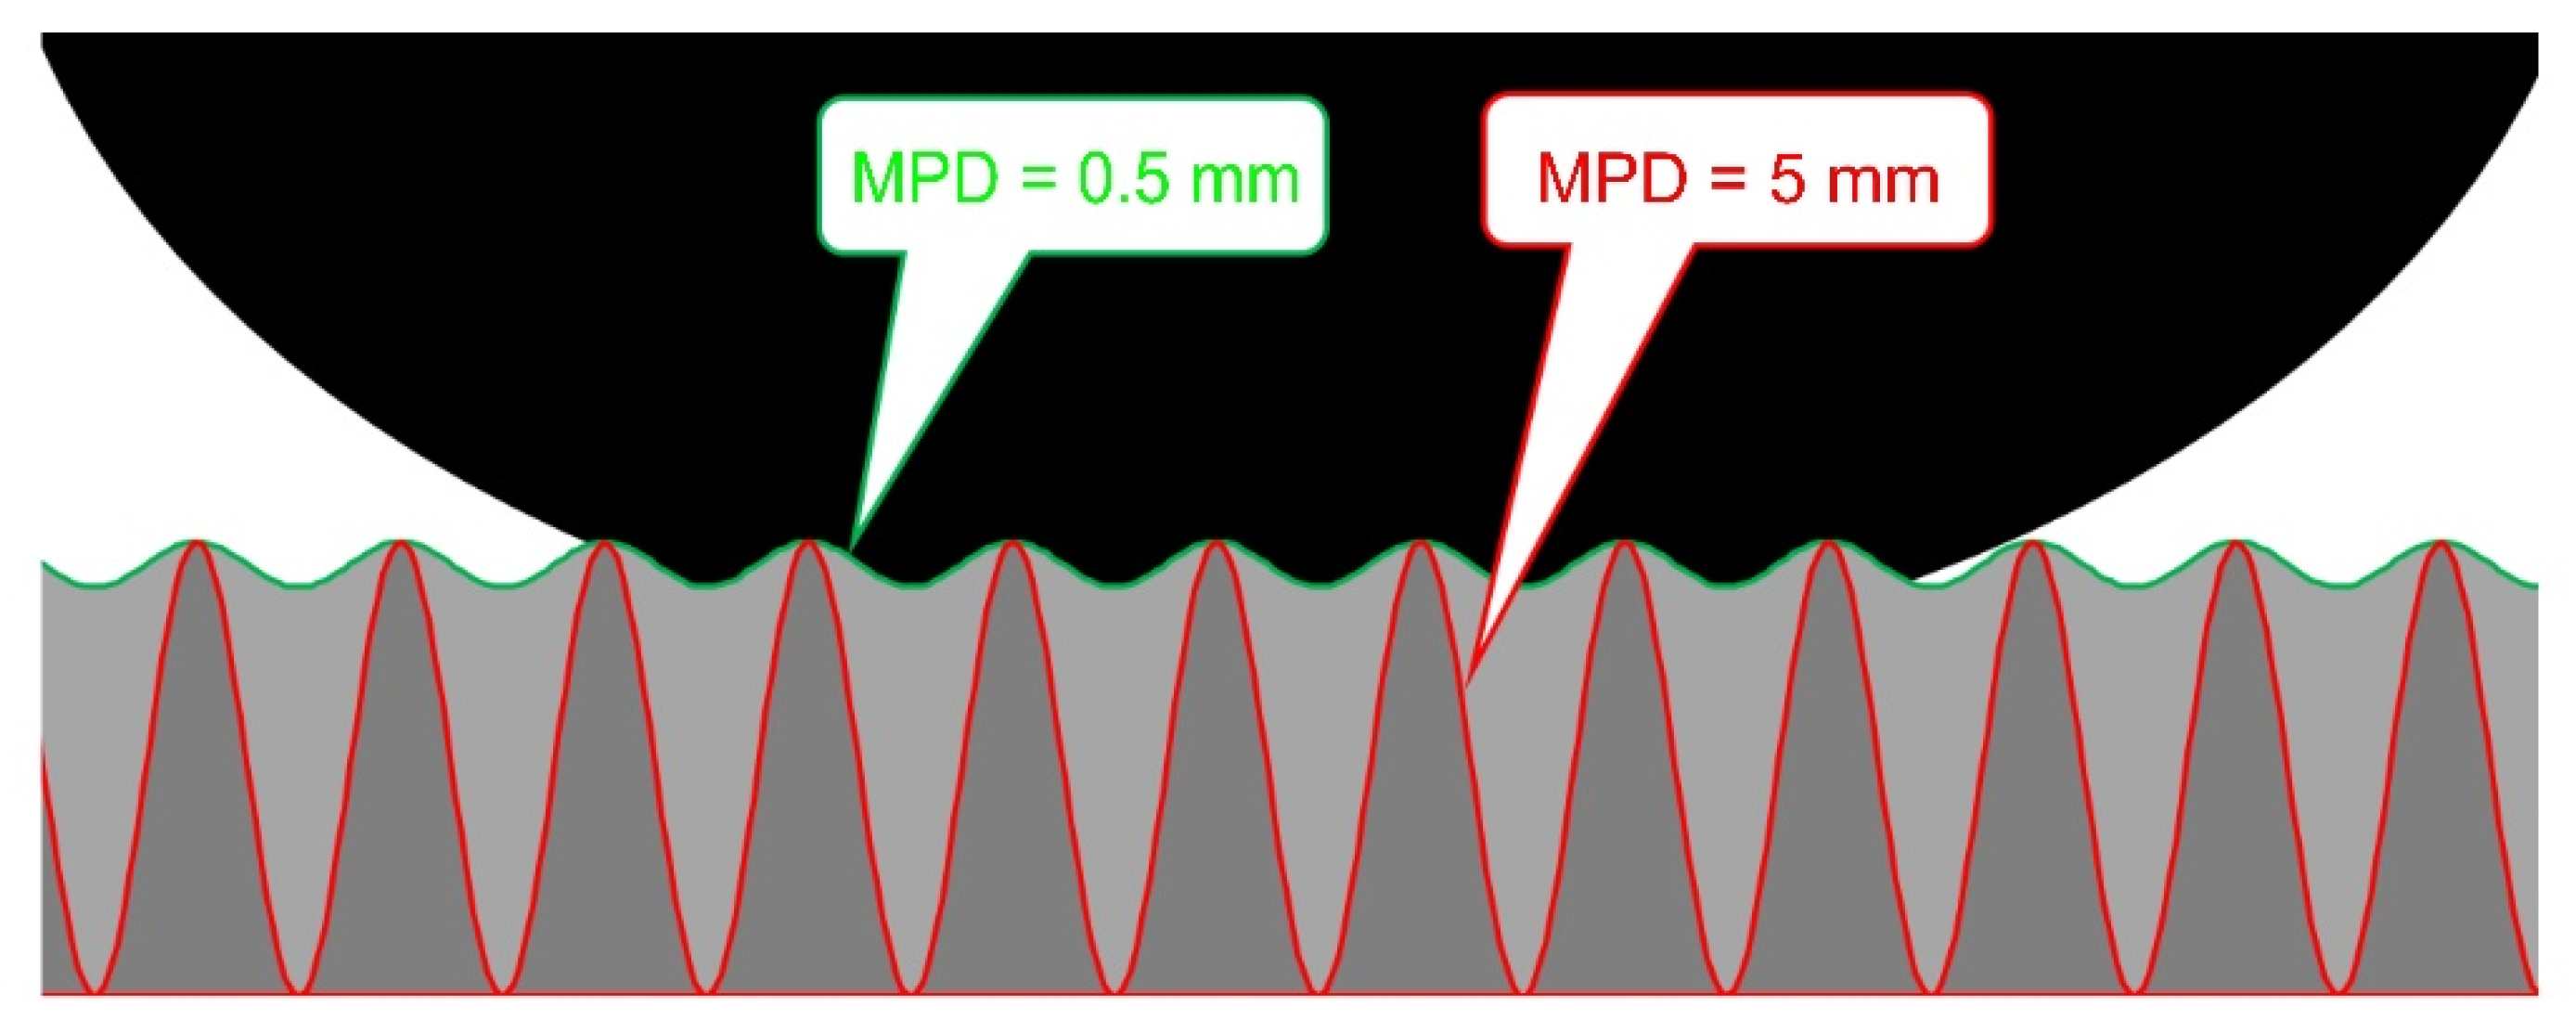
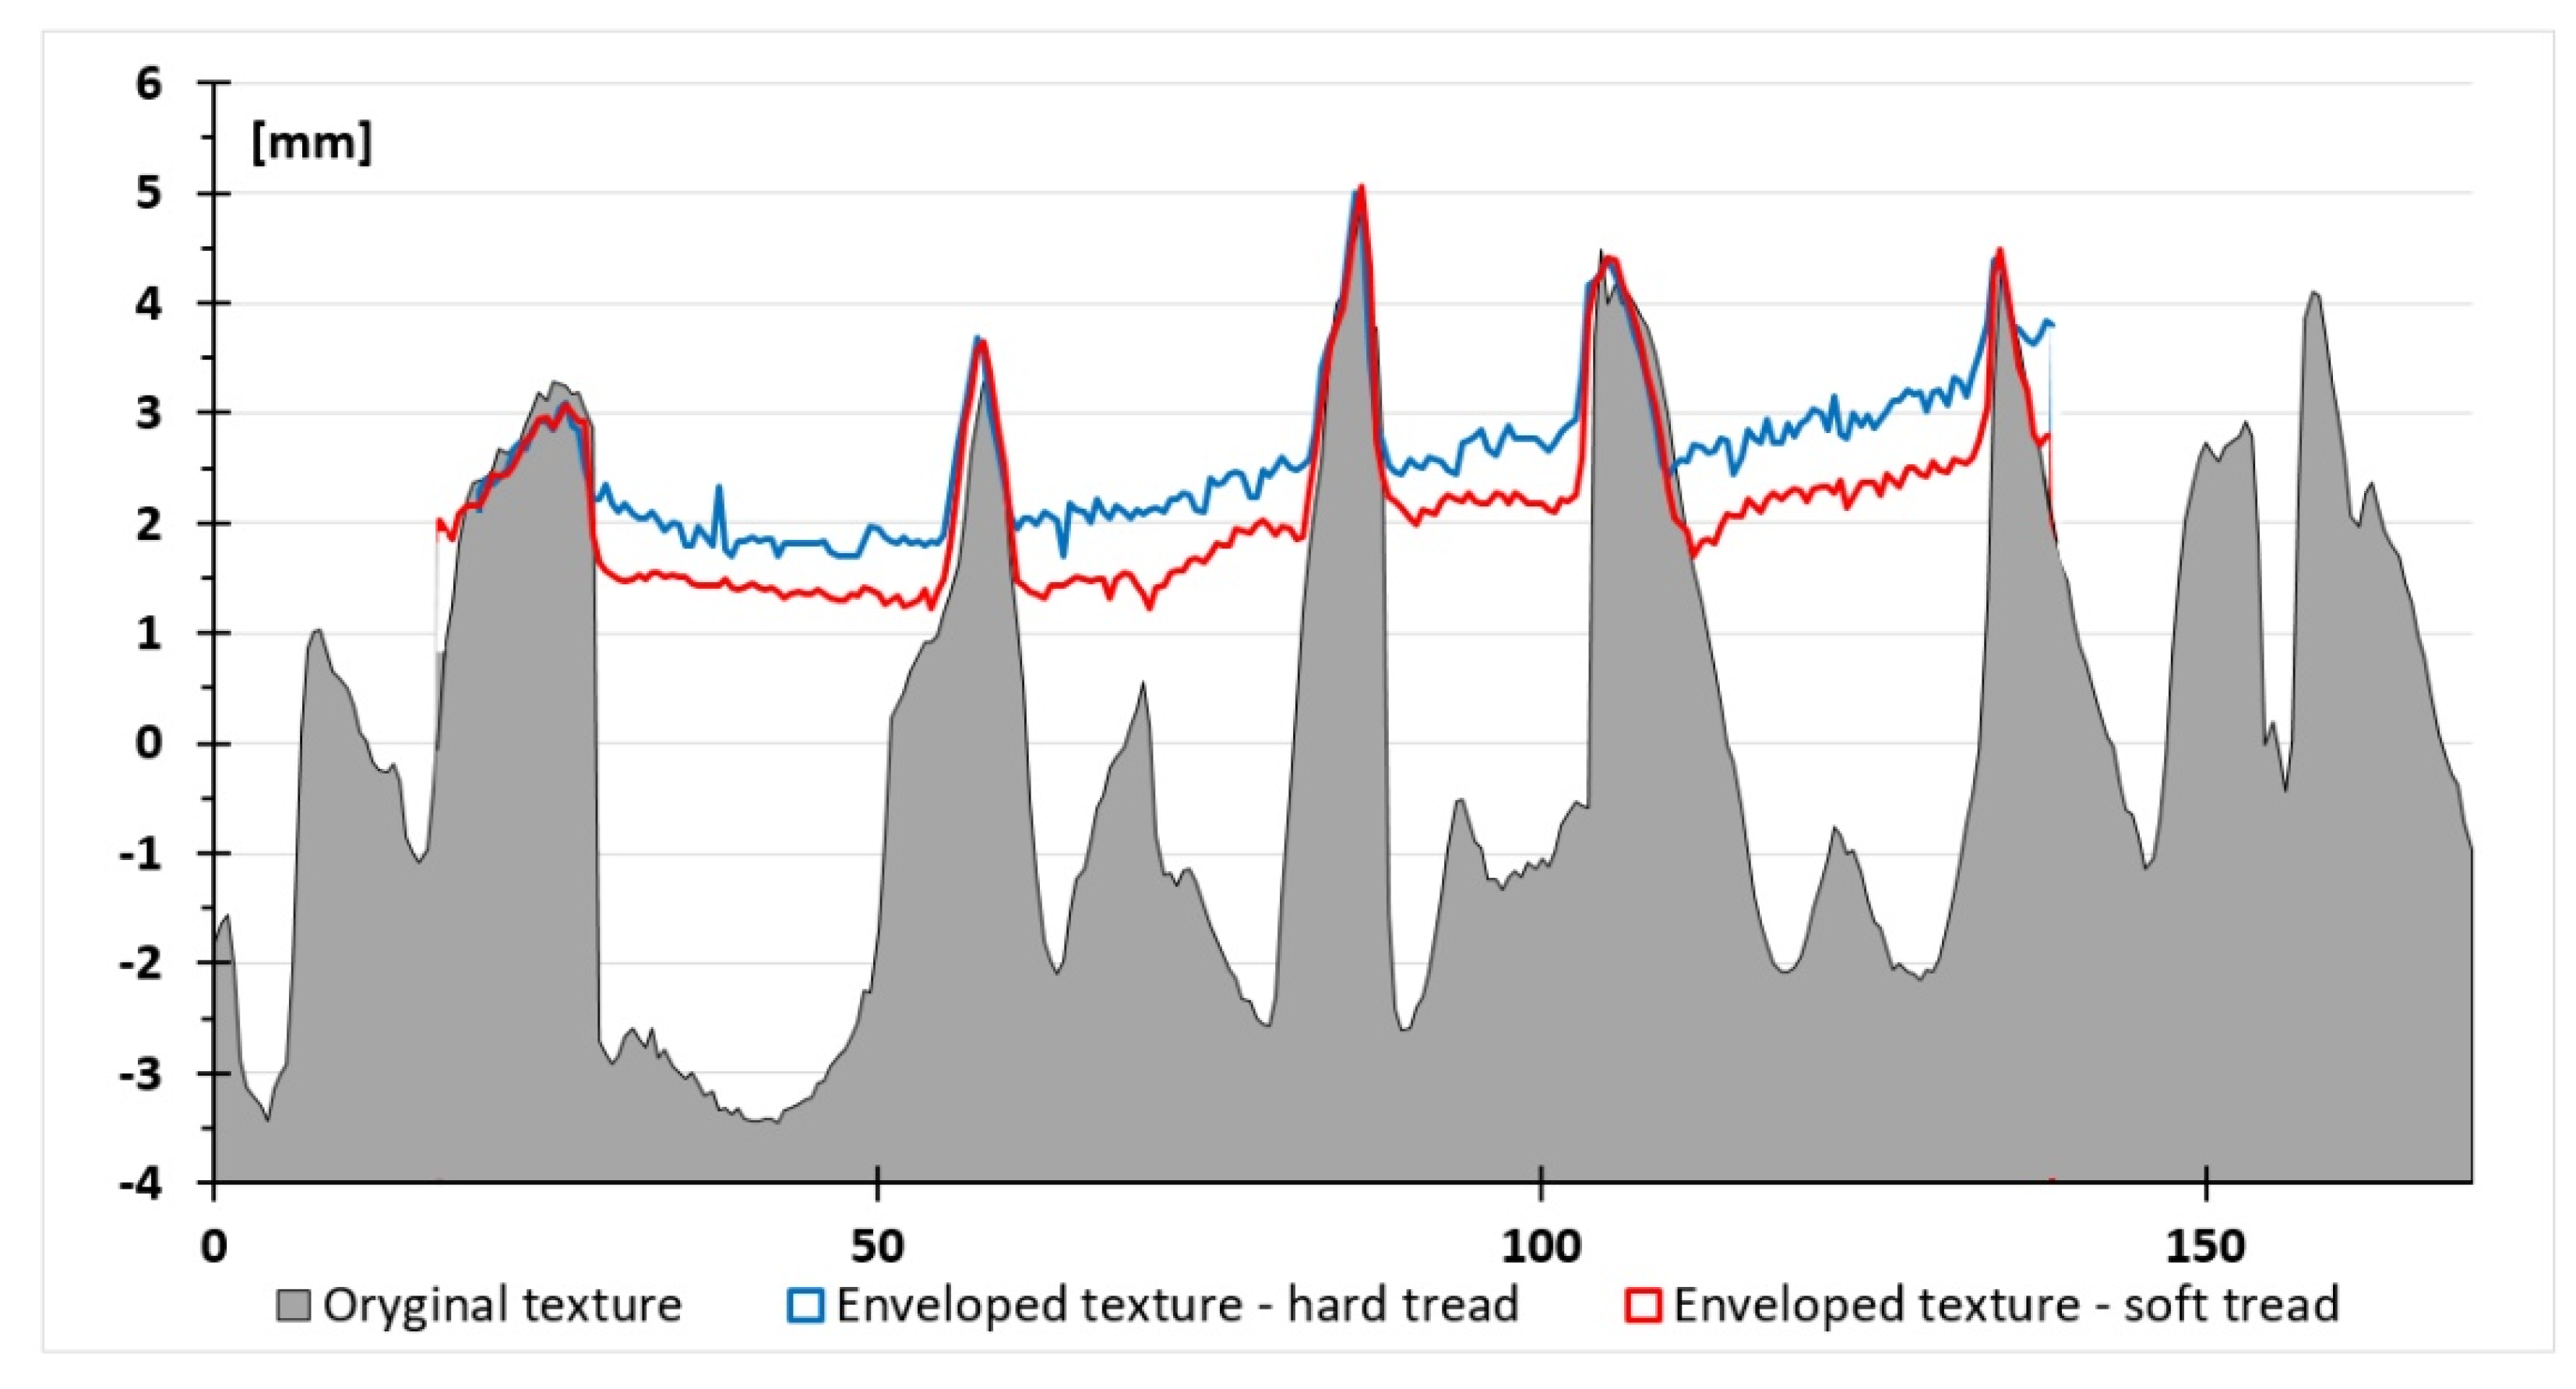
In
Figure 1 such exaggerated cases of enveloping are presented. The green profile represents a rather smooth pavement (MPD = 0.5 mm) that ascertains full contact with tire tread. The red profile represents a very “aggressive pavement” (MPD = 5 mm) that interacts with tread rubber only in the most elevated regions (summits). In this article, the authors use the term “aggressive pavement” to mean a pavement with high, positive texture [
13] dominated by summits not by pots, with harsh edges and sharp peaks of the aggregate. Such a surface usually shows very good friction, especially in wet conditions and when it is covered with a thin layer of ice or snow, but is noisy and has high rolling resistance. It seems reasonable to speculate that for rolling resistance, which is related to tire deformations, change of MPD (provided that the shape of peaks is similar) between these two extreme cases will not be important; thus, rolling resistance will not correlate with MPD.
The above statement, however, conflicts with observations of nearly all researchers [
9] that a certain correlation between those two parameters exists after all. According to research carried at the Gdansk University of Technology [
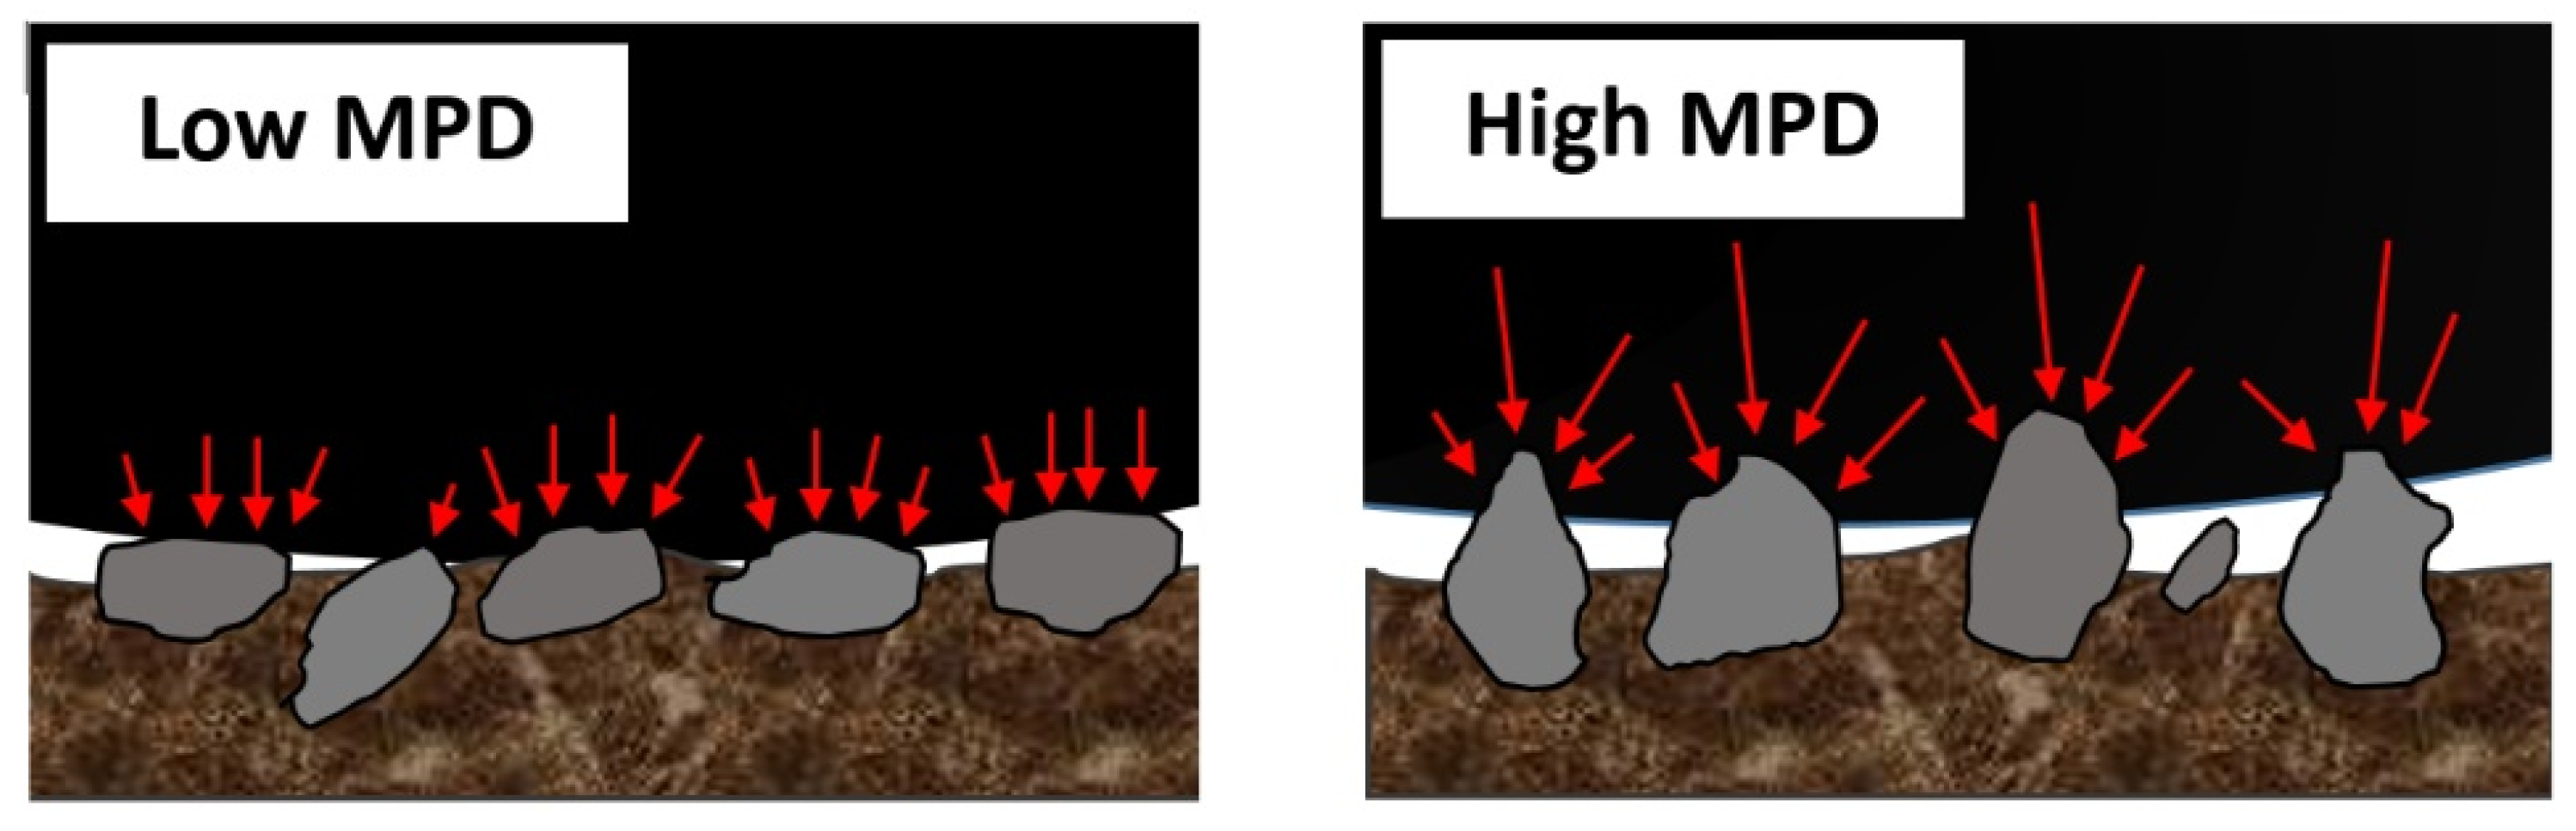
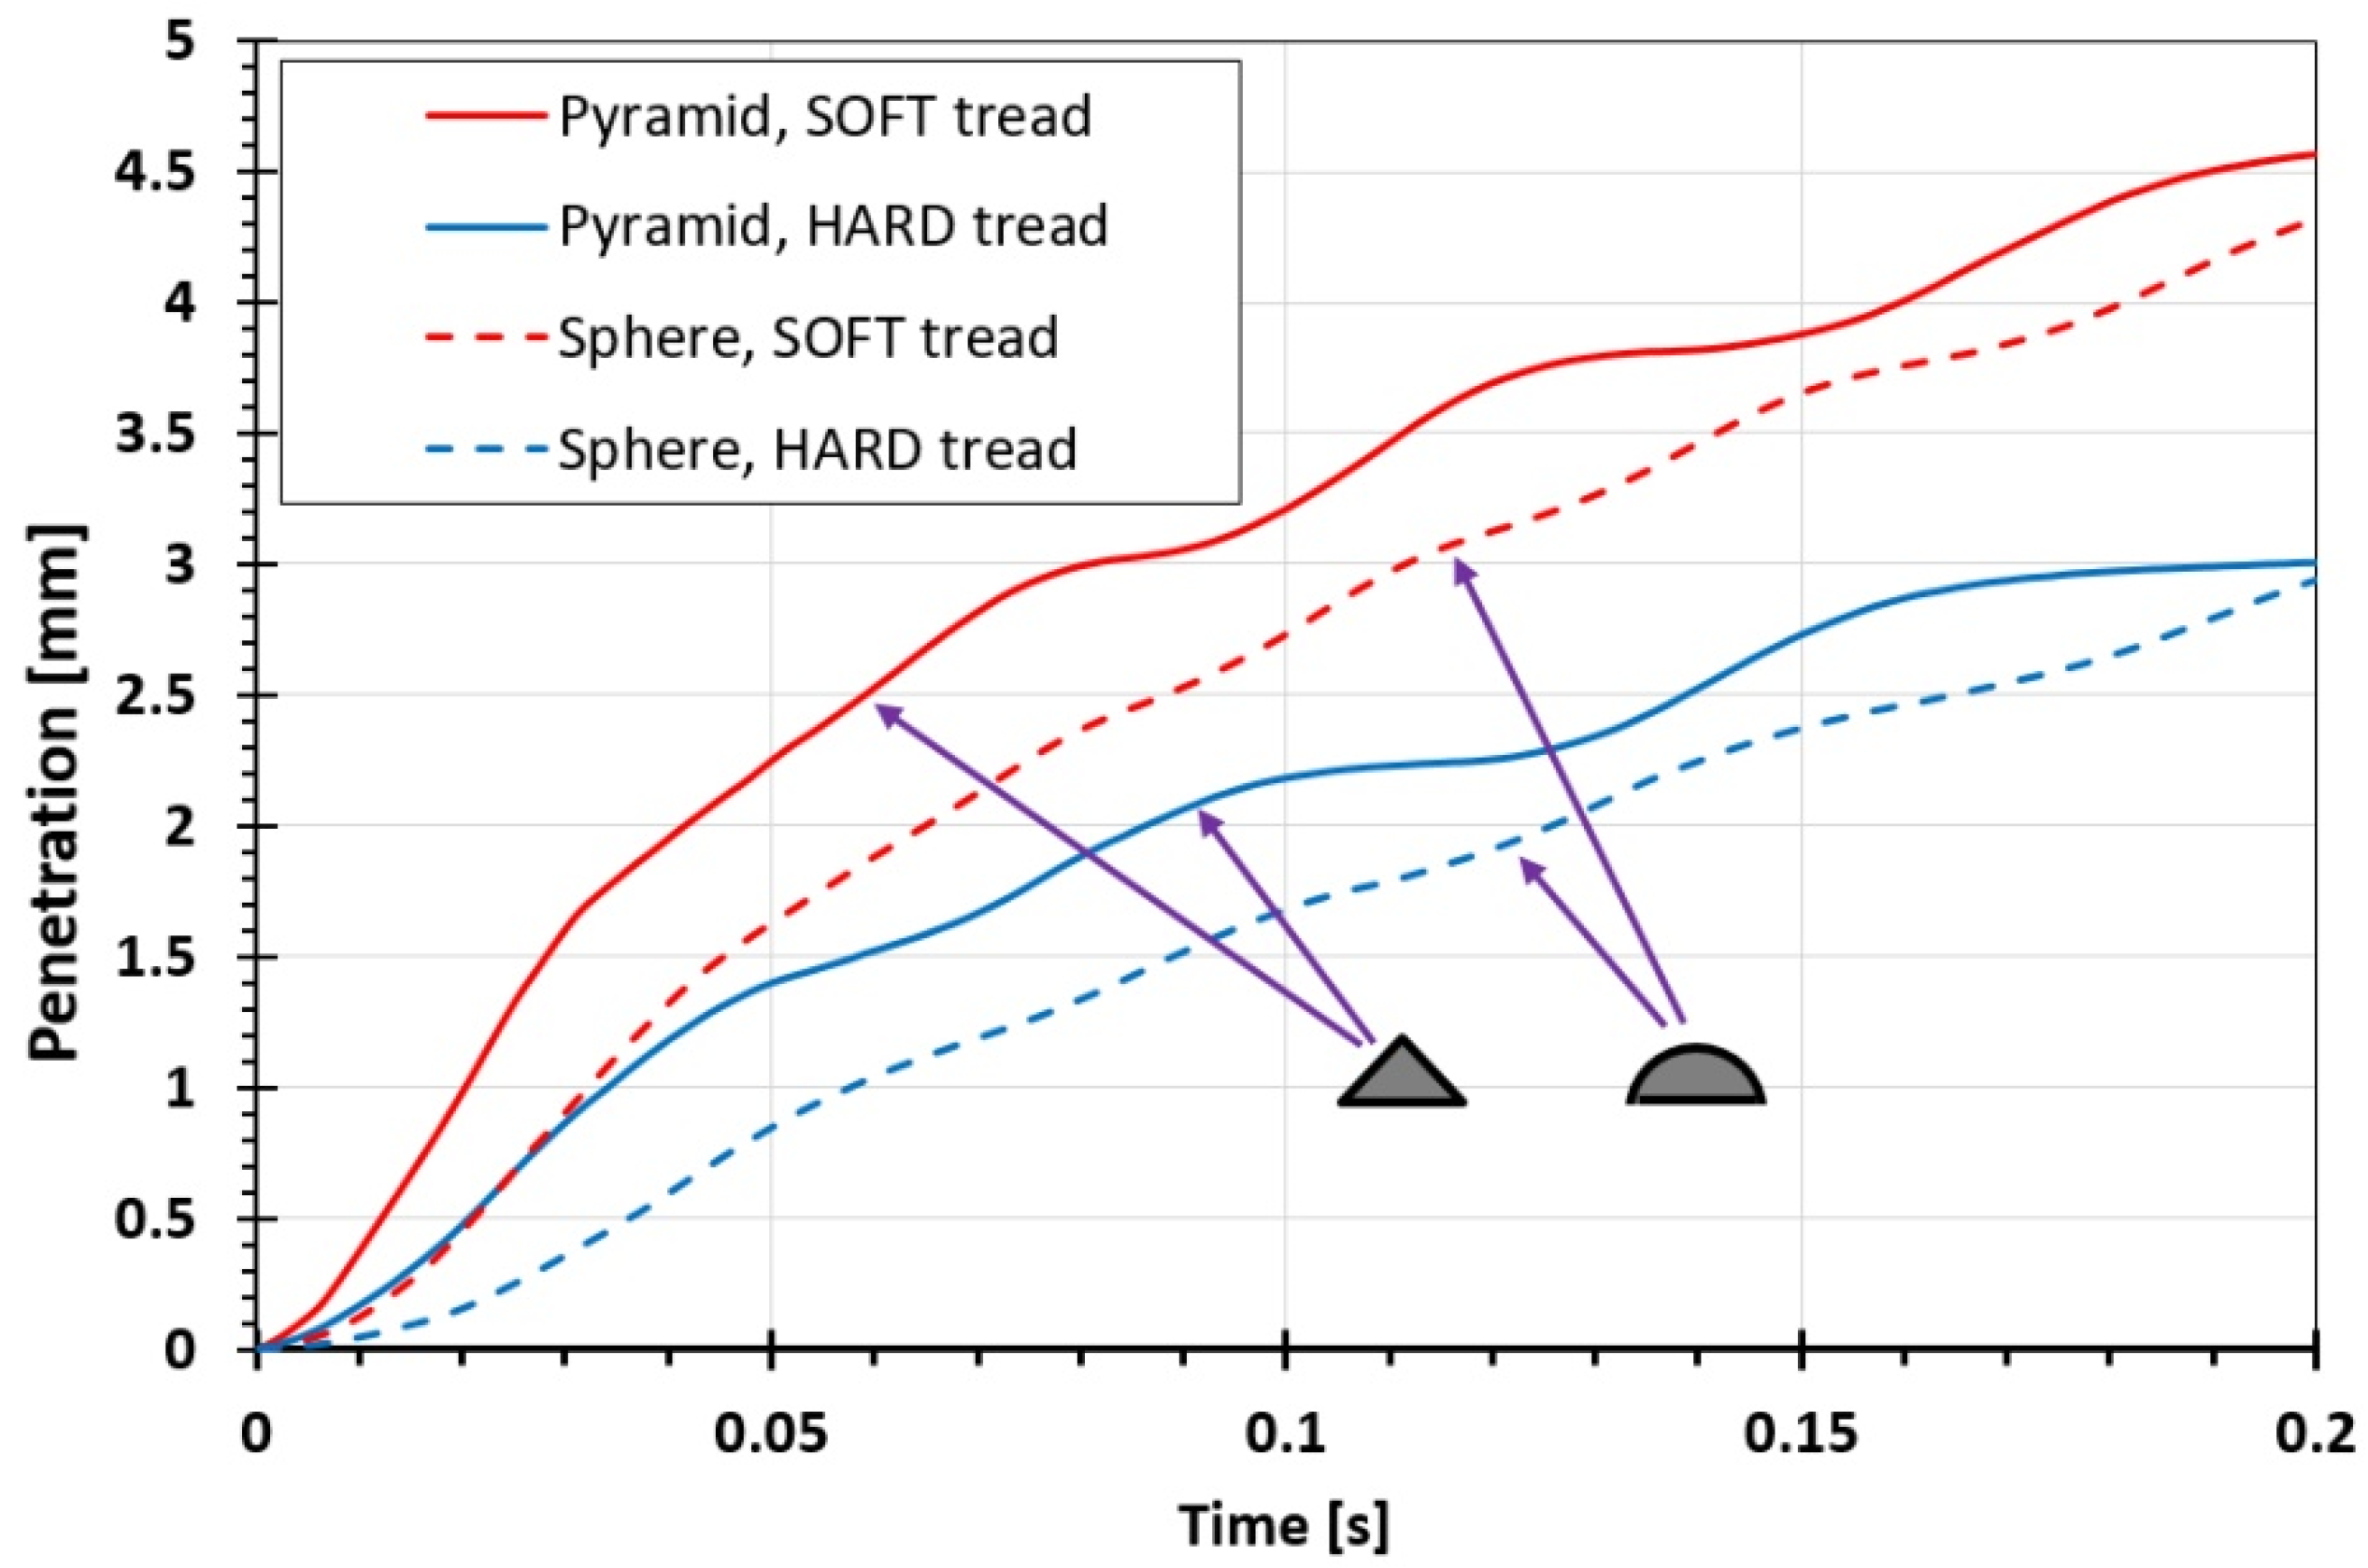
7] the correlation is, however, not just a simple result of higher MPD but it is caused by different shape of the “summit regions” of typical textures with high MPD (coarse pavements) in comparison to smooth pavements. Such aggressive pavements usually have sharp, widely spaced aggregate which, in order to transfer the pressure, penetrates the tread elements much more deeply. A lower contacting area and steeper slopes of the mineral aggregate edges cause local strains and deformations to be very high. Due to the hysteresis of the tread material and the nonlinear phenomena typical of it, the increase in deformation leads to substantial increase in energy losses, which results in increase of rolling resistance. This is visualized in
Figure 2. So, in the authors’ opinion, the increase of rolling resistance on pavements with high MPD is not due to the fact that the cavities (pits) are deeper and more specious but because the summits are sharper and less congested.
2. Materials and Methods
In order to determine the effect of texture on rolling resistance, it is necessary to conduct road and laboratory tests using surfaces with realistic textures. In the case of laboratory tests, the main difficulty is related to the fact that international standards [
14,
15,
16,
17] require testing on smooth steel drums so the vast majority of research institutions only have such devices. However, the Gdańsk University of Technology (GUT, Gdańsk, Poland) laboratory uses a roadwheel facility with an external drum with a diameter of 2.0 m on which replicas of road surfaces with matching texture can be mounted (see
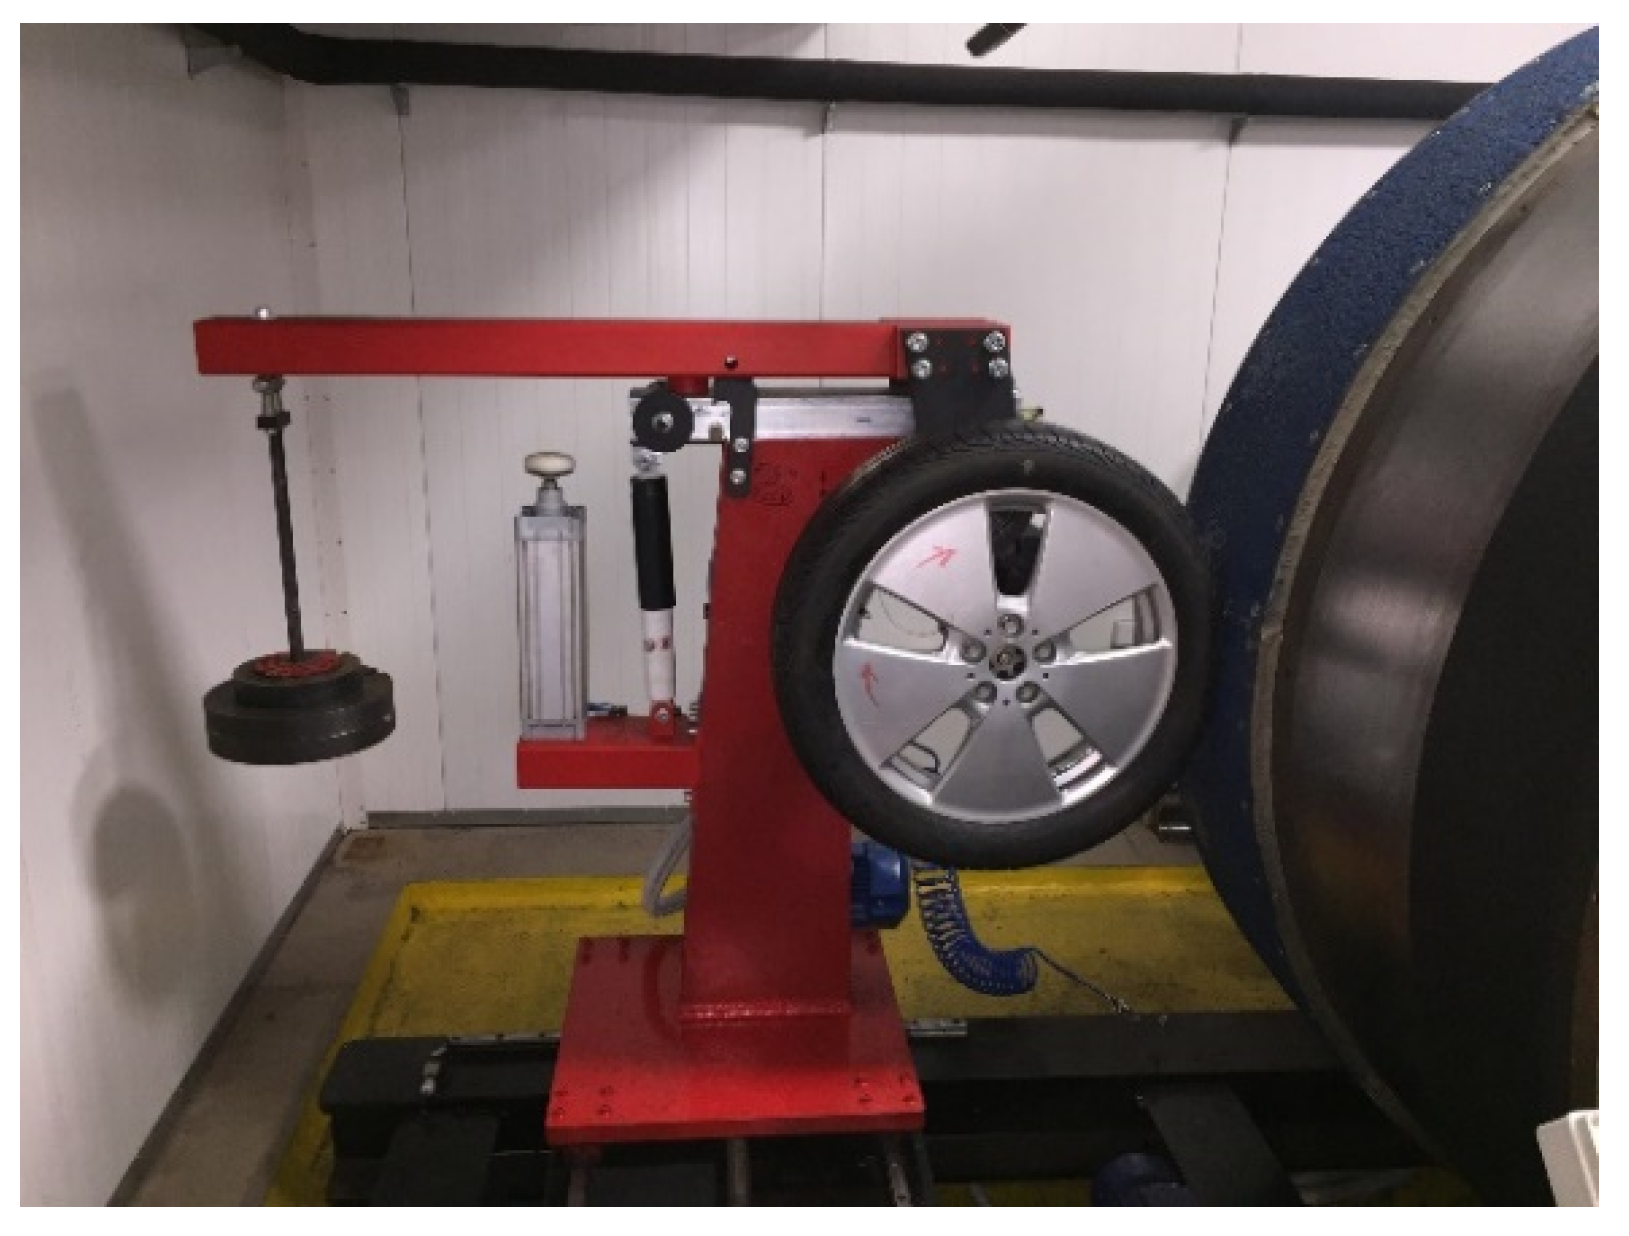
Figure 3). Thanks to this, a high degree of measurement representability is obtained, as the only serious disturbance of the tire/road interaction is the curvature of the drum. The facility is located in an isothermal chamber, which enables rolling resistance tests to be carried out at temperatures from −15 to +30 °C.
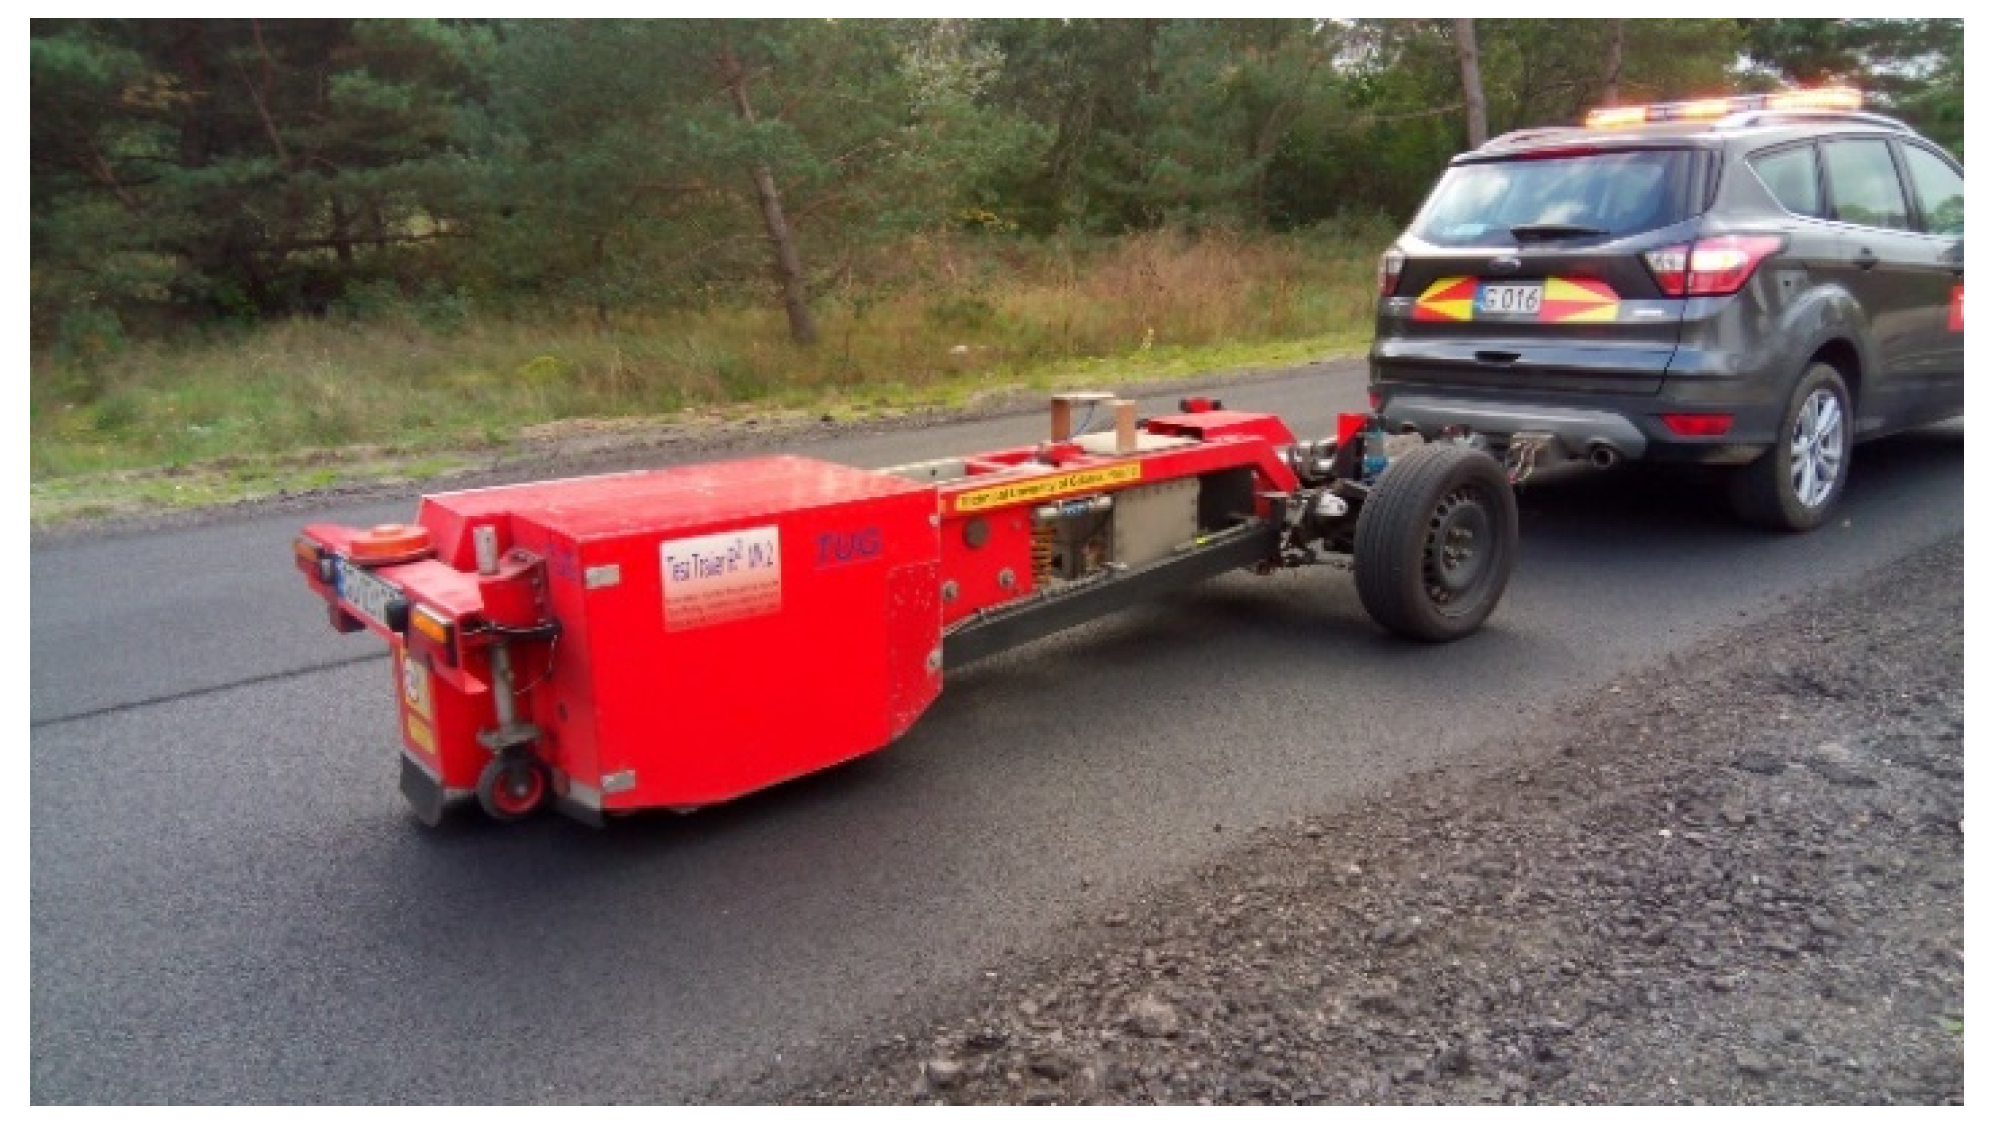
For road tests, however, more complex equipment is needed because the popular coast-down tests, used a long time ago, have questionable accuracy and are very impractical to carry out, at least on public roads. At GUT, a specialized R
2 Mk.2 test trailer (manufactured by GUT, Miami, FL, USA) is used for rolling resistance tests, which was specially made for this purpose and has very advanced systems, reducing the impact of unavoidable disturbances like road grade, speed deviations, ruts, etc. (see
Figure 4). There are only a few test trailers in the world that can measure rolling resistance, and the R
2 Mk.2 trailer is possibly the most technically advanced and efficient [
18].
The oscillatory engineering method, which is described in [
19], can also be used to roughly evaluate the influence of pavement texture on the rolling resistance. This method examines the oscillations generated after the tire is dropped onto the surface sample (see
Figure 5). Energy dissipation during cyclic tire deflections causes decay of oscillations, which may be used as a specific measure of rolling resistance. This method has been used for some of the experiments described in this article.
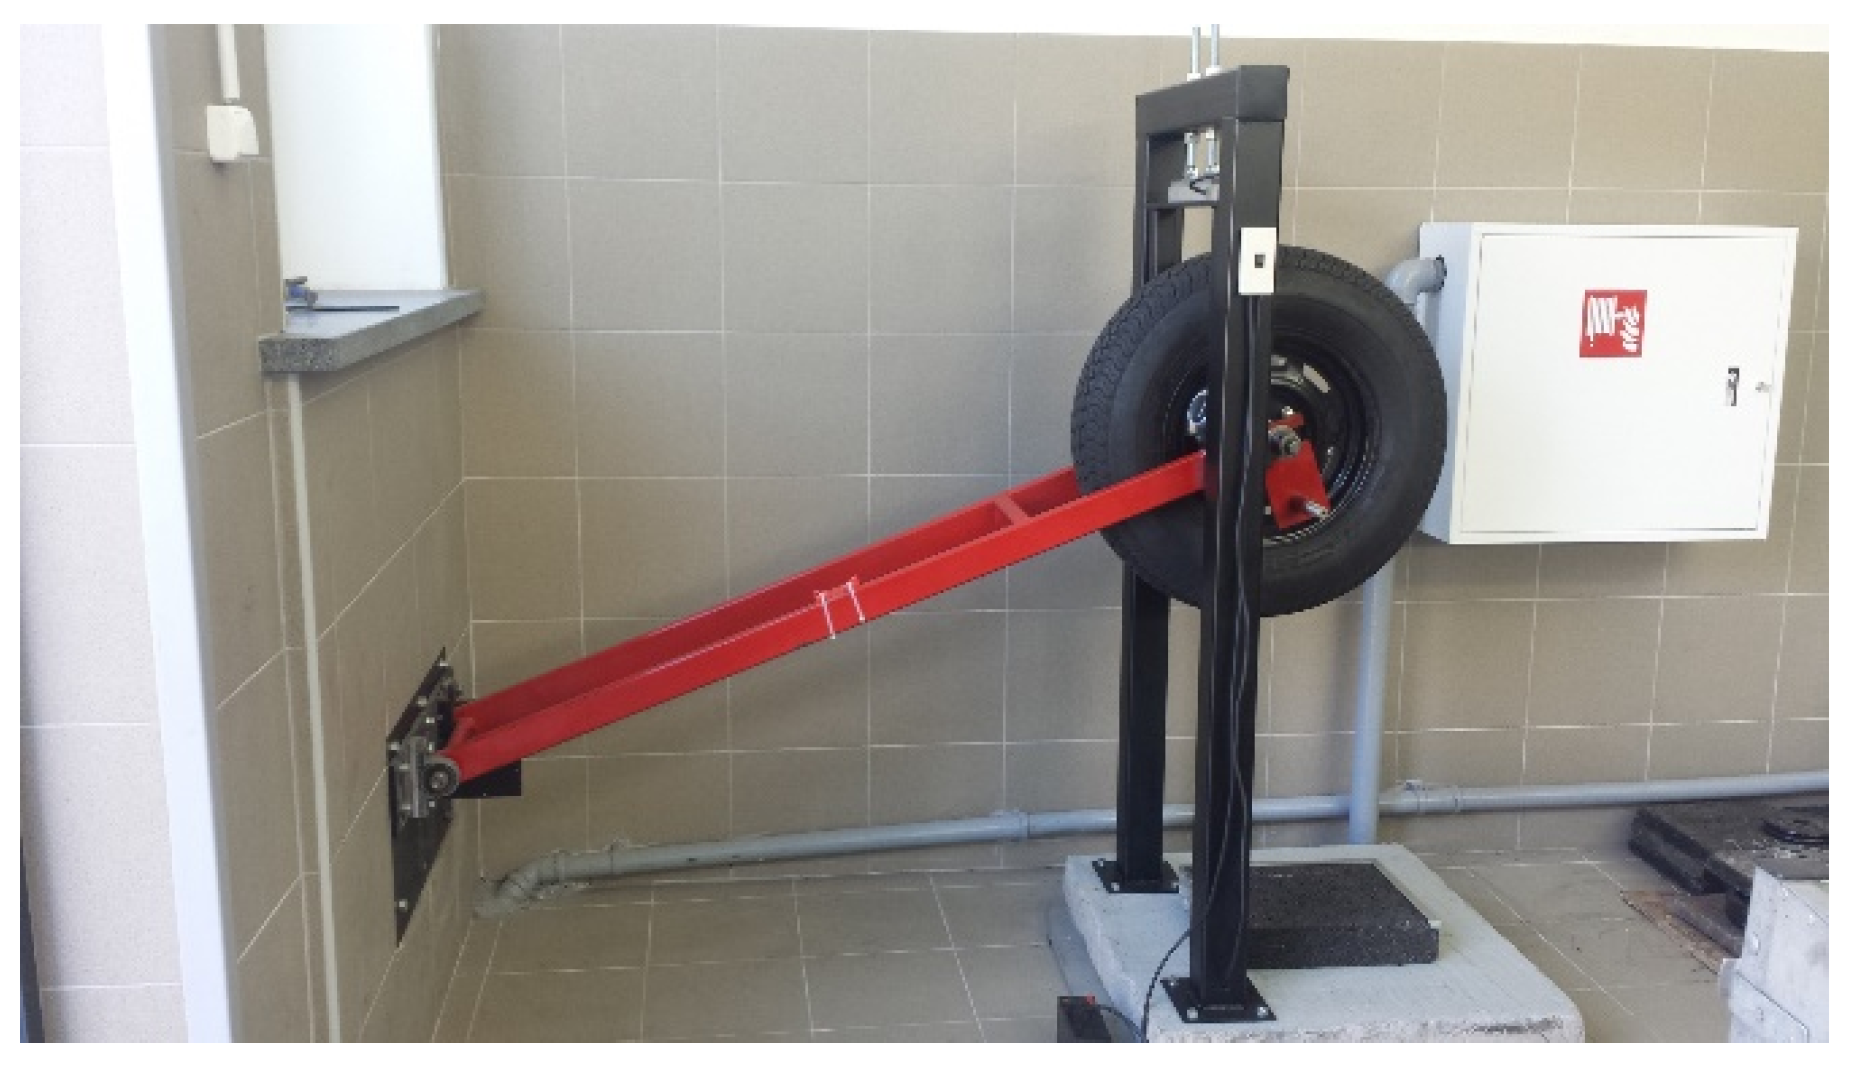
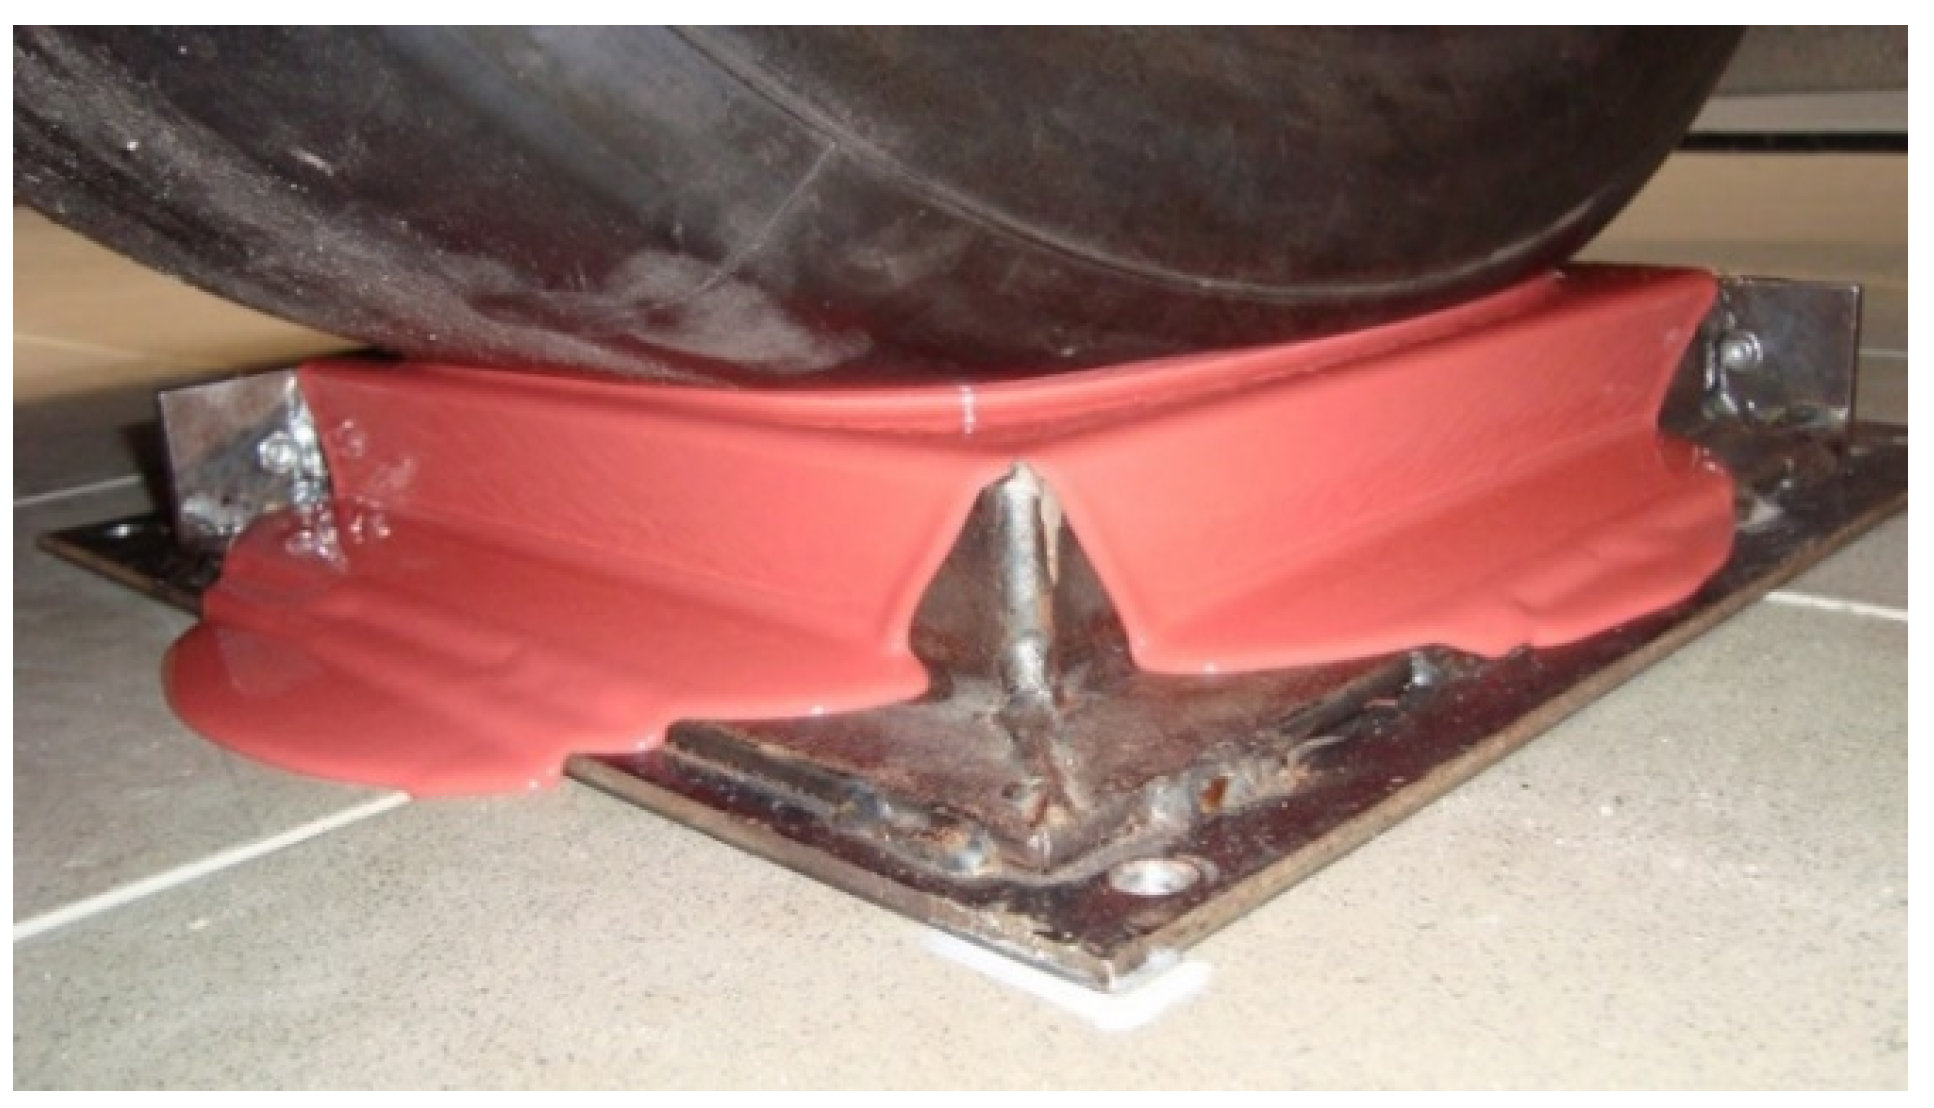
In order to test the tread rubber enveloping texture of a given road pavement it is necessary to use special, non-standard test methods. The methods based on pressure-sensitive film do not allow for the 3-D observation of the contact zone of the tire with the road surface and are practically useless on more aggressive surfaces, such as surface dressing, because the film is pierced by the sharp edges of the aggregate. For the needs of such tests, a special method was developed at GUT, based on casting an imprint of the tire/road contact in self-vulcanizing rubber.
The tested road surface is covered with a liquid, low-viscosity, self-vulcanizing rubber, which is extruded by the tire pressed against the pavement by a given load (exactly in the same way as rainwater is extruded from the tire/pavement footpath). The rubber is in a liquid state and the hardening process takes over an hour, so the rubber does not carry any load as it can flow out freely. As a consequence, the tire only rests on the rigid road surface and rubber remains only in places where there is no tire/pavement contact. After the rubber has hardened and the tire has been removed from the casting, fragments that were in direct contact with the tire protrude from the hardened rubber plane where there was no such contact. The method can be applied to virtually all types of road surfaces. In very few cases, it may be necessary to assist in displacing the liquid rubber by drilling drainage holes through the pits of the pavement sample.
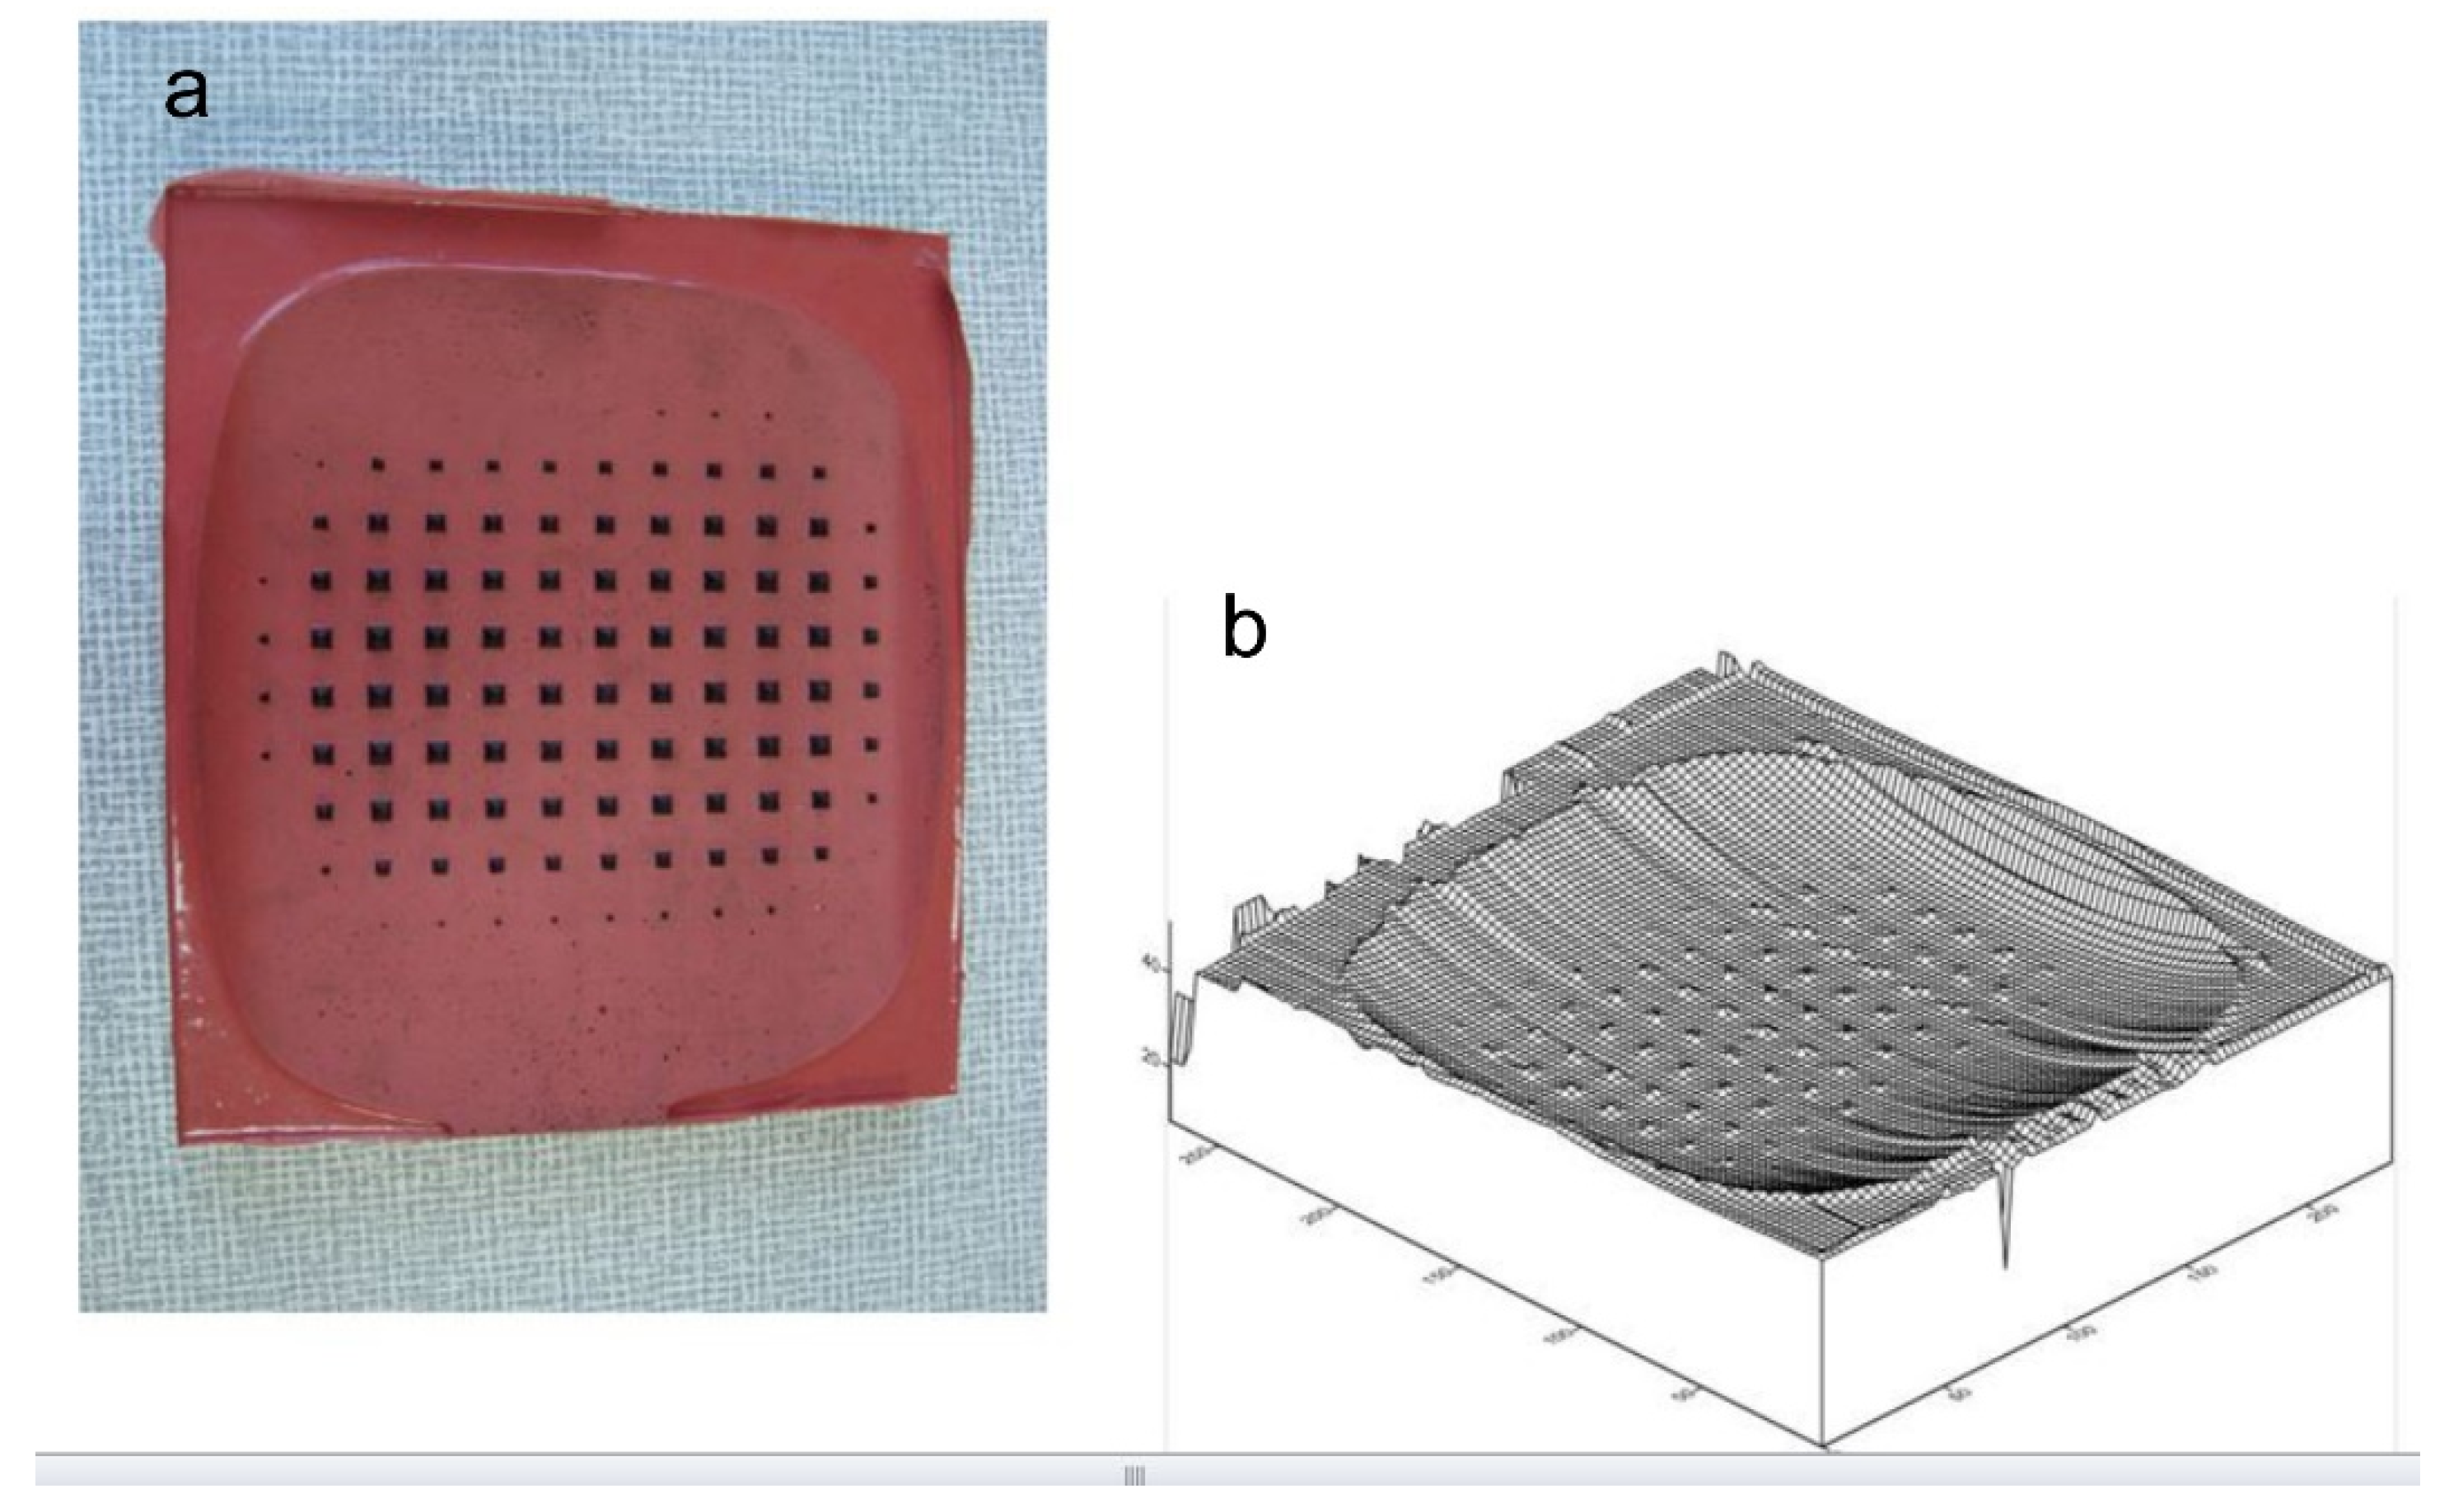
Figure 6 shows the process of obtaining castings and
Figure 7 shows a cast made on an artificial pavement consisting of evenly spaced pyramids.
An advantage of this method is its great simplicity and the possibility of preserving the shapes of contact deformations of the tire tread, which can then be analyzed qualitatively and quantitatively. The most important disadvantage of the method is that static deformations that are registered might not necessarily be the same as in the case of driving, when the interface between the tire and the road is very short-lived and the tread material does not have time to fully settle on the pavement (tread rubber has hysteresis depending on excitation frequency). Nevertheless, in the opinion of the authors, the advantages of the method outweigh its disadvantages.
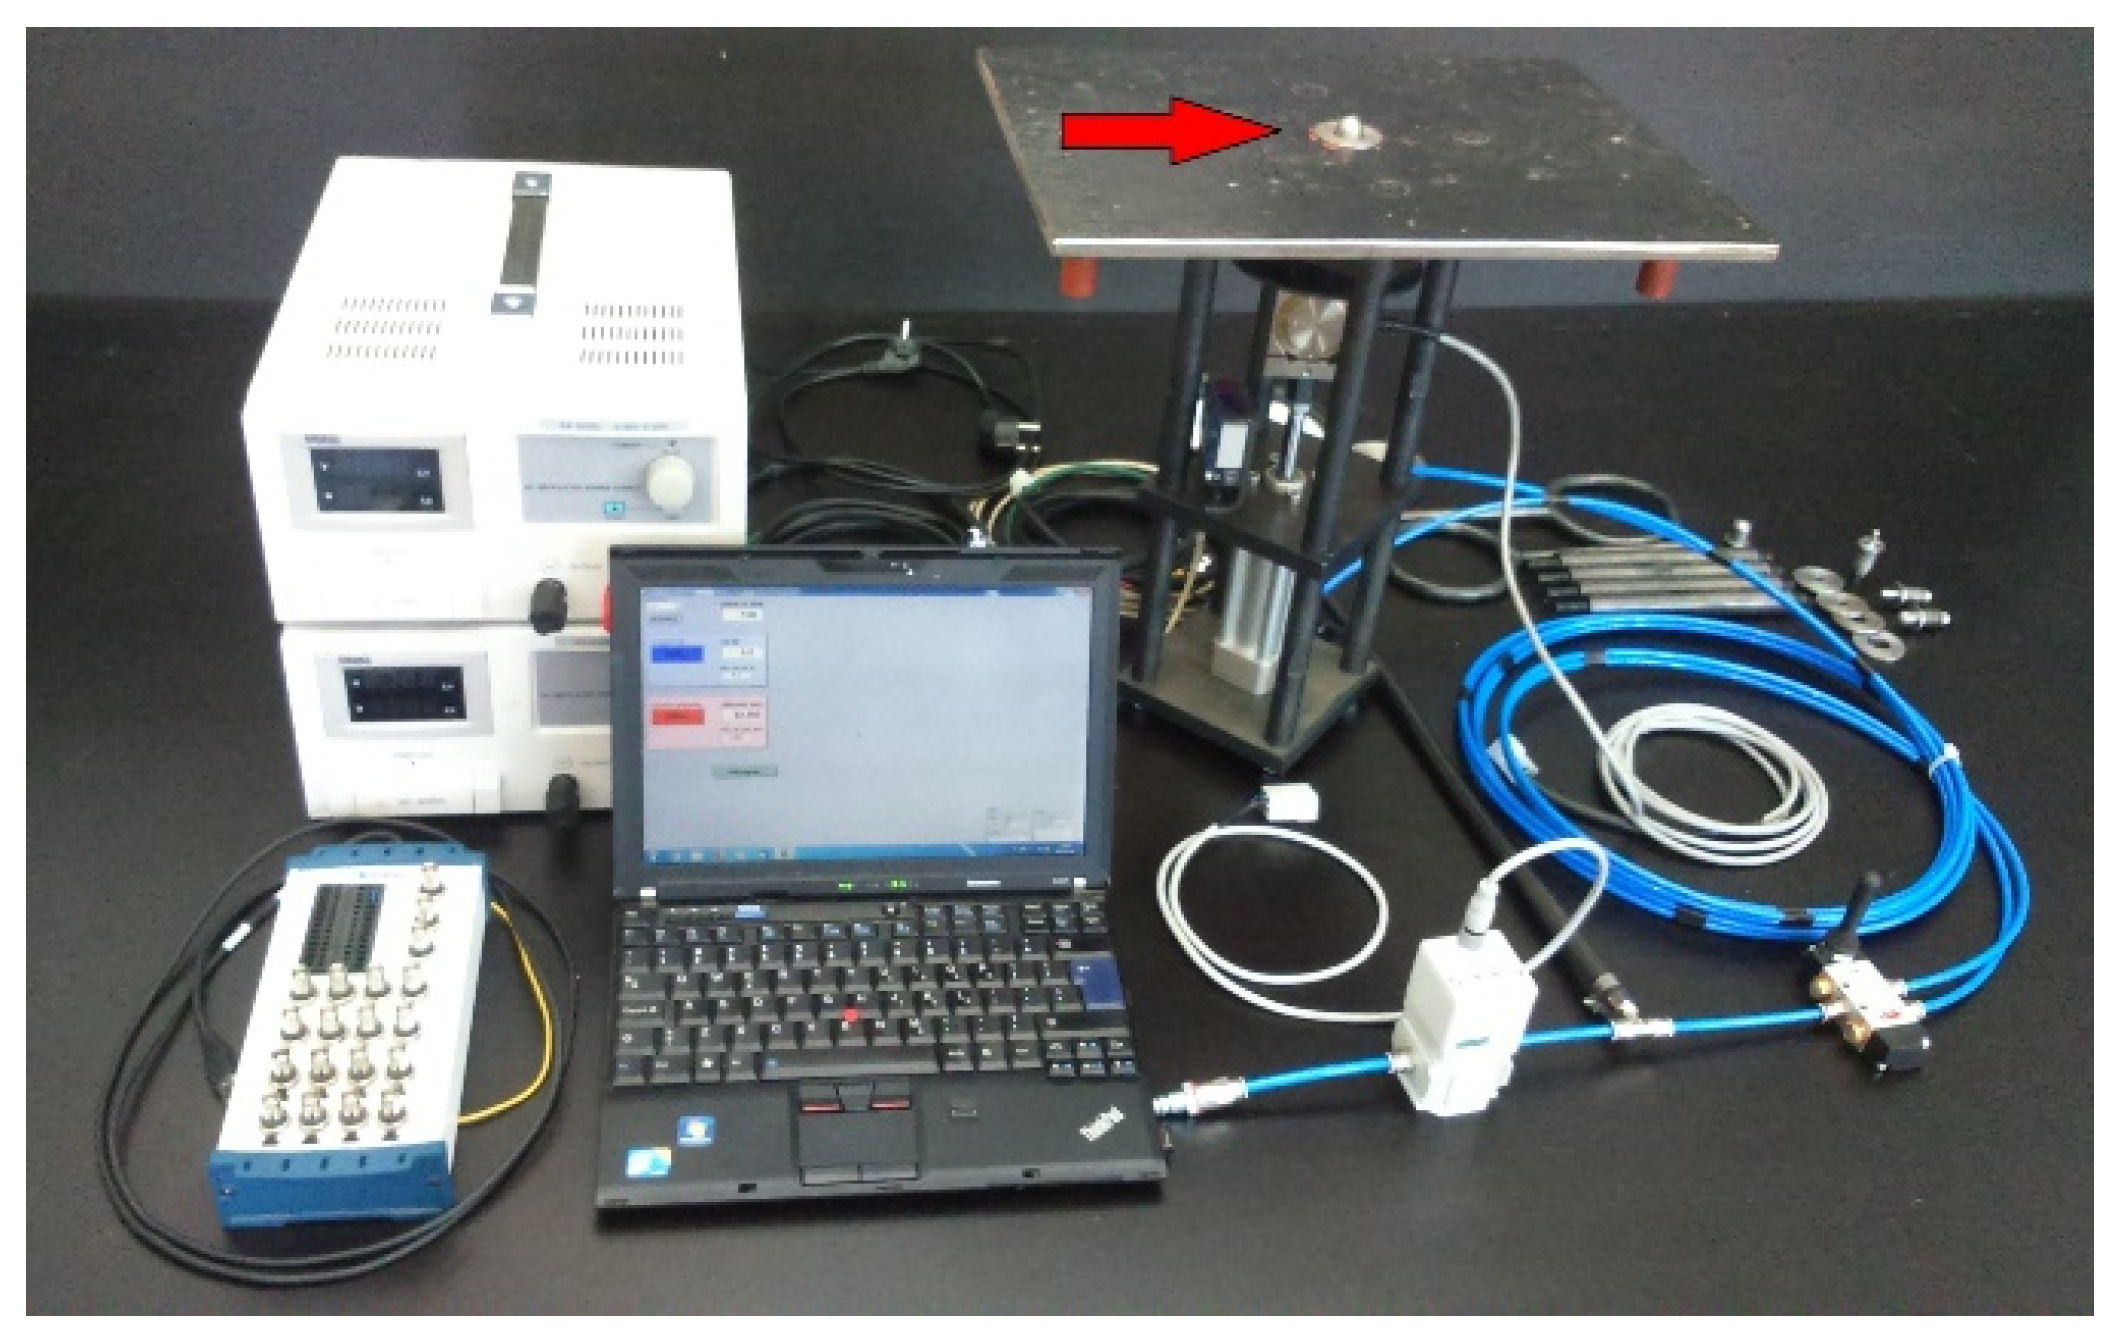
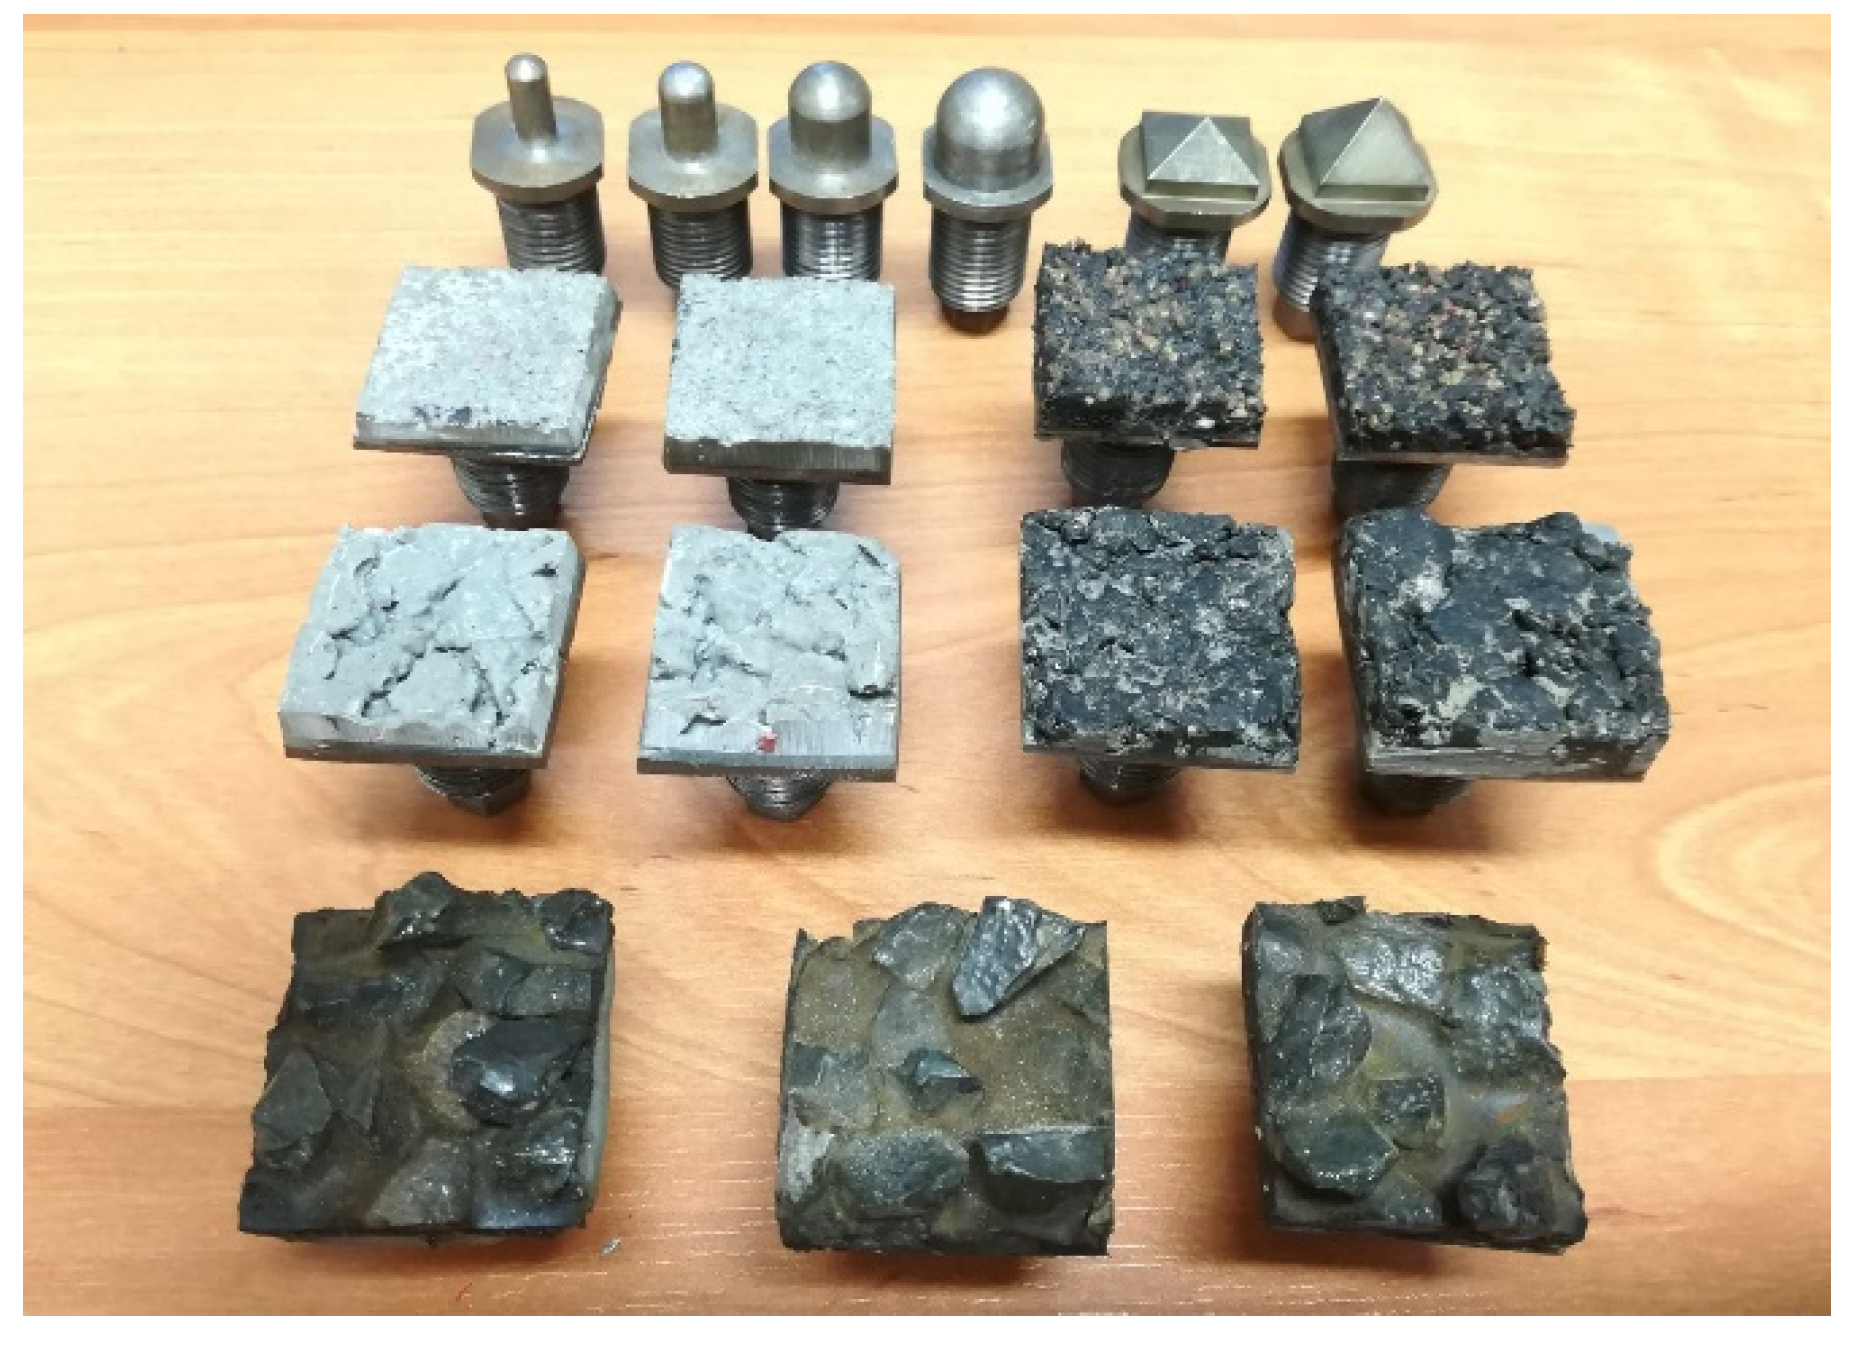
In order to determine the time characteristics of the tire tread deformation process forced by the pavement protrusions, a special device was developed (see
Figure 8), in which a pneumatic actuator drives a penetrator of a given shape into the tread of a tire resting on a flat steel plate (the penetrator is marked with an arrow in the figure). It is possible to change the shape of the penetrator and even to use penetrators made of small fragments of the actual road surface (see
Figure 9). Thanks to this device it is possible to determine the relationship between the force acting on the penetrator and depths of rubber deflection, and how quickly the rubber deforms.
The applied pneumatic system provides a relatively high speed of free penetrator extension which is comparable to the speed with which the protrusions of the pavement are pressed into the rubber of the tread at slow speed driving.
4. Discussion
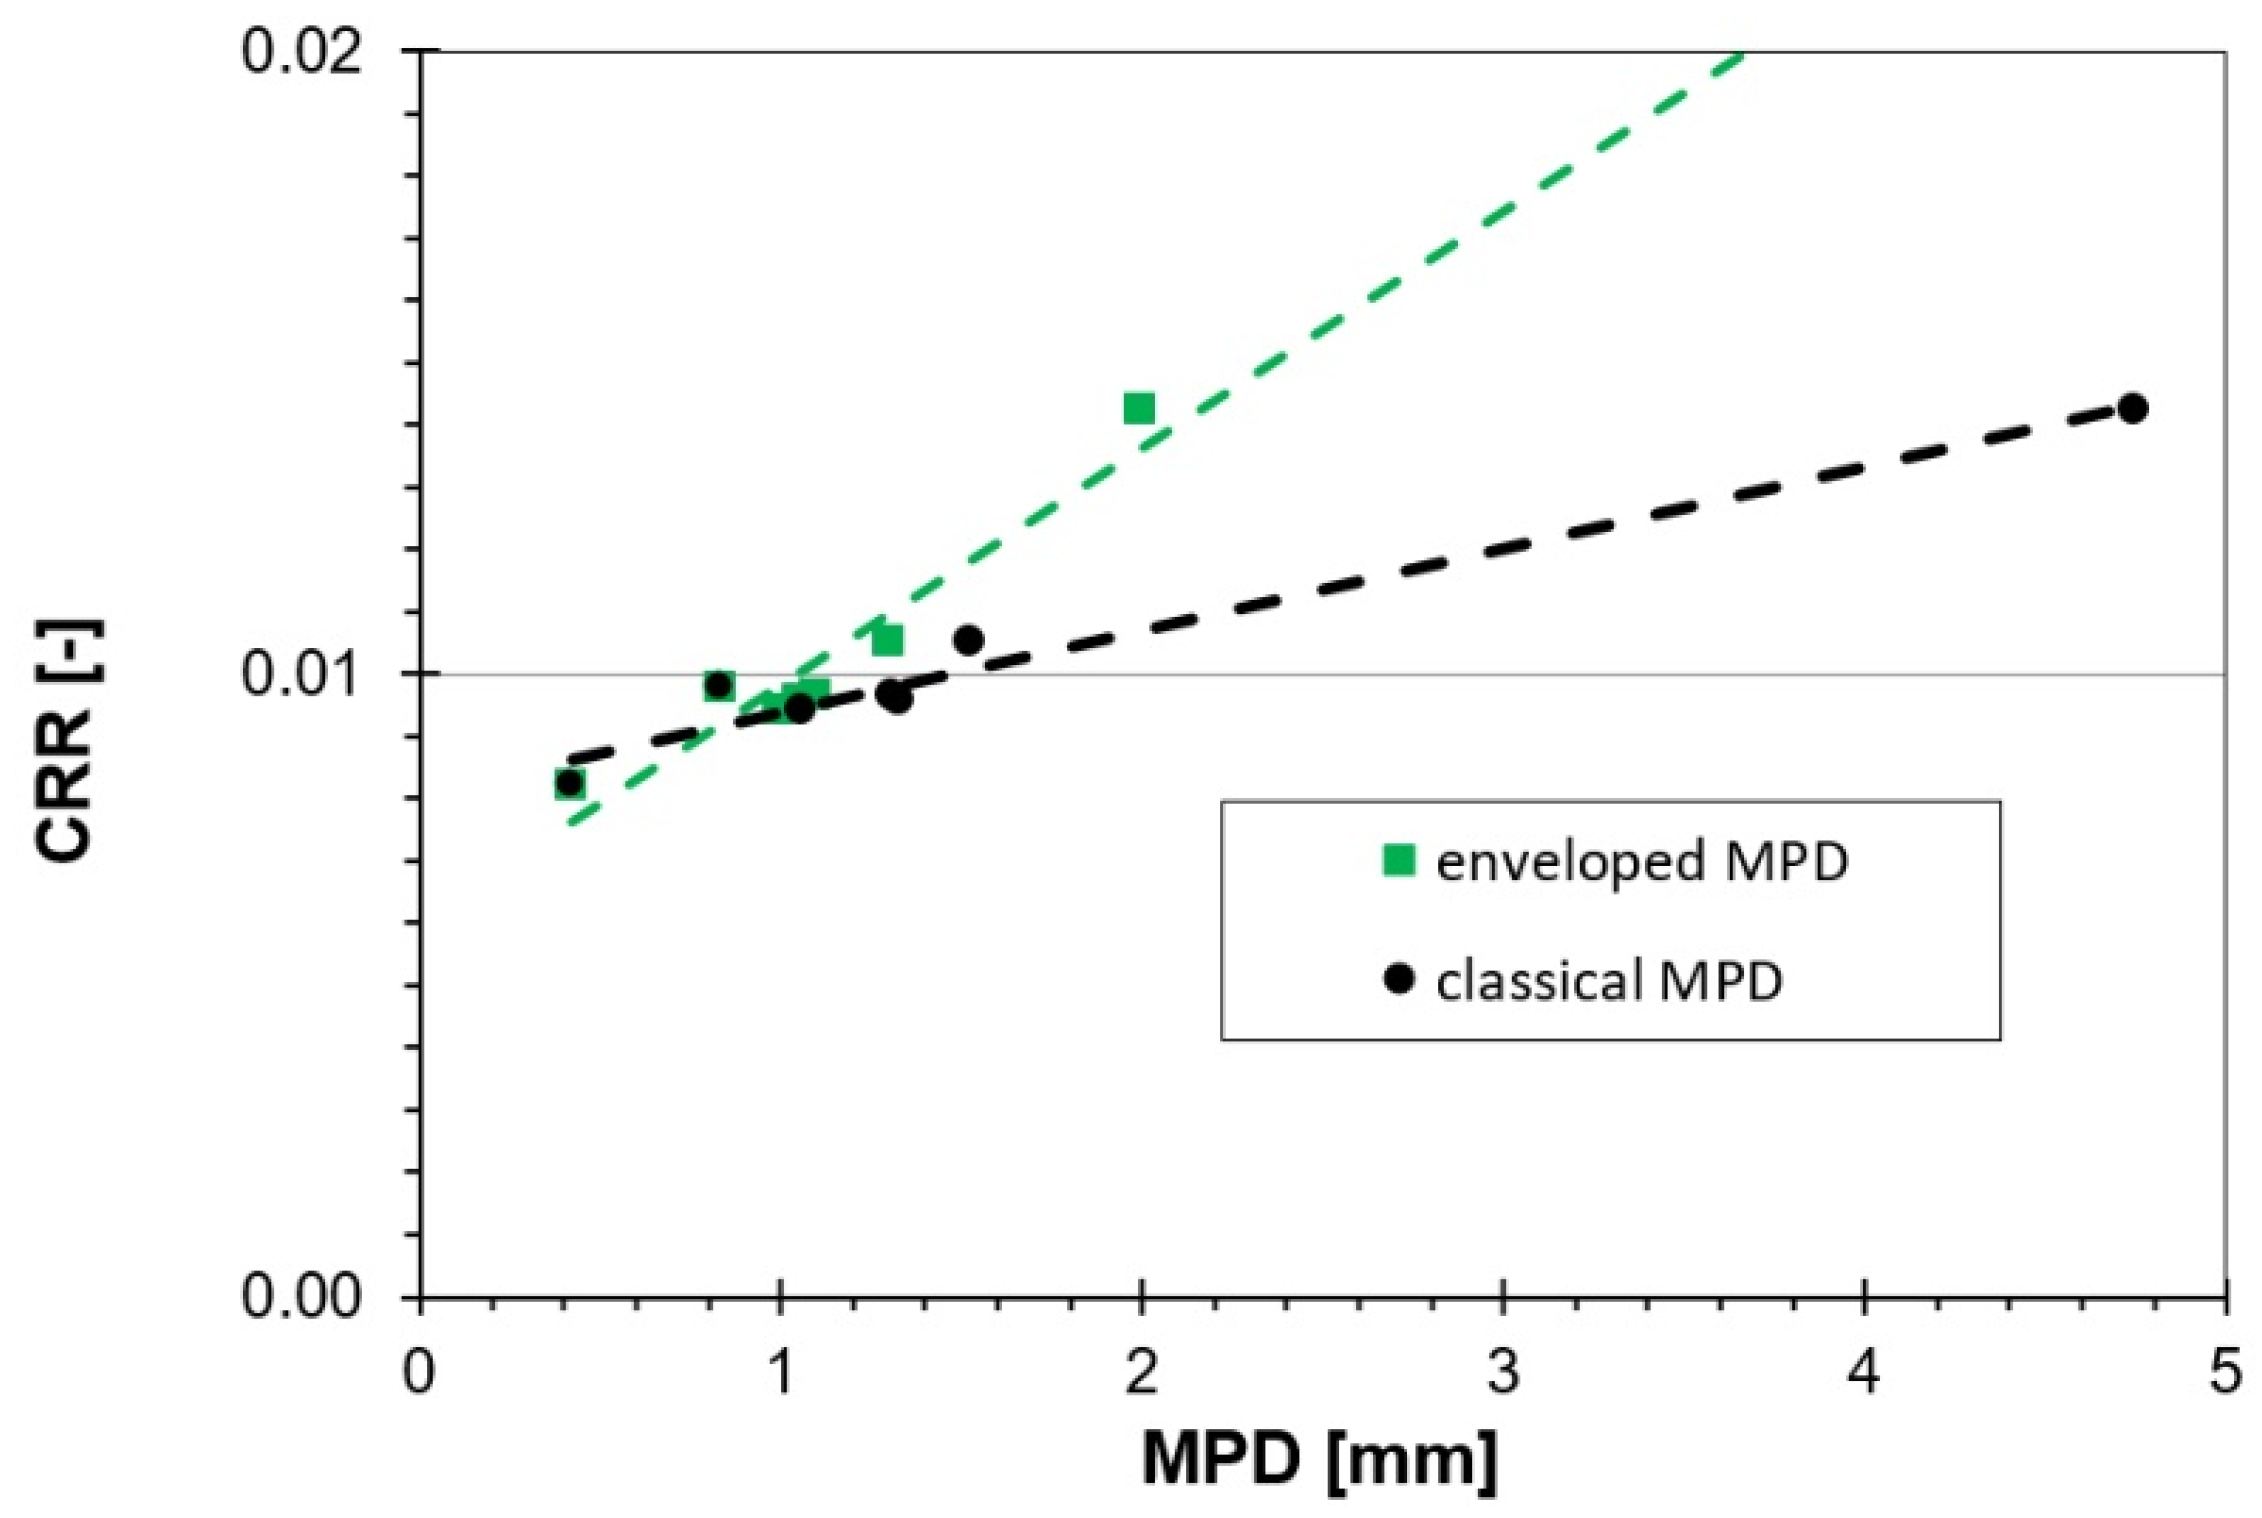
Due to the fact that the research presented in this article is a “pilot study” it is not possible to unequivocally define how the optimal, easy to evaluate parameter describing pavement influence on rolling resistance should look. As can be seen from the considerations presented above, the rolling resistance cannot correlate well with the MPD evaluated in a classical way, as the tire in most cases only partially envelops the pavement texture. The conducted experiments showed that experimental estimation of the enveloped MPD is possible and that it allows elimination of those texture regions that do not come into contact with the tire. Although the method of making rubber castings is laborious, it allows for a more realistic estimate of the enveloped MPD value, just as in the way the tire “feels” it.
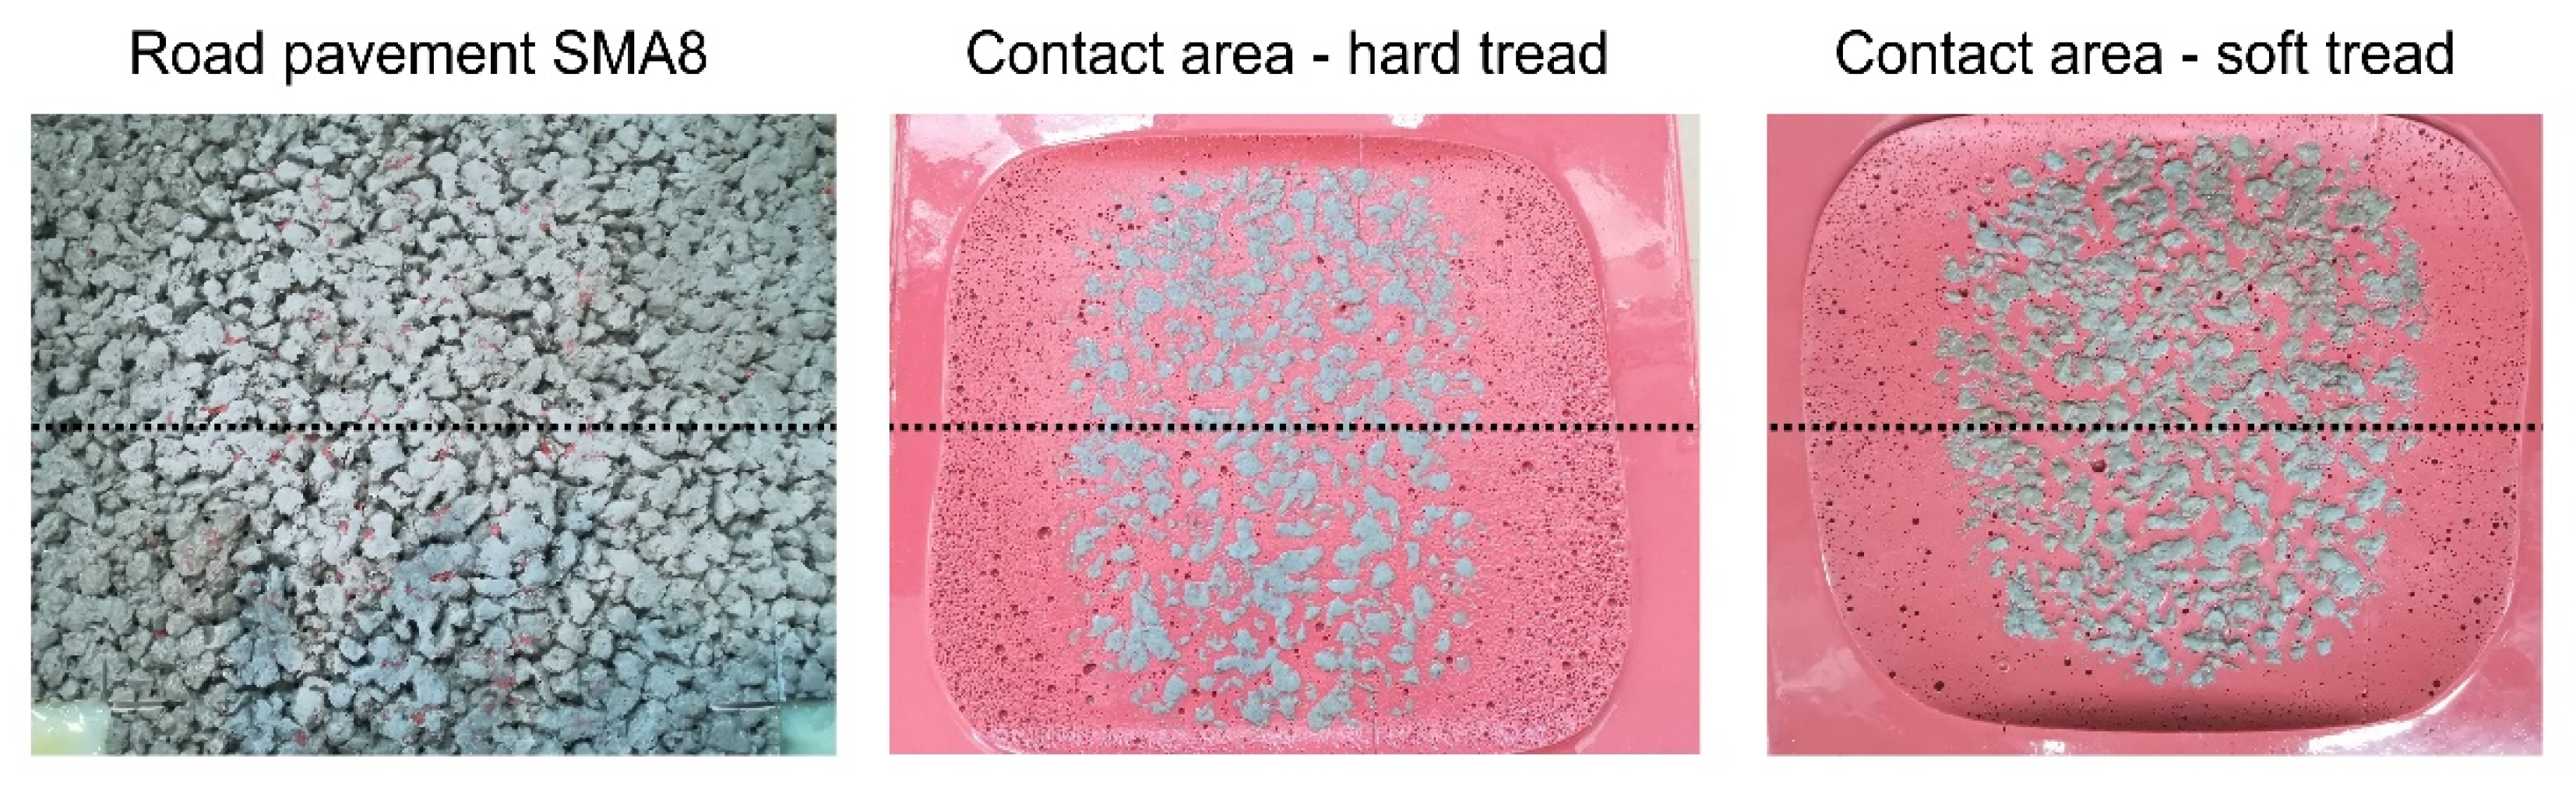
The authors believe that a completely different method of pavement characterization in respect to rolling resistance could also be used, which takes better account of the pavement texture properties that are important for energy losses. The proposed method examines the relationship between the penetration depth of the texture summits and the volume of deformed rubber. If the pavement has the structure as shown in
Figure 10 (for example like SMA8), to obtain deformation of significant volume, even a small penetration depth is enough. If, on the other hand, the pavement structure is as shown in
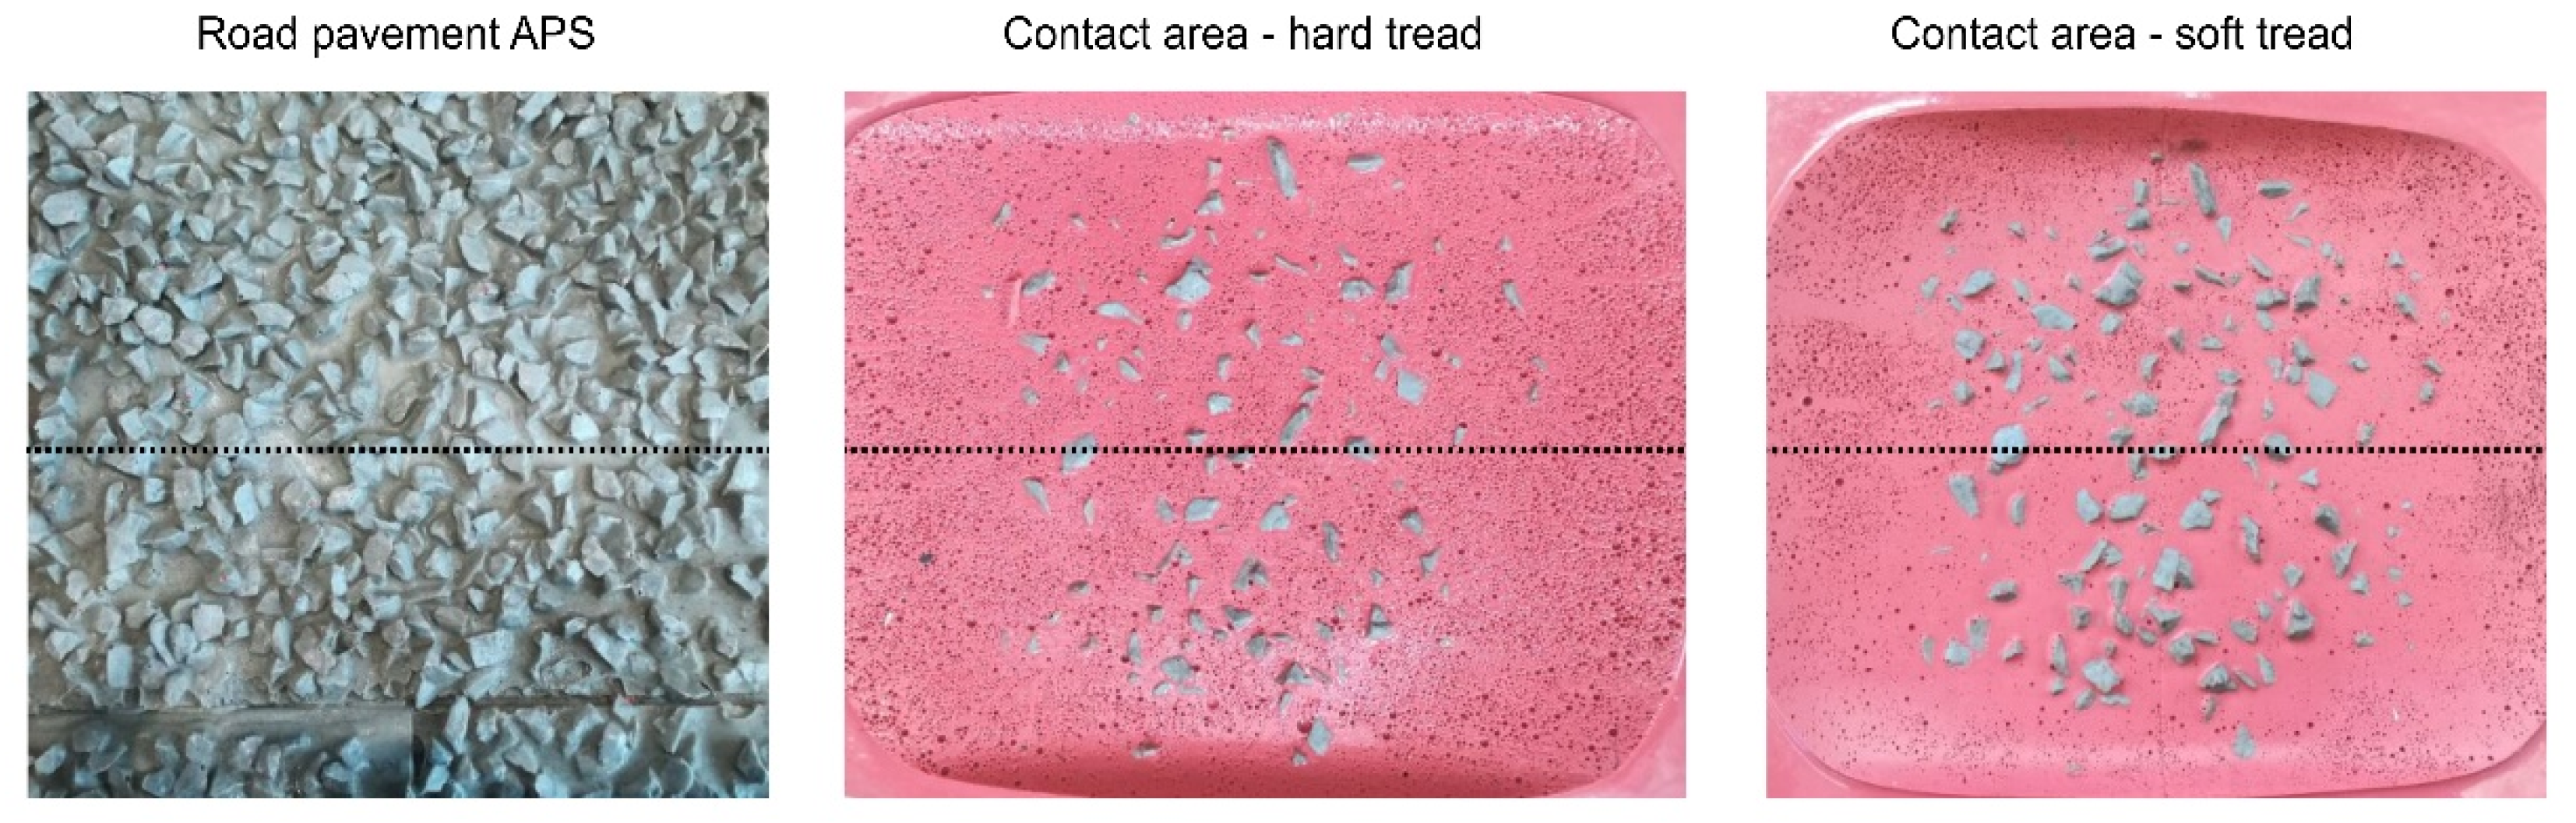
Figure 12, then deep penetration is necessary to achieve deformation of the same volume of rubber (as is the case with the APS pavement). It can, therefore, be speculated that the characteristics of the deflected rubber volume as a function of the penetration depth can classify the surfaces in terms of their “aggressiveness” influencing the rolling resistance.
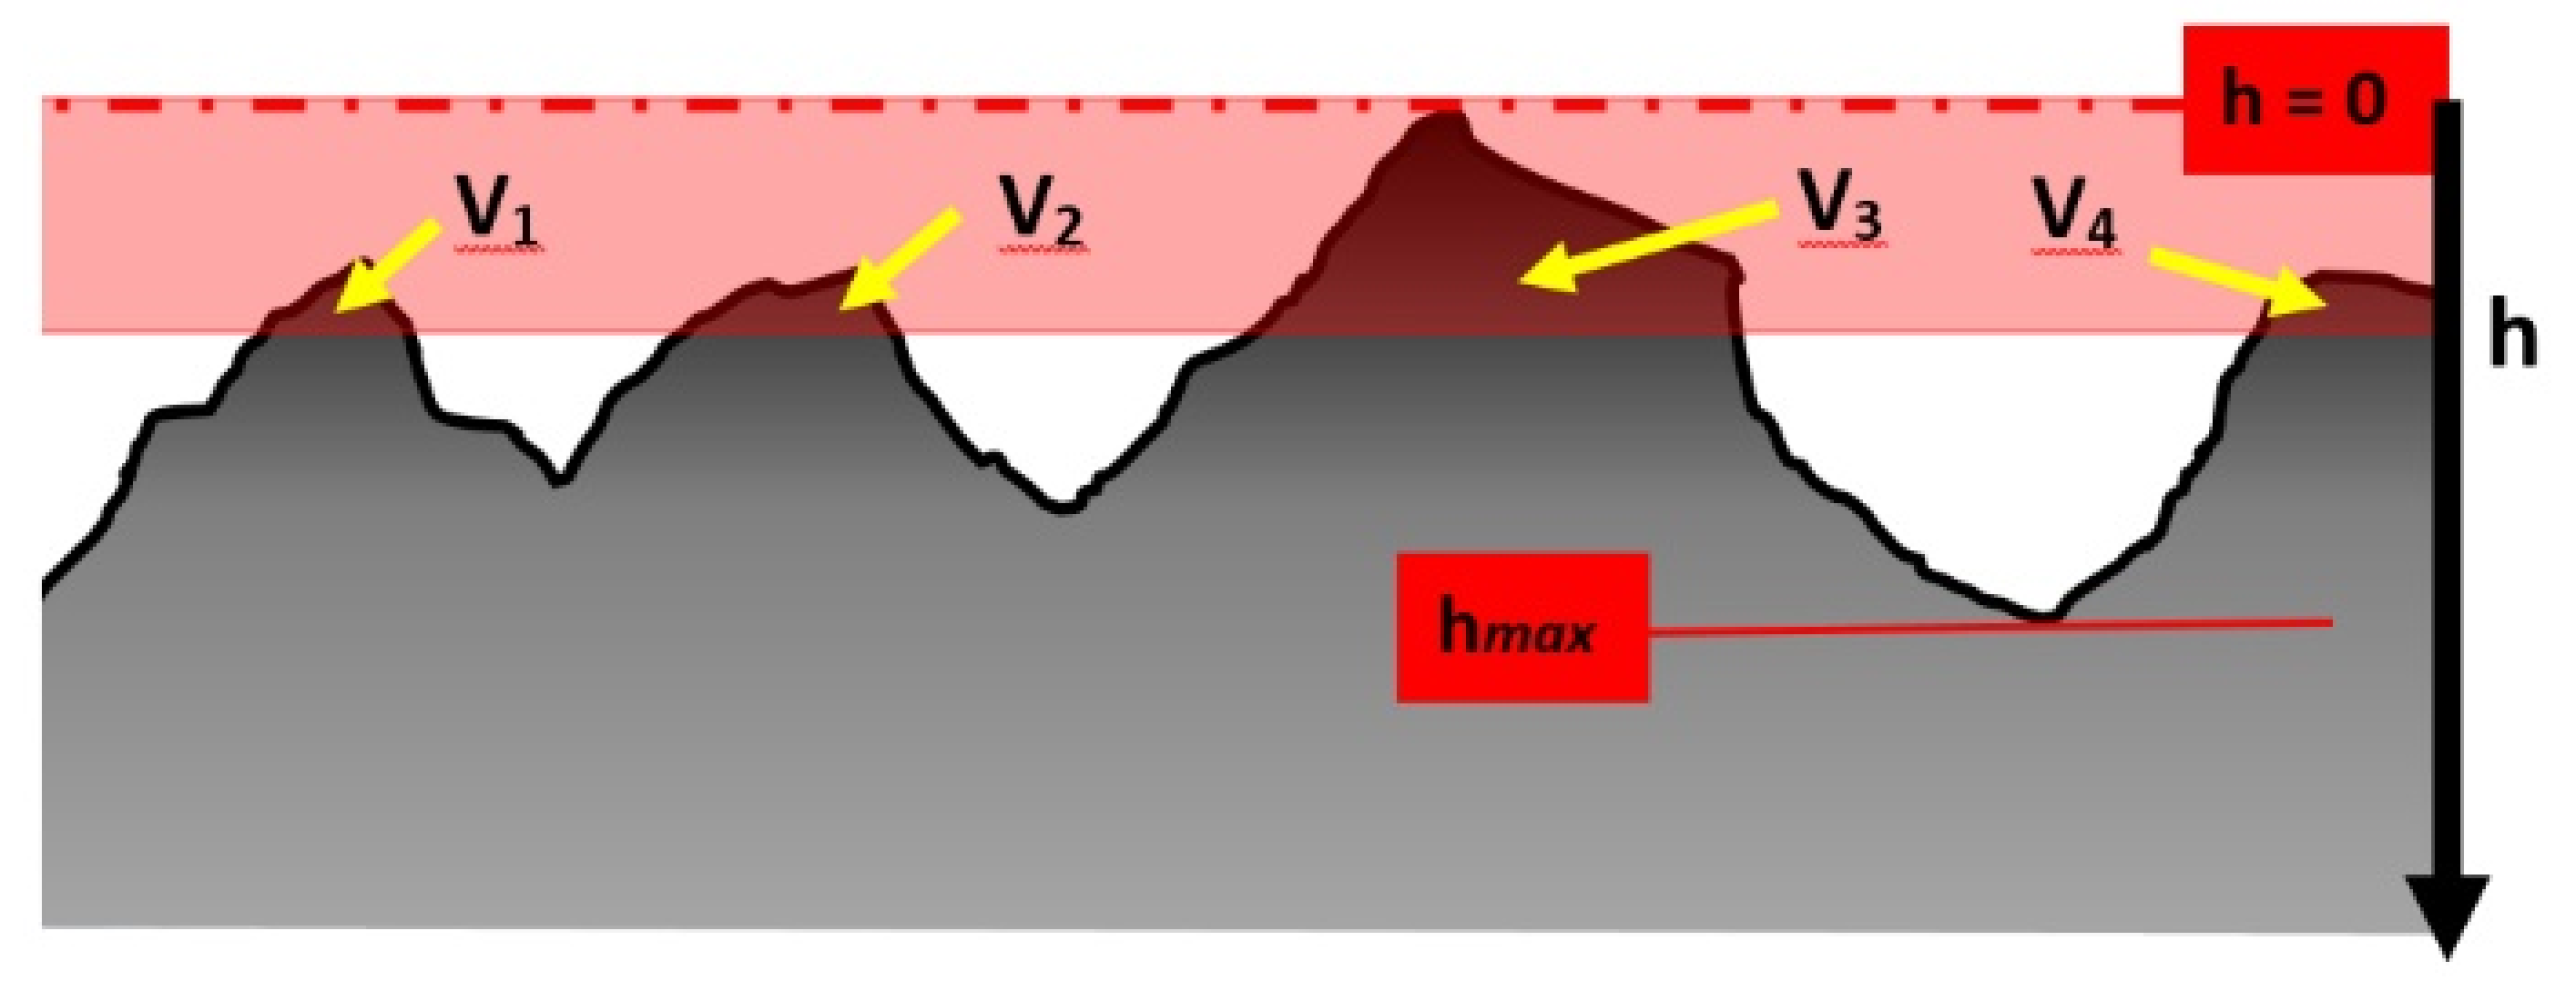
In
Figure 17, the principle of such texture evaluation is described. In the first step, using the 3D recording of the pavement texture, the analyzed area should be determined. In the study discussed in this article, each time this was a 50 mm × 50 mm square located in the region of the center of the tire imprint. For this square, the level of the highest summit is established (in
Figure 17 marked as h = 0) as well as the lowest pit determined by the enveloped tire imprint (marked as h
max). Then, starting from h = 0 up to h
max, the total volume of unevenness that penetrates the tread is determined (V = V
1 + V
2 + V
3 + V
4 + …). Thus, the function V = f(h) is created, describing the relationship between the volume of deformed rubber of the tread compound as a function of penetration depth. For aggressive pavements (with sharp-contour aggregate) the relation V = f(h) is flatter than for pavements having rounded aggregate deeply embedded in the binder.
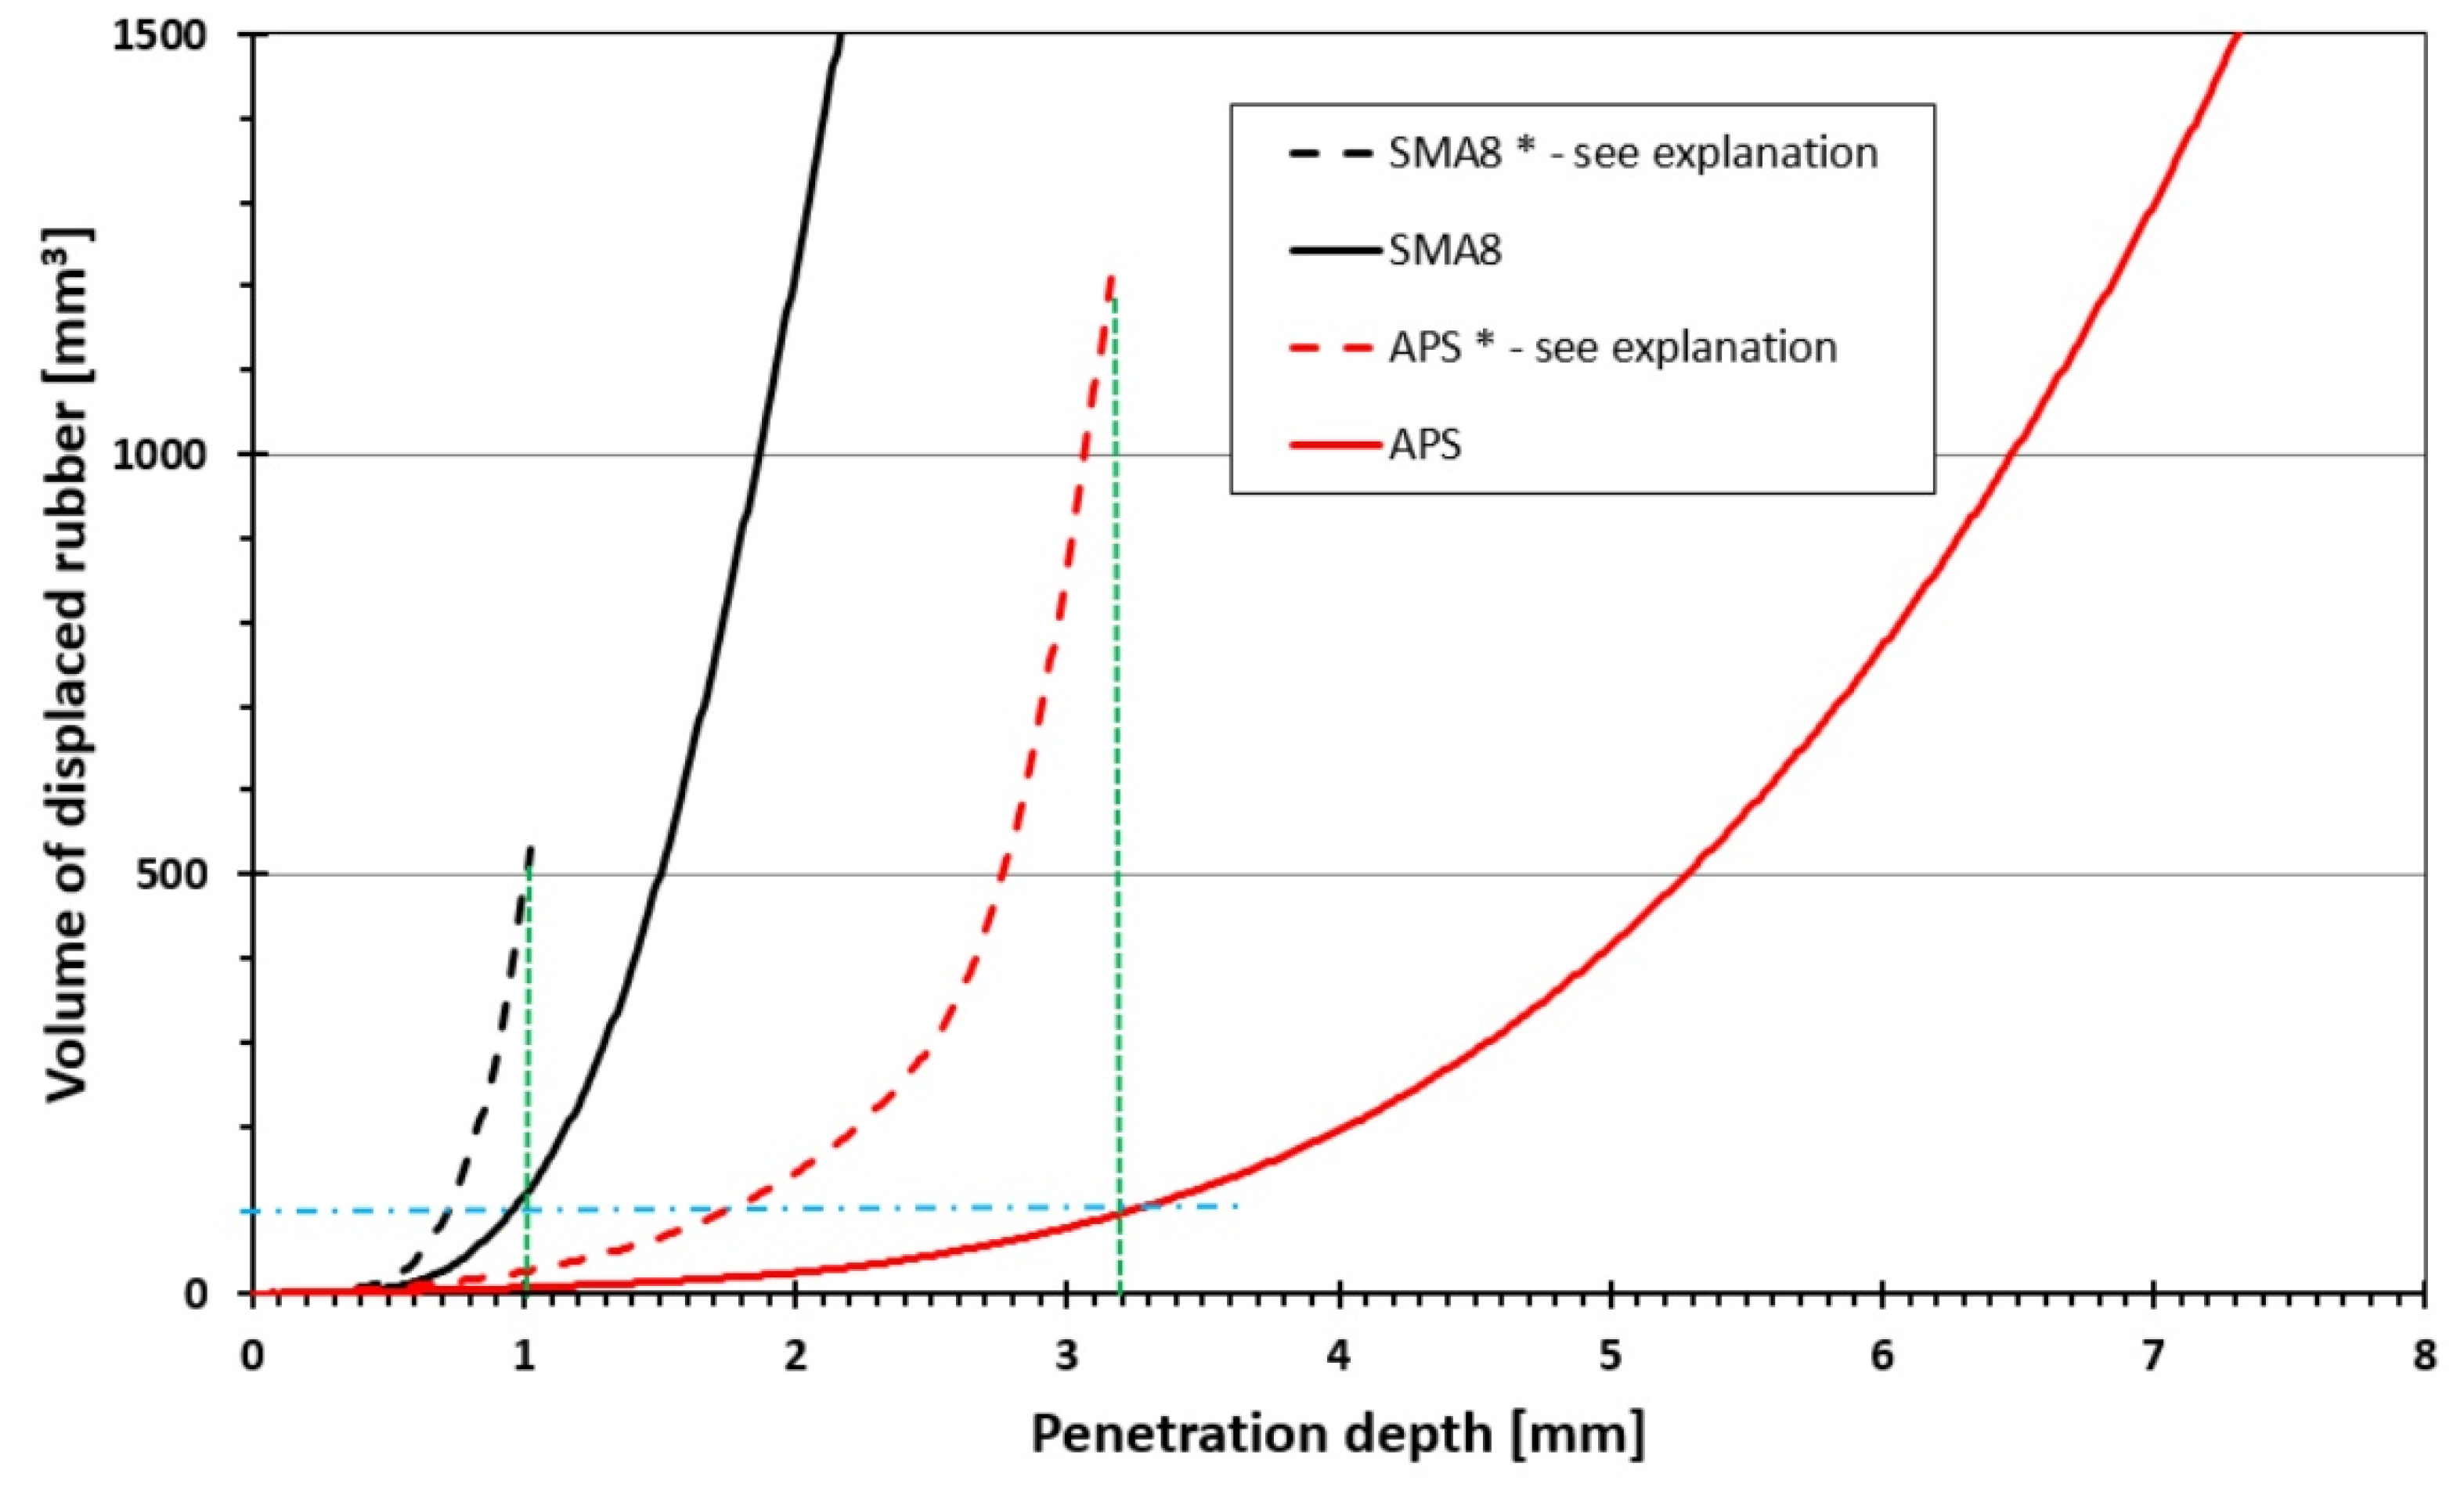
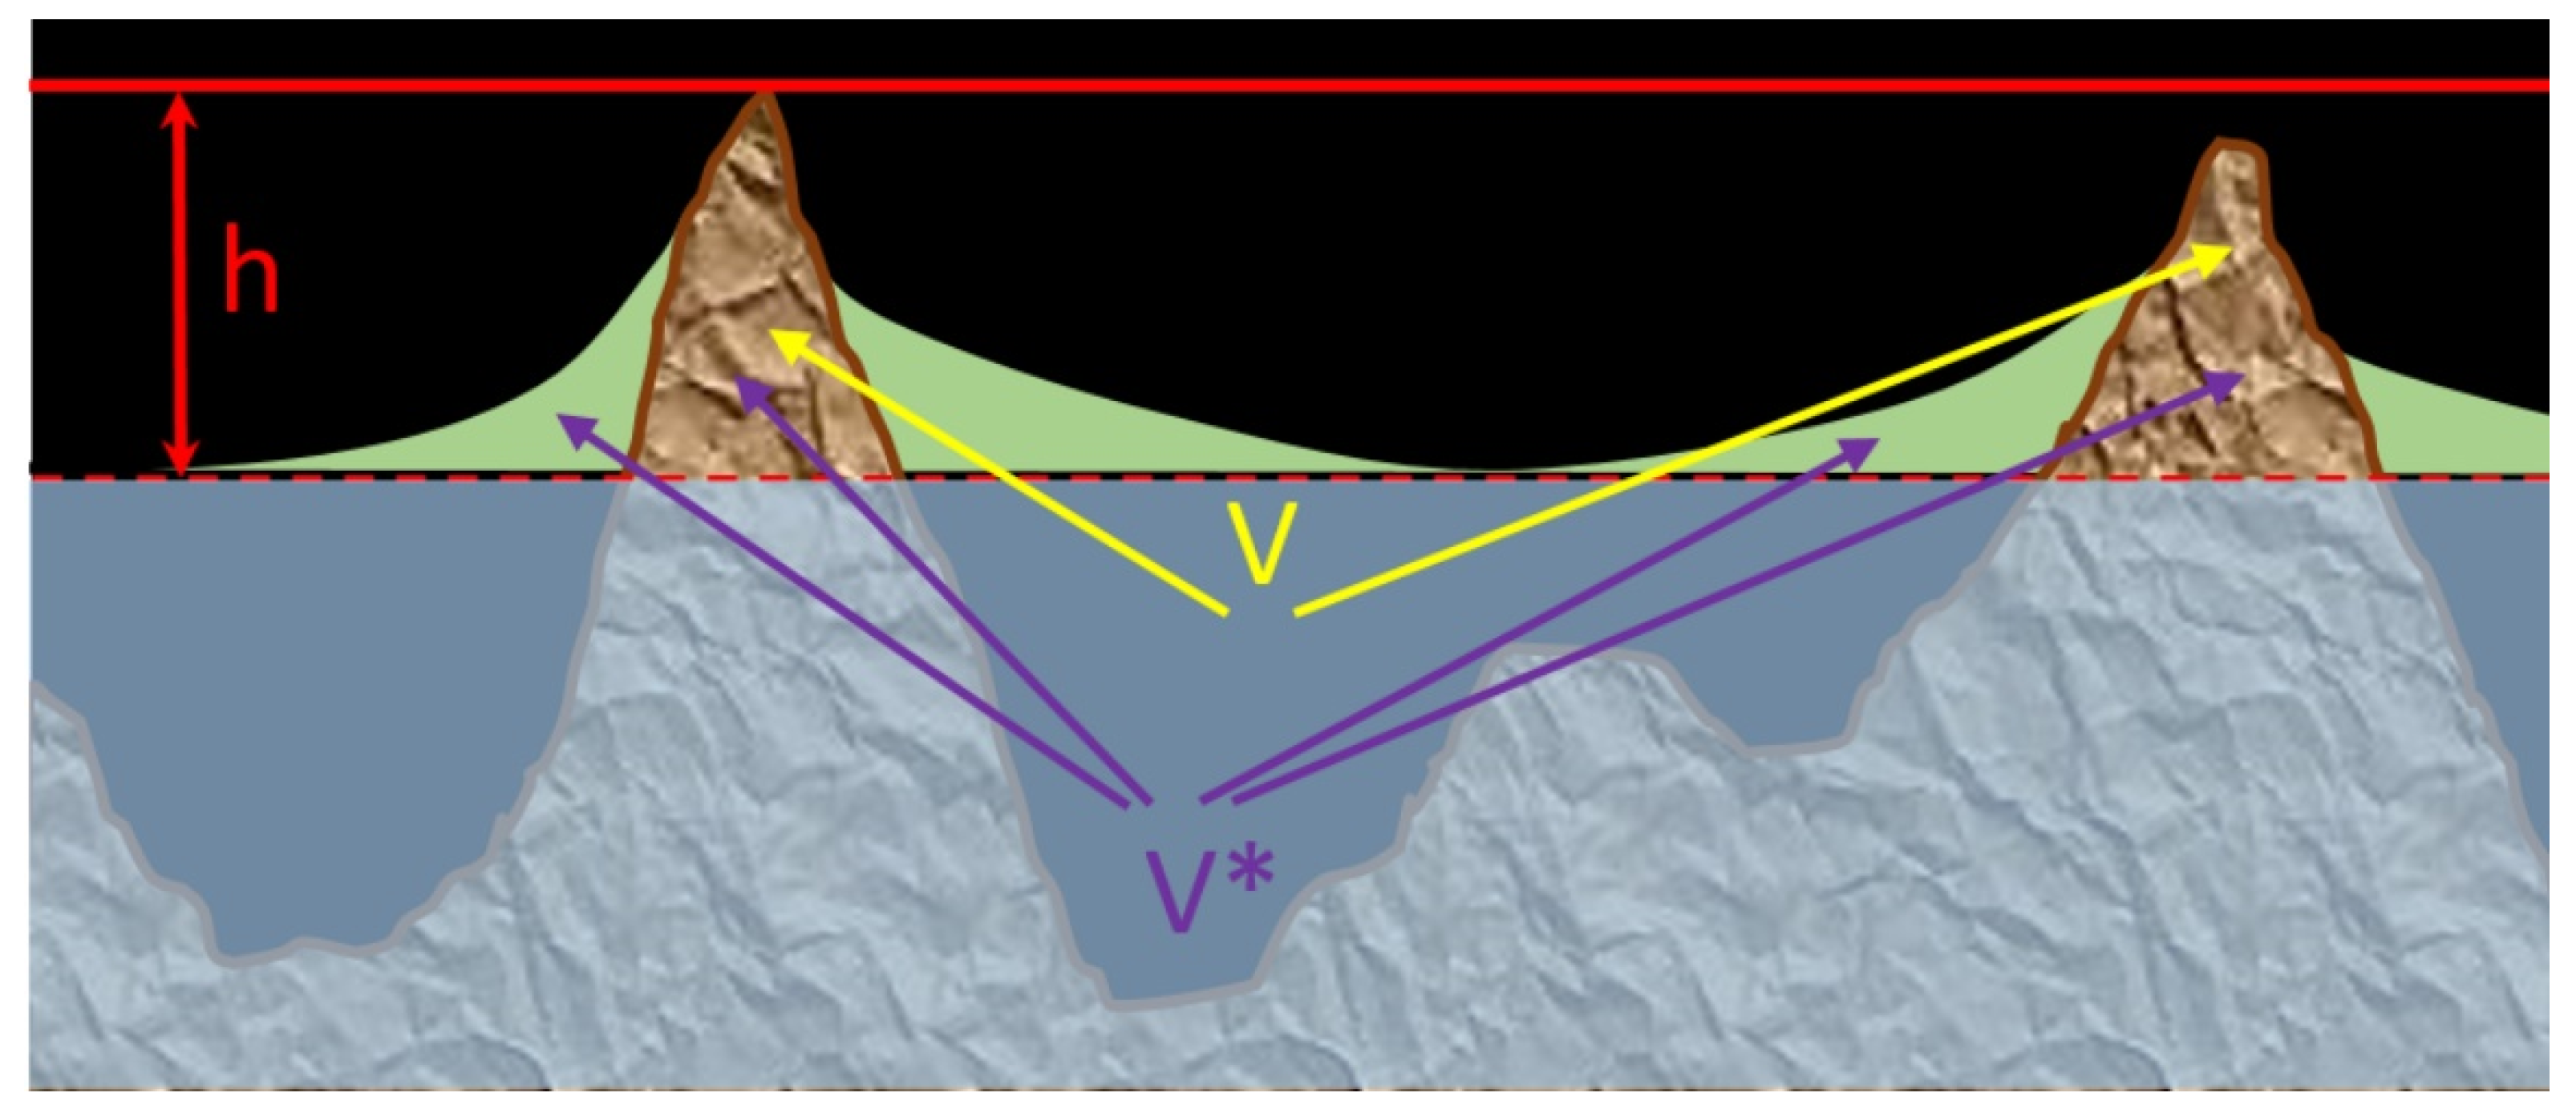
In
Figure 18 relations V = f(h) acquired for SOFT, smooth tires are presented for pavements SMA8 and APS. The relations were obtained by two different methods. The first method, purely geometrical (described above), was based on the volume of summits that protrude over the horizontal plane placed at a distance “h” below the highest summit (see also
Figure 17). Such a characteristic is easy to obtain on the base of a digital 3D texture profile. These relations are marked with solid lines. The second method accounted also for final shape of tread rubber “bridges” hanging over pots between the summits. These relations are marked with dashed lines. The principle of hanging “bridges” is explained also in
Figure 19. Although the characteristics produced according to the second principle seem to be better correlated with actual tread deformations, they are more difficult to evaluate, as the shape of the bridges must be known (for example by molding technique). As the maximum tread penetration for the second method is known, the dashed lines end at the maximum penetration height. Looking at
Figure 18, it can be seen that the maximum penetrations (in the case of SMA8 this is 1 mm and for APS it is 3.2 mm) correspond to the volume of about 100 mm
3 on curves which do not take into account the shape of the bridges.
A possible use of this observation is the adoption of the pavement rolling resistance classification based on the depth to which the texture must penetrate the tread to reach a certain volume of rubber displacement.
In order to simplify the procedure even more it would be desirable to attempt to base evaluation of the rubber deformation not on 3D texture characteristic, but on an easy to obtain 2D profile. Unfortunately, such simplification would not work in the case of directional textures like, for example, longitudinally grooved cement concrete; thus, the authors are in favor of 3D evaluations.
In the near future the authors plan to manufacture four replicas with very different geometrical patterns (evenly spaced spheres, cones, pyramids and cylinders), evaluate V = f(h) characteristics for these replicas and make (as well as SMA8 and APS) rolling resistance tests of 20 different tires. This will verify the usefulness of the method based on the volume–depth characteristics.


