
Study on the Adsorption Properties of Iron Tailings for GO

Abstract
:1. Introduction
2. Experimental Section
2.1. Materials
2.2. Test Instrument
2.3. Adsorption Experiment
2.4. Analytical Method
3. Results and Discussion
3.1. Characterization of Material
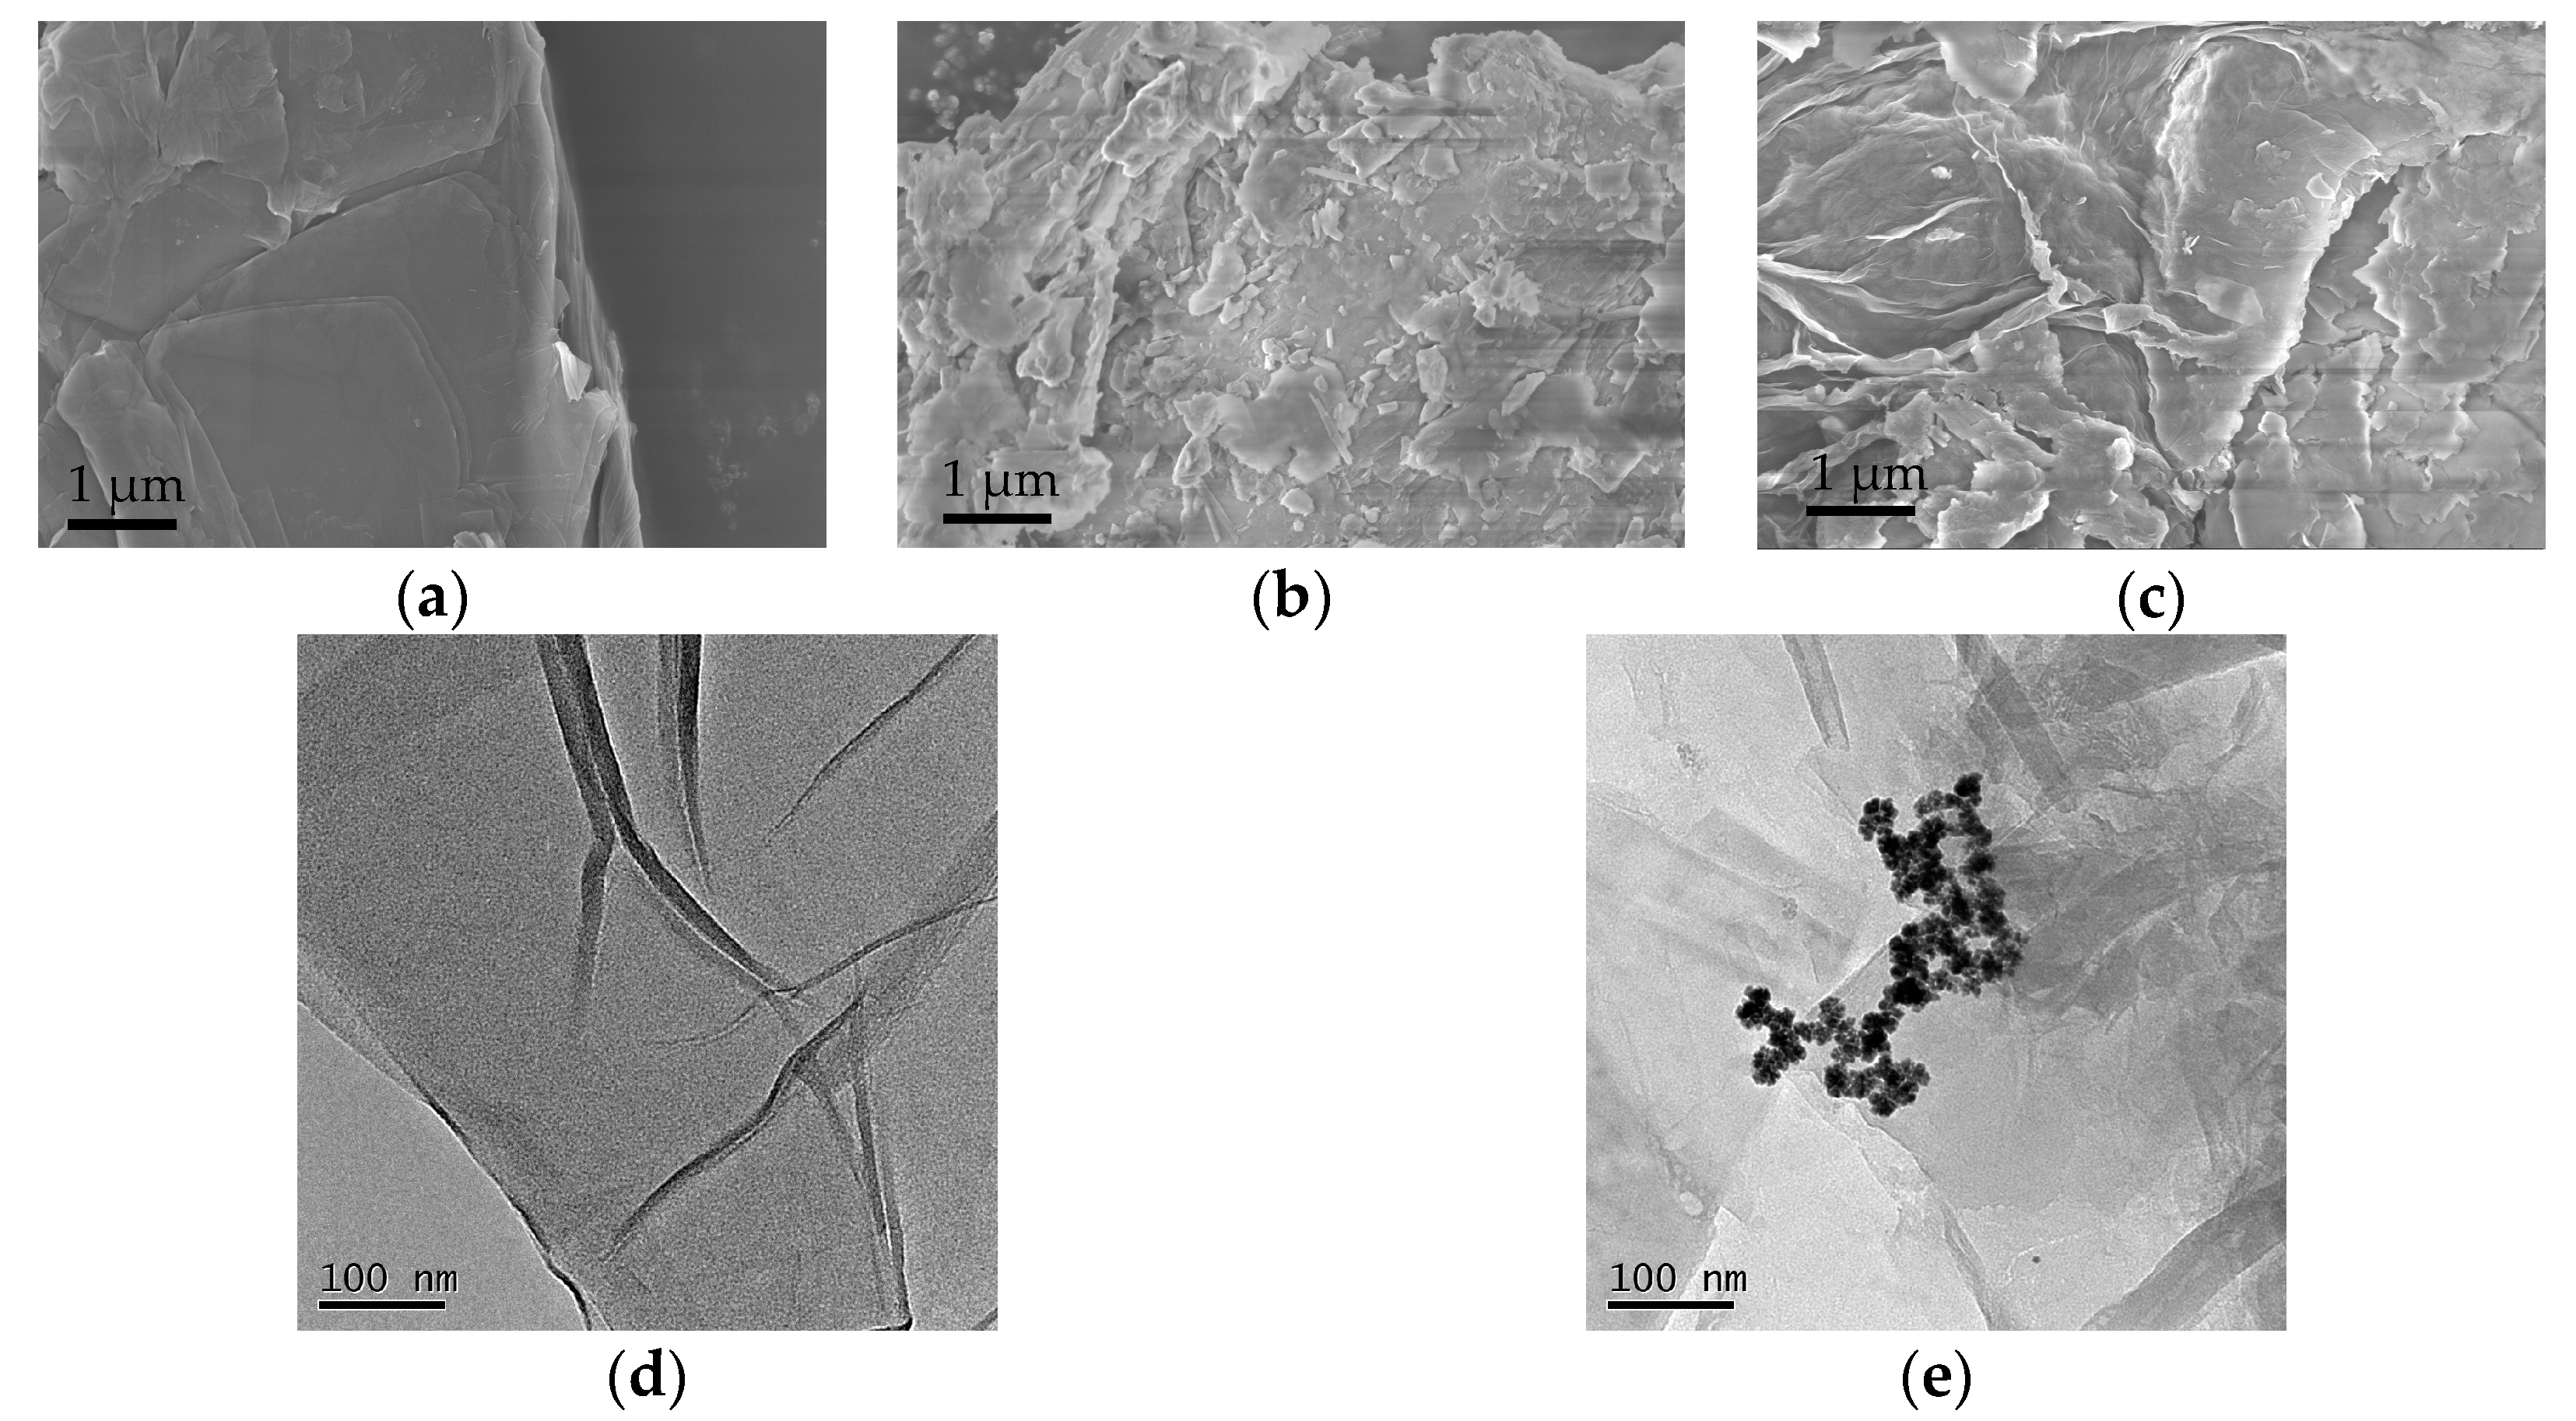
3.1.1. SEM and TEM
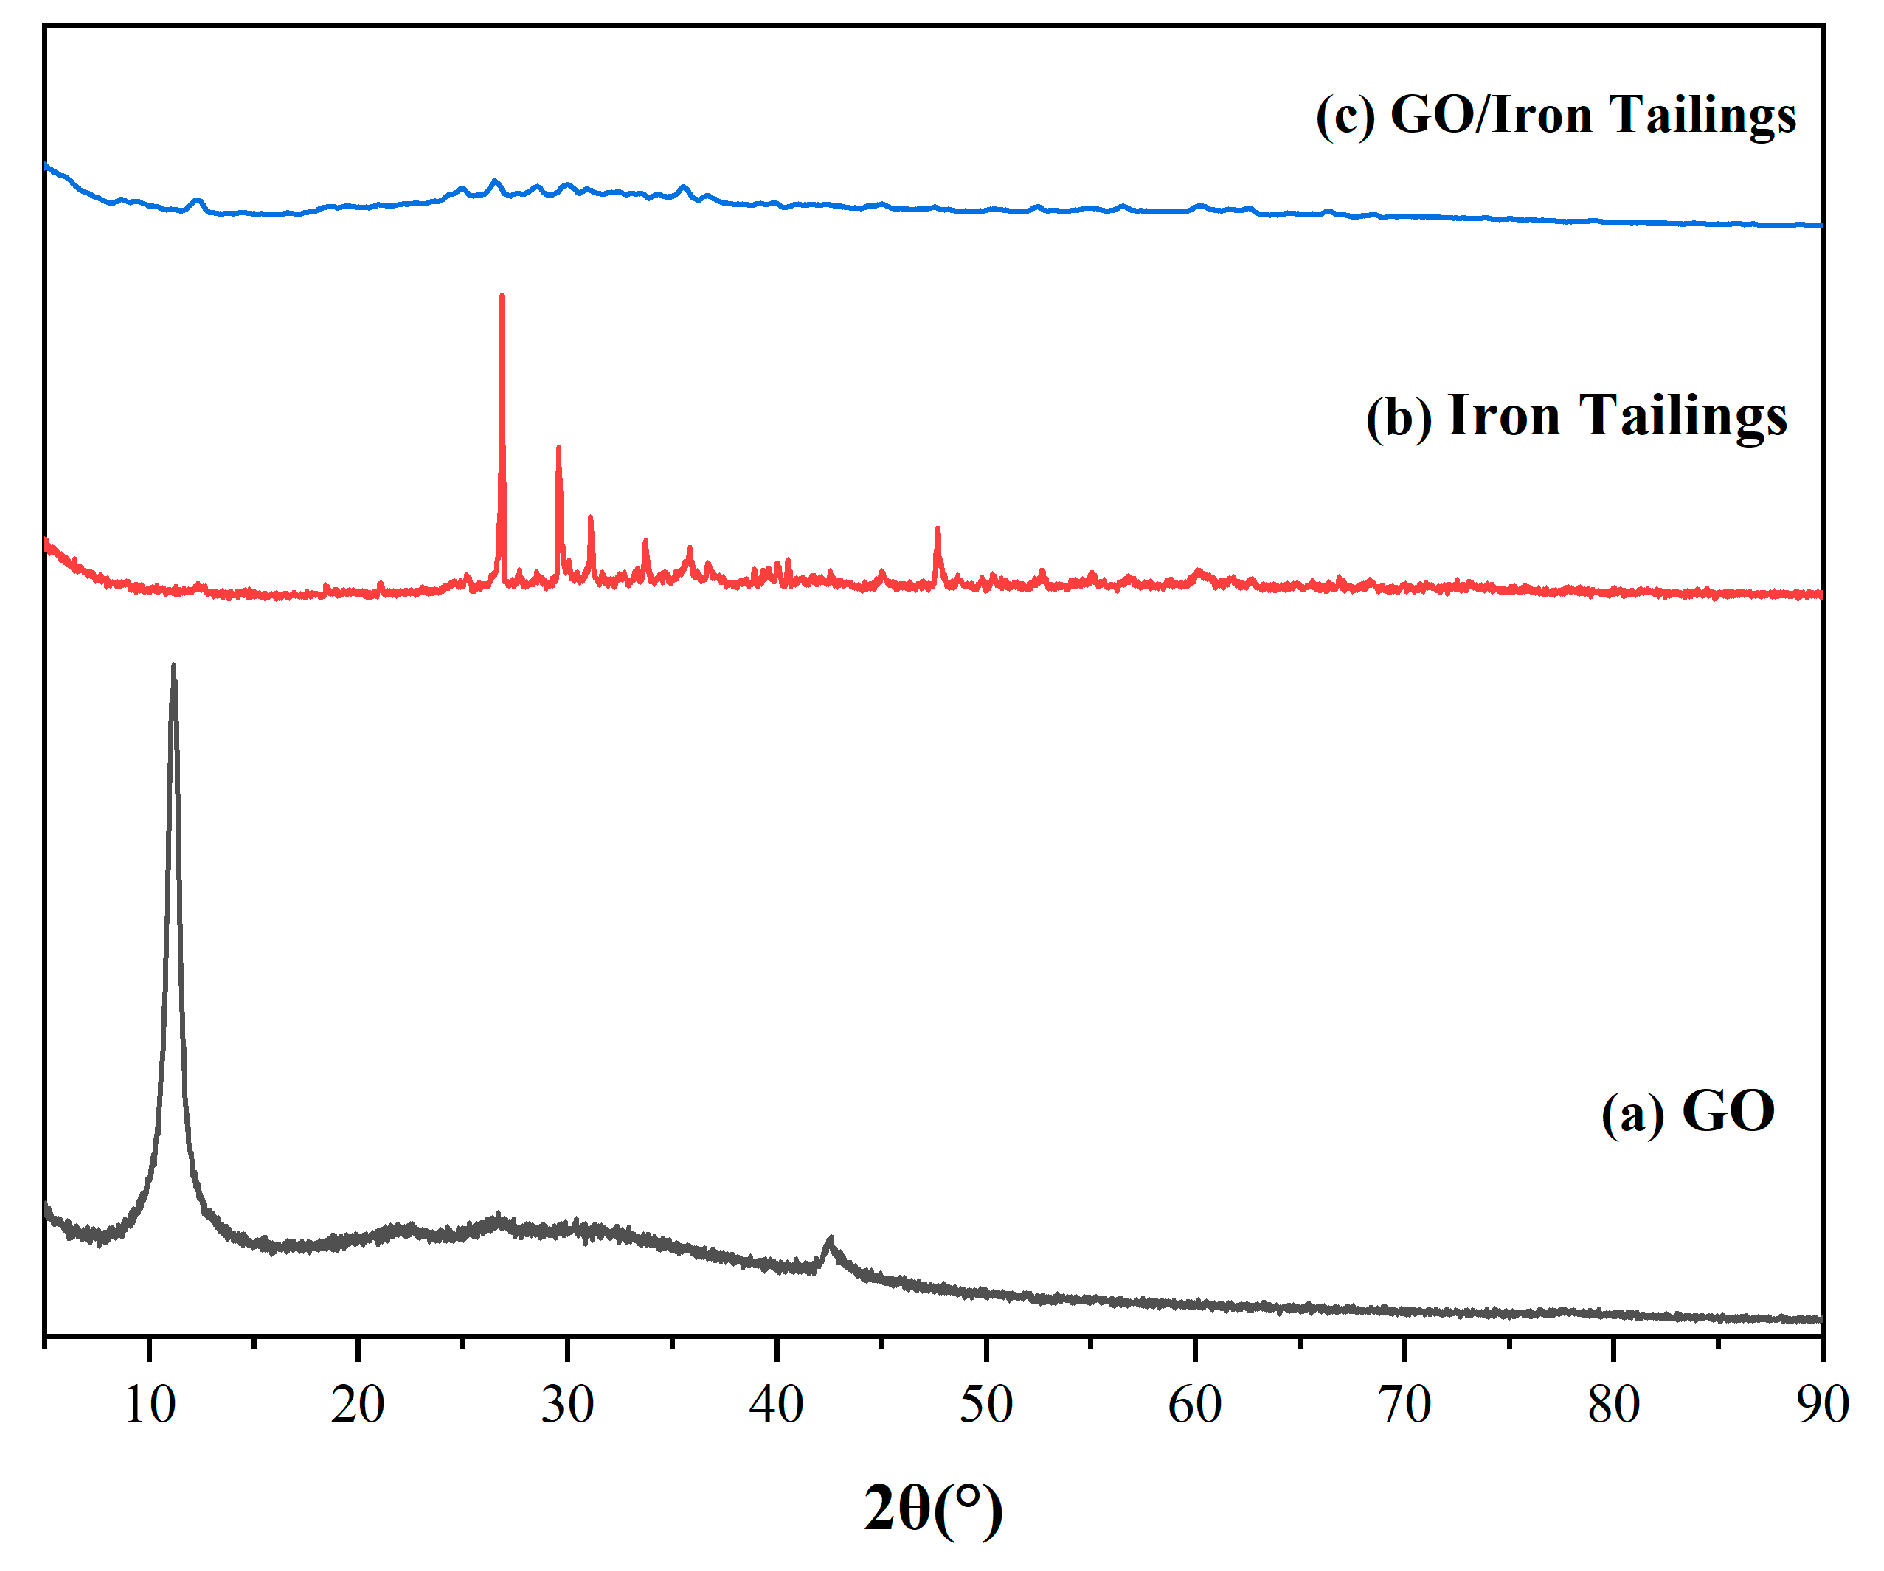
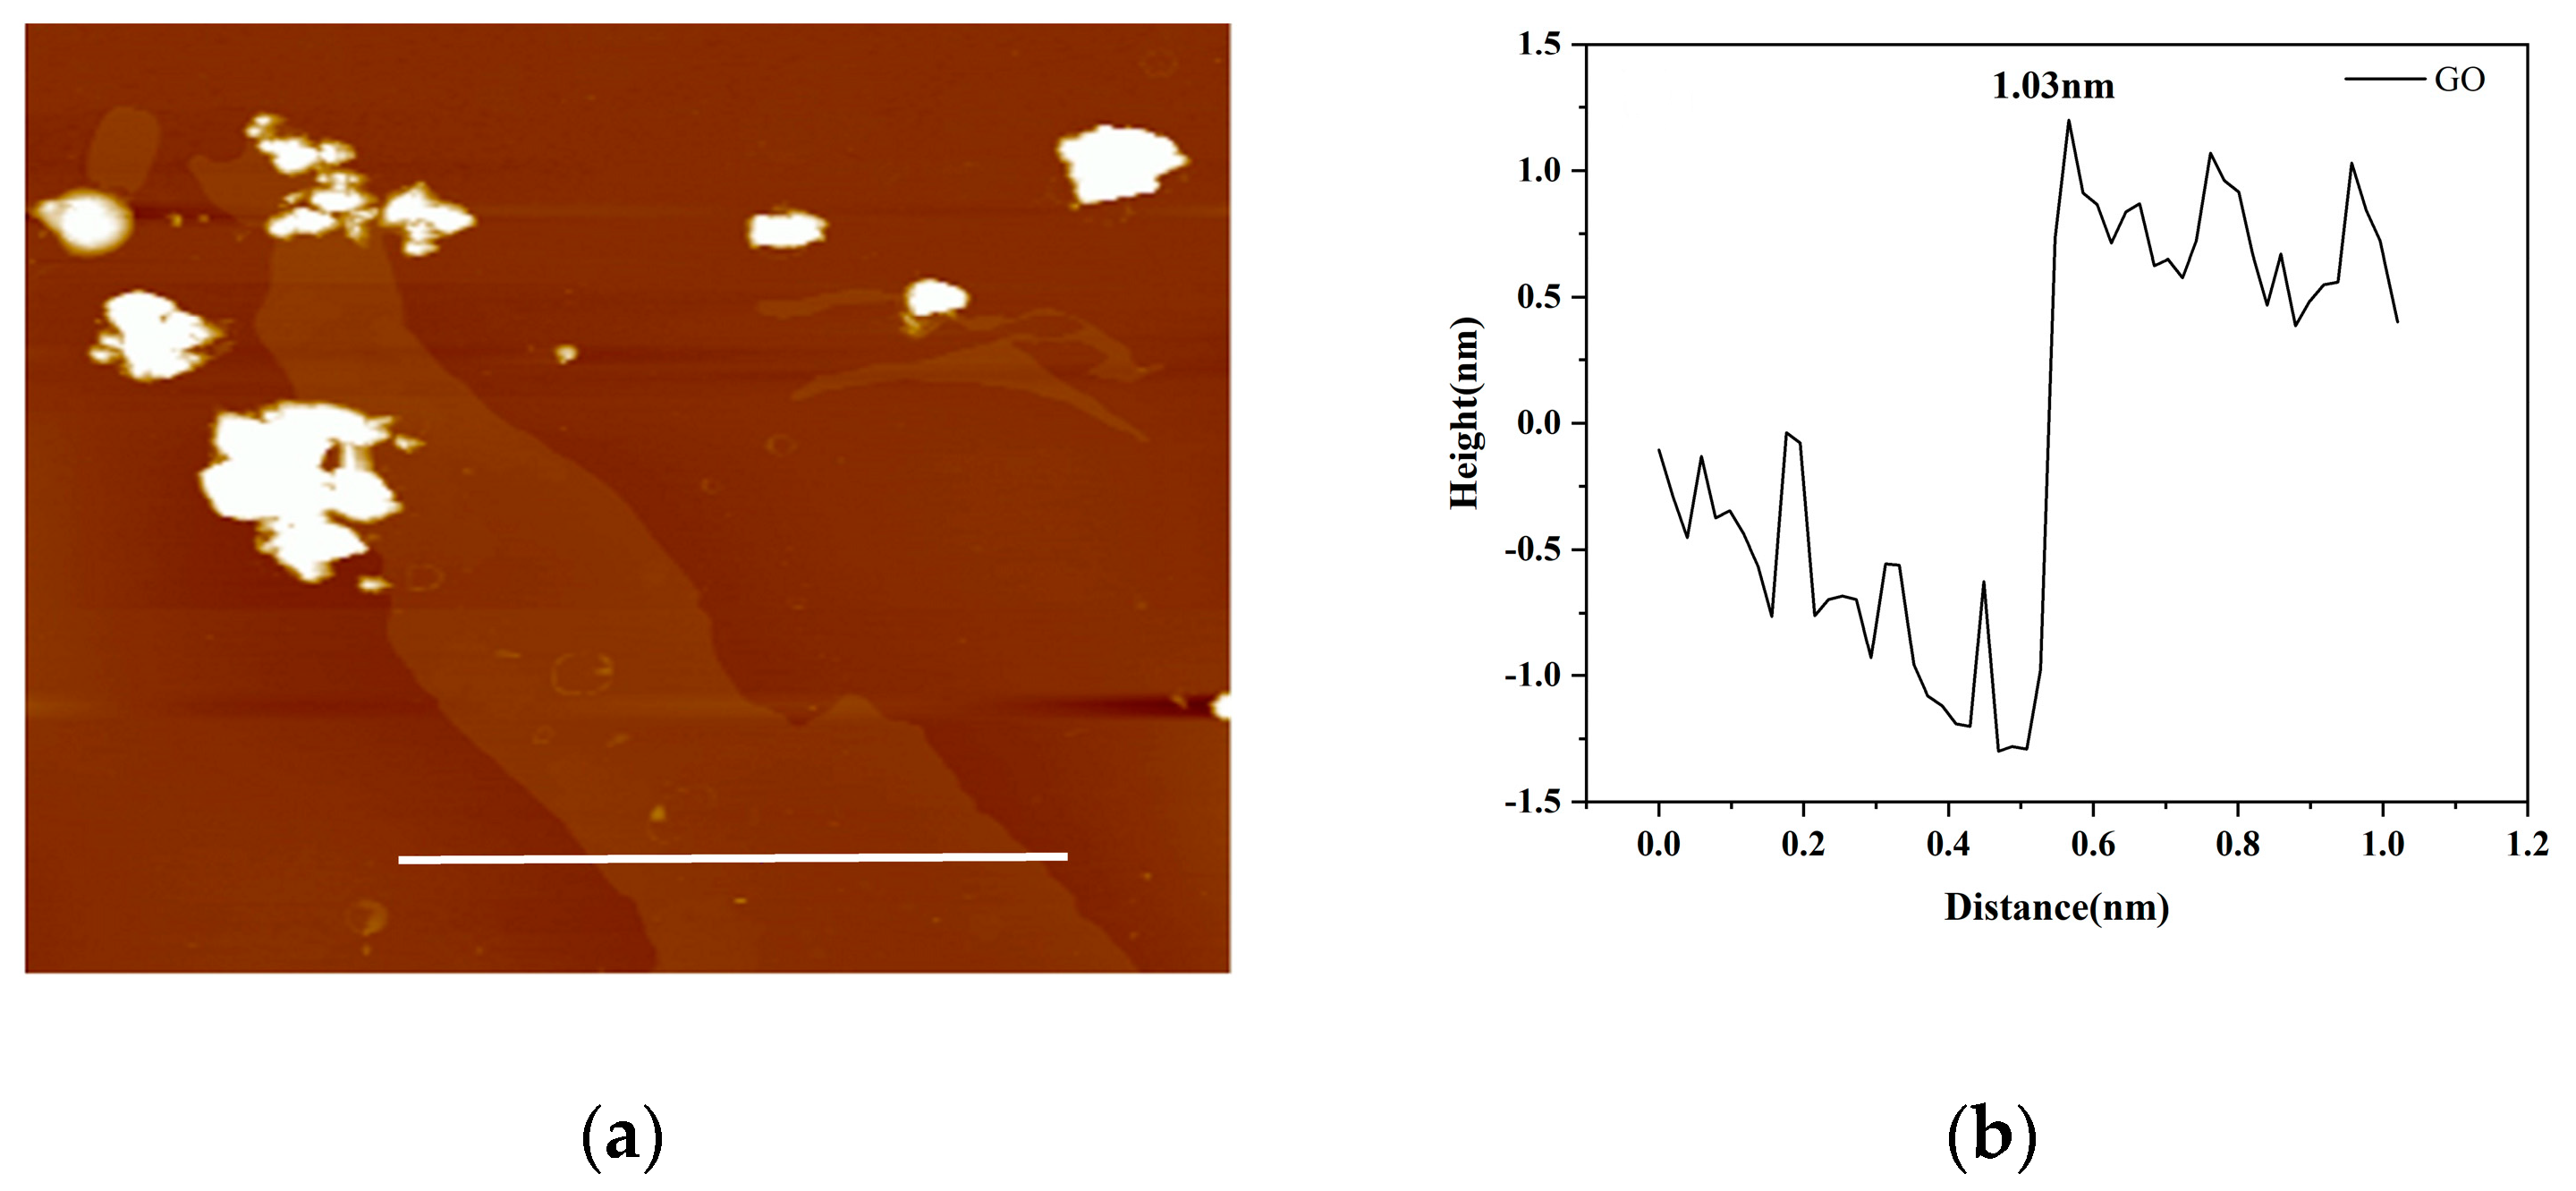
3.1.2. XRD and AFM
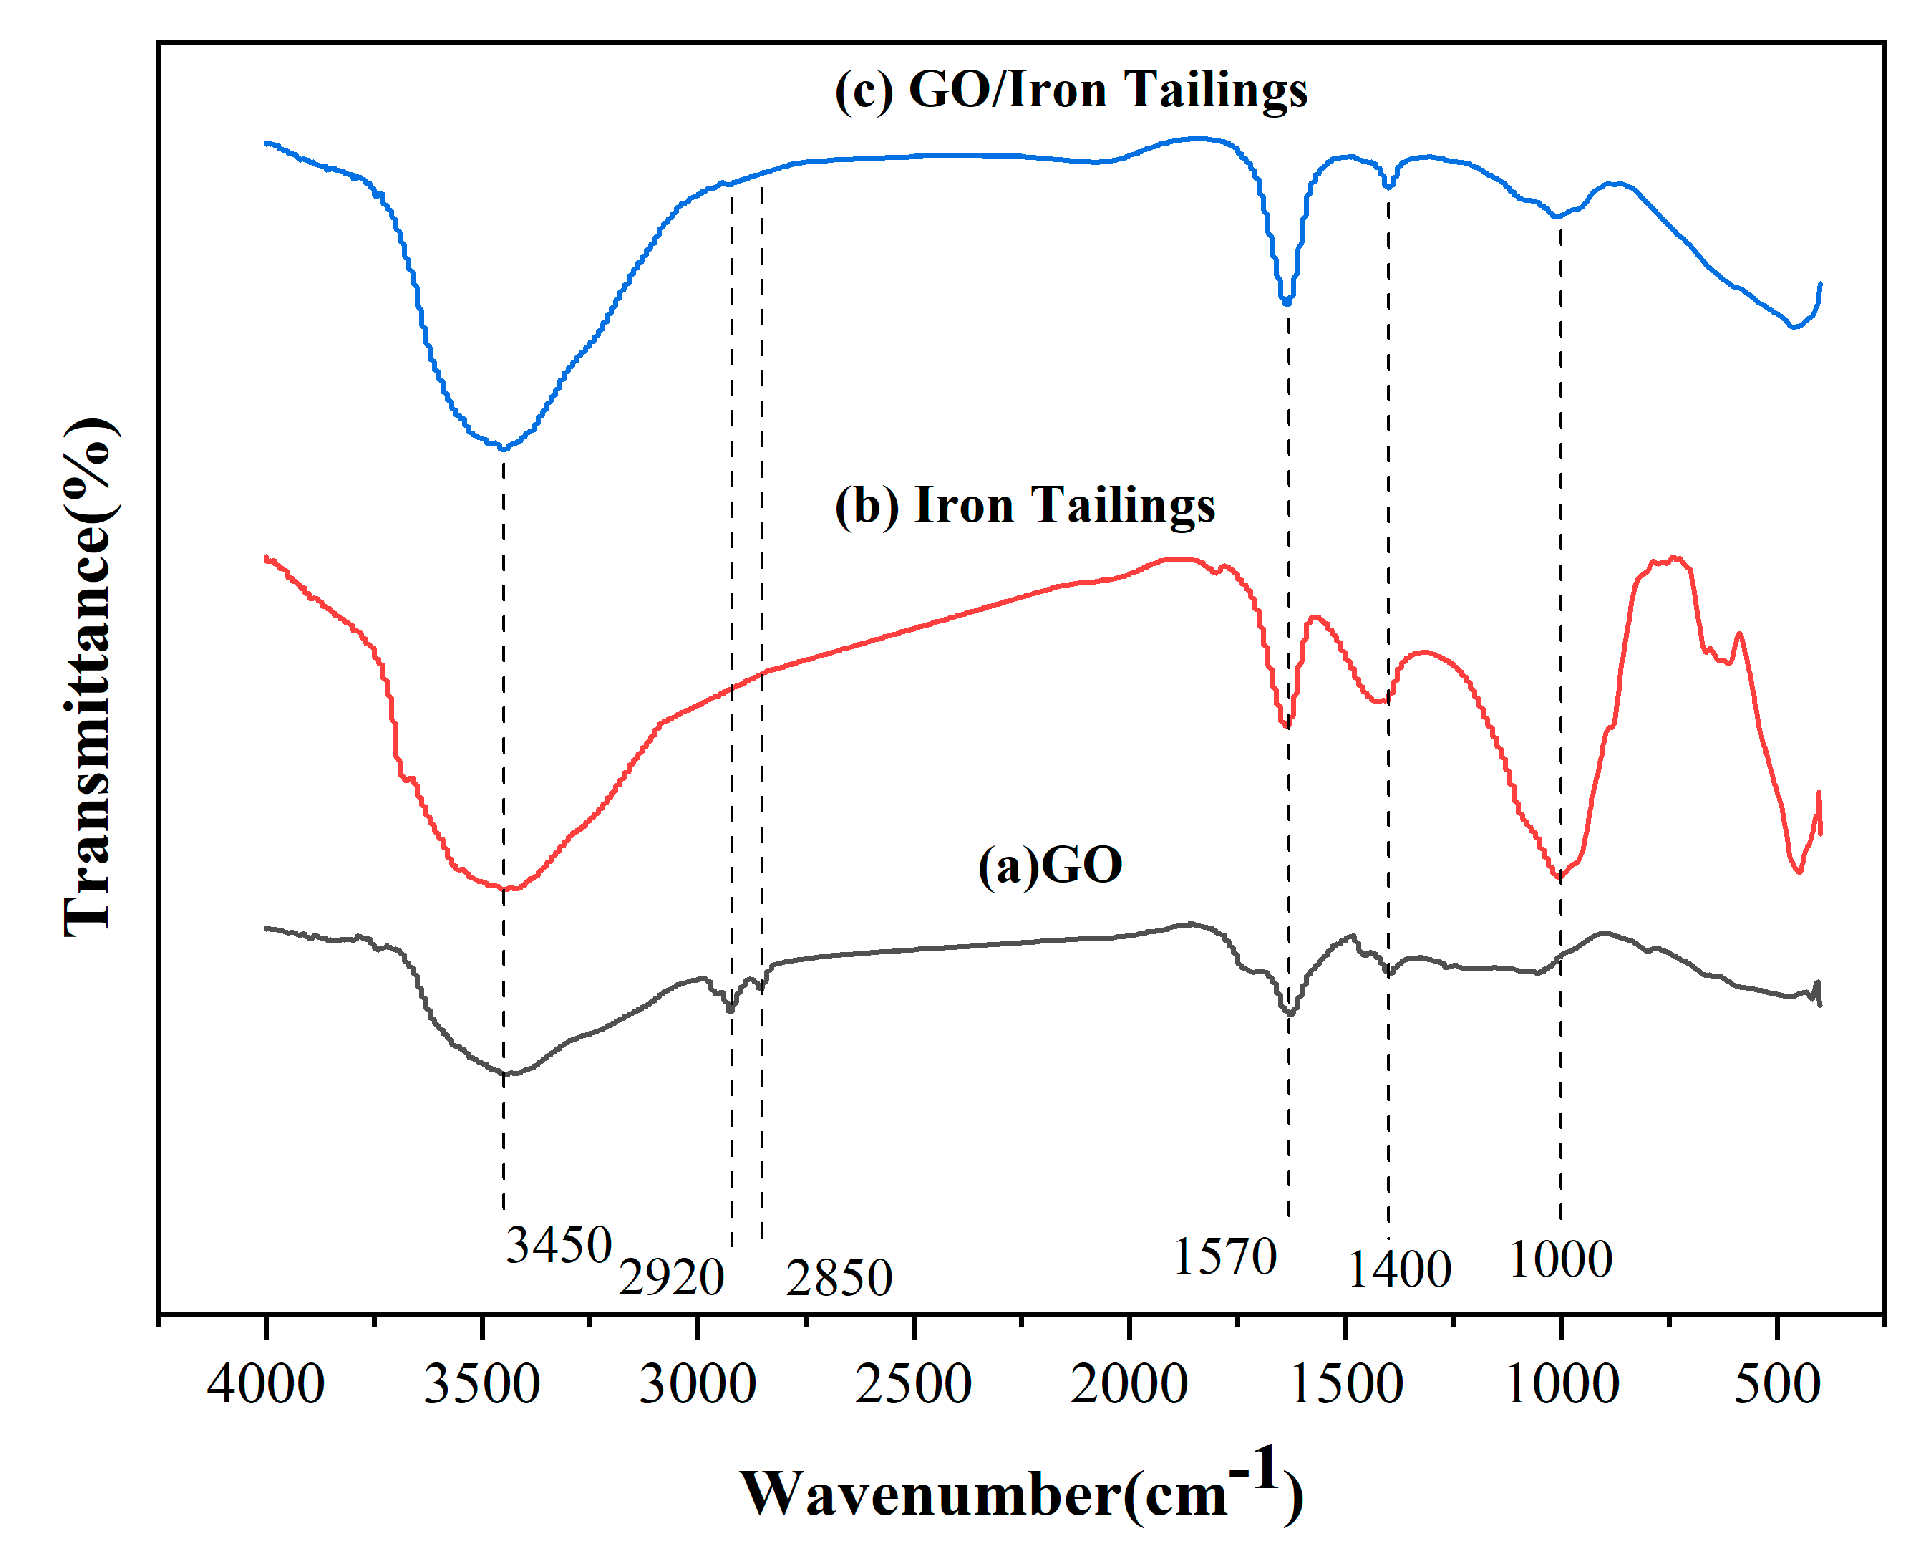
3.1.3. FT-IR
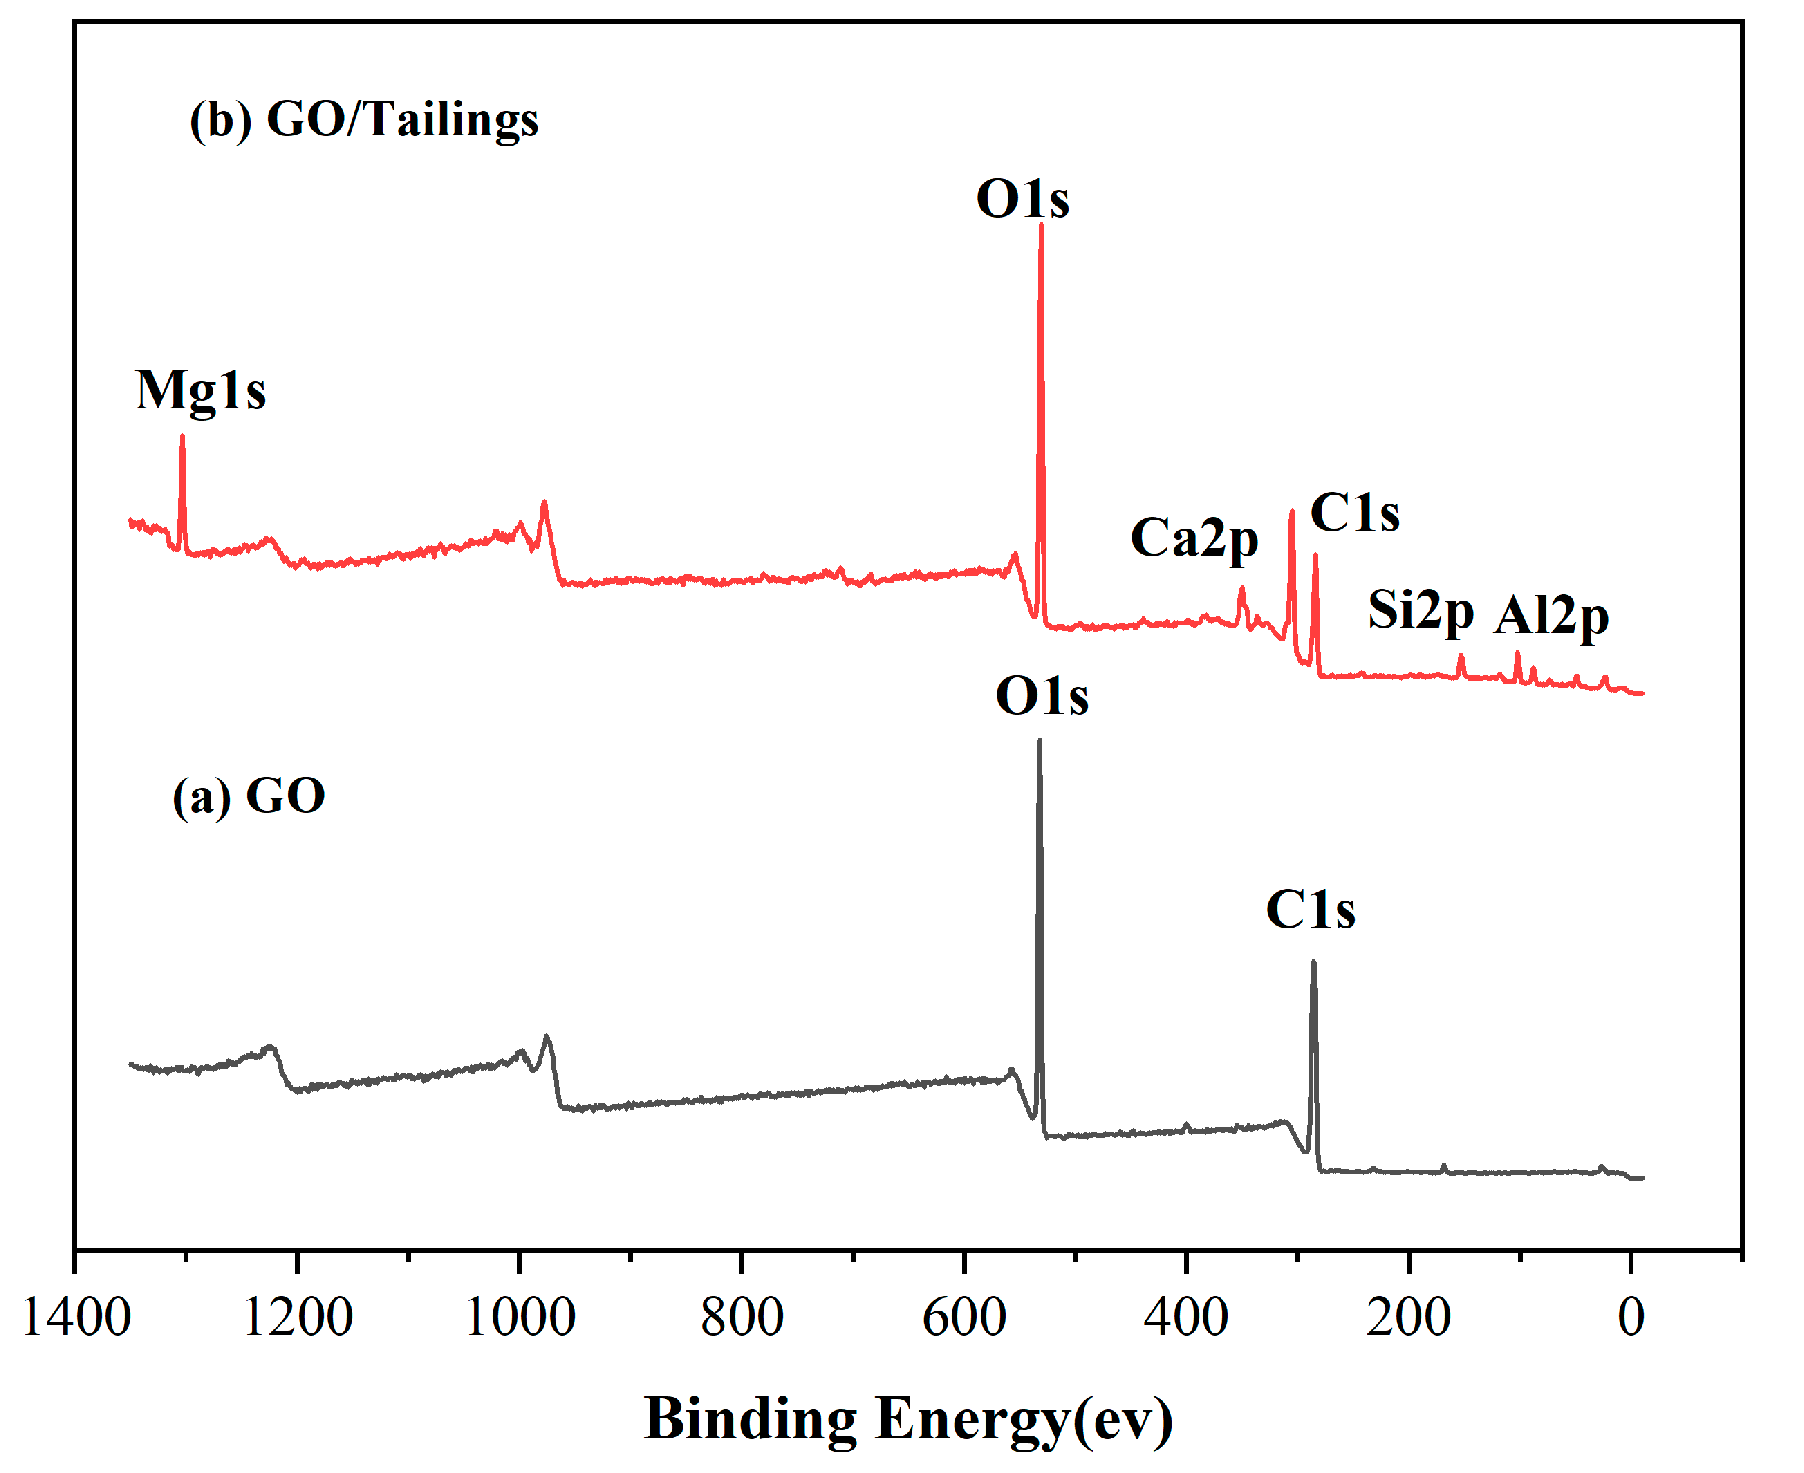
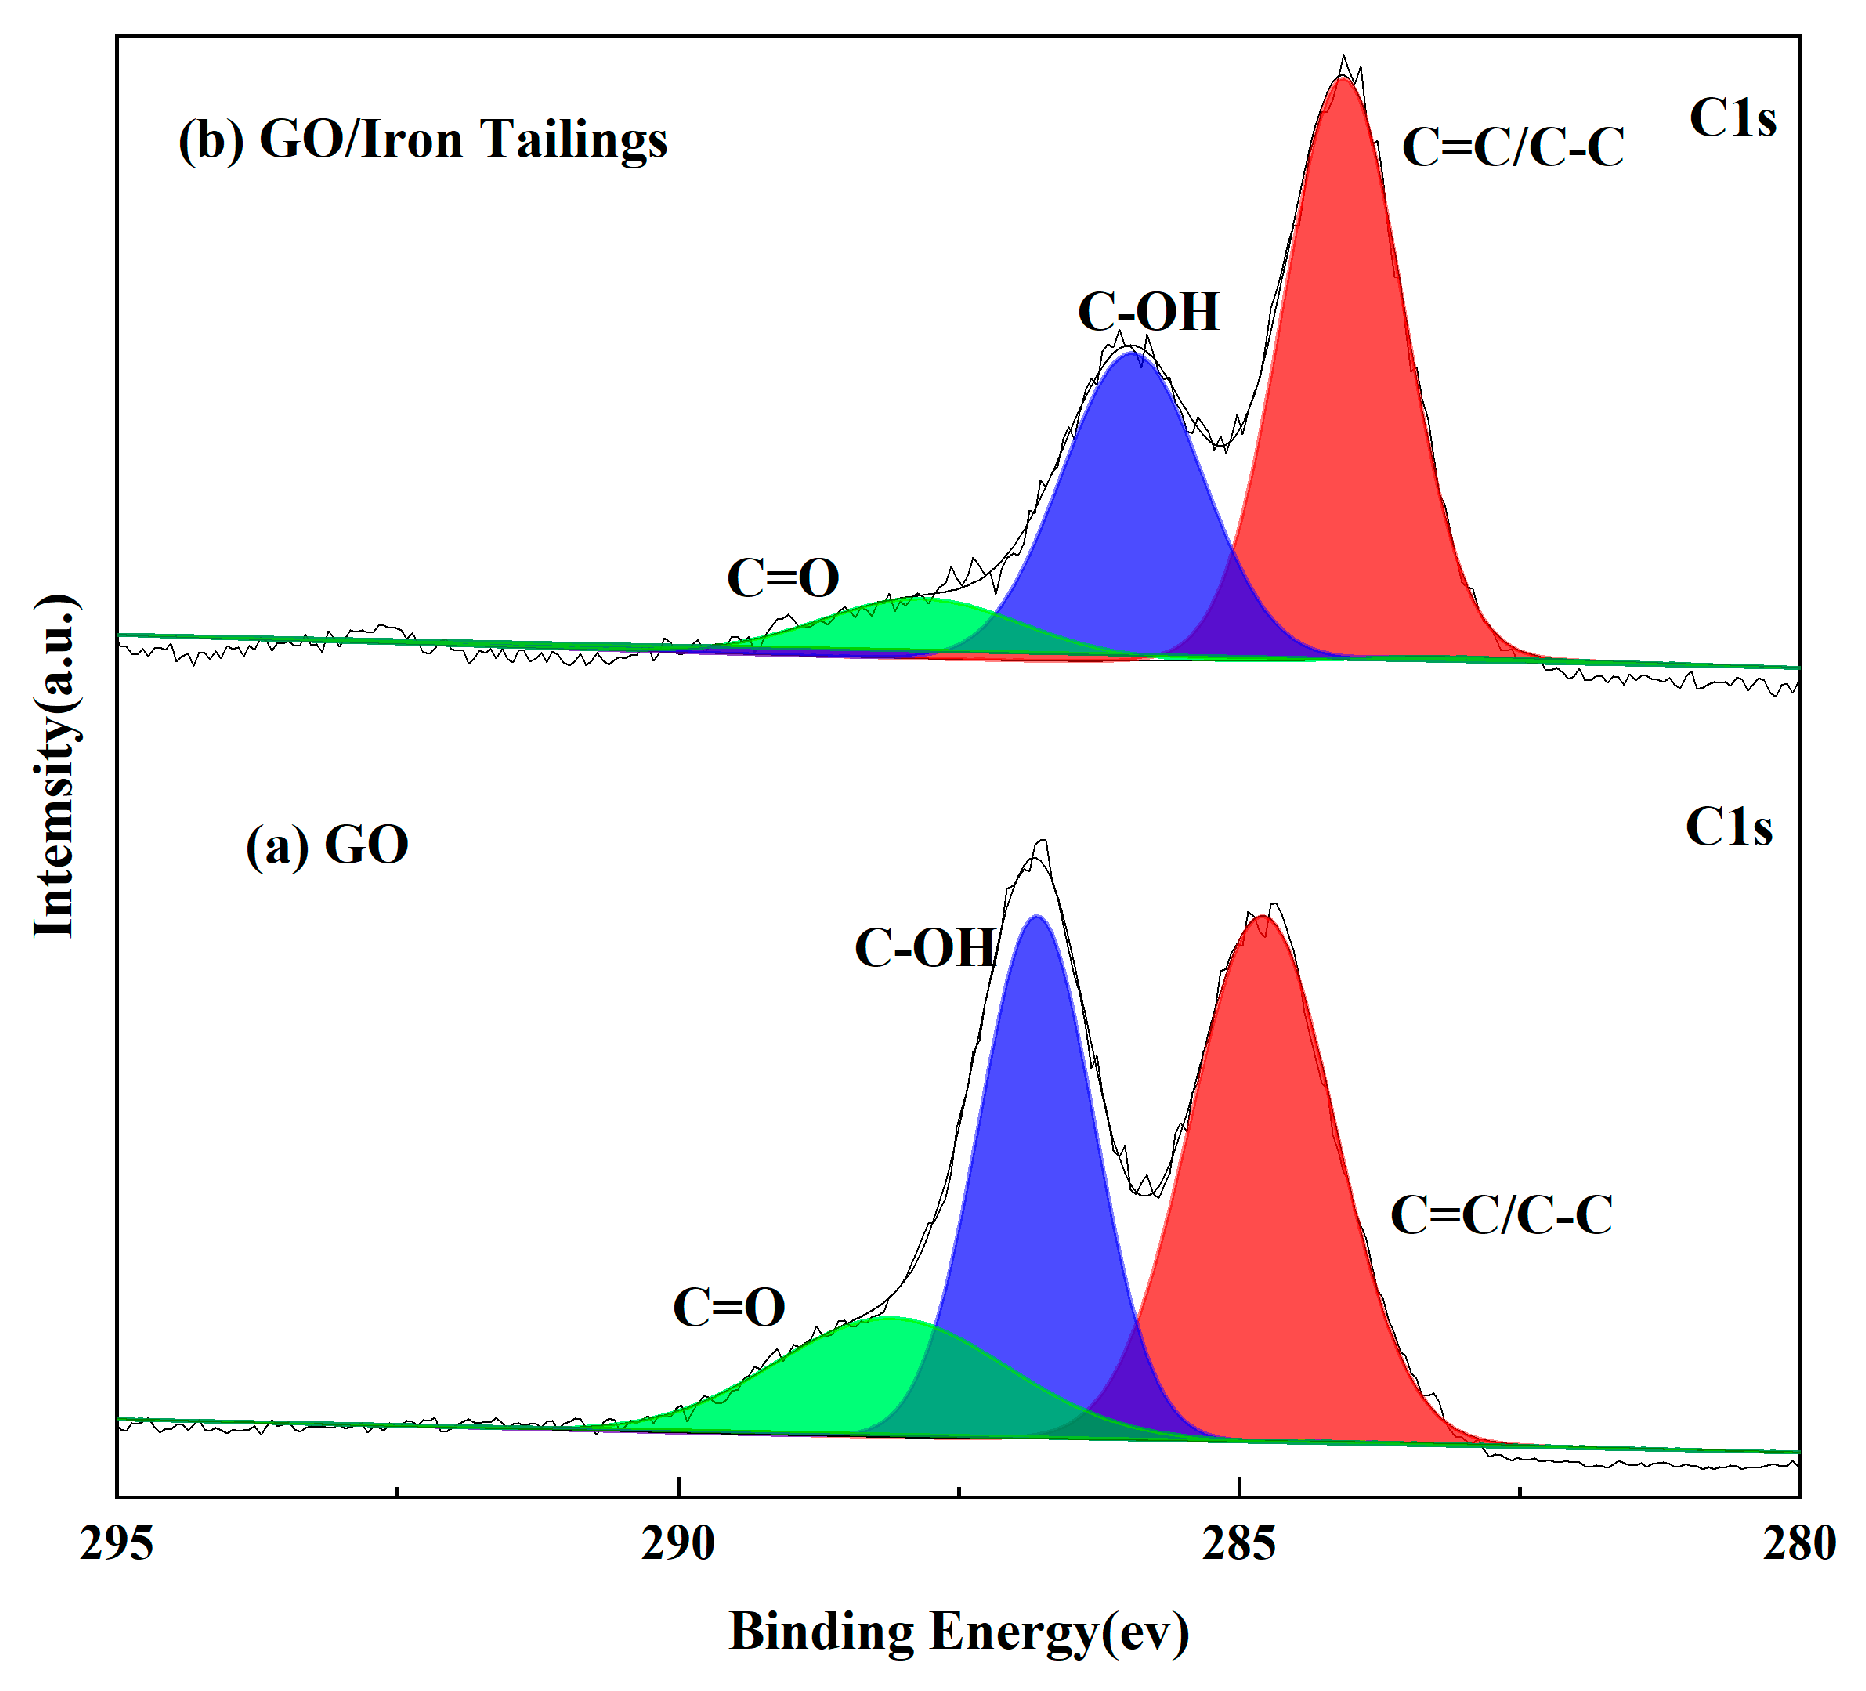
3.1.4. XPS
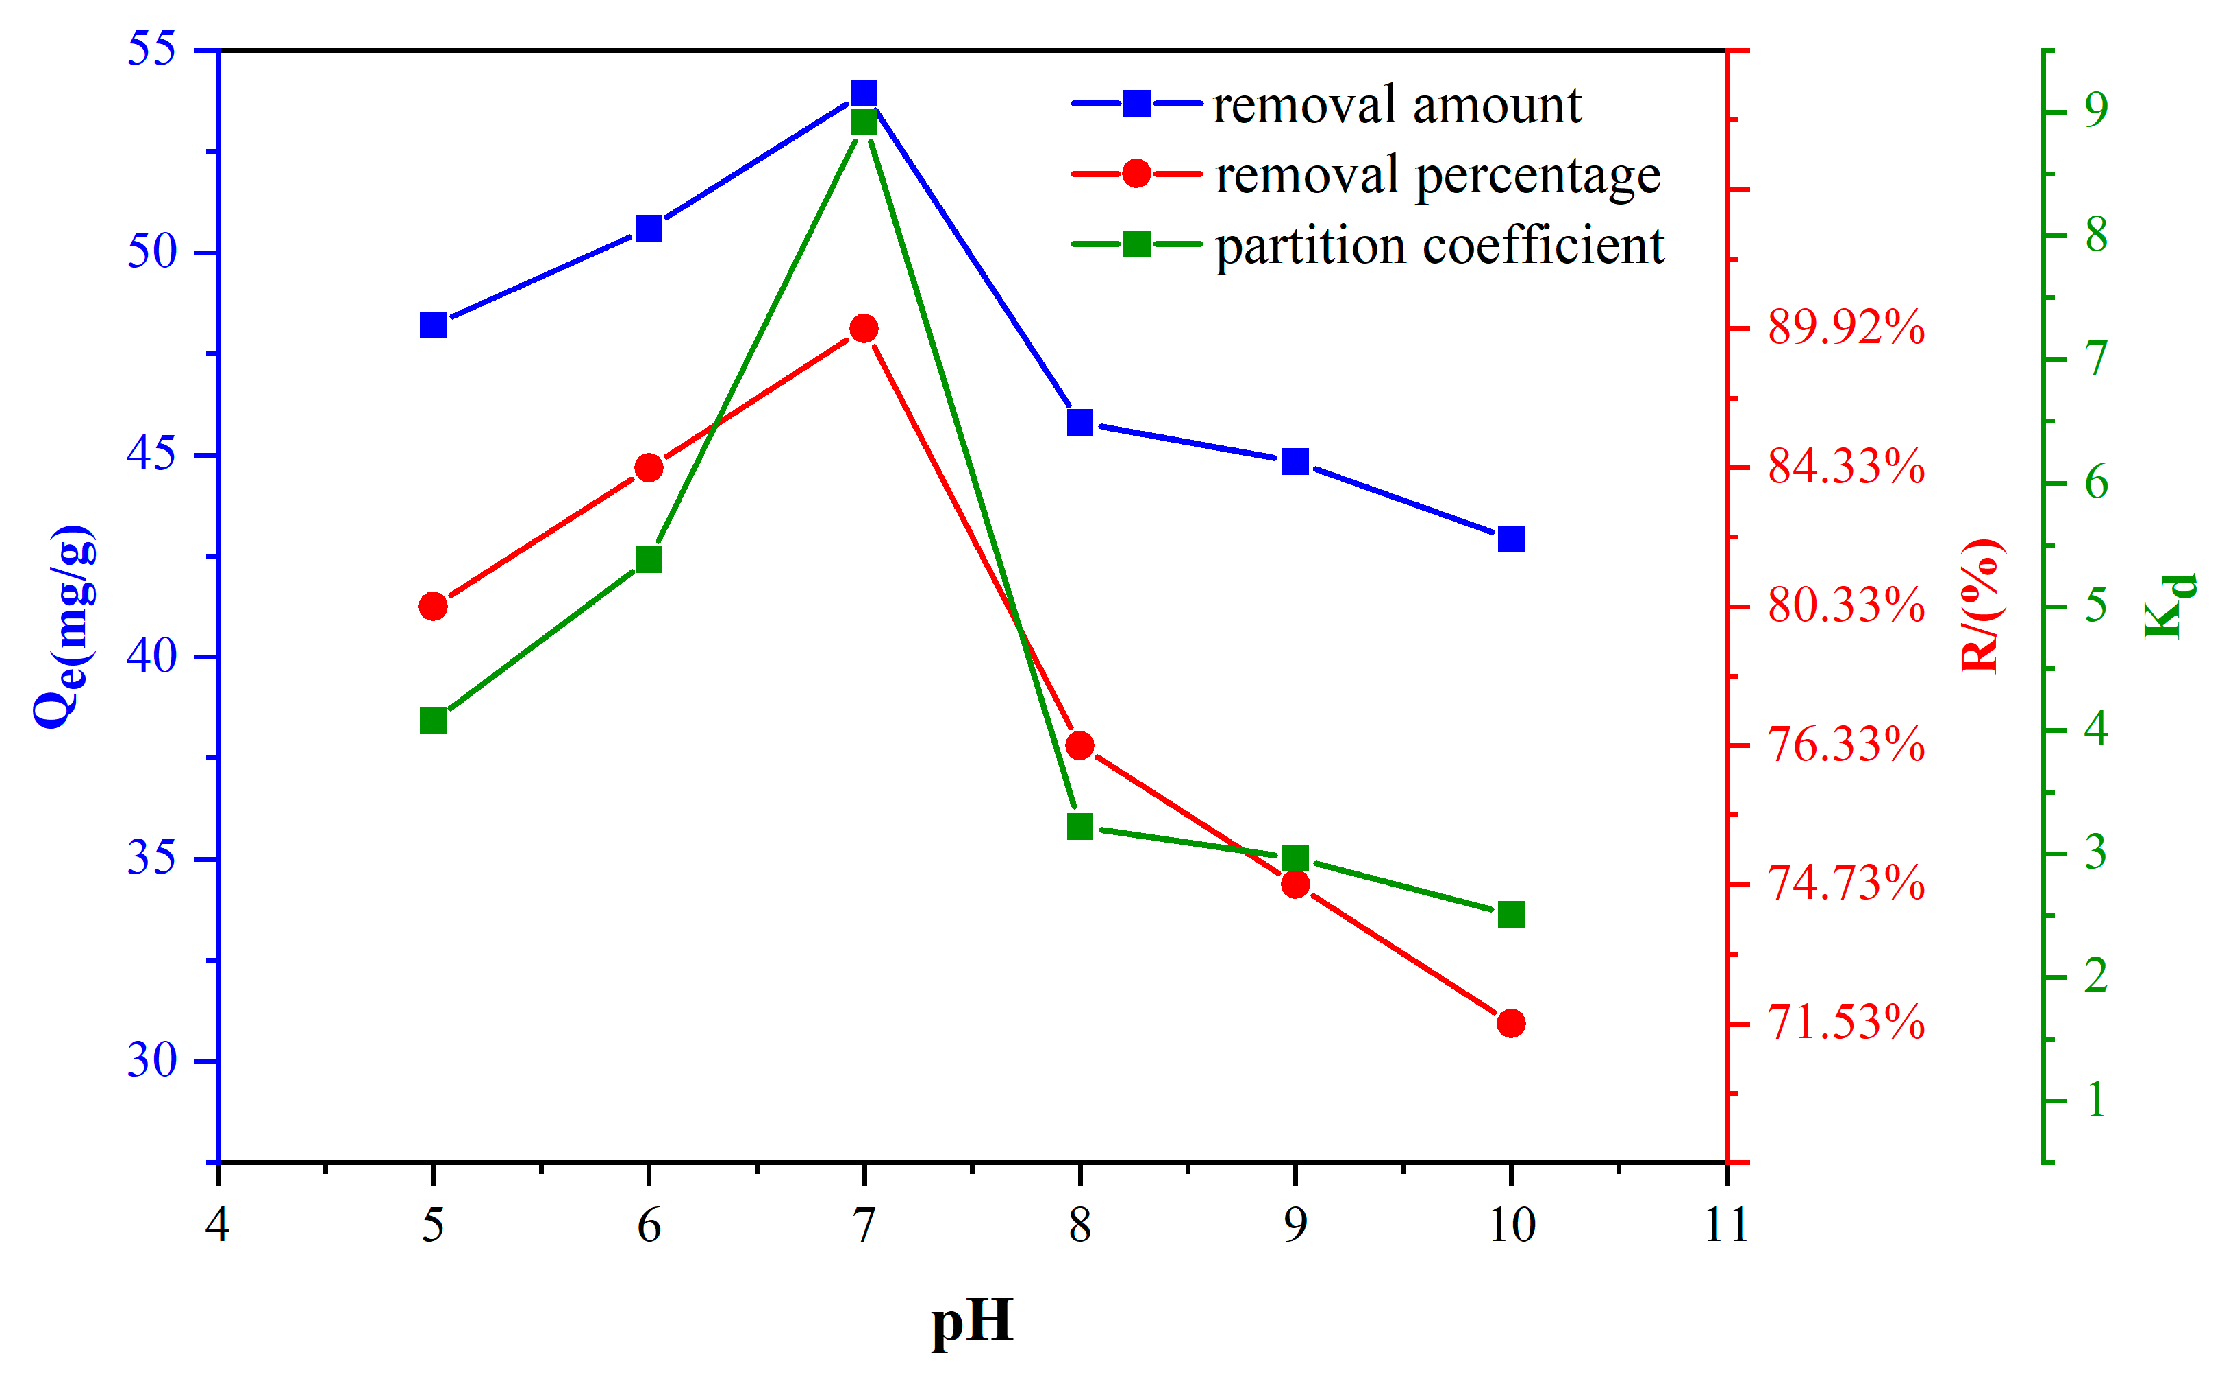
3.2. Effect of pH
3.3. Mass Effect of Iron Tailings
3.4. Effect of GO Content
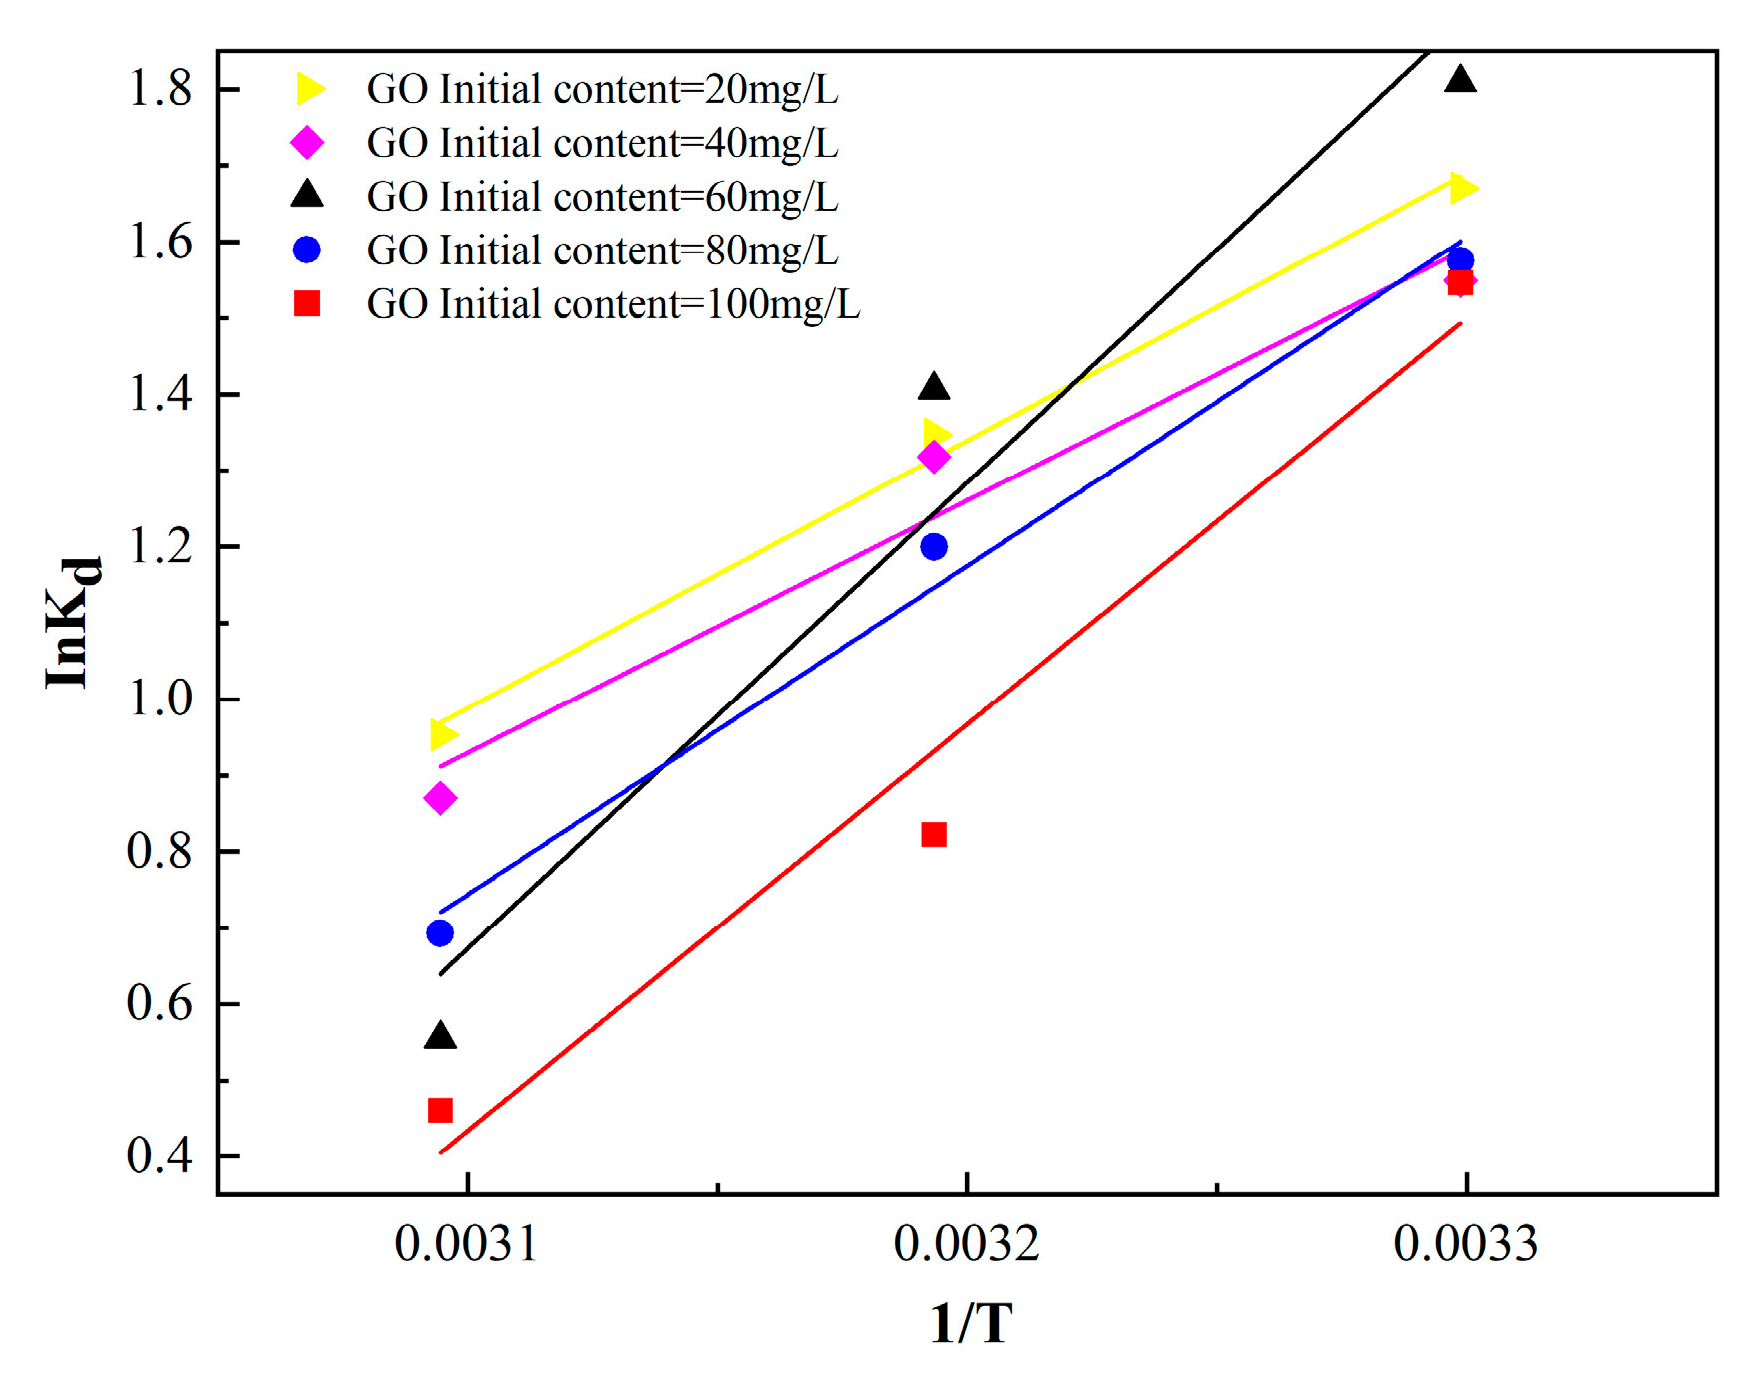
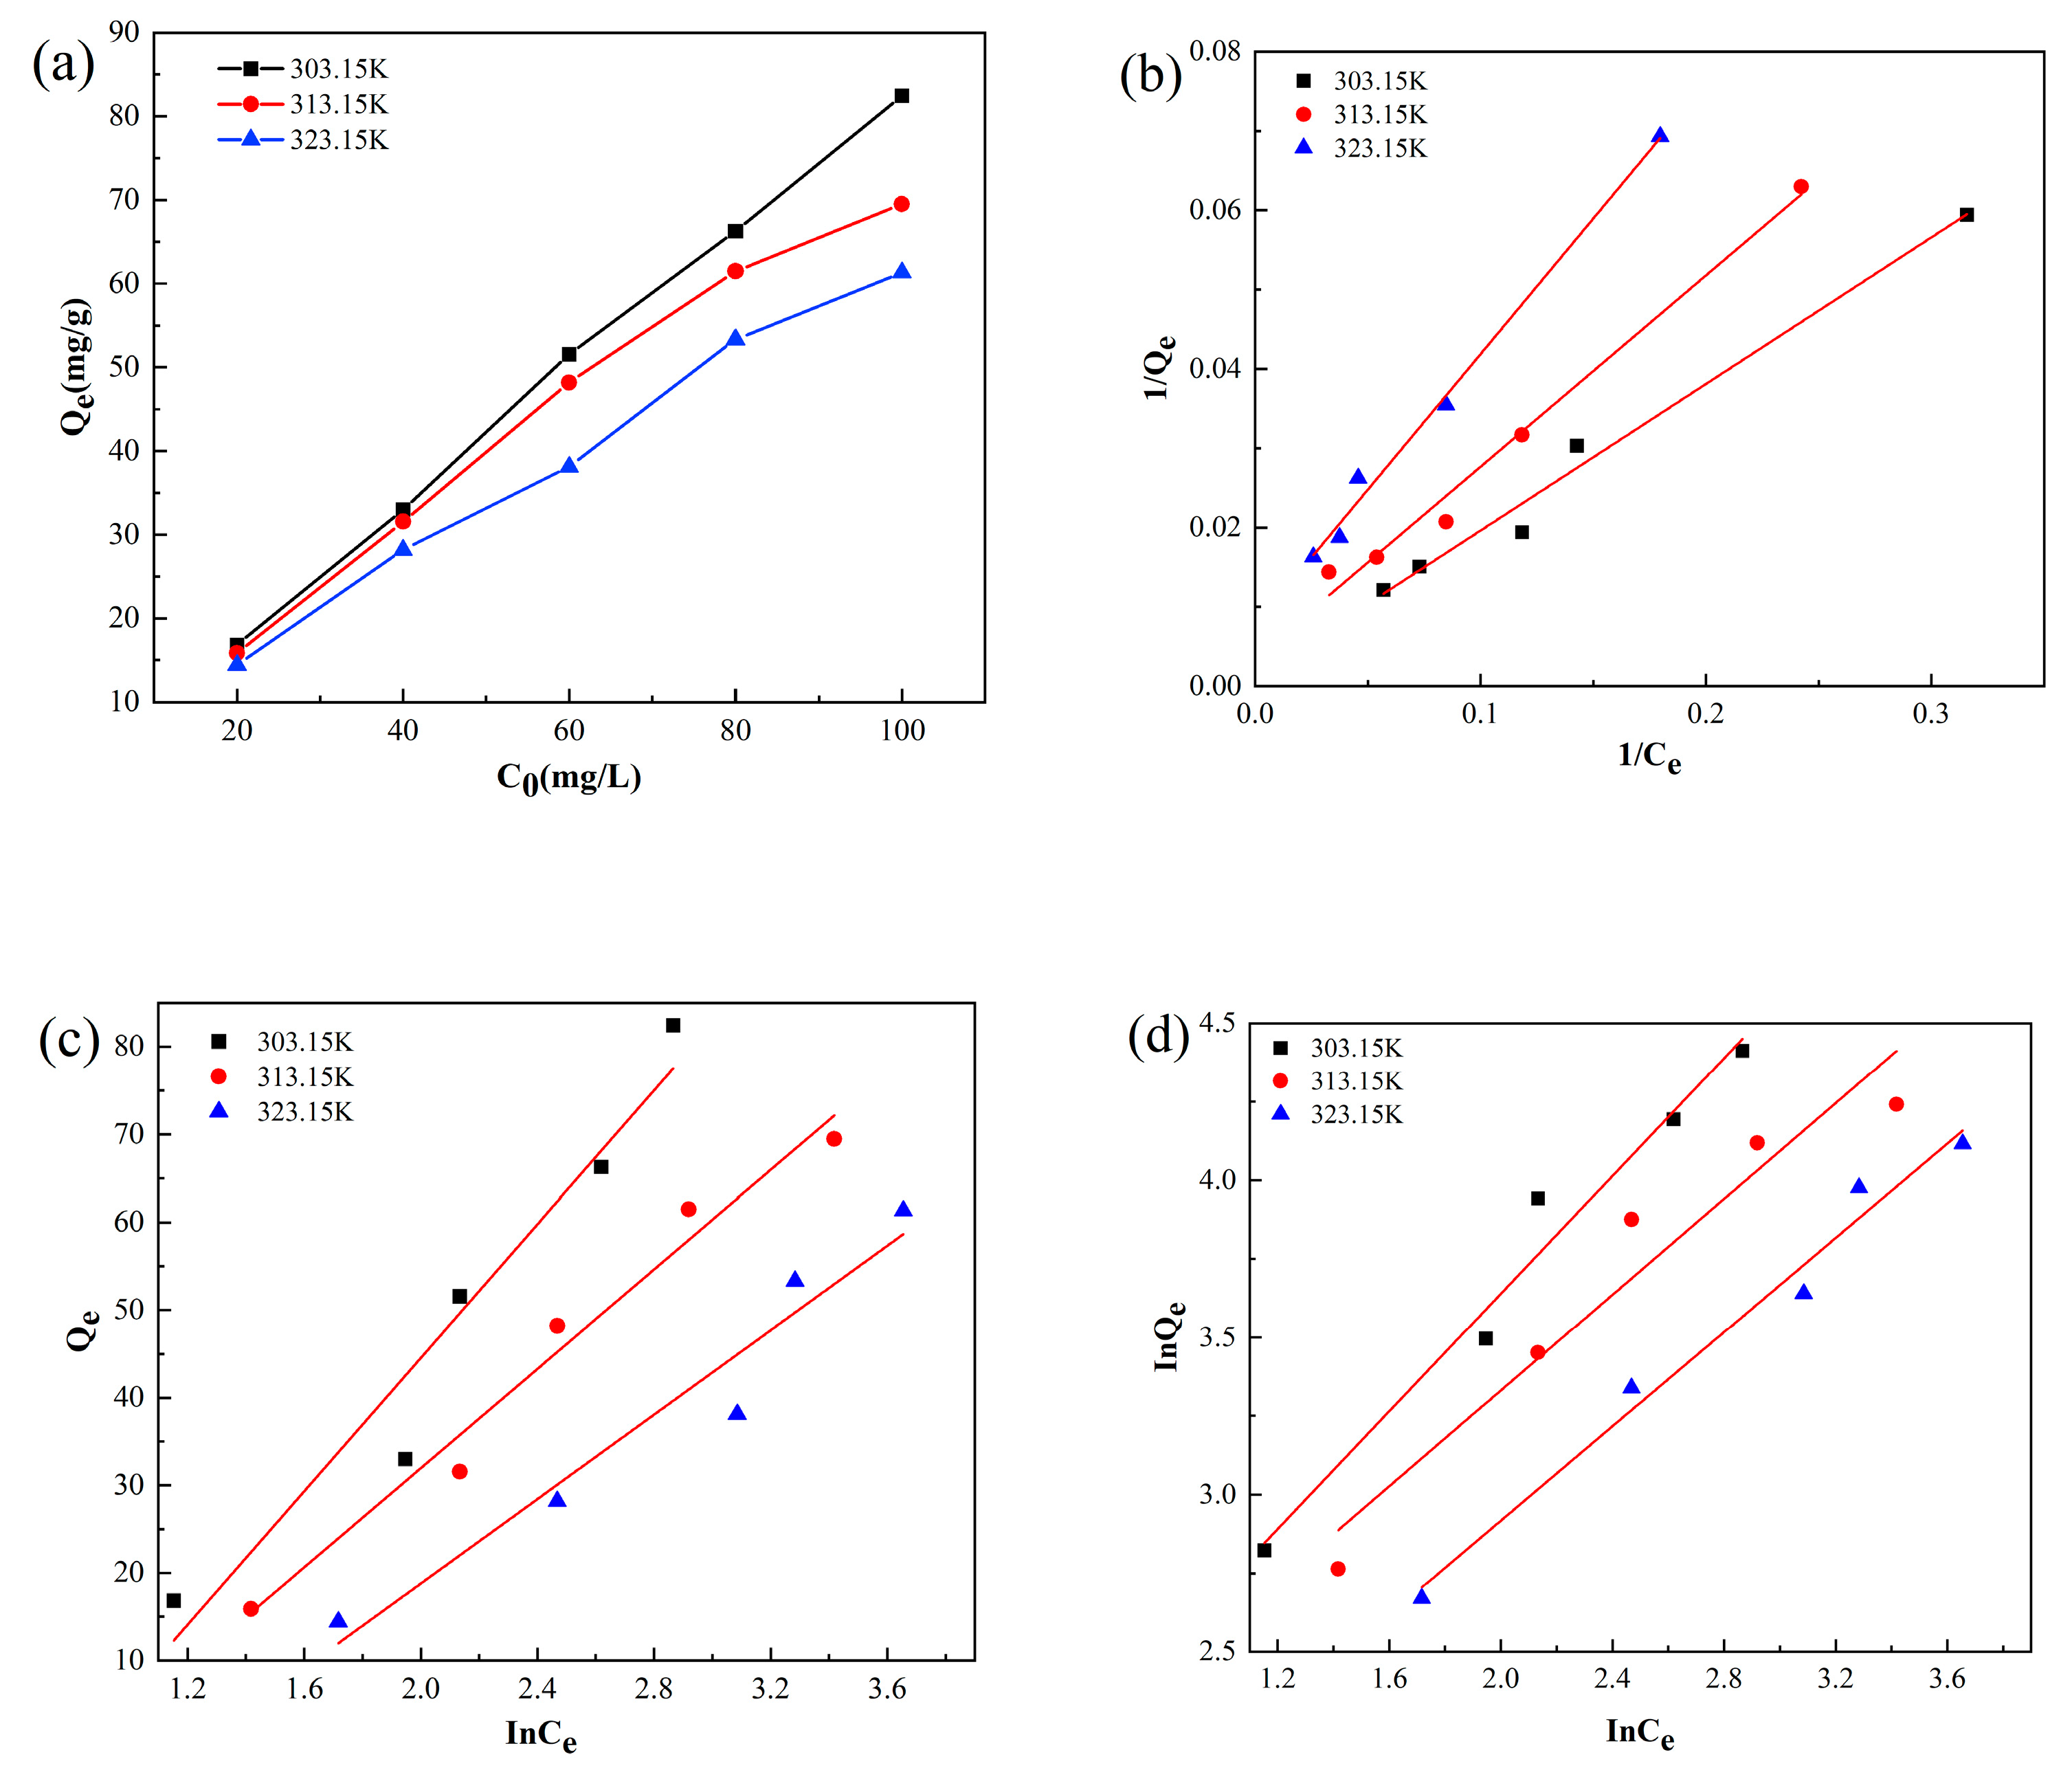
3.5. Adsorption Isotherm and Chemical Thermodynamics
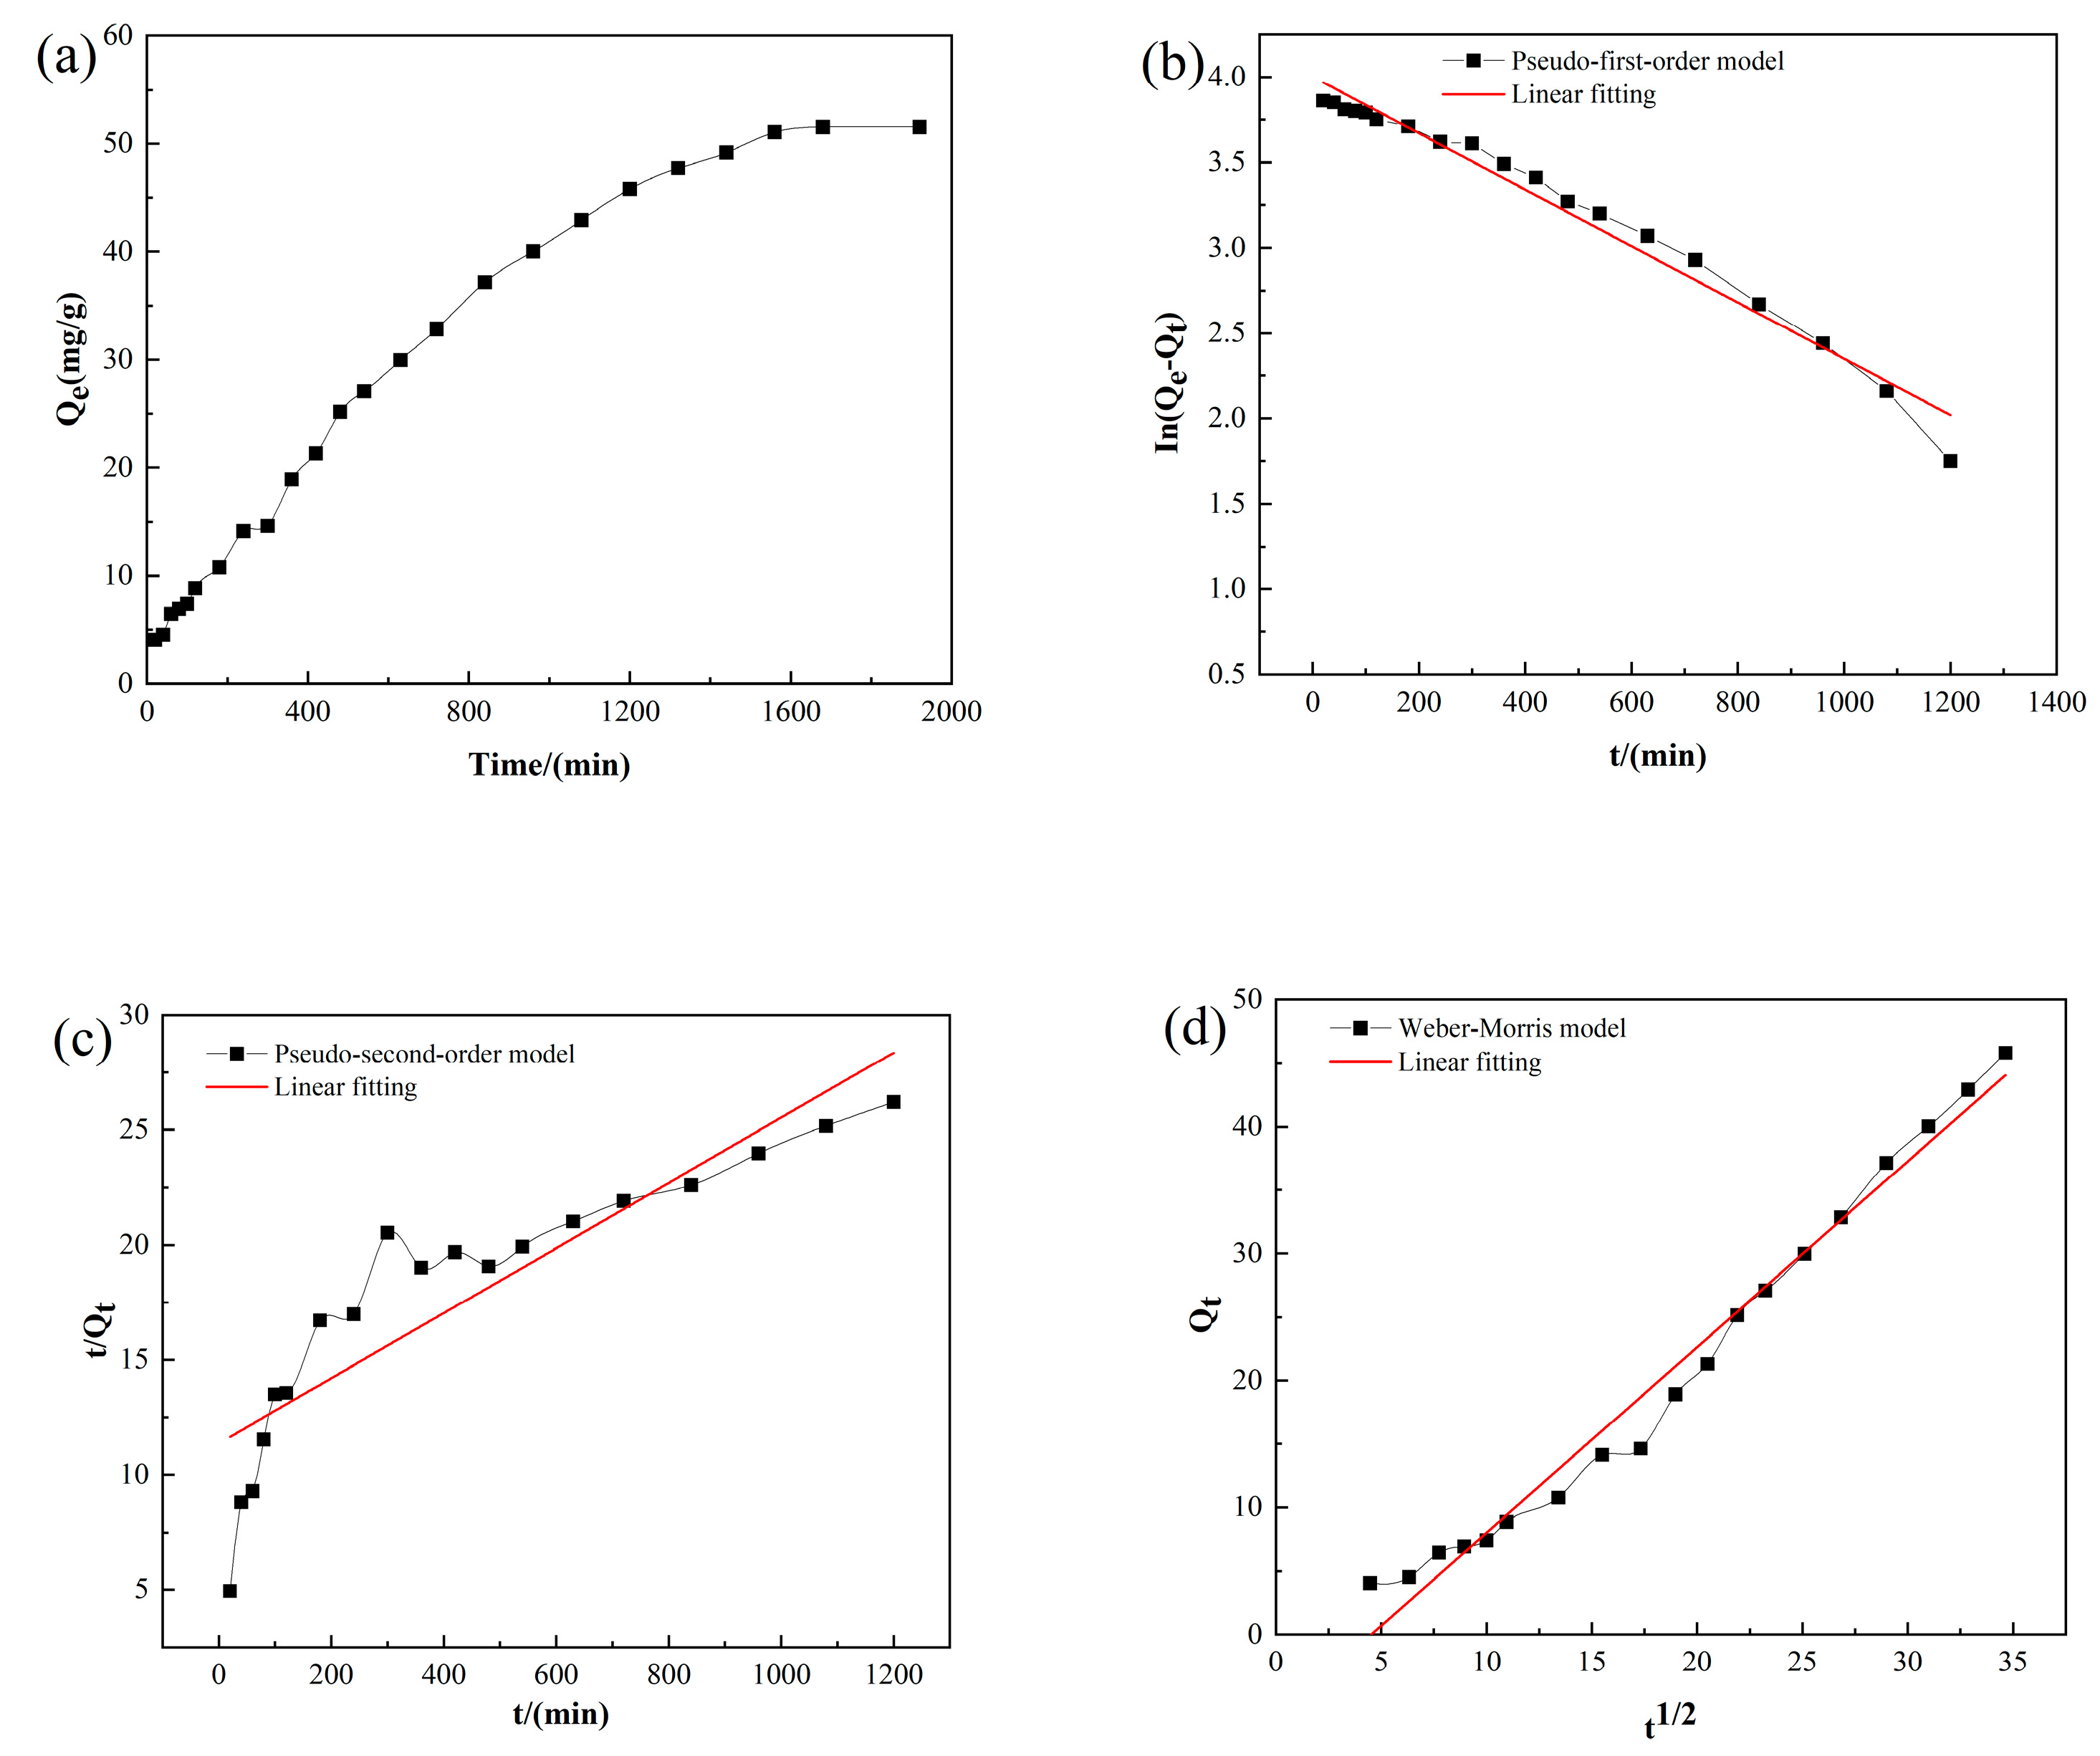
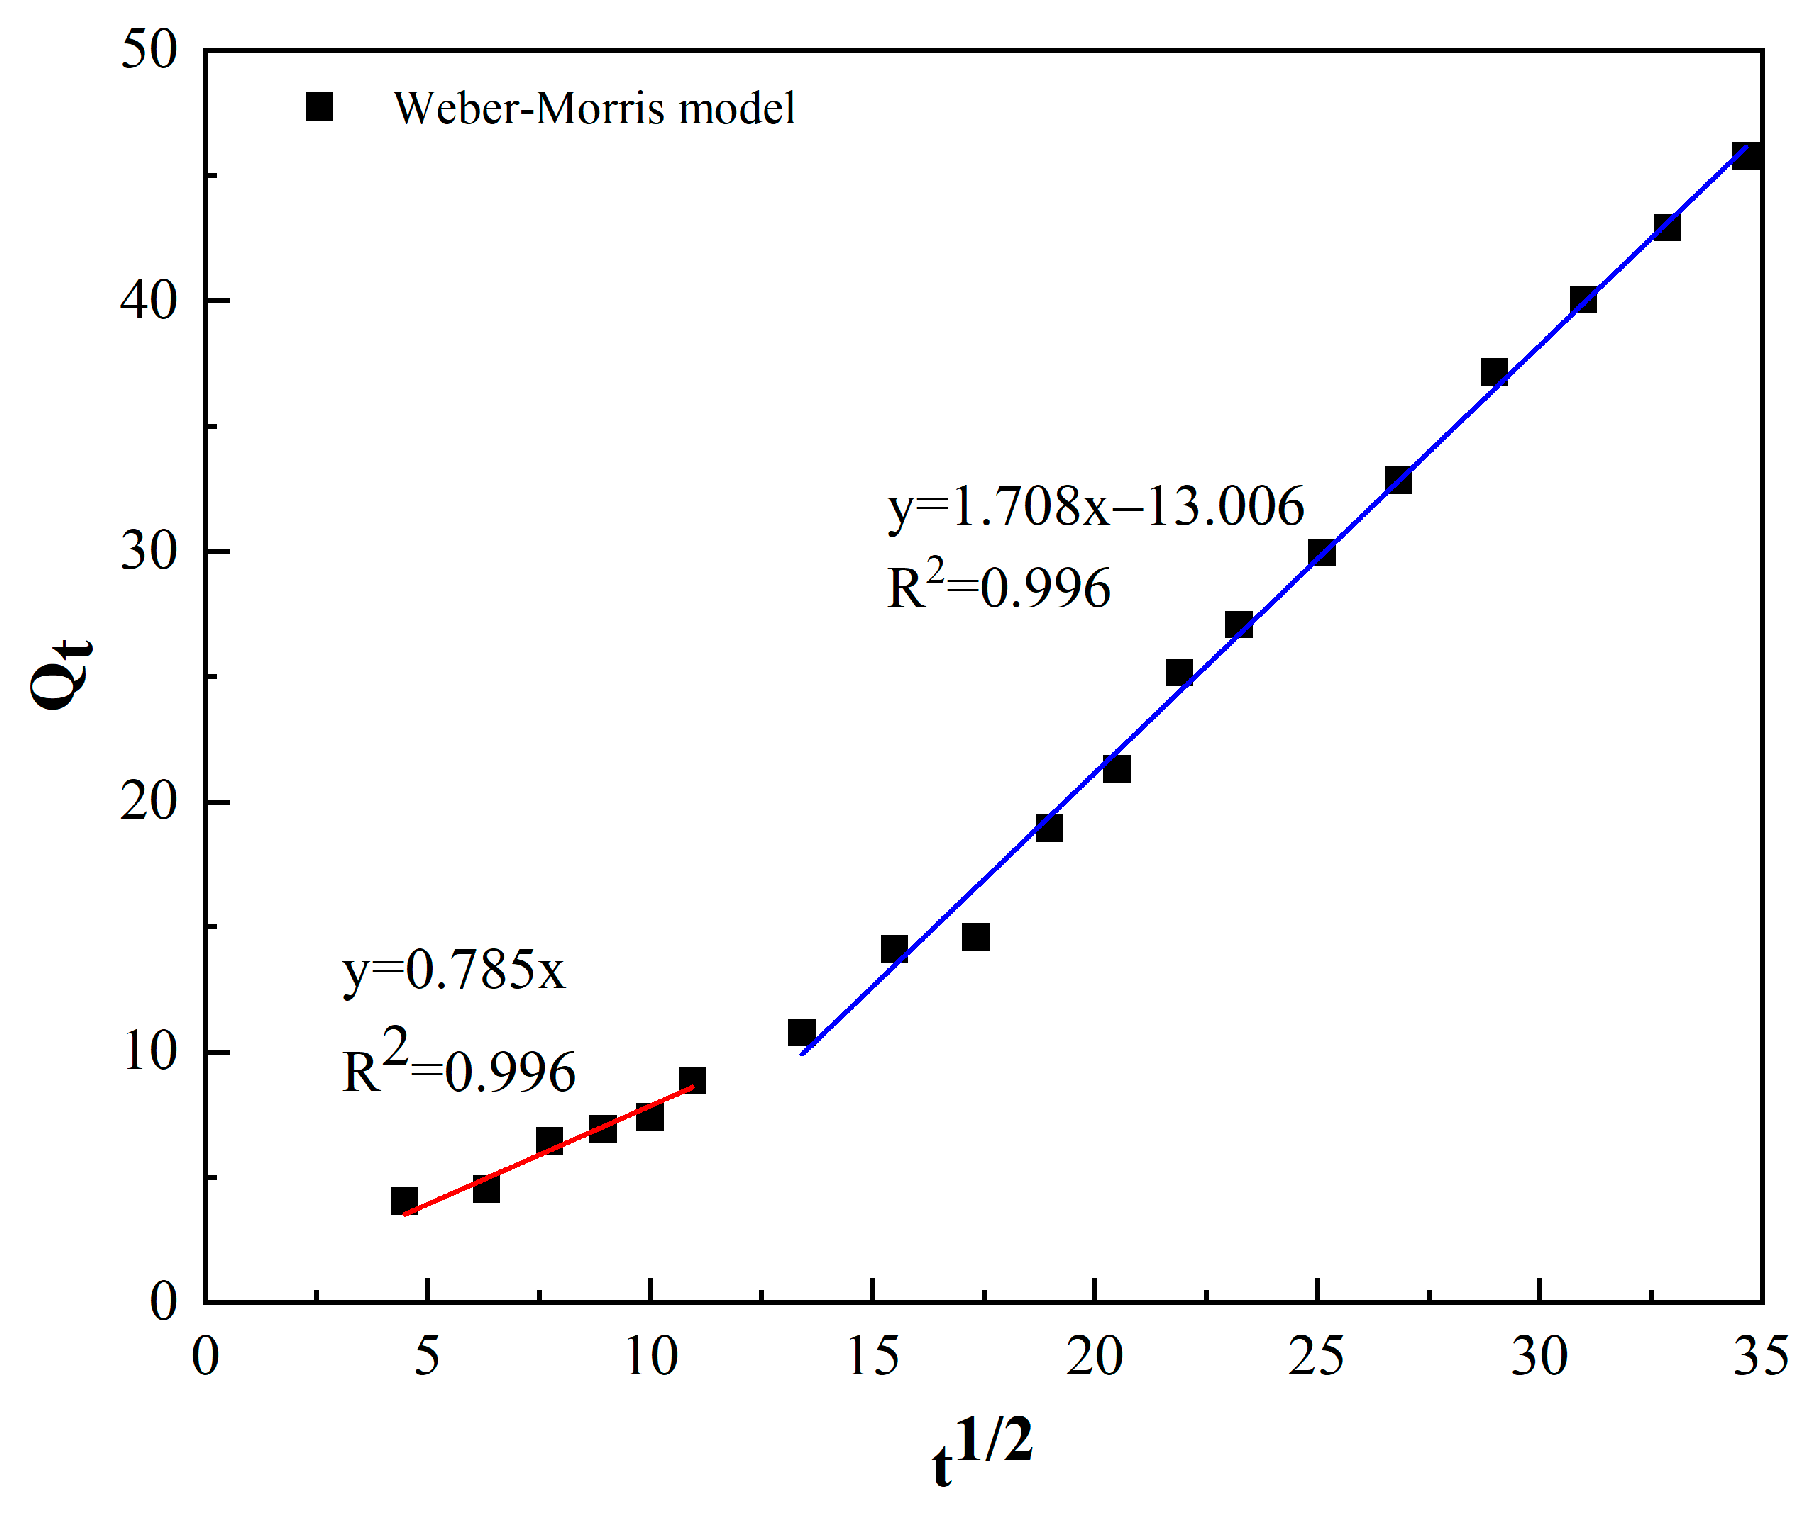
3.6. Adsorption Kinetics
4. Conclusions
Author Contributions
Funding
Institutional Review Board Statement
Informed Consent Statement
Data Availability Statement
Conflicts of Interest
References
- Mittal, H.; Al Alili, A.; Morajkar, P.P.; Alhassan, S.M. Graphene oxide crosslinked hydrogel nanocomposites of xanthan gum for the adsorption of crystal violet dye. J. Mol. Liquids. 2021, 323, 115034. [Google Scholar] [CrossRef]
- Sreeja, K.; Kumar, T.N. Effect of graphene oxide on fresh, hardened and mechanical properties of cement mortar. Mater. Today Proc. 2021, 46, 2235–2239. [Google Scholar] [CrossRef]
- Zhang, Y.; Wu, J.; Qu, Y.; Jia, L.; Jia, B.; Moss, D.J. Optimizing the Kerr nonlinear optical performance of silicon waveguides integrated with 2D graphene oxide films. J. Light. Technol. 2021. [Google Scholar] [CrossRef]
- Dhayal, V.; Hashmi, S.; Kumar, U.; Choudhary, B.; Dalela, S.; Dolia, S.; Dolia, S.N.; Alvi, P.A. Optical and electrical properties of biocompatible and novel (CS–GO) polymer nanocomposites. Opt. Quantum Electron. 2021, 53, 1–13. [Google Scholar] [CrossRef]
- Alkhouzaam, A.; Qiblawey, H.; Khraisheh, M. Polydopamine functionalized graphene oxide as membrane nanofiller: Spectral and structural studies. Membranes 2021, 11, 86. [Google Scholar] [CrossRef] [PubMed]
- Chen, D.; Feng, H.; Li, J. Graphene oxide: Preparation, functionalization, and electrochemical applications. Chem. Rev. 2012, 112, 6027–6053. [Google Scholar] [CrossRef]
- Paredes, J.; Villar-Rodil, S.; Martínez-Alonso, A.; Tascon, J. Graphene oxide dispersions in organic solvents. Langmuir 2008, 24, 10560–10564. [Google Scholar] [CrossRef]
- Xu, Y.; Zeng, J.; Chen, W.; Jin, R.; Li, B.; Pan, Z. A holistic review of cement composites reinforced with graphene oxide. Constr. Build Mater. 2018, 171, 291–302. [Google Scholar] [CrossRef]
- Long, W.-J.; Wei, J.-J.; Ma, H.; Xing, F. Dynamic mechanical properties and microstructure of graphene oxide nanosheets reinforced cement composites. Nanomaterials 2017, 7, 407. [Google Scholar] [CrossRef] [PubMed] [Green Version]
- Seabra, A.B.; Paula, A.J.; de Lima, R.; Alves, O.L.; Durán, N. Nanotoxicity of graphene and graphene oxide. Chem. Res. Toxicol. 2014, 27, 159–168. [Google Scholar] [CrossRef]
- Jia, P.-P.; Sun, T.; Junaid, M.; Yang, L.; Ma, Y.-B.; Cui, Z.-S.; Wei, D.P.; Shi, H.F.; Pei, D.S. Nanotoxicity of different sizes of graphene (G) and graphene oxide (GO) in vitro and in vivo. Environ. Pollut. 2019, 247, 595–606. [Google Scholar] [CrossRef]
- Kryuchkova, M.; Fakhrullin, R. Kaolin alleviates graphene oxide toxicity. Environ. Sci. Technol. Lett. 2018, 5, 295–300. [Google Scholar] [CrossRef]
- Zhang, C.; Qiu, J.; Liu, G.; Gan, F. Comprehensive utilization of tailings contributes to the construction of green mines. Cin. Min. Mag. 2019, 28, 135–137. (In Chinese) [Google Scholar]
- Yu, G.; Song, C.; Pan, Y.; Li, L.; Li, R.; Lu, S. Review of new progress in tailing dam safety in foreign research and current state with development trent in China. Chin. J. Rock Mech. Eng. 2014, 33, 3238–3248. [Google Scholar]
- Mehta, A.; Siddique, R. An overview of geopolymers derived from industrial by-products. Constr. Build Mater. 2016, 127, 183–198. [Google Scholar] [CrossRef]
- Li, N.; Lv, S.; Wang, W.; Guo, J.; Jiang, P.; Liu, Y. Experimental investigations on the mechanical behavior of iron tailings powder with compound admixture of cement and nano-clay. Constr. Build Mater. 2020, 254, 119259. [Google Scholar] [CrossRef]
- Jiang, P.; Qiu, L.; Li, N.; Wang, W.; Zhou, A.; Xiao, J. Shearing performance of lime-reinforced iron tailing powder based on energy dissipation. Adv. Civil Eng. 2018, 2018, 4748526. [Google Scholar] [CrossRef]
- Dash, M.; Dwari, R.; Biswal, S.; Reddy, P.; Chattopadhyay, P.; Mishra, B. Studies on the effect of flocculant adsorption on the dewatering of iron ore tailings. Chem. Eng. J. 2011, 173, 318–325. [Google Scholar] [CrossRef]
- de Andrade, M.B.; Guerra, A.C.S.; dos Santos, T.R.T.; Cusioli, L.F.; de Souza Antônio, R.; Bergamasco, R. Simplified synthesis of new GO-α-γ-Fe2O3-Sh adsorbent material composed of graphene oxide decorated with iron oxide nanoparticles applied for removing diuron from aqueous medium. J. Environ. Chem. Eng. 2020, 8, 103903. [Google Scholar] [CrossRef]
- Nethaji, S.; Sivasamy, A. Graphene oxide coated with porous iron oxide ribbons for 2, 4-Dichlorophenoxyacetic acid (2, 4-D) removal. Ecotoxicol. Environ. Saf. 2017, 138, 292–297. [Google Scholar] [CrossRef] [PubMed]
- Wang, W.; Li, Y.; Yao, K.; Li, N.; Zhou, A.; Zhang, C. Strength properties of nano-MgO and cement stabilized coastal silty clay subjected to sulfuric acid attack. Mar. Georesour. Geotechol. 2020, 38, 1177–1186. [Google Scholar] [CrossRef]
- Muthukannan, V.; Praveen, K.; Natesan, B. Fabrication and characterization of magnetite/reduced graphene oxide composite incurred from iron ore tailings for high performance application. Mater. Chem. Phys. 2015, 162, 400–407. [Google Scholar] [CrossRef]
- Liu, S.; Li, Q.; Zhao, X. Hydration kinetics of composite cementitious materials containing copper tailing powder and graphene oxide. Materials. 2018, 11, 2499. [Google Scholar] [CrossRef] [PubMed] [Green Version]
- Kang, H.; Gu, J.; Liu, G.; Li, B.; Wang, W. Performance and Mechanism of Layered Double Hydroxide to Remove Graphene Oxide in Aqueous Solution. Nat. Environ. Pollut. Tech. 2021, 20, 55–62. [Google Scholar] [CrossRef]
- Zhang, Y.; Zhang, Y.; Shi, X. Effect of pH on biochar adsorption of norfloxacin and sulfamethoxazole. J. Agric. Resour. Environ. 2020, 379, 552–561. (In Chinese) [Google Scholar]
- Zhou, X.; Gao, J.; Huang, H.; Ji, X.; Wu, Q. The characteristics and the mechanism of tellurium(IV) adsorption on graphene oxide. Acta Sci. Circumstantiae 2018, 38, 208–216. [Google Scholar]
- Algothmi, W.M.; Bandaru, N.M.; Yu, Y.; Shapter, J.G.; Ellis, A.V. Alginate–graphene oxide hybrid gel beads: An efficient copper adsorbent material. J. Colloid Interface Sci. 2013, 397, 32–38. [Google Scholar] [CrossRef] [PubMed]
- Lei, W.; Chengling, B.; Zhenya, Z. Adsorption properties and mechanism of Pb (Ⅱ) ions adsorbed by graphene oxide/sodium alginate composite membrane. Acta Mater. Comp. Sin. 2020, 37, 681–689. [Google Scholar]
- Xiaodan, X.; Jianfeng, Z.; Zhenxing, L.; Yin, L. Desorption of adsorbed Pb (Ⅱ) on graphene oxide under alkaline groundwater conditions. Environ. Chem. 2019, 12, 2672–2681. (In Chinese) [Google Scholar]
- Yang, X.; Chen, C.; Li, J.; Zhao, G.; Ren, X.; Wang, X. Graphene oxide-iron oxide and reduced graphene oxide-iron oxide hybrid materials for the removal of organic and inorganic pollutants. RSC Adv. 2012, 2, 8821–8826. [Google Scholar] [CrossRef]
- Rourke, J.P.; Pandey, P.A.; Moore, J.J.; Bates, M.; Kinloch, I.A.; Young, R.J.; Wilson, N.R. The real graphene oxide revealed: Stripping the oxidative debris from the graphene-like sheets. Angew. Chem. 2011, 123, 3231–3235. [Google Scholar] [CrossRef] [Green Version]
- Pereira, I.; Carvalho, K.; Passig, F.; Ferreira, R.; Rizzo-Domingues, R.; Hoppen, M.; Hoppen, M.I.; Macioski, G.; Nagalli, A.; Perretto, F. Thermal and thermal-acid treated sewage sludge for the removal of dye reactive Red 120: Characteristics, kinetics, isotherms, thermodynamics and response surface methodology design. J. Environ. Chem Eng. 2018, 6, 7233–7246. [Google Scholar] [CrossRef]
- Chang, Y.S.; Au, P.I.; Mubarak, N.M.; Khalid, M.; Jagadish, P.; Walvekar, R.; Abdullah, E.C. Adsorption of Cu (II) and Ni (II) ions from wastewater onto bentonite and bentonite/GO composite. Environ. Sci. Pollut. R. 2020, 27, 33270–33296. [Google Scholar] [CrossRef] [PubMed]
- Wang, D.-w.; Song, Y.-x.; Qian, G.; Wang, S.-y.; Cheng, Z. Study on Adsorption of Two Sulfonamide Antibiotics by Graphene Oxide. Chin. J. Anal. Chem. 2018, 46, 211–216. [Google Scholar]
- Ge, H.; Hua, T.; Chen, X. Selective adsorption of lead on grafted and crosslinked chitosan nanoparticles prepared by using Pb2+ as template. J. Hazard. Mater. 2016, 308, 225–232. [Google Scholar] [CrossRef]
- Wang, X.; Peng, G.; Yang, Y.; Wang, Y.; He, T. Uranium adsorption by dry and wet immobilized Saccharomyces cerevisiae. J. Radioanal. Nuclear Chem. 2012, 291, 825–830. [Google Scholar] [CrossRef]
- Lupul, I.; Yperman, J.; Carleer, R.; Gryglewicz, G. Adsorption of atrazine on hemp stem-based activated carbons with different surface chemistry. Adsorption 2015, 21, 489–498. [Google Scholar] [CrossRef] [Green Version]


| C0 (mg/L) | pH | Temperature (K) | Langmuir | Freundlich | Temkin | ||||||
|---|---|---|---|---|---|---|---|---|---|---|---|
| Qm (mg/g) | KL (L/mg) | R2 | KF (mg/g) | n | R2 | KT (L/mg) | C | R2 | |||
| 60 | 7 | 303.13 K | 909.091 | 0.006 | 0.986 | 5.853 | 1.068 | 0.973 | 0.436 | 38.095 | 0.947 |
| 313.13 K | 285.714 | 0.015 | 0.987 | 6.095 | 1.313 | 0.939 | 0.418 | 28.334 | 0.976 | ||
| 323.13 K | 129.87 | 0.023 | 0.993 | 4.129 | 1.334 | 0.981 | 0.295 | 24.097 | 0.947 | ||
| C0 (mg/L) | ΔG (kJ/mol) | ΔH (kJ/mol) | ΔS (J/mol·K) | ||
|---|---|---|---|---|---|
| 303.15 K | 313.15 K | 323.15 K | |||
| 20 | −4.210 | −3.507 | −2.560 | −29.860 | −82.177 |
| 40 | −3.905 | −3.431 | −2.339 | −27.545 | −77.660 |
| 60 | −4.560 | −3.663 | −1.491 | −50.856 | −152.056 |
| 80 | −3.969 | −3.124 | −1.860 | −35.862 | −104.987 |
| 100 | −3.897 | −2.142 | −1.239 | −44.342 | −133.855 |
| C0 (mg/L) | pH | Temperature (K) | Qe (mg/g) | Pseudo-First Order Model | Pseudo-Second Order Model | Weber–Morris Model | ||||||
|---|---|---|---|---|---|---|---|---|---|---|---|---|
| Qe | k1 | R2 | Qe | k2 | R2 | kint | C | R2 | ||||
| 60 | 7 | 303 K | 51.55 | 54.59 | 0.0017 | 0.974 | 70.423 | 0.000018 | 0.801 | 1.463 | −6.629 | 0.98 |
Publisher’s Note: MDPI stays neutral with regard to jurisdictional claims in published maps and institutional affiliations. |
© 2021 by the authors. Licensee MDPI, Basel, Switzerland. This article is an open access article distributed under the terms and conditions of the Creative Commons Attribution (CC BY) license (https://creativecommons.org/licenses/by/4.0/).
Share and Cite
Zhou, J.; Yao, L.; Wang, Y.; Zhao, W.; Gu, J. Study on the Adsorption Properties of Iron Tailings for GO. Coatings 2021, 11, 768. https://doi.org/10.3390/coatings11070768
Zhou J, Yao L, Wang Y, Zhao W, Gu J. Study on the Adsorption Properties of Iron Tailings for GO. Coatings. 2021; 11(7):768. https://doi.org/10.3390/coatings11070768
Chicago/Turabian StyleZhou, Jiawei, Liming Yao, Yunfeng Wang, Weiqi Zhao, and Jiahui Gu. 2021. "Study on the Adsorption Properties of Iron Tailings for GO" Coatings 11, no. 7: 768. https://doi.org/10.3390/coatings11070768
APA StyleZhou, J., Yao, L., Wang, Y., Zhao, W., & Gu, J. (2021). Study on the Adsorption Properties of Iron Tailings for GO. Coatings, 11(7), 768. https://doi.org/10.3390/coatings11070768