Abstract
This paper aims to theoretically study the concept of a photonic salinity and temperature sensor according to a deformed one-dimensional photonic structure. The fundamental capability of the proposed sensor is studied. Simultaneously we search to optimize the thickness of the structure and to get the maximum salinity and temperature sensitivity. The structure is constructed by alternating layers of TiO2 and fused-silica P times. In the middle of the structure, a cavity containing seawater is inserted to measure its salinity and temperature. The transfer matrix method (TMM) is used to simulate the wave-transmittance spectra. It is shown that the quality factor (Q-factor) of the resonance peaks depends on the number (P) of layers. After that, the thickness of the layers is deformed by changing the deformation degree (h). The parameters P and h are optimized to get the maximal Q-factor with the minimal number of layers and structure thickness. The best sensitivity SS of the proposed salinity sensor is 558.82 nm/RFIU with a detection limit of 0.0034 RFIU. In addition, the best sensitivity ST of the designed temperature sensor is 600 nm/RFIU with a detection limit of 0.0005 RFIU.
1. Introduction
The health of living organisms such as humans, plants and animals depends on the quality of water (like the absence of bacteria and a low level of mineral salts) [1]. Regarding seawater, the salinity ratio varies from 3.5% (35 g/L) in the Earth’s oceans to 26% (260 g/L) in the Dead Sea [2]. Water with a salinity level of less than 600 mg/L (0.06%) is regarded as good quality drinking water [3]. Consequently, there is a need to develop an accurate sensing device for salinity measurement [1]. The electronic sensing devices in industrial and biological fields have become a necessity nowadays. They have evolved steadily since the invention of electricity, the development of control circuits and electronic chips. However, these electronic devices are sensitive to surrounding factors like electromagnetic fields, heat and humidity. In addition, their accuracy is affected by the “Joule effect” [4], which is known to raise the temperature of electronic devices due to the flow of electrons inside them. In addition, portable versions of these devices have a high disposable batteries consumption, which in turn is considered a source of pollution to the environment.
The emergence of photonic structures proposed by John [5] and by Yablonovitch [6] makes it possible to eliminate some problems of older electronic devices such as the Joule effect [4]. These structures also known as photonic band gap materials are made by alternating two or more different materials. They represent the optical analogy to a crystal lattice, where atoms or molecules are periodically arranged and the periodic potential introduces gaps into the energy band structure of the crystal [7,8]. There are three different families of photonic structures, according to the direction of materials alternation, namely one-dimensional (1D), two-dimensional (2D) and three-dimensional (3D) structures [5,6]. In addition, the alternation of materials can be periodic or quasi-periodic (where the alternation of materials follows mathematical sequences). The most known quasiperiodic structures are Fibonacci [9,10,11,12], Thue–Morse [13,14,15] and Cantor [11,16] structures. Photonic structures [17] represent a serious opportunity for researchers to study and improve their properties to be suitable for sensing applications [18]. They can be used for salinity sensing [1,19], for D-glucose sensing [20], for temperature [15,19] and pressure sensing [15], for humidity sensing [21], for hemoglobin sensing [22] and for cancer cell detection [23]. These devices are known for their accurate and precise response, and they have less energy consumption with a rapid response because photons are faster than electrons (photons move at a speed of 3 × 10⁸ m/s) [17]. In previous research papers 1D and 2D photonic structures were proposed to measure salinity and water temperature [1,19].
2. Problem Formulation
2.1. Photonic Structure Design
To simulate wave transmittance through a photonic structure containing a seawater layer as a defect, the TMM (introduced by Yeh and Yariv [24]) is deployed. The sensitivity of the optical properties to salinity and temperature variations of seawater is studied. The studied photonic structure is constructed by alternating TiO2 and fused silica (F) as two elementary layers, and at the middle of the structure we find a cavity containing seawater (S), of which we want to measure salinity and temperature (see Figure 1). In the studied spectral range [1–2 μm], the refractive index of amorphous titanium dioxide thin films is assumed to be independent of wavelength [25]. In addition, the refractive index of the TiO2 films reveals no significant dependence on temperature when the film thickness increases more than ~200 nm [26]. Therefore, for this study the refractive index of the TiO2 layers will be fixed at . The refractive index of the fused silica () as a function of wavelength and temperature is determined via Sellmier’s equation [1,27]:
where and T represent the free space wavelength () and the temperature (°C), respectively. The thicknesses of the TiO2 and fused silica layers fulfill the Bragg condition , where is the reference wavelength of the structure. The refractive index of the seawater cavity defect depends on the probing wavelength , the salinity percentage S (%) and the temperature T (°C) [1,28,29]:
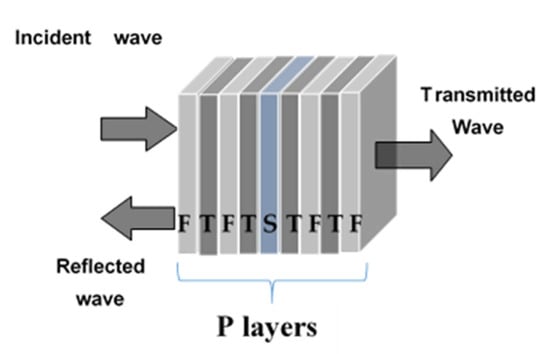
Figure 1.
Schematic representation showing a periodic photonic crystal with the middle cavity containing the seawater, where F is the fused silica layer, T is the TiO2 layer and S is the seawater layer.
is represented in refractive index units (RFIU). The thickness of the seawater cavity obeys the condition .
The thermal expansion of the TiO2 and the fused silica layers are not the same. In addition, the duration of stay of the seawater in the cavity is not determined and we do not know the period necessary to have a heat exchange between the cavity and the rest of the structure. Therefore, and to simplify the simulation, the thermal expansion of the structure was not taken into account.
2.2. Quality Factor of Resonance Peak
The quality factor (Q-factor) of a resonance peak given by a defect through a multilayer photonic structure is a measurement (without unit) that determines the central spectral position of the resonator relative to its wavelength’s-bandwidth [30,31,32].
where is the central wavelength of the resonance peak and represents its full width at half maximum (FWHM) [30,31,32].
In the calculated spectra given by our simulation, the step of the wavelength used for the FWHM calculation is 0.00001 μm.
3. Results and Discussion
3.1. Optimization of Q-Factor and the Intensity of the Transmittance Resonance Peak
In this part we study the effect of the number of layers in the structure (P varies from 8 to 50) on the Q-factor. Thereafter, we will keep the P value which gives the best Q-factor. Note here that the number P does not include the cavity layer. Here the salinity of the seawater is fixed at 50% and the temperature at T = 25 °C (room temperature).
From Figure 2 we notice the presence of two transmittance peaks, the first one located at 1.477 μm and the second one at 1.774 μm. The FWHM of the first transmittance peak is and the FWHM of the second one is . Hence the quality factors of the first and second peaks are and respectively. In addition, when we change the number of layers of the structure (P), the first peak has the best quality factor; for the rest of the study we will concentrate on the first peak to study its sensitivity to salinity and temperature.
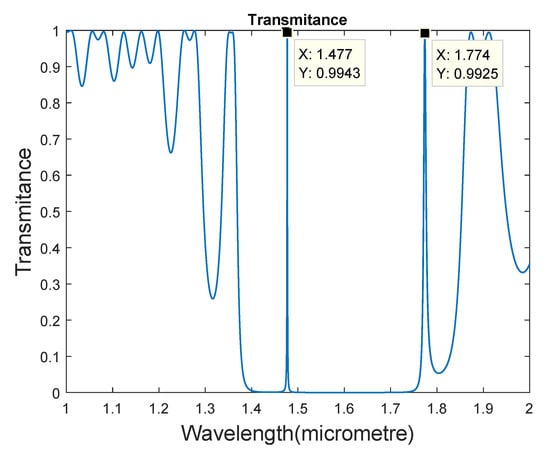
Figure 2.
Transmittance spectrum for a periodic photonic structure with 36 alternated layers of fused silica and TiO2 and with a middle cavity filled by seawater with 50% salinity and at room temperature.
Table 1 and Figure 3 show the variation of the structure thickness, the transmittance peak intensity and the Q-factor as functions of the layer number P. Here it is clear that the peak intensity is still upper 0.8 for P varying from 8 to 52 layers and from 62 layers, the transmittance peak disappears. In addition, the quality factor Q has increased from P = 50 layers and the best Q value is obtained with this number (P = 50). Therefore, the quality factor depends on the structure layers number (P) and for the rest of the study we will keep this number fixed at 50 layers.

Table 1.
Variation of the Peak Intensity, Peak Wavelength, Peak FWHM and the Q-factor for Different Values of P.
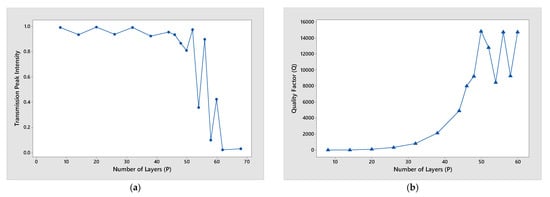
Figure 3.
Variation of the transmittance peak intensity (a) and the quality factor (b) as functions of the layer number (P) of a photonic structure with P alternated layers of fused silica and TiO2 and with a middle cavity filled with seawater of 50% salinity and at room temperature.
From Table 1, it is clear that the transmittance peak intensity takes the value 0.8111 for P = 50 layers, so in the next step we will try to improve the maximum value of the transmittance peak intensity, by applying a deformation in the structure layer thickness. The initial optical thickness of fused silica (F) and TiO2 layers is and the initial optical thickness of the seawater (S) cavity is . Where j defines the layer-position in the photonic structure. By applying the deformation law, the optical thickness of layers varies according to the deformation degree (h) and the layer position (). Therefore for , the new optical thickness of fused silica (F), TiO2 and seawater (S) layers after deformation takes the forms and respectively [12,16].
Figure 4 and Figure 5 illustrate the variation of the transmittance peak intensity and the Q-factor as functions of the deformation degree (h). It is clear that by increasing h from 0 to 0.03, the best intensity and Q-factor are found for (the values of the transmittance peak intensity and the Q-factor are 0.976 and 15060, respectively). In addition, with the increase of the deformation degree (h), we can notice the shift of the photonic band gap (PBG), and transmittance peak towards high wavelengths. This physical phenomenon is due to the increase of the structure’s geometric thickness (d) from to when h varies from 0 to 0.003. Therefore, for the rest of this study we will keep a deformed structure with .
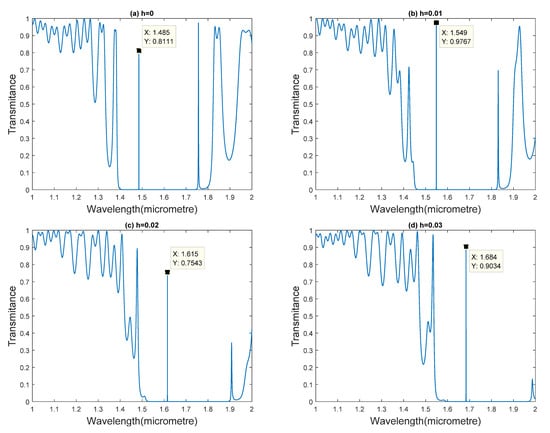
Figure 4.
Variation of the transmittance peak intensity as a function of the deformation degree (h) for a photonic structure with 50 alternated layers of fused silica and TiO2 and with a middle cavity filled with seawater of 50% salinity and at room temperature, (a) h = 0, (b) h = 0.01, (c) h = 0.02, (d) h = 0.03.
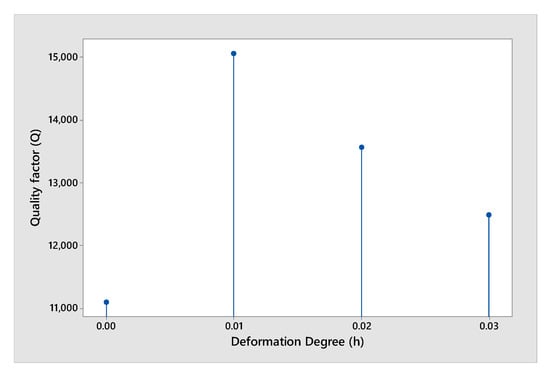
Figure 5.
Variation of Q-factor as a function of the deformation degree (h) for a photonic structure with 50 alternated layers of fused silica and TiO2 and with a middle cavity filled with seawater of 50% salinity and at room temperature.
3.2. Salinity Sensing
In this part we study of the variation of seawater salinity at room temperature () and when the number of layers P and the deformation degree h are fixed at 50 and 0.01, respectively. The sensitivity to the salinity of seawater can be defined as , where is the wavelength shift of the resonance and is the refractive index variation [1].
Table 2 reveals the seawater salt level, its refractive index units (RFIU), the resonance peak wavelength (), the sensitivity to the salinity () and the refractive index difference . The salinity is changed from 0% (fresh water) to 100% considering that the salinity of the seawater varies from 3.5% (35 g/L) in the oceans to 26% (260 g/L) in the Dead Sea [2]. Water with a salinity level less than 600 mg/L (0.06%) is regarded as good quality drinking water [3]. In addition, Figure 6 shows that the resonance peak position shifts toward the right when the salt level increases, with an equidistance between all peaks. It is found that the wavelength shift is equal to 9.2 nm when the salt levels change from 0% to 100% (see Figure 6 and Figure 7). From Figure 7, we can conclude that the regression equation relates the wavelength shift to the salt level: . In addition, from Table 2 we determine that the regression equation relates the sensitivity to the salt level: SS = 544.36 + 0.0198 × salt level (%). For this regression equation the standard error coefficients (SE) for the constant and for the salt level are 5.24 and 0.0845, respectively. Furthermore, from Table 2, it is found that the sensitivity depends on the salinity of the water, but their values remain close when the salinity level varies from lowest to highest values. Using the last regression equation, the salinity sensitivities of the drinking water (0.06% salt) and the Earth’s oceans (3.5% salt) will take the values 544.36 and 544.87, respectively. The best sensitivity of the proposed salinity sensor is 558.82 nm/RFIU at 20% salinity with a detection limit (DL) of 0.0034 RFIU.
Table 2.
Variation of the RFIU, and as Function of Salt Level.
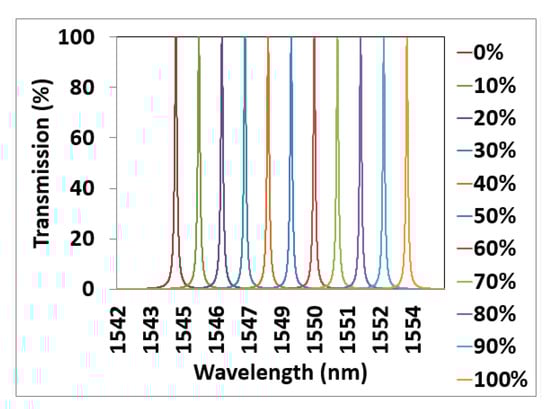
Figure 6.
Optical transmittances as functions of wavelength and salt level for a deformed photonic structure with 50 alternated layers of fused silica and TiO2 and with a middle cavity filled with seawater at room temperature.
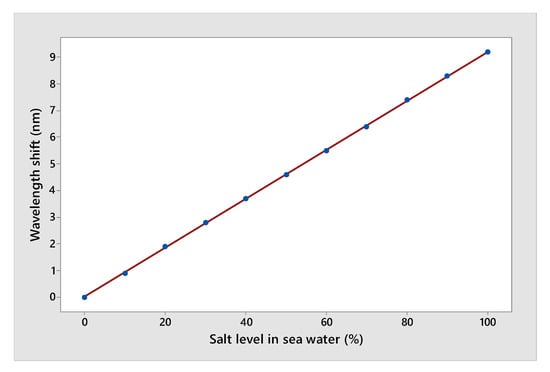
Figure 7.
Peak wavelength shift as function of salt level for a deformed photonic structure with 50 alternated layers of fused silica and TiO2 and with a middle cavity filled with seawater at room temperature.
3.3. Temperature Sensing
In this part, we study of the variation of seawater temperature when the number of layers P, the deformation degree h and the standard salinity of water are fixed at 50, 0.01 and 35%, respectively. The sensitivity to the temperature of seawater is determined by the formula , where is the wavelength shift of the resonance and is the refractive index variation [1].
Table 3 shows the seawater temperature, its refractive index units (RFIU), the resonance peak wavelength (), the sensitivity to the temperature () and the refractive index variation . In addition, Figure 8 shows that the resonance peak position shifts toward the lowest wavelengths when the seawater temperature rises. In contrast to the changes in the degree of salinity, the changes in seawater temperature led to changes in peak resonance locations and the distance between them (see Figure 8). We noticed enlarged gap between peak positions when increasing the temperature and it is physically explained by the parabolic variation of the refraction index of seawater, as a function of temperature. On the other hand, the variation of this index as a function of salinity degree is linear. From Figure 9, it is clear that the wavelength shift is equal to −10.1 nm when the temperature changes from 0 to 100 °C. In addition, from Figure 9, we can conclude the regression equation relates the wavelength shift to the water temperature: . In addition, from Table 3 we determine that the regression equation relates the sensitivity to the temperature degree: ST = 584.09 − 0.430 × T (°C). For this regression equation the standard error coefficients (SE) for the constant and for the temperature are 6.46 and 0.104, respectively. Furthermore, from Table 3, it is found that the sensitivity depends on the temperature of the water and varies from 545.95 nm/RFIU when T = 100 °C to 600 nm/RFIU when T = 10 °C. However, the sensitivity values remain close when the temperature degree varies from the lowest to the highest values. We noticed that the best sensitivity of the proposed temperature sensor is 600 nm/RFIU when the temperature degree of the seawater is 10 °C with a DL of 0.0005 RFIU.
Table 3.
Variation of the RFIU, and as a Function of Temperature.
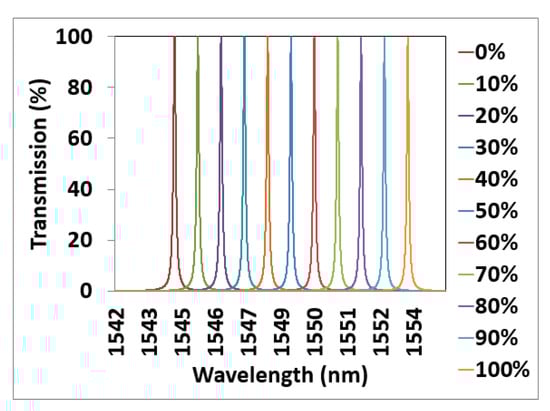
Figure 8.
Optical transmittances as functions of wavelength and water temperature (°C) for a deformed photonic scheme with 50 alternated layers of fused silica and TiO2 and with a middle cavity filled with seawater at 35% salt level.
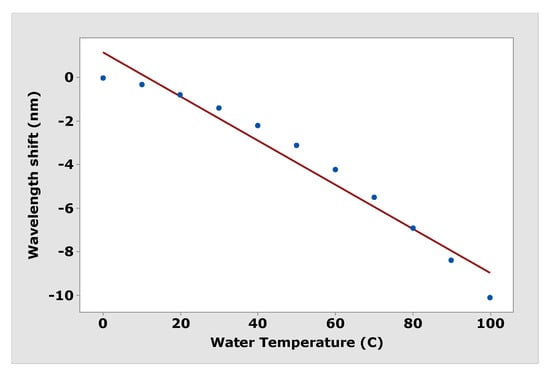
Figure 9.
Peak wavelength shift as function of water temperature degree (°C) for a deformed photonic structure with 50 alternated layers of fused silica and TiO2 and with a middle cavity filled with seawater at 35% salt level.
By comparing our results with the results found by Qutb et al. [19], we find that their periodic structure is composed by the alternation of TiO2 and seawater layers which makes their manufacture almost impossible; also their structures have a thickness of 3.75 μm while the thickness of our structure is 18.57 μm. In addition, Qutb et al. [19] did not calculate the sensitivity of their structure and did not determine the quality factor of the resonance peaks. Furthermore, Vigneswarana et al. [1] proposed a salinity sensor using photonic crystal fiber and this structure is more sensitive to salinity than ours, but still difficult to fabricate. Our structure could be fabricated by the atomic layer deposition (ALD) technique and to make the cavity, the lithographic process and wet or dry etching technologies can be used.
4. Conclusions
The studied deformed photonic structure represents a real opportunity to use optical circuits as sensors for salinity and temperature of water. As the first step, the number of layers was optimized to achieve the best quality factor (Q-factor = 14,852) and after that we tried to deform the layer thickness by applying a mathematical formula. After that, the deformation degree was optimized to be equal to and the best transmittance peak intensity and Q-factor found were 0.976 and 15,060 respectively. By changing the water salinity level from 10% to 100%, we studied the sensitivity of the photonic structure. The resonance peak position shifted towards higher wavelengths when the salt level increased, with an equidistance between all peaks. It was found that the wavelength shift was equal to 9.2 nm when the salt level changes from 0% to 100%. The best sensitivity of the proposed salinity sensor was at 20% salinity of seawater with a DL of 0.0034 RFIU. Finally, the temperature sensitivity was studied. The resonance peak position shifts toward the lowest wavelengths when the seawater temperature rises and enlarged gaps between peaks positions are observed. The wavelength shift was equal to 10.1 nm when the temperature degree changed from 0 to 100 °C. The best sensitivity of the proposed temperature sensor was when the temperature of the seawater was 10 °C with a DL of 0.0005 RFIU.
Author Contributions
Conceptualization, N.B.A. and V.D.; methodology, H.A.; software, N.B.A. and M.T.C.; validation, N.B.A. and M.K.; formal analysis, N.B.A.; investigation, M.T.C.; resources, H.A.; data curation, N.B.A.; writing—original draft preparation, N.B.A. and Y.T.; writing—review and editing, N.B.A. and V.D.; visualization, M.K.; supervision, N.B.A.; project administration, N.B.A.; funding acquisition, all authors. All authors have read and agreed to the published version of the manuscript.
Funding
This research has been funded by Scientific Research Deanship at University of Ha’il–Saudi Arabia through project number RG-20 013.
Institutional Review Board Statement
Not applicable.
Informed Consent Statement
Not applicable.
Data Availability Statement
Not applicable.
Acknowledgments
This research has been funded by Scientific Research Deanship at University of Ha’il–Saudi Arabia through project number RG-20 013.
Conflicts of Interest
The authors declare no conflict of interest.
References
- Vigneswarana, D.; Ayyanarb, N.; Sharmac, M.; Sumathib, M.; Rajand, M.S.M.; Porsezian, K. Salinity sensor using pho-tonic crystal fiber. Sens. Actuators A 2018, 269, 22–28. [Google Scholar] [CrossRef]
- Cullum, J.; Stevens, D.; Joshi, M.M. Importance of ocean salinity for climate and habitability. Proc. Natl. Acad. Sci. USA 2016, 113, 4278–4283. [Google Scholar] [CrossRef] [PubMed]
- World Health Organization & International Programme on Chemical Safety. Guidelines for drinking-water quality. In Health Criteria and Other Supporting Information, 2nd ed.; World Health Organization: Geneva, Switzerland, 1996; Volume 2, Available online: https://apps.who.int/iris/handle/10665/38551 (accessed on 14 May 2021).
- Mun, B.S.; Yoon, J.; Mo, S.-K.; Chen, K.; Tamura, N.; Dejoie, C.; Kunz, M.; Liu, Z.; Park, C.; Moon, K.; et al. Role of joule heating effect and bulk-surface phases in voltage-driven metal-insulator transition in VO2 crystal. Appl. Phys. Lett. 2013, 103, 61902. [Google Scholar] [CrossRef]
- John, S. Strong localization of photons in certain disordered dielectric superlattices. Phys. Rev. Lett. 1987, 58, 2486–2489. [Google Scholar] [CrossRef] [PubMed]
- Yablonovitch, E. Inhibited Spontaneous Emission in Solid-State Physics and Electronics. Phys. Rev. Lett. 1987, 58, 2059–2062. [Google Scholar] [CrossRef]
- Krauss, T.F.; De la Rue, R.M. Photonic crystals in the optical regime—Past, present and future. Prog. Quantum Electron. 1999, 23, 2. [Google Scholar] [CrossRef]
- Schmidt, V. Laser-based micro- and nano-fabrication of photonic structures. In Laser Growth and Processing of Photonic Devices; Elsevier: Amsterdam, The Netherlands, 2012; pp. 162–237. [Google Scholar] [CrossRef]
- Ali, N.B.; Trabelsi, Y.; Kanzari, M. Stop band filter by using hybrid quasi-periodic one dimensional photonic crystal in micro-wave domain. IJMOT 2009, 4, 195–204. [Google Scholar]
- Trabelsi, Y.; Ali, N.B.; Elhawil, A.; Krishnamurthy, R.; Kanzari, M.; Amiri, I.S. Design of structural gigahertz multichanneled filter by using generalized Fibonacci superconducting photonic quasicrystals. Results Phys. 2019, 13, 102343. [Google Scholar] [CrossRef]
- Ben Ali, N. Optical Fabry–Perot filters using hybrid Periodic, Fibonacci and Cantor photonic structures. Nano Commun. Netw. 2017, 13, 34–42. [Google Scholar] [CrossRef]
- Ben Abdelaziz, K.; Zaghdoudi, J.; Kanzari, M.; Rezig, B. A broad omnidirectional reflection band obtained from deformed Fibonacci quasi-periodic one dimensional photonic crystals. J. Opt. A Pure Appl. Opt. 2005, 7, 544–549. [Google Scholar] [CrossRef]
- Asmi, R.; Ben Ali, N.; Kanzari, M. Numerical investigation of light localization in generalized Thue–Morse one-dimensional photonic crystal. J. Photonic Energy 2016, 6, 34501. [Google Scholar] [CrossRef]
- Trabelsi, Y.; Ben Ali, N.; Kanzari, M. Tunable narrowband optical filters using superconductor/dielectric generalized Thue-Morse photonic crystals. Microelectron. Eng. 2019, 213, 41–46. [Google Scholar] [CrossRef]
- Segovia-Chaves, F.; Vinck-Posada, H. Effects of temperature, pressure and thickness on a one-dimensional Thue-Morse photonic crystal. Optik 2020, 203, 163887. [Google Scholar] [CrossRef]
- Ali, N.B.; Kanzari, M. Omni-directional high reflectors using one-dimensional deformed quasi-periodic Cantor band gap structure at optical telecommunication wavelength band. Mediterr. J. Electron. Commun. 2010, 6, 1–6. [Google Scholar]
- Ali, N.B.; Zaghdoudi, J.; Kanzari, M.; Kuszelewicz, R. The slowing of light in one-dimensional hybrid periodic and non-periodic photonic crystals. J. Opt. 2010, 12, 045402. [Google Scholar] [CrossRef]
- Srinivasan, K.; Ben Ali, N.; Trabelsi, Y.; Rajan, M.M.; Kanzari, M. Design of a modified single-negative metamaterial structure for sensing application. Optik 2019, 180, 924–931. [Google Scholar] [CrossRef]
- Qutb, S.R.; Aly, A.H.; Sabra, W. Salinity and temperature detection for seawater based on a 1D-defective photonic crystal material. Int. J. Mod. Phys. B 2021, 35, 1–13. [Google Scholar] [CrossRef]
- Thenmozhi, H.; Rajan, M.M.; Devika, V.; Vigneswaran, D.; Ayyanar, N. D-glucose sensor using photonic crystal fiber. Optik 2017, 145, 489–494. [Google Scholar] [CrossRef]
- Pavlichenko, I.; Exner, A.T.; Guehl, M.; Lugli, P.; Scarpa, G.; Lotsch, B.V. Humidity-Enhanced Thermally Tunable TiO2/SiO2 Bragg Stacks. J. Phys. Chem. C 2012, 116, 298–305. [Google Scholar] [CrossRef]
- Aly, A.H.; Nouman, W.M.; Abd El-Ghany, S.E.S.; Sallam, S.M.; Dawood, A.F.B. Dawood Theoretical studies on hemoglobin periodic structure sensor. Exp. Theor. Nanotechnol. 2019, 3, 203–212. [Google Scholar]
- Ramanujam, N.R.; Amiri, I.S.; Taya, S.A.; Olyaee, S.; Udaiyakumar, R.; Pandian, A.P.; Wilson, K.S.J.; Mahalakshmi, P.; Yupapin, P.P. Enhanced sensitivity of cancer cell using one dimensional nanocomposite material coated photonic crystal. Microsyst. Technol. 2019, 25, 189–196. [Google Scholar] [CrossRef]
- Yeh, P.; Yariv, A. Optical Waves in Crystals; A Wiley-Interscience Publication: New York, NY, USA, 1984. [Google Scholar]
- Kasikov, A.; Aarik, J.; Mändar, H.; Moppel, M.; Pärs, M.; Uustare, T. Refractive index gradients in TiO2 thin films grown by atomic layer deposition. J. Phys. D Appl. Phys. 2005, 39, 54–60. [Google Scholar] [CrossRef]
- Saleem, M.R.; Honkanen, S.; Turunen, J. Thermal properties of TiO2films fabricated by atomic layer deposition. IOP Conf. Ser. Mater. Sci. Eng. 2014, 60, 012008. [Google Scholar] [CrossRef]
- Liu, Q.; Li, S.; Chen, H.; Li, J.; Fan, Z. High-sensitivity plasmonic temperature sensor based on photonic crystal fiber coated with nanoscale gold film. Appl. Phys. Express 2015, 8, 46701. [Google Scholar] [CrossRef]
- Quan, X.; Fry, E.S. Empirical equation for the index of refraction of seawater. Appl. Opt. 1995, 34, 3477–3480. [Google Scholar] [CrossRef] [PubMed]
- Adamo, F.; Attivissimo, F.; Carducci, C.G.C. A small sensor network for sea water Quality monitoring. IEEE Sens. J. 2015, 15, 2514–2522. [Google Scholar] [CrossRef]
- French, J.A. Design and Characterization of a Tunable Fabry-Perot Filter Using an Electro-Optic Modulated Spacer Layer; ProQuest: Washington, DC, USA, 2007. [Google Scholar]
- Harlow, J. Electric power transformer engineering—Book Review. IEEE Electr. Insul. Mag. 2004, 20, 64. [Google Scholar] [CrossRef]
- Tooley, M. Electronic Circuits: Fundamentals and Applications, 3rd ed.; Newnes: London, UK, 2006. [Google Scholar]
Publisher’s Note: MDPI stays neutral with regard to jurisdictional claims in published maps and institutional affiliations. |
© 2021 by the authors. Licensee MDPI, Basel, Switzerland. This article is an open access article distributed under the terms and conditions of the Creative Commons Attribution (CC BY) license (https://creativecommons.org/licenses/by/4.0/).