Article

Thermal Spray Multilayer Ceramic Structures with Potential for Solid Oxide Cell Applications

by
Michail Vardavoulias
1,
Paraskevi Gkomoza
1,*,
Michael Arkas
2,
Dimitrios K. Niakolas
3 and
Stylianos G. Neophytides
3
1
PyroGenesis SA, Technological Park of Lavrion, 1 Athens-Lavrion Ave., 195 00 Lavrion, Greece
2
Laboratory of Functional Nanomaterials of Organized Structure, Institute of Nanoscience and Nanotechnology, NCSR “Demokritos”, 15310 Aghia Paraskevi, Greece
3
Institute of Chemical Engineering Sciences, Foundation for Research and Technology Hellas, Stadiou Str., Rio, GR-265 04 Patras, Greece
*
Author to whom correspondence should be addressed.
Coatings 2021, 11(6), 682; https://doi.org/10.3390/coatings11060682
Submission received: 11 May 2021 / Revised: 2 June 2021 / Accepted: 3 June 2021 / Published: 5 June 2021

Abstract

:
The objective of this paper is to manufacture free-standing solid oxide cells (SOCs) through the atmospheric plasma spray process (APS), without the aid of a metallic support nor the need for a post-process heating treatment. A five-layered cell was fabricated. Fused and crushed yttria-stabilized zirconia (YSZ) powder in the 5–22 μm particle size range was used in order to achieve a dense electrolyte layer, yet still permitting satisfactory ionic diffusivity. Nickel oxide (NiO) powder that was obtained by in-house flame spray (FS) oxidation of pure nickel (Ni) powder was mixed and sprayed with the original Ni-YSZ feedstock, so as to increase the porosity content in the supporting electrode. Two transition layers were sprayed, the first between the support electrode and the electrolyte (25% (Ni/NiO)–75% YSZ) and the second at the electrolyte and the end electrode interface (50% YSZ–50% lanthanum strontium manganite (LSM)). The purpose of intercalation of these transition layers was to facilitate the ionic motion and also to eliminate thermal expansion mismatches. All the as-sprayed layers were separately tested by an in-house developed acetone permeability comparative test (APCT). Electrodes with adequate porosity (25–30%) were obtained. Concerning electrolytes, relatively thick (150–200 µm) layers derived from fused and crushed YSZ were found to be impermeable to acetone, while thinner YSZ counterparts of less than 100 µm showed a low degree of permeability, which was attributed mostly to existent microcracks and insufficient interparticle cohesion, rather than to interconnected porosity.

1. Introduction

Solid oxide cells (SOC), namely solid oxide fuel cells (SOFC) and solid oxide electrolysis cells (SOEC), are environmentally friendly power-generation systems via conversion of energy from one form to another. In the case of SOFCs, the chemical energy of a fuel is converted directly to electrical energy, via fuel oxidation. SOEC is a reverse SOFC that uses electrical energy in order to achieve water electrolysis and consequent hydrogen production. Apart from hydrogen storage ability, SOECs offer the capability for syngas production, since they can also electrolyze carbon dioxide (CO2) to carbon monoxide (CO), and thus provide the source for synthesis of value-added liquid fuels, via the Fischer-Tropsch reaction [1].
Various techniques are used for the fabrication of SOCs’ electrodes and electrolytes, such as screen printing, dip coating, tape casting, physical vapor deposition (PVD), chemical vapor deposition (CVD), electrochemical vapor deposition (EVD), electrophoretic deposition (EPD), atomic layer deposition (ALD), pulsed laser deposition (PLD), electron beam physical vapor deposition (EBPVD), slurry spin coating, magnetron sputtering and spray pyrolysis [2]. A necessary step during electrolyte manufacture, and at the same time a major disadvantage of most of the above techniques, is the subsequent sintering of the electrolyte layer in order to achieve dense microstructures and therefore, optimum ion conductivity. Such processes lead to vast amounts of energy consumption, increased process time and elevated final cost of the product. Some of the techniques referred to above (ALD, PLD) do not demand a post-sintering process [3], but their high cost is prohibiting for commercial application. Other difficulties that arise, related to high-temperature SOC counterpart construction, are interfacial diffusion at the electrode/electrolyte interface and thermal stresses due to mismatch in thermal expansion coefficients of the layers, followed by mechanical damage [4].
In comparison with the above-mentioned techniques, thermal spray, and specifically atmospheric plasma spray (APS), is a quick and economical process to manufacture SOC electrodes and electrolytes, without high-temperature treatment [5], and therefore, to achieve mass and cost-effective production of SOC stacks. In addition, APS facilitates the production of a homogeneous coating with good coherence among the sprayed layers. Therefore, the APS method is suitable for the fabrication of successive electrode-electrolyte stacks of gradient layers, which minimize mismatch problems, and as a result, deter thermal expansion cracking [6]. However, porosity content is still present in the electrolyte layer, which makes these layers prone to high gas permeability and also intercepts electrical conductivity. Subsequently, high ohmic polarization phenomena resulting from low electrical conductivity of the electrolyte layers place a limit to the output power density of the SOC [7]. Moreover, existent open porosity in the electrolyte layer raises the risk of local hot-spot creation and malfunction of the unity of the SOC, due to interfacial diffusion of the fuel and/or the oxidant into the electrolyte [2].
Until now, most efforts to fabricate SOC by thermal spray use a porous metallic layer/foam as a support/substrate for the deposition of the electrode-electrolyte-electrode layers [8,9,10,11]. In the present paper, the possibility of fabrication of SOCs exclusively by thermal spray without the need of using any metallic porous support is presented. The objective of the present work is the fabrication of electrode-supported cells by applying only thermal spraying techniques based on the accumulated know-how of the RTD team, related with thin multilayer materials’ manufacturing.
The proposed thermal spray fabrication method for a complete SOC configuration is based on two main ideas: (a) layered structure of different thermally sprayed materials, and (b) net shape spray-forming of free-standing layers.
(a)
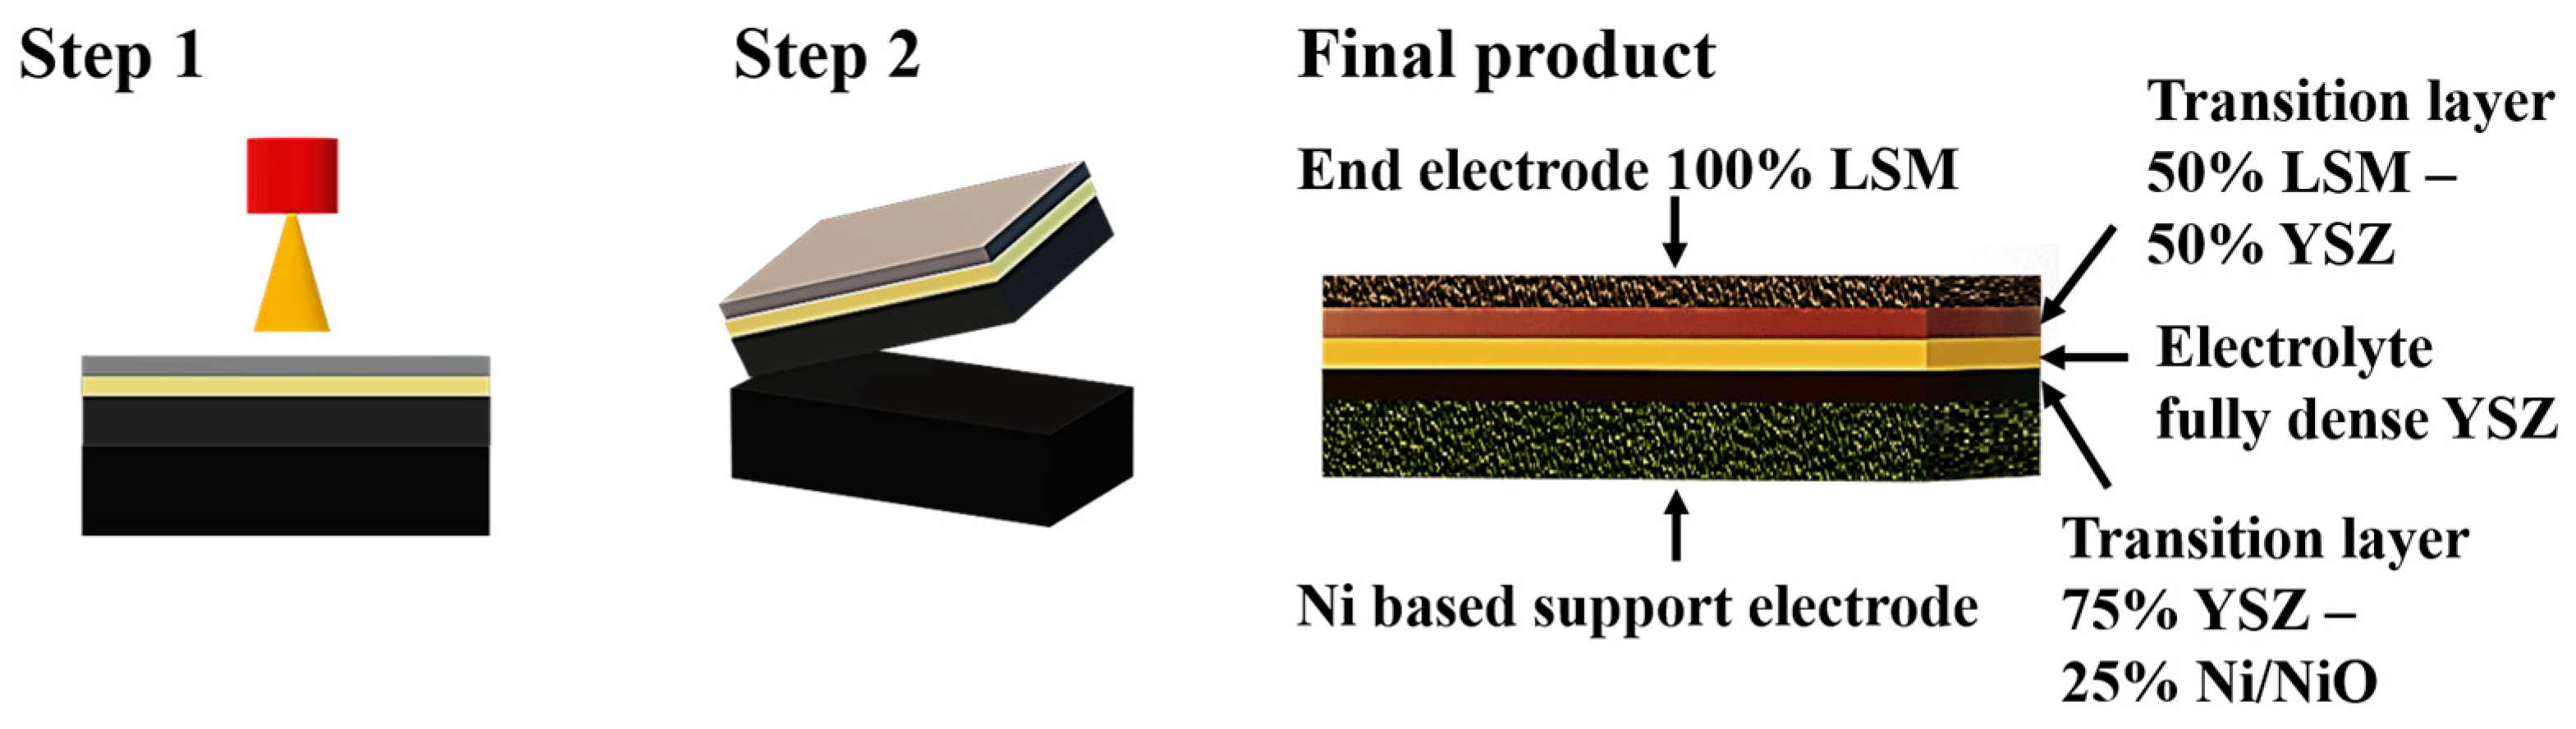
The layered structure is characteristic of the thermal spray method, based on a layer-by-layer deposition of powdered materials, until the targeted thickness is reached. In this way, multiple discrete layers of various materials can be deposited in a layer-by-layer structure, aiming for the effective adherence between them, so as to create interfaces with certain structure that will be quite effective in processing catalytic and electrochemical reactions as well as ionic and electronic charge transfer.
(b)
Net shape spray-forming is based on two steps: thermal spraying on specially designed molds and subsequent removal of the mold without damaging the sprayed layer. The objective of the present investigation is to thermally spray at least three different material layers (electrode-electrolyte-electrode) and then to remove this multilayer structure from the mold. The manufacturing of a five-layer structure has also been attempted, by adding two transition layers between electrodes and electrolytes (Figure 1).
The proposed fabrication technique presents a number of advantages, such as: (i) the ability of using a wide range of materials as the starting powder, (ii) high production rates combined with low cost per unit and (iii) the possibility of porosity control, by optimizing thermal spray parameters and powder characteristics.

2. Materials and Methods

2.1. Materials and Experimental Procedure

A set of experiments was organized, in order to fabricate free-standing multiple-layer SOCs with no use of metallic support. The targeted cells were designed to be electrode-supported. The Ni-based electrode was selected as the support electrode, which operates as an anode for SOFC and as a cathode for SOEC. The cell fabrication was performed progressively, starting with a two-layered sample and then, a three-layered cell with a Ni 50%–YSZ 50% support electrode, a YSZ electrolyte and an LSM end electrode. Finally, a five-layered cell was produced, with one transition layer ((Ni/NiO) 25%–YSZ 75%) between the support electrode and the electrolyte, and one more transition layer (YSZ 50%–LSM 50%) between the electrolyte and the end electrode (Figure 1). The support electrode for the five-layered cell had a Ni/NiO 50%–YSZ 50% composition. As a result, a gradient structure between the electrodes and the electrolyte was created, with the ceramic components having similar coefficients of thermal expansion [10]. In this way, the risk for layer separation or probable cracking during fabrication and operation is expected to be minimized. This is also supported by a similar investigation [12], where it was commented that the volume fraction of lanthanum strontium manganite (LSM) in the cell needs to be greater than 40%, when consistent mechanical and electrochemical performance of the LSM electrode are desirable.
It is suggested [13] that, when satisfying ion conductivity of the SOFC electrode at lower temperatures is expected, the proper process to be followed is the incorporation of the electrolyte material into the support electrode material. This composite layer is held responsible for increasing the number of active sites available for electrochemical reactions, and therefore, ameliorates the support electrode performance [14]. More specifically, it is reported that a composite and relatively thin intermediate layer of YSZ and LSM is utilized, in order to surmount the obstacle of limited ion conductivity at decreased operation temperatures [14].
A key material in this work is YSZ, as it is used in both the supporting electrode, aiming for high porosity content, and therefore easy movement of gas molecules, but also in the electrolyte, where very low porosity is desirable in order to achieve gas tightness, as well as ionic transfer. Thus, porosity is a key property for SOCs, and YSZ porosity control is of major importance.
During our experimentation, our main objective was to achieve the desirable porosity in each specific layer. This was achieved by continuous alteration of the plasma spray parameters, until the sprayed layer reached the targeted microstructure.

2.1.1. YSZ Electrolyte

First, experiments were concerned with YSZ layers, since this ceramic is present both in the electrolyte (100%) and in the support electrode (50% YSZ–50% Ni). Plasma spray technology was applied for the development of the YSZ electrolyte layer. The optimization of the spraying parameters was mainly focused on the starting YSZ powder particle nature and size, and on the plasma power (kW). Agglomerated and sintered YSZ powder (H.C. Starck GmbH, Goslar, Germany), sieved into three different particle size ranges of: (a) 75–90 μm, (b) 45–75 μm and (c) 16–45 μm, were tested in the first part of the project. Later, in a second series of experiments, the enhancement of the YSZ electrolyte gas tightness was attempted. According to the literature [15], fused and crushed morphology off the starting powder results in coatings with denser microstructures. For this reason, smaller fused and crushed YSZ particles in the 5–22 µm range were used. The plasma power applied was in the range of 20–45 kW, in combination with the above-mentioned powder particles. The final objective of these experiments was the porosity control, given that low and closed porosity < 3% is requested for the electrolyte, in order to secure ion transport only, while high porosity in the order of 25–35% is demanded for the supporting electrode of the SOC, so as to secure mass transport of reactant and product gases, according to the relative typical porosity contents of a tubular SOFC that are referred to in the literature [13].

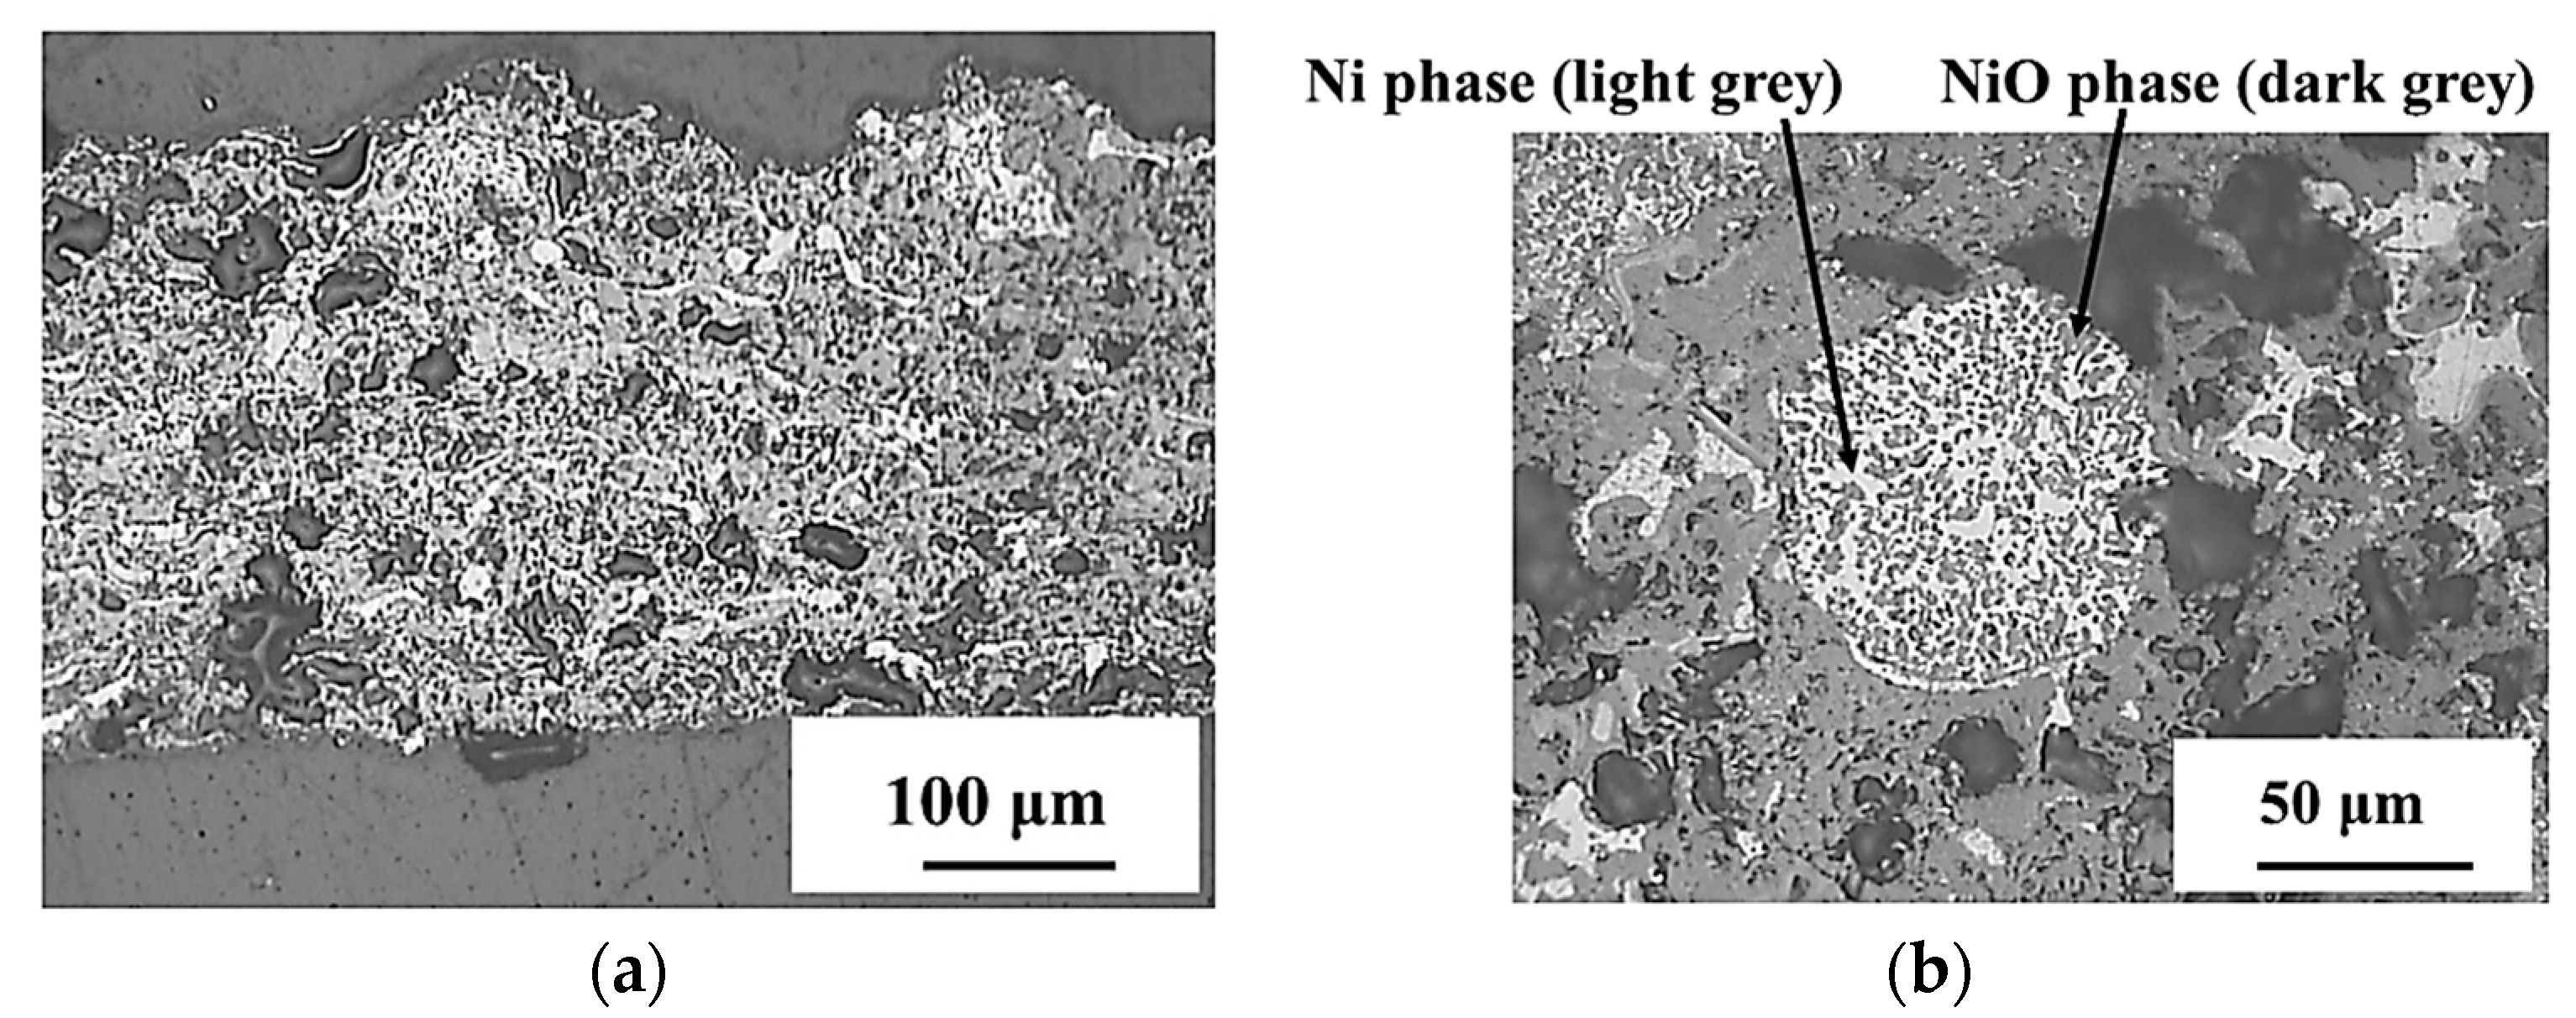
2.1.2. Ni-YSZ and Ni/NiO-YSZ Supporting Electrode

In a first series of experiments, YSZ particles were mixed before spraying with Oerlikon-Metco spherical 99.3% pure Ni particles of 45–75 μm size in a 50-50 wt.% proportion, for the fabrication of a 50% Ni–50% YSZ-supported electrode. In a second series of experiments, Ni powder was replaced by NiO powder in order to increase porosity in the supporting electrode and avoid stress accumulation due to metallic Ni. The nickel oxide powder used in this research originated from the oxidation of the above-mentioned nickel powders via the flame spray technique. Ni powders passed through a flame spray gun (Metco 5P Thermospray Gun, Sulzer Metco, Wohlen, Switzerland) in excess of oxygen and Ni particles were partially or totally transformed into Ni oxide. The Ni/NiO powder particles were then collected and used in the 50–50 wt.% mixture with YSZ, instead of the original Ni powder. However, the NiO particles that were produced from partial or full oxidation of Ni powder were hollow spheres, due to the Nickel ion diffusion from the central part to the surface of the particle, with a remaining part of Ni metal (Figure 2b). In this way, the internal porosity of the hollow NiO powder particles contributed to the total porosity of the layer.
X-ray diffraction (XRD) analysis was performed on each of the starting powder feedstocks, and the resulting identified phases are nickel (Ni) (Figure 2a) and bunsenite (NiO) (Figure 2b), according to the respective integrated databases (PDF 01-087-0712 and PDF 00-004-0835). Both powders seem to be highly crystallized, as it seen in the respective XRD spectra. Ni and NiO phases were detected in the XRD spectrum of the resulting flame-sprayed Ni powder (Figure 2b), which means that the major part of the starting Ni quantity was transformed into NiO. Thus, the final powder consists of both Ni and NiO fractions. For the XRD analysis, a Brucker D8 Focus X-Ray Diffractometer (Billerica, MA, USA) was utilized and the XRD spectra were acquired over a 2θ range of 2°–75° at a scan rate of 0.02° s−1, using CuKα1 (λ = 1.5406 Å) monochromatic radiation.

2.1.3. LSM End Electrode

For the end electrode, LSM powders were plasma-sprayed to obtain the respective layers. The material used was a commercial powder from Oerlikon-Metco (New York City, NY, USA), of spheroidal morphology and particle size in the range of 20–53 μm.

2.2. Characterization Techniques

In order to observe the cross-sectional microstructure of the gradient multilayer cells, specimens were cut from the original samples and prepared using standard metallographic procedures. These specimens were then observed via optical microscope (OM, Leica Microsystems GmbH, Wetzlar, Germany) and scanning electron microscope (SEM) (JEOL JSM-6390, Tokyo, Japan), coupled with an energy dispersive spectroscopy (EDS) system, in order to obtain a more detailed outline of the microstructure of the layers. The surface morphology of the samples was also examined via HR-SEM (Zeiss SUPRA 35VP, Oberkochen, Germany), when needed.
Porosity percentage was estimated by measuring the pore area (%) in the total area of cross-section optical microscopy (OM) images, with the use of a Leica LAS Image Analysis tool (Leica Microsystems GmbH, Wetzlar, Germany). The final result is the average measurement of 10 cross-sections for each sample.
Furthermore, a simple and quick diagnosis test, introduced here as the acetone permeability comparative test (APCT), was applied in all the layers (in monolayer form), under the same temperature and humidity conditions, in order to have an estimation of their permeability. A drop of acetone was simply left to penetrate and transverse the structure. The acetone test indicates whether the layer is permeable by acetone or not. It is a comparative permeability test for equal thickness layers, by calculating the time that a stable quantity of acetone takes to appear in the rear side of the layer. The concept is based on the fact that the layers permeable by volatile liquids will also be permeable by gases. Most importantly, layers of the same thickness may be compared and any improvement in the structure’s tightness may be established.

3. Results and Discussion

3.1. Single-Layer Structure Optimization

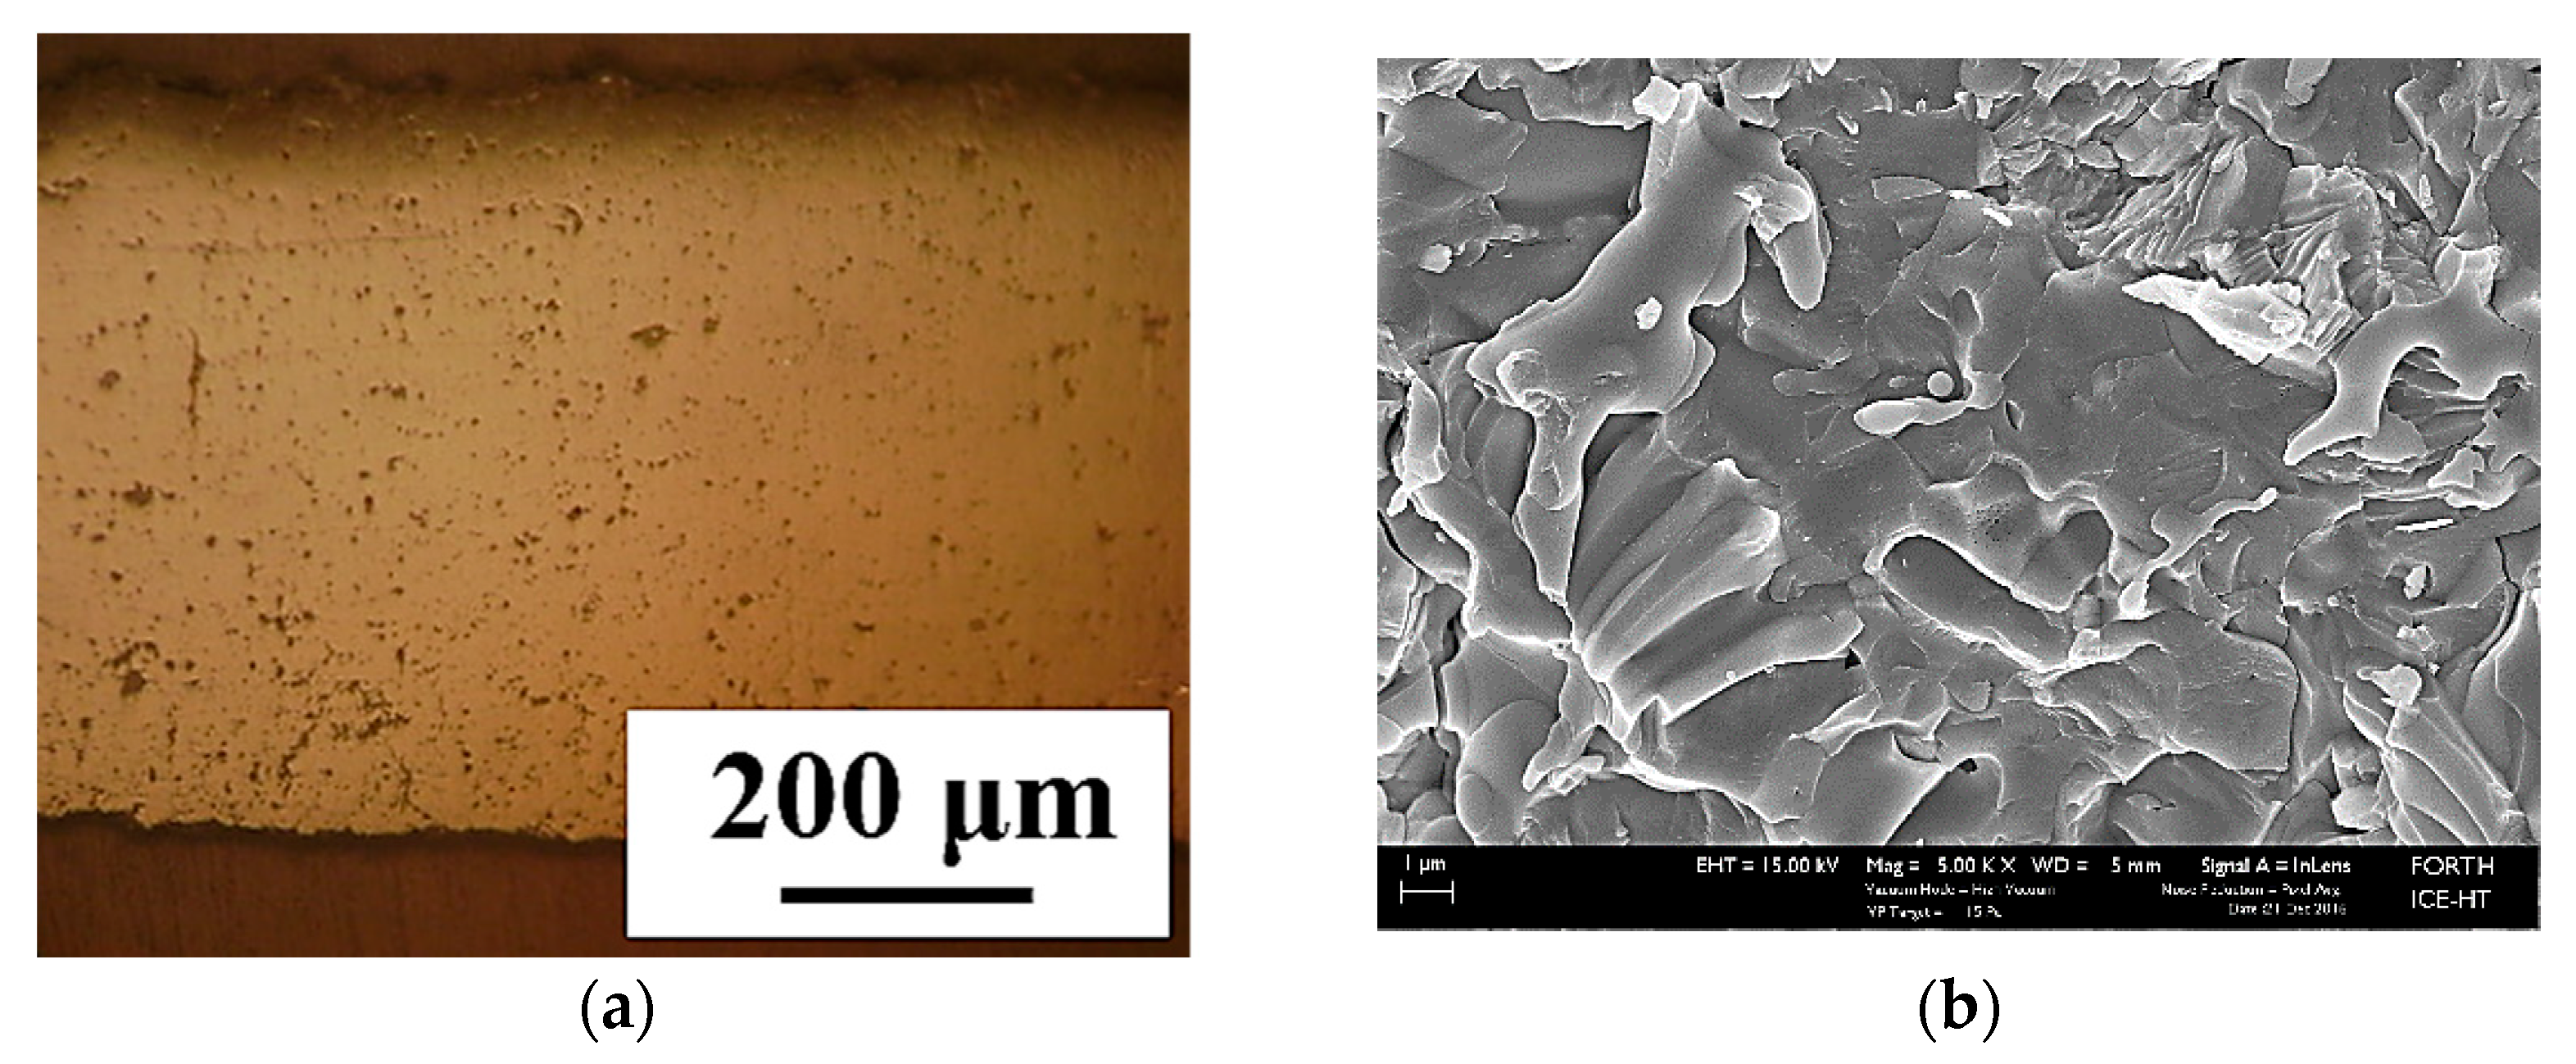
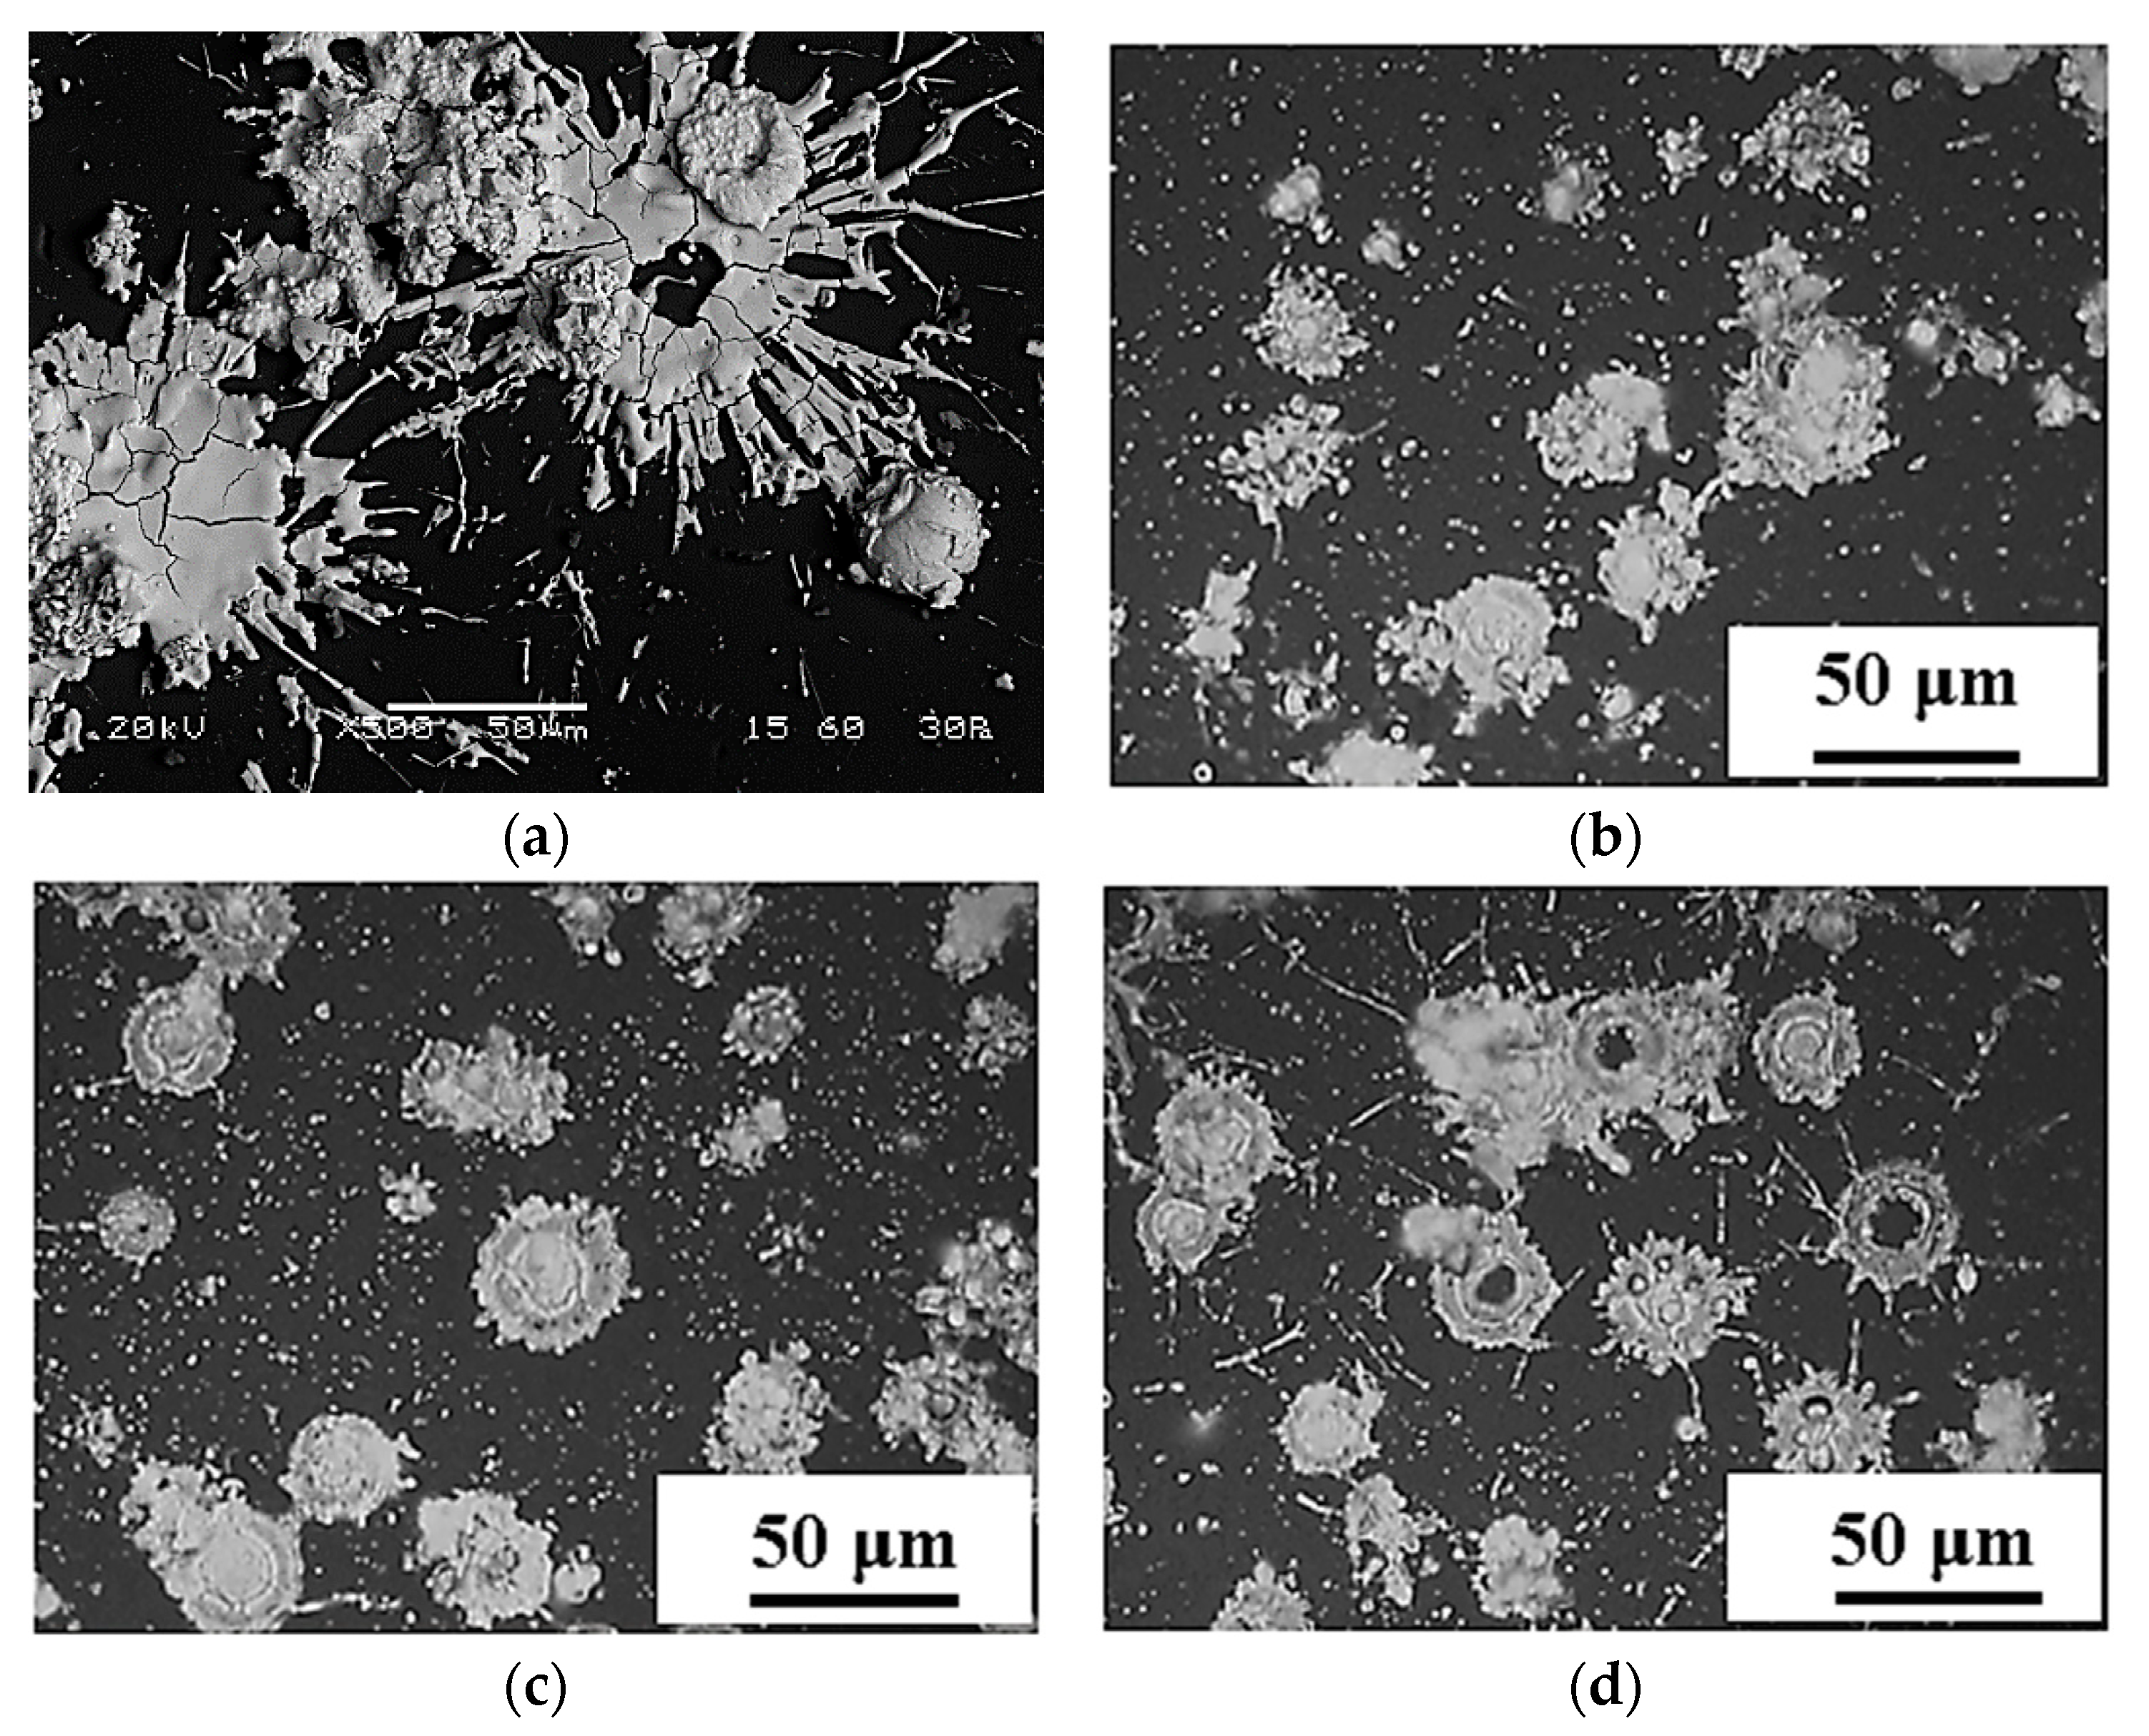
3.1.1. YSZ Electrolyte Layer

A series of experiments—by modifying plasma spray parameters and also particle nature (agglomerated or fused and crushed) and size range (four different size ranges as described in Section 2.1.1)—were carried out in order to control porosity in the YSZ electrolyte layer. Free-standing YSZ layers were produced. After experimentation, a YSZ layer with an average thickness of 500–600 μm (Figure 3a) was achieved, in which the content of porosity was greatly diminished. Some vertical microcracks appeared at the dense coating, due to stress release phenomena that occur by temperature changes between subsequently sprayed layers [16,17]. SEM observation of the fracture surface of the sample (Figure 3b) showed that the ceramic material was well-molten, and the sprayed particles had formed flattened splats, which had been consolidated and had formed a cohesive smooth surface, so that surface porosity is sufficiently closed.

3.1.2. Ni-YSZ Support Electrode Layer

The obtained support electrode material layers have an average thickness of 500 μm, and their relative metallographic cross-section is observed in Figure 4. Increase of support electrode porosity (higher than 10%) and continuity of the YSZ network was achieved (Figure 4) by the utilization of low plasma power (20 kW) and small Ni particle powder in the range of 14–45 μm. This is explained as the use of lower plasma spray power results in inadequate melting of the as-sprayed particles and formation of pores throughout the coating material. Moreover, the Ni powder particles in the starting feedstock are significantly smaller than the YSZ particles, and as a result, they only partially fill the occurring inter-splat voids that are formed by the unmolten or semi-deformed YSZ particles existent in the coating.

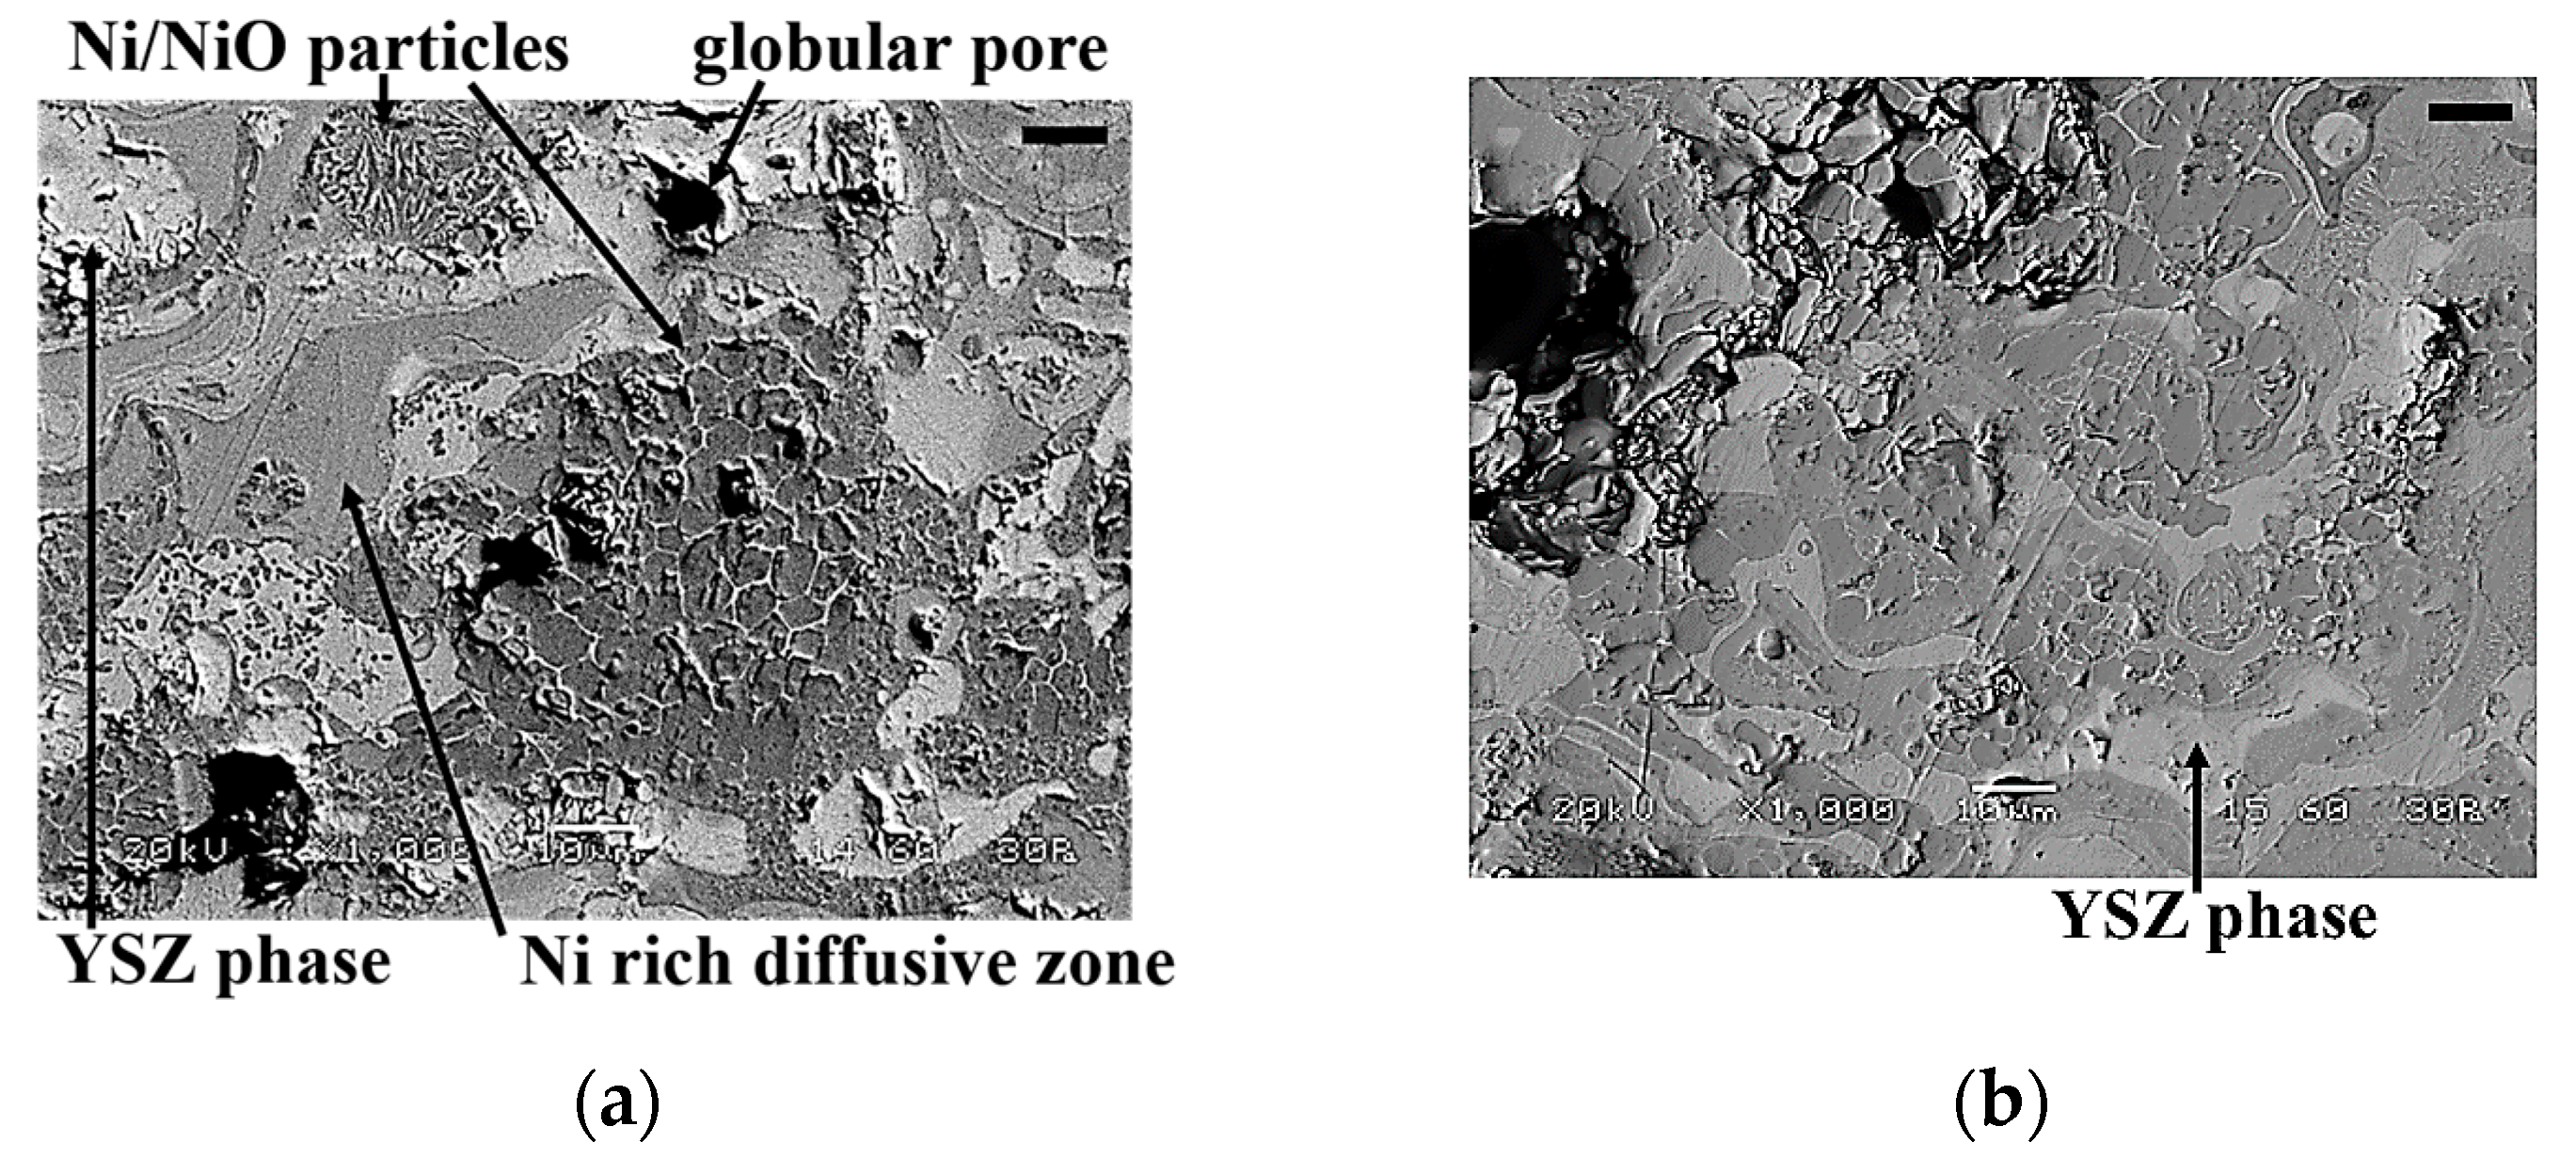
3.1.3. Ni/NiO-YSZ Support Electrode Layer

Porosity in the support electrode can be further increased if NiO totally or partially replaces Ni in the initial feedstock powder. According to previous research [18,19,20], application of thermal treatment onto feedstock powders of irregular shape, such as thermal plasma, spray-drying followed by sintering and mechanical activation (e.g., pass through a planetary mill), results in the spheroidization of the particles and also yields hollow spheres, even when metallic powders are considered. In this project, metallic Ni powder was oxidized via flame spray and thus, hollow Ni-NiO particles were produced. This intrinsic porosity acted additively to the total porosity content of the coating, that reached 25–30%. As it can be observed in Figure 5a, in cross- and parallel-sections, the porosity of the support electrode layers was clearly increased in comparison with previous ones (Figure 4), where only Ni powder was used. In Figure 5b, the cross-section of a partially oxidized Ni powder particle is shown, where the original Ni element is illustrated with light grey and the intraparticle NiO phases are depicted in dark grey. The particle has retained its original spheroidal shape and remains compact inside, as it has not been fully molten, so as to form a hollow particle.

3.1.4. LSM End Electrode

The LSM layer with high porosity obtained by the plasma spray process is presented below (Figure 6). The end electrode layer had an average thickness of 250 μm and is characterized by a porous structure that could act as a permeation site for the reactant and product gases’ mass transportation.

3.2. Three-Layer Structure Manufacturing (Electrode-Electrolyte-Electrode)

The three different layers of support electrode, electrolyte and end electrode were successively plasma-sprayed one over the other (first the support electrode, then the electrolyte, and at the end, the end electrode), and three-layer samples were obtained (Figure 7). The support electrode porous layer consisted of 50% Ni–50% YSZ, with a mean thickness of 370 μm, while the end electrode porous layer consisted of LSM (100%), with a thickness between 100 and 140 μm. The middle electrolyte YSZ layer was also porous and relatively thin, with an average thickness of 140 μm.
This triple layer could be considered as a potential SOC fully manufactured by thermal spray. However, porosity and cracking (micro and macro) issues still existed in the electrolyte. This had an impact on the gas molecule permeability in the electrodes and gas tightness in the electrolyte. Consequently, a new series of experiments had to be carried out with the following objectives:
  • Porosity had to be increased in the electrodes.
  • Porosity had to be reduced in the electrolyte.
  • Microcracking should not exist in the electrolyte.
In the next step, a five-layer structure was manufactured based on the above-mentioned directions.

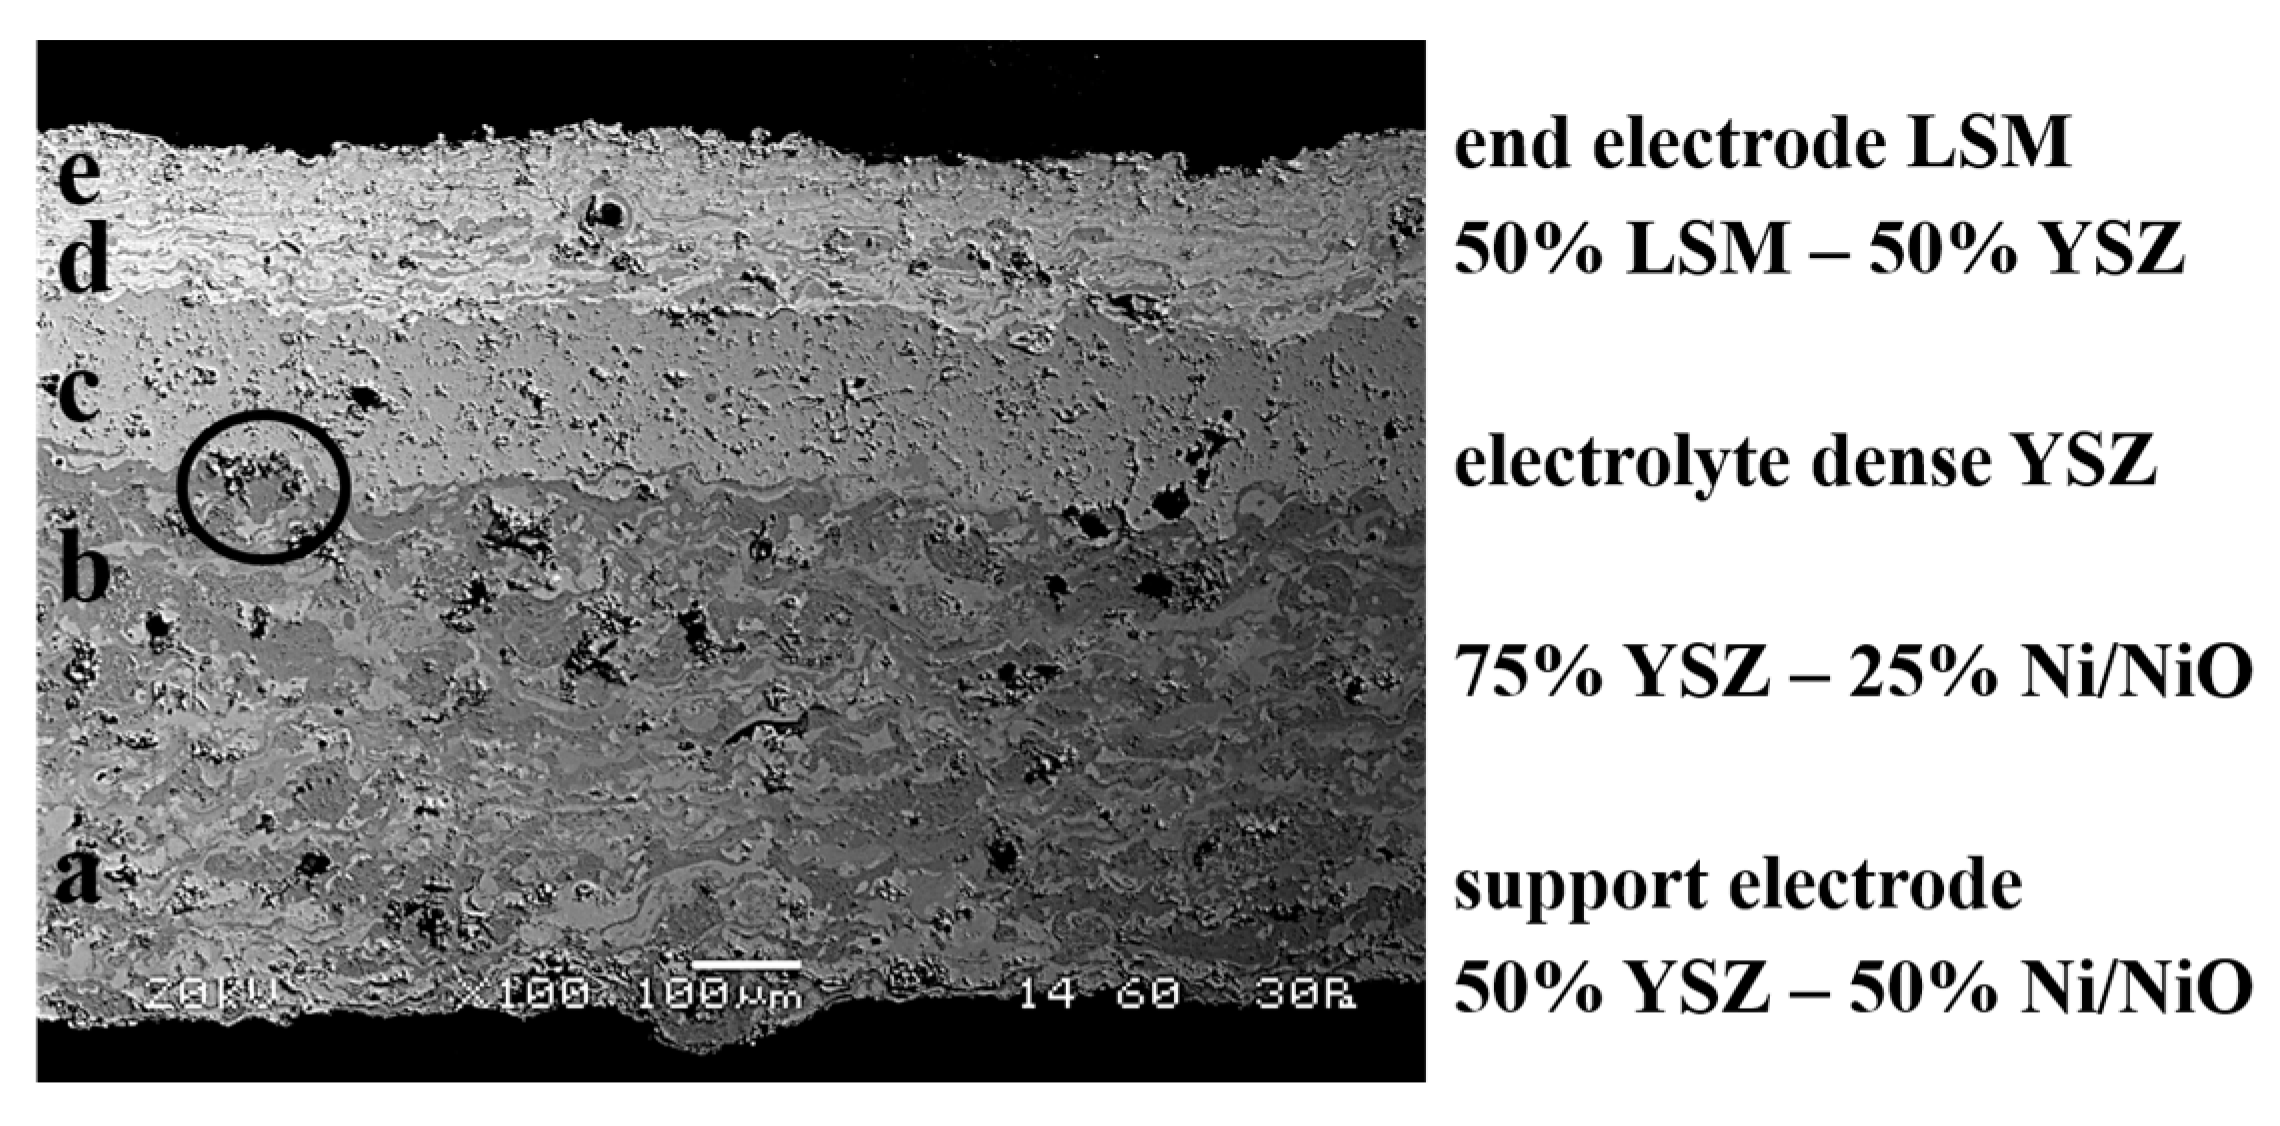
3.3. Five-Layer Structure Manufacturing (Electrode-Transition Layer-Electrolyte-Transition Layer-Electrode)

Using the Ni/NiO powder instead of Ni, a five-layer structure was manufactured by plasma spray (Figure 8). The successive layers, which were included in this structure, showed the following characteristics:
(a)
Support electrode: composition Ni/NiO 50%–YSZ 50%, thickness 300–350 μm, porosity 25–30%.
(b)
Support electrode/electrolyte transition layer: composition Ni/NiO 25–YSZ 75%, thickness 100–120 μm, porosity 20–25%.
(c)
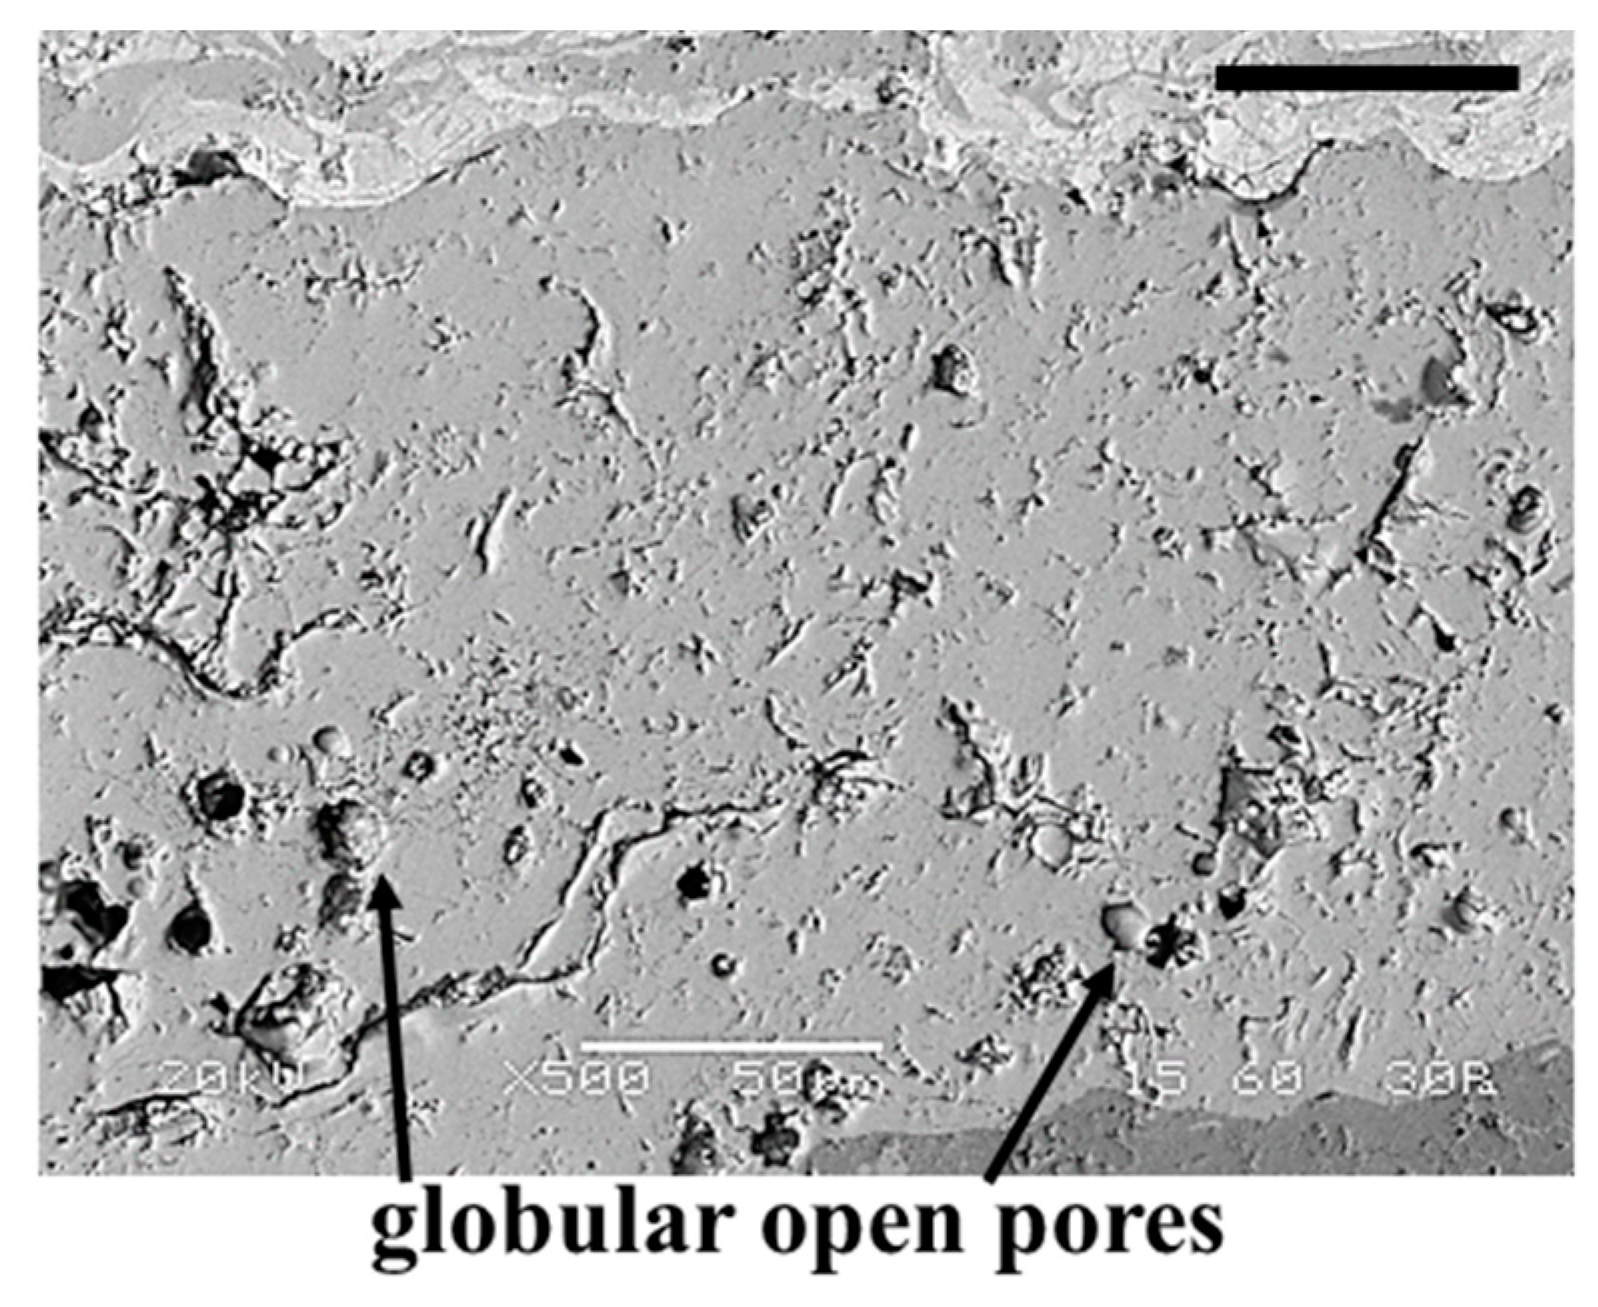
Electrolyte: composition YSZ 100%, thickness 100–120 μm, porosity < 5%, not connected.
(d)
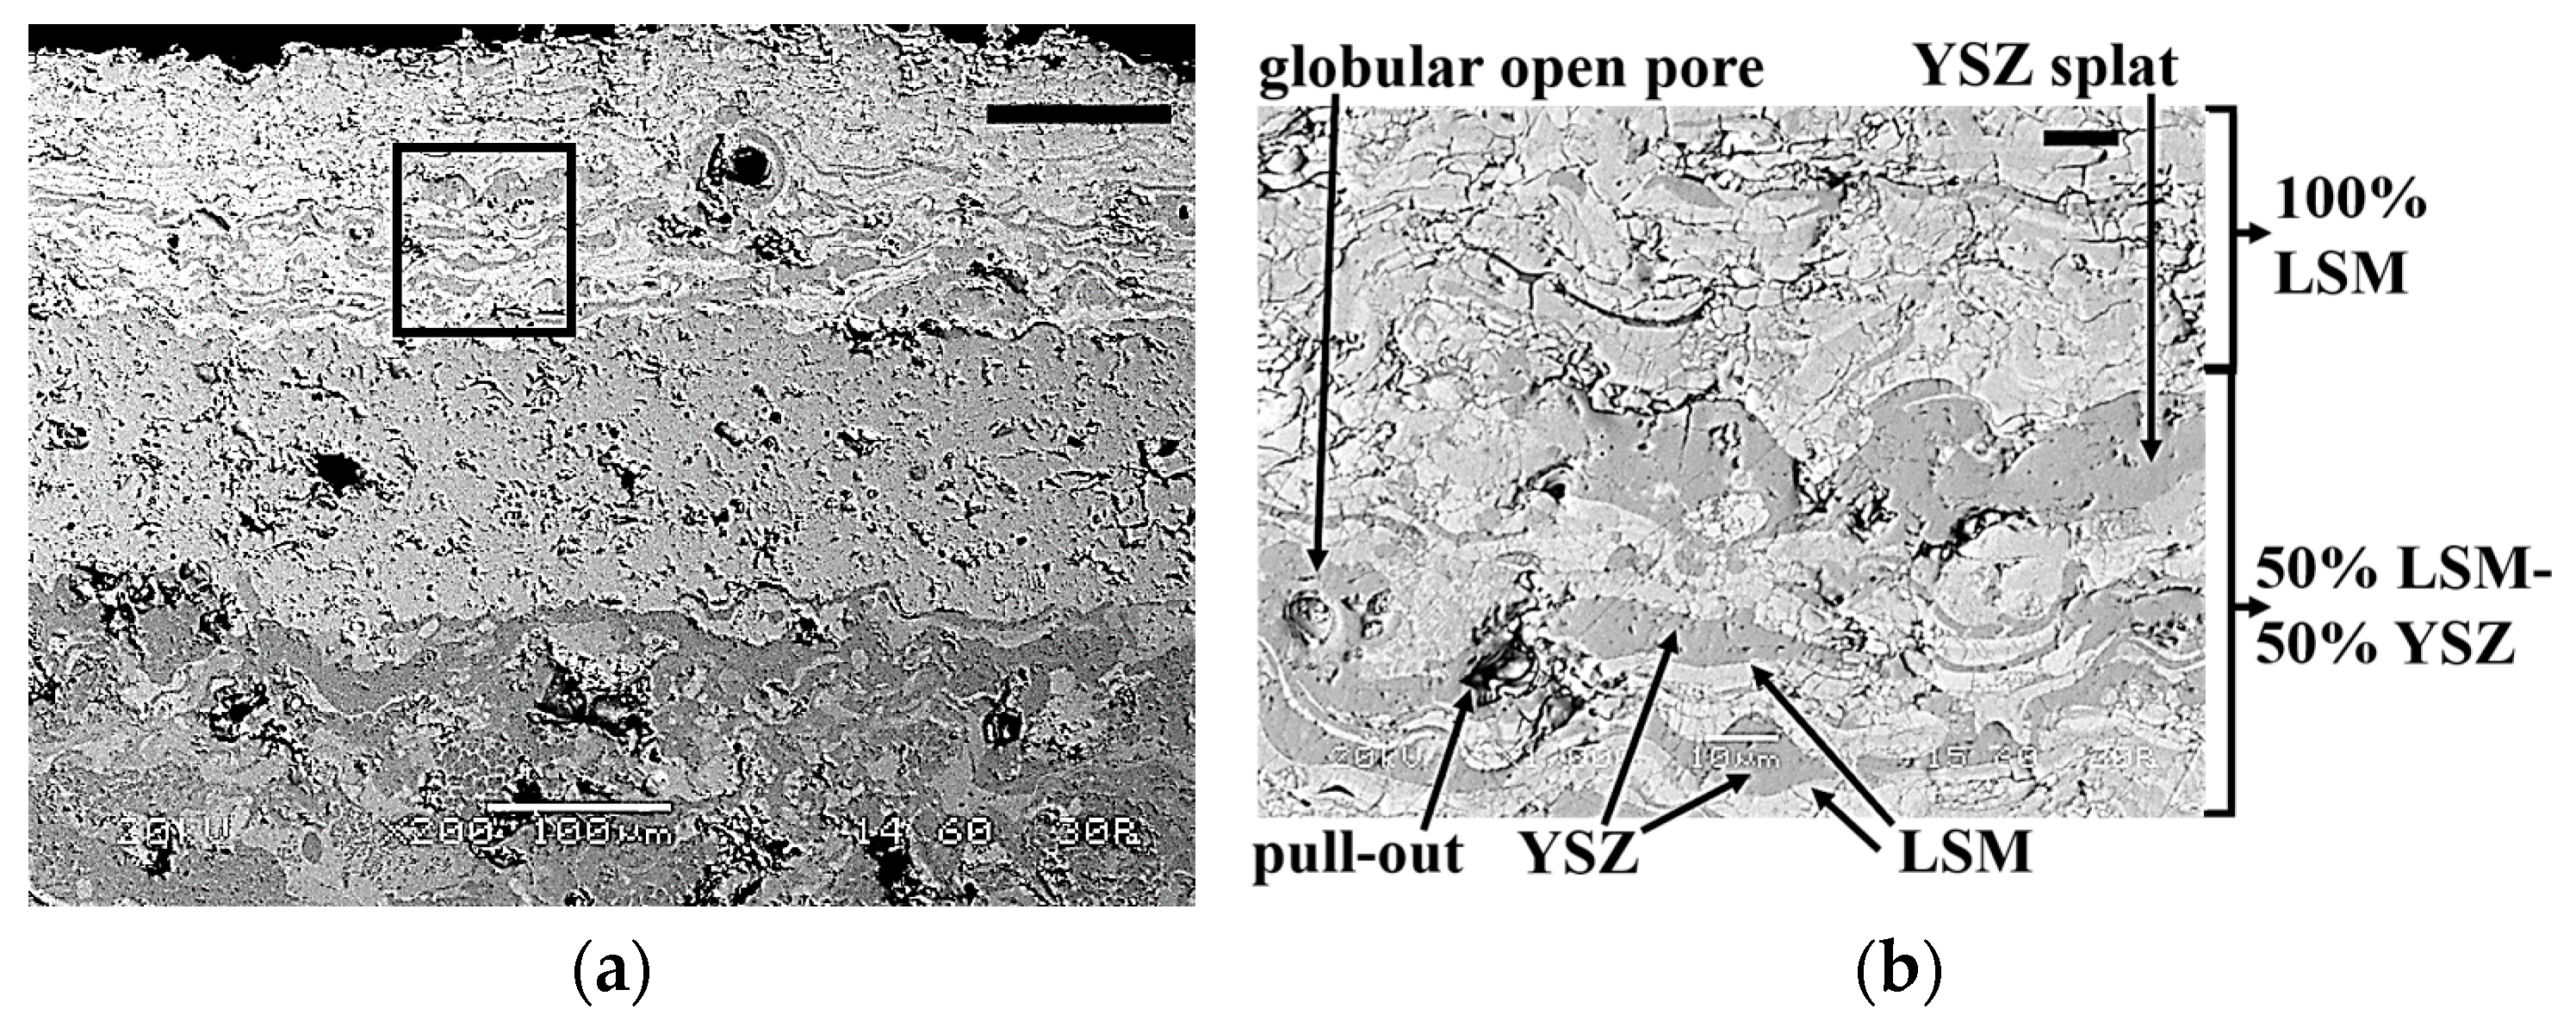
Electrolyte/end electrode transition layer: composition 50% YSZ–50% LSM, thickness 80–100 μm, porosity 20–25%.
(e)
End electrode: composition LSM 100%, thickness 70–90 μm, porosity 25–30%.
A SEM image of the five-layer structure is shown in Figure 8. The mixed Ni/NiO (dark grey)-YSZ (light grey) support electrode layer at the bottom (a), the mixed Ni/NiO (dark grey)-YSZ (light grey) support electrode transition layer, with higher YSZ content, above (b), the YSZ electrolyte (light grey) (c), the mixed LSM (white)-YSZ (light grey) end electrode transition layer above (d) and the end electrode LSM (white) layer at the top (e), are observed.
As it is observed in Figure 8, all of the layers seem to be strongly adhered to one another, since no pores or horizontal microcracks are discerned in between the majority of the interfaces of the layers. However, some local defects, such as the unmolten particle (black circle) in the border of the support electrode transition layer to electrolyte (b to c) do not affect the successive microstructure of the layers. Although the particle belongs to the transition layer (its dark grey color is distinctive for Ni/NiO particles), the successive electrolyte layer has covered the protruding surface of the particle and has retained its uniformity in the vertical axis, without transferring this structural variation to the layers above. Around the particle, a cluster of pores has been accumulated, which, however, do not cause any further discontinuity. Apart from the specific interfacial particle, more un-melted Ni/NiO particles can be noticed, dispersed in the support electrode transition layer. It could be speculated that the decreased Ni/NiO percentage in the transition layer was not adequate in order to affect the heat transfer in the entirety of the layer, contrary to the homogeneous alteration of heat transfer in the support electrode layer. Therefore, the abundance of unmolten Ni/NiO particles in the support electrode transition layer is the cause for the concentration of tiny globular pores at their periphery, which is a typical microstructural characteristic in plasma spray coatings [21]. Some distinct larger globular pores exist in both the end electrode and the support electrode layers (a and e). The support electrode transition layer (b) concentrates the majority of the pores, though they are smaller in size and grouped into sporadic clusters. Some pull-out pores are also present. The electrolyte layer (c) has only a few large globular pores, and in general seems to have the densest microstructure. The borderlines of the support electrode and end electrode transition layers (b and d) are not clear. What makes the support electrode transition layer separated from the support electrode layer (a) below is the accumulation of dark grey areas that implies Ni/NiO presence. Correspondingly, what also makes the end electrode transition layer (d) stand out from the final end electrode layer (e) is also the existence of light-grey interlamellar zirconia splats amongst the white LSM particles.
Additional microstructural details of the five-layer prototype cell are shown in Section 3.3.1, Section 3.3.2, Section 3.3.3, Section 3.3.4 and Section 3.3.5.

3.3.1. Support Electrode Layer

In Figure 9a, two unmolten Ni/NiO powder particles are shown. The particles both appear to be almost dense, contrary to the typical hollow NiO particle microstructure. The bigger particle on the right has some small pores of less than 10 μm enclosed in its mass. These pores could be the result of aggregated porosity enclosed in the original porous starting NiO powder, rather than pull-outs created during the preparation of the metallographic specimen, since their shape is somewhat circular, while no material removal is implied from their inner surface [22]. The smaller particle on the left is denser than the previous one and consists of needle-like grains, that are probably recrystallized grains due to thermal-softening effects [23]. A globular pore is also noticed at the interface of a light-grey zirconia particle and a dark-grey Ni particle. Moreover, a type of unmolten Ni particle with irregular shape and indefinite border, also referred to in the literature as “diffusive zone” [24], is discerned. Finally, interlamellar YSZ phases amongst the Ni/NiO particles are also noticed and are pointed out by black arrow indicators in Figure 9a,b.

3.3.2. Support Electrode-Electrolyte Transition Layer

The transition layer between the support electrode and the electrolyte was the only one among the five layers which could not be clearly distinguished in OM and SEM images (Figure 8). Obviously, the increase of YSZ content from 50% to 75% did not result in clear microstructural differentiation.
It is mentioned that the materials in the support electrode and the support electrode transition layer, which include more than two materials, may locally appear to not be fully uniformly mixed. It is noted that, in our on-going research, better mixing of the materials has been achieved. In addition, a part of the lack of uniformity is due to the fact that Ni/NiO composite powder derived from in-situ oxidization of pure Ni powder and subsequent use of the resulted mixed Ni/NiO powder, in order to exploit both good melting ability of metallic Ni particles and the additional porosity derived from the hollow NiO particles.

3.3.3. Electrolyte Layer

The cross-section of the electrolyte layer reveals a sufficiently cohesive and dense coating (Figure 10). Plenty of globular pores are shown (and noted with black arrow indicators), but after careful observation, the porosity seems to be unconnected. According to the literature [5], globular pores could be the result of entrapped gas phase, that was retained in the as-sprayed powder particles throughout solidification. Interlamellar porosity in the form of microcracks is also present. Longer and almost horizontal microcracks present in the coating could jeopardize the coating cohesion, though spalling of the coating around the crack is not observed. The electrolyte layer is estimated to have good adhesion with the bilateral electrode transition layers, since there is an absence of voids accumulated at the electrolyte-electrode interfaces.

3.3.4. Electrolyte-End Electrode Transition Layer

Compared to the end electrode LSM layer, the end electrode transition layer seems to be more cohesive and denser (Figure 11a). The intense microcracking that is present in the end electrode layer is now absent, since the existent microcracks are smaller and smoother. The denser microstructure is explained by the fact that successive spraying of the LSM layer has contributed to the tamping/peening effect, and thus the subsequent decrease in porosity content and densification of the previously sprayed layer. In addition, easily molten LSM particles (melting temperature > 1650 °C) have thermal conductivity that has been previously experimentally evaluated [25] and estimated to fall in the range of 3.42–4.45 W/(m·K), very close enough to that of agglomerated 8 mol% YSZ (2.84 W/(m·K)). As a result, the LSM particles easily melted and acted as a binder amongst the less splatted YSZ particles (Figure 11b), leaving only sporadic porosity inclusions at their interface. Moreover, the YSZ and LSM splats were alternately accumulated and established a lamellar structure [26]. Finally, a globular pore with planar inner surface and an irregularly shaped pull-out are shown in Figure 11b.
Phase distinction between the LSM and YSZ phases is utilized via SEM observation, where the LSM phase is again presented with white color and the YSZ phase in light-grey color, and are noted with black arrow indicators in Figure 11b.

3.3.5. End Electrode Layer

The LSM end electrode layer (Figure 12) is characterized by a network of mostly horizontal microcracks, which is identified in the literature as interlamellar porosity [22]. No pull-outs or large pores were noticed. An elemental distinction in the LSM material was noticed via SEM observation. More specifically, two phases were discerned: one with darker grey color, which represents the Mn-rich LSM phase, and one with lighter grey-white color, that is the La-Sr-rich LSM phase. These two distinct phases were identified by EDS analyses. Finally, the upper end of the end electrode layer appears to be sharded. This could be due to insufficiently molten particles that hit the previously sprayed layer and bounced back, causing minor deformation at the surface of the layer. This phenomenon is aggravated by the fact that the already sprayed end electrode transition layer that acts as the end electrode substrate was already cold when the spray process occurred, since the layers were sprayed successively by the same plasma spray gun.

3.4. Electrolyte Permeability Test (Acetone Permeability Comparative Test, APCT) and Results

In-house designed acetone testing was performed on all the layers, in order to assess their permeability. It is not unusual that custom-designed equipment is often used, so as to estimate the permeability of a SOC’s sprayed layers [11]. Almost all tested layers were proven to be permeable by acetone, some of them easily, others with more difficulty. Permeability may exist due to connected porosity, microcracks and/or poor cohesion between splats (molten and resolidified particles after plasma spray). In initial experiments to produce support electrode layers, Ni and YSZ powders were used. These layers were the only ones which were completely impermeable by acetone, and this must be attributed to the molten Ni particles, which closed the porosity network (Figure 13). Ni particles were fully molten during plasma spray and filled any existent inter-splat voids and pores, thus making the layer impermeable to acetone. On the contrary, NiO particles were not fully melted, and owing to their unique microstructure as hollow spheres, they add to the total porosity of the layer, and therefore make the layer permeable by acetone (Figure 5a). On the other hand, the YSZ electrolyte, which should be very dense and gas-tight, showed permeability, although limited. All tested samples of the LSM end electrode layer showed increased permeability.

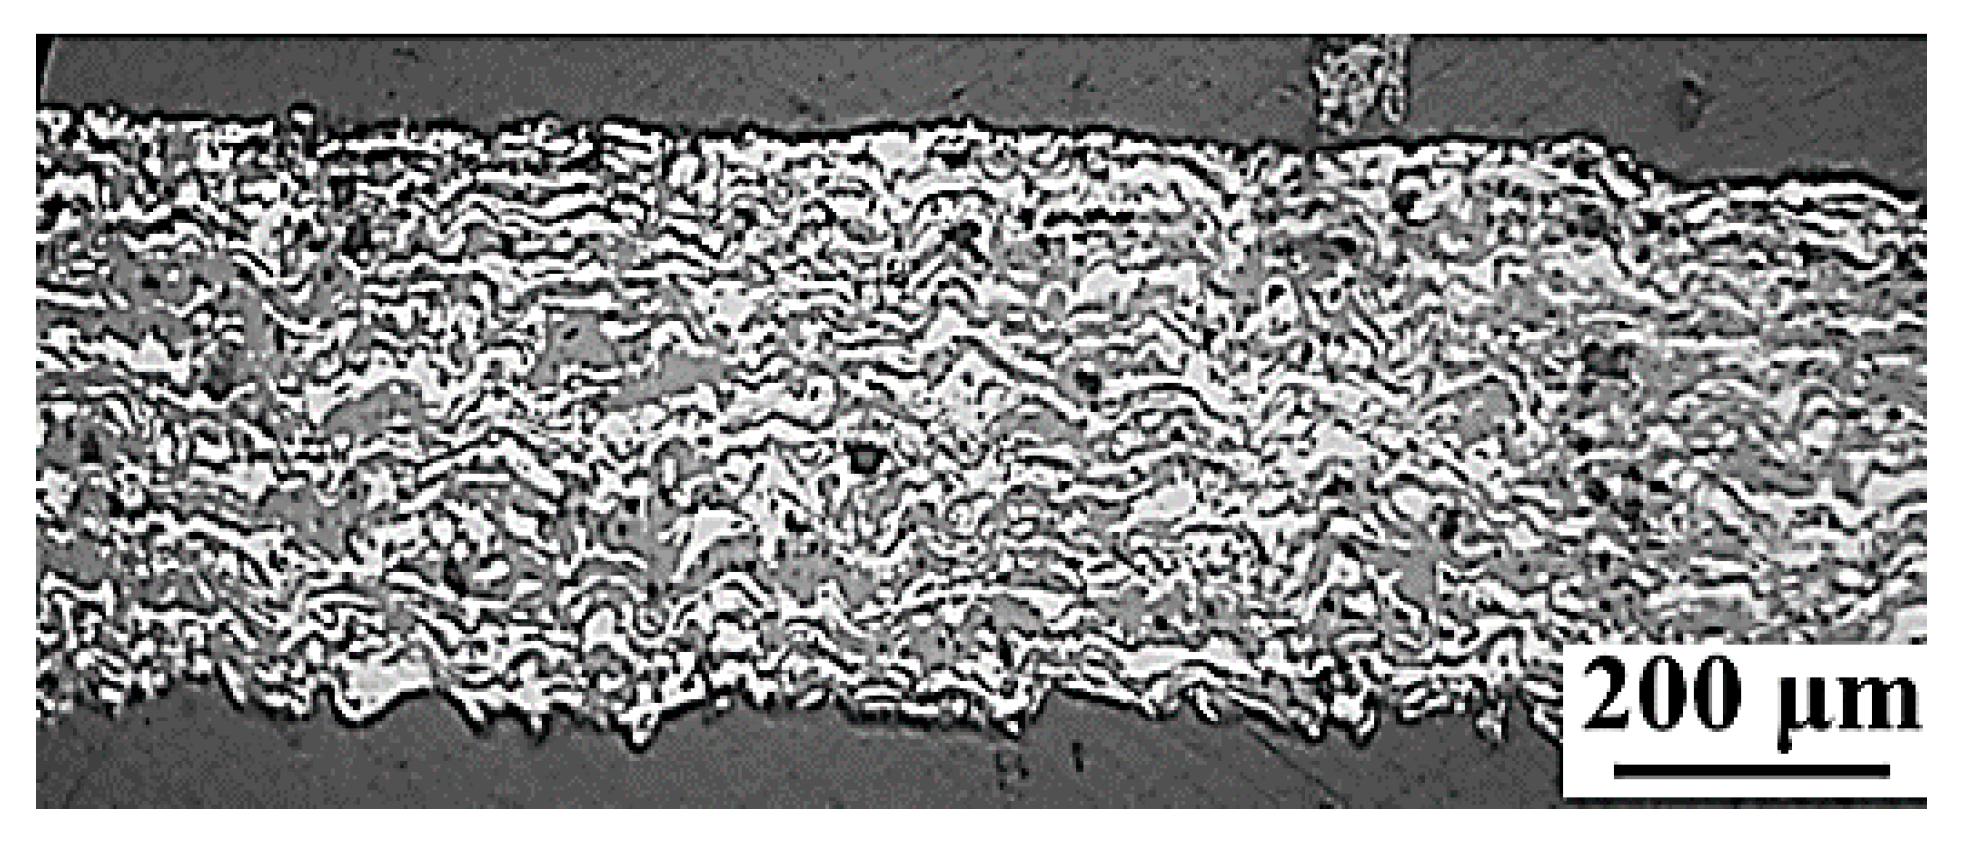
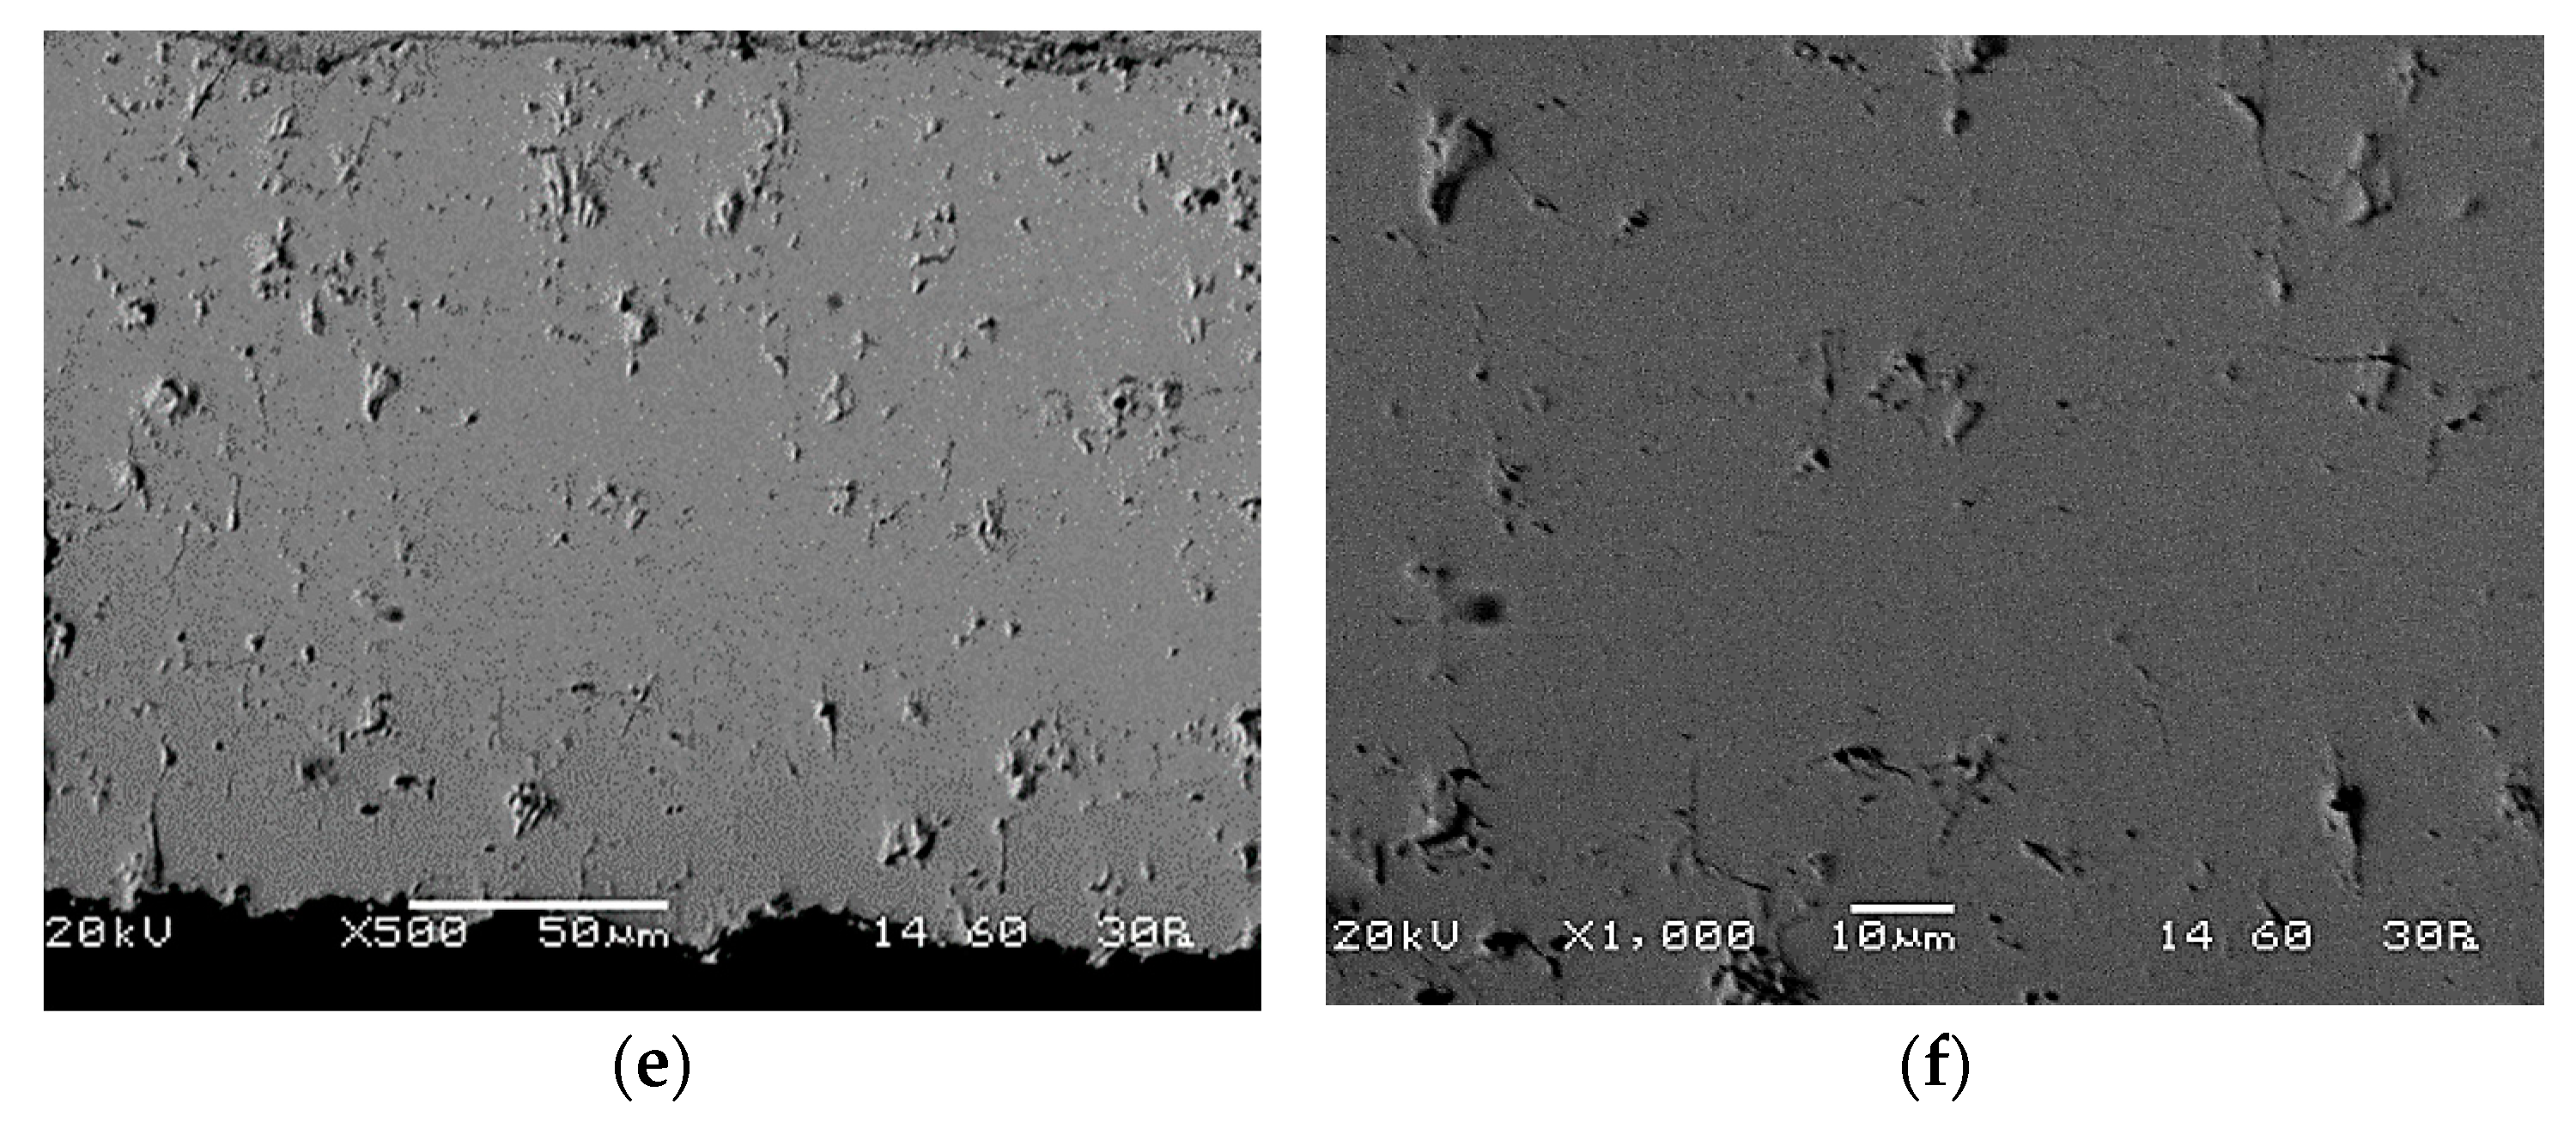
3.5. Improvement of Electrolyte’s Gas Tightness

The present research focused on the possibility of achievement of a thin (below 50 μm) non-molecule permeable electrolyte, a fact that is very important for the functionality of the cell. A similar focus was attempted by other researchers, who tried to achieve this with the use of YSB powder [5]. In the initial series of experiments concerning the YSZ electrolyte, large YSZ particles were used (in the 45–75 μm range), which were spray-dried and agglomerated. In Figure 14a, single splats of those large YSZ particles, which were plasma-sprayed at 28 kW, are shown. It is noted that the majority of the particles have formed splashed splats with elongated fringes, while only a few have retained their original shape. Moreover, the splashed microstructure of the splat can be discerned, where material from the center of the splat has been transferred to its periphery, by jetting away from its center [27], creating a hollow core. In addition, microcracks are noted at the splat surface, both due to increased plasma power and also due to rapid cooling and contractive forces on the splat matter, during its nearly instant solidification. Molten and resolidified particles that are not fully spread are also noticed.
In order to improve gas tightness, smaller YSZ particles (in the 5–22 μm range), which were fused and crushed, were used in the final series of experiments. In Figure 14b–d, single splats of fused and crushed YSZ powder particles sprayed at different plasma power are shown. For low (Figure 14b) and medium plasma power (Figure 14c), the particles are sufficiently spread and have a rounded rim, while the splat matter is kept at the center. At elevated plasma power, although still lower than 28 kW, splat material has been moved to the splat periphery in barely a few particles (Figure 14d). Despite the lower plasma power (20–25 kW), melting and solidification of these particles was better than that of the bigger and agglomerated particles used in the first set of experiments. The reduced particle size contributed to adequate heat transfer to the whole mass of the particles, and thus enhanced melting and subsequent spreading. However, it is noted that even in the plasma power range of 20 to 25 kW, there are differences in the resulted splats’ morphology. More specifically, as the plasma power exceeds 22 kW and approaches 25 kW, the splat morphology of the fused and crushed particles resembles the one obtained by spraying large agglomerated YSZ particles at 28 kW. As a result, the highest gas tightness samples were obtained (Figure 14e,f) with the use of small (5–22 μm) fused and crushed particles at 22 kW (Figure 14c). A recent study [5] arrived at a similar conclusion, where in order to achieve a dense electrolyte, the researchers used fused and crushed YSB particles with a near plasma power to particle size ratio (25 kW, 37.5–75 μm).
Consequently, permeability of the YSZ electrolyte was significantly reduced. However, the layers were still permeable—although hardly—for thicknesses below 100 μm. Electrolyte layer leakage of similar thickness has been reported in the literature [10]. A fully non-permeable YSZ electrolyte was achieved for thicknesses in the 150–200 μm range in the present work. Nevertheless, thicker electrolytes show high (ohmic) resistance during operation of the cell, and since it is claimed that permeability is dominated by the electrolyte properties [17], thinner electrolytes with reinforced impermeability are still a goal for future research.
As connected porosity was not observed, one could arrive at the conclusion that the above-mentioned acetone permeability of the YSZ electrolyte is rather due to microcracks and low cohesion between particles, than to connected porosity. In a similar investigation [10], it is stated that when thermal spraying occurs at harsh plasma spray conditions, the sprayed powder particles undergo rapid heating and subsequent cooling. Thus, thermal stress phenomena appear in the coating, that may even lead to macrocracking, as well as microcracking. According to other investigators [17], microcrack formation could be eliminated by optimizing the heat management during the cooling phase of the YSZ layers.
As a suggestion for future research, in order to further minimize the porosity in the electrolyte layer, the mixing of nano-sized lower melting point electrolyte powders with YSZ microparticles could be performed. This could improve the cohesion between sprayed YSZ microparticles (splats) and eliminate microcrack formation.

4. Conclusions

The novelty of this manuscript is the utilization of a net shape forming technique in order to achieve 100% thermally sprayed SOCs, without the use of a metallic support. Specifically, atmospheric plasma spray was used, which is a cost-effective and single-step fast production technique, in comparison to sintering methods that are currently fully or partially applied in the SOC production field. The present research led to the following conclusions:
  • Three-layer and five-layer free-standing electrode-supported SOCs were manufactured exclusively by the use of the thermal spray technique.
  • Ni and NiO were used in combination with YSZ as support electrode material. Ni/NiO-YSZ feedstock powder delivered higher porosity layers than the ones provided by metallic Ni with YSZ.
  • The complete density and gas tightness of the YSZ electrolyte was not achieved for thicknesses below 100 μm.
  • The permeability of the YSZ electrolyte was significantly reduced when small fused particles and high deposition rates were used, coupled with heat management to avoid microcrack formation. However, the layers were still permeable, although hardly. The permeability is rather attributed to the existence of microcracks, than to connected porosity.
  • A fully non-permeable YSZ electrolyte was achieved for thicknesses in the 150–200 μm range.

Author Contributions

Conceptualization, M.V, D.K.N., and S.G.N.; methodology, M.V.; validation, M.V.; investigation, M.V., P.G., D.K.N., and S.G.N.; resources, M.V. and M.A.; writing—original draft preparation, M.V. and P.G.; writing—review and editing, M.V., P.G., M.A., D.K.N., and S.G.N.; visualization, M.V.; supervision, M.V.; project administration, M.V.; funding acquisition, D.K.N. and S.G.N. All authors have read and agreed to the published version of the manuscript.

Funding

The research leading to these results has received funding from the Fuel Cells and Hydrogen 2 Joint Undertaking under the project SElySOs (Grant Agreement No. 671481).

Institutional Review Board Statement

Not applicable.

Informed Consent Statement

Not applicable.

Data Availability Statement

Not applicable.

Acknowledgments

This Joint Undertaking receives support from the European Union’s Horizon 2020 Research and Innovation Programme.

Conflicts of Interest

The authors declare no conflict of interest.

References

  1. Wang, Y.; Liu, T.; Lei, L.; Chen, F. High temperature solid oxide H2O/CO2 co-electrolysis for syngas production. Fuel Process. Technol. 2017, 161, 248–258. [Google Scholar] [CrossRef]
  2. Onbilgin, S.; Timurkutluk, B.; Timurkutluk, C.; Celik, S. Comparison of electrolyte fabrication techniques on the performance of anode supported solid oxide fuel cells. Int. J. Hydrogen Energy 2020, 45, 35162–35170. [Google Scholar] [CrossRef]
  3. Orsini, A.; Medaglia, P.G.; Sanna, S.; Traversa, E.; Licoccia, S.; Tebano, A.; Balestrino, G. Epitaxial superlattices of ionic conductor oxides. Superlattices Microstruct. 2009, 46, 223–226. [Google Scholar] [CrossRef] [Green Version]
  4. Nesaraj, A.S.; Raj, I.A.; Pattabiraman, R. Tape casting of alternate electrolyte components for solid oxide fuel cells. Indian J. Eng. Mater. Sci. 2006, 13, 347–356. Available online: http://nopr.niscair.res.in/handle/123456789/7567 (accessed on 3 May 2021).
  5. Chen, R.; Zhang, S.-L.; Li, C.-J.; Li, C.-X. Plasma-sprayed high-performance (Bi2O3)0.75(Y2O3)0.25 electrolyte for intermediate-temperature solid oxide fuel cells (IT-SOFCs). J. Therm. Spray Technol. 2021, 30, 196–204. [Google Scholar] [CrossRef]
  6. Torrell, M.; Cano, I.G.; Miguel, J.M.; Guilemany, J.M.; Laguna-Bercero, M.A.; Orera, V.M. Solid Oxide Fuel Cells produced by Atmospheric Plasma Spray technology: Structural and electrochemical characterization. In Proceedings of the International Thermal Spray Conference and Exposition, Houston, TX, USA, 21–24 May 2012; Available online: http://hdl.handle.net/10261/103043 (accessed on 3 May 2021).
  7. Li, C.-J.; Ning, C.-X.; Ning, X.-J. Performance of YSZ electrolyte layer deposited by atmospheric plasma spraying for cermet-supported tubular SOFC. Vacuum 2004, 73, 699–703. [Google Scholar] [CrossRef]
  8. Tucker, M.C. Progress in metal-supported solid oxide electrolysis cells: A review. Int. J. Hydrogen Energy 2020, 45, 24203–24218. [Google Scholar] [CrossRef]
  9. Costa, R.; Ansar, A. “Evolved materials and innovative design for high performance, durable and reliable SOFC cell and stack” presentation and status of the european project EVOLVE. ECS Trans. 2013, 57, 533–541. [Google Scholar] [CrossRef] [Green Version]
  10. Ilhan, Z.; Ansar, A.; Soysal, D. Recent Progress in Intermediate Temperature SOFCs (ITSOFCs) Development at DLR. In Proceedings of the Advances and Innovations in SOFCs 2: From Materials to Systems Conference, Katarino, Bulgaria, 11–16 September 2011; Available online: https://elib.dlr.de/71020/ (accessed on 3 May 2021).
  11. Szabo, P.; Ansar, A.; Franco, T.; Gindrat, M.; Kiefer, T. Stack Tests of Metal-Supported Plasma-Sprayed SOFC. In Proceedings of the 10th European SOFC Forum Conference, Lucerne, Switzerland, 26–29 June 2012; Available online: https://elib.dlr.de/78828/ (accessed on 3 May 2021).
  12. Fang, X.; Zhu, J.; Lin, Z. Effects of electrode composition and thickness on the mechanical performance of a solid oxide fuel cell. Energies 2018, 11, 1735. [Google Scholar] [CrossRef] [Green Version]
  13. National Energy Technology Laboratory. Seventh Edition Fuel Cell Handbook. Available online: https://netl.doe.gov/sites/default/files/netl-file/FCHandbook7.pdf (accessed on 3 May 2021).
  14. Muhoza, S.P.; Lee, S.; Song, X.; Guan, B.; Yang, T.; Gross, M.D. Enhancing activity, charge transport, power production, and stability of commercial solid oxide fuel cells with yttria-stabilized zirconia nanoparticles. J. Electrochem. Soc. 2020, 167, 024517. [Google Scholar] [CrossRef]
  15. Gupta, M.; Weber, A.; Markocsan, N.; Gindrat, M. Electrochemical performance of plasma sprayed metal supported planar solid oxide fuel cells. J. Electrochem. Soc. 2016, 163, F1059–F1065. [Google Scholar] [CrossRef] [Green Version]
  16. Jarligo, M.O.; Mauer, G.; Bram, M.; Baumann, S.; Vaßen, R. Plasma spray physical vapor deposition of La1−xSrxCoyFe1−yO3−δ thin-film oxygen transport membrane on porous metallic supports. J. Therm. Spray Technol. 2014, 23, 213–219. [Google Scholar] [CrossRef] [Green Version]
  17. Waldbillig, D.; Kesler, O. Characterization of metal-supported axial injection plasma sprayed solid oxide fuel cells with aqueous suspension plasma sprayed electrolyte layers. J. Power Source 2009, 191, 320–329. [Google Scholar] [CrossRef]
  18. Károly, Z.; Szépvölgyi, J. Hollow alumina microspheres prepared by RF thermal plasma. Powder Technol. 2003, 132, 211–215. [Google Scholar] [CrossRef]
  19. Fauchais, P.; Montavon, G.; Bertrand, G. From powders to thermally sprayed coatings. J. Therm. Spray Technol. 2010, 19, 56–80. [Google Scholar] [CrossRef] [Green Version]
  20. Solonenko, O.P.; Gulyaev, I.P.; Smirnov, A.V. Thermal plasma processes for production of hollow spherical powders: Theory and experiment. J. Therm. Sci. Technol. 2011, 6, 219–234. [Google Scholar] [CrossRef] [Green Version]
  21. Odhiambo, J.G.; Li, W.; Zhao, Y.; Li, C. Porosity and its significance in plasma-sprayed coatings. Coatings 2019, 9, 460. [Google Scholar] [CrossRef] [Green Version]
  22. Deshpande, S.; Kulkarni, A.; Sampath, S.; Herman, H. Application of image analysis for characterization of porosity in thermal spray coatings and correlation with small angle neutron scattering. Surf. Coat. Technol. 2004, 187, 6–16. [Google Scholar] [CrossRef]
  23. Kuroda, S.; Watanabe, M.; Kim, K.; Katanoda, H. Current status and future prospects of warm spray technology. J. Therm. Spray Technol. 2011, 20, 653–676. [Google Scholar] [CrossRef] [Green Version]
  24. Ctibor, P.; Roussel, O.; Tricoire, A. Unmelted particles in plasma sprayed coatings. J. Eur. Ceram. Soc. 2003, 23, 2993–2999. [Google Scholar] [CrossRef]
  25. Mahato, N.; Sharma, S.; Keshri, A.K.; Simpson, A.; Agarwal, A.; Balani, K. Nanomechanical properties and thermal conductivity estimation of plasma-sprayed, solid-oxide fuel cell components: Ceria-doped, yttria-stabilized zirconia electrolyte. J. Miner. Met. Mater. Soc. 2013, 65, 749–762. [Google Scholar] [CrossRef]
  26. Zhang, C.; Li, W.-Y.; Liao, H.; Li, C.-J.; Li, C.-X.; Coddet, C. Microstructure and electrical conductivity of atmospheric plasma-sprayed LSM/YSZ composite cathode materials. J. Therm. Spray Technol. 2007, 16, 1005–1010. [Google Scholar] [CrossRef]
  27. Fukumoto, M.; Huang, Y. Flattening mechanism in thermal sprayed nickel particle impinging on flat substrate surface. J. Therm. Spray Technol. 1999, 8, 427–432. [Google Scholar] [CrossRef]
Figure 1. Net shape spray-forming: (step 1) spraying of the SOC layers on a porous metallic support, (step 2) detachment of the SOC cell from the substrate, (final product) schematic representation of the five-layer structure of the suggested SOC.
Coatings 11 00682 g001
Figure 2. XRD spectra and OM micrographs of (a) Ni powders used for production of NiO through a flame spray gun, and (b) Ni-NiO hollow powders. Phase identification was performed by XRD. The identified X-ray diffraction patterns are: •: Ni (PDF 01-087-0712), and *: NiO (PDF 00-004-0835).
Coatings 11 00682 g002
Figure 3. Porosity control in YSZ layer: (a) OM cross-section micrograph and (b) SEM image of the fracture surface of low-porosity YSZ layer.
Coatings 11 00682 g003
Figure 4. OM micrographs of support electrode 50% Ni–50% YSZ layers fabricated with plasma power of 20 kW and Ni powder of particle size of 14–45 μm.
Coatings 11 00682 g004
Figure 5. (a) OM micrograph of the cross-section of the electrode layer when Ni/NiO powder is used instead of Ni. Increased porosity is observed. (b) OM micrograph of a partially oxidized Ni powder particle. The Ni phases are depicted with light grey and the NiO phases are depicted with dark grey.
Coatings 11 00682 g005
Figure 6. Metallographic cross-section of the end electrode LSM layer.
Coatings 11 00682 g006
Figure 7. OM micrograph of three-layer sample consisted of a porous 50% Ni–50% YSZ support electrode layer (top), a middle, relatively dense YSZ electrolyte layer and a porous end electrode LSM layer (bottom).
Coatings 11 00682 g007
Figure 8. Five-layer structure SEM image.
Coatings 11 00682 g008
Figure 9. (a,b) SEM images of microstructural details of the support electrode layer of the five-layered cell. The scale bars attached on the upper right corners of both Figures correspond to 10 μm.
Coatings 11 00682 g009
Figure 10. SEM image of the YSZ electrolyte layer. The scale bar attached on the upper right corner of the Figure corresponds to 50 μm.
Coatings 11 00682 g010
Figure 11. (a,b) SEM images of microstructural details of the end electrode transition layer of the five-layered cell. The detailed area enclosed in the black rectangle in (a) is presented enlarged in (b). Light-grey areas are YSZ, while white areas are LSM. Both ceramics are in splat form and an alteration between the two materials appears. The scale bar attached on the upper left corner of (a) corresponds to 100 μm, while the one on (b) corresponds to 10 μm.
Coatings 11 00682 g011
Figure 12. SEM image of microstructural details of the end electrode layer of the five-layered cell. Within the LSM layer, light grey areas predominate which are rich in La and Sr, while dark grey areas appear rich in Mn. The scale bar attached on the upper right corner of the Figure corresponds to 10 μm.
Coatings 11 00682 g012
Figure 13. OM micrographs of support electrode 50% Ni–50% YSZ layers fabricated with a plasma power of 33 kW and Ni powder of particle size of 45–75 μm.
Coatings 11 00682 g013
Figure 14. (a) SEM image of splats of large agglomerated YSZ particles of 45–75 μm at 28 kW. OM micrographs of small fused and crushed YSZ particles of 5–22 μm, after target test at (b) 20 kW, (c) 22 kW and (d) 25 kW. (e,f) SEM images of the electrolyte YSZ layer produced with YSZ particles of 5–22 μm at 22 kW, at different magnifications.
Coatings 11 00682 g014aCoatings 11 00682 g014b
Publisher’s Note: MDPI stays neutral with regard to jurisdictional claims in published maps and institutional affiliations.

