Article

Corrosion Resistance of AISI 304 Stainless Steel Modified Both Femto- and Nanosecond Lasers

by
Katarzyna M. Mroczkowska
1,
Paulina Dzienny
1,
Aleksander Budnicki
2 and
Arkadiusz J. Antończak
1,*
1
Faculty of Electronics, Wroclaw University of Science and Technology, Wyb. Wyspianskiego 27, 50-370 Wroclaw, Poland
2
TRUMPF Laser GmbH + Co. KG, Aichhalder Straße 39, D-78713 Schramberg, Germany
*
Author to whom correspondence should be addressed.
Coatings 2021, 11(5), 592; https://doi.org/10.3390/coatings11050592
Submission received: 13 April 2021 / Revised: 11 May 2021 / Accepted: 14 May 2021 / Published: 18 May 2021
(This article belongs to the Special Issue Anticorrosion Protection of Nonmetallic and Metallic Coatings II)

Abstract

:
This article is aimed to study the effect of laser treatment of AISI 304 stainless steel on the corrosion resistance and chemical composition of the surface layer. The samples were irradiated using two quite different laser sources: IPG Yb:glass fibre laser (τ = 230 ns, λ = 1062 nm) and Trumpf TruMicro Series 2020 fiber laser (τ = 260 fs–20 ps, λ = 1030 nm) that is, in both the long and ultra-short pulse duration regime. It allowed the observation of completely different microstructures and chemical composition of the surface layer. In this study, the morphology of the samples was accessed using both Keyence digital microscope and Olympus Lext 5000 profilometer. The corrosion resistance was examined in 3% NaCl solution using both potentiodynamic measurement and Electrochemical Impedance Spectroscopy. In order to examine the change in chemical composition of the surface layer, the X-ray photoelectron spectroscopy study was performed. Results show that the use of a long laser pulse contributes to the formation of a thin, tight, rich in chromium passive layer, which significantly improves corrosion resistance in comparison to the reference sample. Different behaviour is observed after irradiation with an ultra-short pulse duration laser.

Graphical Abstract

1. Introduction

The main avails of the laser processing applied in surface engineering are high quality, resolution and wear resistance, the possibility of automation, low operating costs, and process purity. For these reasons, it found its application, particularly in medicine (marking implants and surgical tools), tool marking, automotive, and aerospace industry. Despite many advantages, one of the problems that can arise after laser irradiation of steel is increased corrosion, resulting mainly from a change in the surface morphology (defects, roughness) and its physicochemical structure. Due to its unpredictability, lack of information and mostly negative impact on corrosion resistance the universality of this processing method is limited.
The duration of the laser pulse is an important factor affecting the interaction between the beam and the material. In case of long pulses, due to thermalization of deposited energy, the oxide layer is formed on the surface, and there is a change in both morphology and chemistry of the surface layer, whereas ultrashort pulses exert an impact mainly on the topography, as the short time of deposition of energy limits the production of heat. A particular case of the latter one is the occurrence of laser-induced periodic surface structures (LIPSS), also referred to as “ripples”. They are a subject of interest mainly because due to the sub-micrometre size of their period they can act as a diffraction grating, generating structural colours. Both mechanisms of light absorption lead to change in the surfaces’ susceptibility to corrosion, optical properties, wettability, etc. [1,2,3,4,5,6,7,8].
However, it should be emphasized that laser processes are inevitably accompanied by a change in geometry, chemistry, or both. Two lasers with different pulse duration (nano- and femtosecond) were selected for research. Both the mechanism of light absorption and the processes accompanying material modification with these lasers are radically different. The principle of the laser with a long pulse duration is based on the controlled supply of energy in an oxygen-containing environment, causing changes in both the chemical composition (rearrangement of ions according to the principles of thermodynamics and kinetics of accompanying reactions), and the development of the surface condition (roughness, microcracks, and other defects). The use of a femtosecond laser shows a different effect. A unique feature of ultra-short pulses is the supply of energy in less time than the time needed for its thermalization (depending on the material it ranges from one to several picoseconds). Overall, this results in a significant improvement in the quality of material treatment due to the reduction of thermal and mechanical load. AISI 304 stainless steel, due to numerous advantages, including high resistance to corrosion and temperature, good mechanical parameters (strength, elasticity, plasticity), shiny gloss, etc., is one of the most commonly used materials, practically in every industry from everyday products, medical, automotive, aviation, maritime, building constructions, to space and high-tech applications.
The aim of this work was to compare the effect of laser treatment of different pulse duration on the morphology, chemical composition of the surface layer, and corrosion resistance of AISI 304 stainless steel.
The novelty of the presented approach consists in both examining the corrosion properties of the stainless-steel surfaces covered in LIPSS structures as a special case of femtosecond laser radiation effect, as there are few reports in the literature, and on comparing the mutual influence of both laser radiation on the corrosion resistance of the material. As it is commonly known, the formation of an oxide layer on the surface of the material is not only a function of the applied process parameters, but also the initial state of the surface of the modified material. However, the mutual interaction of two techniques, one of which (ns-laser), in accordance with our previous research [9], was optimized to obtain the highest corrosion resistance, and the other technique allowing the maximum development of the effective surface of the material by producing periodic structures (LIPSS) with a fs-laser, which should have a negative impact on corrosion resistance, did not allow for the formulation of a predictable result. The obtained results should help to better understand how the laser interaction modifies the corrosion of stainless steel.

2. Materials and Methods

2.1. Preparation of Samples

Experiments were performed on a commonly used stainless steel AISI 304 (0H18N9, cold rolled sheets with a chemical composition: 17 wt.% Cr, 12 wt.% Ni, 2.5 wt.% Mo, max 2 wt.% Mn, max 1 wt.% Si, max = 0.008 wt.% C, Fe = residual) with a dimension of 20 × 20 mm2 and thicknesses of 1 mm. The plates were pre-coated with an anti-scratch polymer foil, which was removed before the experiment. Before the laser treatment process, samples had also been twice washed for 10 min in 60 °C in an ultrasonic cleaner filled with isopropyl alcohol and dried by compressed nitrogen.

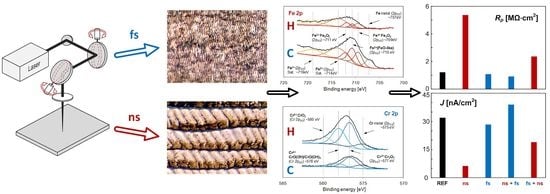
2.2. Laser Treatment

In this research, two quite different laser sources were used to change both the morphology and the chemical composition of the AISI 304 stainless steel.
First was the nanosecond (pulse duration τ = 230 ns) Yb:glass fibre laser with a wavelength of λ = 1062 nm, an average output power of up to P = 20 W, beam diameter d = 40 μm and beam quality factor M2 ≤ 1.2 (IPG, YLP series, Oxford, MA, USA). In this system F-theta lens (LINOS type 4401-301-000-20/21, Goettingen, Germany) was used. The temperature of the substrate was controlled (20 ± 0.2 °C) using a temperature controller (ILX Lightwave type LDT-5525, Bozeman, MT, USA). A detailed diagram and setup visualization were presented in the previous work [10]. Samples were irradiated at a normal angle using the following parameters: output power P = 4.4 W, scanning speed V = 396 mm/s, hatching distance h = 10 μm and pulse repetition rate PRR = 80 kHz. These parameters were selected due to our previous research results [3,9]. These studies showed that after laser irradiation with above-mentioned parameters, a thin, tight, passive, chromium oxide-rich layer with extremely high corrosion resistance (significantly higher than the unstructured sample) is formed on the steel surface. The question then arose whether and how this result will be influenced by additional femtosecond laser radiation directed at the largest possible surface development through the LIPSS structures.
The second laser source was Trumpf TruMicro Series 2020 fiber laser (Schramberg, Germany) with pulse duration time tuneable from 260 fs to 20 ps, the wavelength of λ = 1030 nm, an average output power of up to P = 20 W, and beam quality factor M2 < 1.15. The SCANLAB’s optical scanning system intelliSCAN 14se (Puchheim, Germany) alongside with F-Theta lens of fd = 163 mm was used (Sill Optics S4LFT1163/081, Wendelstein, Germany). The resulting beam diameter d was below 50 μm. Samples were irradiated at normal angle using the following parameters: output power P = 0.4, 0.7 and 1.2 W, scanning speed V = 200 mm/s, hatching distance h = 5 μm and pulse repetition rate PRR = 20 kHz. These parameters were experimentally selected as being suitable for the formation of relatively good quality LIPSS and average corrosion parameters on the surfaces [8].
In this study, five samples of AISI 304 stainless steel were selected for the experiments (Figure 1):
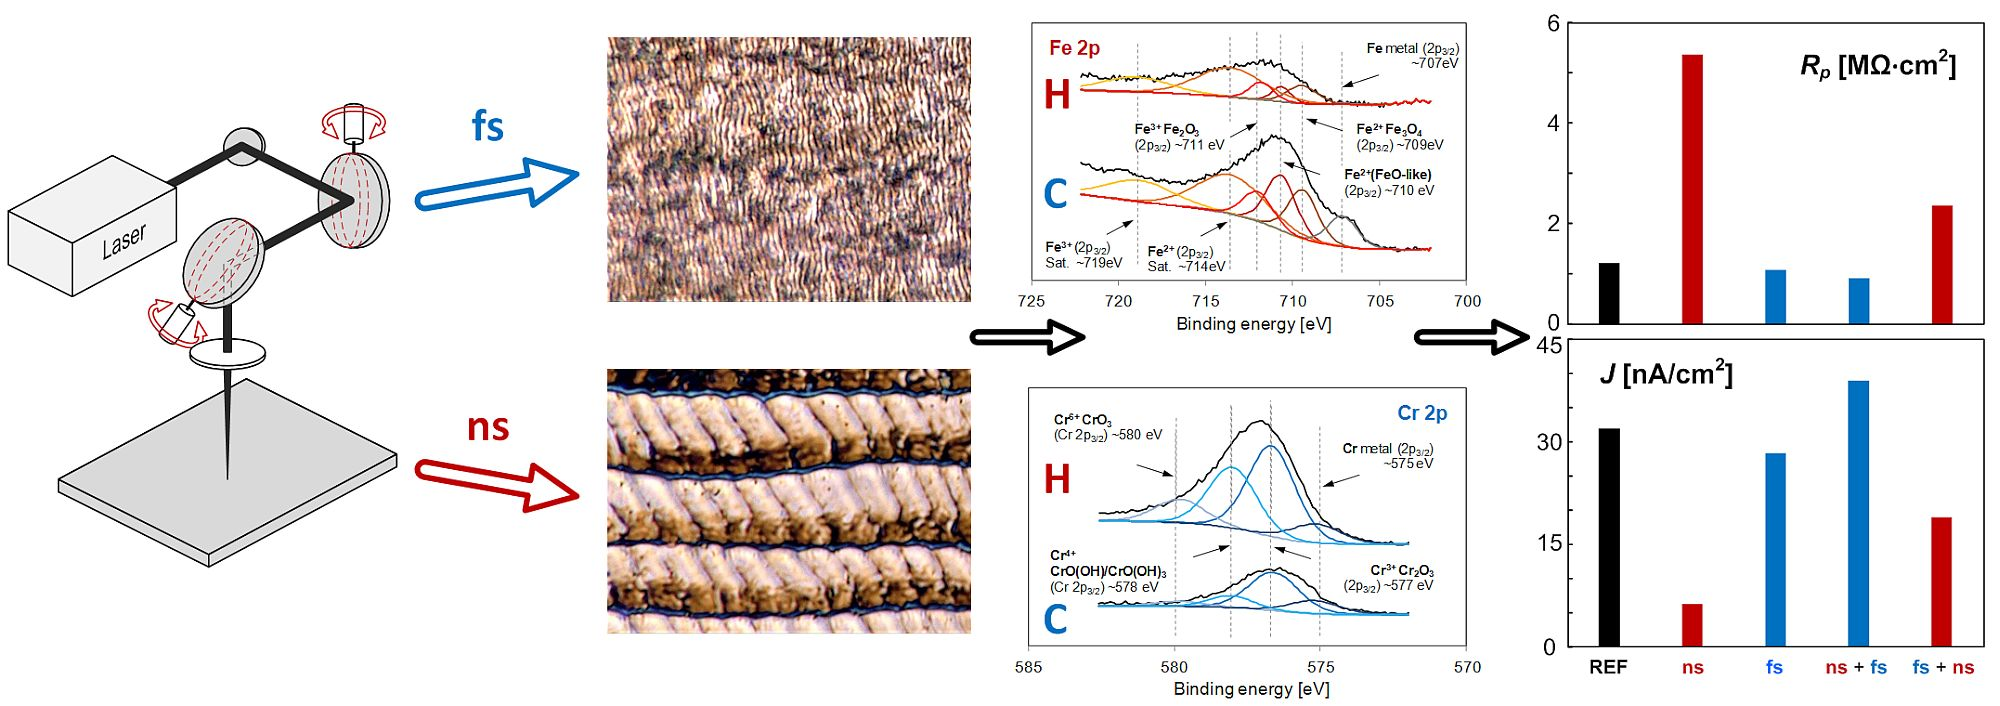
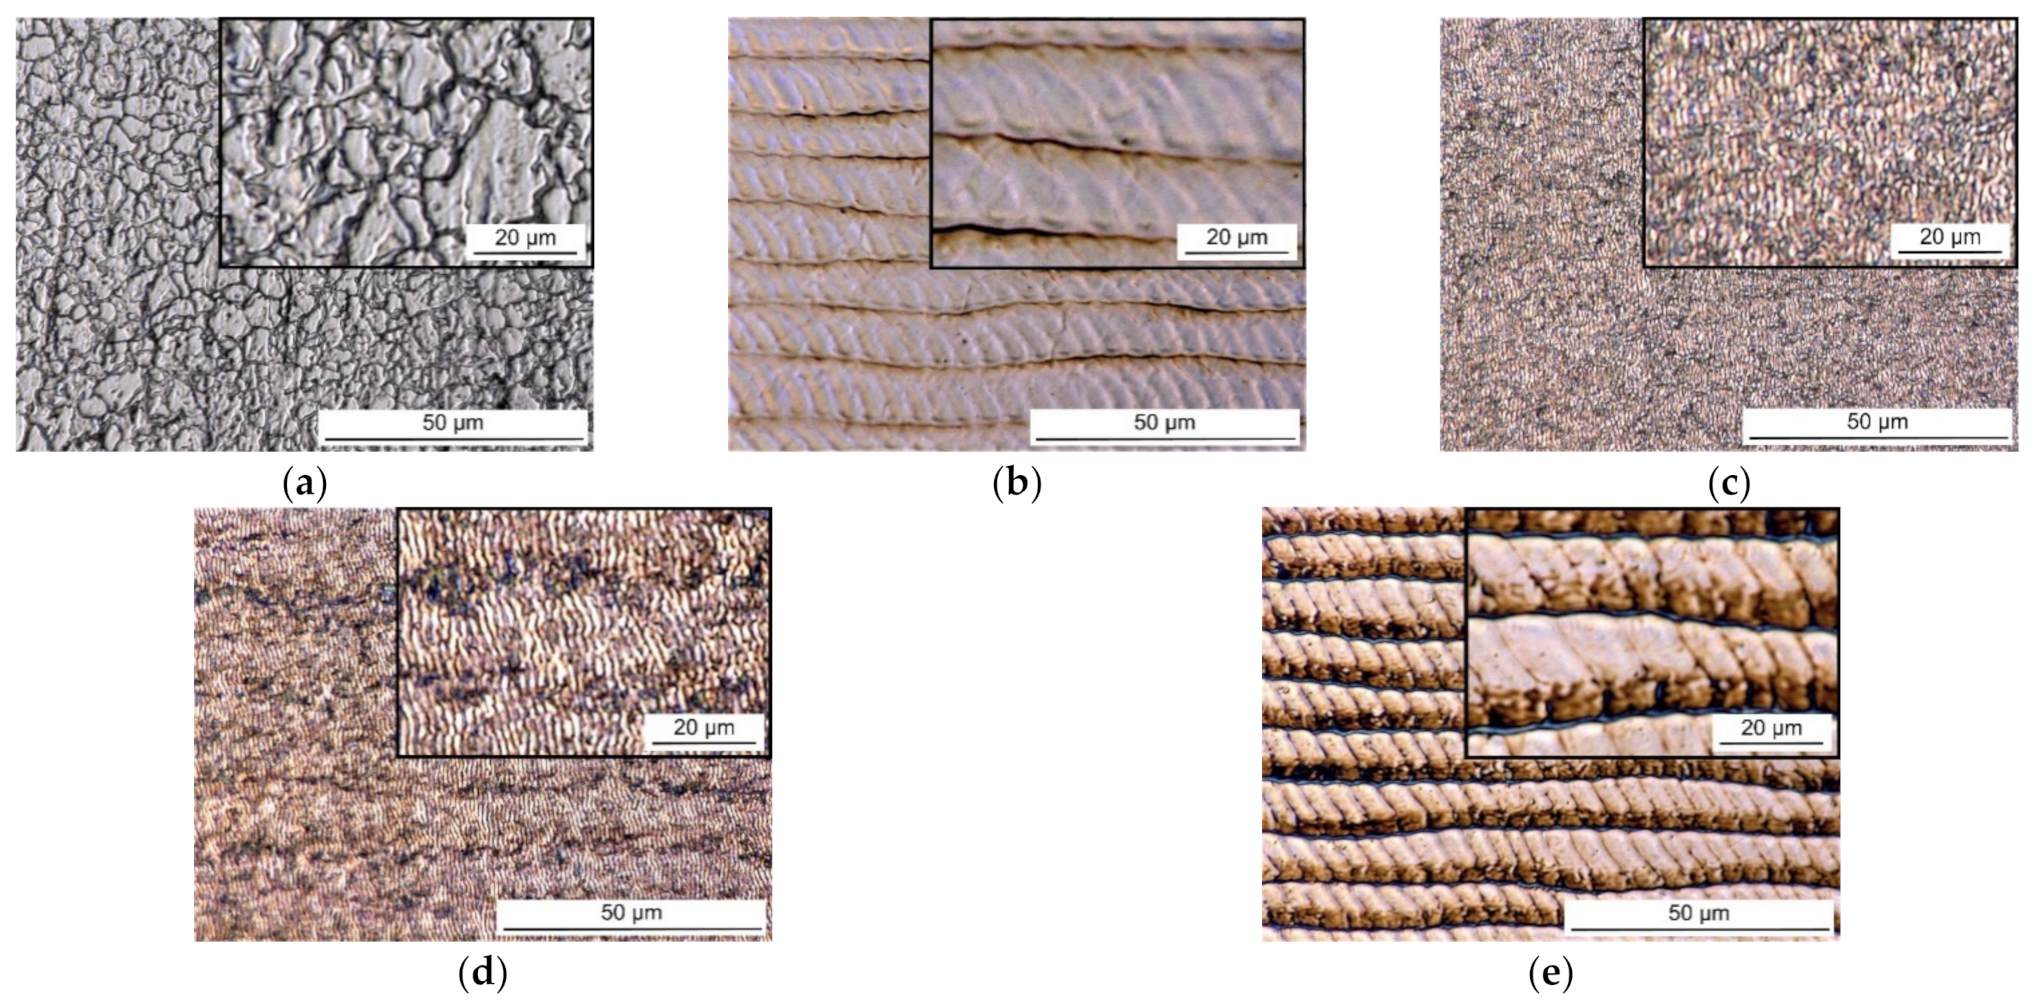
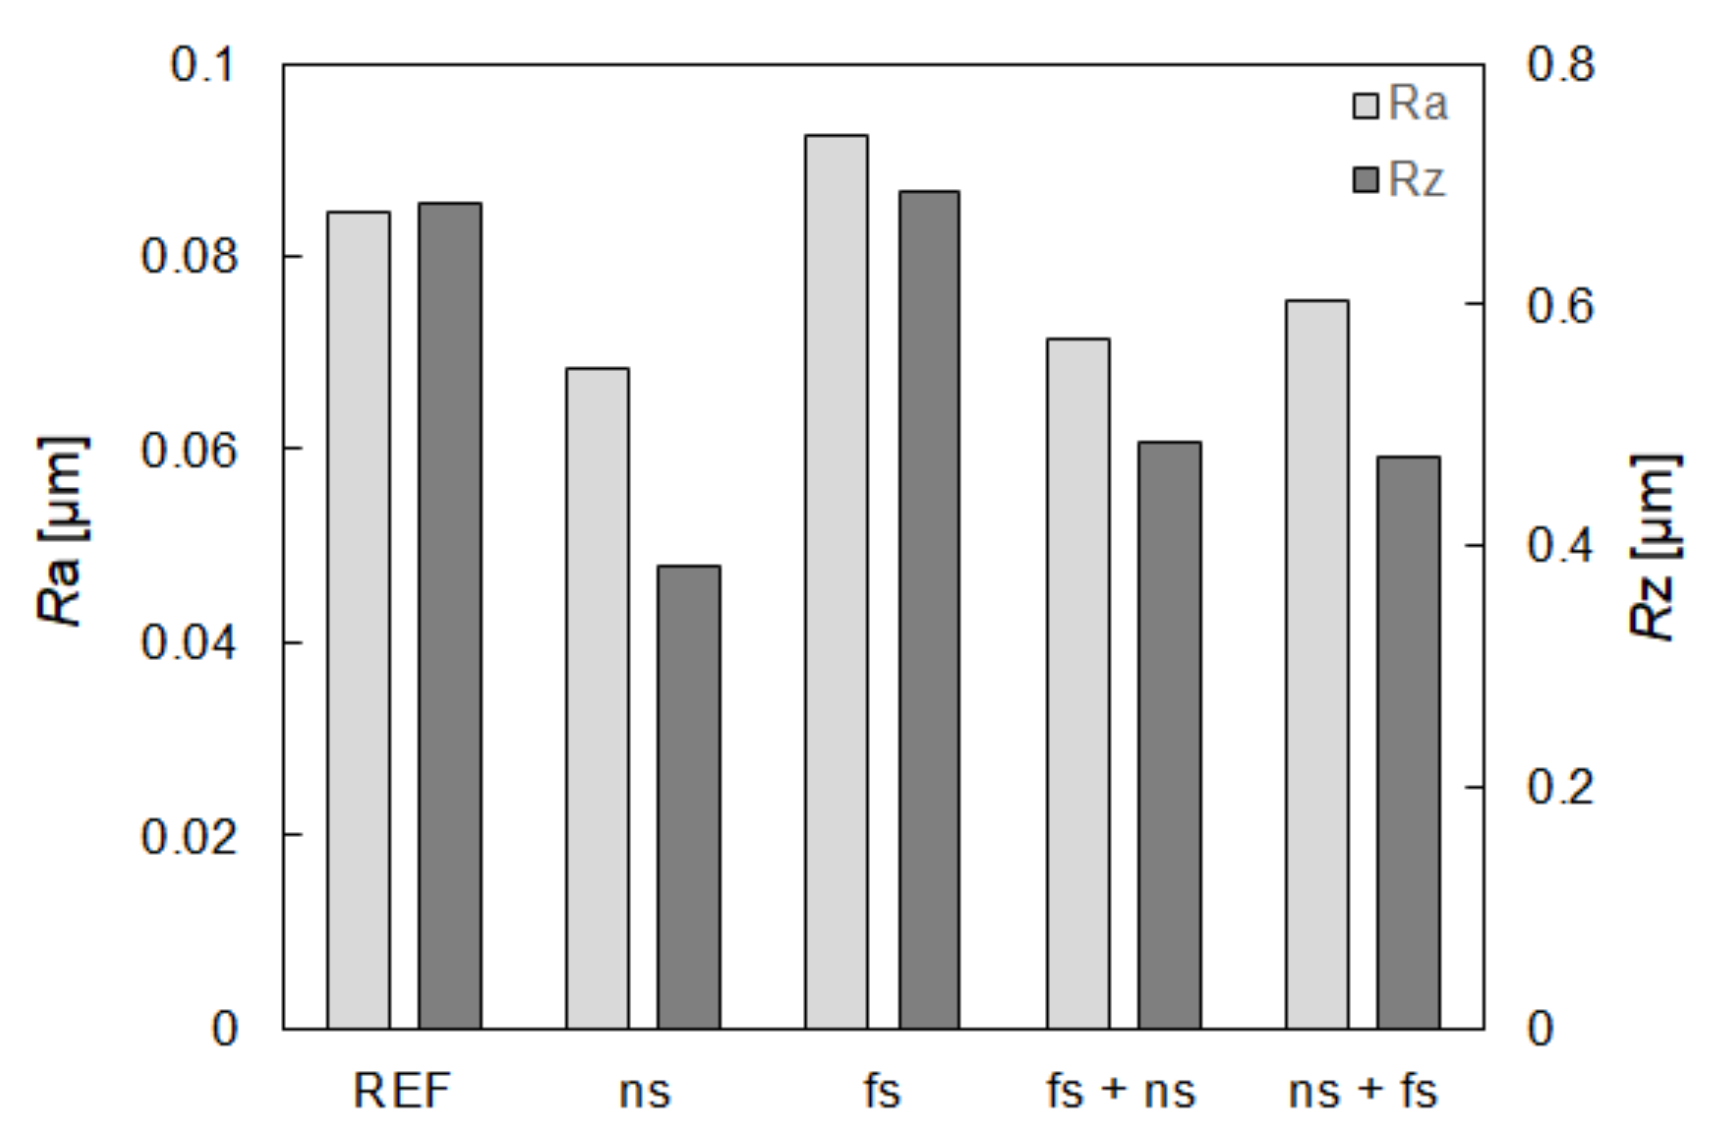
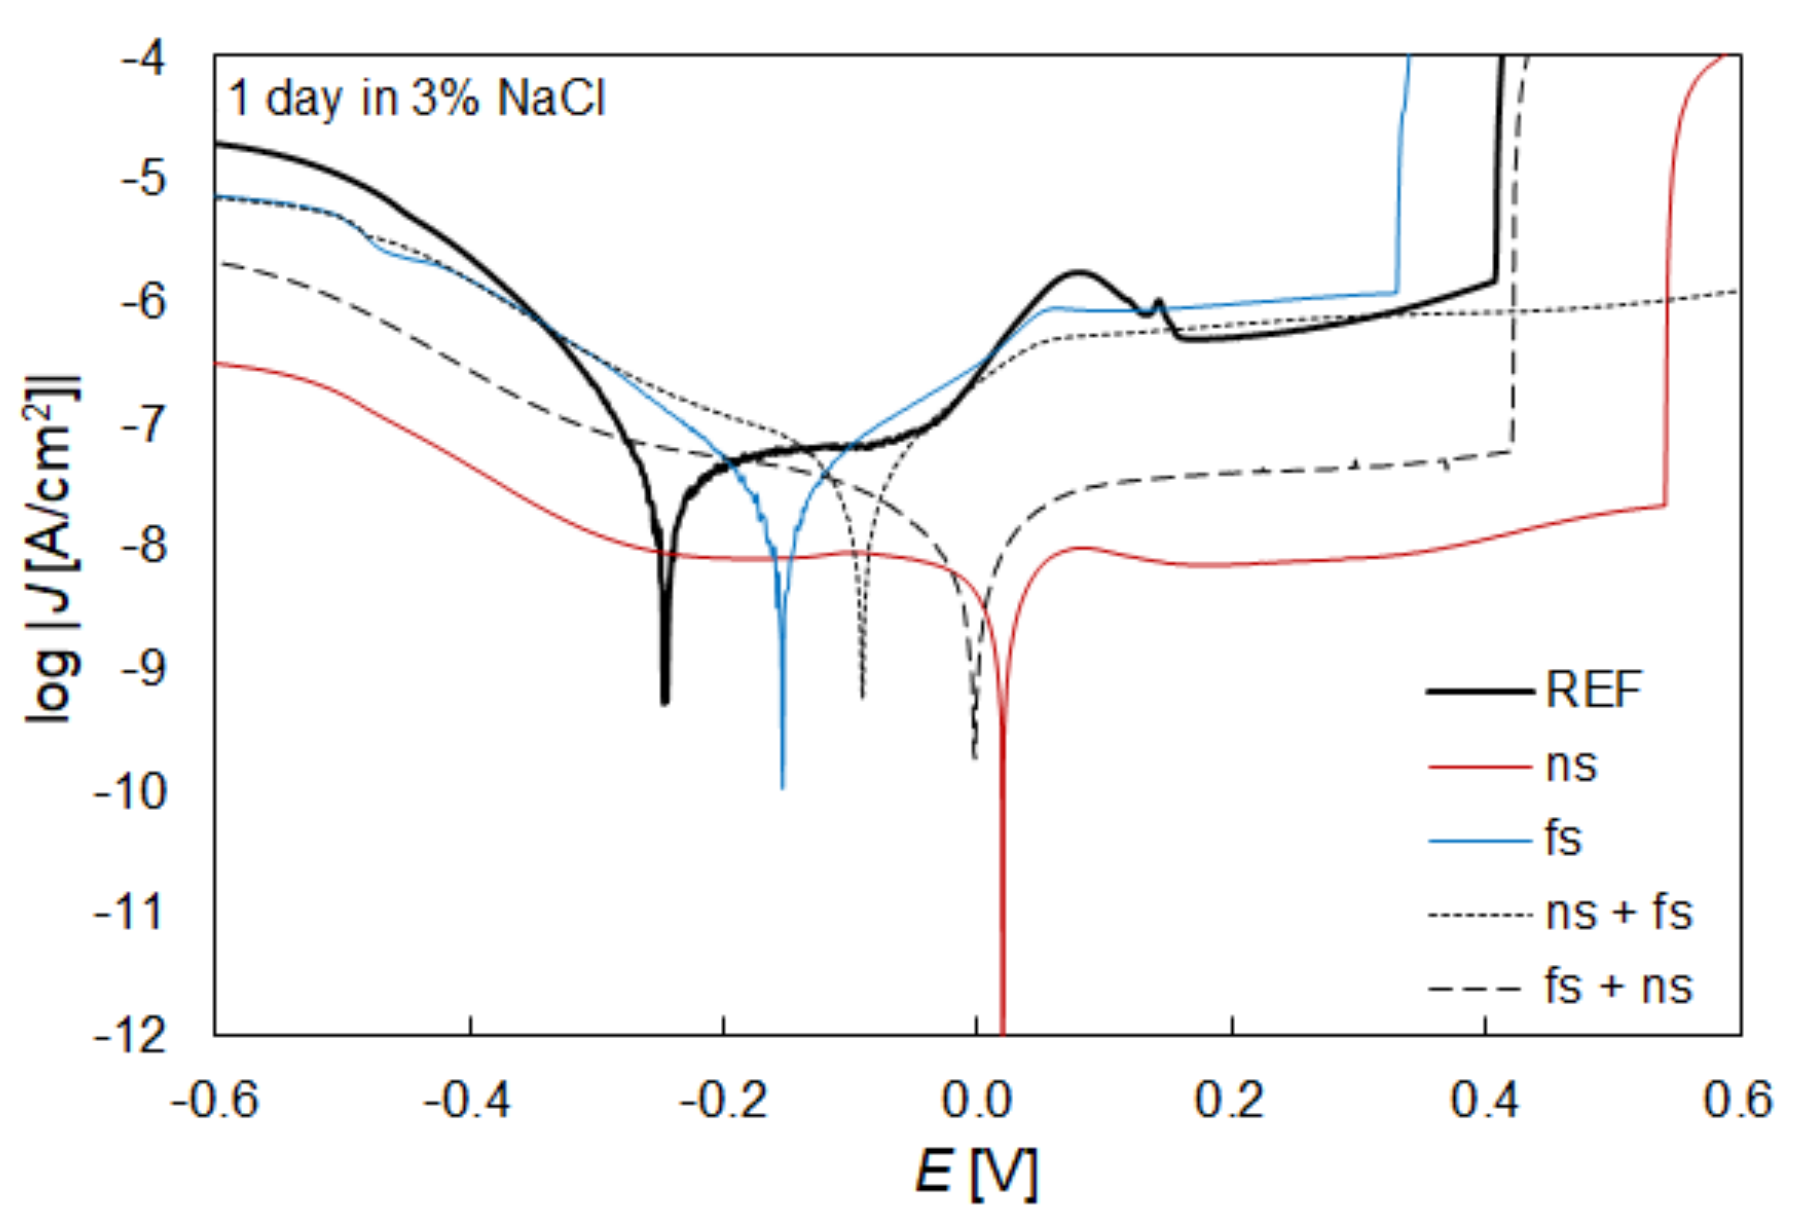
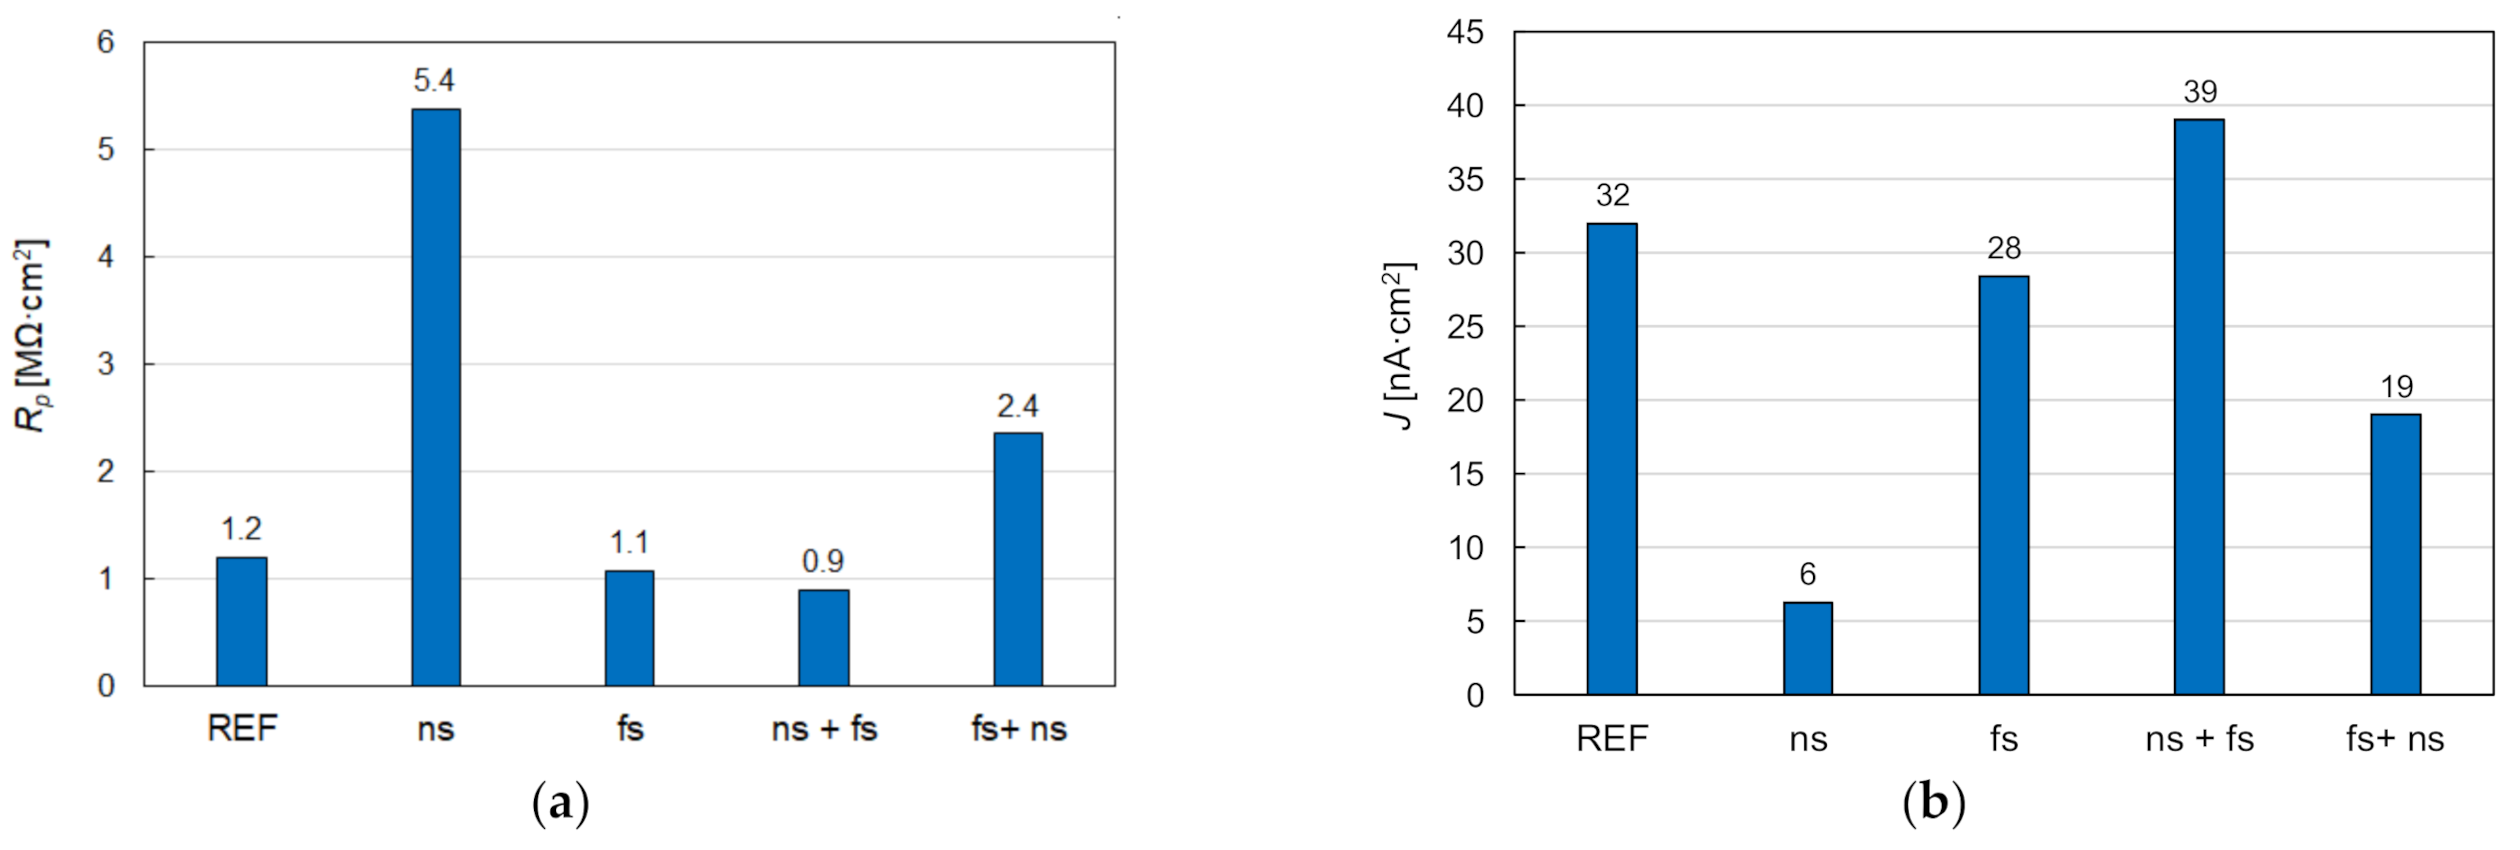
  • Reference—hereinafter referred to as REF,
  • irradiated using only nanosecond laser—hereinafter referred to as ‘ns’,
  • irradiated using only femtosecond laser—hereinafter referred to as ‘fs’,
  • irradiated using femtosecond and then nanosecond laser—hereinafter referred to as ‘fs + ns’,
  • irradiated using nanosecond and then femtosecond laser—hereinafter referred to as ‘ns + fs’.
The samples having dimensions of 20 × 20 × 1 mm3 were irradiated on the surface of 15 × 15 mm2.

2.3. The Morphology and Surface Roughness of the Samples

Microscopic visualization of the samples was carried out using a Keyence VHX-5000 digital microscope. An Olympus Lext 5000 profilometer equipped with a 405 nm laser diode was used to assess the roughness of the samples. Surface roughness (Ra—arithmetic mean roughness value from the absolute value of all profile values of the measuring section, Rz—the distance from the highest peak to the lowest part of the trough [11]) were carried out at an angle of 90 degrees to the lines scanned by laser in order to obtain the largest scatter of results, for a trace width of 4 mm. Ten measurements were made for each sample. The presented results are the average value. The research was carried out in accordance with standard PN-EN ISO 4288.

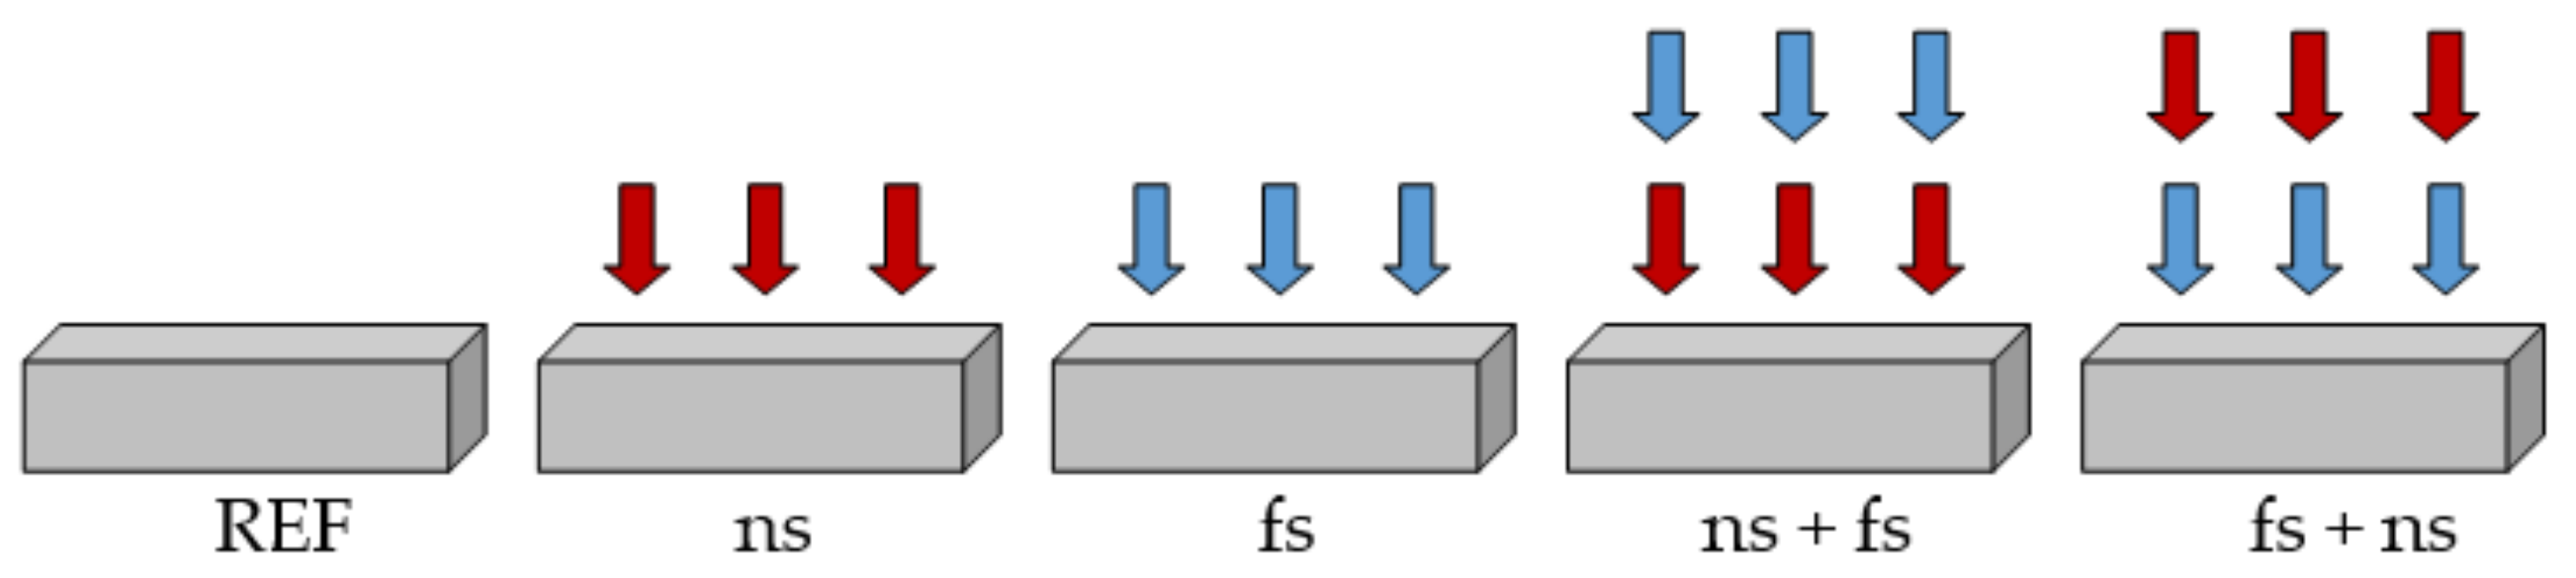
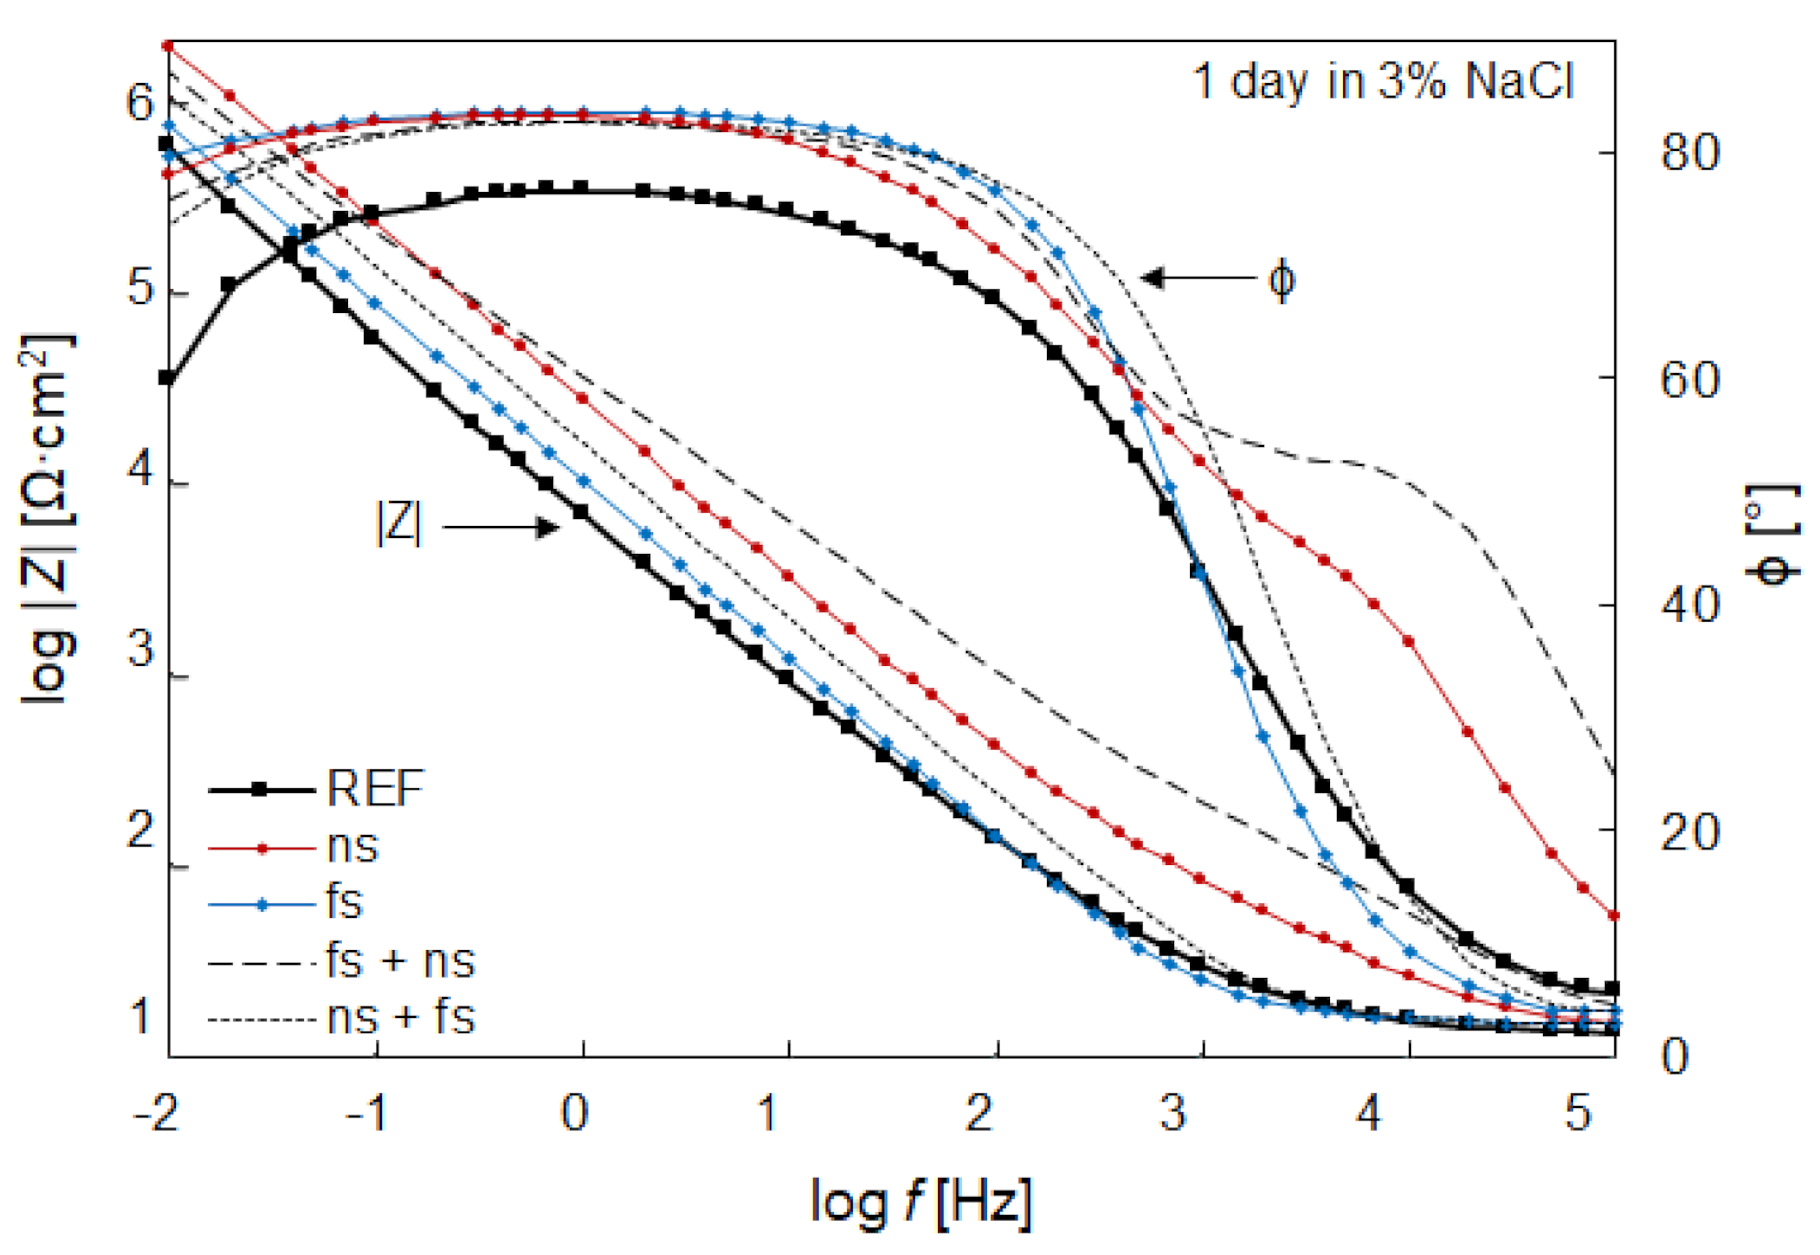
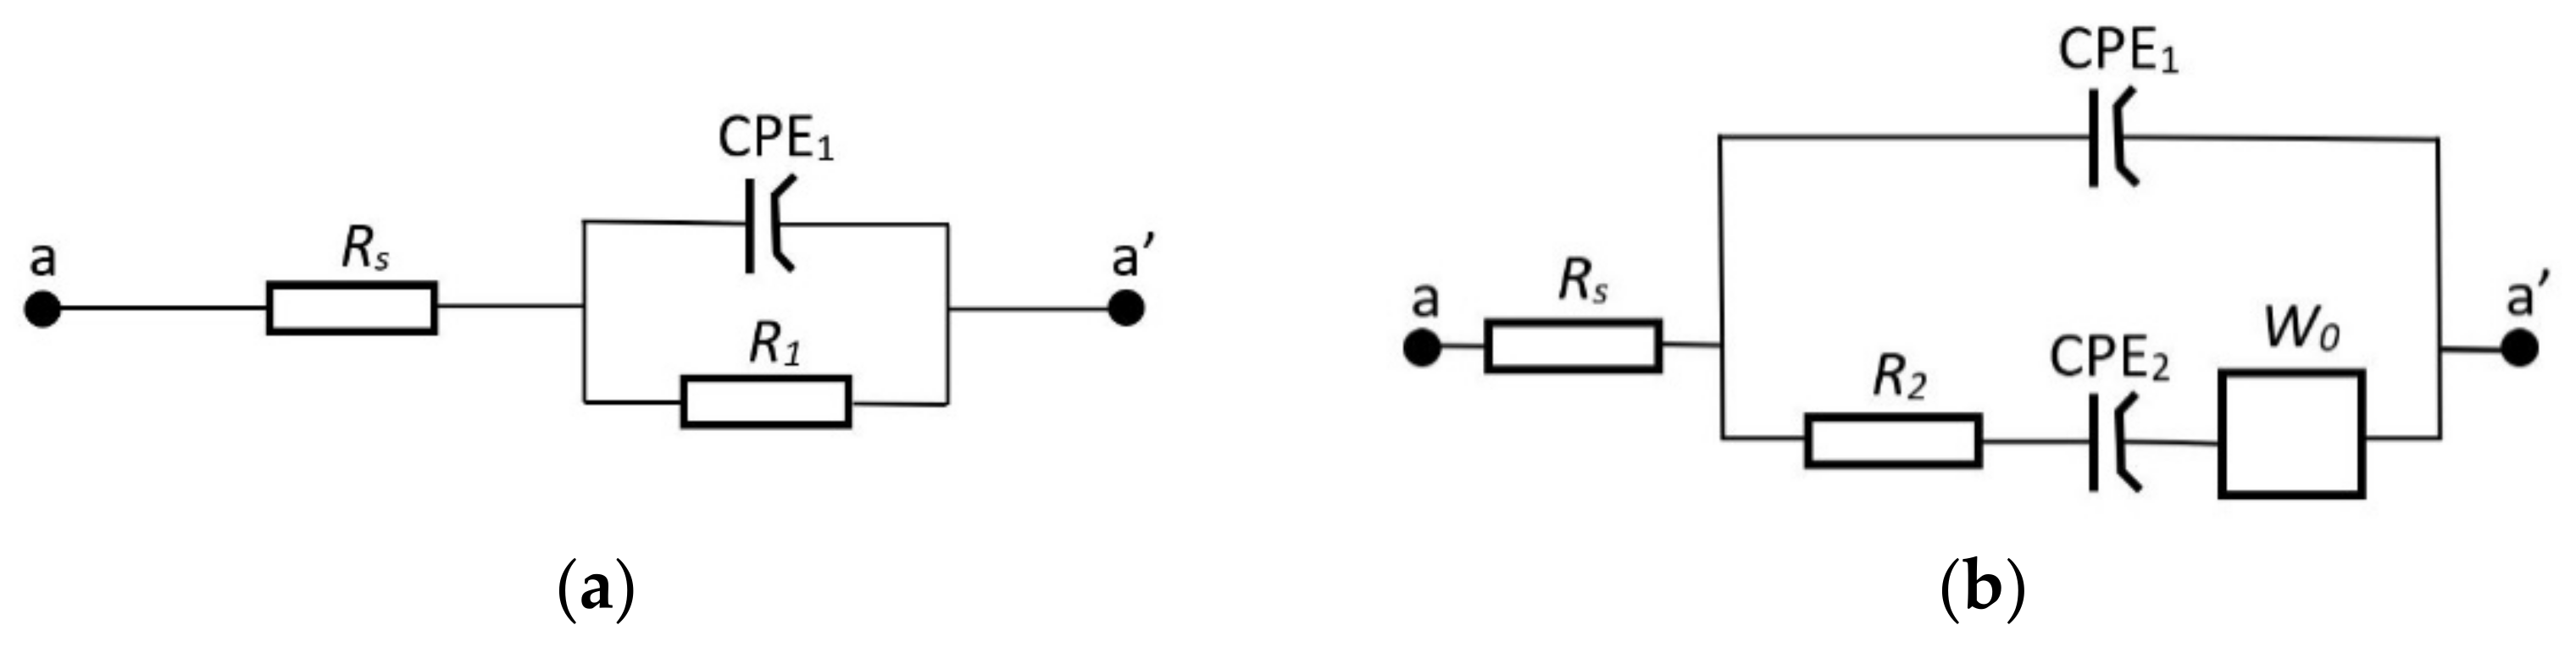
2.4. Electrochemical Corrosion Tests

Both potentiodynamic measurements and Electrochemical Impedance Spectroscopy EIS were performed after 1-h stabilization at open circuit potential (OCP) using Atlas 1131 Electrochemical Unit and Impedance Analyser (Atlas Sollich, Rębiechowo, Poland). In this research, a three-electrode 011951 plate material evaluating cell was used. The reference electrode was a Saturated Calomel Electrode (ESCE = 244 mV), Working Electrode were a test specimen of titanium and a Counter Electrode was a platinum wire. The tests were carried out in accordance with the standard PN-EN ISO 17475. A CNaCl = 3% solution was used in this experiment, and its temperature was controlled during the whole experiment and was 24 ± 2 °C (room temperature). During experiments, the electrochemical cell was filled with a volume of 1 mL. Seals made of rubber Viton® (FKM, ERIKS, Utrecht, The Netherlands), which distinguished enhanced chemical and thermal resistance, derived from the DuPont company were used. The electrochemical cell was placed in a Faraday cage in order to minimalize the electromagnetic interference.
The potentiodynamic measurements were performed starting from −0.8 V vs. OCP, and progressing in the anodic direction up to 0.8 V at a scan rate SR = 1 mV/s. The analysis of registered potentiodynamic curves was carried out using the AtlasLab® (Atlas Sollich, Rębiechowo, Poland) program dedicated to electrochemical studies, which use the Tafel interpolation method. The Tafel method consists of plotting linear sections on the anode and cathode curves parts (Figure 2).
Corrosion current density J and corrosion potential E can be determined from its intersection. Taking into account the slope of the curves, the polarization resistance Rp can be determined from the Stern-Geary equation:
Rp = (βa × βc)/(J × 2303 × (βa + βc)),
where: βa—anode curve slope, βc—cathode curve slope.
The EIS acquired in the frequency range of 10 mHz to 100 kHz with a 10 mV amplitude sine wave generated by a frequency response analyser.

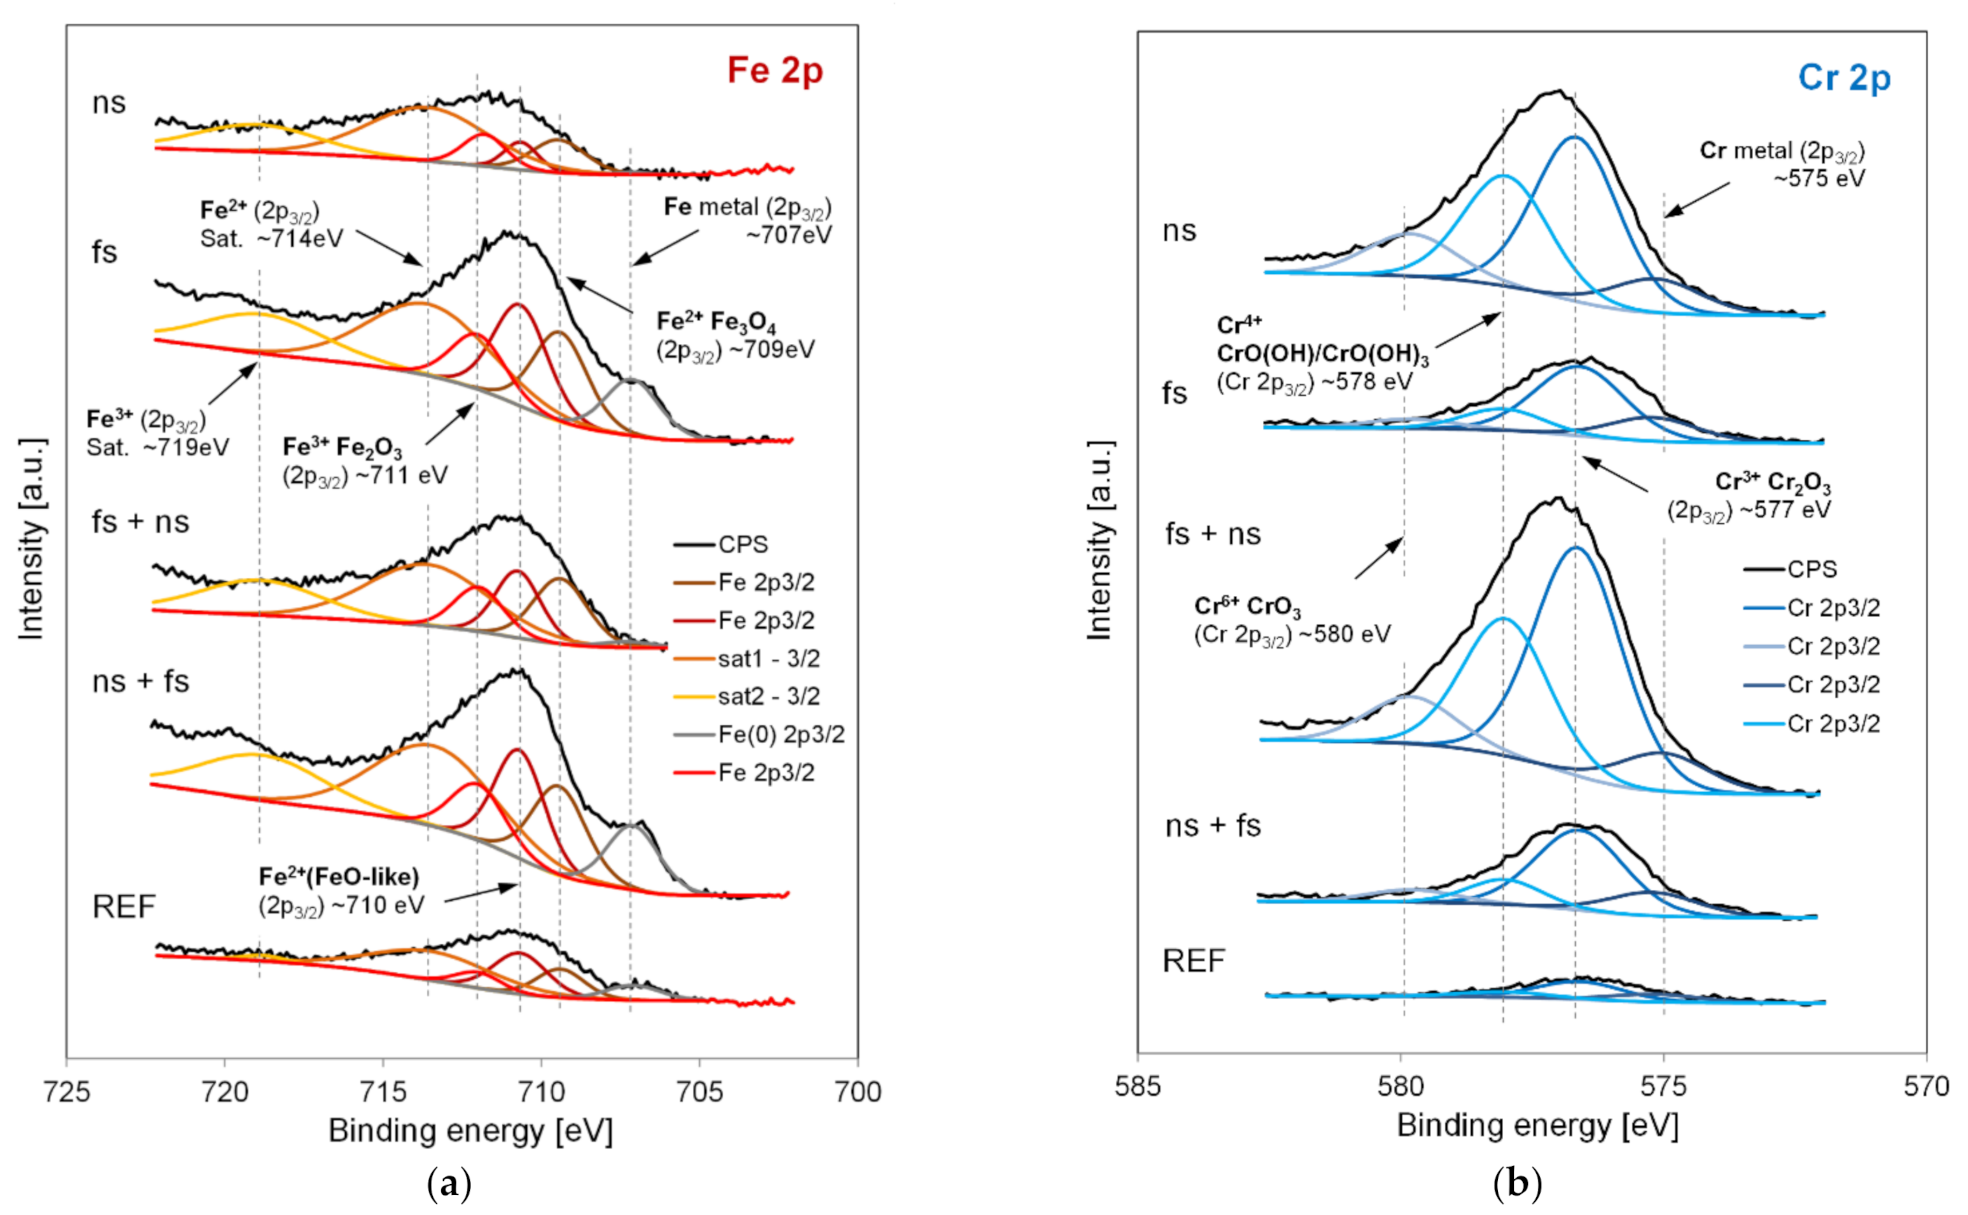
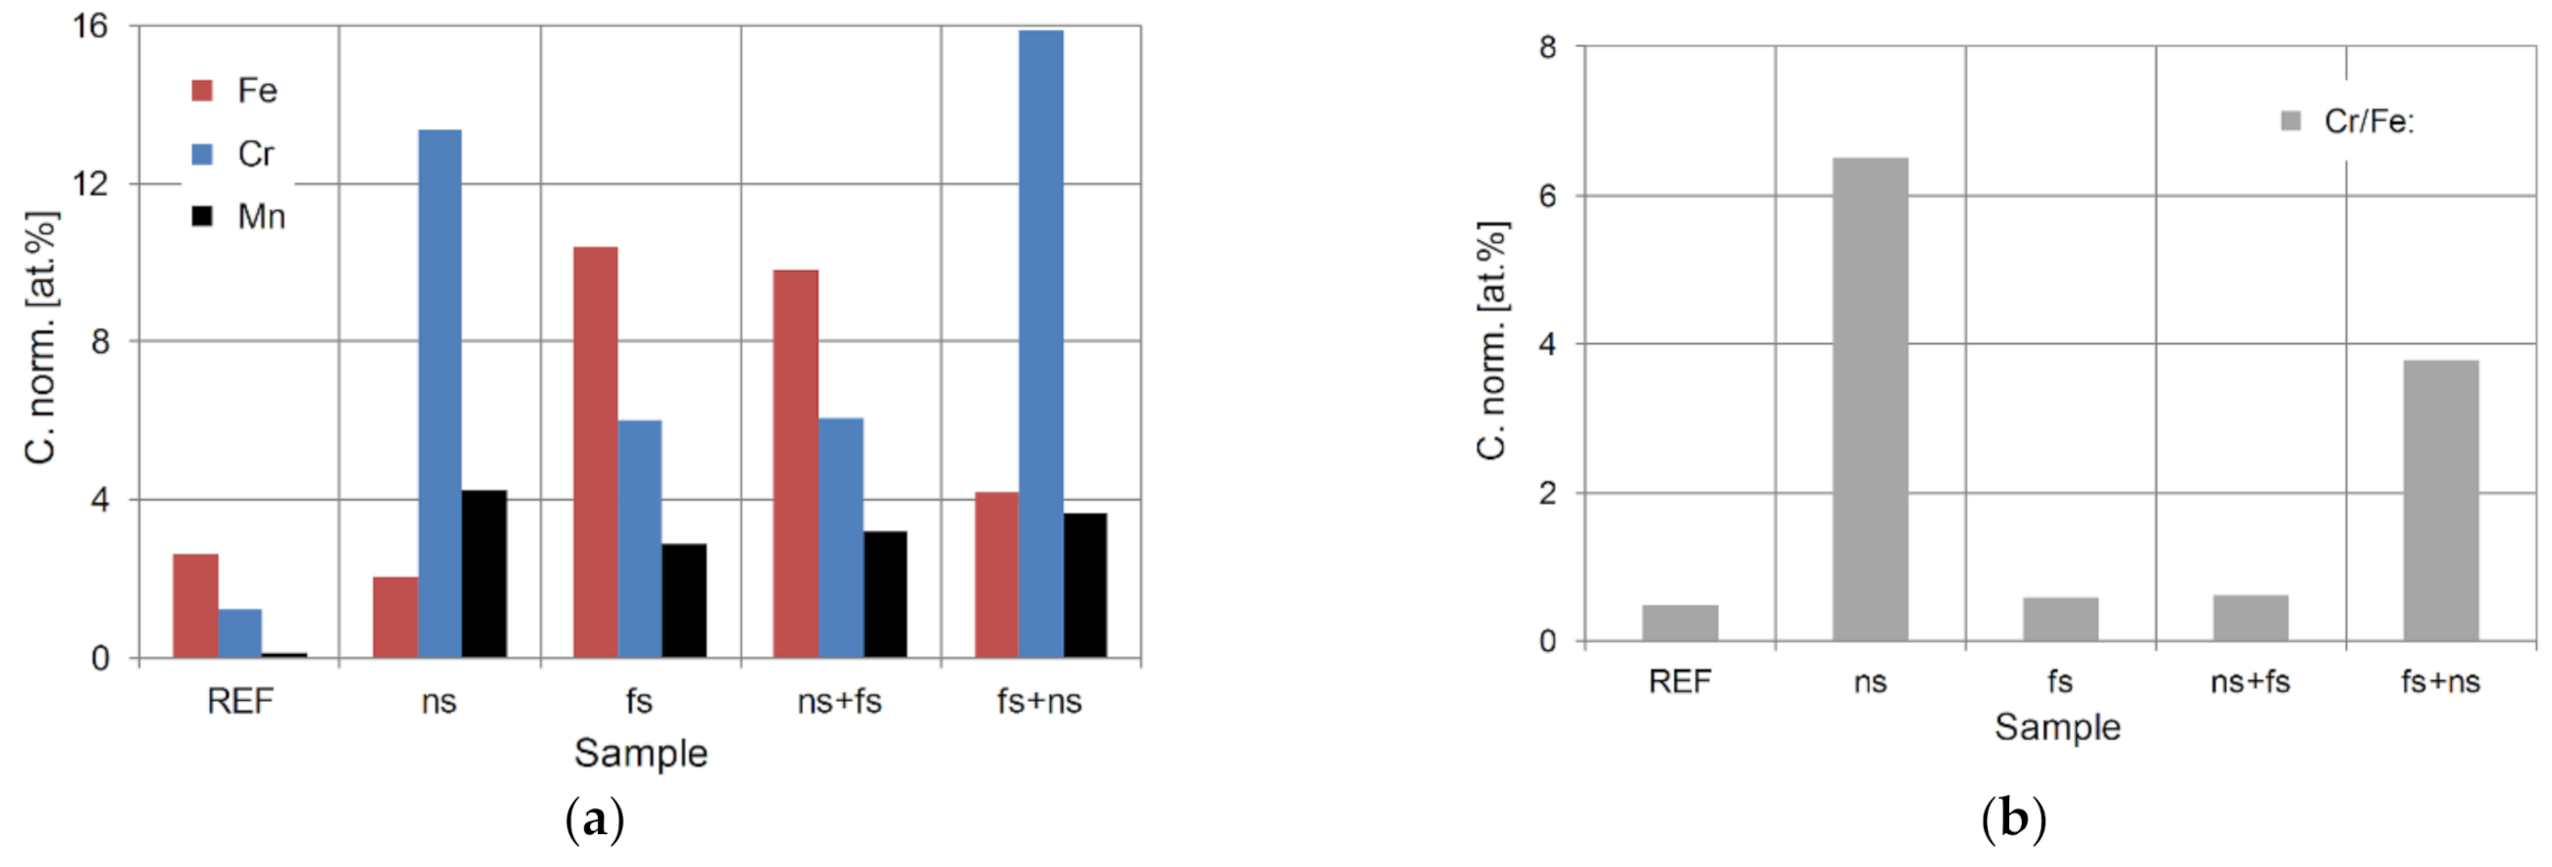
2.5. Chemical Analysis

X-ray photoelectron spectroscopic (XPS) chemical bonding analysis was conducted using hemispherical spectrophotometer VG Scienta R3000. Spectra were obtained under ultra-high vacuum, under pressure of ~2·105 Pa. The source of monochromatic light was the Al Kα X-ray tube (hν = 1486.6 eV), which was placed at an angle of 55°. As a reference for spectra calibration, the C1s peak position of carbon (284.6 eV) was used. The obtained experimental data were fitted to Gauss-Lorentz shapes using CasaXPS® software (version 2.3.16, Casa Software Ltd., Teignmouth, UK).

3. Results and Discussion

The microscopic images of the samples selected for the research, shown in Figure 3, present differences in surface morphology of AISI 304 stainless steel. Laser modification (using both nano- and femtosecond sources) contributed to the homogeneity of the sample surface, compared to the reference sample, on which the grains with different sizes are visible (Figure 3a). In the case when a nanosecond laser was used in the last irradiation process, in other words, the top layer was irradiated with a nanosecond laser (Figure 3b,e) as a result of gently remelting the surface with a laser beam, a thin, tight (no microcracks in the microscopic sense) oxide layer was formed on the surface. A different surface is observed when the last stage was irradiated with a laser with an ultra-short pulse duration (Figure 3c,d). On the surface of these samples, LIPSS were formed.
The surface of the material determines its properties as well as other corrosion rates. Therefore, roughness tests were conducted. The use of a nanosecond laser to modify the surface layer of AISI 304 steel resulted in a smoother surface compared to the reference sample (Figure 4). Smoothing the surface after nanosecond irradiation was also observed by Alwan et al. [12], Ruzankina et al. [13], and Krawczyk et al. [14]. The use of a femtosecond source did not significantly change the surface roughness despite the formation of LIPSS on the surface. A very slight increase in Ra and Rz was observed compared to the reference sample. Interestingly, despite the completely different microscopic images (Figure 3d,e), the roughness (both Ra and Rz) of the layers using both lasers (fs + ns and ns + fs) is comparable and noticeably smaller in relation to the reference.
The corrosion resistance of stainless steel after laser treatment depends on both morphology and physicochemical structure (mainly the concentration of chromium in the surface layer) [2,4,15,16]. This is a significant problem limiting the widespread use of this technology. To assess the corrosive behaviour of the material after laser modification, potentiodynamic and EIS tests were performed. Potentiodynamic curves were recorded after 1 day (24 h) of the sample’s immersion in a 3% sodium chloride (NaCl) solution (Figure 5). The tests showed a significant decrease in the corrosion current density J and an increase in the corrosion potential E for the sample irradiated using a nanosecond laser. A significant decrease in the corrosion current density in the NaCl solution was also noted as a result of remelting the surface layer with a ns fibre laser [2].
On the basis of registered potentiodynamic curves (Figure 5), using the Tafel interpolation method (Figure 2) [17,18], the value of polarization resistance Rp and corrosion current density J were determined for all tested samples (Figure 6). A significant (~4.5×) increase in polarization resistance, characterizing the corrosion resistance and the accompanying significant decrease (~5.3×) of the corrosion current density and process intensity, compared to the reference sample (REF) was noted for the sample irradiated using a nanosecond laser (ns). Similar results were obtained using fibre laser by Alwan et al. in a 13% HCl solution [12], Abbas in artificial salvia solution [19], Westin et al. in 1 M NaCl solution [20], and in our previous research in NaCl, H2SO4, and KCl solution [3,9,21]. A significant increase in corrosion resistance seems to be associated with surface homogeneity, a decrease in roughness after the laser process (Figure 4). The use of a femtosecond laser (fs and ns + fs) did not change the corrosion resistance of AISI 304 steel compared to the reference sample. A slight increase in corrosion resistance was observed for the case of irradiation with femto- and then nano-second laser (fs + ns). Similar to ‘ns’ sample, this may be due to the formation of a thin, tight and protective layer on the surface.
Bode impedance spectra [22] (Figure 7) confirm the results of potentiodynamic studies (Figure 4 and Figure 5). As expected, the ‘ns’ samples showed the highest corrosion resistance, as evidenced by both the highest impedance module |Z| and high phase angle value Φ, in particular at the low frequency range (<10 Hz), which indicate a typical passivated characteristic of the material [15,23,24,25]. In addition, the ‘fs + ns’ sample exerted higher corrosion resistance than the REF. The |Z| for all laser irradiated samples is significantly higher than REF in the whole frequency range. The impedance modules |Z| for all samples are linear over a wide frequency range and their slope is close to –1, which indicates a typical capacitive character of the analysed surfaces. In a wide range of medium frequency, the phase angle of all samples reaches a value close to 80°, which indicates that their surface is relatively homogeneous, stable (tight), and possesses that passive film is intact [26] and in line with the roughness tests (Figure 4). The lowest phase angle exerts the REF sample. Given that the shape of the phase angle Φ spectrum of the samples exposed by the ‘ns’ and ‘fs + ns’ lasers in the high frequency range significantly differs from the other samples, the electrical models describing the electrochemical behaviour of these samples must be different.
This is mainly evident from completely different mechanisms associated with nano- and femtosecond laser processing. Bode impedance spectra were adapted to electric models using the AtlasLab program, where Rs—electrolyte resistance, CPE1—Constant Phase Element describing the capacity of the electric double layer, R1—charge transfer resistance, CPE2—oxide layer capacity, R2—resistance of the passive oxide layer, Wo—Warburg impedance (Figure 8).
The results of matching electrical models (Figure 8) to impedance spectra (Figure 7) are summarized in Table 1. The charge transfer resistance R1 for all analyzed samples is very high (~MΩ), confirming good corrosion resistance of AISI 304 stainless steel. The capacitive behaviour of the layer is modelled by the Constant Phase Elements CPE. The use of a CPE contributes to better fitting results compared to a pure capacity due to inhomogeneities in the layer. The impedance of CPE is calculated by its two parameters: frequency independent admittance Y and parameter N, which gives information about the nature of the CPE:
ZCPE = 1/(Y(jω)N),
where: j—imaginary part, ω = 2πf—circular frequency.
The CPE results concern the good quality of the layers. The N1 and N2 parameters can have values from 0 to 1. N = 0 indicates a resistance and N = 1 indicates a pure capacity behaviour [27,28,29]. The obtained N1 and N2 values (close to 1) both represent a capacity behaviour and suggest a high tightness and homogeneity of the passive layer. The obtained impedance spectra for the REF, ‘fs’ and ‘ns + fs’ samples were fitted to the Randles substitute electric model [30,31] (Figure 8a). The nanosecond laser acts as a heat source, causing the surface to oxidize. The thin oxide layer formed on the surface of the sample is visible in the different shapes of impedance spectra. Due to this fact both ‘ns’ and ‘fs + ns’ samples were fitted to the different electrical model including this oxide layer. For both ‘ns’ and ‘fs + ns’ samples in the electric model, Warburg impedance [30,32] appears (Figure 8b). It is associated with the transport of the reacting substance (diffusion), as both oxidation and reduction processes occur [33,34]. It also appears to be a protective and passive oxide layer. Abbas [19] also observed an improvement in the corrosion resistance associated with the formation of a protective layer of chromium oxide on the surface, which reduces the corrosion rate and improves the pitting corrosion resistance.
In order to assess the elemental composition of tested samples, XPS was used. Photoemission spectra for two main elements in the form of Fe 2p and Cr 2p lines for all analysed cases are presented in Figure 9. It is worth explaining the low intensity of the Cr 2p and Fe 2p lines for a reference sample in relation to the cases exposed to laser radiation. This resulted in a significant amount of carbon deposits (mainly due to free hydrocarbons) on the surface of the unstructured sample, which masked the chemical structure of the analysed steel. This is particularly evident from the summary presented in Table 2. The image of the obtained spectra correlates quite well with the expectation. In general, two trends can be distinguished, and the final result is mainly determined by the process that was carried out as the second. Therefore, for processes ending with the femtosecond laser, both the nature of the spectra (Figure 9) and the proportions of individual elements (Table 2 and Figure 10a) are analogous to those in the reference sample. The difference is essentially due to partial ablation of the carbon contamination. The largest share of the pure metal lines (~575 eV for Cr and ~707 eV for Fe) are visible here in relation to the whole spectrum, compared to other samples. The share of Cr and Fe ions in the structure of the passivation layer is quite comparable (Cr/Fe ≈ 0.4–0.5). This state proves that the process of creating LIPSS structures with a femtosecond laser ablates at the same time the previously produced oxide layer (ns laser), thereby significantly cancelling the change in the chemical structure introduced by the thermal process.
The situation is quite different for the case where the final process is thermally oriented irradiation with a nanosecond laser. The oxide layer in this case consists mainly of chromium oxides. This is due to the stronger affinity of chromium to oxygen (thermodynamic preference, which is the highest negative free energy ΔG0 among the agents occurring in the substrate) [35,36]. What is also characteristic in this case is the maximum shift of the Cr 2p spectrum towards higher binding energies, i.e., higher levels of chromium oxidation (Cr2+ ~577 eV → Cr4+ ~578 eV and Cr6+ ~580 eV). There is no such shift for the iron Fe 2p lines. This is due to the low energy density of the nanosecond laser radiation, selected so (as part of previous research) to improve the corrosion resistance of AISI 304 steel [9].
Although it might seem that the earlier structuring of steel with a femtosecond laser promotes the extraction of more chromium ions to the surface, which could positively contribute to the improvement of corrosion resistance compared to the sample exposed only by the nanosecond laser, however, a deeper analysis shows that this case also favours a higher content of iron ions on the surface.
Ultimately, the Cr/Fe ratio is slightly less favourable here compared to the case of nanosecond laser only, as shown in Figure 10b.

4. Conclusions

The paper presents an analysis of the impact of irradiation of stainless steel with laser sources of different pulse durations on the chemical composition of the surface and its corrosion resistance. The study was conducted with nanosecond and femtosecond radiation. By modifying the surface of stainless steel alternately with a nano and femtosecond laser, it has been observed that the final result is determined by the process that was carried out as the second.
It was found that the highest corrosion resistance can be obtained by producing the oxide layer on the surface of AISI 304 steel only with a ns-laser, and this is mainly due to the most favourable Cr/Fe ratio, which is Cns = 6.5. In this case, the polarization resistance Rp_ns is ~4.5 times higher and corrosion current density, indicating the intensity of the corrosion Jns ~ 5.3 times smaller in comparison to the reference sample. The formation of an oxide layer after an earlier surface development with a fs-laser (fs + ns) did not bring such a good result. Despite the higher concentration of chromium on the surface compared to irradiation with nanosecond laser only (Crfs+ns = 15.9%, Crns = 13.4%), the ratio of Cr/Fe (Cfs+ns = 3.8, Cns = 6.5) was lower. It is in line with potentiodynamic tests (Rp_fs+ns is ~ 2 times higher and corrosion current density Jfs+ns ~ 1.6 times smaller in comparison to the reference sample). The most surprising case is the case of structuring with a fs-laser after having previously formed the oxide layer. Although this sample was less rough and its chemical composition in terms of the proportion of the main elements (except for the carbon deposit) was comparable to the REF sample, in the end, the corrosion resistance was worse than for the REF sample (Rp_ns+fs = 0.8 times smaller and corrosion current density Jns+fs ≈ 1.2 times higher). The last of the analysed cases, structuring only with a fs-laser, despite a significant surface development (LIPSS) with the accuracy to measurement errors does not affect the corrosion resistance of the steel under consideration. While this result is neutral, given the additional micro- structuring, it should be interpreted as a positive finding.

Author Contributions

Conceptualization, K.M.M., P.D., A.B. and A.J.A.; methodology, K.M.M., P.D., A.B. and A.J.A.; formal analysis, K.M.M. and A.J.A.; investigation, K.M.M. and A.J.A.; resources, K.M.M., P.D. and A.B.; data curation, K.M.M. and P.D.; writing—original draft preparation, K.M.M. and P.D.; writing—review and editing, K.M. and A.A.; visualization, K.M.M., P.D. and A.J.A.; supervision, A.J.A. All authors have read and agreed to the published version of the manuscript.

Funding

The work was funded by the Polish National Agency for Academic Exchange NAWA (PPI/APM/2018/1/00031/U/001).

Institutional Review Board Statement

Not applicable.

Informed Consent Statement

Not applicable.

Data Availability Statement

Data is contained within the article.

Conflicts of Interest

The authors declare no conflict of interest.

References

  1. Veiko, V.; Odintsova, G.; Ageev, E.; Karlagina, Y.; Loginov, A.; Skuratova, A.; Gorbunova, E. Controlled oxide films formation by nanosecond laser pulses for color marking. Opt. Express 2014, 22, 24342. [Google Scholar] [CrossRef]
  2. Pacquentin, W.; Caron, N.; Oltra, R. Nanosecond laser surface modification of AISI 304L stainless steel: Influence the beam overlap on pitting corrosion resistance. Appl. Surf. Sci. 2014, 288, 34–39. [Google Scholar] [CrossRef]
  3. Łȩcka, K.M.; Antończak, A.J.; Kowalewski, P.; Trzcinski, M. Wear resistance of laser-induced annealing of AISI 316 (EN 1.4401) stainless steel. Laser Phys. 2018, 28, 096005. [Google Scholar] [CrossRef]
  4. Khalfallah, I.Y.; Rahoma, M.N.; Abboud, J.H.; Benyounis, K.Y. Microstructure and corrosion behavior of austenitic stainless steel treated with laser. Opt. Laser Technol. 2011, 43, 806–813. [Google Scholar] [CrossRef]
  5. Bonse, J.; Hohm, S.; Kirner, S.V.; Rosenfeld, A.; Kruger, J. Laser-induced periodic surface structures—A scientific evergreen. IEEE J. Sel. Top. Quantum Electron. 2017, 23, 9000615. [Google Scholar] [CrossRef]
  6. Valette, S.; Steyer, P.; Richard, L.; Forest, B.; Donnet, C.; Audouard, E. Influence of femtosecond laser marking on the corrosion resistance of stainless steels. Appl. Surf. Sci. 2006, 252, 4696–4701. [Google Scholar] [CrossRef]
  7. Bonse, J.; Koter, R.; Hartelt, M.; Spaltmann, D.; Pantzien, S.; Hohm, S.; Rosenfeld, A.; Kruger, J. Femtosecond laser-induced periodic surface structures on steel and titanium alloy for tribological applications. Appl. Phys. A Mater. Sci. Process. 2014, 117, 103–110. [Google Scholar] [CrossRef]
  8. Dzienny, P.; Stępak, B.; Budnicki, A.; Antończak, A.J. The influence of laser pulse duration on periodic surface structures on stainless steel. J. Laser Micro. Nanoeng. 2020, 15, 4–7. [Google Scholar]
  9. Łęcka, K.M.; Antończak, A.J.; Szubzda, B.; Wójcik, M.R.; Stępak, B.D.; Szymczyk, P.; Trzcinski, M.; Ozimek, M.; Abramski, K.M. Effects of laser-induced oxidation on the corrosion resistance of AISI 304 stainless steel. J. Laser Appl. 2016, 28, 032009. [Google Scholar] [CrossRef]
  10. Antończak, A.J.; Kocoń, D.; Nowak, M.; Kozioł, P.; Abramski, K.M. Laser-induced colour marking—Sensitivity scaling for a stainless steel. Appl. Surf. Sci. 2013, 264, 229–236. [Google Scholar] [CrossRef]
  11. Rawlins, J.W.; James, W.; Storey, R.F. The waterborne symposium. In Proceedings of the Thirty-Ninth Annual International Waterborne, High-Solids, and Powder Coatings Symposium, New Orleans, LA, USA, 13–17 February 2021; Volume 39. [Google Scholar]
  12. Alwan, A.S.; Khalid, E.A.; Jaddoa, A.A. Improvement the corrosion behavior and wear characteristics of AISI 304 stainless steel by using Nd:YAG laser surface treatment. J. Mech. Eng. Res. Dev. 2020, 43, 50–59. [Google Scholar]
  13. Ruzankina, J.S.; Vasiliev, O.S. Study on possibility for the improvement of corrosion resistance of metals using laser-formed oxide surface structure. J. Phys. Conf. Ser. 2016, 735, 012050. [Google Scholar] [CrossRef] [Green Version]
  14. Krawczyk, B.; Heine, B.; Engelberg, D.L. Performance optimization of cold rolled Type 316L stainless steel by sand blasting and surface linishing treatment. J. Mater. Eng. Perform. 2016, 25, 884–893. [Google Scholar] [CrossRef]
  15. Pieretti, E.F.; Pessine, E.J.; Correa, O.V.; de Rossi, W.; das Neves, M.D.M. Effect of laser parameters on the corrosion resistance of the ASTM F139 stainless steel. Int. J. Electrochem. Sci. 2015, 10, 1221–1232. [Google Scholar]
  16. Conde, A.; García, I.; de Damborenea, J.J. Pitting corrosion of 304 stainless steel after laser surface melting in argon and nitrogen atmospheres. Corros. Sci. 2001, 43, 817–828. [Google Scholar] [CrossRef]
  17. Tafel, J.; Naumann, K. Beziehungen zwischen Kathodenpotential und elektrolytischer Reduktionswirkung. Z. Phys. Chem. 1905, 50, 713–752. [Google Scholar] [CrossRef]
  18. Tafel, J. Über die Polarisation bei kathodischer Wasserstoffentwicklung. Z. Phys. Chem. 1905, 50, 641–712. [Google Scholar] [CrossRef]
  19. Abbass, M.K. Effect of Nd-YAG laser treatment on corrosion behavior of AISI316L stainless steel in artificial saliva solution. IOP Conf. Ser. Mater. Sci. Eng. 2019, 518, 032006. [Google Scholar] [CrossRef]
  20. Westin, E.M.; Laakso, P.; Oliver, J.; Penttilä, R. Effect of laser color marking on the corrosion performance of stainless steel. Icaleo 2009, M1009, 1245–1250. [Google Scholar]
  21. Szubzda, B.; Antończak, A.; Kozioł, P.; Łazarek, Ł.; Stępak, B.; Łęcka, K.; Szmaja, A.; Ozimek, M. Corrosion resistance of the AISI 304, 316 and 321 stainless steel surfaces modified by laser. IOP Conf. Ser. Mater. Sci. Eng. 2016, 113, 012017. [Google Scholar] [CrossRef] [Green Version]
  22. Huang, J.; Li, Z.; Liaw, B.Y.; Zhang, J. Graphical analysis of electrochemical impedance spectroscopy data in Bode and Nyquist representations. J. Power Sources 2016, 309, 82–98. [Google Scholar] [CrossRef]
  23. Lv, J.; Luo, H. Comparison of corrosion behavior between coarse grained and nano/ultrafine grained 304 stainless steel by EWF, XPS and EIS. J. Nucl. Mater. 2014, 452, 469–473. [Google Scholar] [CrossRef]
  24. Pieretti, E.F.; Costa, I. Surface characterisation of ASTM F139 stainless steel marked by laser and mechanical techniques. Electrochim. Acta 2012, 114, 838–843. [Google Scholar] [CrossRef]
  25. Jinlong, L.; Tongxiang, L.; Chen, W. Surface enriched molybdenum enhancing the corrosion resistance of 316L stainless steel. Mater. Lett. 2016, 171, 38–41. [Google Scholar] [CrossRef]
  26. Trethewey, K.R.; Paton, M. Electrochemical impedance behaviour of type 304L stainless steel under tensile loading. Mater. Lett. 2004, 58, 3381–3384. [Google Scholar] [CrossRef]
  27. Bret, C. Electrochemistry-Principles, Methods and Applications; Oxford University Press: Oxford, UK, 1993. [Google Scholar]
  28. Gabrielli, C. Identification of Electrochemical Processes by Frequency Response; Schlumberger Instruments: Farnborough, UK, 1984; p. 15. [Google Scholar]
  29. Bösing, I.; Cramer, L.; Steinbacher, M.; Zoch, H.W.; Thöming, J.; Baune, M. Influence of heat treatment on the microstructure and corrosion resistance of martensitic stainless steel. AIP Adv. 2019, 9, 065317. [Google Scholar] [CrossRef] [Green Version]
  30. Ribeiro, D.V.; Abrantes, J.C.C. Application of electrochemical impedance spectroscopy (EIS) to monitor the corrosion of reinforced concrete: A new approach. Constr. Build. Mater. 2016, 111, 98–104. [Google Scholar] [CrossRef]
  31. Jafari, H.; Idris, M.H.; Ourdjini, A.; Rahimi, H.; Ghobadian, B. EIS study of corrosion behavior of metallic materials in ethanol blended gasoline containing water as a contaminant. Fuel 2011, 90, 1181–1187. [Google Scholar] [CrossRef]
  32. Skale, S.; Doleček, V.; Slemnik, M. Substitution of the constant phase element by Warburg impedance for protective coatings. Corros. Sci. 2007, 49, 1045–1055. [Google Scholar] [CrossRef]
  33. Verdian, M.M.; Raeissi, K.; Salehi, M. Electrochemical impedance spectroscopy of HVOF-sprayed NiTi intermetallic coatings deposited on AISI 1045 steel. J. Alloys Compd. 2010, 507, 42–46. [Google Scholar] [CrossRef]
  34. Li, R.; Li, Z.; Zhu, Y.; Qi, K. Structure and corrosion resistance properties of Ni-Fe-B-Si-Nb amorphous composite coatings fabricated by laser processing. J. Alloys Compd. 2013, 580, 327–331. [Google Scholar] [CrossRef]
  35. Li, Z.L.; Zheng, H.Y.; Teh, K.M.; Liu, Y.C.; Lim, G.C.; Seng, H.L.; Yakovlev, N.L. Analysis of oxide formation induced by UV laser coloration of stainless steel. Appl. Surf. Sci. 2009, 256, 1582–1588. [Google Scholar] [CrossRef]
  36. Allen, G.C.; Dyke, J.M.; Harris, S.J.; Morris, A. A surface study of the oxidation of type 304L stainless steel at 600 K in air. Oxid. Met. 1988, 29, 391–408. [Google Scholar] [CrossRef]
Figure 1. AISI 304 stainless steel samples selected for the experiment.
Coatings 11 00592 g001
Figure 2. A graphical example of determining the tafel curves.
Coatings 11 00592 g002
Figure 3. Microscopic images of the samples surface of AISI 304 stainless steel: (a) REF, and after laser irradiation using nano- and femtosecond pulse duration lasers: (b) ns, (c) fs, (d) ns + fs, (e) fs + ns.
Coatings 11 00592 g003
Figure 4. The surface roughness Ra and Rz.
Coatings 11 00592 g004
Figure 5. Potentiodynamic curves of AISI 304 stainless steel under open circuit potential condition for the reference and laser irradiated samples, registered after 1 day in 3% NaCl solution.
Coatings 11 00592 g005
Figure 6. Electrochemical measurements of AISI 304 stainless steel in 3% NaCl solution under open circuit potential condition for the reference and laser irradiated samples, after 1 day: (a) polarization resistance, (b) corrosion current density.
Coatings 11 00592 g006
Figure 7. Bode plots of AISI 304 stainless steel for the reference and laser irradiated samples after: 1 day immersion in 3% NaCl solution.
Coatings 11 00592 g007
Figure 8. Electric models, where: Rs—electrolyte resistance, CPE1—capacity of the electric double layer, R1—charge transfer resistance, CPE2—oxide layer capacity, R2—resistance of the passive oxide layer, Wo—Warburg impedance: (a) “1”—single-layer, (b) “2”—double-layer with Warburg impedance.
Coatings 11 00592 g008
Figure 9. The change in the XPS photoemission spectra lines of the: (a) Fe 2p, (b) Cr 2p; where: CPS—Counts Per Second and sat—satellite peaks.
Coatings 11 00592 g009
Figure 10. Atomic concentration of: (a) Fe, Cr, and Mn, (b) the Cr/Fe ratio.
Coatings 11 00592 g010
Table 1. The results of matching electrical models to impedance spectra.
SampleModelRs (Ω∙cm2)Y1 (μS/cm2)N1R1 (MΩ∙cm2)Y2 (μS/cm2)N2R2 (Ω∙cm2)Wo (kS/cm2)
REF10.470.970.8524.5----
ns20.541.500.90-1.480.9225.30.883
fs10.150.170.9317.3----
ns + fs11.270.090.915.19----
fs + ns20.250.160.74-0.150.920.0032.61
Table 2. Atomic concentration of main elements on the surface of analysed samples (up to 10 nm depth).
Sample% Fe% Mn% Cr% Si% C% O
REF2.600.101.230.0064.7331.34
ns2.054.2513.357.8612.5759.92
fs10.372.865.991.4127.7651.61
fs + ns4.213.6815.885.0311.9659.24
ns + fs9.823.176.061.5225.5853.85
Publisher’s Note: MDPI stays neutral with regard to jurisdictional claims in published maps and institutional affiliations.

