Article

Surface and Interface Investigation of a 15th Century Wall Painting Using Multispectral Imaging and Pulse-Compression Infrared Thermography

1
Department of Informatics, Modeling, Electronics and Systems Engineering, University of Calabria, 87036 Rende, Italy
2
Department of Engineering, Polo Scientifico Didattico di Terni, University of Perugia, 05100 Terni, Italy
3
Department of Industrial and Information Engineering and Economics, University of L’Aquila, 67100 L’Aquila, Italy
4
Department of Economics, Engineering, Society and Business Organization (DEIM), University of Tuscia, 01100 Viterbo, Italy
*
Author to whom correspondence should be addressed.
Coatings 2021, 11(5), 546; https://doi.org/10.3390/coatings11050546
Submission received: 30 March 2021 / Revised: 23 April 2021 / Accepted: 4 May 2021 / Published: 6 May 2021
(This article belongs to the Special Issue Surface and Interface Analysis of Cultural Heritage)

Abstract

:
Before starting the restoration of an artwork, good practice involves the evaluation of the item healthiness possibly carried out through non-invasive techniques. In the specific case of painting inspection, hyper- and multi- spectral techniques are commonly used to analyze the outer layers (varnish, pictorial, and drawing), while X-ray, tomography, and many others can be employed to investigate its inner structure. Although highly desirable, a single technique providing all the information about a painting is still not available. Thus, it is of great interest to define the analysis’ protocols that could optimally exploit the complementarities of a minimal set of techniques. To this aim, the present paper shows the combined use of the hypercolorimetric multispectral imaging and pulse-compression thermography on a 15th century wall painting attributed to the Italian artist Antonio del Massaro, also known as Pastura, representing the Madonna with the Child and the Saints Jerome and Francis. The capabilities and the complementarities of the two techniques, whose information can also be fused through post-processing, are illustrated in detail in this paper. In addition, a false-colour imaging approach is proposed to improve the readability and analysis of the thermography results.

1. Introduction

Nowadays, diagnostics play a key role both to develop and implement restoration, conservation, and preservation plans for cultural heritage (CH) items [1,2]. In fact, the knowledge of the original and restoration materials, manufacturing techniques, and stratigraphy of the artwork is requested by conservators to define any potential interventions. Among numerous diagnostics tools, imaging techniques have become widely applied in CH—their use provides information about the materials and the structure of the artworks in a non-invasive and non-destructive way, thus helping the conservators choose the most appropriate intervention decision during a restoration work. A plethora of imaging techniques have been developed and employed for inspecting a number of CH items. Although a comprehensive review is out of the scope of this work, Table 1 shows details of references [3,4,5,6,7,8,9,10,11,12,13,14,15,16,17,18,19,20], highlighting the different nature of the inspected items and the main findings, with a close look on the combination of techniques and tools used.
Table 1 shows that the use of a range of imaging techniques and tools can provide an in-depth knowledge of different CH items in a reliable way without the need for sampling micro-chips of materials for laboratory analysis, a fact that is in general highly desirable or even mandatory in some cases [4,6,9,10,12,13,14,15,16,17,18,19,20].
Moreover, references in Table 1 show that thorough diagnostic approaches rely on (i) the integration of data collected from different imaging techniques, (ii) the exploitation of their complementarities in terms of spectral range and/or physical principles, and (iii) the potential combination of the relative outputs via digital imaging processing tools. It is important to note that data integration and fusion can strongly support traditional analytical methods, giving a comprehensive diagnosis of the painting state of conservation and reducing any ambiguities resulting from the use of a single diagnostic method, for example, see [10,16,18,20,21].
Hyperspectral (HS), multispectral (MS), and any other spectral-based imaging techniques are widely adopted for studying the outer layers of a painting such as the varnish, the pictorial stratum, and the underdrawings. Thus, starting from ultraviolet (UV), passing by visible (VIS), and reaching infrared (IR), the outer layers of a painting can be inspected, for example, see [10]. In particular, UV reflectance and fluorescence are employed for evaluating the condition of the varnish layer, for identifying possible retouching and over-paintings; fluorescence can also aid in the characterization of the materials (varnish, pigments, and binders). The analysis of the reflected light in the VIS range, especially using raking light, highlights the artist’s technique (brushstrokes, impastos), the presence of flaking paint or cracks, and it can also show areas requiring special care for being faithfully preserved [16]. Finally, images in the near IR range are used for the analysis of the inner layers—near IR light can penetrate the pictorial layer and make underdrawings and possible pentimenti visible due to the high reflectance of carbon-based materials, for example, see [21]. Note that the transparency of the outer layers to the near IR lights can vary much, thus making the imaging of the underdrawings’ layer challenging.
IR radiation can be also exploited for painting analysis by HS imaging techniques, which use the retrieved pixelwise spectral information to classify the pigments and map them over the inspected painting surface. HS cameras split the range of sensitivity of the sensors in hundreds of bins for an accurate reconstruction of the reflected IR spectrum. In painting inspections, near- (900–1700 nm) or short-wave (1000–2500 nm) IR HS camera is mainly used—many of the overtones and the combination of vibrational bands of inorganic pigments used in historical paintings fall in these ranges. It should be noted that the application of HS imaging in the middle-wave (3000–5000 nm) IR has also been recently reported to classify organic compounds [22]. However, HS cameras need a scanning stage for imaging—the spectral scanning is usually realized by combining a standard IR camera with a monochromator or with a diffraction grating. These facts hamper the use of HS imaging for in situ artworks inspection. Further, as mentioned above, HS imaging should be anyway combined with UV and VIS imaging methods for a complete analysis of the pictorial set. As a consequence, the possible engineering of a single technique capable of providing information within the mentioned electromagnetic spectra is highly desirable and would be of great value from a practical point of view.
In this framework, Hypercolorimetric Multispectral Imaging (HMI) processes information from the near UV to the near IR, thus covering the spectral range of interest for inspecting the whole pictorial set. The here-employed system relies on a 36 megapixels reflex Nikon digital camera (Nikon, Tokyo, Japan), modified to work in the 300–1000 nm extended range and combined with suitable flash lamps and optical filters. The images obtained are then represented into a seven bands hyper-colorimetric space, as described in detail in [23,24]. Such coordinate system extends the concept of the common 3D colour space used in colorimetry, i.e., the CIE XYZ standard or the more common RGB, by defining seven hyper-colorimetric coordinates in which one coordinate is related to the near UV range and three to the near IR range. By combining artificial intelligence techniques with a proper calibration procedure, it is possible to fully exploit this augmented colour space so as to perform all the above-mentioned analyses using a single instrument [23,24,25].
Regarding the evaluation of the whole painting stratigraphy, i.e., from the varnish to the support (panel, canvas, wall, etc.), the number of possible techniques is even larger: X-ray imaging is commonly employed, 2D and 3D XRF imaging are often used for identifying materials’ chemical composition. In addition, medical computer tomography techniques, terahertz time resolved (TTR) imaging, optical coherence tomography (OCT), and nuclear magnetic resonance (NMR ) have recently broaden the range of available methods [26,27,28].
In this framework, infrared thermography (IRT) represents a robust technique for the inspection of CH items [29,30]. Moreover, in this case, a trade-off between the information amount, cost, and measurement complexity (measurement time, mechanical equipment, computational costs, etc.) should be found. IRT is relatively easy to be performed in situ, providing imaging without the need for reconstruction algorithms and it can operate over large areas. Unlike TTR, XRF, OCT, and NMR, IRT does not require a continuous translation stage and it does not involve any hazardous source. The costs are not as low as the typical equipment for IR reflectometry, but are among the cheapest ones within the above-mentioned techniques. On the other hand, IRT does not reach the depth resolution of other techniques such as TTR and OCT, but it can inspect the support up to depths of several millimeters or even few centimeters in the case of wall paintings if a suitable excitation scheme is used. In addition, recent developments in the IRT technique have increased its effectiveness for artworks inspection and reduced the risk of any alteration of the artworks due to the thermal stimulus power [31,32]. In particular, the use of the so-called pulse-compression thermography (PuCT) procedure combined with a pseudo-noise modulated heating stimuli has been demonstrated to be effective even with a very small increment of the sample surface’s temperature (~1 °C) [33,34].
For the mentioned reasons, the combined use of PuCT and HMI is very promising for in situ inspections of paintings—the tailored hardware and the advanced processing and postprocessing algorithms provide complimentary information to art historians and restorers, and their contextual use allows for investigating the paintings’ stratigraphy from the varnish to the support. In addition, the output of the two methods can be fused by image processing tools and post-processing algorithms. The first example of the combined application of PuCT and HMI was recently reported in the literature—the two techniques were used together for inspecting two historical panel paintings of the renaissance period, realized by Andrea Mantegna and from the Michelangelo’s workshop [35].
In the present work, HMI and PuCT are applied together for the first time on a detached wall painting, which is currently undergoing restoration in the laboratories of the 5-year course in Conservation and Restoration of Cultural Heritage of University of Tuscia, Viterbo, Italy [36]. A thorough description of the inspected artwork is reported in Section 2.
The combined use of these techniques is shown here to enable obtaining information about the painting materials and the stratigraphic sequence, the last one being a highly-inhomogeneous mix of both original layers and new grounds.
HMI’s results, addressed to map the blue/green background composition, have been corroborated by traditional X-ray fluorescence spectroscopy performed through a portable instrument. For clarity, Figure 1 shows a schematic of the here-employed techniques and related outputs, together with details of the followed approaches, i.e., “comparison and integration” and “cross-checking and validation”.
The achieved results are illustrated in the following sections, demonstrating the high potential of this integrated approach to become a standard methodology in the preliminary study of artworks.

2. Materials and Methods

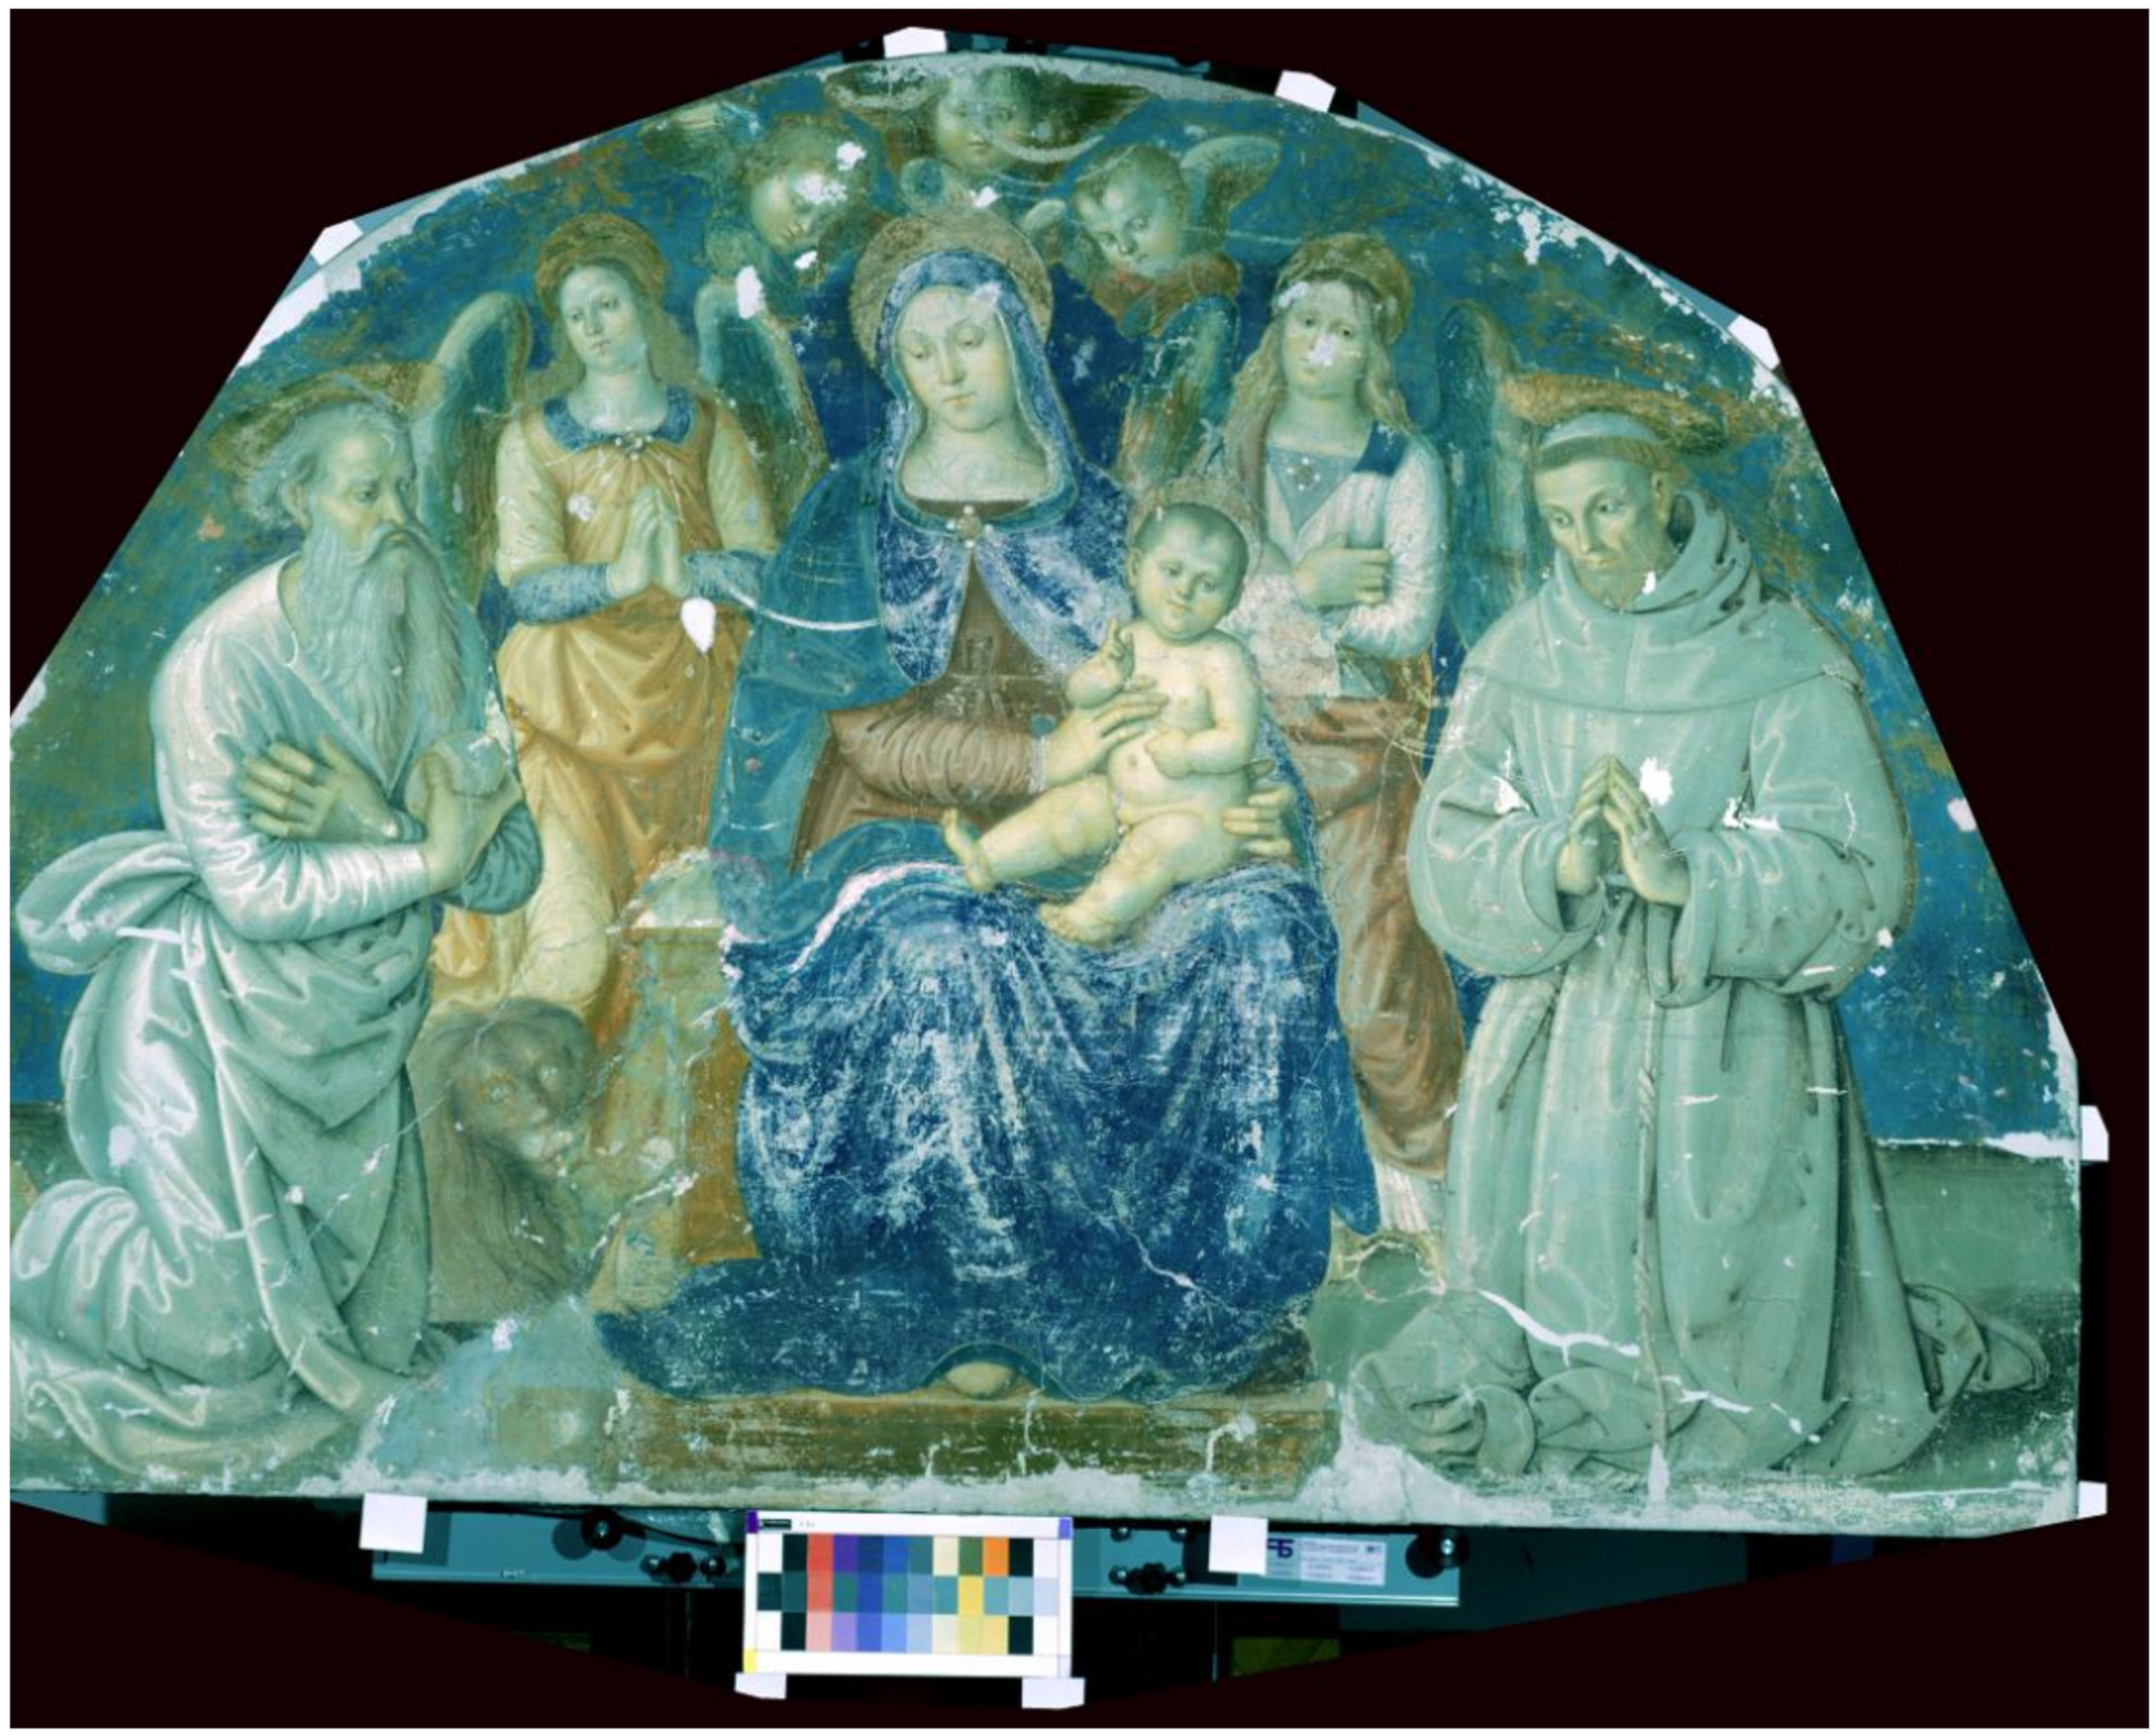
2.1. Inspected Artwork: Wall Painting from Antonio del Massaro, known as Pastura

The inspected wall painting, specifically a lunette (136 cm × 200 cm), depicts a Madonna and Child enthroned in between the angels and the Saints Jerome and Francis, see Figure 2. The painting has been dated back to 1490 and it is attributed to the artist Antonio del Massaro, known as Pastura (1450–1519). The painting was originally located in the convent of Santa Maria del Paradiso in Viterbo, central Italy [37,38]. After the detachment occurred in 1912, the painting was transferred to the Civic Museum of Viterbo. The detachment of the lunette was likely to be due to the bad state of conservation—a consequence of the exposure to weathering and acts of vandalism [39]. In fact, large grouts are visible in photographs from the beginning of the 20th century, confirming the bad state of conservation and the need for interventions [36]. However, the performed restoration interventions were made with both unsuitable materials and techniques such as the mimetic reintegration, hampering in turn the correct readability of the artwork. In accordance with the Superintendence responsible for the Civic Museum, it has been thus decided to perform a restoration aimed at recovering the original appearance of the painting. As a result, in 2016 the lunette has been brought to the restoration laboratories of University of Tuscia for starting the intervention.
The restoration work has been initially supported by traditional ultraviolet fluorescence (UVF) photography aimed at mapping any superimposed materials, grouts, lacunae, and non-original areas [40,41]. This preliminary analysis has been fundamental both to address the first cleaning choices of restorers and to start the intervention. The image under UV radiation showed diffuse blue fluorescence, which is thought to be due to the presence of glue used for the detachment of the lunette [40]. Grouts and cracks have been also well-highlighted by the UV image [36]. Fourier transform infrared (FTIR) analysis has been performed to characterize the blue fluorescent material visible under UV radiation. This revealed and confirmed that the yellowed surface material is made of protein glue. The main signatures of glue have been observed in the infrared spectrum at 3289, 3064, 2930, 1660, 1542, 1373, 1313, 1246, and 1033 cm−1 [42,43]. Other bands in the spectrum have been associated to calcium carbonate (1424 and 876 cm−1) and gypsum (1152 cm−1) [36]. Gypsum appeared to be the main component of the new ground created for the painting after the detachment [36].

2.2. Hypercolorimetric Multispectral Imaging (HMI)

HMI has been performed through a Nikon D810FR 36 Megapixel camera (Nikon, Tokyo, Japan), modified in order to obtain full range spectral reflectance measurements. Nikon SB910 xenon flashes (Nikon, Tokyo, Japan) have been exploited for lighting the painting—note that the plastic covers have been removed from the flashes’ front surfaces to emit the UV radiation. UVF has been obtained by filtering the flashes light with a UV band-pass filter (nominal cut-off at 380 nm), and using also an UV-IR cut filter (nominal cut off at 400–700 nm) placed onto the camera lens. The HMI image processing system consists of two main software tools: SpectraPick® for the image calibration, and PickViewer® for the image analysis both developed by Profilocore (Profilocolore SRL, Rome, Italy) [13,23,24,25,35]. The image calibration procedure is performed using radiometric references just below the painting. In particular, various white patches and a sample with 36 patches of colour-checkers built using colour samples from the Natural Colour System®© (NCS) catalog have been placed just below the painting, see Figure 2. The spectral reflectances of the references have been measured in the range 220–1050 nm at Profilocolore laboratory (Rome, Italy), with 0.7 nm accuracy (Instrument System Spectroradiometer CAS 140 CT (Konica Minolta Group, Langenhagen, Germany) and dark room). The calibration procedure outputs a single AdobeRGB TIFF (Adobe Inc., San Jose, US) 16 bit colour image and seven monochromatic images in a 16 bit TIFF format, containing the spectral reflectance values at 350, 450, 550, 650, 750, 850, and 950 nm. The last three values have been used for obtaining images at different IR wavelengths, namely IR1, IR2, and IR3, respectively. The precision achieved in the reflectance measurement across the whole 36 megapixels image is >95%, and the colour error is less than CIE2000 ∆E = 2 for the colour image [13]. Note that the calibration and alignment process require a few minutes and it can be performed in situ for an immediate results analysis. After the image calibration and acquisition, multispectral images have been obtained and processed through the HMI software PickViewer®. PickViewer® provides powerful image processing tools able to reveal hidden information from multispectral images and external imaging data, which can be also processed together using the same environment [23]. The full description of the technique and physical principle on which HMI is based is thoroughly explained in [44].

2.3. X-ray Fluorescence Spectroscopy (XRF)

A Surface Monitor II (Assing™, Rome, Italy) spectrometer has been used to gather XRF spectra, which operated with the following settings: Ag tube at 40 kV, current 76 μA, acquisition time equal to 60 s, distance from the analyzed surface equal to 94 mm, spot equal to 2 mm. The XRF spectrometer was equipped with an Amptek X-123 Si-PIN detector (Amptek, Bedford, US), resolution 145 to 260 eV at 5.9 keV, optimum energy range 1–40 keV. Spectra have been collected by Gonio software by Assing™. Points of analysis have been highlighted with an alphanumeric abbreviation, i.e., the letter “X” followed by a progressive number and photographically registered on the painting image file.

2.4. Pulse-Compression Thermography (PuCT)

The PuCT experimental setup is the same as detailed in previous published papers, wherein also an extended theoretical base of the technique can be found [33,34,35]. In particular, the signal generation/acquisition has been managed by LabVIEW software (National Instruments Corporation, Austin, US). Thermograms have been collected at 40 Hz, i.e., 40 FPS, through a Xenics Onca-MWIR (XenICs, Leuven, Belgium) (3.6–4.9 μm)-InSb, having a resolution of 320 × 240 pixels, and connected to a NI-1433 Camera Link Frame Grabber (National Instruments Corporation, Austin, US). The distance between the painting and the camera was about 700 mm. Eight light emitting diode (LED) chips (Tesfish, Shenzen, China—6500 K, 4500 LM) have been used as a heat source, each one having a maximum nominal electrical power of 50 W. Note that the LEDs have not been used at their maximum power—an overall electrical peak power of about 250 W was reached to get the reported results. The pseudo-noise code driving the LED chips consisted of a repetition of two Legendre sequences, each one of 47 bits. The duration of each bit was 1 s, thus resulting in an overall excitation time of 94 s. During this time, the LEDs have been switched on for about half of the overall excitation time, so that an overall electrical energy of ~12 kJ was delivered. Note that the camera and the heating source have been placed on the same side with respect to the inspected painting, thus the PuCT analysis has been performed in reflection mode. The coded excitation voltage signal driving the LEDs was provided by a TDK Lambda GEN 750W power supply (TDK Corporation, Tokyo, Japan). The frame grabber and the power supply have been driven synchronously by the signals provided by a National Instrument PCI-6711 Arbitrary Waveform Generator (AWG) board. Both the AWG board and the frame grabber were connected to a central PC/DSP Unit. Figure 3 shows a detailed picture of the PuCT setup.
A thorough description of the PuC algorithm lies beyond the scope of this work, therefore the reader is referred to [32,34,35] for a deeper understanding of the whole procedure. For the sake of clarity, some fundamental aspects of the technique are worth being highlighted.
For the here-employed setup, the reconstructed time trend of each pixel after the application of the pulse-compression (PuC) algorithm corresponds to that achievable by exciting the sample with an equivalent rectangular pulse of 1 s duration. The advantage of using PuC rather than a pulsed excitation is that this fictitious single pulse carries the energy of the entire pseudo-noise Legendre sequence, which means that the thermal response retrieved after PuC, and hence the thermograms, are characterized by a good signal-to-noise ratio (SNR) even by using relatively-low peak power values. It must be stressed that such aspect is crucial in the inspection of irreplaceable items as the artworks: While a short high-power excitation pulse could damage the painting by inducing thermochromism or thermal/mechanical stress, the use of a pseudo-noise excitation spread rather than the energy within a longer time, making the temperature rise of the sample smooth and magnitude-limited. After PuC, a fictitious larger and faster temperature increment is rather achieved exploiting the mathematical properties of the coded excitation [33].
It has been shown in [35] that the use of the Hilbert transform and of the derived time-phase feature from PuCT signals can highlight some characteristics of the support, such as wood grain, grouts, etc. This processing is applied here to the PuCT data, so that three different time-domain features are obtained and shown: “Emissivity”—is the amplitude of the time signal of each pixel retrieved after PuC and it is an indirect measure of the pixel thermal emissivity, which can be related to the pixel surface temperature by a proper calibration; “Hilbert”—is the output of the Hilbert transform applied pixelwise to the “Emissivity” trends; “Time-phase”—is the function that for each time instant t outputs the argument of the complex number c(t) = Emissivity(t) + i × Hilbert(t) in time domain, with i being the imaginary unit. Those three features help in interpreting the recorded data—the presence of cracks, for instance, can be inferred as a specific area with abnormal temperature rise that is visible either imaging the “Emissivity” or “Hilbert” or the “Time-Phase”. As a matter of fact, the highly-heterogeneous nature of any painting leads to an IR data interpretation which is far from being automatic and unsupervised, thus the need for imaging and interpreting information from different features at the same time.
As for HMI, Principal Component Analysis (PCA) has been here applied to thermograms produced by imaging both the Emissivity and the Hilbert features. As can be seen in the next section, PCA highlights some characteristics of the time-series using a reduced amount of data. This is useful for detecting clear anomalies quickly and in situ, while imaging the whole time-series is still needed for an in-depth quantitative analysis.
An alternative way of showing the thermography results has been here explored, based on using the Emissivity, Hilbert, and time-phase features to generate colour images. In particular, RGB and YCbCr colour spaces have been explored by relating each colour coordinate to the each of the three features.

3. Results and Discussion

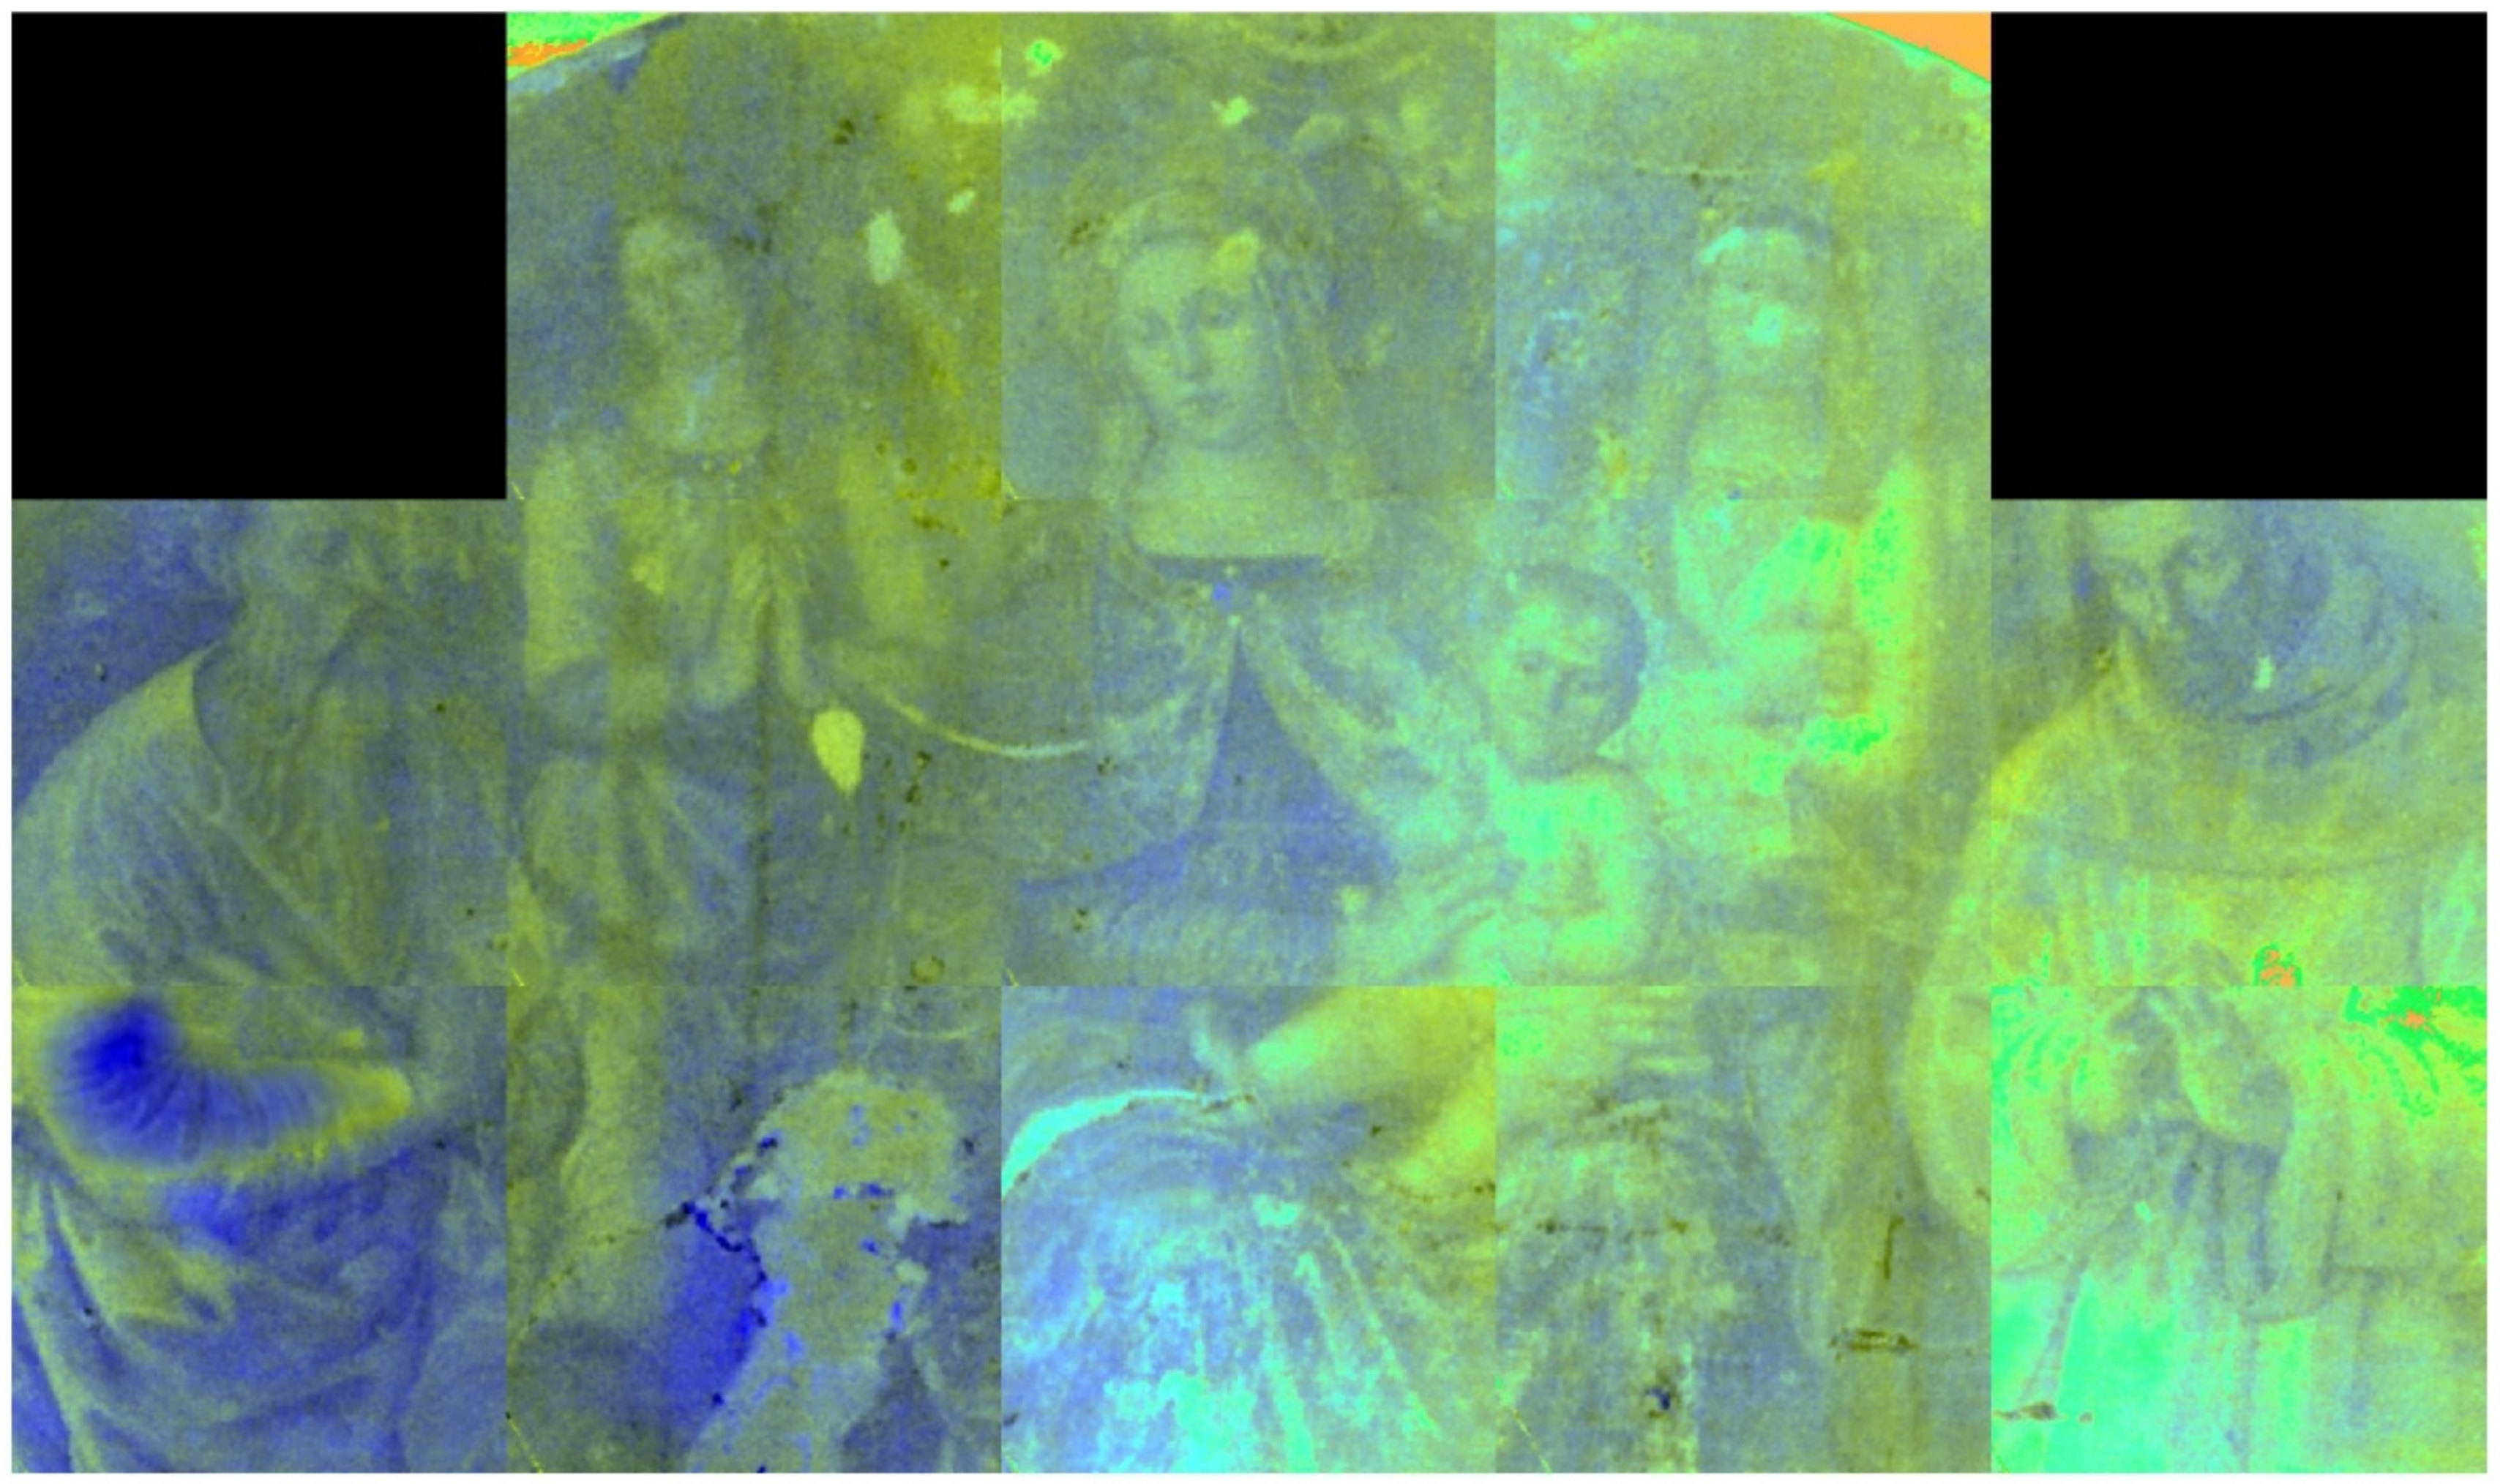
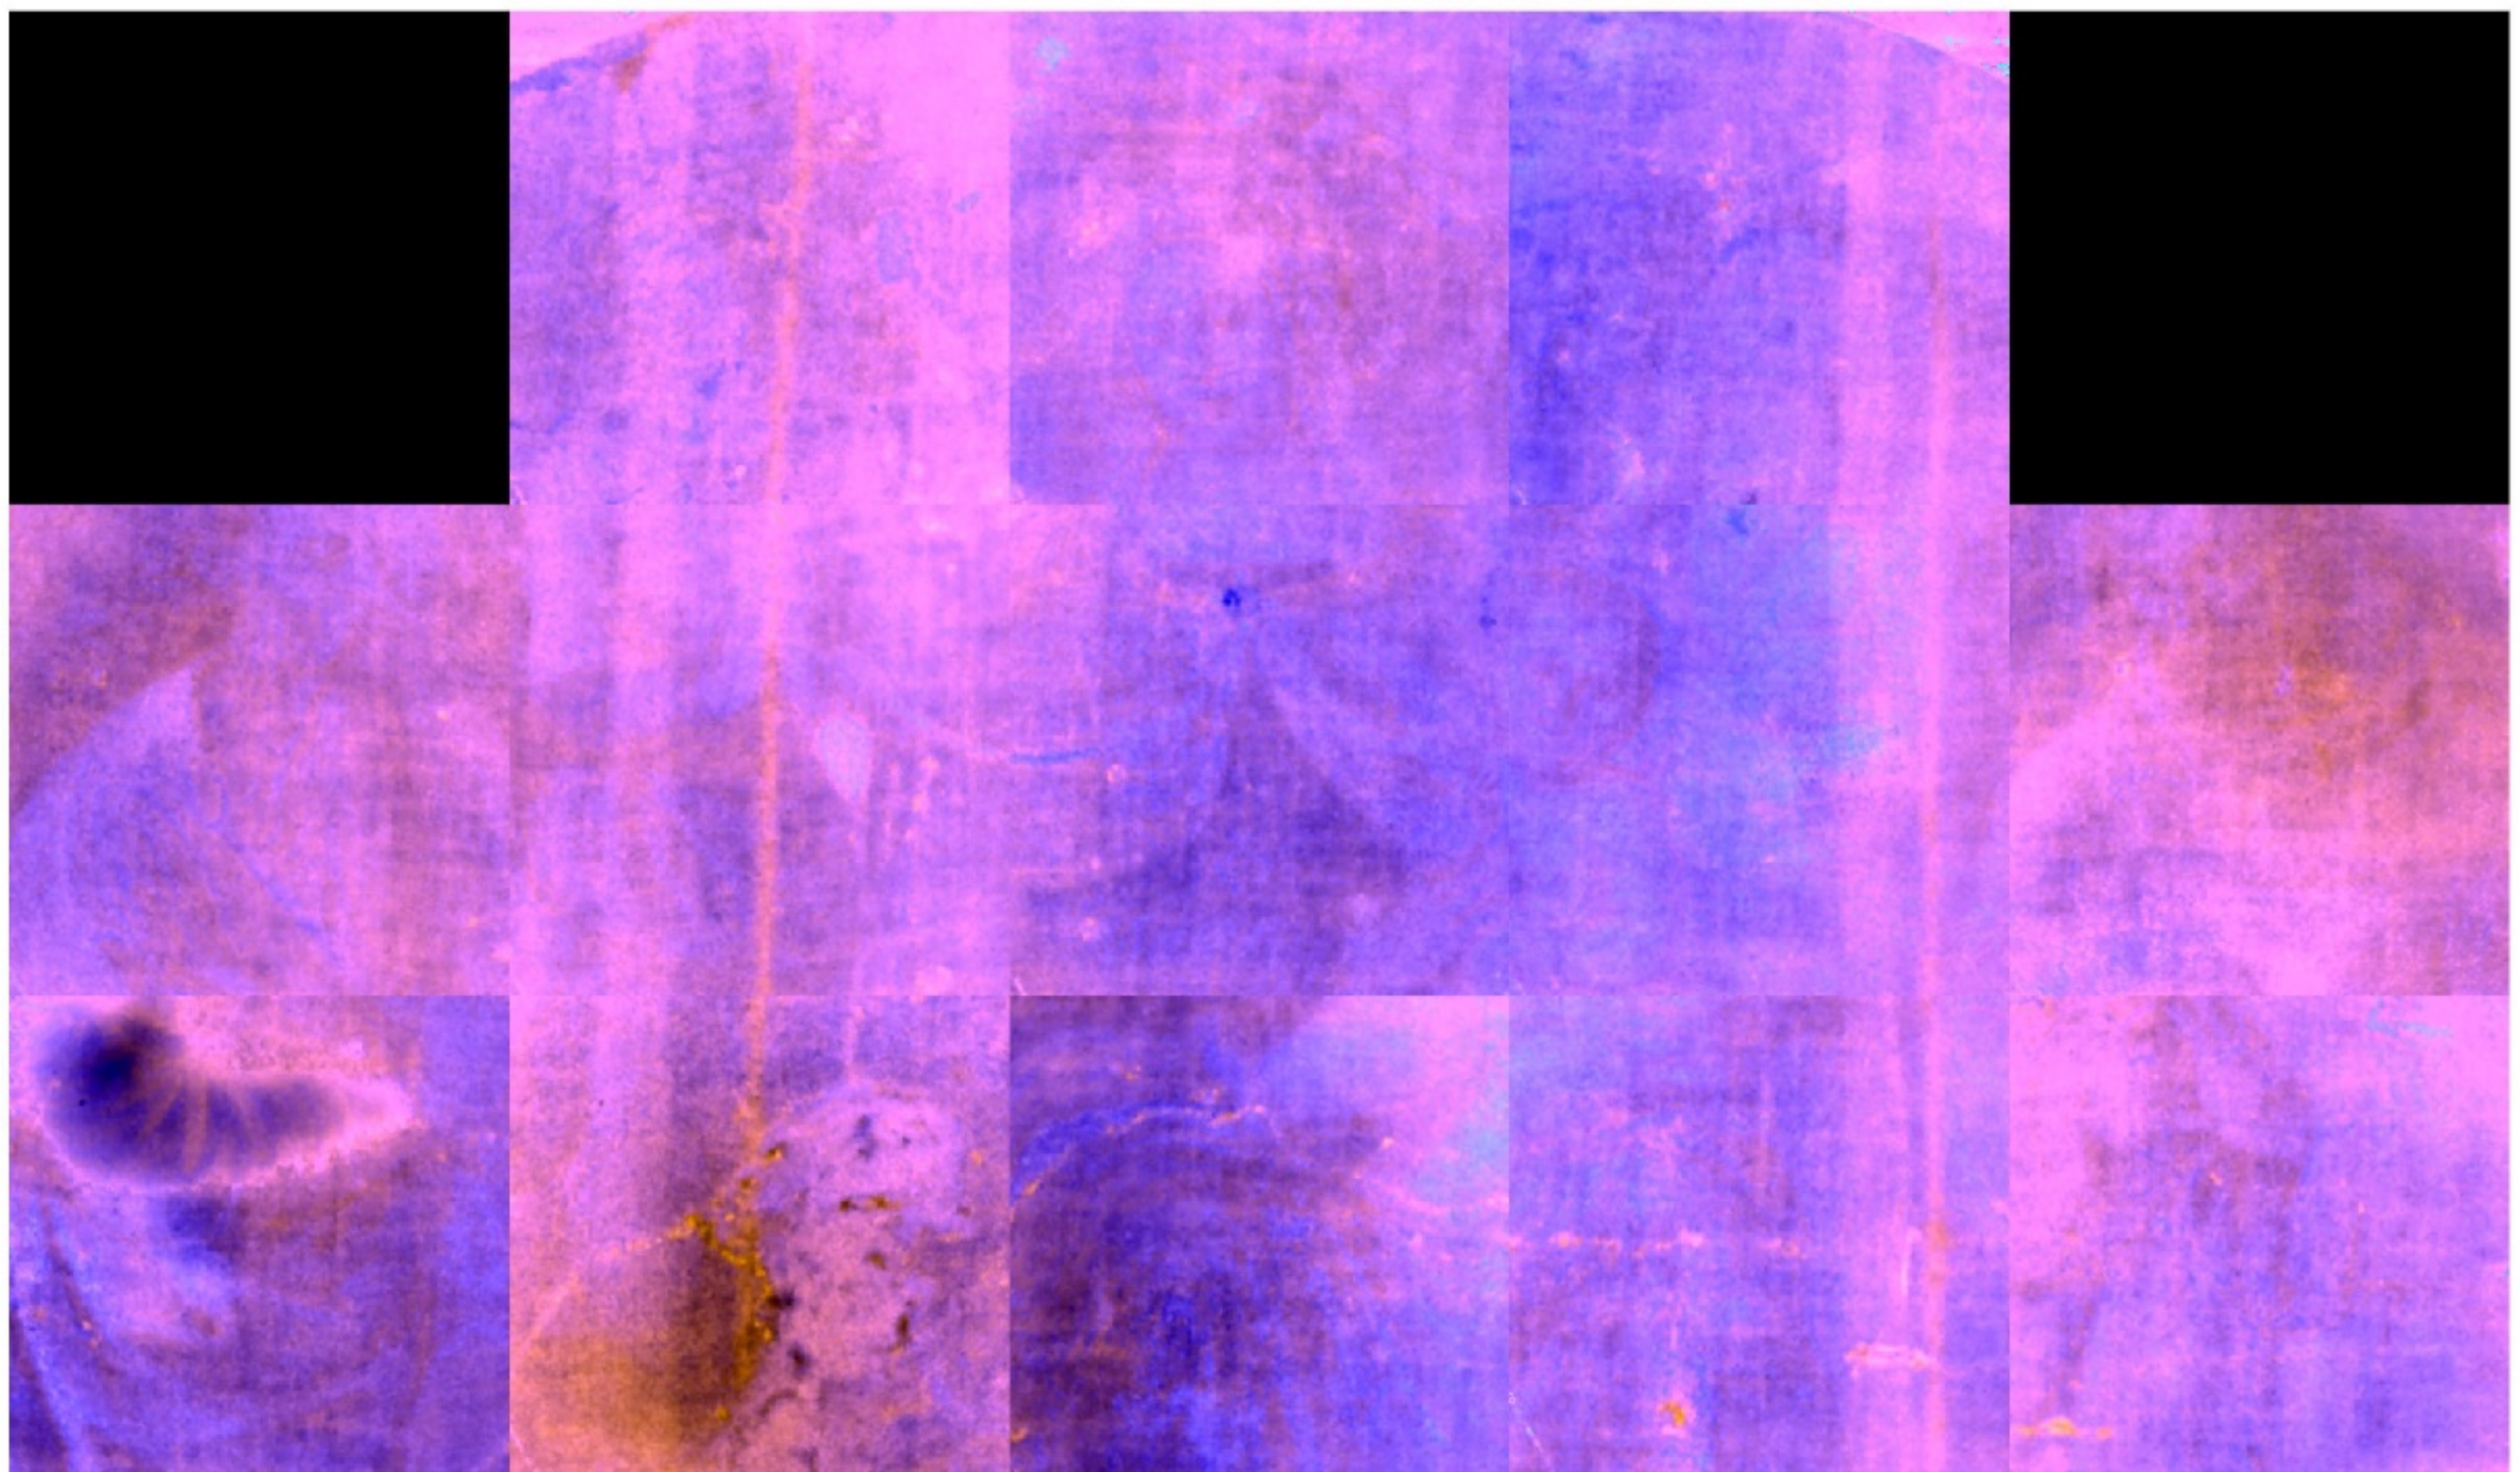
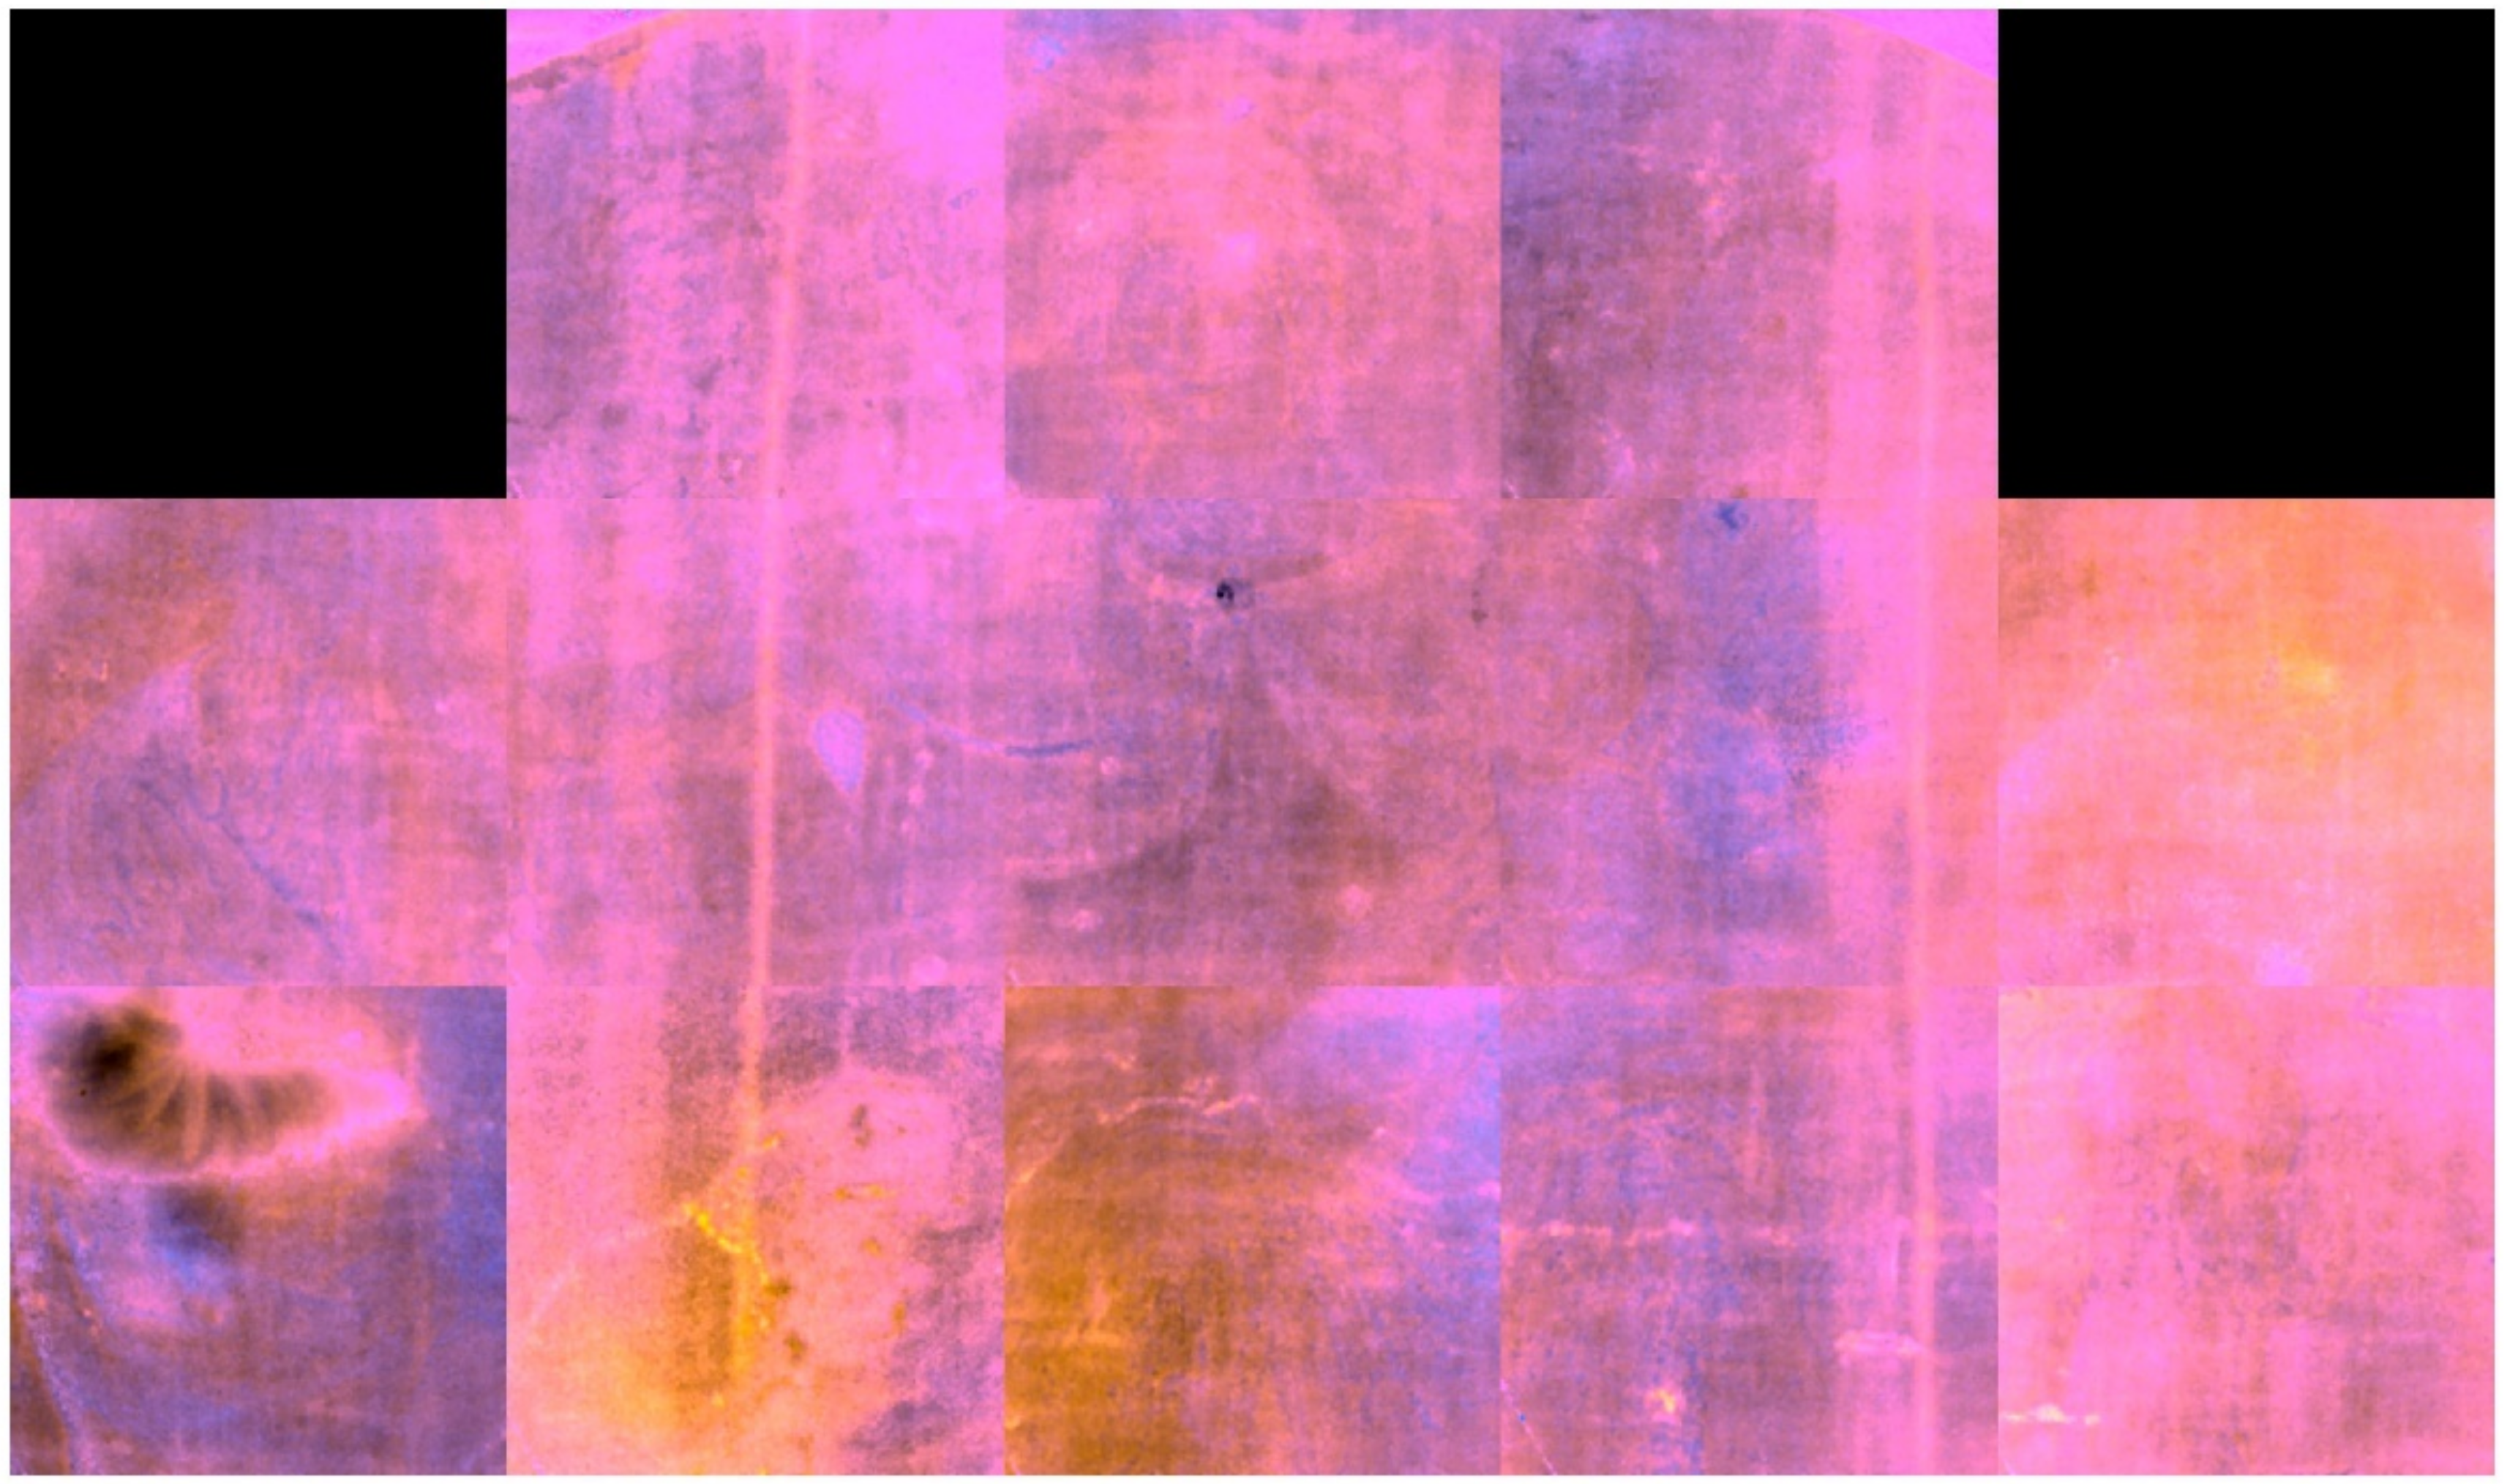
3.1. Hypercolorimetric Multispectral Imaging (HMI)

The seven calibrated spectral bands images have been analyzed in PickViewer® software and some processing tools applied to gain further diagnostic information. PCA has been applied on IR images to highlight the presence of preparatory drawing and possible pentimenti, especially in the restored areas where different and superimposed materials are found to be highly mixed. In fact, PCA has been widely used for art conservation applications [45,46,47], especially in digital imaging investigation for highlighting areas with similar spectral response, which is an indication of similar material composition.
Figure 4 shows the HMI processed image in the infrared at 850 nm (IR2)—details of the preparatory drawing are noticeable in the garments of the saints, of the angels, of the Virgin, and of the lion near Saint Jerome, as well as details of a scroll at the lower edge of the Virgin’s blue dress (see Figure 5). Thus, imaging obtained with IR2 enhances the outlines of the original design of the scroll that, as suggested by the restorers in charge of the artwork’ restoration, was probably applied by a secco technique and is now lost.
An extended micro-cracking has been highlighted in correspondence of the Virgin’s face by applying PCA to the images in the IR region (IR1, IR2, and IR3, see Figure 6). In fact, PCA enables highlighting fine details that are hardly visible by imaging a single spectral band and avoiding data redundancy, allowing in the present case to exclude any later retouching and to reveal an extended microcracking of the pictorial layer. Furthermore, a comparison of the measured spectral reflectance has been applied to the red colour in the Virgin’ garment and in that of the angel at the right side of the Virgin (Figure 7). This has been done to compare the multispectral and colorimetric characteristics of two painting materials, appearing similar in the visible otherwise. The obtained values of both the colour coordinates (reported as raw numbers in the lower bar of the GUI as L*a*b colour space) and the reflectance show a high similarity between the two, suggesting a possible equal composition in terms of pigments.
In order to make the hypothesis about the pigments’ composition, especially for the blue and green ones on the background and on the Virgin’s mantle, infrared false colour (IRFC) analysis has been performed by combining calibrated R, G, B, and IR channels, see Figure 8 [48,49,50].
For the blue pigment of the Virgin’s garment, the use of azurite is hypothesized on the base of its characteristic deep blue colour as for the IRFC. Both the sky and parts of the Virgin’s vest show a peculiar green colour in the visible but they assume a light blue hue when imaged via IRFC, suggesting a possible presence of malachite. In addition, considering the bad state of conservation of the artwork after a long exposition to weathering, a preferential degradation caused by humidity with a transformation of azurite into malachite or other green copper-based compounds seems very likely, rather than the application of a green pigment in areas meant to be blue-coloured [51]. Areas having unaltered azurite are in fact clearly visible in the background sky behind the Virgin’ head and at the bottom edge of the sky, as well (Figure 9).
To corroborate the hypothesis, a map of spectral similarity has been built on the base of the 7-bands spectral reflectance bins measured in a 9 × 9 pixels area onto the blue part of the Virgin’s dress, as shown in Figure 10 (see the white spot on the right side of the Virgin’s face). The results gathered by the application of the HMI (spectral similarity algorithm) are shown in the right-half of the software’s GUI—a high correspondence between the blue pigment of the Virgin’s vest and the sky one is found, supporting the hypothesis of the use of azurite in all the blue areas. Note that those results are also confirmed by the XRF analysis described in detail in Section 3.2.

3.2. X-ray Fluorescence Spectroscopy

XRF spectroscopy via a portable instrument has been chosen as a powerful and non-invasive tool to detect chemical elements in selected points onto the painting surface.
The results of XRF spectroscopy are shown in Table 2. The presence of copper in the blue and green areas of the background and in the Virgin’s garment and mantle confirms the result obtained through UV and IR false color images acquired via HMI about the use of Cu-based pigments for those colours, probably azurite and malachite. These pigments have been used in wall paintings by a secco technique, i.e., applied by an organic binder on a fresco ground layer generally made of iron based pigments such as the so-called morellone [52]. The presence of Ca associated to Sr in all of the examined points, suggest the use of gypsum as ground for the detached paintings. This result confirms the FTIR data that showed the presence of gypsum with a minor content of calcium carbonate [36].
Iron is also present in the XRF measured points. It can be associated to the preparatory layer of azurite/malachite (the so-called morellone) and to the use of Fe-based ochre and earths. In the dark brown of St. Francis habit, Fe is associated to Mn suggesting the use of umber pigment. In this same point, traces of Br have been also detected. Generally, Br can be associated to organic dye or to residues of treatments (mainly disinfection) [53].
Gold has been detected in the jewel on the Virgin’s mantle and on the angel, and also in the Christ halo (point X11)—note that here the gilding is completely detached and no trace of gold could be seen by the naked eyes.
Lastly, Pb based pigments have been detected, especially in the gilding areas where they can be associated to compounds used for their siccative properties.

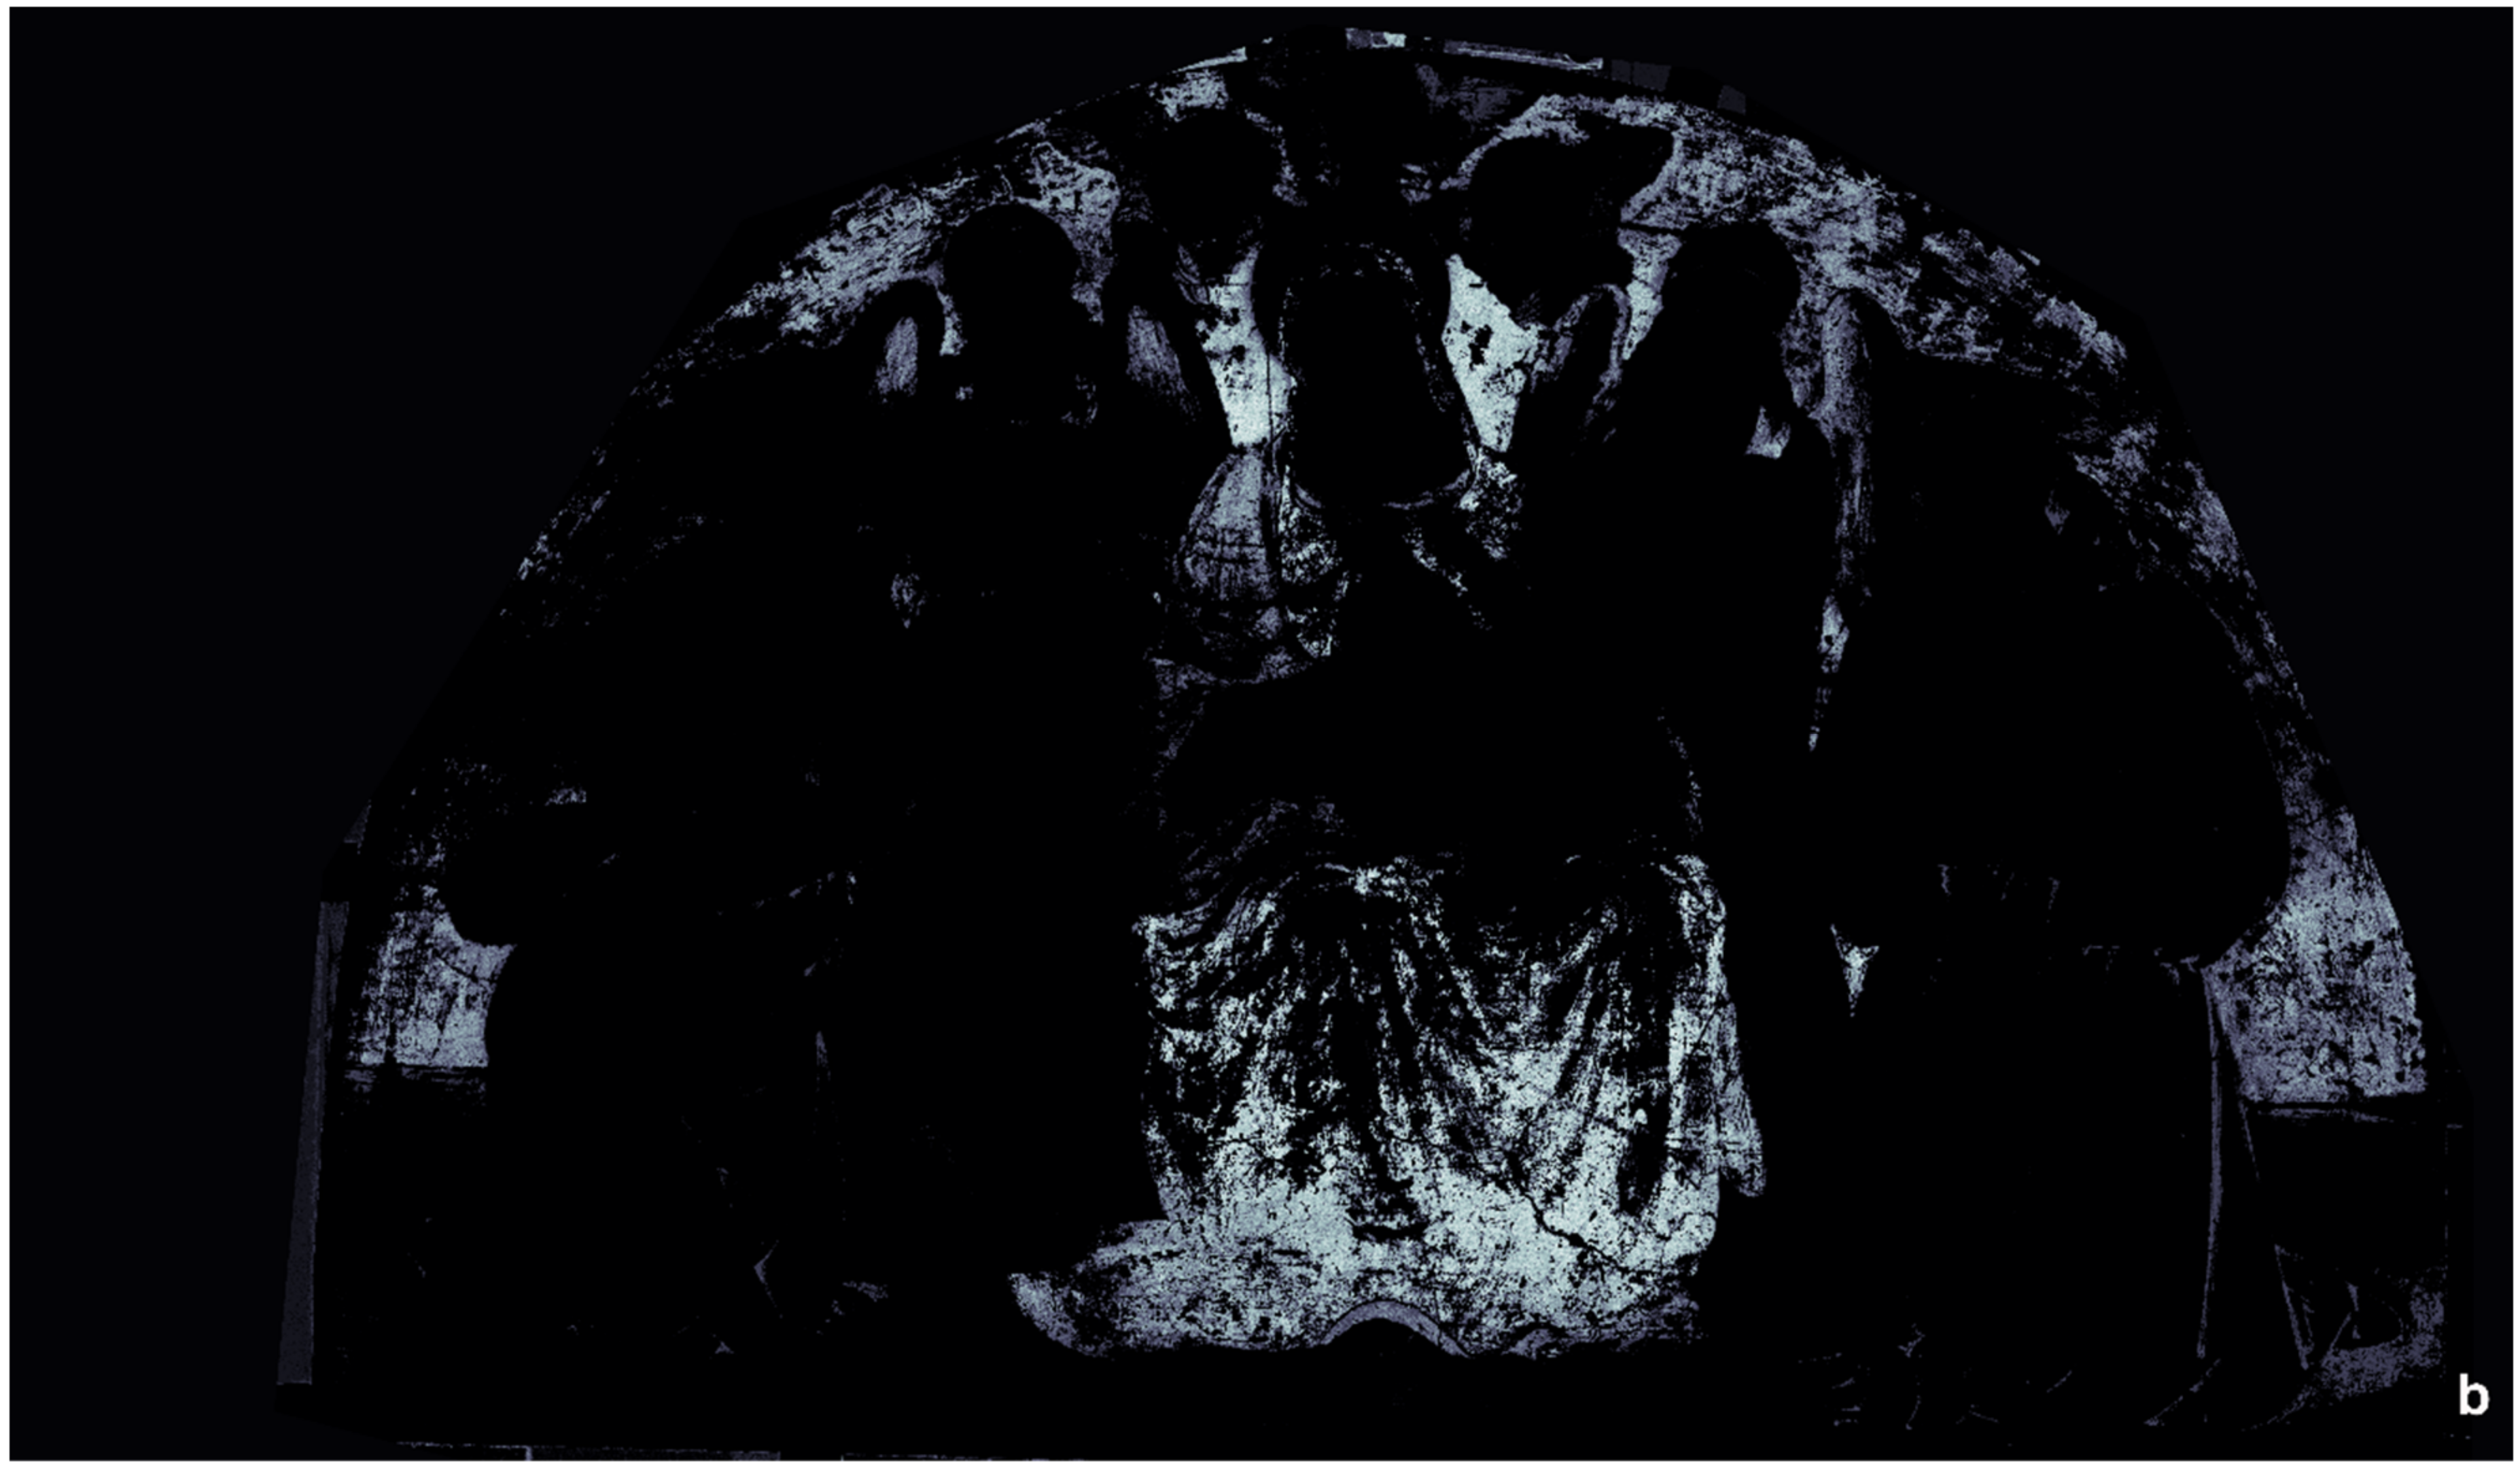
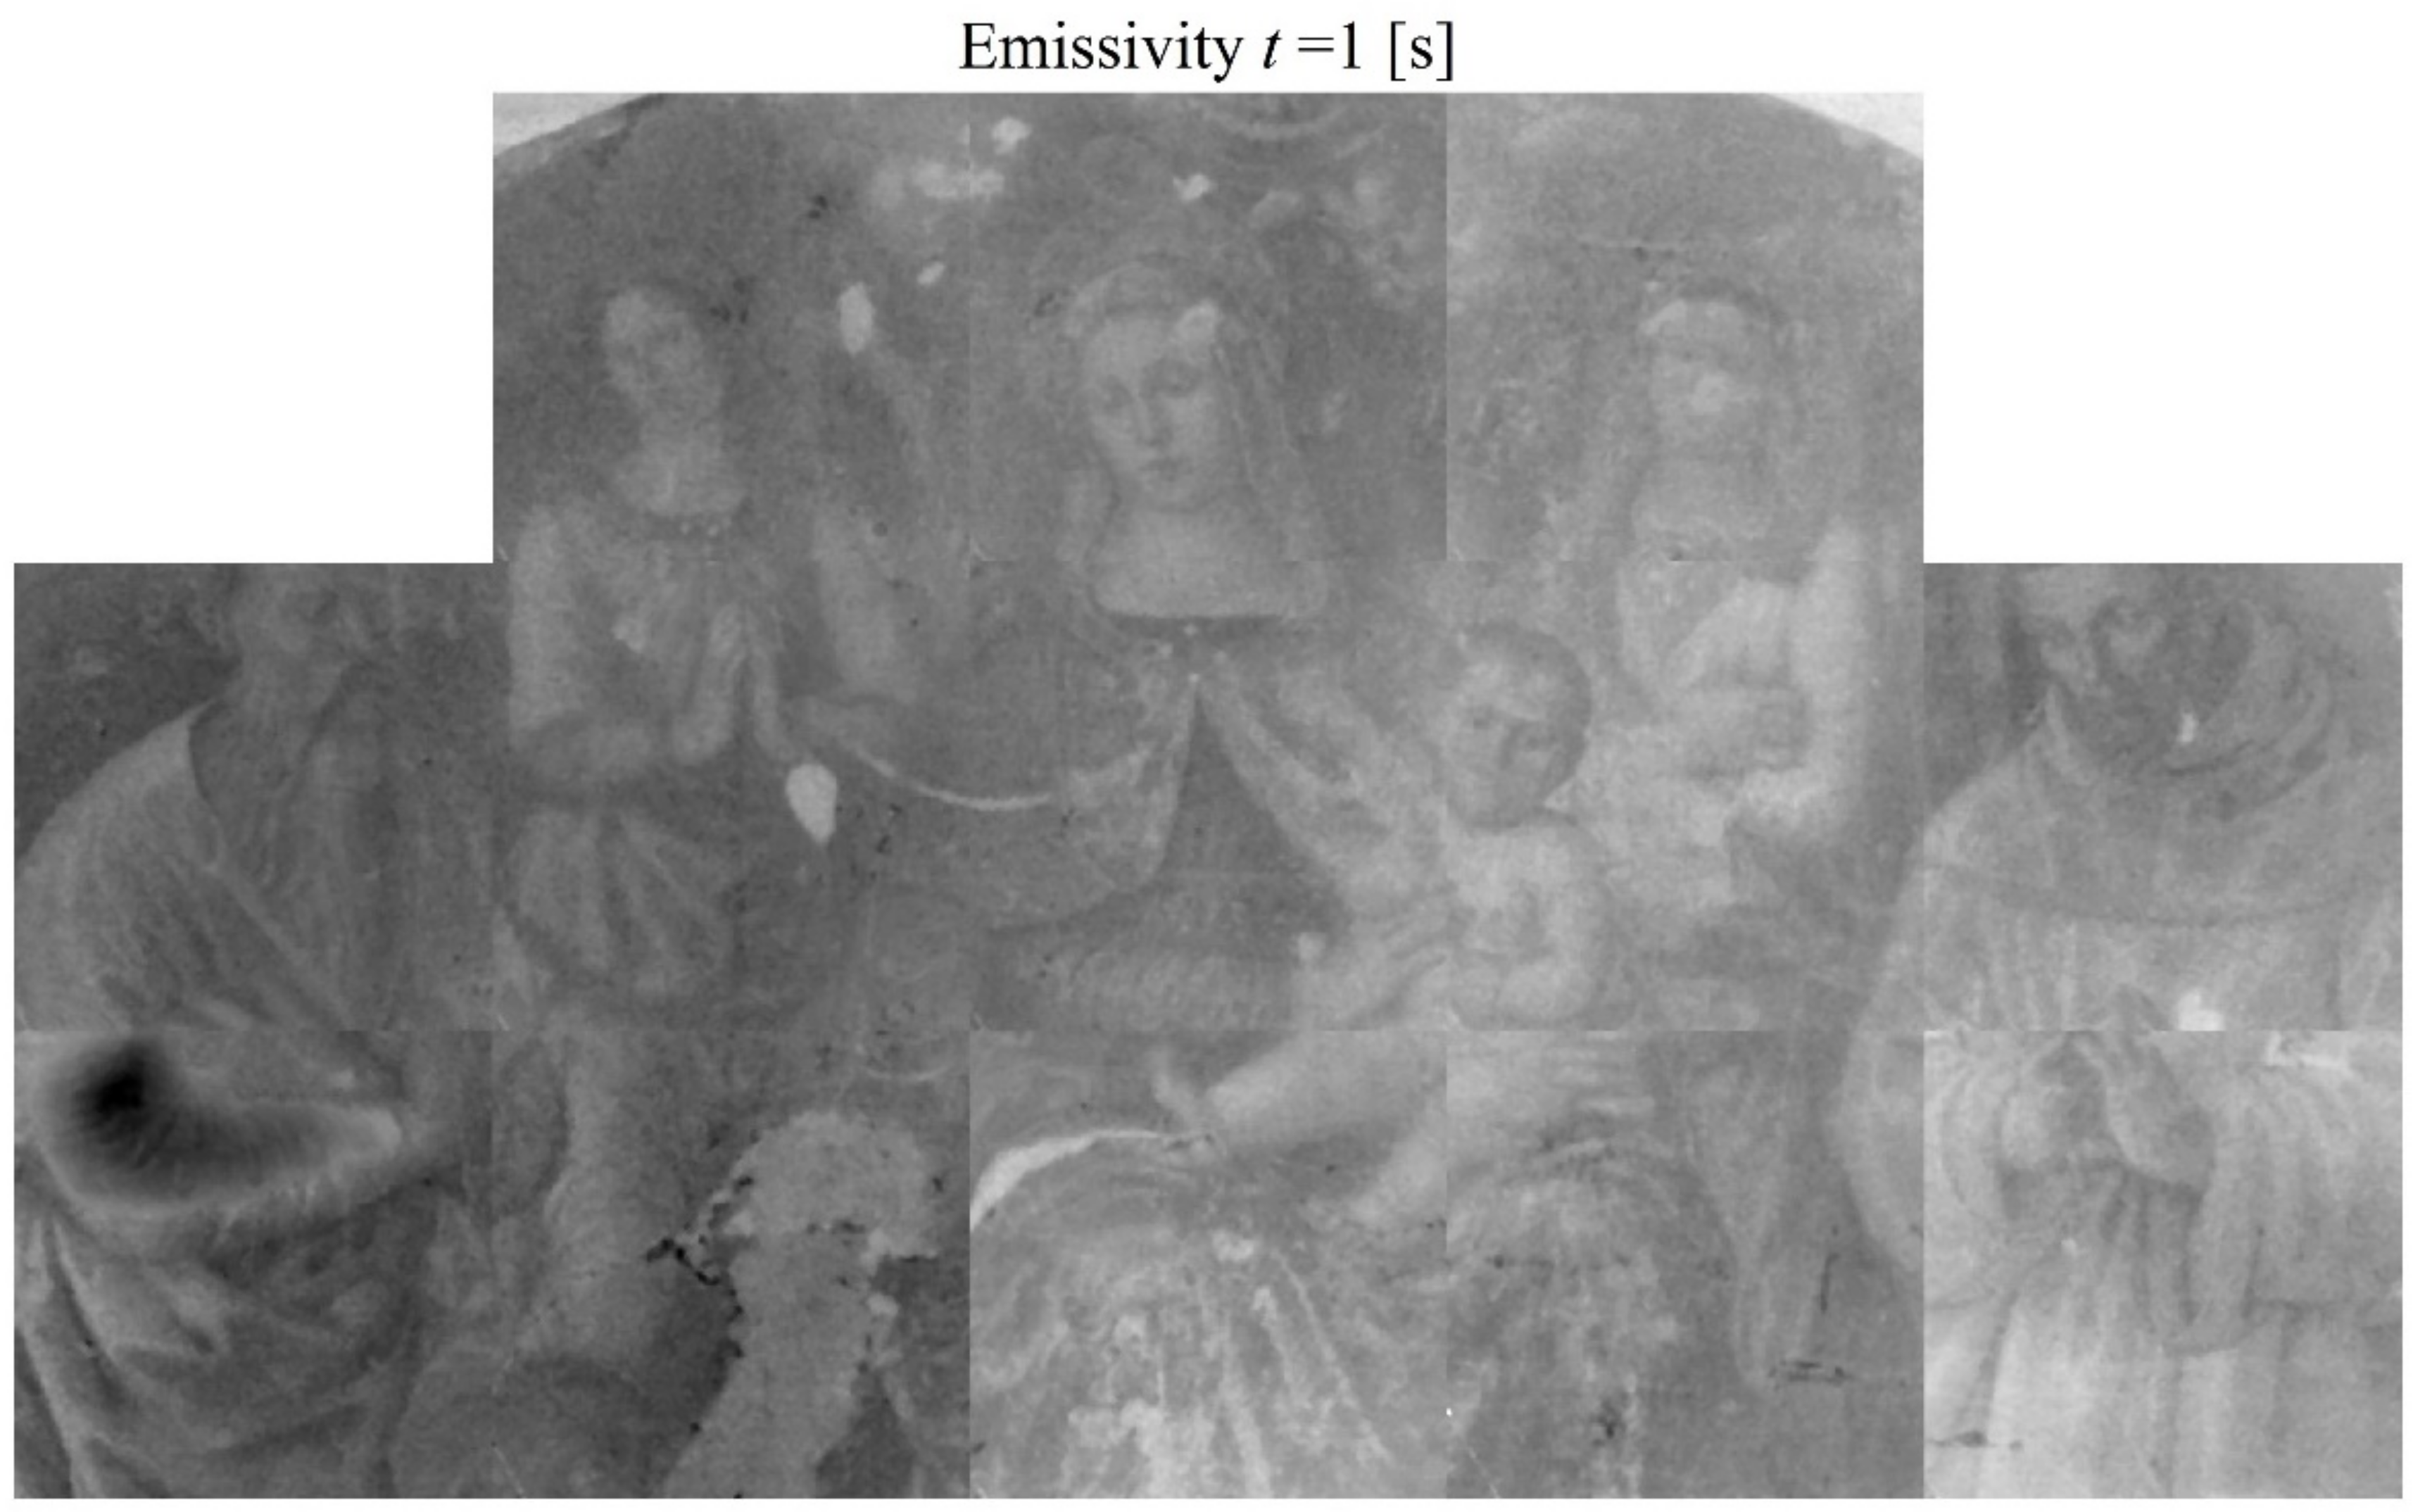
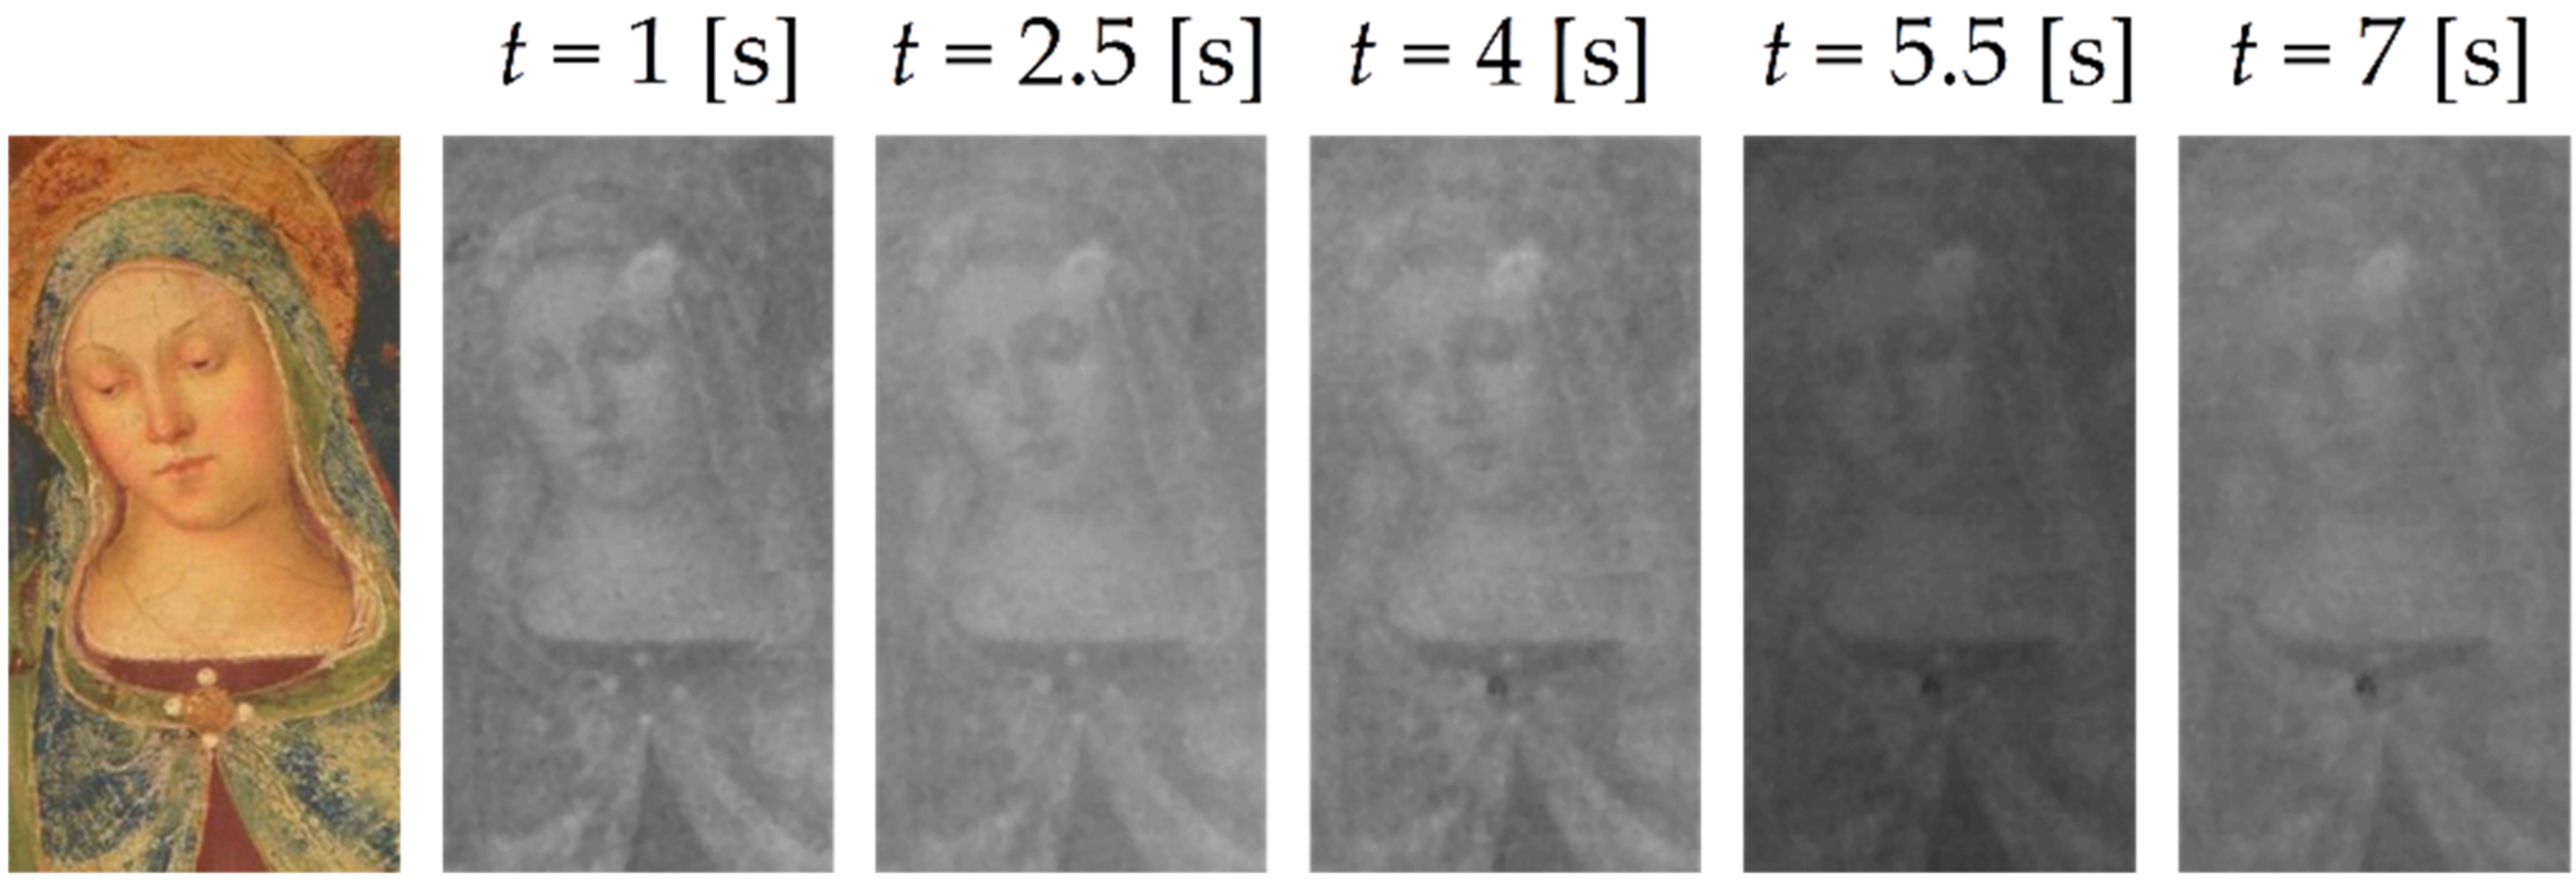
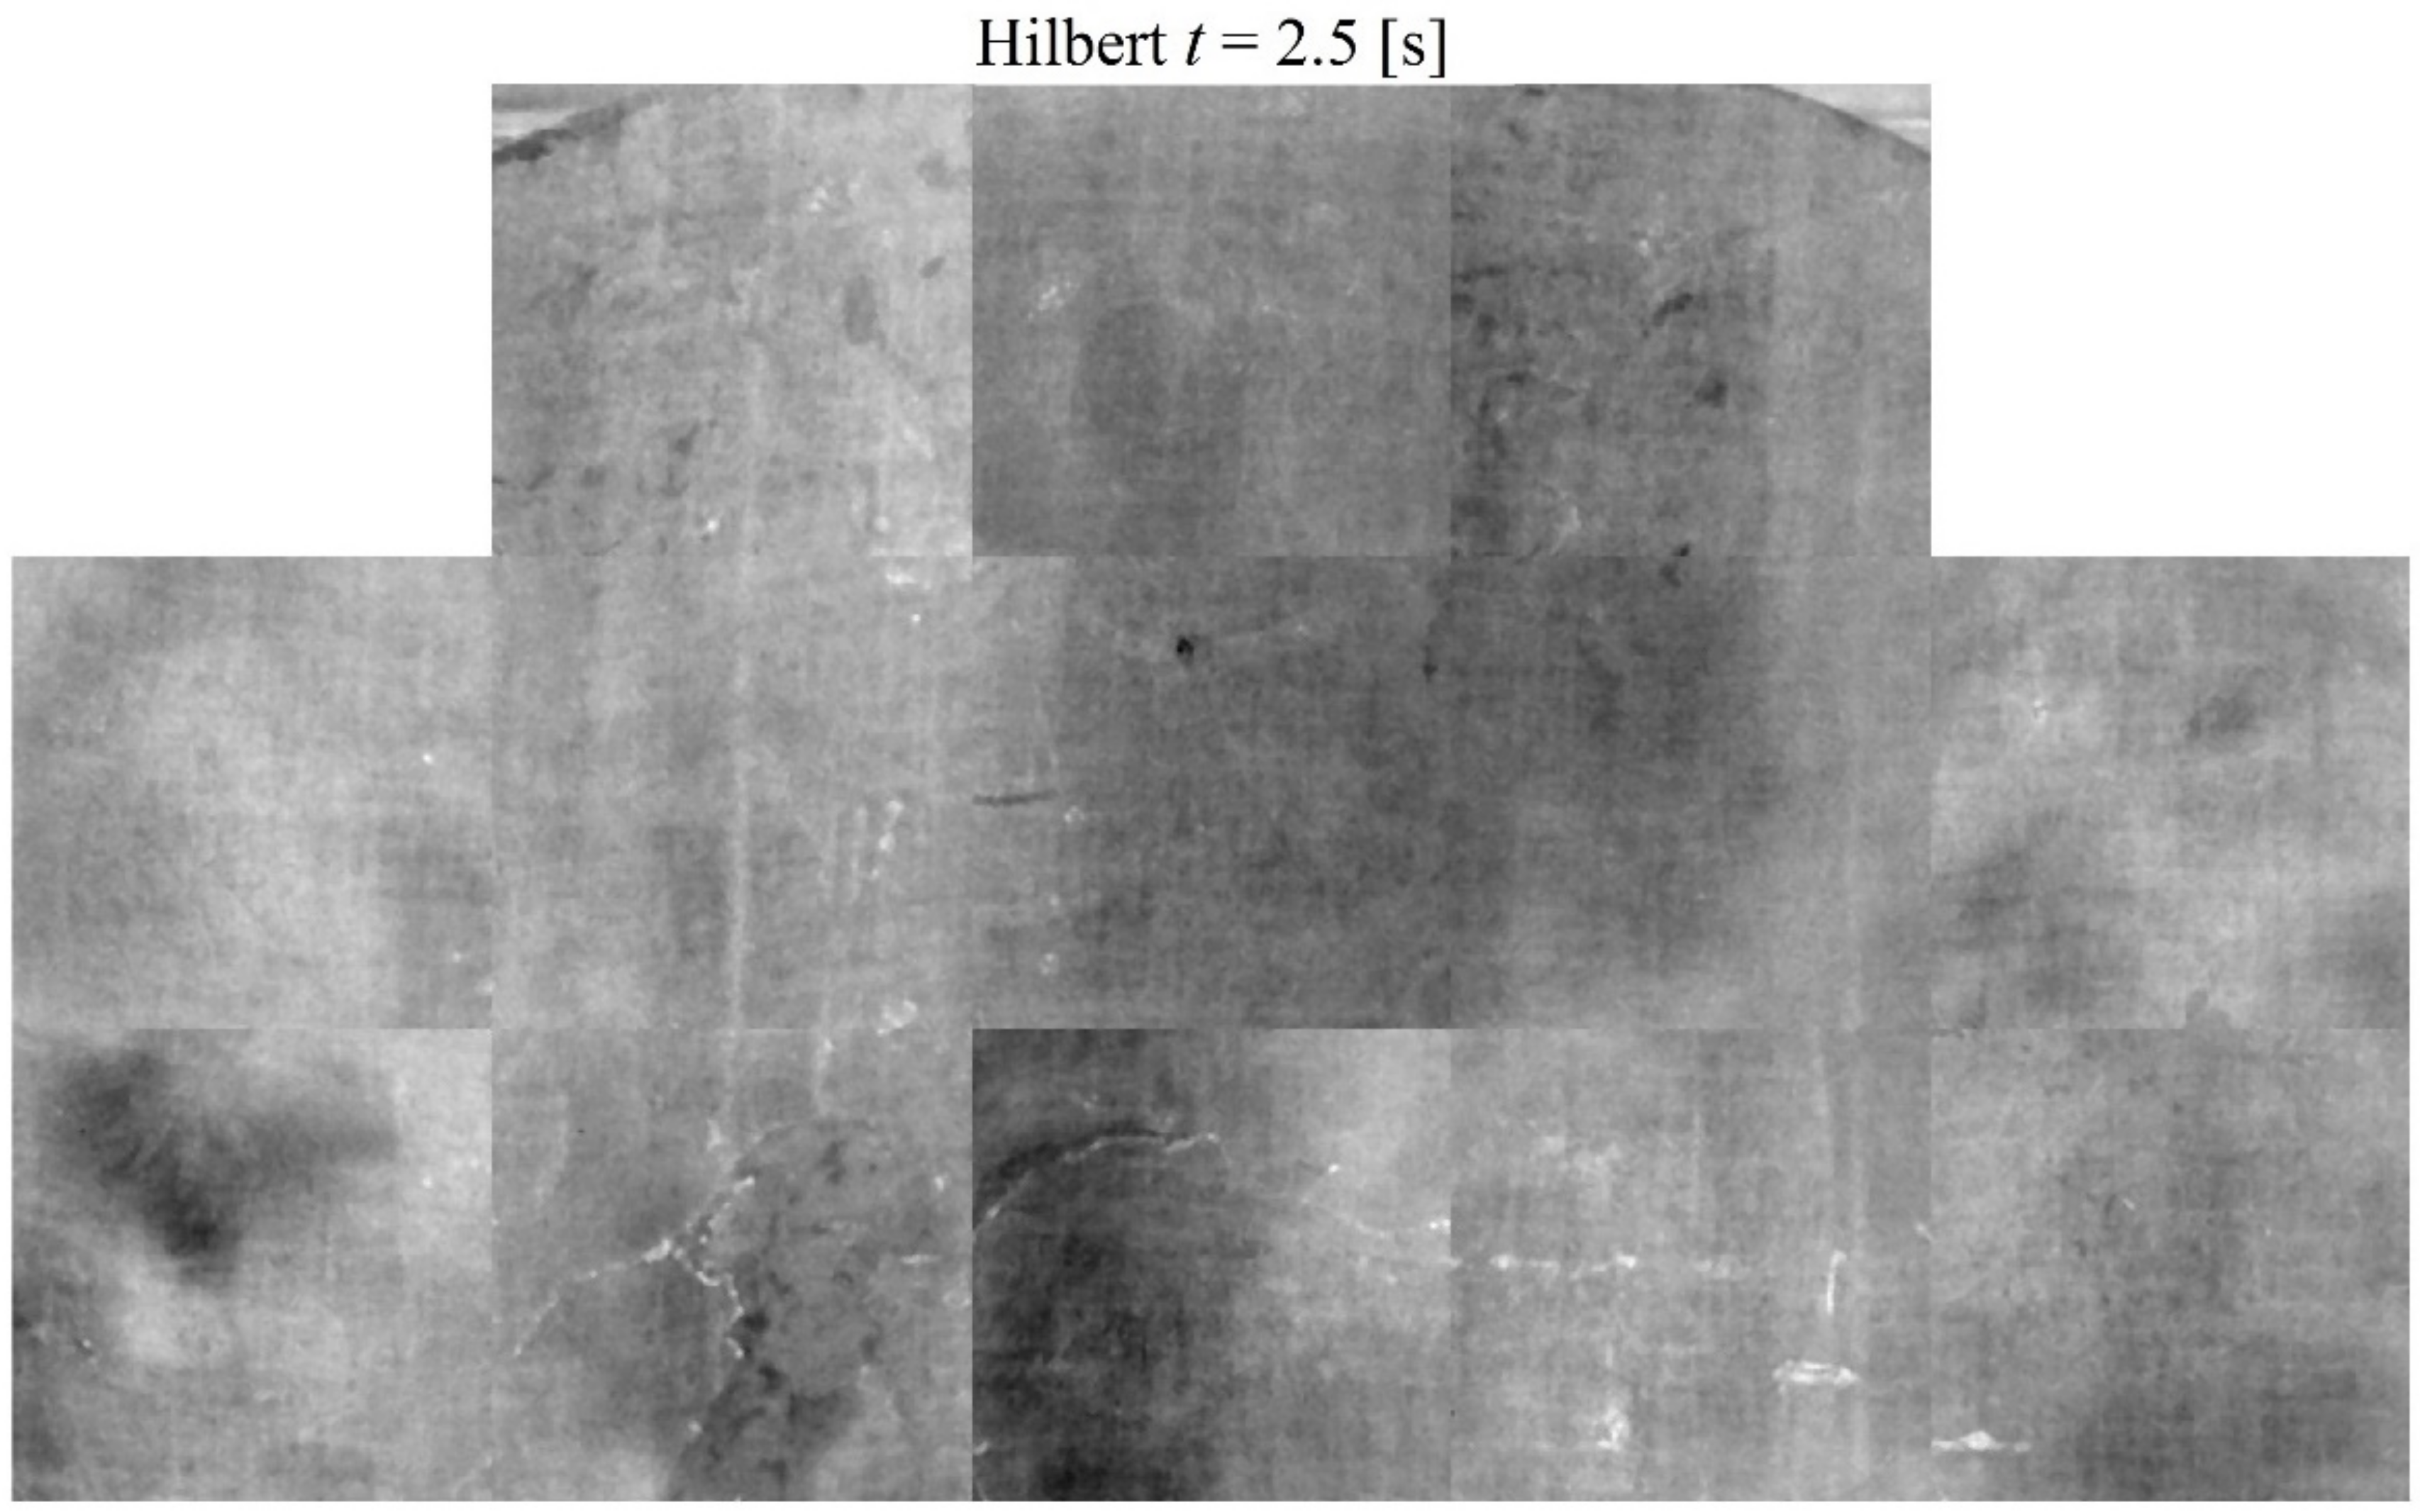
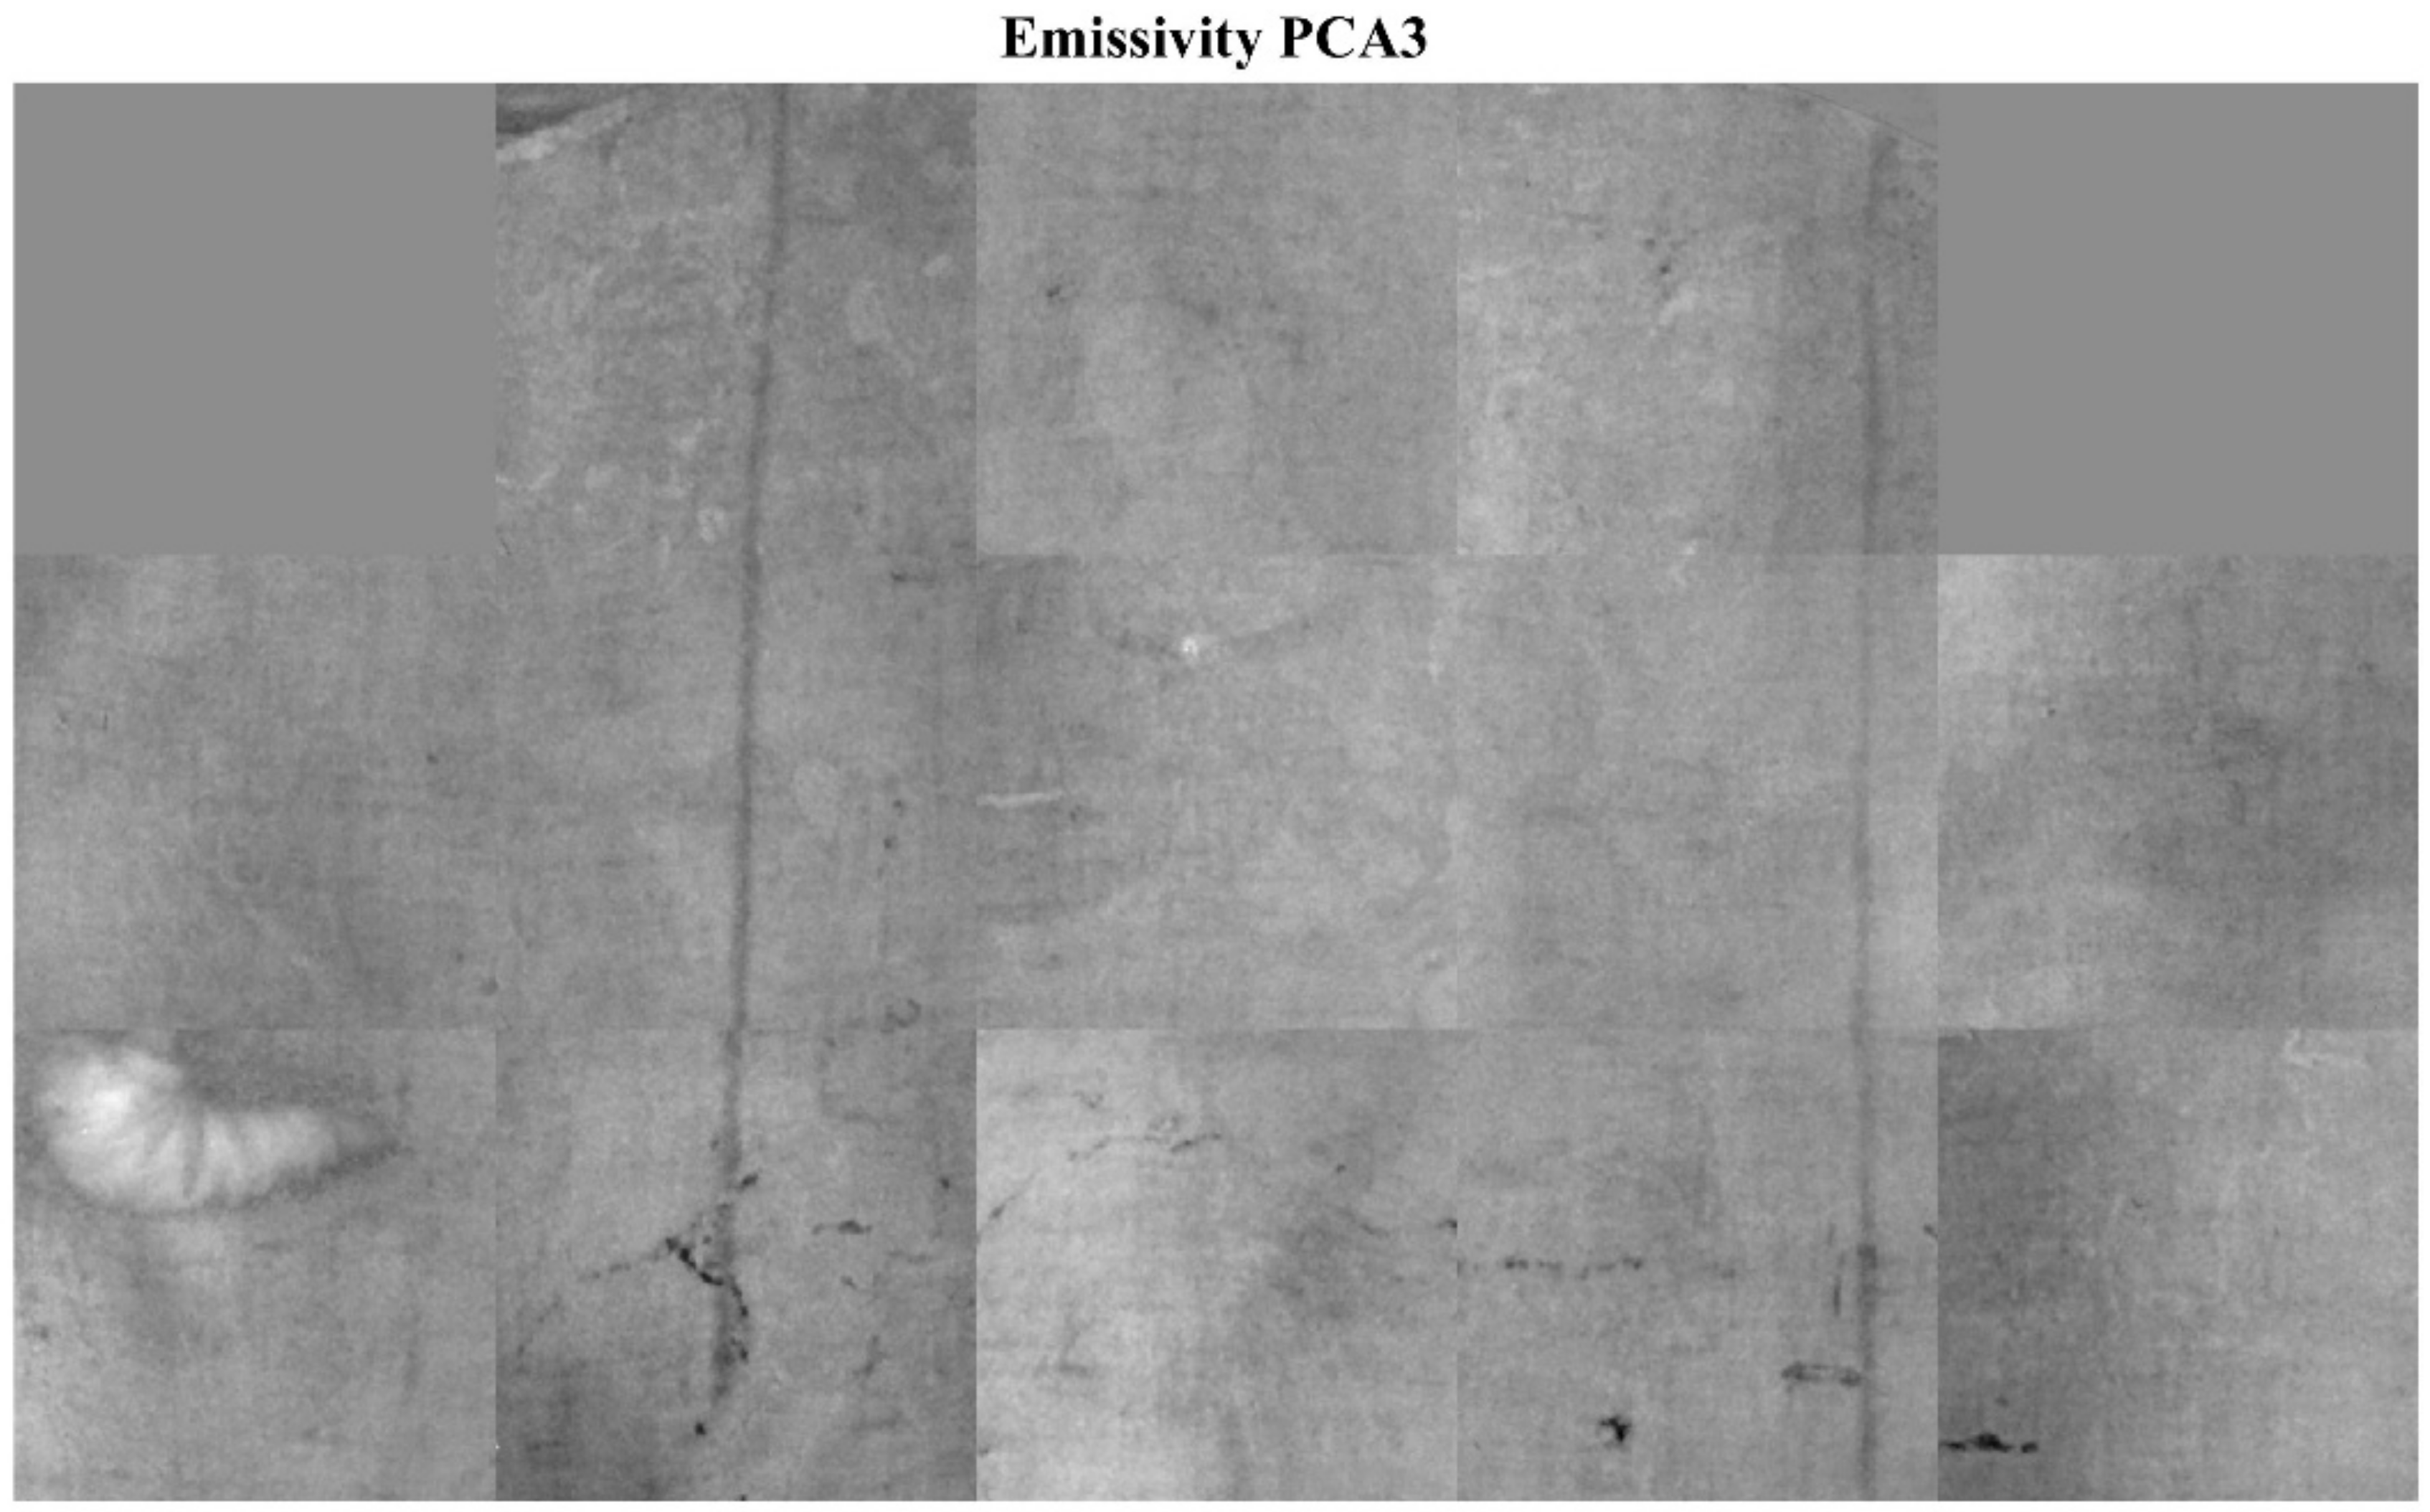
3.3. Pulse-Compression Thermography (PuCT)

The reported results have been obtained by applying pixelwise the PuC algorithm over the acquired thermograms, as it has been described in detail in Section 2.4. Note that some spatial discontinuities among the images can be seen even after some preliminary image processing. Those discontinuities are due to the thirteen spatial “tiles”, i.e., thirteen different tested locations sticked together in a single mosaic, needed to capture the whole painting’ surface—the mosaic merging procedure can be further improved with a proper calibration, but this will be addressed in a next work. The current results are satisfactory enough to be exploited for an evaluation of the state of conservation of a painting.
On one hand, if the IR2 band (850 nm) gives some information on the preparatory drawing of the scene, see Figure 4, the infrared PuCT analysis highlights instead many interesting details of the surface and stratigraphy. Detachments, gold coating, and different restoration appear as brighter areas in emissivity images. Note that the brighter the area, the lower the emissivity. This can be seen in Figure 11 that shows the emissivity image corresponding to t = 1 s, that is the thermal emissivity estimated after 1 s from the beginning of the reconstructed thermal pulse. Typically, this is the time instant that better shows the details of the pictorial layer—the light is absorbed differently by the various colours during the excitation step, leading to a variation of the surface’s temperature over the inspected area. The presence of gold traces in the haloes of the Saints and angels suggests that the haloes have been originally gilded probably using a missione, which is an adhesive oil/resin primer, used to make the adhesion of gold on the wall paintings possible [52,53]—note that this is also visible in the IRFC image with a yellow-brown colour, see Figure 8 and Figure 9. Increasingly, the large previous restoration works between the Virgin and Saint Jerome appears as a well-delimited cold area, while Saint Jerome’s right arm is warmer than the rest of the figure. It can be noticed that the same arm exhibits an anomalous brilliance in the IR2 and in false colour images (Figure 4 and Figure 8), probably due to the use of different materials and painting techniques.
Different details become more and more visible as time elapses—there is a direct link between the thermal responses of layers at deeper depths within the tested materials and the flow of time.
As an example, Figure 12 depicts the emissivity image at t = 7 s. Thermal signatures of possible deeper detachments/restorations/gluing are visible as vertical-contrasted areas denoted with yellow markers. The canvas texture underneath the painting is also barely visible, superimposed to the faint details of the painting scene. An interesting detail concerns the Virgin’s cloak closure. In Figure 11, four lighter-colder spots are clearly visible, while those are no more present in Figure 12 but a darker/hotter spot appeared in the middle of the four previous spots. The evolution of this area in time is illustrated with more detail in Figure 13, where a zoom of this part is reported as time elapses together with the visible image serving as a reference.
To better identify the support of the painting, the images obtained by Hilbert and time-phase features can be used. Indeed, while the emissivity feature is influenced for quite a long time by the temperature rise of the pictorial layer, the details of the pictorial layer, i.e., the painting subject, disappears rapidly in the other two features, so that the subsurface layers can be visualized.
Figure 14 shows the image obtained by the Hilbert feature at t = 2.5 s, where the canvas texture and its waviness are clearly visible. In these thermograms, the following can be observed: (i) A series of cracks, starting from the large retouching at bottom left, passing through the Virgin’s knees and Child’s feet; (ii) the warm spot of the cloak closure; (iii) the vertical bands and lines present also in Figure 12; (iv) Saint Jerome’s arm that appears darker/warmer; and (v) warm and cold spots scattered all around the painting.
Other frames corresponding to different values of time could be selected to better highlight different details, but the main aim here is to demonstrate the capability of the PuCT technique to provide information from the inner structure of the sample to be complemented by the HMI information.
PCA can be applied separately to emissivity, Hilbert, and time-phase images or to all the images together. It has been found that the application of PCA to the emissivity time series allows most of the details of interest to be visualized, as also found here with the third principal component of PCA analysis PCA3 image, see Figure 15. The presence of the canvas is under the painting in fact enhanced with respect to the standard time analysis of the emissivity images.
As a further investigation, the PCA images have been transformed from the grey scale to the YCbCr colour space [54]. This is due to the fact that the human eye has a different perception between a grey scale image and its coloured replica, thus this can help in highlighting areas having different thermal contrasts. Although the perception is inherently highly subjective by nature and further investigations are needed to confirm the validity of the proposed approach—including the possibility to submit a survey to several experts in the field—in our opinion, Figure 16, Figure 17 and Figure 18 show an enhanced perception of the abovementioned area of interests with respect to the same depicted in Figure 15.

4. Conclusions

Hypercolorimetric multispectral imaging (HMI) and pulse-compression thermography (PuCT) analysis have been successfully applied for the first time together on a detached wall painting, representing the Madonna and the Child enthroned between the angels and the Saints Jerome and Francis (AD 1490), attributed to the painter Antonio del Massaro known as Pastura (1450–1519). Traditional XRF spectroscopy through a portable instrument was also used to support and confirm the pigments and materials attribution.
The HMI supplied relevant information on surface and sub-surface layers in terms of possible pigment composition and distribution.
The PuCT output signatures of detachments, grouting, gilding from the surface to the deep layers giving relevant information on the possible presence of discontinuity or deep grouts. A colour space transformation from gray scale to YCbCr was found to be useful for highlighting the areas of interest.
Further processing of the acquired images will also be possible with the support of conservators that could address the choice of the most useful deepening to supply a valid aid to the intervention.

Author Contributions

Conceptualization, M.R., S.S., S.L., G.C., and C.P.; methodology, M.R., S.S., C.P., and S.L.; software, S.L., M.R., C.C., and L.L.; validation, S.L., M.R., and H.M.; formal analysis, S.L., M.R., L.L., C.C., and H.M.; investigation, M.R., S.L., L.L., C.C., and H.M.; resources, G.C., M.R., S.S., and C.P.; data curation, M.R., C.P., S.L., C.C., and H.M.; writing—original draft preparation, C.P. and M.R.; writing—review and editing, S.L., S.S., and H.M.; visualization, C.C., M.R., L.L., and S.L.; supervision, G.C. and M.R.; project administration, M.R. and G.C.; funding acquisition, M.R., S.S., G.C., and C.P. All authors have read and agreed to the published version of the manuscript.

Funding

This research received no external funding.

Institutional Review Board Statement

Not applicable.

Informed Consent Statement

Not applicable.

Data Availability Statement

The datasets used and/or analyzed during the current study are available from the corresponding author on a reasonable request.

Acknowledgments

The restoration and diagnostic activities were made possible thanks to the availability of the Municipality of Viterbo and the director of the Civic Museum of Viterbo, under the surveillance by the Superintendence of Archeology, Fine Arts, and Landscape for the metropolitan area of Rome, the Province of Viterbo and southern Etruria. The authors would like to thank the restorer Mark Gittins for the revision of the paper and English language, and Paola Pogliani for the suggestions about the interpretation of the painting technique. Lastly, the authors acknowledge fruitful discussions with Saverio Ricci about the history of the artwork inspected.

Conflicts of Interest

The authors declare no conflict of interest.

Abbreviations

HMIHypercolorimetric multispectral imaging
PuCTPulse-compression thermography
CHCultural Heritage
MSMultispectral
HSHyperspectral
UVUltraviolet
VISVisible
IRInfrared
TTRTerahertz time resolved
OCTOptical coherence tomography
IRTInfrared thermography
UVFUltraviolet fluorescence
LEDLight emitting diode
AWGArbitrary waveform generator
PCAPrincipal component analysis
SNRSignal-to-noise ratio
PuCPulse-compression
GUIGraphical user interface
IRFCInfrared false colour

References

  1. Mairinger, F. UV-, IR-and X-ray imaging. In Non-Destructive Microanalysis of Cultural Heritage Materials; Janssens, K., Van Grieken, R., Eds.; Elsevier Science: Amsterdam, The Netherlands, 2004; Volume XLII, pp. 15–73. [Google Scholar]
  2. Kubik, M. Hyperspectral imaging: A new technique for the non-invasive study of artworks. In Physical Techniques in the Study of Art, Archaeology and Cultural Heritage; Creagh, D., Bradley, D., Eds.; Elsevier: Amsterdam, The Netherlands, 2007; Volume 2, pp. 199–259. [Google Scholar]
  3. Aldrovandi, A.; Bertani, D.; Cetica, M.; Matteini, M.; Moles, A.; Poggi, P.; Tiano, P. Multispectral image processing of paintings. Stud. Conserv. 1988, 33, 154–159. [Google Scholar] [CrossRef]
  4. Saunders, D.; Billinge, R.; Cupitt, J.; Atkinson, N.; Liang, H. A new camera for high-resolution infrared imaging of works of art. Stud. Conserv. 2006, 51, 277–290. [Google Scholar] [CrossRef] [Green Version]
  5. Fischer, C.; Kakoulli, I. Multispectral and hyperspectral imaging technologies in conservation: Current research and potential applications. Stud. Conserv. 2006, 51, 3–16. [Google Scholar] [CrossRef]
  6. Delaney, J.K.; Zeibel, J.G.; Thoury, M.; Littleton, R.O.; Palmer, M.; Morales, K.M.; de La Rie, E.R.; Hoenigswald, A. Visible and infrared imaging spectroscopy of Picasso’s Harlequin musician: Mapping and identification of artist materials in situ. Appl. Spectrosc. 2010, 64, 584–594. [Google Scholar] [CrossRef] [PubMed]
  7. Adam, A.J.L.; Planken, P.C.M.; Meloni, S.; Dik, J. Terahertz imaging of hidden paint layers on canvas. Opt. Express 2009, 17, 3407–3416. [Google Scholar] [CrossRef] [Green Version]
  8. Fukunaga, K.; Picollo, M. Terahertz spectroscopy applied to the analysis of artists’ materials. Appl. Phys. A 2010, 100, 591–597. [Google Scholar] [CrossRef]
  9. Casini, A.; Bacci, M.; Cucci, C.; Lotti, F.; Porcinai, S.; Picollo, M.; Radicati, B.; Poggesi, M.; Stefani, L. Fiber optic reflectance spectroscopy and hyper-spectral image spectroscopy: Two integrated techniques for the study of the Madonna dei Fusi. In Proceedings of the Optical Methods for Arts and Archaeology, Munich, Germany, 13–17 June 2005. [Google Scholar]
  10. Elias, M.; Mas, N.; Cotte, P. Review of several optical non-destructive analyses of an easel painting. Complementarity and crosschecking of the results. J. Cult. Herit. 2011, 12, 335–345. [Google Scholar] [CrossRef]
  11. Luciani, G.; Pelosi, C.; Agresti, G.; Lo Monaco, A. How to reveal the invisible the fundamental role of diagnostics for religious painting investigation. Eur. J. Sci. Theol. 2019, 15, 209–220. [Google Scholar]
  12. Lanteri, L.; Agresti, G.; Pelosi, C. A new practical approach for 3D documentation in ultraviolet fluorescence and infrared reflectography of polychromatic sculptures as fundamental step in restoration. Heritage 2019, 2, 207–215. [Google Scholar] [CrossRef] [Green Version]
  13. Colantonio, C.; Pelosi, C.; D’Alessandro, L.; Sottile, S.; Calabrò, G.; Melis, M. Hypercolorimetric multispectral imaging system for cultural heritage diagnostics: An innovative study for copper painting examination. Eur. Phys. J. Plus 2018, 133, 526. [Google Scholar] [CrossRef]
  14. Pelosi, C.; Calienno, L.; Fodaro, D.; Borrelli, E.; Rubino, A.R.; Sforzini, L.; Lo Monaco, A. An integrated approach to the conservation of a wooden sculpture representing Saint Joseph by the workshop of Ignaz Günther (1727–1775): Analysis, laser cleaning and 3D documentation. J. Cult. Herit. 2016, 17, 114–122. [Google Scholar] [CrossRef]
  15. Lo Monaco, A.; Giagnacovo, C.; Falcucci, C.; Pelosi, C. The triptych of the Holy Saviour in the Tivoli Cathedral: Diagnosis, conservation and religious requirements. Eur. J. Sci. Theol. 2015, 11, 241–252. [Google Scholar]
  16. Pelosi, C.; Falcucci, C.; Ardagna, V. Investigation of a medieval illuminated manuscript through non-invasive techniques. Eur. J. Sci. Theol. 2017, 13, 61–68. [Google Scholar]
  17. Vetter, W.; Schreiner, M. Characterization of pigment binding media systems—Comparison of non invasive in situ reflection FTIR with transmission FTIR microscopy. e-Preservation Sci. 2011, 8, 10–22. [Google Scholar]
  18. Ricciardi, P.; Delaney, J.K.; Facini, M.; Zeibel, J.G.; Picollo, M.; Lomax, S.; Loew, M. Near infrared reflectance imaging spectroscopy to map paint binders in situ on illuminated manuscripts. Angew. Chem. Int. Ed. 2012, 51, 5607–5610. [Google Scholar] [CrossRef]
  19. Legrand, S.; Ricciardi, P.; Nodari, L.; Janssens, K. Non-invasive analysis of a 15th century illuminated manuscript fragment: Point-based vs imaging spectroscopy. Microchem. J. 2018, 138, 162–172. [Google Scholar] [CrossRef]
  20. Mancini, D.; Percot, A.; Bellot-Gurlet, L.; Colomban, P.; Carnazza, P. On-site contactless surface analysis of modern paintings from Galleria Nazionale (Rome) by Reflectance FTIR and Raman spectroscopies. Talanta 2021, 227, 122159. [Google Scholar] [CrossRef] [PubMed]
  21. Laureti, S.; Malekmohammadi, H.; Rizwan, M.K.; Burrascano, P.; Sfarra, S.; Mostacci, M.; Ricci, M. Looking through paintings by combining hyper-spectral imaging and pulse-compression thermography. Sensors 2019, 19, 4335. [Google Scholar] [CrossRef] [Green Version]
  22. Rosi, F.; Miliani, C.; Braun, R.; Harig, R.; Sali, D.; Brunetti, B.G.; Sgamellotti, A. Noninvasive analysis of paintings by mid-infrared hyperspectral imaging. Angew. Chem. Int. Ed. 2013, 52, 5258–5261. [Google Scholar] [CrossRef]
  23. Melis, M.; Miccoli, M.; Quarta, D. Multispectral hypercolorimetry and automatic guided pigment identification: Some masterpieces case studies. Proceedings Optics for Arts, Architecture, and Archaeology IV, Munich, Germany, 13–16 June 2013. [Google Scholar]
  24. Samadelli, M.; Melis, M.; Miccoli, M.; Vigl, E.E.; Zink, A.R. Complete mapping of the tattoos of the 5300-year-old Tyrolean Iceman. J. Cult. Herit. 2015, 16, 753–758. [Google Scholar] [CrossRef]
  25. Melis, M.; Miccoli, M. Trasformazione evoluzionistica di una fotocamera reflex digitale in un sofisticato strumento per misure fotometriche e colorimetriche. Proceedings Colore e Colorimetria contributi multidisciplinari, Firenze, Italy, 19–20 September 2013. [Google Scholar]
  26. Dong, J.; Locquet, A.; Melis, M.; Citrin, D.S. Global mapping of stratigraphy of an old-master painting using sparsity-based terahertz reflectometry. Sci. Rep. 2017, 7, 15098. [Google Scholar] [CrossRef] [PubMed] [Green Version]
  27. Alberghina, M.F.; Macchia, A.; Capizzi, P.; Schiavone, S.; Ruffolo, S.A.; Comite, V.; Barberio, M.; La Russa, M.F. Surface and volume non-invasive methods for the structural monitoring of the bass-relief ‘Madonna con Bambino’ (Gorizia, Northern Italy). Nat. Prod. Res. 2019, 33, 1034–1039. [Google Scholar] [CrossRef]
  28. Elkhuizen, W.S.; Callewaert, T.W.J.; Leonhardt, E.; Vandivere, A.; Song, Y.; Pont, S.C.; Geraedts, J.M.P.; Dik, J. Comparison of three 3D scanning techniques for paintings, as applied to Vermeer’s ‘Girl with a Pearl Earring’. Herit. Sci. 2019, 7, 1–22. [Google Scholar] [CrossRef]
  29. Zhang, H.; Sfarra, S.; Saluja, K.; Peeters, J.; Fleuret, J.; Duan, Y.; Fernandes, H.; Avdelidis, N.; Ibarra-Castanedo, C.; Maldague, X. Non-destructive investigation of paintings on canvas by continuous wave terahertz imaging and flash thermography. J. Nondestruct. Eval. 2017, 36, 34. [Google Scholar] [CrossRef] [Green Version]
  30. Maldague, X. Theory and Practice of Infrared Thermography for Nondestructive Testing; Wiley: Hoboken, NJ, USA, 2001. [Google Scholar]
  31. Bodnar, J.L.; Nicolas, J.L.; Candoré, J.C.; Detalle, V. Non-destructive testing by infrared thermography under random excitation and ARMA analysis. Int. J. Thermophys. 2012, 33, 2011–2015. [Google Scholar] [CrossRef]
  32. Silipigni, G.; Burrascano, P.; Hutchins, D.A.; Laureti, S.; Petrucci, R.; Senni, L.; Torre, L.; Ricci, M. Optimization of the pulse-compression technique applied to the infrared thermography nondestructive evaluation. NDT & E Int. 2017, 87, 100–110. [Google Scholar] [CrossRef]
  33. Laureti, S.; Sfarra, S.; Malekmohammadi, H.; Burrascano, P.; Hutchins, D.A.; Senni, L.; Silipigni, G.; Maldague, X.P.V.; Ricci, M. The use of pulse-compression thermography for detecting defects in paintings. NDT & E Int. 2018, 98, 147–154. [Google Scholar] [CrossRef] [Green Version]
  34. Sfarra, S.; Laureti, S.; Gargiulo, G.; Malekmohammadi, H.; Sangiovanni, M.A.; La Russa, M.; Burrascano, P.; Ricci, M. Low Thermal Conductivity Materials and Very Low Heat Power: A Demanding Challenge in the Detection of Flaws in Multi-Layer Wooden Cultural Heritage Objects Solved by Pulse-Compression Thermography Technique. Appl. Sci. 2020, 10, 4233. [Google Scholar] [CrossRef]
  35. Laureti, S.; Colantonio, C.; Burrascano, P.; Melis, M.; Calabrò, G.; Malekmohammadi, H.; Sfarra, S.; Ricci, M.; Pelosi, C. Development of integrated innovative techniques for paintings examination: The case studies of The Resurrection of Christ attributed to Andrea Mantegna and the Crucifixion of Viterbo attributed to Michelangelo’s workshop. J. Cult. Herit. 2019, 40, 1–16. [Google Scholar] [CrossRef]
  36. Gittins, M.; Agresti, G.; Catalano, M.I.; Pelosi, C.; Pogliani, P. La lunetta raffigurante Madonna con Bambino in trono tra gli angeli e i Santi Francesco e Girolamo staccato dal convento di Santa Maria del Paradiso per il Museo Civico di Viterbo: Fortuna dell’opera e storia conservativa alla luce dell’ultimo restauro (2016-2017). In Proceedings of the XV Congresso Nazionale IGIIC Lo Stato dell’Arte, Firenze, Italy, 12–14 October 2017. [Google Scholar]
  37. Ricci, C. Antonio da Viterbo detto il Pastura e l’Appartamento Borgia. Per l’inaugurazione del Museo Civico di Viterbo; Agnesotti: Viterbo, Italy, 1912; pp. 23–27. [Google Scholar]
  38. Zuccari, A. L’attività viterbese di Antonio del Massaro detto il Pastura. Il Quattrocento a Viterbo; Museo Civivo di Viterbo: Milano, Italy, 1983; pp. 222–239. [Google Scholar]
  39. Rinaldi, S. I dipinti del Museo Civico di Viterbo. Censimento conservativo in omaggio a Michele Cordaro; Ediart: Todi, Italy, 2004; p. 75. [Google Scholar]
  40. Pelosi, C.; Lanteri, L.; Agresti, G.; Santamaria, U. Documentation and Scientific Investigation on the “Crucifixion” by Balletta in the church of Santa Maria Nova in Viterbo (Italy). Conservation and Religious Requirements. Eur. J. Sci. Theol. 2016, 12, 271–281. [Google Scholar]
  41. Lanteri, L.; Agresti, G. Ultraviolet fluorescence 3D models for diagnostics of cultural heritage. Eur. J. Sci. Theol. 2017, 13, 35–40. [Google Scholar]
  42. Derrick, M.R.; Stulik, D.C.; Landry, J.M. Infrared spectroscopy in conservation science, 1st ed.; The Getty Conservation Institute: Los Angeles, CA, USA, 1999; Chapters 2–6. [Google Scholar]
  43. Meilunas, R.J.; Bentsen, J.G.; Steinberg, A. Analysis of aged paint binders by FTIR spectroscopy. Stud. Conserv. 1990, 35, 33–51. [Google Scholar] [CrossRef]
  44. Melis, M.; Babbi, A.; Miccoli, M. Development of a UV to IR extension to the standard colorimetry, based on a seven band modified DSLR camera to better characterize surfaces, tissues and fabrics. In Proceedings of the SPIE Optical Metrology, Optics for Arts Architecture, and Archaeology III, Munich, Germany, 23–26 May 2011. [Google Scholar]
  45. Bro, R.; Smilde, A.K. Principal component analysis. Anal. Methods 2014, 6, 2812–2831. [Google Scholar] [CrossRef] [Green Version]
  46. Pelosi, C.; Capobianco, G.; Agresti, G.; Bonifazi, G.; Morresi, F.; Rossi, S.; Santamaria, U.; Serranti, S. A methodological approach to study the stability of selected watercolours for painting reintegration, through reflectance spectrophotometry, Fourier transform infrared spectroscopy and hyperspectral imaging. Spectroch. Acta A 2018, 198, 92–106. [Google Scholar] [CrossRef] [PubMed]
  47. Lau, D.; Villis, C.; Furman, S.; Livett, M. Multispectral and hyperspectral image analysis of elemental and micro-Raman maps of cross-sections from a 16th century painting. Anal. Chim. Acta 2008, 610, 15–24. [Google Scholar] [CrossRef] [PubMed]
  48. Cosentino, A. Infrared technical photography for art examination. e-Preserv. Sci. 2016, 13, 1–6. [Google Scholar]
  49. Cosentino, A. Identification of pigments by multispectral imaging; a flowchart method. Herit. Sci. 2014, 2, 8. [Google Scholar] [CrossRef] [Green Version]
  50. Cosentino, A. Effects of different binders on technical photography and reflectrography of 54 historical pigments. Int. J. Conserv. Sci. 2015, 6, 287–298. [Google Scholar]
  51. Cavallo, G. Alteration of azurite into paratacamite at the St. Alessandro church (Lasnigo, Italy). Conserv. Patrim. 2009, 9, 5–11. [Google Scholar] [CrossRef] [Green Version]
  52. Sandu, I.C.; Afonso, L.U.; Murta, E.; de Sa, M.H. Gilding techniques in religious art between east and west, 14th–18th centuries. Int. J. Conserv. Sci. 2010, 1, 47–62. [Google Scholar]
  53. Seccaroni, C.; Moioli, P. Prontuario per L’analisi XRF Portatile Applicata a Superfici Policrome, 1st ed.; Nardini Editore: Firenze, Italy, 2002; p. 69. [Google Scholar]
  54. Liu, C.; van Netten, J.J.; Van Baal, J.G.; Bus, S.A.; van Der Heijden, F. Automatic detection of diabetic foot complications with infrared thermography by asymmetric analysis. J. Biomed. Opt. 2015, 20, 026003. [Google Scholar] [CrossRef] [PubMed] [Green Version]
Figure 1. Schematic of the employed techniques, obtained output, and employed approaches.
Coatings 11 00546 g001
Figure 2. The calibrated visible image of the lunette with Madonna and the Child enthroned in between the angels and the Saints Jerome and Francis (AD 1490; 136 cm × 200 cm), attributed to the painter Antonio del Massaro known as Pastura (1450–1519). The colour checker and the white patches used for the calibration are also shown in the scene.
Coatings 11 00546 g002
Figure 3. PuCT experimental setup: (1) Thermal camera; (2) rectangular plastic frame, which houses two LED chips per side; (3) tripod; (4) inspected wall painting lunette.
Coatings 11 00546 g003
Figure 4. HMI infrared calibrated image at 850 nm (IR2) highlighting the preparatory drawing in the garments of the Saints, the angels, the Virgin, and the lion near Saint Jerome.
Coatings 11 00546 g004
Figure 5. A zoom of the imaging obtained by IR2, showing the scroll outlines.
Coatings 11 00546 g005
Figure 6. PCA applied to IR1-IR2-IR3 calibrated images showing an extended amount of micro-cracking in correspondence to the Virgin’s face and neck.
Coatings 11 00546 g006
Figure 7. Spectral similarities tool applied to an area onto the arm of the Virgin garment and on the Angel’s dress. High similarity is found both in terms of reflectance values and of colour coordinates, as can be seen on the right-half of the figure: Here, the values of spectral reflectance (%) for the two investigated micro areas (blue and pink small circles on the visible image on the left) are reported for the seven spectral bins, together with a graphical representation of the colorimetric CIE L*a*b values in CIE 1931 xy chromaticity space, and a normalized difference of the two spectral curves (blue and pink lines) in the bands zoom of the imaging obtained by IR2, showing original outlines of the Virgin’s vest drapery, later hidden by restoration.
Coatings 11 00546 g007
Figure 8. Infrared false colour image (IRFC) obtained through PickViewer®.
Coatings 11 00546 g008
Figure 9. Detail of IRFC image showing the blue portion of the probable unaltered azurite in the background sky behind the Virgin’s head.
Coatings 11 00546 g009
Figure 10. Multispectral similarity mapping of azurite: The top-left shows the visible image as for the HMI software interface PickViewer®; the area used as a reference for the spectral reflectance is enhanced by a white spot, near the Virgin’s head. The outcome of the spectral similarity processing is shown in (a) and magnified in (b).
Coatings 11 00546 g010aCoatings 11 00546 g010b
Figure 11. PuCT emissivity image obtained at t = 1 s.
Coatings 11 00546 g011
Figure 12. PuCT emissivity image obtained at t = 7 s.
Coatings 11 00546 g012
Figure 13. PuCT emissivity images at different times representing the Virgin’s face and cloak closure. Darker areas correspond to warmer zones.
Coatings 11 00546 g013
Figure 14. PuCT Hilbert image obtained at t = 2.5.
Coatings 11 00546 g014
Figure 15. Third PCA image retrieved by the PuCT emissivity time series image.
Coatings 11 00546 g015
Figure 16. False-colour PuCT—YCbCr colour space at t = 1 s PCA image retrieved by the PuCT emissivity time series image.
Coatings 11 00546 g016
Figure 17. False-colour PuCT—YCbCr colour space at t = 3 s PCA image retrieved by the PuCT emissivity time series image.
Coatings 11 00546 g017
Figure 18. False-colour PuCT—YCbCr colour space at t = 4 s PCA image retrieved by the PuCT emissivity time series image.
Coatings 11 00546 g018
Table 1. Details of references [3,4,5,6,7,8,9,10,11,12,13,14,15,16,17,18,19,20].
Ref.AuthorsTitle and YearInvestigated SamplesEmployed TechniquesMain Findings
3Aldrovandi, A. et al.“Multispectral Image Processing Of Paintings”, 1988.Test panel;
Tempera painting.
Reflectographic apparatus (0.7–1 µm), equipped with an image processor.Demonstrating the discrimination of both pigments and overpainting via multispectral imaging.
4Saunders, D. et al.“A New Camera for High-Resolution Infrared Imaging of Works of Art”, 2006.Underdrawings test chart; “The Adoration of the Name of Jesus” by El Greco; “The Virgin and Child with Saints Jerome and Francis” by Perugino.Scanning Infrared Imaging System (SIRIS), 0.9–1.7 µm.A modified camera based on a commercially available 320 × 256 pixel InGaAs was realised, and its capability to scan quickly large painted areas demonstrated.
5Fischer, C., Kakoulli, I.“Multispectral and hyperspectral imaging technologies in conservation: Current research and potential applications”, 2006.Review Paper.Review Paper on multispectral imaging.A literature review concerning the application of multispectral and hyperspectral imaging for the study and conservation of artworks (from visible to mid infrared (up to 15 µm)).
6Delaney, J. K. et al.“Visible and Infrared Imaging Spectroscopy of Picasso’s Harlequin Musician: Mapping and Identification of Artist Materials in Situ”, 2010.“Harlequin Musician” by Pablo Picasso.Hyperspectral cameras (0.441–1.680 µm); Luminescence imaging spectroscopy; X-Ray fluorescence spectrometry; Polarized light microscopy; scanning electron microscopy-energy dispersive spectrometry.Primary colorants can be successfully identified and mapped using Hyperspectral cameras covering the ShortWave InfraRed (SWIR) spectrum and luminescence imaging spectroscopy.
7Adam, A. J. L. et al.“TeraHertz imaging of hidden paint layers on canvas”, 2009.Test specimens.Terahertz imaging; X-rays; SIRIS system.Terahertz time resolved reflectography can image hidden painting layers and measures their optical thickness.
8Fukunaga, K., Piccolo, M. et al.“Terahertz spectroscopy applied to the analysis of artists’ materials”, 2010.Test specimens.Fourier Transform-based Terahertz systems.Building an online database containing (to date) >1500 spectra of different artists’ materials, in both transmission and reflection mode
9Casini, A. et al.“Fiber optic reflectance spectroscopy and hyper-spectral image spectroscopy: Two integrated techniques for the study of the Madonna dei Fusi”, 2005.“Madonna of the Yarnwinder”(Lansdowne), attributed to Leonardo da Vinci.Fiber optics reflectance spectroscopy; image spectroscopy.A good match with several other non-invasive techniques applied on the same painting was found in terms of pigments, preparatory layer, and binding medium’ identification.
10Elias, M. et al.“Review of several optical non-destructive analyses of an easel painting. Complementarity and crosschecking of the results”, 2011.“Portrait of lady” by Franz Strotszberg.Multispectral imaging; optical coherence tomography; goniophometry; UV-fluorescence emission spectroscopy; diffuse reflectance spectroscopy.Results from the different techniques are shown to be complementary to each other—their crosschecking leads to an in-depth understanding of the painting.
11Luciani, G. et al.“How to reveal the invisible the fundamental role of diagnostics for religious painting investigation”, 2019.Panel painting from a private collection.Video microscope; infrared reflectography; UV fluorescence photography, X-ray fluorescence spectroscopy; radiography.The combined use of these techniques revealed a preserved painting hidden by the landscape representation.
12Lanteri, L. et al.“A New Practical Approach for 3D Documentation in Ultraviolet Fluorescence and Infrared Reflectography of Polychromatic Sculptures as Fundamental Step in Restoration”, 2019.A 17th century reliquary bust representing St. Rodonio.Modified Nikon D5300 SLR camera and a modified digital camera Samsung NX3300 for UV fluorescence and infrared photography.Generating a 3D model of the inspected sample, containing UV and infrared information.
13Colantonio, C. et al.“Hypercolorimetric multispectral imaging system for cultural heritage diagnostics: An innovative study for copper painting examination,” 2018.A 17th century oil painting, originally positioned in S. Giuliano monastery in L’Aquila, Italy.Hypercolorimetric Multispectral Imaging
(0.3–1 µm).
A degradation map of the paintings’ layers has been produced, representing a potential decision-making tool for the conservators.
14Pelosi, C. et al.“An integrated approach to the conservation of a wooden sculpture representing Saint Joseph by the workshop of Ignaz Günther: Analysis, laser cleaning, and 3D documentation”, 2016.An 18th century wooden sculpture representing Saint Joseph by the workshop of Ignaz Günther.Optical microscopy; micro-Raman; Fourier transform infrared (FTIR) spectrometry.The techniques have been used to inspect the painting and monitor the laser cleaning procedure applied onto the wooden surface.
15Lo Monaco, A. et al.“The triptych of the Holy Saviour in the Tivoli Cathedral: Diagnosis, conservation, and religious requirements”, 2015.“Holy Saviour” panel painting in Tivoli’s Cathedral, Rome, Italy (12th century).Video microscope; infrared reflectography; false colour infrared photography; X-ray fluorescence spectroscopy.The use of valuable materials and pigments such as gold, vermilion, ultramarine blue has been shown. The analyses allowed the dating of the panel painting.
16Pelosi, C. et al.“Investigation of a medieval illuminated manuscript through non-invasive techniques”, 2017.The so-called ‘Saint Thomas’ Bible, stored in “Ardenti Library”, Viterbo, Italy (13th century).X-ray fluorescence spectroscopy; visible reflectance spectrophotometry; infrared reflectography; false colour infrared and ultraviolet fluorescence digital photography; video microscope acquisitions.Pigments have been identified as well as possible non-original interventions on the Bible.
17Vetter, W., Schreiner, M.“characterization of pigment-binding media systems—comparison of non-invasive in situ reflection ftir with transmission ftir microscopy”, 2011.Test samples;
two paintings on paper “Heute verliebt, morgen betrübt” and an untitled one, both by Franz West.
Reflection FTIR spectroscopy; FTIR microscope.Most of the pigments have been succesfully identified with a reflection FTIR device, which is portable and it can be used in situ, and the results validated with FTIR microscope.
18Ricciardi, P. et al.“Near infrared reflectance imaging spectroscopy to map paint binders in situ on illuminated manuscripts”, 2012.A 15th century illuminated manuscript leaf on parchment representing the “Praying Prophet” by Lorenzo Monaco.Hyperspectral near infrared imaging spectrometer (1.0–2.5 µm); FTIR; fiber optic spectroradiometer; gas chromatography/mass spectrometry.An unexpected use of egg yolk tempera was found.
19Legrand, S. et al.“Non-invasive analysis of a 15th century illuminated manuscript fragment: Point-based vs. imaging spectroscopy”, 2018.Don Silvestro dei Gherarducci, “St Clement in a historiated initial D”, dated within 1370–1375, The Fitzwilliam Museum, Cambridge, UK.Macroscopic X-Ray fluorescence. macroscopic reflection mode (FTIR) scanning.Identification of different lead compounds and gildings, in a total non-invasive way.
20Mancini, D. et al.“On-site contactless surface analysis of Modern paintings from Galleria Nazionale (Rome) by Reflectance FTIR and Raman spectroscopies”, 2021.Seven artworks by J. Albers, A. Bonalumi, L. Boille, T. Scialoja, and M. Schifano, Galleria Nazionale di Arte Moderna, Rome, Italy.Specular Reflectance Infrared Spectroscopy; Raman spectroscopy (SR-FTIR).Acrylic, vinylic, oil media, and enamal paints have been succesfully identified with SR-FTIR, with or without opacifiers.
Table 2. Points of XRF analysis, detected elements with the relative amounts on the base of counts derived from the experimental spectra and pigments that could consequently be hypothesized.
Point and ColourDetected ElementsHypothesized Pigments on the Base of XRF Data
X1—Blue of the Virgin garmentCu (main), Ca, Fe, SrCopper based pigment, probably azurite, red ochre
X2—Green of the Virgin mantleCu (main), Ca, Fe, Sr, PbCopper based green, probably malachite, red ochre
X3—White of the Virgin jewelCa (main), Fe, Sr, Cu (tr)Ca white
X4—Yellow of the Virgin jewelCa (main), Fe, Au, Pb, SrGold on missione with siccative Pb-based pigments
X5—Blue of the background near the Virgin headCu (main), Fe, Ca, Sr (tr), Pb (tr)Copper based pigment, probably azurite, red ochre
X6—Yellow of the angel armCa (main), Fe, SrYellow ochre
X7—Gold yellow of angel jewelCa, Fe, Au, Pb, SrGold on missione with siccative Pb- and Fe-based pigments
X8—Red of angel garmentCa (main), Fe, SrRed ochre
X9—Dark red, “morellone”, of the Virgin garmentFe (main), Ca, SrFe-based pigment, probably morellone
X10—Child cheekCa (main), Fe, SrCa white and red ochre
X11—Gold yellow of the Child haloCa (main), Fe, Sr, Au, Pb, Mn (tr)Gold on missione with siccative Pb- and Fe-based pigments
X12—Red background at the bottom rightCa, Fe, Cu, SrCopper based pigment on red ochre
X13—Green background at the bottom rightCu, Ca, Fe, As, Cl, SrRetouching area (Emerald green)
X14—Blue background at the bottom rightCu (main), Ca, Fe, SrCopper based pigment on red ochre
X15—Dark brown of St. Francis habitCa, Fe, Mn, Sr, BrUmber pigment due to the presence of Mn
Publisher’s Note: MDPI stays neutral with regard to jurisdictional claims in published maps and institutional affiliations.

