Article

Effects of Oxygen Partial Pressure on Wood-Based Activated Carbon Treated with Vacuum Ultraviolet Light

1
Department of Electronic and Physical Systems, Waseda University, Shinjuku 169-8555, Japan
2
Research Organization for Nano and Life Innovation, Waseda University, 513 Waseda Tsurumaki, Shinjuku 162-0041, Japan
3
Organization for Regional Collaborative Research and Development, Tokyo University of Science, Chino, Nagano 391-0292, Japan
*
Author to whom correspondence should be addressed.
Coatings 2021, 11(4), 411; https://doi.org/10.3390/coatings11040411
Submission received: 15 March 2021 / Revised: 29 March 2021 / Accepted: 30 March 2021 / Published: 1 April 2021
(This article belongs to the Section Surface Characterization, Deposition and Modification)

Abstract

:
This study uses vacuum ultraviolet (VUV) light with a wavelength of 172 nm as a surface treatment to enhance the adsorption capacity of wood-based activated carbon (AC). The AC surface treatment is performed under three O2 partial pressure conditions—5.0 × 10⁴ Pa, where ozone (O3) effects dominate; 6.3 × 10⁻⁶ Pa, where VUV effects dominate; and 1.9 × 10³ Pa for a balanced condition. For the O3-dominant condition, only graphene edge defects are etched (no aromatic carbon bonds are etched), resulting in increased surface roughness. When the VUV effects dominate, aromatic carbon bonds are cleaved, which then reacted with O2 or water adsorbed inside the pores. This increased both the number and size of the mesopores. Under the balanced conditions, the water adsorption capacity was enhanced by 45.5%, which is higher than that obtained before VUV exposure or with VUV under other conditions. This is because the surface roughness increased, as well as the pore sizes and numbers under the balanced condition. These results indicate that we can control VUV-based AC surface treatments via O2 partial pressure.

1. Introduction

Activated carbon (AC) has high surface areas and adsorption capacities because of oxygen functional groups on the surfaces of micro- and mesoporous structures [1,2]. The porous properties of AC are widely used for water purification, gas filtering, and gas adsorption [3,4,5,6]. In addition, the electrical conductivity of the sp2 carbons enables other potential applications, such as electrodes for electronic and electrochemical devices [7] and double-layer capacitors [8].
The AC structure derives from the nature of the precursor materials, which could be chemical products (coal, polymers), or natural products (palm shells, crops, wood) [9,10]. Natural-material-based AC is renewable, abundant, and has natural pores [11]. It requires a binder to form shapes, which can degrade the properties by filling the pores and also degrade the electrical conductivity [6]. Previously, we developed a thin binder-less wood-based AC, a film of woody carbon material (FWCM), that has natural pore structures. It originated from Picea jezoensis (Jezo Spruce) and had an electrical conductivity of 3 × 10⁻² S/m [8]. FWCM has a unique physical characteristic (thinness, flexibility), although the adsorption characteristic is inferior to chemical products-based AC as same as other wood-based AC. Thus, surface treatment to improve adsorption characteristics is required for wood-based AC.
After the AC structure is formed, oxygen functional groups on the surfaces are created by various treatments to improve its adsorption capacity. There are two major treatment methods. One is a wet treatment that uses acid solutions [9,10,11,12,13,14]; the other is a dry treatment that uses a plasma [15,16] or high-energy light, such as ultraviolet (UV) [17,18]. In the wet treatment, the acid solution consists of HNO3 or H2O2 to form oxygen functional groups via strong oxidation reactions on the outer and inner AC surfaces [19]. However, these solutions generate hazardous wastes and can disrupt the pore structures [13]. In dry treatments, O2 gas is used. Only the outer AC surface is gently oxidized, and oxygen functional groups are created by excited oxygen atoms O (1D) or ozone (O3) generated by electrical plasmas or UV light. Thus, dry treatments retain pore structures while introducing oxygen functional groups on the surfaces [13]. Vacuum ultraviolet (VUV) surface treatments, such as those that use 172-nm Xe2* excimer lamps (698 kJ/mol), utilize much higher energy than those that use 254-nm UV light from a mercury lamp (472 kJ/mol). In a 172-nm VUV treatment, the light is strongly absorbed by O2, generating high densities of O3, which is hardly dissociated by the VUV [20]. In addition, the VUV directly cleaves chemical bonds, such as O–H (458 kJ/mol) and C=C (589 kJ/mol), which are difficult to break via UV light. We previously reported a VUV treatment of FWCM under an O2 partial pressure of 5.0 × 10⁴ Pa [8], which enhanced the iodine adsorption capacity by 21.2%. However, the effects of the VUV treatment were a tradeoff between O3 and VUV effects, depending on the O2 partial pressure. Hence, the effect of the O2 partial pressure on the AC treatment had not been clarified.
Here, we examined the O2 effects on the VUV treatment of AC. The FWCM was, thus, treated at several O2 partial pressures: 5.0 × 10⁴ Pa, where activated oxygen (O3) effects dominate, 1.9 × 10³ Pa where the VUV effects dominate, and 6.3 × 10⁻⁶ Pa for a balanced condition. The mechanisms are discussed in terms of chemical and physical characteristics, including water adsorption.

2. Experiments

2.1. Materials

The FWCM was prepared from raw wood (Picea jezoensis) purchased from the Durart Company (Saitama, Japan). It was carbonized at 300 °C for six hours to form a film without cracks, then heated to 750 °C for 30 min to enhance the adsorption capacity by improving the porous structure [8]. The FMCM was sliced along the tracheid into 100-μm-thick pieces.

2.2. VUV Treatment

VUV treatment was performed with a 172-nm Xe2* excimer lamp (UER20-172, Ushio, Japan) [8]. The samples were placed in a treatment chamber, and the O2 partial pressure was introduced. The sample was then irradiated with VUV light for ten minutes, after which the chamber was purged with N2 gas. The sample was then irradiated with VUV for 10 min with the irradiance of 10 mW/cm2 at room temperature, after which the chamber was purged with N2 gas. The distance between the light source and the samples was 1.3 cm [8]. The size and thickness of the samples were not changed before and after the treatment.
For each of the conditions (O3-dominant, direct VUV-dominant, and balanced), the three different O2 partial pressures were calculated using the following Equation (1) [20]:
I =   I 0   × exp (   α P O 2 L )
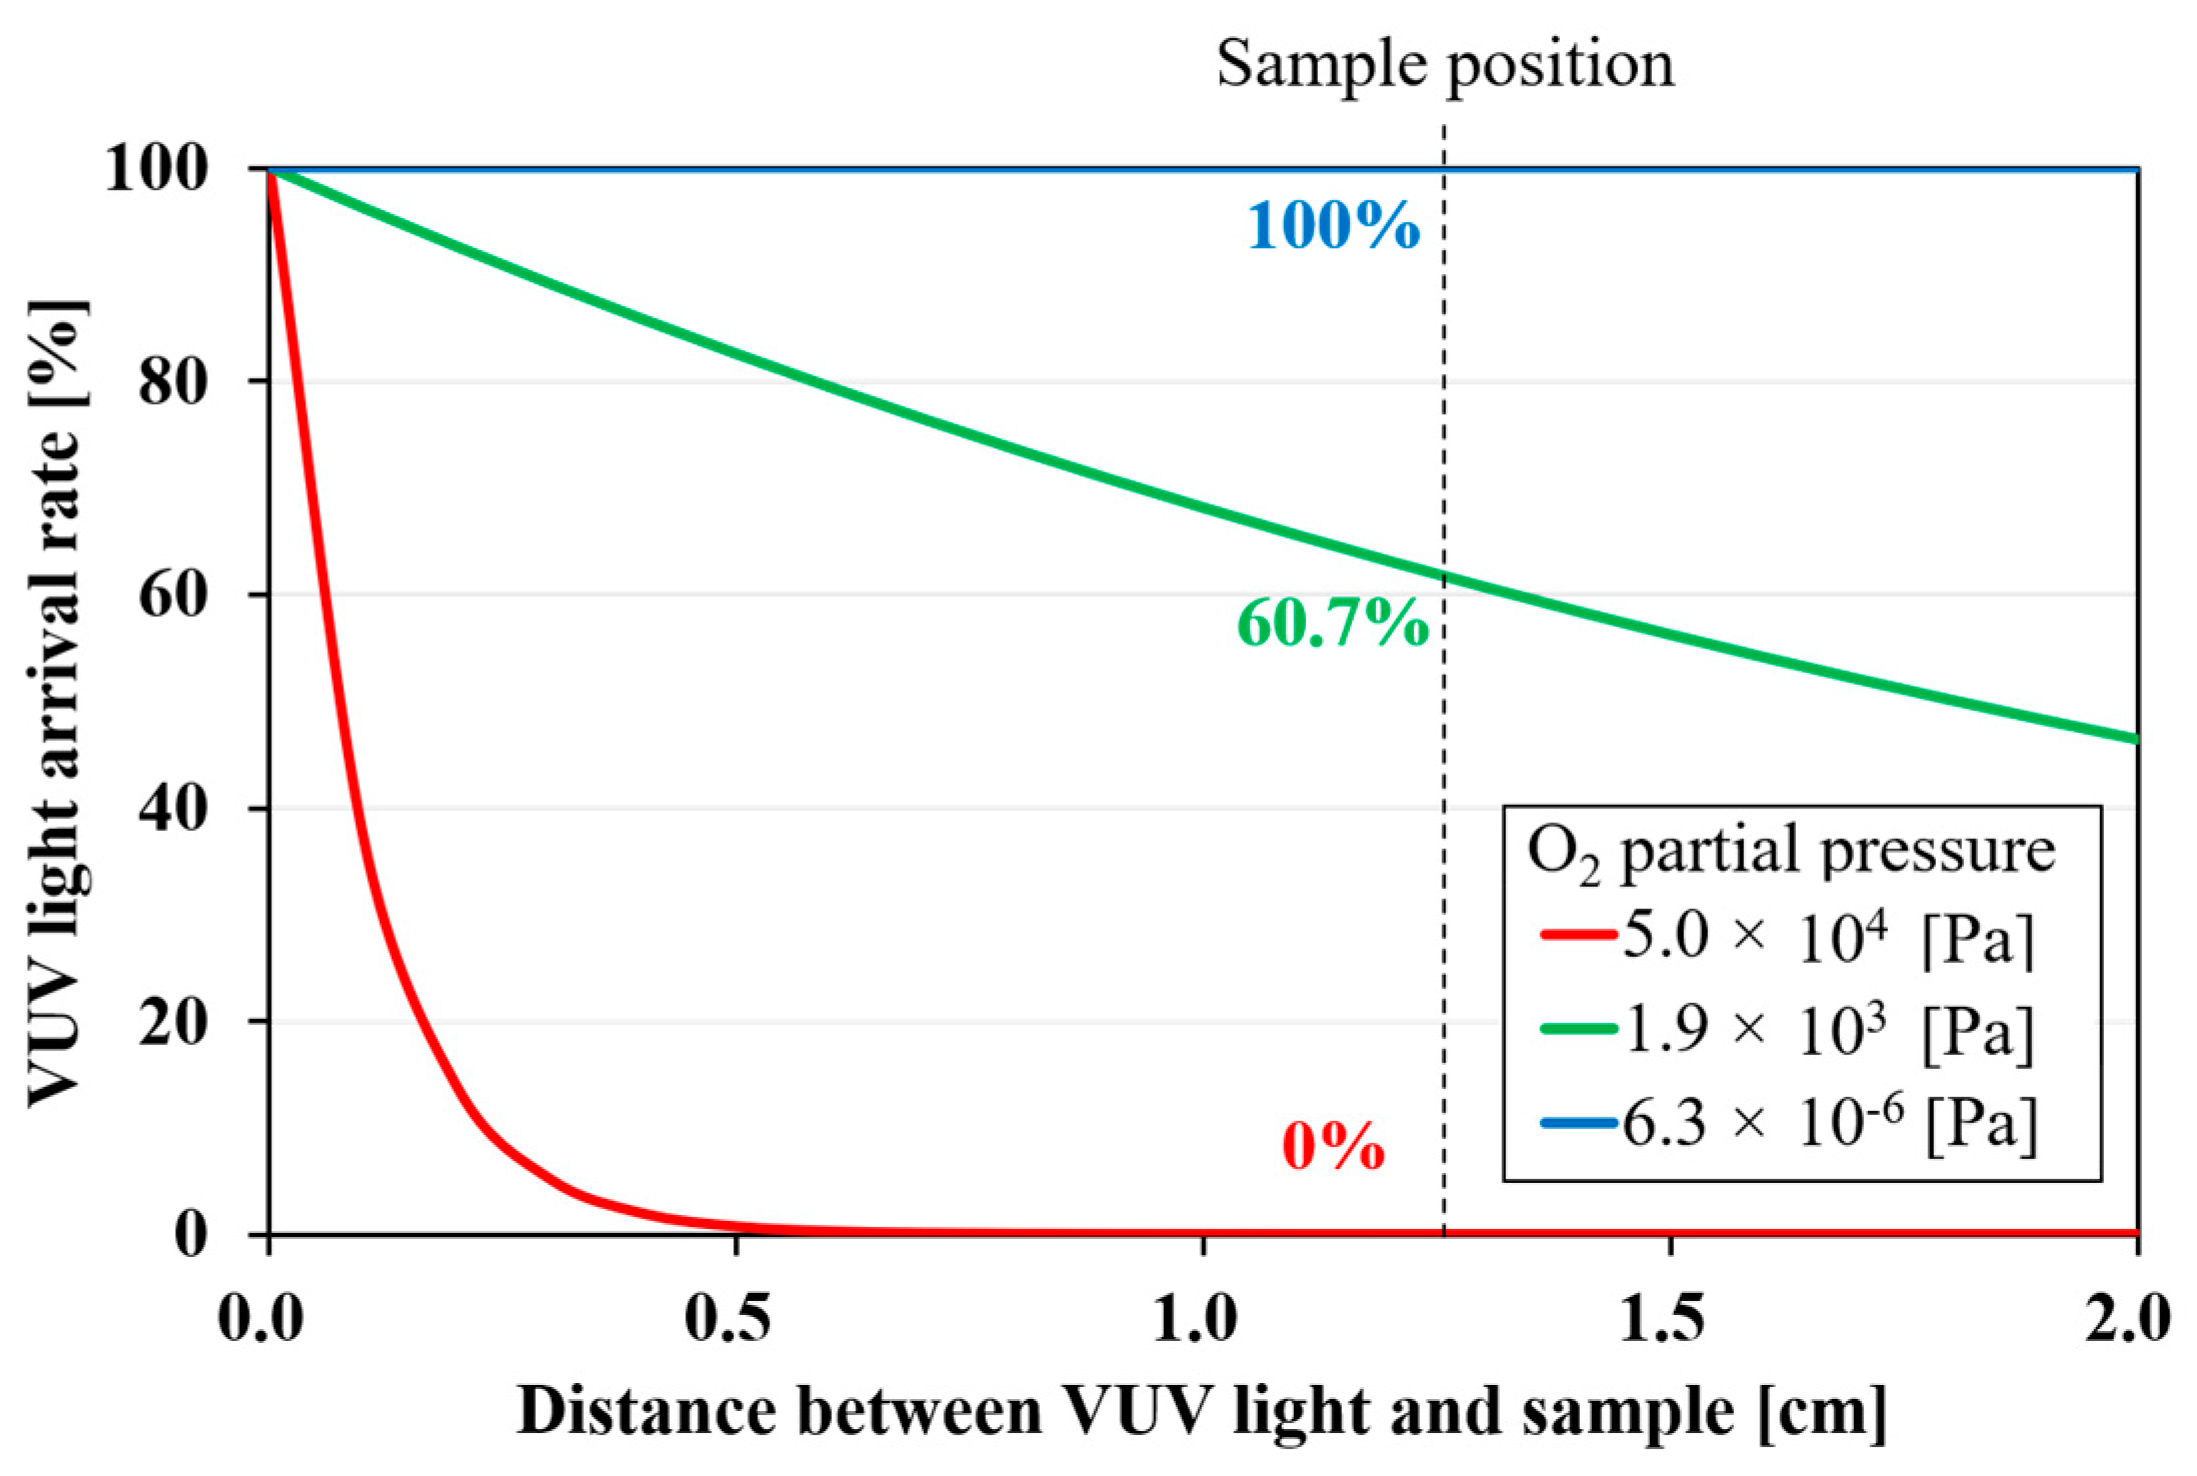
where I 0 is the light intensity from the VUV source, I is the VUV intensity on the sample surface, α is the VUV absorption efficiency of O2, P O 2 is the O2 partial pressure, and L is the distance from the light source to the sample (for details, see Figure A1 in the Appendix A). We determined the following three conditions: High P O 2 (5.0 × 10⁴ Pa), where 100% of the light energy was used for O3 generation; low P O 2 (6.3 × 10⁻⁶ Pa), where 0% of the light energy directly reached the sample surface, and median P O 2 (1.9 × 10³ Pa), where 60.7% of the light energy was used for O3 generation, and 39.3% directly reached the sample surface.

2.3. Characterizations

2.3.1. Chemical Analysis

X-ray photoelectron spectroscopy (XPS, JPS-9100 TR, Tokyo, Japan) was used to examine the oxygen content and functional groups on the FWCM surfaces. The spectra were obtained using Mg Kα (1253.6 eV) radiation. The C1s electron binding energy was calibrated at 284.0 eV. The accelerating voltage and current were 10 kV and 10 mA, respectively, and the pass energy was 10 eV. The spectra were analyzed with a Gaussian-Lorentzian function in curve-fitting software (SpecSurf 1.92). A mixing ratio of 0.7 was used for all peaks.

2.3.2. Physical Analysis

The surface morphologies of the samples were imaged with a scanning electron microscope (SEM; S-5500 and SU-8200, Hitachi High technologies, Tokyo, Japan). No conductive coatings were used, and the images were acquired rapidly to minimize damage by the electron beam.
Specific surface areas and pore volumes were calculated from CO2 gas adsorption using a Microtraek-MRB (Belsorp-HP, MicrotracBEL, Osaka, Japan). N2 gas was not used because it cannot diffuse into the interior of carbon materials that have complex pore structures, such as the hierarchical structure of woody carbon [21]. Conversely, CO2 can easily adsorb on the pore structures because of its large quadrupole moment [21]. The sample (about 0.2 g) was ground into a powder and degassed at 473 K for 20 h to remove water and other atmospheric contaminants. The micropore size distribution was analyzed based on Horvath-Kawazoe (HK) method. Specific surface areas and micropore volumes were derived from CO2 adsorption isotherms using standard Brunauer-Emmett-Teller analysis [21].

2.3.3. Water Adsorption

Water adsorption experiments were performed at room temperature to evaluate the adsorption capacity of untreated and treated FWCM. As a reference, commercial silica-gel desiccant was also evaluated. All samples were placed in a 20% relative-humidity environment for 24 h after degassing at 170 °C for 6 h. It is well known that sulfuric acid solution controls relative humidity according to the concentration, since it is hygroscopic [22]. The relative-humidity was controlled by using aqueous solution system that offers a degree of humidity adjustment that can be achieved by changing its concentration [22]. To keep relative-humidity at 20%, 58.9 wt.% H2SO4 solution was placed in the chamber. The adsorption rate ( A ) was calculated according to:
A = W W 0 W 0   × 100
where W and W 0 are the initial and the final sample weights, respectively.

3. Results and Discussions

3.1. Chemical Properties

XPS analysis was conducted with respect to oxygen content and functional groups to examine the chemical effects on the FWCM from the VUV treatments. Table 1 lists the atomic ratios of carbon and oxygen (O/C) from the C1s and O1s spectra. The O/C ratio for untreated FWCM was 4.6%, while those for the high P O 2 , median P O 2 , and low P O 2 conditions were 26.6%, 27.8%, and 24.8%, respectively. The oxygen content was, thus, significantly enhanced after all the VUV treatments, especially for the high and median P O 2 . Figure 1 shows C1s spectra for the FWCMs. For all the prepared samples, the C1s spectra could be resolved into three component peaks for C=C/C–C (284.2 eV), C=O/C–O (284.9–285.3 eV), and O–C=O (287.0–288.1 eV) [8]. The relative content of each group is listed in Table 2. The C=C/C–C group is attributed to an aromatic ring layer, which is the main AC component [23]. After the VUV treatments, the C=C/C–C groups decreased, and oxygen functional groups increased. Furthermore, the C=O/C–O groups exhibited higher peak areas than the O–C=O groups after the high P O 2 treatment. In contrast, the O–C=O groups increased by a factor of two, compared with values before the VUV treatments, after median and low P O 2 , while the C=O/C–O groups decreased.
Differences in the oxygen functional groups after various VUV conditions were observed. Although O3 is the main reactant when FWCM is treated with VUV and high P O 2 , graphene is difficult to oxidize [24]. Thus, the O3 only reacts with H atoms at graphene edge defects [25,26], generating C–O groups. The C–O addition reaction is the dominant pathway relative to the O–C=O generation reaction during the oxidation of carbon chains at room temperature [27]. However, the VUV generates radical sites by cleaving graphene bonds (518 kJ/mol) [28,29], and those sites can react with O2 and H2O adsorbed in the pores. Thus, the O=C–O groups increase by the progression of the oxidation reaction at low P O 2 .

3.2. Physical Properties

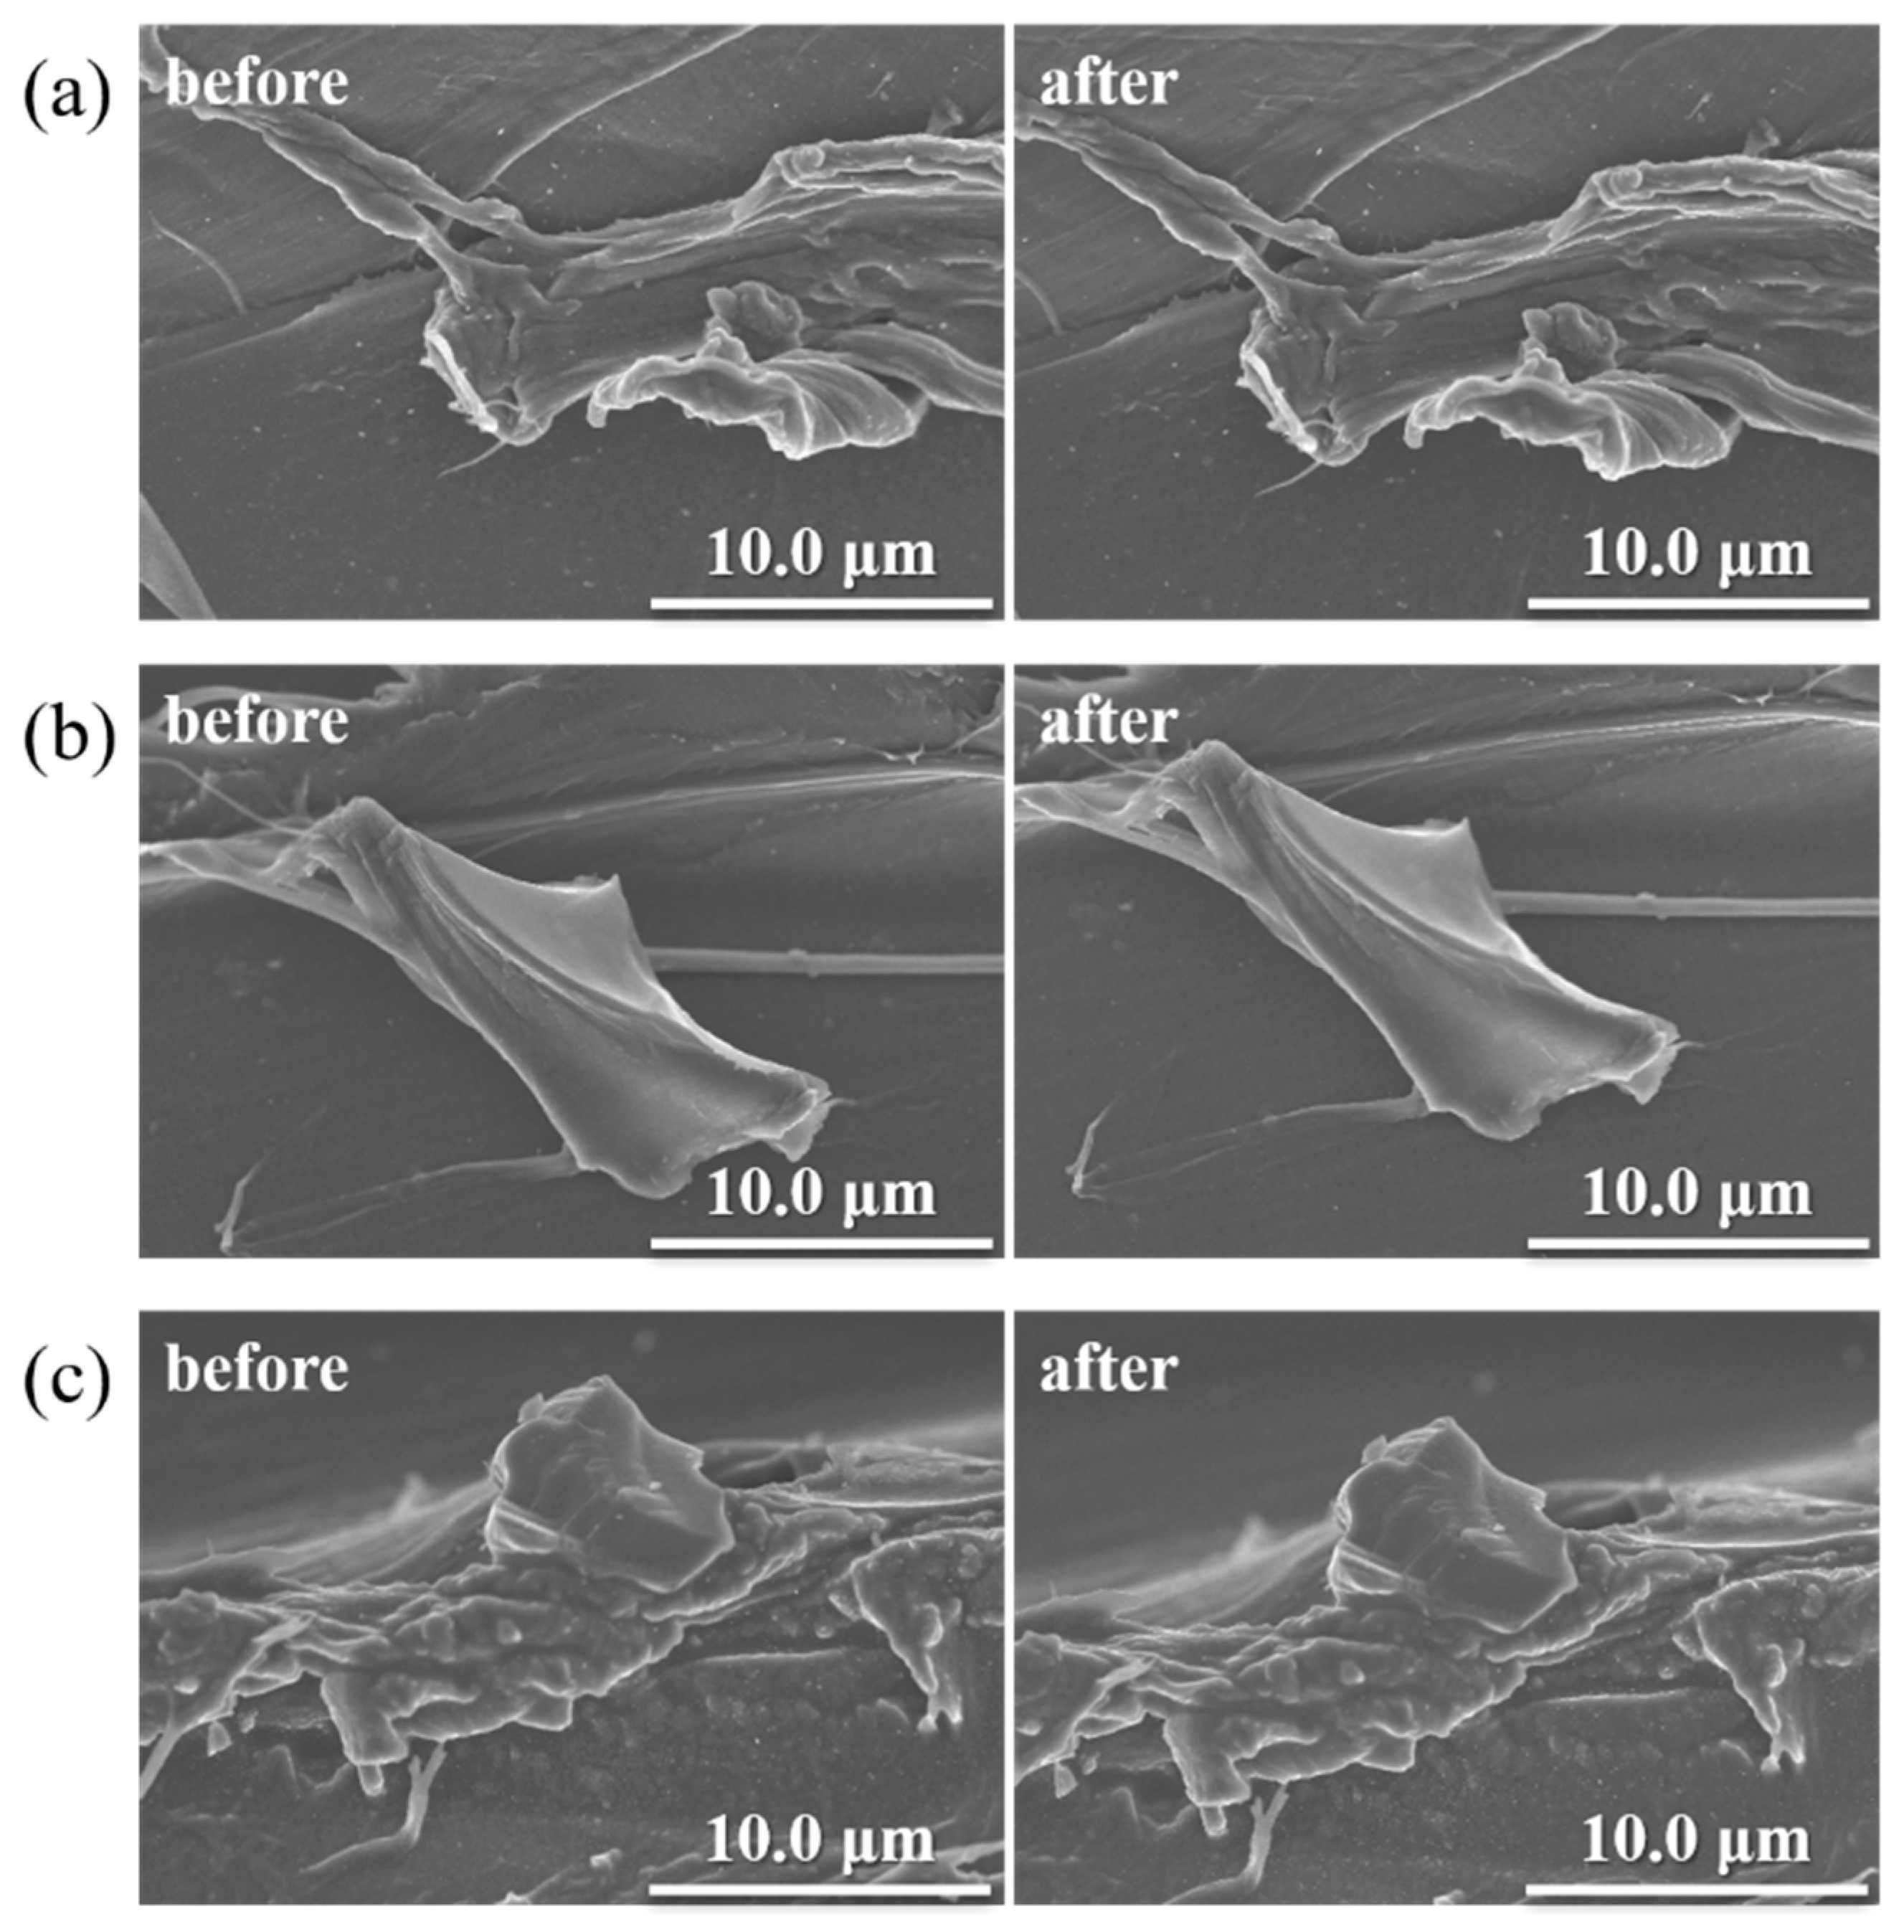
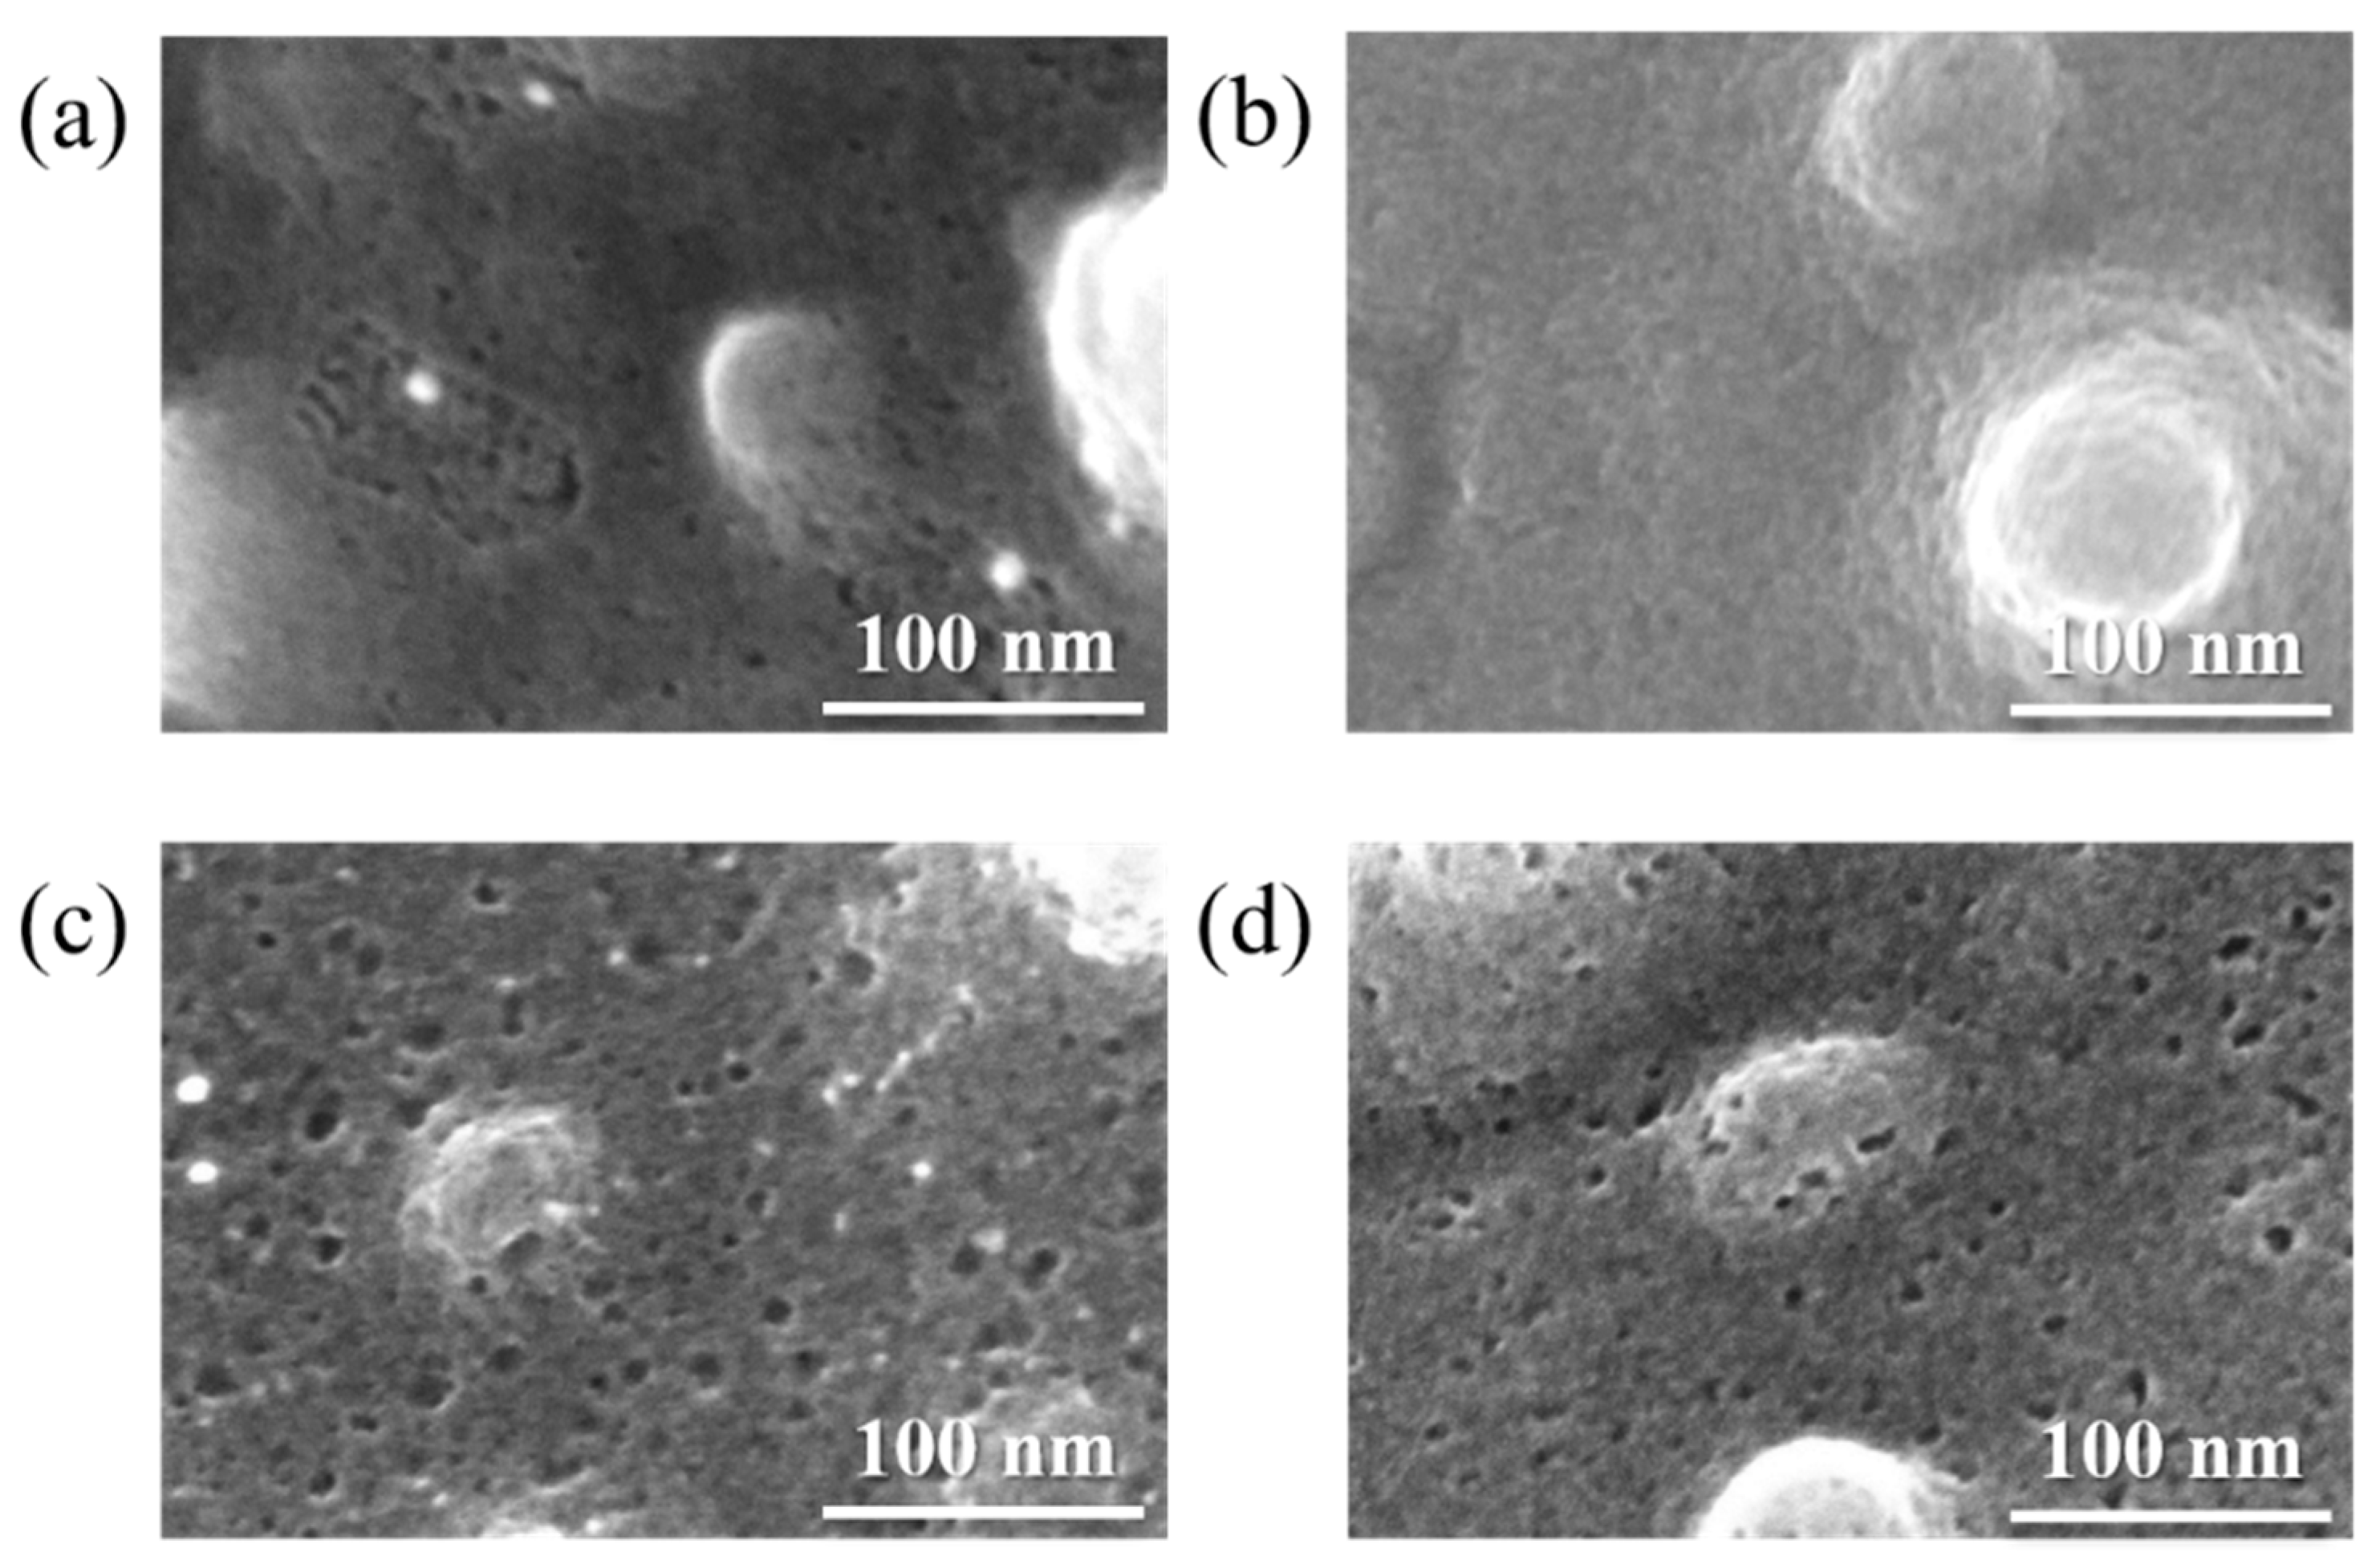
Figure 2 shows SEM images of FWCM surfaces before and after VUV treatment. Large pieces of debris were observed that originated from the natural wood, and there were no significant differences before and after the treatment. Thus, as with plasma treatments, the VUV does not affect the AC macro structures [15,16]. Figure 3 shows high-magnification SEM images of FWCMs. A smooth surface with mesopores was observed for the untreated FWCM [Figure 3a]. The pores were either naturally derived from the wood or generated during carbonization. After a high P O 2 treatment, the mesopores were disappeared on the surface, and the surface roughness increased [Figure 3b], which was consistent with previous reports [8]. In contrast, after a low P O 2 treatment, the mesopore size grew to over 10 nm, and the number of pores increased [Figure 3c]. After a median P O 2 treatment, the pores enlarged and increased in number compared with a high P O 2 treatment, and the surface roughness increased as well compared with low P O 2 treatment [Figure 3d].
During the VUV treatment, the AC surface is modified by O3 or the VUV, depending on the O2 partial pressure. At high P O 2 , the high density of generated O3 etched only the graphene edges, as discussed in the XPS results, which increased the surface roughness. At low P O 2 , the VUV cleaved carbon bonds and generated radical sites that reacted with adsorbed O2 or H2O in the meso- and micropores. Thus, the number and the size of the mesopores increased at low P O 2 . At median P O 2 , some VUV is absorbed by the O2, and some reaches the sample surface. Thus, both surface roughness and the increased mesopore size and number occurred simultaneously. Overall, these results indicate that VUV can control the AC surface roughness and pore density/number only by changing the O2 partial pressure.
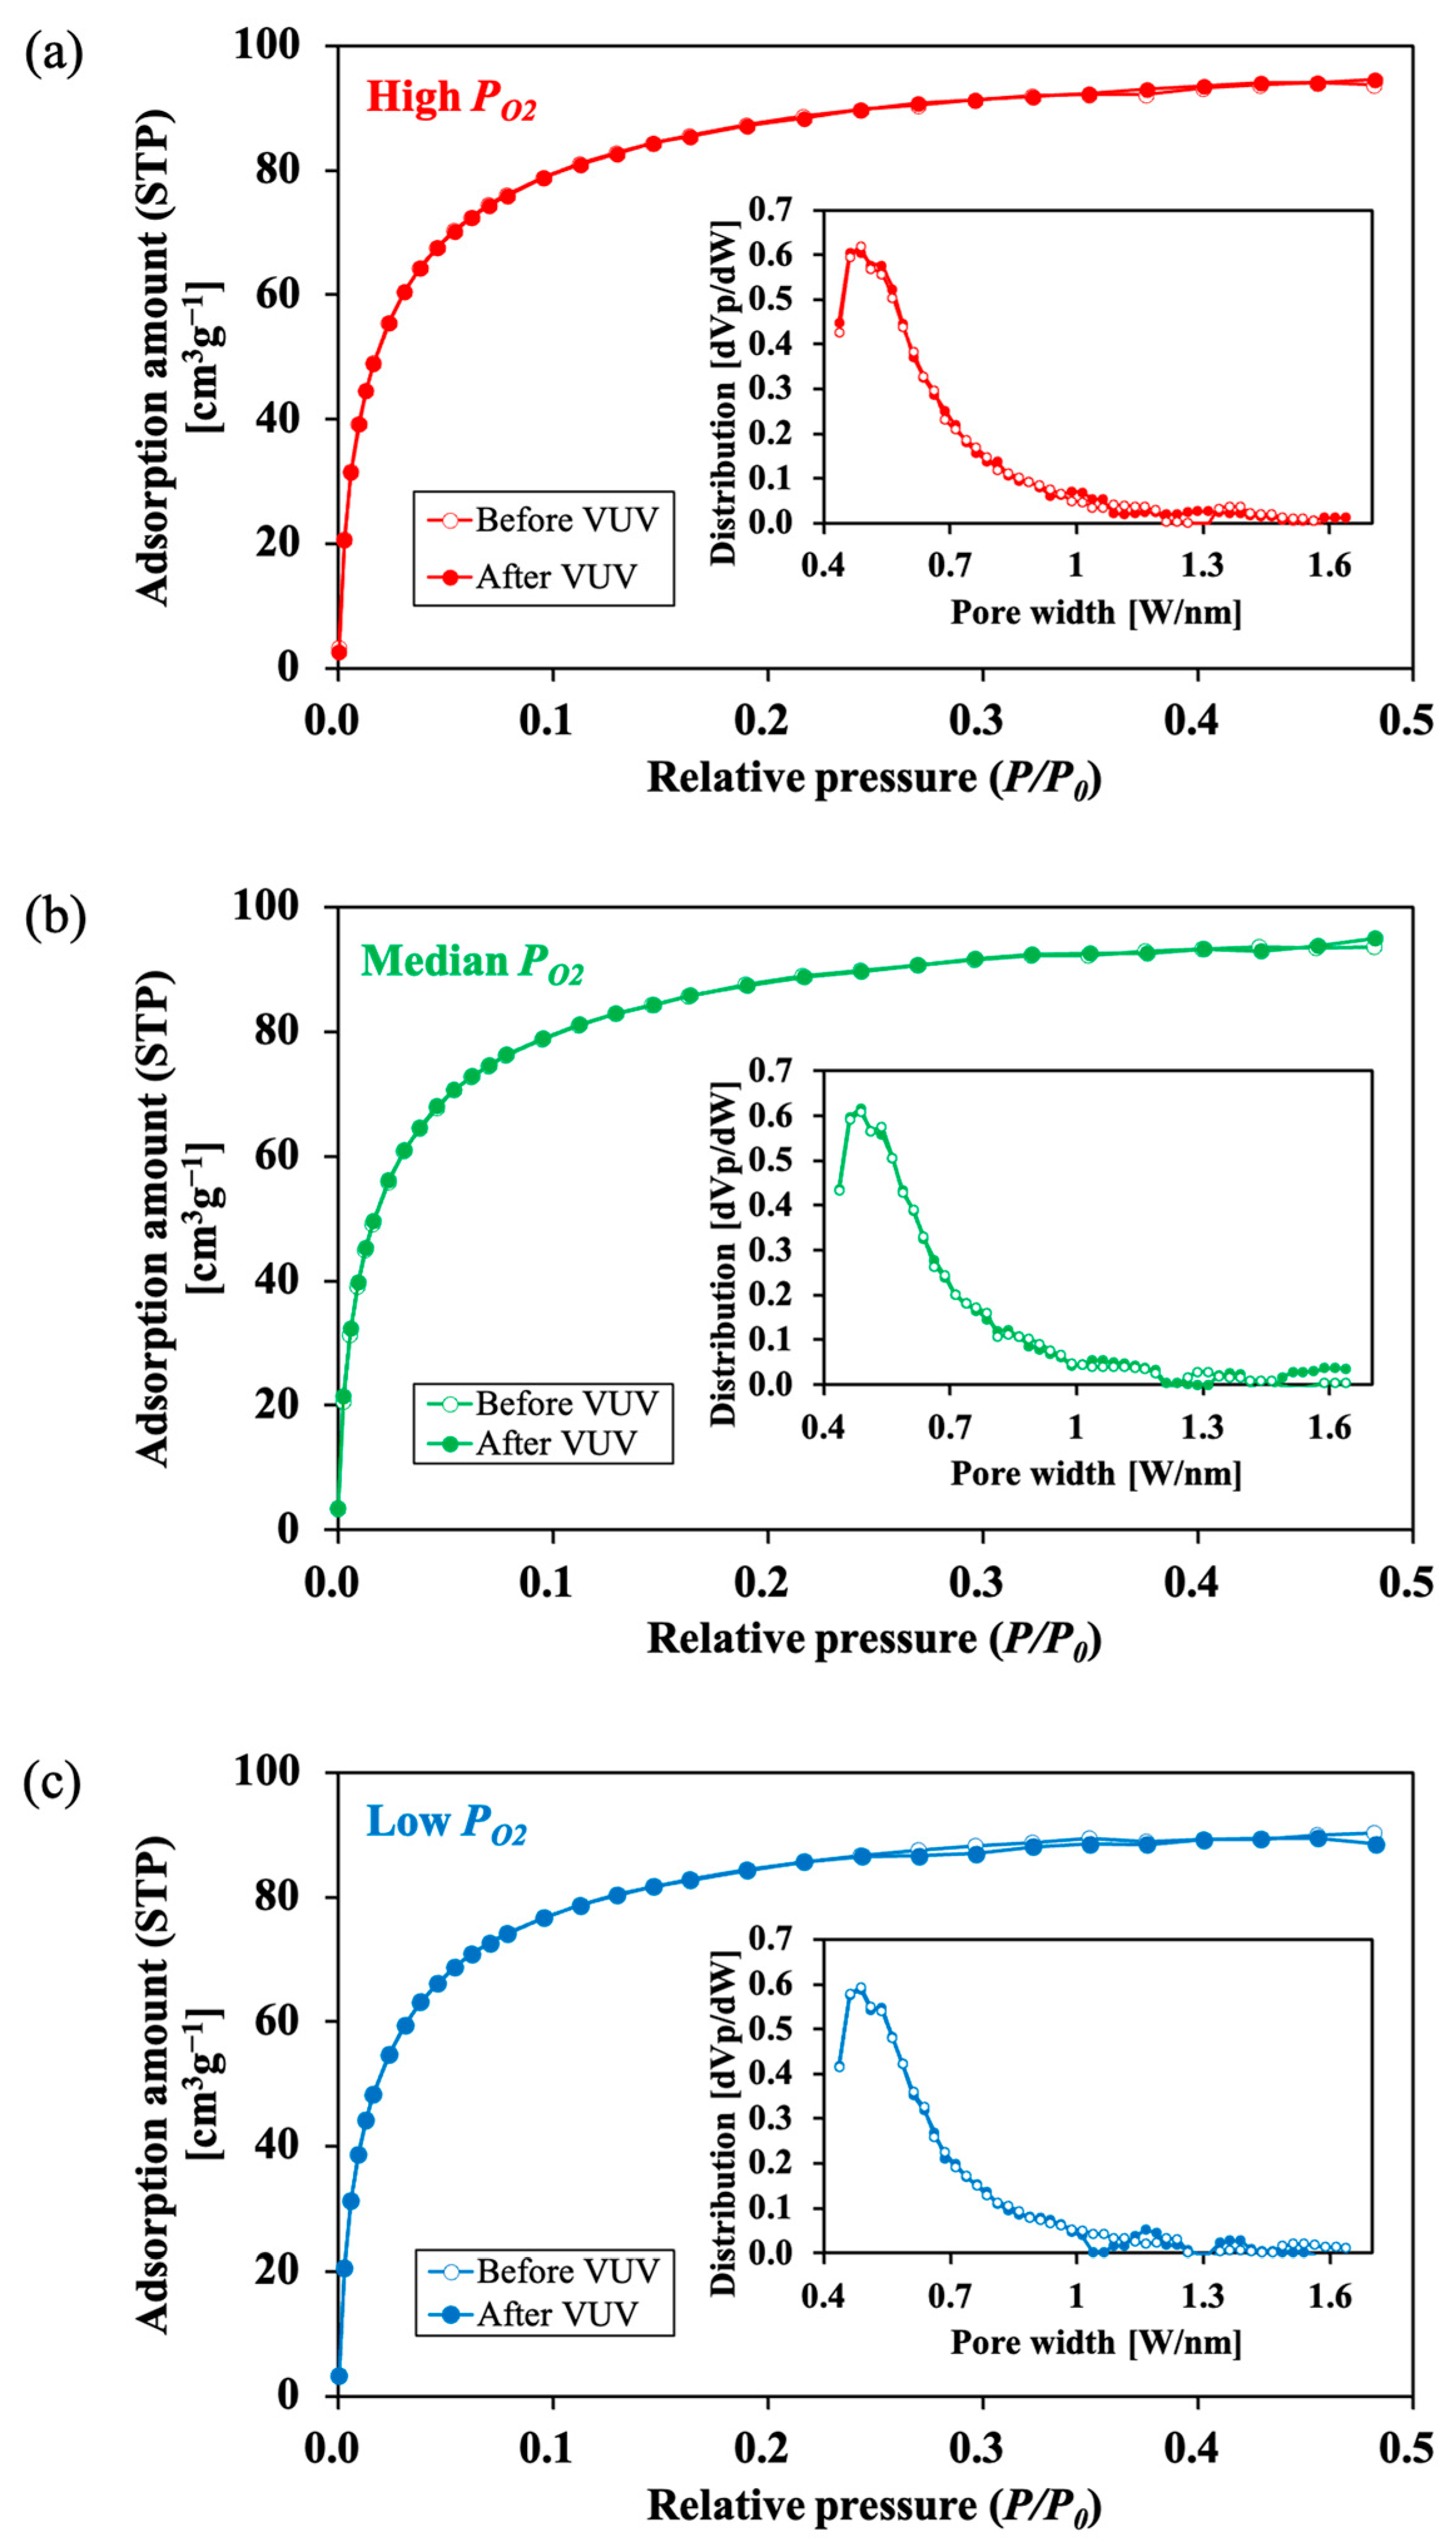
CO2 adsorption isotherms for FWCMs, ranging 0–0.48 relative pressure ( P / P 0 ), and pore size distribution analyzed from the adsorption isotherm are shown in Figure 4. The adsorption amount increased dramatically at P / P O between 0–0.1, and then saturated. This result indicated that micropores existed in the FWCMs and were successfully evaluated in this experiment [21]. There is no significant change between before and after the treatment. The specific surface areas and pore volumes of the micropores in the samples are summarized in Table 3. The average specific surface area of untreated FWCMs was 450 m2/g, which was larger than that in a previous study (216 m2/g) [8]. As noted above, N2 adsorption in the previous study did not reach an equilibrium state at 77 K because of the complex porous structure of natural woody carbon. The specific surface area and micropore volume at low P O 2 were slightly lower, while the other samples were unchanged. Note that the actual surface area was larger than the measured value because the formation of oxygen functional groups in the micropores affected CO2 adsorption [30]. The micropores grew into mesopores at low P O 2 , resulting in a decrease in micropores, as discussed in the SEM section. We thought that the VUV effect occurs only at the outermost sample surface, and the effect might be covered by the results of inner part of the samples; thus, the rate of change was limited. In our future work, we plan to check the physical changes using other AC, such as powder-type AC, to clarify the change.

3.3. Water Vapor Adsorption Characteristic

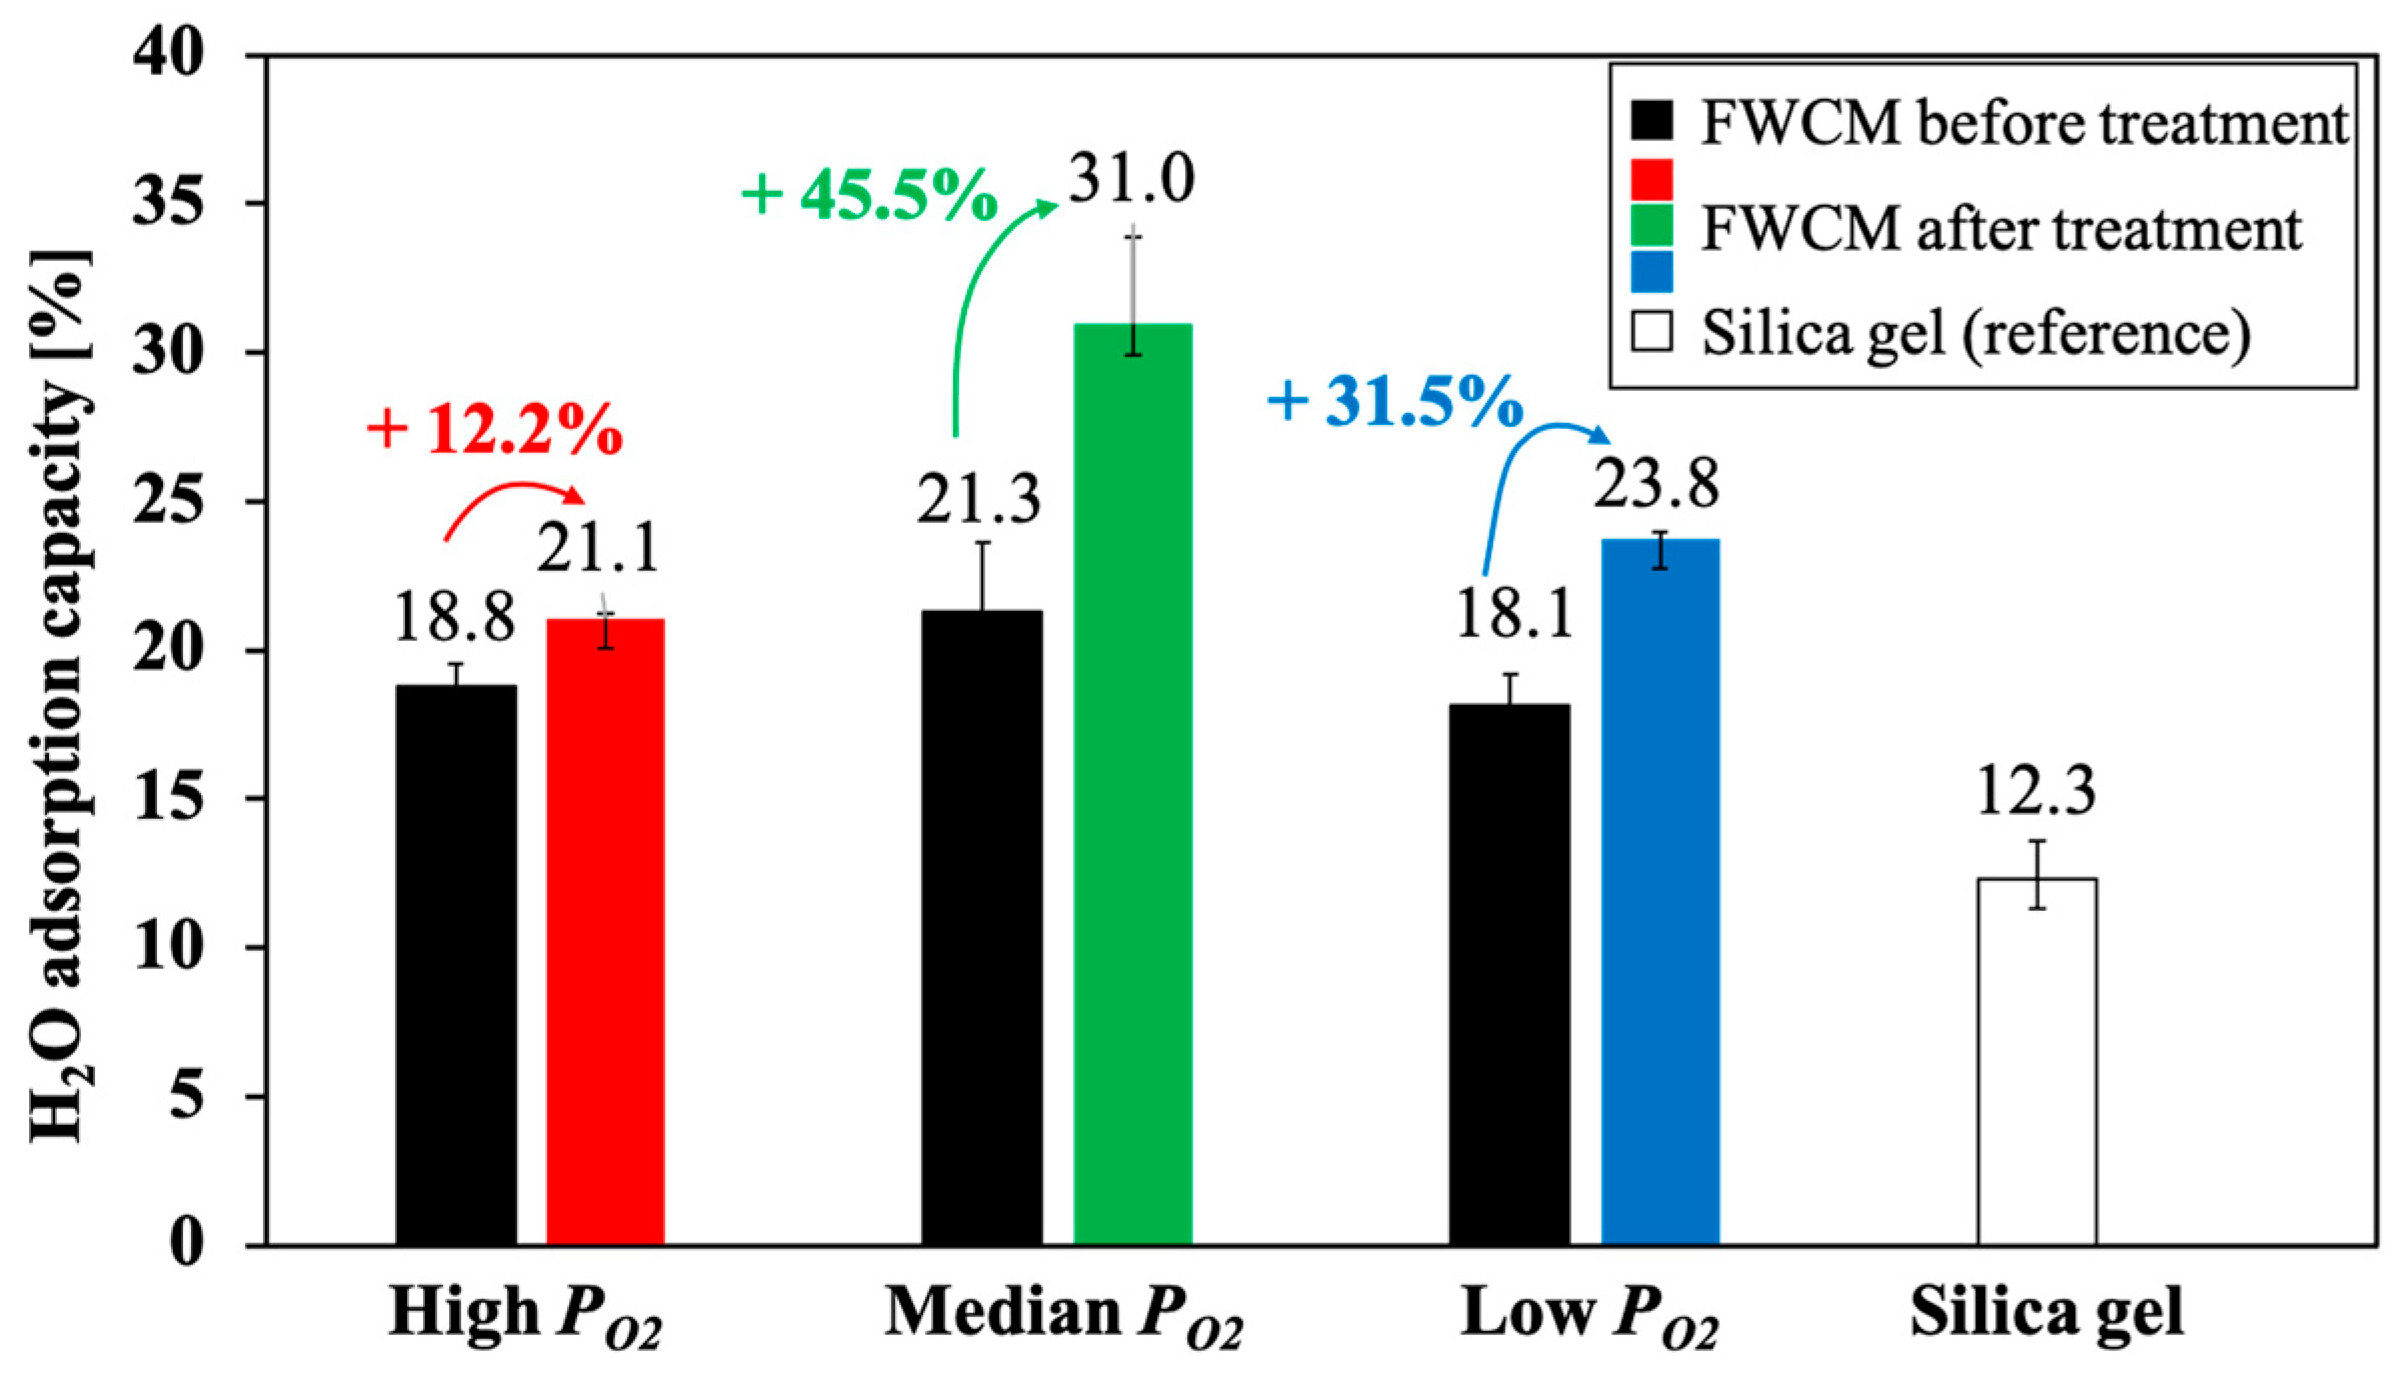
Figure 5 shows the water adsorption capacities of untreated and treated FWCMs; silica-gel desiccant is used for reference. The adsorption rate of the silica-gel and the average rate of the untreated FWCMs were 12.3% and 19.4%, respectively. Thus, the adsorption rates of untreated FWCMs were higher than that of silica gel. Moreover, the adsorption rate greatly increased after VUV treatments. In particular, the rate increased by 45.5% after the median P O 2 treatment, which was more than 1.4 times those following high P O 2 (12.2%) or low P O 2 (31.5%). We assumed that VUV treatment has the following effects on water adsorption capability: (i) Increment of surface oxygen functional group enhance the hydrophilicity of surface, and (ii) surface physical changes improve the specific surface area that is an important factor for water adsorption [21]. The specific surface at the outermost sample surface was increased by improving surface roughness caused by O3 effect in the high P O 2 treatment, and increasing the number of mesopores caused by the VUV light effect in the low P O 2 treatment. In addition, the FWCM surface after the median P O 2 treatment exhibited both an O3 effect, as for the high P O 2 , and a VUV effect, as for the low P O 2 . Hence, the VUV can increase the water adsorption capacity of the AC with an optimized O2 partial pressure.

4. Conclusions

We studied O2 effects on the VUV treatment of AC by using three different O2 partial pressures that changed the generated O3/VUV light ratio. The chemical and physical effects of VUV on FWCM were characterized. Our results reveal that the chemical reaction sites on the AC changed with the O2 partial pressure. The reaction sites increased the surface roughness at high P O 2 , and increased the mesopore sizes and numbers at low P O 2 . The VUV at the median P O 2 significantly improved the water adsorption capacity (45.5%), because both the roughness and the pore sizes and number increased. These results indicate that pore properties of wood-based AC can be controlled by VUV with an optimal O2 partial pressure for a wide range of applications.

Author Contributions

H.K. and S.M. conceived the idea and designed the experiments; N.T., H.K., and S.M. carried out the experiments; N.T. and H.K. wrote the manuscript; H.K., S.M., M.K., A.T., S.S. and J.M. revised the manuscript. All authors have read and agreed to the published version of the manuscript.

Funding

This research received no external funding.

Acknowledgments

The authors would like to acknowledge Sato (Durart Company, Saitama, Japan), Mizokami (Nippon API Corporation, Tokyo, Japan), and MEXT Nanotechnology Platform Support Project (Waseda University, Tokyo, Japan) for their support. We thank Alan Burns, from the Edanz Group for editing a draft of this manuscript.

Conflicts of Interest

The authors declare no competing interests.

Appendix A

Appendix AFigure A1 shows vacuum ultraviolet (VUV) light arrival rate in different O2 partial pressures used in this study. Arrival rate of VUV light is calculated by following Equation (A1) [20];
I =   I 0   × exp (   α P O 2 L )
where I 0 is the light intensity from the VUV source, I is the VUV intensity on the sample surface, α is the VUV absorption efficiency of O2, P O 2 is the O2 partial pressure, and L is the distance from the light source to the sample. We calculated α as 2.0 × 10⁻⁵ Pa−1mm−1 [20] and L as 1.3 cm [8] for this calculation. When P O 2 is 6.3 × 10⁻⁶ Pa (low P O 2 condition), almost 100% of VUV light arrives to the sample surface, meaning VUV light energy directly reacts with the sample. On the other hand, when P O 2 is 5.0 × 10⁴ Pa (high P O 2 condition), VUV light almost absorbed by O2 and hardly reaches the sample (3.1 × 10⁻⁴%), meaning VUV light energy is used to generate O3 that react with the sample. When P O 2 is 1.9 × 10³ Pa (median P O 2 condition), 60.7% of VUV light arrives to the sample, meaning both VUV light effect and O3 effect occurred.
Figure A1. Calculation results of vacuum ultraviolet (172-nm) light arrival rate.
Coatings 11 00411 g0a1

References

  1. Ismadji, S.; Sudaryanto, Y.; Hartono, S.B.; Setiawan, L.E.K.; Ayucitra, A.J.B.T. Activated carbon from char obtained from vacuum pyrolysis of teak sawdust: Pore structure development and characterization. Bioresour. Technol. 2005, 96, 1364–1369. [Google Scholar] [CrossRef] [PubMed]
  2. Hu, Z.; Srinivasan, M.P.; Ni, Y. Preparation of mesoporous high-surface-area activated carbon. Adv. Mater. 2000, 12, 62–65. [Google Scholar] [CrossRef]
  3. Dias, J.M.; Alvim-Ferraz, M.C.; Almeida, M.F.; Rivera-Utrilla, J.; Sánchez-Polo, M. Waste materials for activated carbon preparation and its use in aqueous-phase treatment: A review. J. Environ. Manag. 2007, 85, 833–846. [Google Scholar] [CrossRef] [PubMed]
  4. Bhatnagar, A.; Hogland, W.; Marques, M.; Sillanpää, M. An overview of the modification methods of activated carbon for its water treatment applications. Chem. Eng. J. 2013, 219, 499–511. [Google Scholar] [CrossRef]
  5. De Jonge, R.J.; Breure, A.M.; van Andel, J.G. Bioregeneration of powdered activated carbon (PAC) loaded with aromatic compounds. Water Res. 1996, 30, 875–882. [Google Scholar] [CrossRef]
  6. Inomata, K.; Kanazawa, K.; Urabe, Y.; Hosono, H.; Araki, T. Natural gas storage in activated carbon pellets without a binder. Carbon 2002, 40, 87–93. [Google Scholar] [CrossRef]
  7. Maeda, S.; Kuwae, H.; Sakamoto, K.; Shoji, S.; Mizuno, J. Water-Electrokinetic Power Generation Device Using Flexible Woody Carbon Film. In 2019 IEEE 32nd International Conference on Micro Electro Electro Mechanical Systems (MEMS); IEEE: Seoul, Korea, January 2019; pp. 233–236. [Google Scholar] [CrossRef]
  8. Funabashi, T.; Mizuno, J.; Sato, M.; Kitajima, M.; Matsuura, M.; Shoji, S. Film of lignocellulosic carbon material for self-supporting electrodes in electric double-layer capacitors. APL Mater. 2013, 1, 032104. [Google Scholar] [CrossRef] [Green Version]
  9. Li, X.; Tang, Y.; Song, J.; Yang, W.; Wang, M.; Zhu, C.; Zhao, W.; Zheng, J.; Lin, Y. Self-supporting activated carbon/carbon nanotube/reduced graphene oxide flexible electrode for high performance supercapacitor. Carbon 2018, 129, 236–244. [Google Scholar] [CrossRef]
  10. Yahya, M.A.; Al-Qodah, Z.; Ngah, C.W.Z. Agricultural bio-waste materials as potential sustainable precursors used for activated carbon production: A review. Renew. Sust. Energ. Rev. 2015, 46, 218–235. [Google Scholar] [CrossRef]
  11. Zhu, H.; Luo, W.; Ciesielski, P.N.; Fang, Z.; Zhu, J.Y.; Henriksson, G.; Himmel, M.E.; Hu, L. Wood-derived materials for green electronics, biological devices, and energy applications. Chem. Rev. 2016, 116, 9305–9374. [Google Scholar] [CrossRef] [PubMed]
  12. Álvarez-Merino, M.A.; López-Ramón, V.; Moreno-Castilla, C. A study of the static and dynamic adsorption of Zn (II) ions on carbon materials from aqueous solutions. J. Colloid Interface Sci. 2005, 288, 335–341. [Google Scholar] [CrossRef] [PubMed]
  13. Jia, Y.F.; Thomas, K.M. Adsorption of cadmium ions on oxygen surface sites in activated carbon. Langmuir 2000, 16, 1114–1122. [Google Scholar] [CrossRef]
  14. Macías-García, A.; Gómez-Serrano, V.; Alexandre-Franco, M.F.; Valenzuela-Calahorro, C. Adsorption of cadmium by sulphur dioxide treated activated carbon. J. Hazard. Mater. 2003, 103, 141–152. [Google Scholar] [CrossRef]
  15. Lee, D.; Hong, S.H.; Paek, K.H.; Ju, W.T. Adsorbability enhancement of activated carbon by dielectric barrier discharge plasma treatment. Surf. Coat. Technol. 2005, 200, 2277–2282. [Google Scholar] [CrossRef]
  16. ChangMing, D.; DongWei, H.; HongXia, L.; MuDan, X.; Kui, W.; Lu, Z.; ZhiYi, L.; TengFei, C.; JianMin, M.; Dong, G.; et al. Adsorption of acid orange II from aqueous solution by plasma modified activated carbon fibers. Plasma Chem. Plasma Process. 2013, 33, 65–82. [Google Scholar] [CrossRef]
  17. Li, Q.; Ding, W.; Yong, Y.; Zeng, X.; Gao, Y. Effects of ultraviolet modification on physicochemical property and adsorption performance of biochar. Nanosci. Nanotechnol. Lett. 2016, 8, 978–984. [Google Scholar] [CrossRef]
  18. Peng, Z.; Liu, X.; Chen, H.; Liu, Q.; Tang, J. Characterization of ultraviolet-modified biochar from different feedstocks for enhanced removal of hexavalent chromium from water. Environ. Sci. Pollut. Res. 2018, 25, 10808–10819. [Google Scholar] [CrossRef]
  19. Domingo-García, M.; López-Garzón, F.J. & Pérez-Mendoza, M. Effect of some oxidation treatments on the textural characteristics and surface chemical nature of an activated carbon. J. Colloid Interface Sci. 2000, 222, 233–240. [Google Scholar]
  20. Watanabe, K.; INN, E.C.Y.; Zelikoff, M. Absorption coefficients of oxygen in the vacuum ultraviolet. J. Chem. Phys. 1953, 21, 1026–1030. [Google Scholar] [CrossRef]
  21. Marsh, H.; Reinoso, F.R. Chapter 4 Characterization of Activated Carbon. In Activated Carbon, 1st ed.; Elsevier Science: Amsterdam, The Netherlands, 2006; pp. 143–242. [Google Scholar]
  22. Solomon, M.E. Control of humidity with potassium hydroxide, sulphuric acid, or other solutions. Bull. Entomol. Res. 1951, 42, 543–554. [Google Scholar] [CrossRef]
  23. Carrott, P.J.M.; Carrott, M.M.L. Lignin-from natural adsorbent to activated carbon: A review. Bioresour. Technol. 2007, 98, 2301–2312. [Google Scholar]
  24. Atkinson, R.; Carter, W.P.L. Kinetics and mechanisms of the gas-phase reactions of ozone with organic compounds under atmospheric conditions. Chem. Rev. 1984, 84, 437–470. [Google Scholar] [CrossRef]
  25. Sajjadi, B.; Chen, W.Y.; Egiebor, N.O. A comprehensive review on physical activation of biochar for energy and environmental applications. Rev. Chem. Eng. 2019, 35, 735–776. [Google Scholar] [CrossRef]
  26. Laine, N.R.; Vastola, F.J.; Walker, J.P.L. The importance of active surface area in the carbon-oxygen reaction1,2. J. Phys. Chem. 1963, 67, 2030–2034. [Google Scholar] [CrossRef]
  27. Gómez-Serrano, V.; Álvarez, P.M.; Jaramillo, J.; Beltrán, F.J. Formation of oxygen complexes by ozonation of carbonaceous materials prepared from cherry stones: I. Thermal effects. Carbon 2002, 40, 513–522. [Google Scholar] [CrossRef]
  28. Huang, H.; Huang, H.; Zhan, Y.; Liu, G.; Wang, X.; Lu, H.; Xiao, L.; Feng, Q.; Leung, D.Y. Efficient degradation of gaseous benzene by VUV photolysis combined with ozone-assisted catalytic oxidation: Performance and mechanism. Appl. Catal. B 2016, 186, 62–68. [Google Scholar] [CrossRef]
  29. Kislov, V.V.; Nguyen, T.L.; Mebel, A.M.; Lin, S.H.; Smith, S.C. Photodissociation of benzene under collision-free conditions: An ab initio/Rice–Ramsperger–Kassel–Marcus study. J. Chem. Phys. 2004, 120, 7008–7017. [Google Scholar] [CrossRef] [PubMed] [Green Version]
  30. Song, X.; Liu, H.; Cheng, L.; Qu, Y. Surface modification of coconut-based activated carbon by liquid-phase oxidation and its effects on lead ion adsorption. Desalination 2010, 255, 78–83. [Google Scholar] [CrossRef]
Figure 1. C1s X-ray photoelectron spectra of (a) untreated and vacuum-ultraviolet-treated films of woody carbon material under (b) high P O 2 , (c) median P O 2 , and (d) low P O 2 .
Coatings 11 00411 g001
Figure 2. Low-magnification scanning electron microscope images of films of woody carbon material before and after vacuum-ultraviolet-treatments under (a) high P O 2 , (b) median P O 2 , and (c) low P O 2 .
Coatings 11 00411 g002
Figure 3. High-magnification scanning electron microscope images of films of woody carbon material. (a) Untreated surface. Vacuum-ultraviolet-treated films of woody carbon material at (b) high P O 2 , (c) median P O 2 , and (d) low P O 2 .
Coatings 11 00411 g003
Figure 4. CO2 adsorption isotherms of films of woody carbon material from 0 to 0.48 relative pressure: (a) High P O 2 condition, (b) median P O 2 condition, (c) low P O 2 condition, and (d) all condition. Inset: Micropore distribution dVp/dW analyzed by Horvath-Kawazoe method.
Coatings 11 00411 g004
Figure 5. Water adsorption capacities of untreated and vacuum-ultraviolet-treated films of woody carbon material at 20% relative-humidity. Commercial silica-gel desiccant was also evaluated as a reference.
Coatings 11 00411 g005
Table 1. Oxygen and carbon composition of untreated and vacuum-ultraviolet-treated films of woody carbon material calculated from C1s and O1s X-ray photoelectron spectra.
SamplesComposition
O [at.%]C [at.%]
Untreated4.5895.4
High P O 2 21.079.0
Middle P O 2 21.878.2
Low P O 2 19.980.1
Table 2. Chemical components of untreated and vacuum-ultraviolet-treated films of woody carbon material calculated from C1s X-ray photoelectron spectra.
SamplesC=C/C–C [%]C=O/C–O [%]O–C=O [%]
Untreated58.426.615.1
High P O 2 49.232.218.6
Middle P O 2 48.218.133.7
Low P O 2 47.320.032.7
Table 3. Specific surface areas and pore volumes of untreated and vacuum-ultraviolet-treated films of woody carbon material estimated from CO2 Brunauer-Emmett-Teller micropore analysis.
SamplesSpecific Surface Area [m2/g]Pore Volume [cm3/g]
UntreatedTreatedUntreatedTreated
High P O 2 4504500.260.26
Middle P O 2 4504500.260.26
Low P O 2 4404300.250.24
Publisher’s Note: MDPI stays neutral with regard to jurisdictional claims in published maps and institutional affiliations.